Article

Enhancing the Dielectric Properties of Recycled Polyolefin Streams Through Blending

Department of Mechanical Engineering, École de Technologie Supérieure, Montréal, QC H3C 1K3, Canada
*
Author to whom correspondence should be addressed.
Sustainability 2025, 17(9), 4123; https://doi.org/10.3390/su17094123
Submission received: 13 December 2024 / Revised: 2 April 2025 / Accepted: 16 April 2025 / Published: 2 May 2025

Abstract

:
The extensive use of polyolefins, such as polyethylene (PE) and polypropylene (PP), has led to a substantial accumulation of plastic waste, raising growing concerns about environmental impact and sustainability. In this study, the dielectric, thermal, and chemical properties of recycled materials were investigated, and blending with virgin polyethylene was examined as a sustainable strategy to enhance their electrical performance and promote material reuse. Dielectric analysis demonstrated that blending recycled materials with virgin polyethylene effectively reduced dielectric losses. With the addition of only 15% virgin HDPE, the dielectric loss was significantly lowered by 40% for recycled HDPE (rHDPE) and 30% for the recycled PE-PP blend (r(PE-PP))—compared to their unblended forms. Although the original recycled materials exhibited much higher dielectric losses than virgin HDPE—24 and 28 times greater for rHDPE and r(PE-PP), respectively, at 60 Hz—the blending approach clearly improved their electrical behavior. Overall, the results highlight blending as a practical and sustainable strategy to improve the dielectric performance of recycled polyolefins, enabling their reuse in applications such as electrical cable insulation while contributing to plastic waste reduction.

1. Introduction

Polyolefins, such as polyethylene (PE) and polypropylene (PP), are widely used as dielectric insulating materials due to their excellent electrical insulating properties, chemical stability, low cost, and processability suitable with the cable industry. Dielectric insulation is a crucial component in various electrical and electronic devices, including transformers, capacitors, and cables. The low dielectric constant and low dielectric loss of polyolefins also make them suitable for use in high-frequency applications [1,2].
Despite the significant advantages of polyolefins, the increasing global demand for plastics has led to a significant rise in the generation of plastic waste, resulting in considerable environmental challenges. Addressing this issue requires innovative approaches, particularly through the reuse and recycling of plastic waste. Utilizing recycled polyolefins in dielectric applications is a promising solution that not only improves the environmental burden of plastic waste but also conserves natural resources and mitigates the greenhouse gas emissions associated with producing virgin materials [1].
One strategy for improving the properties of recycled polyolefins is to blend them with virgin polyolefins, such as virgin high-density polyethylene (HDPE) [3,4]. The blending of recycled polyolefins with virgin materials enhances the mechanical and thermal properties of recycled polyolefins [5,6,7]. In addition, blending can also improve their dielectric properties, making them more attractive for use in electric and electronic applications [3]. Previous studies have investigated different properties of recycled materials, including their mechanical and photodegradation behavior [8,9]. However, their electrical performance, specifically dielectric and thermal properties, needs further exploration.
In this study, we investigated the possibility of using recycled materials in the electrical cable industry for low- to high-voltage applications as a continuation of our previous study referenced in [10]. The dielectric, thermal, and chemical properties of recycled materials were characterized, along with the effect of impurities on these properties. Furthermore, we studied how blending recycled materials with virgin materials could improve their dielectric properties, with the goal of addressing the challenges associated with using waste material.
In summary, the significance of this study is the investigation of the dielectric properties of recycled materials and, secondly, enhancing the properties of recycled materials through blending.

2. Materials and Methods

2.1. Materials

There were two different waste materials. The first waste material was high-density polyethylene supplied in flake form with a melt flow index (MFI) of 0.60 g/10 min measured at 190 °C. The second waste material was a mix of polyethylene and polypropylene provided by the supplier (MFI ≥ 4), with the reported PP content ranging from 45 wt% to 55 wt%. Both recycled materials sourced from local recyclers in Quebec come from post-consumer recycled streams.
For the virgin material, high-density polyethylene (HDPE) with a density of 0.952 g/cm3 and MFI of 6.8 g/10 min (at 190 °C under 2.16 kg load) was supplied from Dow in pellet form.

2.2. Sample Preparation

A twin-screw extruder with a length-to-diameter ratio of 40 was utilized to blend waste material with virgin HDPE. The temperature was set at 200 °C from the hopper to the die, while the screw rate was set at 100 rpm. The recycled and blended materials were hot-pressed into disk-shaped samples using a hydraulic press for the purpose of analyzing their dielectric properties. The proportion of recycled material in the blend was 15%, 30%, 50%, 70%, and 85% wt. The blending process was repeated twice to ensure adequate mixing. The thickness of the samples for broadband dielectric spectroscopy measurements was around 300 μm, while a mold with 500 μm thickness was used for dielectric breakdown strength testing. In preparation, a preheating step of 5 min was carried out, followed by hot-pressing at 175 °C for another 5 min under a pressure of 10 MPa. The samples were then cooled under constant pressure with circulating water at a rate of 10 °C per minute until they reached an ambient temperature.

2.3. Characterization

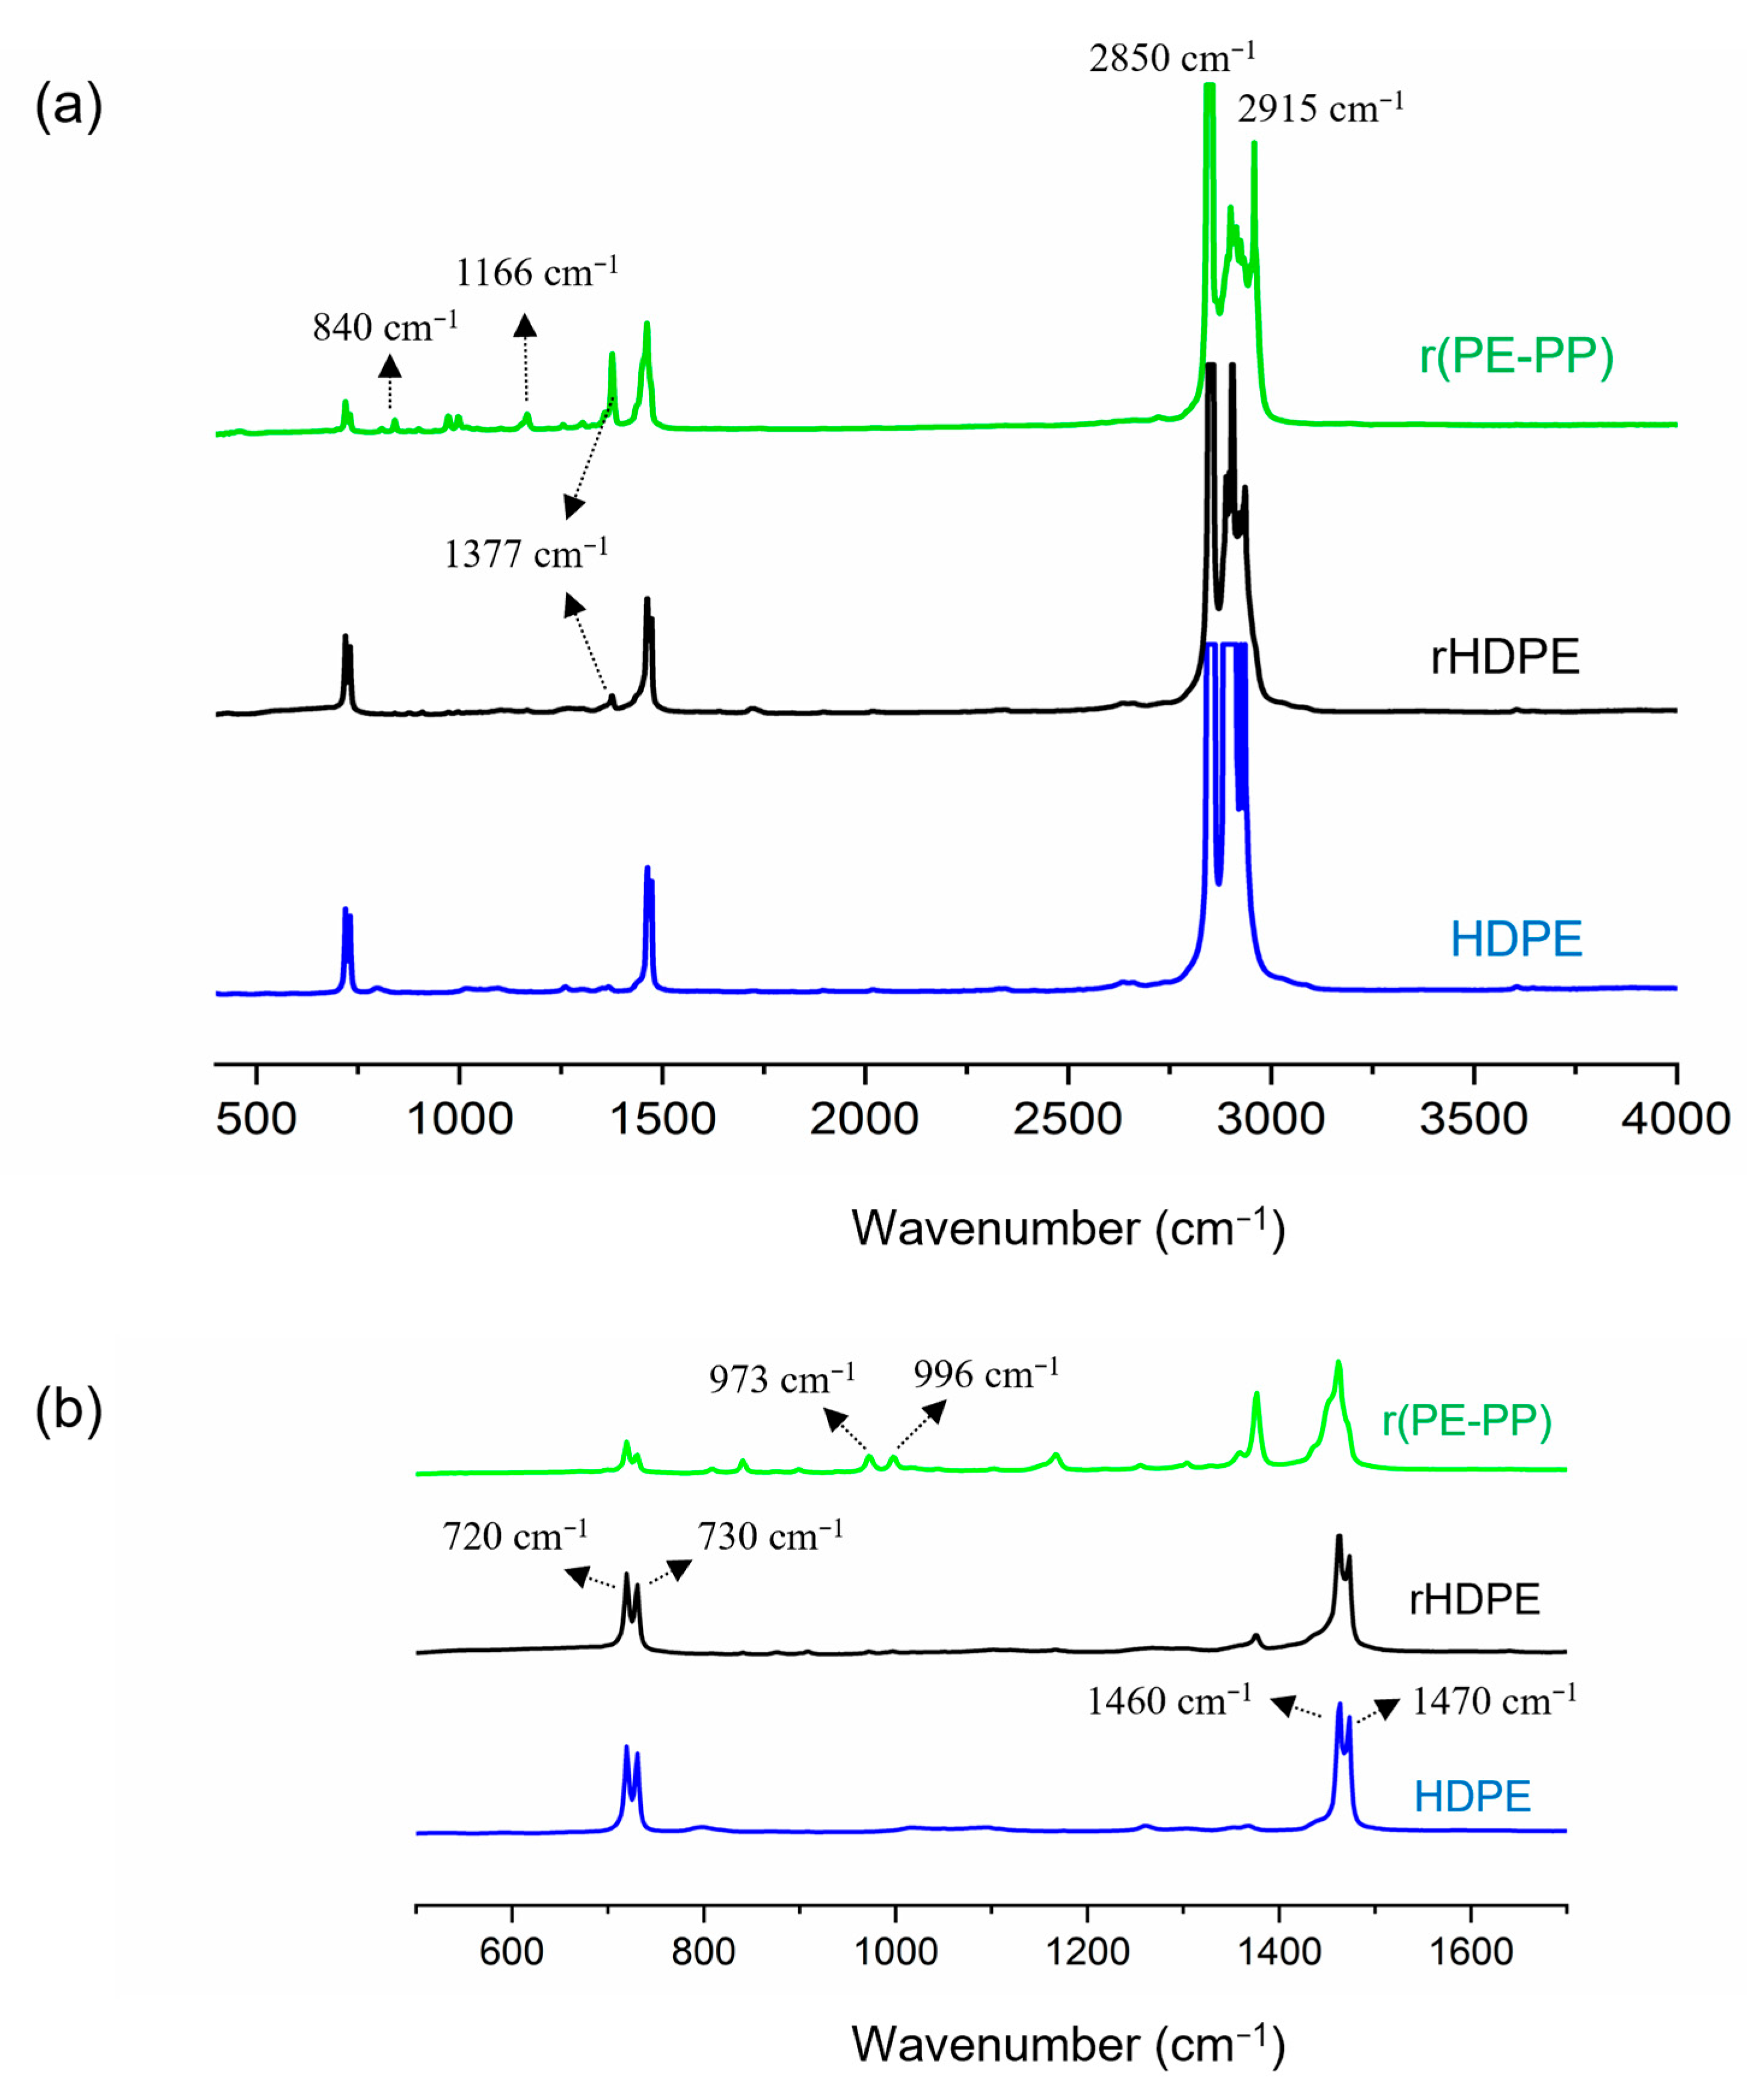
2.3.1. Chemical Characterization

The chemical composition of the recycled materials was determined using Fourier Transform Infrared Spectroscopy (FT-IR) in transmission mode, with a wavenumber range from 400 to 4000 cm−1, using a Nicolet 6700 FT-IR Spectrometer (manufactured by Thermo Fisher Scientific Inc, Waltham, USA). The content of inorganic impurities was analyzed on the surface of waste materials using SEM-EDX (Scanning Electron Microscopy–Energy-Dispersive X-ray Spectroscopy), which was performed using a Hitachi SU3500 SEM, manufactured by Hitachi Science Systems, Ltd., Tokyo, Japan.

2.3.2. Thermal Characterization

Thermogravimetric analysis (TGA) was performed using a Pyris Diamond model from PerkinElmer technology (TG/DTA, Shelton, CT, USA) to examine the thermal degradation of the material and measure the weight quantity of inorganic impurities. The samples were heated under a nitrogen atmosphere with a flow rate of 100 mL/min from 50 °C to 600 °C with a heating rate of 10 °C/min. To verify the TGA results, pyrolysis was performed on larger samples in an oven at 450 °C.
Differential scanning calorimetry (DSC) using a Perkin Elmer, Pyris1 (Shelton, USA), was used to determine the degree of crystallinity, melting temperature, and crystallization temperature of the samples. The samples were first heated from 70 °C to 180 °C with a heating rate of 10 °C/min under a nitrogen flow rate of 20 mL/min to eliminate any thermal history of the material. Then, they were cooled from 180 °C to 70 °C at a cooling rate of 10 °C/min, followed by a second heating cycle from 70 °C to 180 °C at a rate of 10 °C/min. The results from the second heating cycle were used for calculation purposes. The degree of crystallinity (Xc) was calculated using Equation (1), according to ASTM D-3418 [11],
X c = 100 × Δ H m Δ H m °
where Xc is the weight fraction of the crystalline phase, Δ H m ° is the fusion enthalpy of 100% crystalline PE (293.6 J/g), and Δ H m is the fusion enthalpy of the sample extracted from DSC thermograms.

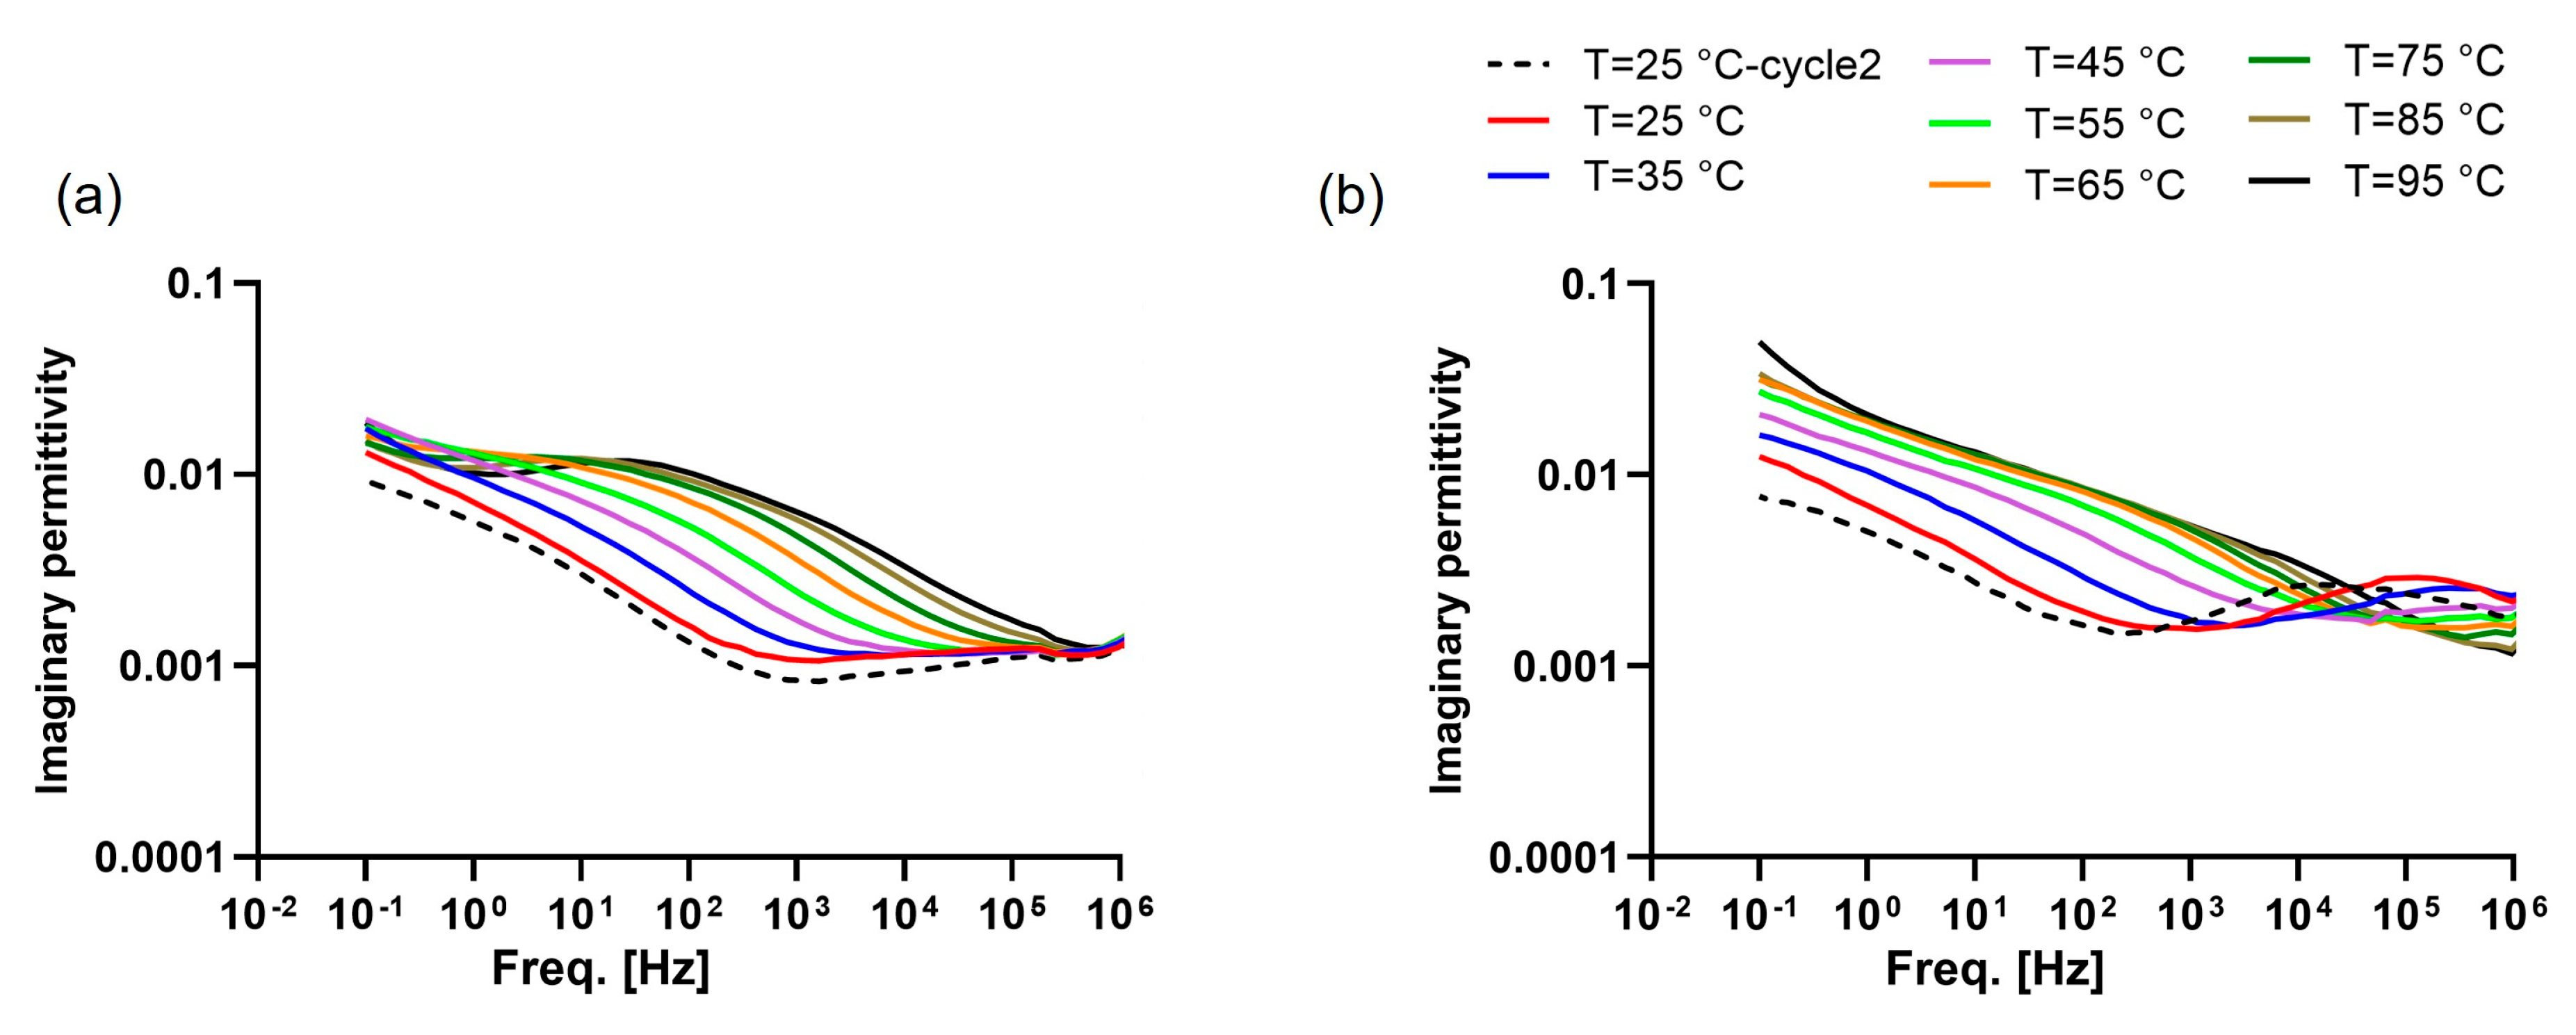
2.3.3. Dielectric Response

Dielectric response measurements were performed in the frequency domain using a broadband dielectric spectrometer (Novocontrol Technologies GmbH & Co. KG, Montabaur, Germany). The samples used were disk-shaped with a thickness of 300 μm and a diameter of 30 mm and were placed between two parallel plate electrodes with a thickness of 2 mm. The spectrometer was set to apply a 3 Vrms excitation voltage.
The measurements were conducted using three different strategies in order to investigate the dielectric response of the materials in detail. The three different strategies are as follows:
(1)
The dielectric response was assessed at various temperatures ranging from 25 °C to 95 °C across a frequency spectrum from 10−1 to 106 Hz with steps of 10 °C between each isothermal scan, with the measuring chamber continuously purged with dry nitrogen. After reaching the highest temperature, the sample cooled down to 25 °C, and the dielectric spectrum was measured again in order to examine the effect of the heating process on the dielectric response.
(2)
The samples were kept at a constant temperature of 70 °C, and the dielectric response was measured every 10 min to analyze the effect of high temperature on dielectric response.
(3)
The samples were subjected to heating and cooling cycles between 25 °C and 70 °C to mitigate the limits of evaluating the dielectric response at higher temperatures observed in the previous step. In each cycle, the sample was held at 70 °C for 10 min, then cooled back to 25 °C before measurements were performed at this temperature.

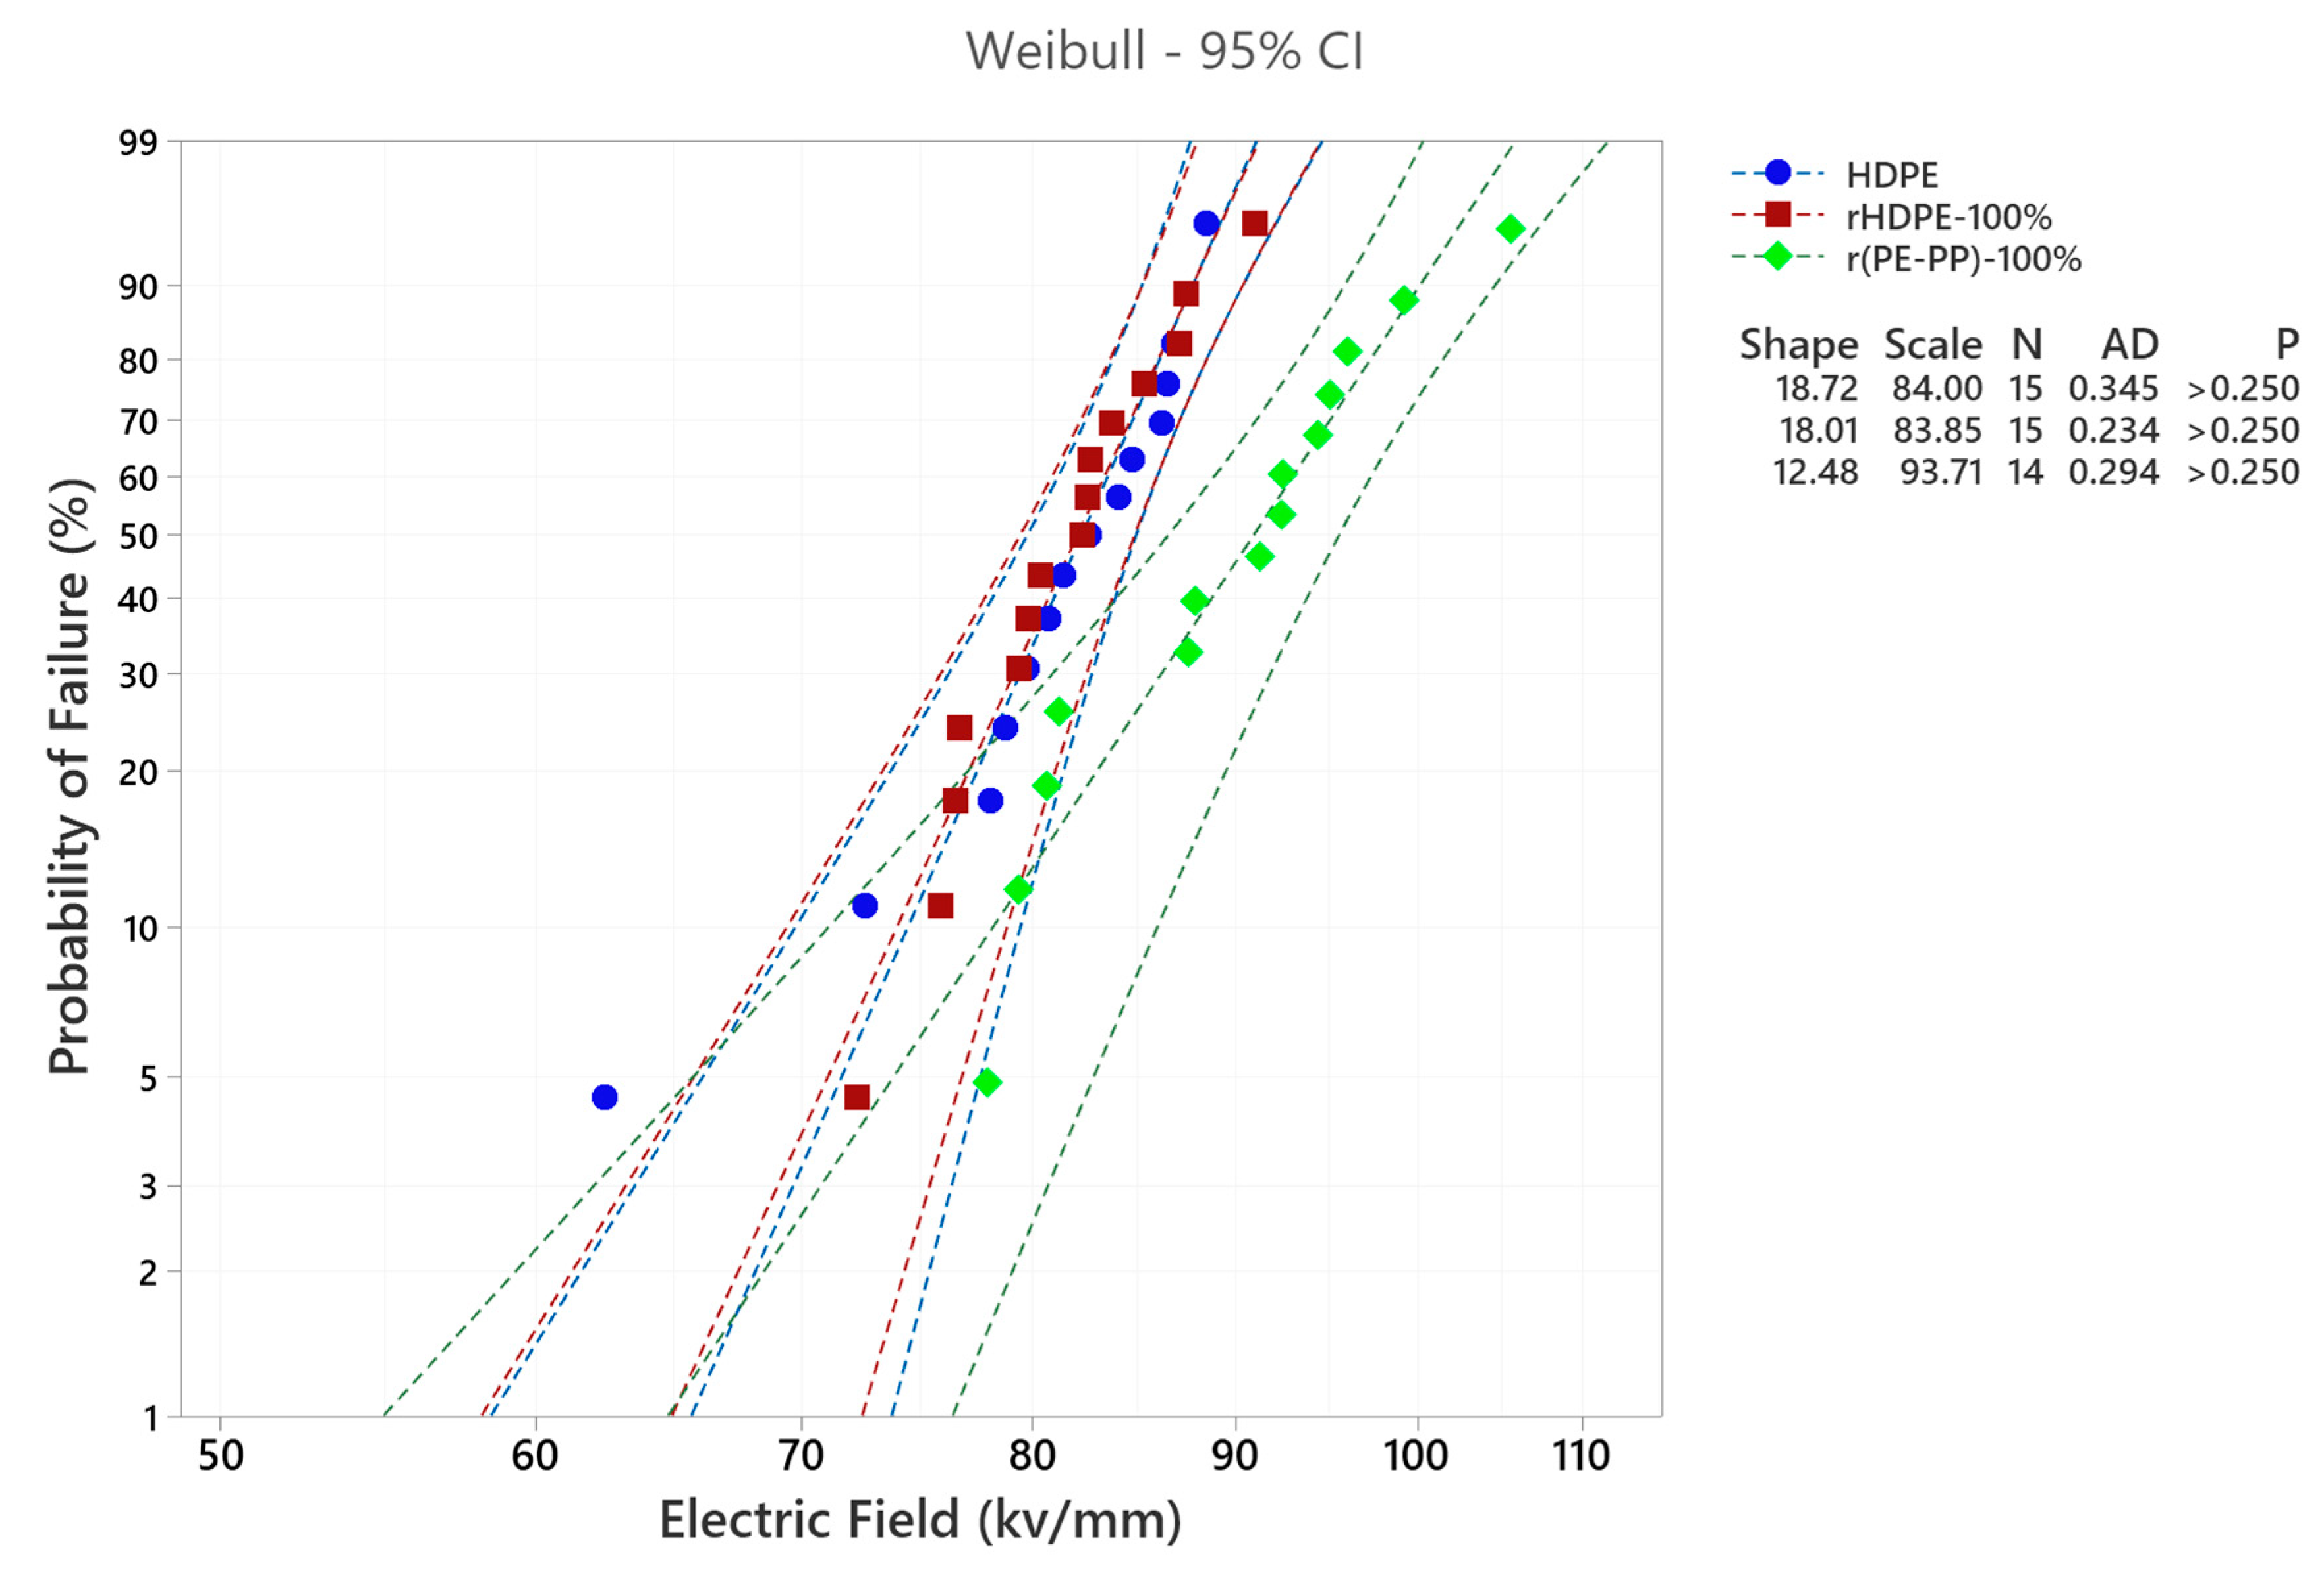
2.3.4. Dielectric Breakdown Strength

AC short-term breakdown tests were performed using a Baur DTA100 device, manufactured by BAUR GmbH, Sulz, Austria. The samples were positioned between two 4 mm diameter ball-shaped electrodes, surrounded by mineral oil as the insulating medium. The tests followed the ASTM D-149 method A [12], with a voltage increase rate of 2 kV/s and frequency of 60 Hz. The mineral oil was degassed for a minimum of two hours in a vacuum oven to increase its dielectric strength and decrease the risk of flashovers. The surrounding oil was replaced periodically with new, clean, and degassed mineral oil to avoid any failure caused by oil impurities.
The electrodes were cleaned when the oil was refreshed to maintain accuracy. To account for variations in sample thickness, the measurements were adjusted to a standard thickness of 400 μm. The estimated breakdown strength (E2) at a thickness of 400 μm was calculated using the power–law relationship in Equation (2), where E1 is the measured breakdown strength at the actual thickness (d1), and d2 has a standardized thickness of 400 μm [13]. To account for the statistical variability of dielectric breakdown, 15 samples of the same material were tested, and the results were analyzed using a two-parameter Weibull distribution, as shown by Equation (3).
E 2 = E 1 ( d 2 d 1 ) 0.4
P = 1 exp [ E E 0 ] β
P represents the cumulative probability of failure at electrical fields lower than or equal to E. The scale parameter E0 represents the electrical field for which 63.2% of the samples broke down. The shape parameter β shows the scattering of data, and a high value of β indicates a low standard deviation of breakdown strength measurements. The maximum likelihood method was used to determine the scale and shape parameters of the distribution, and the 95% confidence bounds were calculated numerically. The scale parameter was used to represent the breakdown strength of each material [14]. Further information on the statistical analysis of breakdown measurements can be found in [13].

3. Results and Discussion

3.1. Chemical Characterization of Recycled Samples

Figure 1 displays the FT-IR spectra of virgin HDPE and recycled materials. In both virgin and recycled HDPE (rHDPE), the peaks at 2915 cm−1 and 2850 cm−1 correspond to the asymmetric and symmetric stretching vibrations of C-H bonds in methylene groups, respectively [15,16]. Additionally, the bending and rocking vibration modes of C-H bonds can be observed at 1460 cm−1 and 720 cm−1, respectively [17,18,19].
The FT-IR spectra of rHDPE and virgin HDPE present a high degree of similarity, confirming that the recycled material is mainly composed of polyethylene. The main difference is the presence of a weak absorbance band at 1377 cm−1 in the IR spectrum of the rHDPE sample. This peak is associated with the symmetrical bending vibrations of C-H bonds in methyl groups and may indicate contamination with PP [15,20]. Furthermore, the presence of the band at 1377 cm−1 can be used as an indicator to differentiate between different types of branched polyethylene (PE), such as LDPE, LLDPE, and HDPE. HDPE typically exhibits a higher peak between 1400 cm−1 and 1300 cm−1 without an additional band at 1377 cm−1 [21].
In Figure 1b, weak peaks at lower wavenumbers are observed in the r(PE-PP) sample, which are not present in the rHDPE or virgin PE samples. These peaks can be attributed to polypropylene. The peak at 840 cm−1 corresponds to the C-H rocking vibration, while the medium peaks at 973 cm−1 and 996 cm−1 are associated with the C-C stretching or rocking vibration of the methylene group in polypropylene. Additionally, the rocking vibration of the methyl group or bending vibration of the C-H bond can be observed at 1166 cm−1 [13].
Further analysis shows that the peak at 720 cm−1 is split into two separate peaks at slightly different wavenumbers for all three materials. Figure 1b illustrates two distinct in-phase and out-of-phase rocking vibrations, resulting in separate peaks at 720 cm−1 and 730 cm−1. This splitting phenomenon is characteristic of solid, long-chain alkanes like HDPE. In contrast, a polymer like LDPE lacks this splitting due to the presence of side chains that hinder the crystallization of methylene chains by keeping them apart [16]. As this split peak pattern is typically found in PE materials or a very weak one in PP copolymers, the detection of medium intensity in r(PE-PP) is, therefore, attributed to the presence of PE in a polyolefin blend or PP copolymer, or both [17,21]. Similarly, further analysis shows that the peak at 1460 cm−1 is split into two separate peaks at 1460 cm−1 and 1470 cm−1 for virgin HDPE and recycled HDPE, but this splitting is not observed for the recycled r(PE-PP) sample. These peaks correspond to the crystalline structure of HDPE in both virgin HDPE and recycled HDPE [16]. Several weak peaks in the region from 800 cm−1–1300 cm−1 are characteristic of PP, as observed in previous studies [22]. Similar peaks are also commonly detected in plastic waste from various sources [23]. Therefore, the spectral features in this region may be attributed to impurities present within the polymer matrix, PP, or both.
Inorganic impurities present in the recycled material were identified using SEM-EDX analysis, which is a technique that combines high-resolution imaging of a material’s surface with chemical identification of its elemental composition. The detected elements are listed in Table 1, indicating the presence of Ti, Ca, Si, and Al as the most prominent elements in waste materials. Previous studies have also reported on the potential sources of these inorganic impurities in recycled polyethylene [23]. Soil impurities are believed to be the primary source of silicon (Si). Titanium may originate from pigment components. It has been suggested that the fire retardants or catalysts used during polymerization could contribute to the presence of impurities. In the case of neat HDPE, the Si content can provide further support to the previous discussion regarding the existence of soil impurities. Figure 2 presents the SEM-EDX map of the r(PE-PP) sample, revealing the simultaneous detection of elements such as Ca and Si or Al and Si in the same locations. This suggests the presence of inorganic contamination, possibly in the form of calcium silicate or aluminosilicate components.

3.2. Thermal Analysis (DSC, TGA, Pyrolysis) of Recycled HDPE

Figure 3a presents the results of the differential scanning calorimetry (DSC) analysis for virgin HDPE, recycled HDPE, and recycled r(PE-PP) materials. Virgin high-density polyethylene (HDPE) exhibits a single melting transition (Tm) at 132 °C. For the recycled r(PE-PP) material, two separate peaks were observed at 129° C and 160 °C, corresponding to HDPE and PP, respectively. However, no evidence of additional melting peaks, indicating contamination with LDPE or PP, was observed for the rHDPE sample. The only melting peak detected for rHDPE was at around 133 °C, which is consistent with the recycler’s identification of mainly HDPE content. However, this finding may differ from the FTIR results, which indicated the presence of inorganic impurities. This discrepancy could be attributed to the varying sensitivities of different analytical techniques. In this regard, Thoden et al. [24] reported detecting as low as 2 wt% of polypropylene using DSC, confirming that rHDPE is mainly composed of HDPE.
The DSC method used here is a common approach to determine polymer blend compositions based on their melt enthalpy, enabling the distinction of each component’s specific melting temperature (Tm) in immiscible polyolefin blends. The results of DSC and FTIR discussed earlier suggest that the rHDPE sample predominantly consists of HDPE with the minimal presence of other organic impurities, while the r(PE-PP) sample is a blend of HDPE and PP.
Figure 3b displays the thermal gravimetric analysis (TGA) curves of recycled materials. The decomposition of these recycled materials was observed to start at approximately 350 °C. The majority of the weight loss occurred within the temperature range of 400 °C to 500 °C. The residual mass at 600 °C was determined to be approximately 1.4 wt% for both rHDPE and r(PE-PP) samples. However, these values exhibited minor variations across different samples, primarily due to the limitations of TGA in accurately quantifying impurities, including the inhomogeneous dispersion of impurities, overlapping decomposition events, the atmospheric effects on decomposition, and sensitivity limitations in detecting low-level impurities.
To address the accuracy of these values, conventional pyrolysis was carried out on larger samples using a pyrolysis oven. Unlike TGA, pyrolysis enables the complete thermal degradation of the polymer matrix in a controlled environment, leaving behind only non-volatile inorganic residues. The results indicated impurity contents of (1.45 ± 0.01) wt% for rHDPE and (0.44 ± 0.01) wt% for r(PE-PP). The values of inorganic impurities obtained from both TGA and pyrolysis were similar for the rHDPE sample. However, there was a noticeable difference in the results for r(PE-PP) waste material. This difference was mainly due to the presence of carbon black, as reported by the material supplier. Carbon black is a conductive filler that does not fully combust under the standard nitrogen atmosphere used in TGA, leading to the overestimation of residual mass. However, in pyrolysis, where controlled oxygen-rich or oxidative conditions are used for complete combustion, a more precise determination of actual impurity levels is achieved.

3.3. Dielectric Properties of Recycled Materials

In Figure 4, the imaginary part of complex permittivity is plotted against the temperature for two recycled materials over a range of 25 °C to 95 °C. The low dielectric loss of polyolefins (~10−4), which is an intrinsic property of these materials, makes the measurements highly sensitive to molecular and inorganic contaminants. A relaxation peak appears at low frequencies (1–102 Hz) in Figure 4a, attributed to interfacial polarization, commonly known as Maxwell–Wagner polarization [25]. This effect arises from ionic carrier accumulation at polymer–electrode interfaces (electrode polarization) or at contaminant–polymer interfaces due to the differences in electrical conductivity among constituents.
As depicted in Figure 4, the relaxation peak shifts toward higher frequencies as the temperature rises. This change could likely be attributed to an increase in the conductivity of ionic or micro-scale impurities. The latter explanation carries more significance and correlates with earlier investigations into the dielectric response in the frequency domain of polyethylene containing minor concentrations of metallic or non-metallic oxides [26].
Figure 4b represents the imaginary part of the complex permittivity of r(PE-PP) as a function of frequency. In this figure, two distinct relaxation modes are observable at high and low frequencies. The interfacial relaxation peak overlaps with the DC conductivity at low frequencies from 1 to 100 Hz. The dielectric loss of r(PE-PP) is slightly higher than rHDPE at low frequencies due to higher DC conductivity. Zois et al. [27] reported a dielectric loss of around 10−1 for the polypropylene/carbon black system with a 6 wt% percolation threshold. Additionally, another relaxation peak can be observed at higher frequencies, ranging from 104 to 105, which gradually shifts to higher frequencies with increasing temperature. The second peak can be attributed to the absorbed water that is usually observable at higher frequencies, or it can be connected to the dipolar polarization of carbon-black-containing systems.
Figure 5 represents the relaxation behavior of r(PE-PP) under different temperature conditions. In Figure 5a, when the sample is gradually heated and then cooled to an initial temperature of 25 °C, the relaxation peak shifts to lower frequencies. This behavior has also been observed for samples that contain absorbed water. Indeed, due to the presence of hydrophilic inorganic impurities, water may have been absorbed. In order to investigate the possible presence of absorbed water, samples were heated at 70 °C for 70 min, as shown in Figure 5b. According to Figure 5b,c, no change in either the magnitude or the frequency of the position of the relaxation peak was observed after ten minutes of drying. Furthermore, it shows that although the dried sample has a lower relaxation peak intensity than the original sample, the peak does not disappear completely. In other words, although the relaxation peak is affected by the absorbed water between the impurity and polymer interlayer, it is not solely attributed to water. Moreover, the relaxation peak shifted to lower frequencies. This relaxation peak, which is almost 103 faster than the other relaxation peak, can be attributed to the presence of carbon black. Such a bimodal peak pattern has been documented in earlier studies involving polymer/clay nanocomposites [28,29,30] and can also be observed in carbon black, which contains polyolefins below the percolation concentration.
After normalization, collected data from the AC breakdown tests were analyzed using a two-parameter Weibull distribution to determine the breakdown strength of virgin HDPE and recycled materials. Statistical evaluation was conducted using commercial software, revealing differences in the electrical breakdown behavior of these materials. Further information on the statistical analysis of breakdown measurements can be found in [13].
Figure 6 illustrates the cumulative Weibull distribution function for the breakdown strength. The scale parameter of the distributions, which is commonly used as the characteristic breakdown strength for a material, indicates that virgin PE, recycled HDPE, and recycled r(PP-PE) have breakdown strengths of 84, 83, and 93 kV/mm, respectively. These values are lower than those we obtained for virgin and recycled HDPE in our previous research [10]. The difference may stem from differences in environmental conditions and the difference in the increasing voltage rate, which was 2 kV/s compared to the previous 5 kV/s. However, the influence of inorganic impurities on breakdown strength in recycled polyethylene is not clear, but there is agreement that the inclusion of micro-fillers typically results in breakdown strengths similar to or lower than those of the neat matrix, particularly when employing short-term test procedures to monitor breakdown strength [31,32,33].
The dielectric breakdown strength of recycled r(PE-PP) exceeds that of recycled HDPE and virgin PE. This is likely due to the higher polypropylene dielectric breakdown strength in comparison to polyethylene, as polypropylene is a component of recycled r(PE-PP) [34].

3.4. Blending

In the previous section, an in-depth analysis of the dielectric properties of recycled materials was carried out. These materials showed lower performance compared to virgin polyethylene (PE), mainly due to higher losses—at least ten times larger at power frequency (60 Hz). This highlights the need for practical solutions to improve their properties. To address these issues, a blending method was used, combining recycled r(PE-PP) and recycled HDPE with virgin high-density polyethylene (HDPE). This method aimed to incorporate the advantageous properties of virgin HDPE to enhance the overall quality of recycled materials. The details of the blend sample compositions, which were prepared to improve dielectric properties, are provided in Table 2. This blending approach shows promise in addressing the limitations of recycled materials.

3.4.1. Thermal Analysis

In our previous study [10], it was shown that the degree of crystallinity decreased as the proportion of recycled material increased. The same trend was observed for the melting temperature. The nature of the polymer structure, as well as the number of impurities, might affect the crystallinity of recycled polymers. At low filler loadings, the crystallinity increases but decreases at higher filler loadings, which implies that a range of filler content leads to the maximum value of crystallinity.
Table 3 presents the melting temperature, degree of crystallinity, crystallization temperature, and melting enthalpy of each portion of blended recycled materials. In the r(PE-PP) material, each sample displays distinct melting temperatures. The lower melting temperature signifies the Tm of the high-density polyethylene (HDPE) component, while the higher melting temperature corresponds to the Tm of the polypropylene (PP) component. This double-peak characteristic was consistently identified in all examined blends. Due to the overlap in crystallization temperature, only the peaks with a percentage composition exceeding 50% of recycled material exhibited a clear distinction.
The distinct melting temperatures of PE and PP in the primary recycled material demonstrate that blends of PP and PE are basically incompatible. The findings from Table 3 indicate a gradual decrease in the melting temperature of PE and an increase in the melting temperature of PP as the PP content increases. This outcome aligns with the results reported by Wong et al. [35].
The percentage of polypropylene (PP) in the polymer blend was determined using differential scanning calorimetry (DSC), following the methodology outlined by Kazemi et al. [36]. The calculated PP content ranged from 7% for the sample r(PE-PP)-30% to 43% for the sample r(PE-PP)-100%. The samples were kept at alues obtained through this method are lower than those calculated using the blending rules for the blends.
Figure 7 displays the TGA curves for the recycled material r(PE-PP) combined with virgin HDPE. The decomposition of the recycled materials was initiated at around 350 °C, with primary weight loss occurring within the temperature range of 400 °C to 500 °C. The decomposition of the recycled material blend with virgin HDPE occurred earlier in comparison to the decomposition of virgin HDPE alone. Moreover, with the increase in the recycled material content (r(PE-PP)), the composites started decomposing at a lower temperature. This finding aligns with our earlier investigation into a recycled HDPE blend [10]. This could be due to the lower decomposition temperature of polypropylene compared to polyethylene (PE), attributed to the lower thermal stability of polypropylene.
In Figure 7b, the residual weight (%) versus the percentage of recycled material is illustrated. The residual content was 1.4 wt% for r(PE-PP)-100%. Based on the experimental results obtained, the quantity of the residual content could be determined using the linear equation provided in Figure 7b.

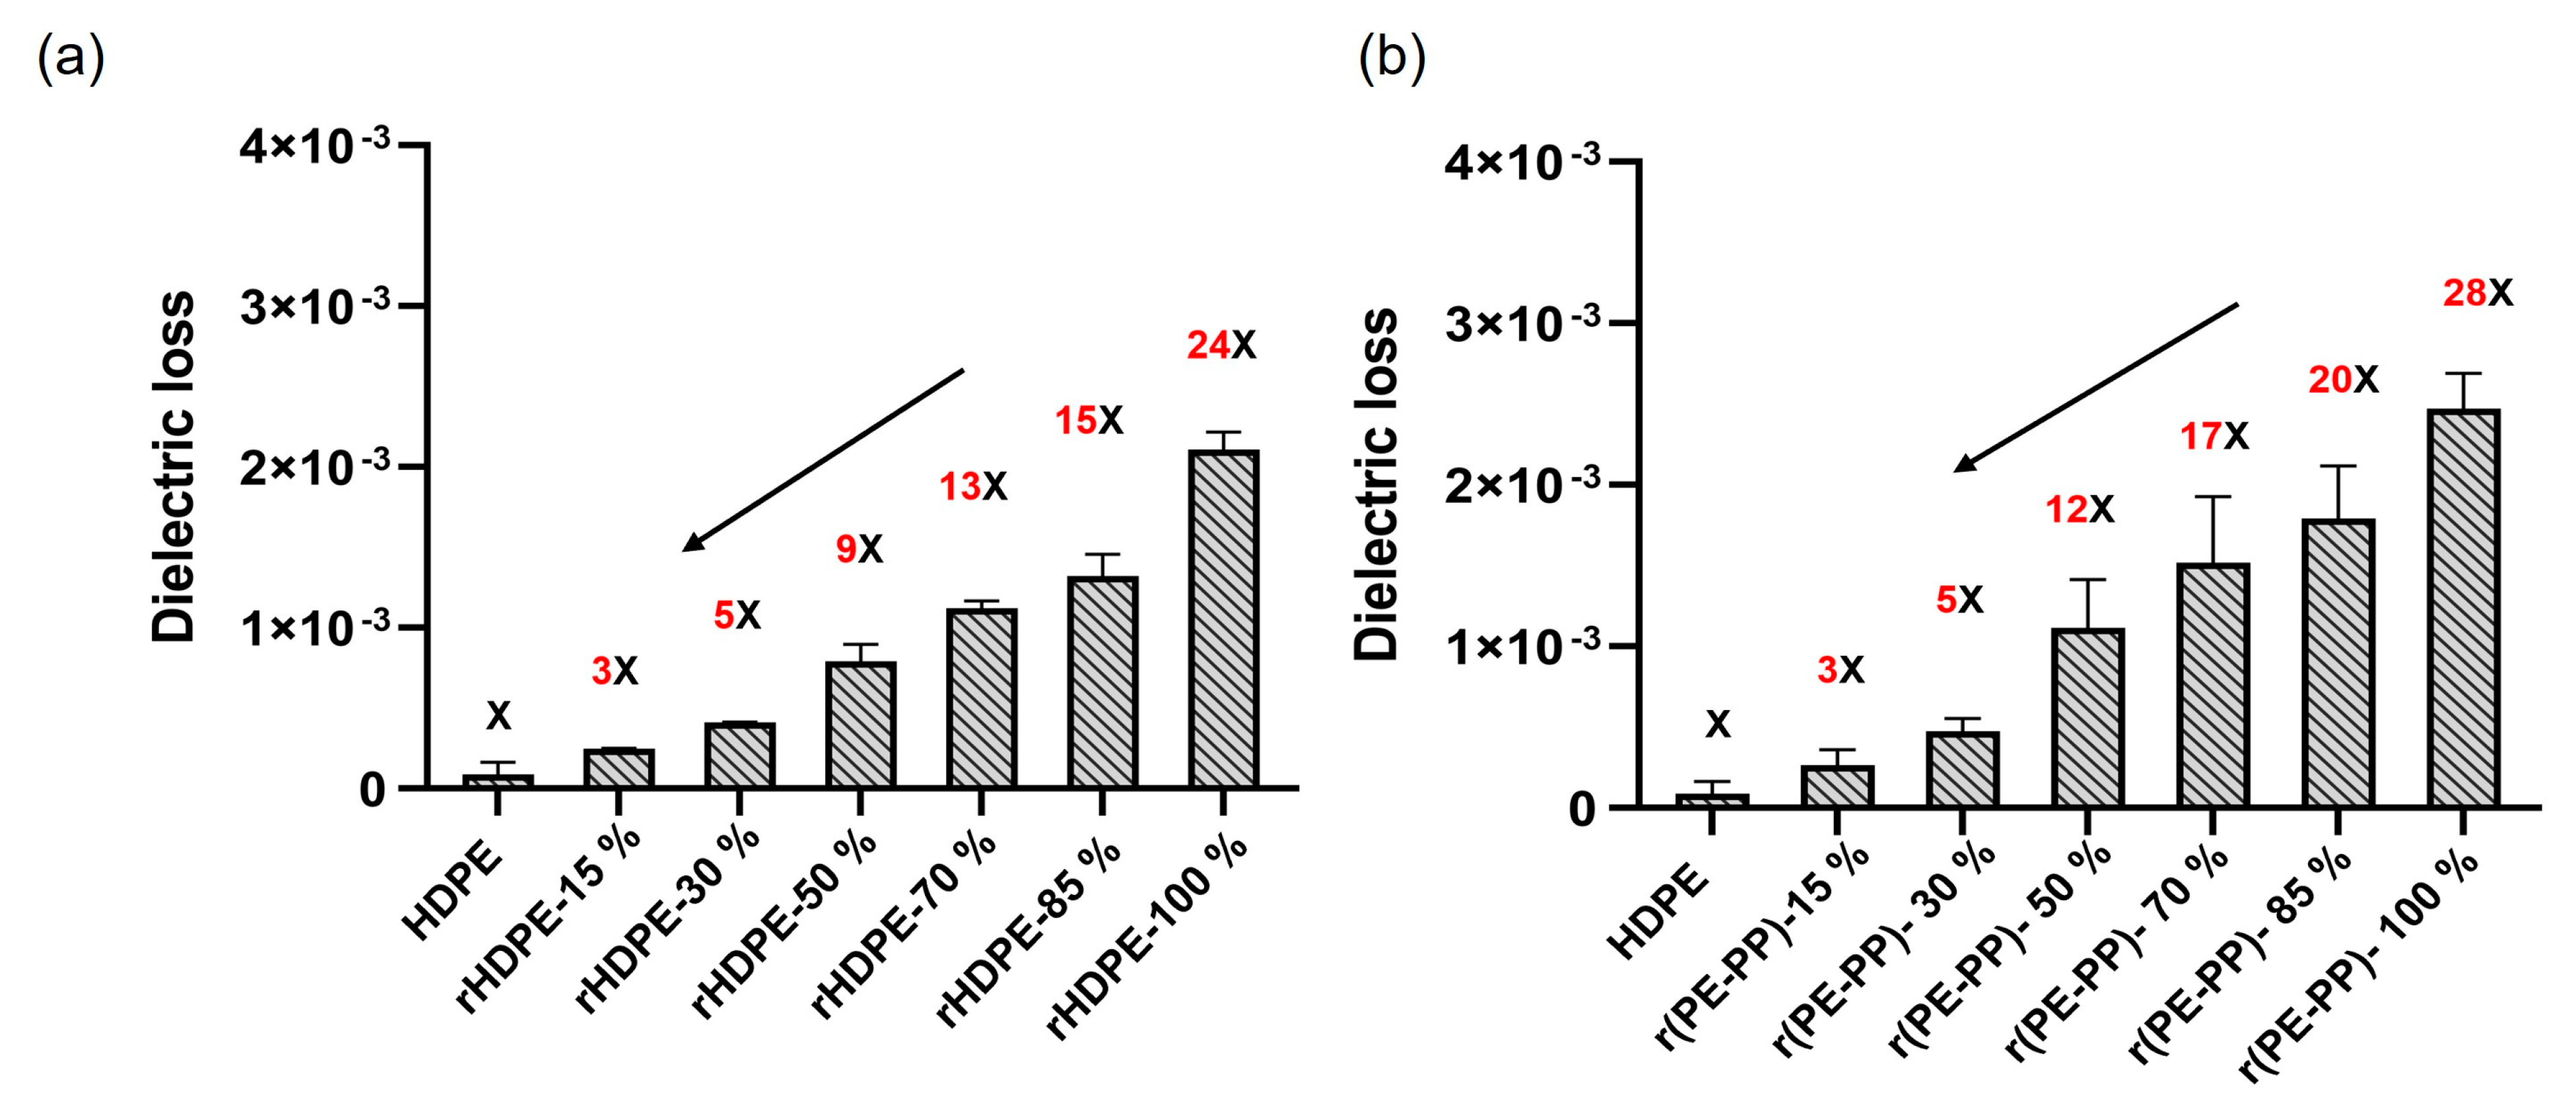
3.4.2. Dielectric Behavior of Blended Material

The utilization of unaltered post-consumer materials in the electrical insulation industry seems confined to unshielded or low-voltage cables, as their high electrical loss poses risks for shielded AC cables like distribution or transmission cables (with a medium-to-high voltage). To mitigate dielectric loss, one potential strategy involves blending recycled polymers with pure HDPE at varying ratios. This approach aims to reduce the concentration of impurities, thereby lowering dielectric loss. Notably, a significant reduction in dielectric losses was observed for both rHDPE and r(PE-PP) upon the addition of virgin HDPE, particularly at lower frequencies (Figure 8). With the power frequency (60 Hz), the dielectric loss of rHDPE and r(PE-PP) was approximately 24 and 28 times higher, respectively, than that of virgin HDPE (Figure 9). Introducing just 15% of virgin HDPE decreases the dielectric loss of rHDPE and r(PE-PP) by almost 40% and 30%, respectively. Furthermore, when an equal composition of virgin and recycled material is used, the dielectric loss decreases by 62% and 57% for rHDPE and r(PE-PP), respectively, compared to the original recycled materials at 60 Hz.
Figure 10 illustrates the Weibull distributions of breakdown data for virgin HDPE when blended with recycled material. Contrary to the findings in our previous study [10], where blending with virgin HDPE was shown to enhance the breakdown strength of recycled material by reducing the concentration of impurities, our current study yielded different results. For instance, in Figure 10a, no significant difference was observed when virgin HDPE was added to recycled polyethylene (rHDPE). In the case of recycled PE-PP samples, the dielectric breakdown strength decreased from 93 to 89 kV/mm as the percentage of virgin HDPE increased from 0 to 70%. This was attributed to the composition of the polymer matrix blend. Typically, the breakdown strength of PP is higher than that of PE; thus, the addition of virgin material to the recycled blend resulted in reduced breakdown strength. However, Dabbak et al. [37] showed opposite results. In their case, the addition of HDPE increased the breakdown strength of the HDPE/PP blend.

4. Conclusions

This research focused on the characterization of recycled materials mainly containing polyethylene or a mixture of polyethylene/polypropylene. Furthermore, the potential use of recycled polyolefins as possible materials for dielectric insulation, with blending strategies, was investigated. Several findings and conclusions can be drawn based on the investigation conducted in this study:
Chemical analysis using SEM-EDX showed the presence of inorganic impurities in the recycled materials, mainly identified as soil impurities and pigment components. Thermal analysis, DSC, exhibited the first recycled material, which was mainly composed of HDPE. The results confirm the supplier’s information regarding the second recycled material, which is composed of two different polymers: HDPE and PP. These results were also confirmed by specific FT-IR absorbance peaks at 720 cm−1, 1460 cm−1 attributed to HDPE, and several weak peaks in the range of the 800 cm−1–1300 cm−1 region attributed to PP. The thermal degradation behavior of the polymer, using TGA, represents the presence of impurities at around 1.4 wt% for both recycled materials. However, pyrolysis results showed a lower content of inorganic impurities (around 0.4 wt%) for the recycled material containing polypropylene, which was probably caused by the decomposition of carbon black in the presence of air at high temperatures.
Dielectric analysis showed considerably higher losses for recycled materials compared to virgin HDPE, especially at low frequencies where the dielectric losses of recycled rHDPE and recycled r(PE-PP) were 24 and 28 times lower than virgin polyethylene, respectively. The addition of virgin material was found to extensively reduce the dielectric loss of recycled materials. Indeed, adding only 15 wt% of virgin HDPE reduced the dielectric loss by about 40% and 30% for recycled rHDPE and recycled r(PE-PP), respectively. This result suggests the potential of blending in order to enhance dielectric properties. On the other hand, the addition of virgin material reduces the breakdown strength of the recycled material containing polypropylene due to the lower breakdown strength of PE compared to PP.

Author Contributions

Methodology, I.S.S.; Validation, I.S.S., N.R.D. and E.D.; Formal analysis, I.S.S.; Investigation, I.S.S.; Resources, N.R.D. and E.D.; Writing—original draft, I.S.S.; Writing—review & editing, I.S.S., N.R.D. and E.D.; Visualization, I.S.S.; Supervision, N.R.D. and E.D. All authors have read and agreed to the published version of the manuscript.

Funding

This research was funded by the Natural Sciences and Engineering Research Council of Canada (NSERC), grant number [RGPIN-2019-05791].

Institutional Review Board Statement

Not applicable.

Informed Consent Statement

Not applicable.

Data Availability Statement

Data are contained within the article.

Conflicts of Interest

The authors declare no conflict of interest.

References

  1. Geyer, R.; Jambeck, J.R.; Law, K.L. Production, use, and fate of all plastics ever made. Sci. Adv. 2017, 3, e1700782. [Google Scholar] [CrossRef] [PubMed]
  2. Jambeck, J.R.; Geyer, R.; Wilcox, C.; Siegler, T.R.; Perryman, M.; Andrady, A.; Narayan, R.; Law, K.L. Plastic waste inputs from land into the ocean. Science 2015, 347, 768–771. [Google Scholar] [CrossRef]
  3. Huang, X.; Zhang, J.; Jiang, P.; Tanaka, T. Material progress toward recyclable insulation of power cables. Part 1: Polyethylene-based thermoplastic materials: Dedicated to the 80th birthday of professor Toshikatsu Tanaka. IEEE Electr. Insul. Mag. 2019, 35, 7–19. [Google Scholar] [CrossRef]
  4. Cecon, V.S.; Da Silva, P.F.; Vorst, K.L.; Curtzwiler, G.W. The effect of post-consumer recycled polyethylene (PCRPE) on the properties of polyethylene blends of different densities. Polym. Degrad. Stab. 2021, 190, 109627. [Google Scholar] [CrossRef]
  5. Zhang, J.; Hirschberg, V.; Rodrigue, D. Blending Recycled High-Density Polyethylene HDPE (rHDPE) with Virgin (vHDPE) as an Effective Approach to Improve the Mechanical Properties. Recycling 2023, 8, 2. [Google Scholar] [CrossRef]
  6. Jones, H.; McClements, J.; Ray, D.; Hindle, C.S.; Kalloudis, M.; Koutsos, V. Thermomechanical Properties of Virgin and Recycled Polypropylene—High-Density Polyethylene Blends. Polymers 2023, 15, 4200. [Google Scholar] [CrossRef]
  7. Yin, S.; Tuladhar, R.; Shi, F.; Shanks, R.A.; Combe, M.; Collister, T. Mechanical reprocessing of polyolefin waste: A review. Polym. Eng. Sci. 2015, 55, 2899–2909. [Google Scholar] [CrossRef]
  8. Sultana, S.M.N.; Helal, E.; Gutiérrez, G.; David, E.; Moghimian, N.; Demarquette, N.R. Effect of Few-Layer Graphene on the Properties of Mixed Polyolefin Waste Stream. Crystals 2023, 13, 358. [Google Scholar] [CrossRef]
  9. Sultana, S.M.N.; Helal, E.; Gutiérrez, G.; David, E.; Moghimian, N.; Demarquette, N.R. The Influence of a Commercial Few-Layer Graphene on the Photodegradation Resistance of a Waste Polyolefins Stream and Prime Polyolefin Blends. Recycling 2024, 9, 29. [Google Scholar] [CrossRef]
  10. Shirzaei Sani, I.; Demarquette, N.R.; David, E. Investigation and characterization of dielectric, thermal, and chemical properties of recycled high-density polyethylene blended with virgin polyethylene. Polym. Eng. Sci. 2023, 63, 3254–3267. [Google Scholar] [CrossRef]
  11. ASTM D-3418; Standard Test Method for Transition Annual Book of ASTM. ASTM: Philadelphia, PA, USA, 2015.
  12. ASTM D-149; Standard Test Method for Dielectric Breakdown Voltage and Dielectric Strength of Solid Electrical Insulating Materials at Commercial Power Frequencies. ASTM: Philadelphia, PA, USA, 2020.
  13. IEEE-930; IEEE Guide for the Statistical Analysis of Electrical Insulation Breakdown Data. Electrical Insulation Society: New York, NY, USA, 2005.
  14. Dissado, L.A.; Fothergill, J.C. Electrical Degradation and Breakdown in Polymers. Statistical Features of Breakdown; IET: London, UK, 1992; pp. 319–355. [Google Scholar]
  15. Gala, A.; Guerrero, M.; Serra, J.M. Characterization of post-consumer plastic film waste from mixed MSW in Spain: A key point for the successful implementation of sustainable plastic waste management strategies. Waste Manag. 2020, 111, 22–33. [Google Scholar] [CrossRef]
  16. Smith, B. The Infrared Spectra of Polymers II: Polyethylene. Spectroscopy 2021, 36, 24–29. [Google Scholar] [CrossRef]
  17. Andreassen, E. Infrared and Raman Spectroscopy of Polypropylene. In Polypropylene: An A–Z Reference; Karger-Kocsis, J., Ed.; Springer: Dordrecht, The Netherlands, 1999; pp. 320–328. [Google Scholar]
  18. Camacho, W.; Karlsson, S. NIR, DSC, and FTIR as quantitative methods for compositional analysis of blends of polymers obtained from recycled mixed plastic waste. Polym. Eng. Sci. 2001, 41, 1626–1635. [Google Scholar] [CrossRef]
  19. Fang, J.; Zhang, L.; Sutton, D.; Wang, X.; Lin, T. Needleless Melt-Electrospinning of Polypropylene Nanofibres. J. Nanomater. 2012, 2012, 382639. [Google Scholar] [CrossRef]
  20. Heydariaraghi, M.; Ghorbanian, S.; Hallajisani, A.; Salehpour, A. Fuel properties of the oils produced from the pyrolysis of commonly-used polymers: Effect of fractionating column. J. Anal. Appl. Pyrolysis 2016, 121, 307–317. [Google Scholar] [CrossRef]
  21. Gall, M.; Freudenthaler, P.J.; Fischer, J.; Lang, R.W. Characterization of Composition and Structure–Property Relationships of Commercial Post-Consumer Polyethylene and Polypropylene Recyclates. Polymers 2021, 13, 1574. [Google Scholar] [CrossRef]
  22. Smith, B. The infrared spectra of polymers III: Hydrocarbon polymers. Spectroscopy 2021, 6, 22–25. [Google Scholar] [CrossRef]
  23. Turku, I.; Kärki, T.; Rinne, K.; Puurtinen, A. Characterization of plastic blends made from mixed plastics waste of different sources. Waste Manag. Res. 2017, 35, 200–206. [Google Scholar] [CrossRef]
  24. Thoden van Velzen, E.U.; Chu, S.; Alvarado Chacon, F.; Brouwer, M.T.; Molenveld, K. The impact of impurities on the mechanical properties of recycled polyethylene. Packag. Technol. Sci. 2021, 34, 219–228. [Google Scholar] [CrossRef]
  25. Dakin, T.W. Conduction and polarization mechanisms and trends in dielectric. IEEE Electr. Insul. Mag. 2006, 22, 11–28. [Google Scholar] [CrossRef]
  26. Ciuprina, F.; Plesa, I.; Notingher, P.V.; Zaharescu, T.; Rain, P.; Panaitescu, D. Dielectric properties of LDPE-SiO2 nanocomposites. In Proceedings of the 2010 10th IEEE International Conference on Solid Dielectrics, Potsdam, Germany, 4–9 July 2010; pp. 1–4. [Google Scholar]
  27. Zois, H.; Apekis, L.; Omastova, M. Electrical properties and percolation phenomena in carbon black filled polymer composites. In Proceedings of the 10th International Symposium on Electrets (ISE 10) (Cat. No.99 CH36256), Athens, Greece, 22–24 September 1999; pp. 529–532. [Google Scholar]
  28. Tomer, V.; Polizos, G.; Randall, C.A.; Manias, E. Polyethylene nanocomposite dielectrics: Implications of nanofiller orientation on high field properties and energy storage. J. Appl. Phys. 2011, 109, 074113. [Google Scholar] [CrossRef]
  29. Tripathi, N.; Thakur, A.K.; Shukla, A.; Marx, D.T. Dielectric, transport and thermal properties of clay based polymer- nanocomposites. Polym. Eng. Sci. 2018, 58, 220–227. [Google Scholar] [CrossRef]
  30. Böhning, M.; Goering, H.; Fritz, A.; Brzezinka, K.-W.; Turky, G.; Schönhals, A.; Schartel, B. Dielectric Study of Molecular Mobility in Poly(propylene-graft-maleic anhydride)/Clay Nanocomposites. Macromolecules 2005, 38, 2764–2774. [Google Scholar] [CrossRef]
  31. Cheng, Y.; Bai, L.; Yu, G.; Zhang, X. Effect of particles size on dielectric properties of nano-ZnO/LDPE composites. Materials 2018, 12, 5. [Google Scholar] [CrossRef]
  32. Li, Z.; Okamoto, K.; Ohki, Y.; Tanaka, T. The role of nano and micro particles on partial discharge and breakdown strength in epoxy composites. IEEE Trans. Dielectr. Electr. Insul. 2011, 18, 675–681. [Google Scholar] [CrossRef]
  33. Nelson, J.K.; Fothergill, J.C. Internal charge behaviour of nanocomposites. Nanotechnology 2004, 15, 586. [Google Scholar] [CrossRef]
  34. Angalane, S.K.; Kasinathan, E. A review on polymeric insulation for high-voltage application under various stress conditions. Polym. Compos. 2022, 43, 4803–4834. [Google Scholar] [CrossRef]
  35. Wong, A.C.-Y.; Lam, F. Study of selected thermal characteristics of polypropylene/polyethylene binary blends using DSC and TGA. Polym. Test. 2002, 21, 691–696. [Google Scholar] [CrossRef]
  36. Kazemi, Y.; Ramezani Kakroodi, A.; Rodrigue, D. Compatibilization Efficiency in Post-Consumer Recycled Polyethylene/Polypropylene Blends: Effect of Contamination. Polym. Eng. Sci. 2015, 55, 2368–2376. [Google Scholar] [CrossRef]
  37. Ahmed Dabbak, S.Z.; Illias, H.A.; Ang, B.C.; Abdul Latiff, N.A.; Makmud, M.Z. Electrical Properties of Polyethylene/Polypropylene Compounds for High-Voltage Insulation. Energies 2018, 11, 1448. [Google Scholar] [CrossRef]
Figure 1. FT-IR spectra of recycled waste materials and virgin HDPE at spectral ranges from (a) 400 cm−1 to 4000 cm−1 and (b) 500 cm−1 to 1700 cm−1. rHDPE and r(PE–PP) refer to recycled high-density polyethylene and a recycled polyethylene/polypropylene blend, respectively.
Sustainability 17 04123 g001
Figure 2. SEM-EDX map of post-consumer-recycled polyethylene/polypropylene, r(PE-PP). * Intensity scale: 0.001 cps/eV (counts per second per electron volt).
Sustainability 17 04123 g002
Figure 3. Thermal behavior of HDPE, rHDPE, and r(PE-PP). (a) DSC curve at temperatures from 80 to 180 °C; (b) TGA curve at temperatures from 200 to 600 °C. HDPE, rHDPE and r(PE–PP) refer to virgin high-density polyethylene, recycled high-density polyethylene and a recycled polyethylene/polypropylene blend, respectively.
Sustainability 17 04123 g003
Figure 4. The imaginary permittivity of (a) recycled polyethylene (rHDPE) and (b) recycled polymer, with a mix of polyethylene and polypropylene r(PE-PP), at temperatures ranging from 25 °C to 95 °C.
Sustainability 17 04123 g004
Figure 5. The imaginary permittivity of r(PE-PP) under different temperature profiles: (a) gradual temperature increase; (b) steady high temperature; and (c) cyclic temperature changes between 25 °C and 70 °C.
Sustainability 17 04123 g005
Figure 6. Breakdown strength of virgin HDPE, recycled HDPE, and r(PE-PP).
Sustainability 17 04123 g006
Figure 7. (a) TGA curve, and (b) the remaining weight (%) at 600 °C derived from the TGA curve for the recycled material r(PE-PP) blended with virgin HDPE at various ratios. In Figure 7b, the black dots represent experimental data, while the blue dotted line is the linear fit, showing a positive correlation between the residual weight and the recycled content (y = 0.0124x).
Sustainability 17 04123 g007
Figure 8. The imaginary permittivity of recycled materials blended with virgin polyethylene at various concentrations: (a) recycled HDPE (rHDPE); (b) recycled polyethylene/polypropylene, r(PE-PP), at a range of frequencies from 10−1 to 106 Hz and at the temperature 25 °C.
Sustainability 17 04123 g008
Figure 9. The dielectric loss of the blend of recycled materials and virgin polyethylene at various concentrations: (a) recycled PE, rHDPE; (b) recycled polyethylene/polypropylene blend, r(PE-PP), at a fixed frequency (60 Hz) and a temperature of 25 °C.
Sustainability 17 04123 g009
Figure 10. Dielectric breakdown strength of the blend of (a) recycled polyethylene (rHDPE) and (b) recycled polyethylene/polypropylene mixture, r(PE-PP), at different ratios with virgin high-density polyethylene. The samples are labeled according to the sample name and the percentage of recycled material included.
Sustainability 17 04123 g010
Table 1. Proportions of elements (%) on the surface of virgin and recycled materials.
Sample/ElementCOTiCaSiAlSClKMgNa
rHDPE96.491.910.880.230.10.220.050.040.08--
r(PE-PP)97.471.510.390.250.080.27-0.04---
HDPE98.091.06--0.710.14-----
Table 2. Composition of blended recycled material, both recycled HDPE and recycled PE-PP, with virgin HDPE.
Samplewt% of Virgin
HDPE
wt% of Recycled
rHDPE
wt% of Recycled
r(PE-PP)
HDPE10000
r(PE-PP)-100%00100
r(PE-PP)-85%15085
r(PE-PP)-70%30070
r(PE-PP)-50%50050
r(PE-PP)-30%70030
r(PE-PP)-15%85015
rHDPE-100%01000
rHDPE-85%15850
rHDPE-70%30700
rHDPE-50%50500
rHDPE-30%70300
rHDPE-15%85150
Table 3. Thermal properties of blended recycled materials calculated using the DSC result.
Polymer Blend T m P E T m P P T C P E T C P P ΔHPEΔHtotalPP%
HDPE133-120-233.2233.20
r(PE-PP)-30%132161121-178.2190.27
r(PE-PP)-50%132161121-145.1167.313
r(PE-PP)-70%131160121123121.1156.522
r(PE-PP)-100%13016111912469.611943
Note: Tm: melting temperature, TC: crystallization temperature of polyethylene and polypropylene in the polymer blend.
Disclaimer/Publisher’s Note: The statements, opinions and data contained in all publications are solely those of the individual author(s) and contributor(s) and not of MDPI and/or the editor(s). MDPI and/or the editor(s) disclaim responsibility for any injury to people or property resulting from any ideas, methods, instructions or products referred to in the content.

