Article

Study on China’s Plastic Consumption Trend and Sustainable Development Countermeasures

Energy Research Institute, China Academy of Macroeconomic Research, Beijing 100038, China
*
Author to whom correspondence should be addressed.
Sustainability 2025, 17(9), 4218; https://doi.org/10.3390/su17094218
Submission received: 28 March 2025 / Revised: 30 April 2025 / Accepted: 1 May 2025 / Published: 7 May 2025

Abstract

:
The global plastic pollution control process has put forward higher requirements for waste plastic reduction and recycling. This study evaluated the plastic demands by 2030 and 2050 in China based on a combination of qualitative and quantitative methods, identified the four consumption terminals, and put forward countermeasures for the sustainable development of the plastics industry. The results show that based on the analysis of China’s low-carbon transition and global plastic pollution control policies, the reasonable demands for plastic will reach 118 and 110 million tons by 2030 and 2050, respectively. The packaging, construction and decoration, electronics and appliance, and automobile areas are the four major terminals of plastic consumption in China, accounting for more than 80% of the total plastic consumption. The enhanced implementation of the policy of banning and restricting plastic bags will lead to a significant drop in the consumption of disposable packaging plastics, while the low-carbon transformation of the whole society will promote the realization of low-energy consumption in the field of construction, the automobile industry toward lightweight materials, and electronics and appliance products toward high quality, thus further stimulating the related plastics demand. Finally, countermeasures for the sustainable development of plastic are proposed.

1. Introduction

Since the 1850s, human beings have produced more than 9.2 billion tons of plastic, of which 6.3 billion tons have become plastic waste, which sink into the oceans through rivers and lakes, resulting in about 93,000 to 236,000 tons of plastic waste floating on the sea, 94% of which will fall to the sea floor [1], which has a serious impact on the marine ecosystem. In addition, as plastic waste decomposes in the natural environment, microplastic particles gradually form and are widely found in tap water around the world. According to one study, microplastics were detected in 83% of tap water samples worldwide, with an average of 4.34 microplastic particles per liter of water [2]. Microplastics have also been detected in the atmosphere and can cause adverse health consequences in the human body through inhalation or ingestion [3]. Moreover, chemical additives, such as plasticizers and flame retardants used in the plastic manufacturing process, may be enriched through the food chain, posing a serious threat to biodiversity and human health [4,5].
In an effort to end marine plastic pollution, the second phase meeting of the Fifth UN Environment Conference (UNEA-5.2) reached the decision entitled “End Plastic Pollution: Moving towards a Legally binding International Agreement” in 2022 [6], which formally launched the plastic management process. The Intergovernmental Negotiation Committee (INC) successfully concluded the fifth Global Plastics Treaty negotiations by 2024 [7]. Although no legally binding international agreement has been formed, a resumed conference in 2025 is on the horizon, where the details of the treaty will be explored in detail [8]. Once the global Plastics Treaty is signed, the signatories will assume the responsibility and obligation to reduce the pollution throughout the life cycle of plastics, which will undoubtedly have a profound impact on the upstream and downstream chains of the global plastics industry. At present, many countries in the world have formulated various plastic pollution control policies [9]. In January 2018, the European Union issued the EU Plastics Strategy in the Circular Economy, proposing that by 2030, 100% of the plastic packaging can be reused or recycled [10]. Japan, France, the United States and other countries have also introduced the Resource Circulation Strategy for Plastics [11], the Anti-Waste and Circular Economy Law [12] and the Plastics Act [13], which define the time planning and quantitative goals of plastic recycling. China is also actively carrying out plastic pollution control. In 2020, the National Development and Reform Commission and the Ministry of Ecology and Environment jointly issued the document on Further Strengthening the Control of Plastic Pollution, which clearly puts forward the prohibition and restriction of plastic products by region, time and type, and requires localities to formulate corresponding control programs according to the actual situation [14]. In 2021, the National Development and Reform Commission and the Ministry of Ecology and Environment jointly issued the Notice on the “14th Five-Year Plan” Action Program on Plastic Pollution Control, which aims to effectively reduce the use of single-use plastic products and improve the construction of plastic recycling and disposal systems by strengthening the whole chain of plastic production, circulation, consumption, recycling and disposal [15].
Although countries around the world are struggling to cope with the challenge of plastic pollution, even with the concept of low-carbon development deeply rooted in the hearts of the people, approaches involving plastics in the construction; automobile; electronics and appliance; and other fields of wide application, such as “plastic instead of steel”, “plastic instead of wood” and “plastic instead of glass” innovation practices, mean that these areas of demand for advanced plastics continue to rise, with no sign of weakening. In the global plastic pollution control negotiations, some countries intend to take the opportunity to limit the global production of plastics worldwide or even by some countries [16], which is actually putting the cart before the horse. The demand for advanced plastics driven by the global low-carbon development cannot be curbed, and the way to fully stop the source of production is not desirable. Limiting the production of plastics is restricting global economic development. To resolve the dispute over whether to reduce plastic production, it is necessary to learn more about the actual situation of global plastic consumption, identify key consumption areas and make accurate predictions of future consumption trends. This will help to distinguish which areas are critical and irreducible in global economic development and which can be reduced, thus providing a solid data base for global plastics treaty negotiations. So far, there have been some studies on plastic flows and stocks in China [17,18,19]; however, there have been few studies on plastic consumption demand and terminal consumption in the world or even in a certain country. Therefore, this study tried to take the plastic consumption demand in China as an example and assessed China’s future plastics consumption demand by benchmarking the per capita plastics consumption level of developed countries; identified the four major consumption terminals and examined the future trends; and finally, put forward countermeasures and suggestions for the sustainable development of plastics consumption.

2. Materials and Methods

The analysis of the plastic demand in China relied on a comparative analysis method, which commonly involves the description of similarities and differences of conditions or outcomes between regions and nations. The quantitative comparison is expressed through quantitative characteristics of relative scales, where the one-parameter comparison is much easier and more time-efficient [20]. Thus, we used a one-parameter comparison to analyze two or more countries or regions with each other [21]. By applying this method, first, the theme and purpose of the comparison should be determined; second, the object of comparison should be determined; and finally, the conclusion should be drawn from the comparative analysis based on the collected information. Specifically for the international comparison of the plastic consumption level, the method involved choosing developed countries, developing countries or regions for comparison; taking the per capita plastic consumption level as the weighing scale; analyzing the per capita plastic consumption level and the gaps between the countries; benchmarking the per capita plastic consumption level in Japan and other countries; and judging the trend of China’s per capita plastic consumption level and the future demand of plastic consumption.
The analysis of the plastic terminal consumption trend in China mainly relied on qualitative methods, which can focus on the analysis of empirical data to generalize the analysis [22]. By evaluating the market potential of the mainstream products of the plastic consumption terminals by experts and comprehensively considering the future development trend of various sectors, such as industry, agriculture and services, the changing trend of each consumption terminal can be predicted. China’s plastic consumption terminals mainly include packaging, construction and decoration, electronics and appliances, automobiles and agriculture. Combined with the current implementation of the whole chain of plastic pollution control policies, the mainstream plastic products and market space needed in various fields were studied and evaluated. The packaging sector focuses on the analysis of the restrictions on single-use plastic products and the market demand for advanced materials, such as metallocene polyethylene, high-barrier materials and biodegradable plastics. The field of construction and decoration is mainly based on the development trend of green, energy-saving and low-carbon buildings, and the market demand of building materials, such as thermal insulation and heat insulation, while the electronics and appliances field mainly focuses on the development trend of 5G and intelligent electronic equipment, as well as the market demand analysis of high-performance, lightweight, energy-saving and new low-carbon materials. The automobile field is mainly based on the development trend of automotive lightweight and the market demand of modified plastic composites.

3. Assessment of China’s Future Plastic Consumption Demand

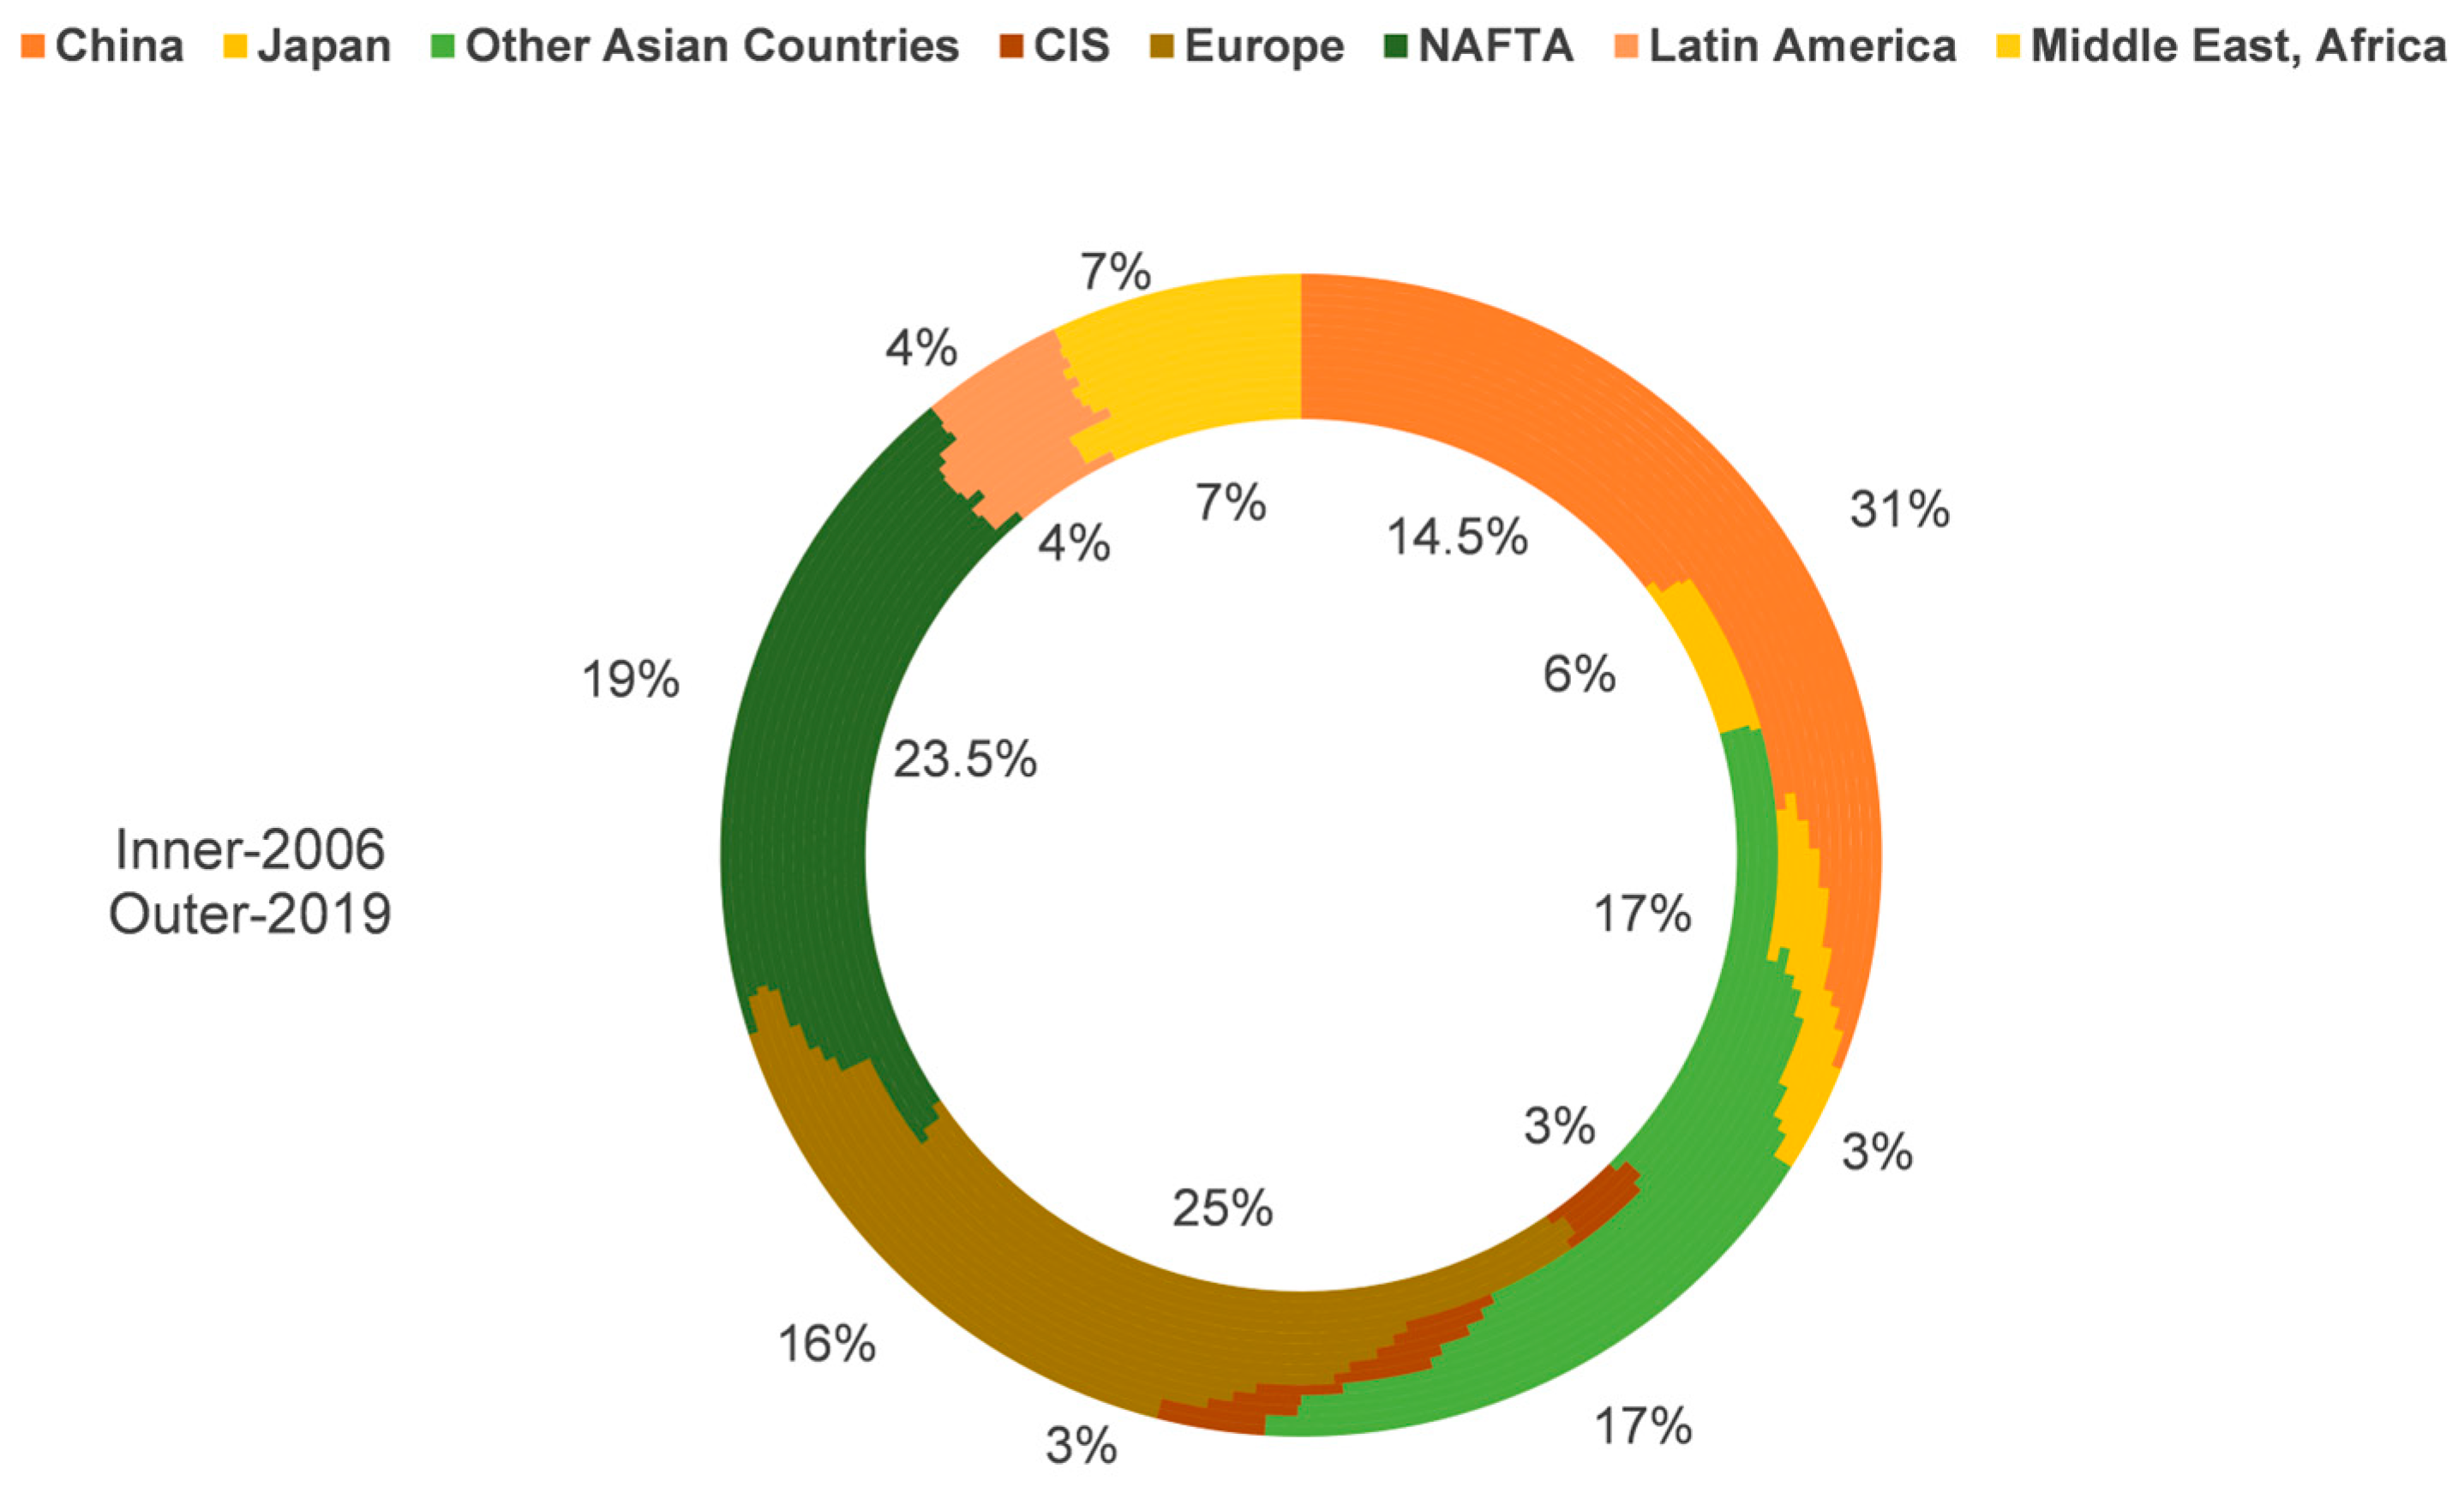
3.1. Global Plastic Production and Consumption Pattern

As shown in Figure 1, China’s production of primary plastic in 2006 was 26.03 million tons, which accounted for about 15% of the global plastic production. At that time, European countries had the highest plastic production, which accounted for about 25% of the world. This pattern has changed since 2010, when China’s plastic production climbed sharply to 44.33 million tons, which accounted for about 23.5% of the global total, and has continued to grow rapidly at an average annual rate of 9% since then [23]. By 2018, China had produced 88.55 million tons of primary plastic, which accounted for about one-third of the global plastic production. This was followed by the North American Free Trade Area (NAFTA), other Asian countries (except China and Japan) and European countries, which accounted for 18%, 17% and 17% of the global plastic production, respectively. The Middle East and Africa accounted for 7% of the global plastic production, while Latin America and Japan both accounted for 4%.
With the rising production of primary plastics, China’s plastic consumption also increased rapidly, from 53.27 million tons in 2010 to 95.55 million tons in 2018, with an average annual growth rate of 8% (Figure 2). The increase in plastic consumption has brought about the expansion of the primary plastic import scale, up from 16.37 million tons in 2010 to 20.12 million tons in 2018. The plastic components here mainly include polyethylene, polypropylene, styrene, ABS resin, PVC and polyester. At the same time, the domestic plastic processing and manufacturing industry also showed a booming trend, and the exports of plastic products increased steadily, doubling from 7.43 million tons in 2010 to 13.12 million tons in 2018. Since the 1990s, China’s imports have mainly been primary plastics, and exports have mainly been plastic products, with the import scale being larger than the export scale. In 2018, the net import of plastics reached 7 million tons, while China’s imports of primary plastics were 36.91 million tons in January to December 2019, with a year-on-year increase of 12.4%.

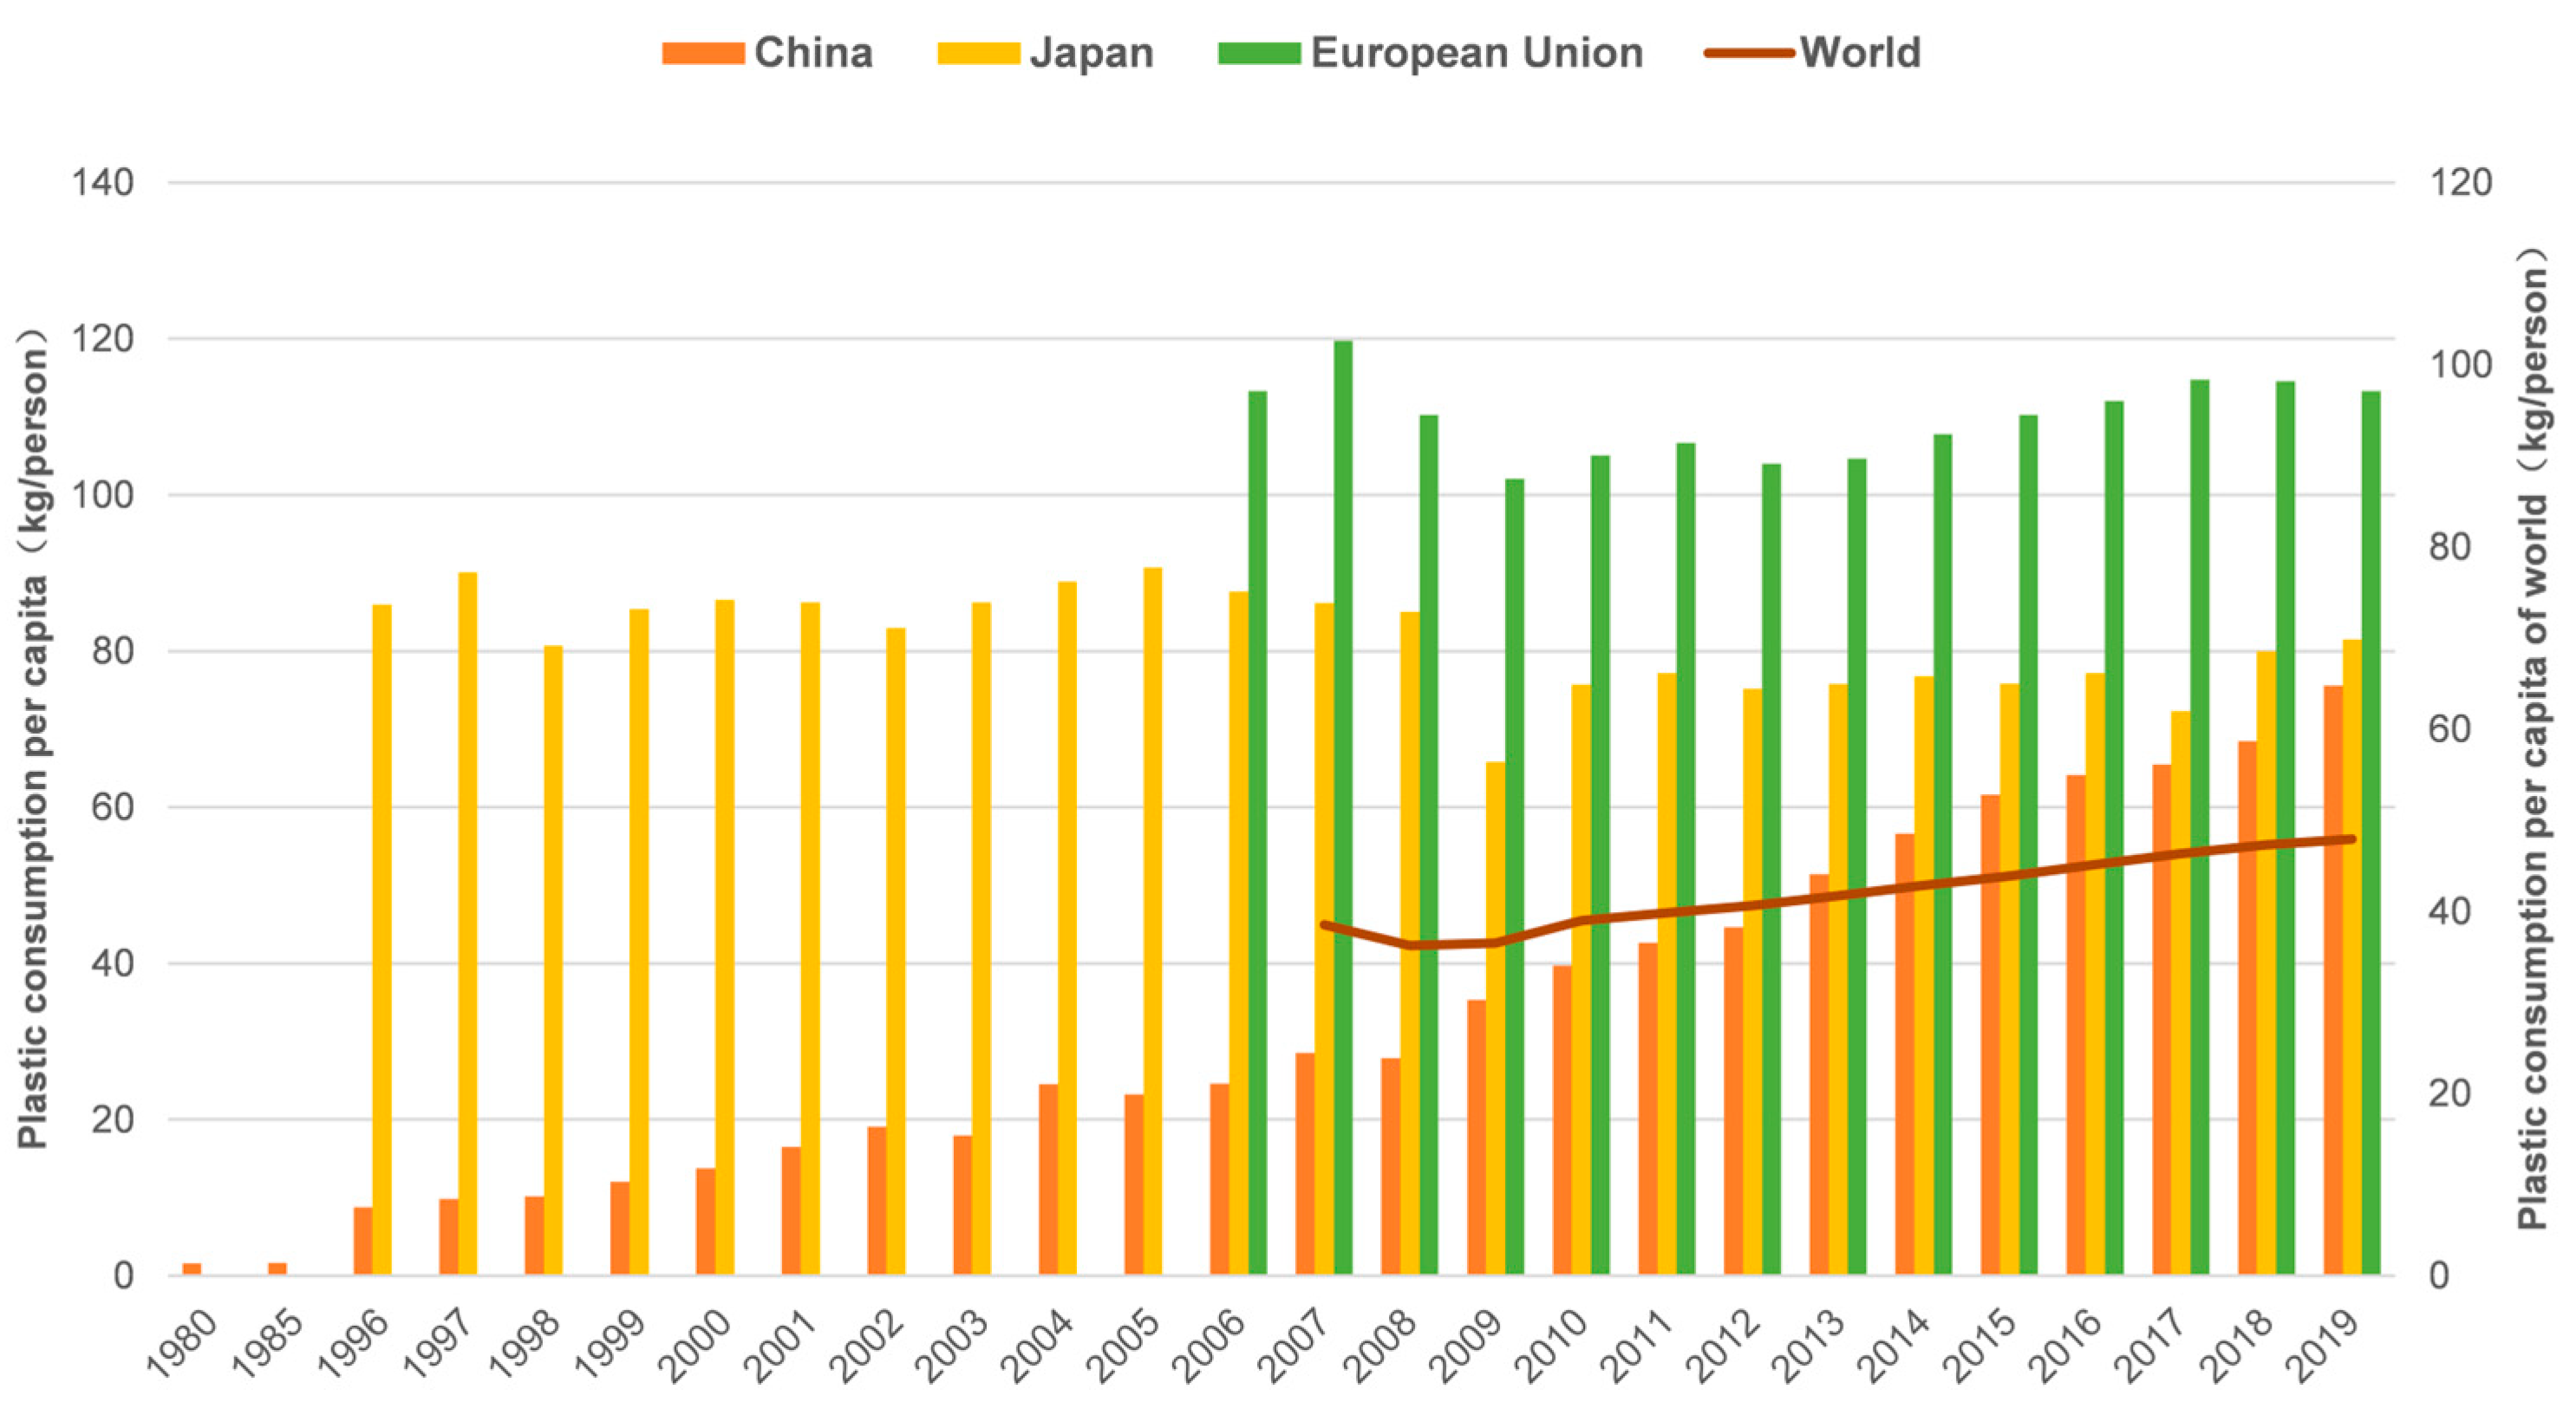
3.2. China’s per Capita Plastic Consumption Level

From the perspective of the plastic consumption level in developed countries, the per capita plastic consumption in Japan and the European Union showed a relatively steady change, fluctuating around 80 kg/person and 110 kg/person, respectively. The global per capita plastic consumption also grew slowly, from 39 kg/person in 2010 to 47.3 kg/person in 2018. With rapid economic and social development, China’s per capita plastic consumption also grew, from 39.7 kg/person in 2010 to 68.5 kg/person in 2018, and almost doubled in 2019 (76 kg/person). Although China’s plastic consumption continued to grow, its per capita plastic consumption level was much lower than that of developed countries, such as Japan (82 kg/person) and those of the European Union (115 kg/person) (Figure 3). In the future, as the plastic linear economic model gradually shifts to the circular economy model [24], the industries of takeaways and express delivery will transform from disposable plastic products consumption to the recycling of plastic products consumption. Then, recycled plastics will replace a portion of the primary plastic, leading to a significantly reduction in the demand for primary plastic products; China’s per capita plastic consumption will also be lower by then.

3.3. Forecast of Future Plastic Consumption Demand in China

Based on the international comparison, China’s per capita plastic consumption level has a big gap with developed countries, and there is still room for plastic consumption growth. Since 2020, due to the impact of the epidemic, the demand for disposable protective products, such as masks, has increased significantly, and it is basically abandoned immediately after use, leading to a rapid increase in the consumption of plastics. Based on the assumption that China’s per capita plastic consumption in China may be equal that of the European Union and other developed countries in the future, it is estimated that China’s per capita plastic consumption will reach 85 kg/person, 98 kg/person and 120 kg/person in 2025, 2030 and 2050, respectively. According to the National Population Development Plan (2016–2030) issued by the State Council [25], China’s total population is expected to peak at 1.45 billion in 2030. According to the Academy of Social Sciences, China will reach a peak at 1.442 billion in 2029, after which the total population will gradually decrease. It is expected that China’s total population will decrease to 1.36 billion in 2050 and 1.25 billion in 2065 [26]. Accordingly, this study assumed that China’s population will reach 1.44 billion, 1.45 billion and 1.36 billion in 2025, 2030 and 2050. The results show that China’s plastic demand will continue to increase from 2025 to 2050, reaching 140 million tons by 2030 and 160 million tons by 2050.
Considering China’s commitment to achieving a carbon peak by 2030 and carbon neutrality by 2060, as well as ongoing plastic pollution control policies, China’s per capita plastic consumption is expected to decrease in the future. According to the existing literature [27,28], the plastic consumption trend in China is similar to that in the European Union and Japan, and local plastic production affects the consumption patterns in the same region to a great extent, which may be related to factors such as the logistics efficiency, economic policies and market dynamics. Among them, Japan’s historical plastic production and consumption characteristics can play a certain reference role in China’s plastic demand forecast. It was assumed that China’s per capita plastic consumption will reach Japan’s per capita consumption level (82 kg/person) in 2025 and will maintain this level thereafter, and that China’s per capita plastic consumption will be 82 kg/person in both 2030 and 2050. The results of China’s future plastic demand are shown in Figure 4. From 2025 to 2050, China’s plastic consumption demand will be stable at about 110 million to 120 million tons. China’s plastic consumption demand will reach a peak at 119 million tons in 2030 and drop to 110 million tons in 2050.

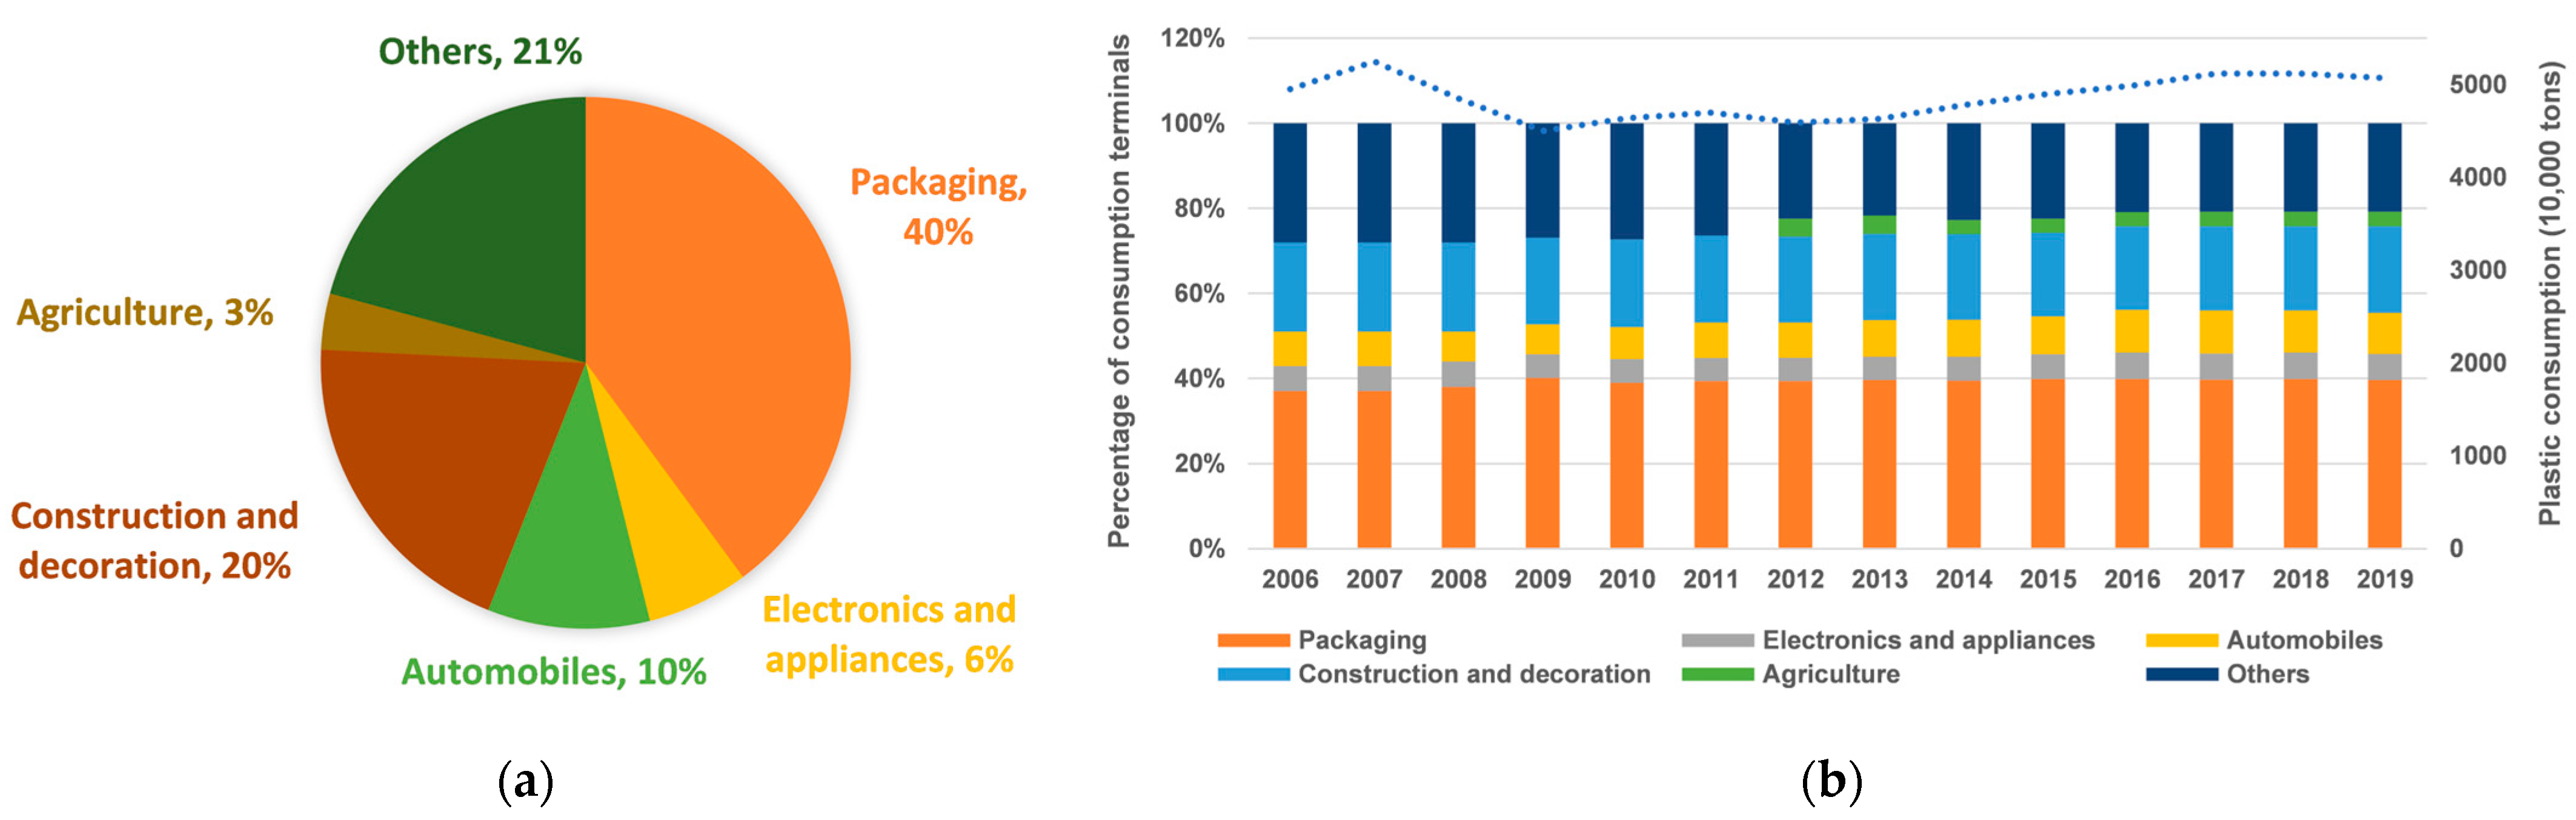
4. Analysis of Plastic Consumption Terminals Trends in China

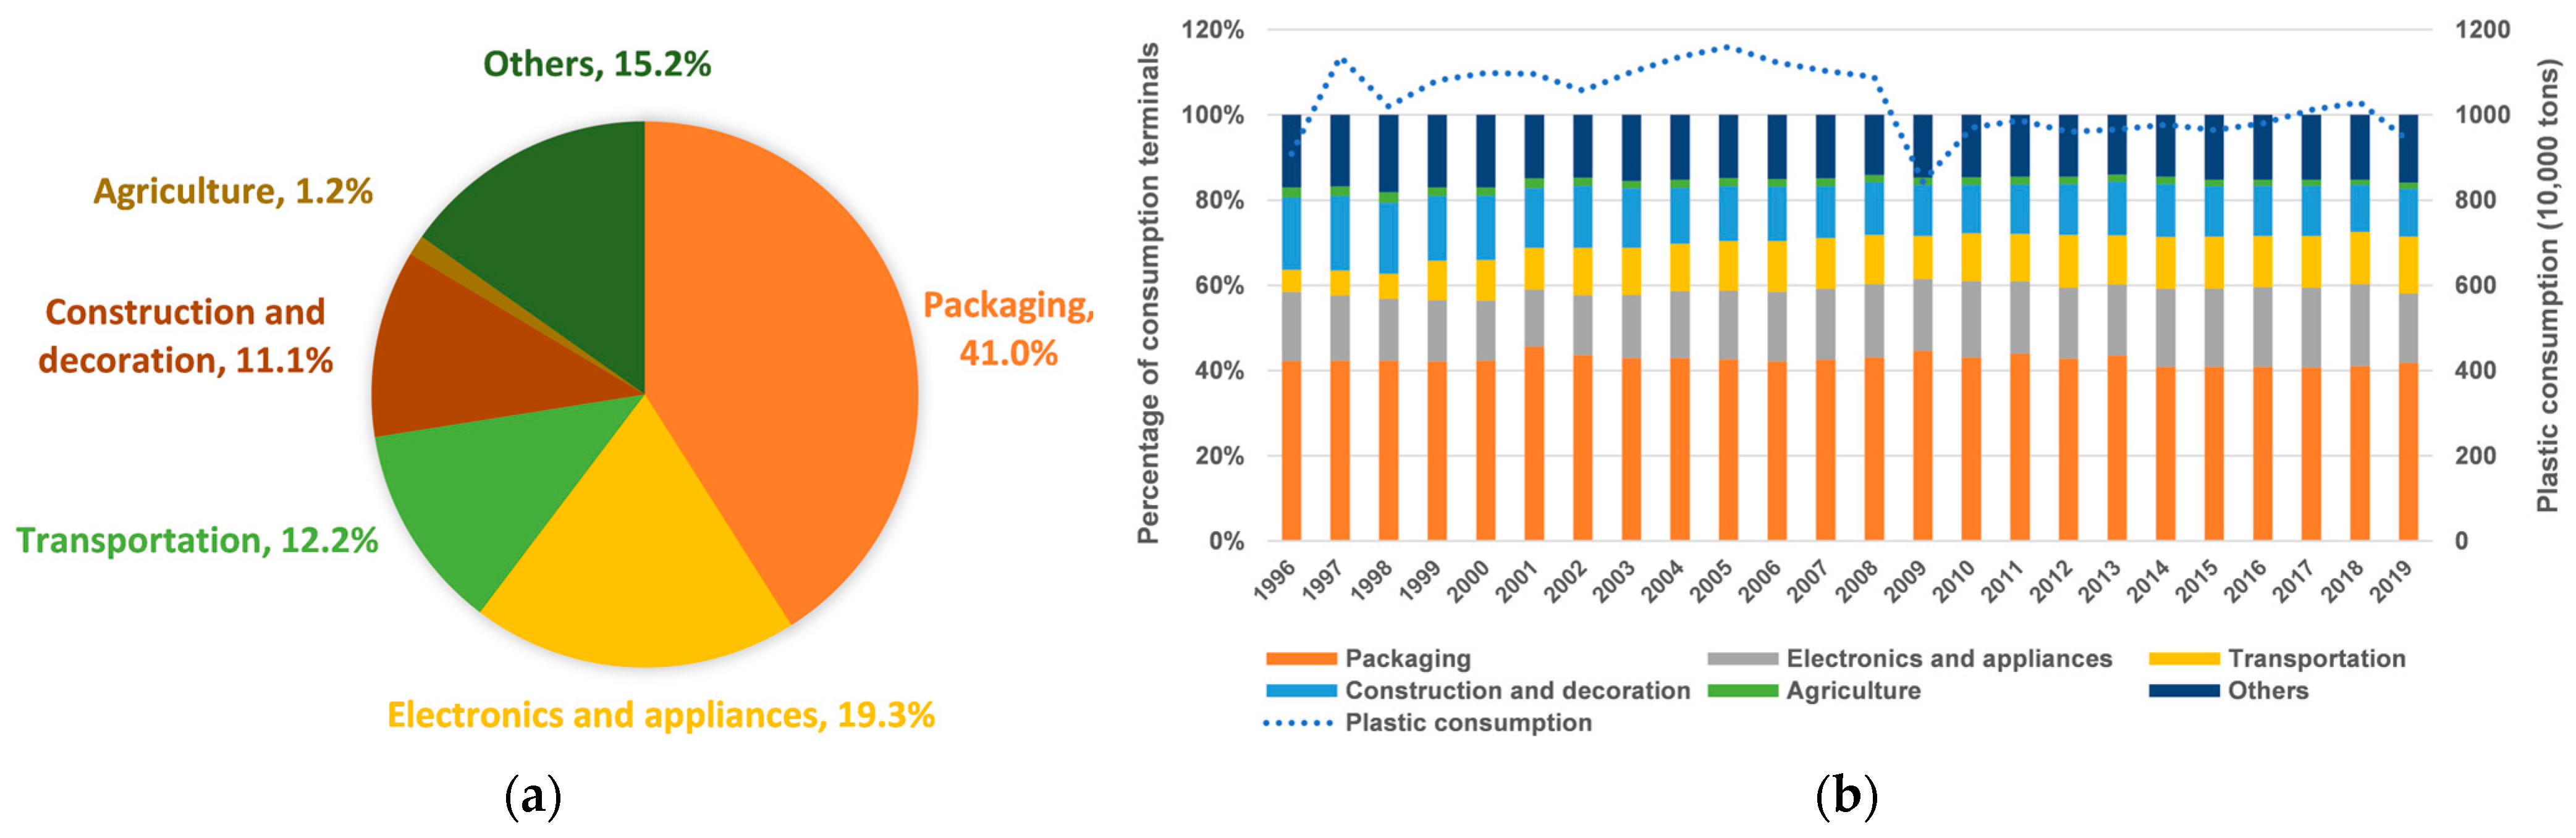
4.1. Analysis of Plastic Consumption Terminals Current Situation in Developed Countries

Plastic consumption is spread across all industries, and the main consumption areas are packaging, construction and decoration, electronics and appliances, transportation and agriculture. According to the statistics of Plastics Europe [23], as shown in Figure 5a, the EU plastic consumption in 2018 was 51.2 million tons, of which the consumption of packaging, construction and decoration, and other areas accounted for 80%, and the plastic consumption in the fields of automobiles, electronics and appliances, and agriculture accounted for less than 10%. Packaging, building decoration and other fields are the main plastic consumption terminals in the EU. The historical trend of plastic consumption terminals is shown in Figure 5b. The EU plastic consumption was in a downward trend from 2007 to 2009, with a drop of 7.5 million tons; an overall steady state from 2009 to 2013; and slowly rose from 2013 to 2017, with overall stabilization since 2017. From the perspective of the plastic consumption pattern, the proportion of packaging, electronic appliances and automobiles increased from 2006 to 2019, from 37%, 6% and 8% to 39.6%, 6.2% and 9.6%, respectively. Meanwhile, the construction and decoration and other fields decreased from 21% and 28% to 20.4% and 20.8%, respectively. The share of plastic consumption in agriculture, on the other hand, declined from 4.2% in 2012 to 3.4% in 2019. This change in the plastic consumption pattern is closely related to the development of the EU plastic manufacturing and end-consumption industries.
Japan’s main plastic consumption terminals are different from the EU’s. According to the statistics of the plastic waste management institute of Japan [29], as shown in Figure 6a, Japan’s plastic consumption was 10.29 million tons in 2018, of which packaging was the largest consumption area, with a consumption share of 41%, followed by the electronics and appliance, other, transportation, and construction and decoration areas, with a consumption shares of 19.3%, 15.2%, 12.2% and 11.1%, respectively. Thus, packaging, construction and decoration, electronics and appliances, and transportation were the main consumption terminals, of which packaging was the largest application terminal. The historical trend of plastic consumption terminals is shown in Figure 6b, where Japan’s plastic consumption fluctuated around 11 million tons from 1996 to 2008, and the overall consumption of plastics stabilized at about 10 million tons from 2009 to 2019. From the perspective of the plastic consumption pattern, the proportion of plastic consumption in the transportation sector increased significantly from 1996 to 2019, from 5.1% to 13.3%, followed by the field of electronics and appliances, where the proportion of consumption increased from about 15% to 19%. Consumption in the packaging sector fluctuated slightly but was generally stable. Consumption in the construction and decoration and agriculture sectors decreased significantly, from 17% and 2.4% to 11.3% and 1.4%, respectively. This change also reflects the development trend of Japan’s automobile, electronics and appliance manufacturing industries.

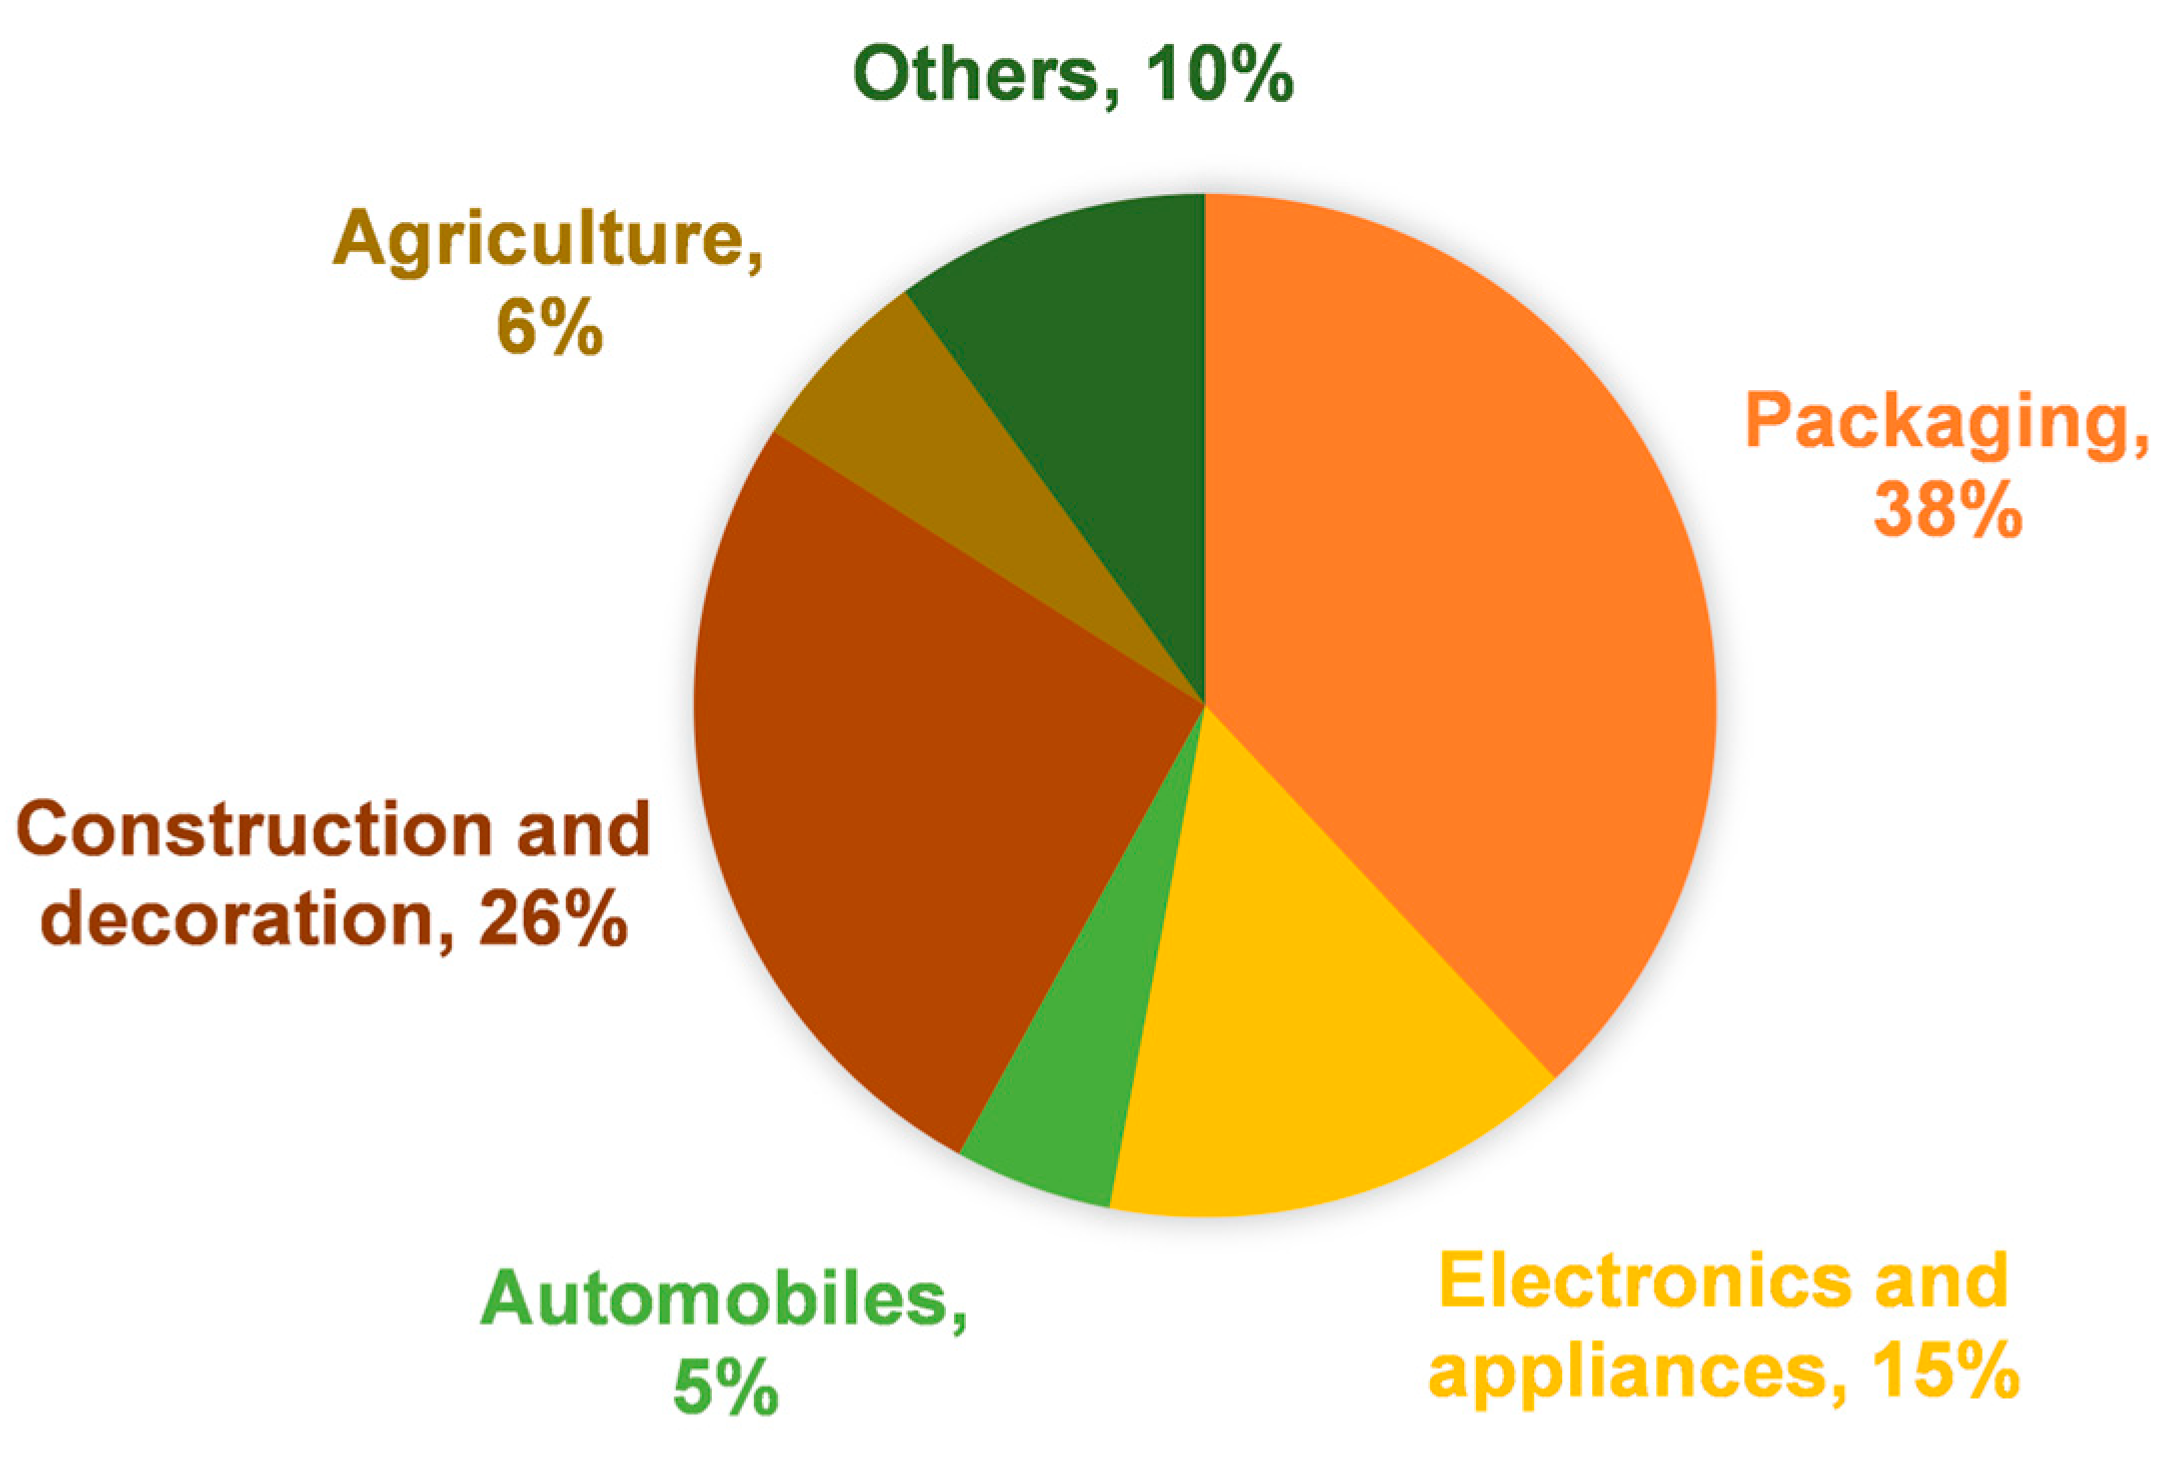
4.2. Analysis of Plastic Terminal Consumption Current Situation in China

Plastic consumption areas mainly include packaging, construction and decoration, electronics and appliances, automobiles, agriculture and other fields. In 2018, China’s plastic consumption was 95.55 million tons, of which the four major consumption terminals of packaging, construction and decoration, electronics and appliances, and automobile were up to more than 80%. As shown in Figure 7, plastic consumption in China’s packaging field accounted for 38% of the total consumption in 2018, followed by construction and decoration and electronics and appliances, with 26% and 15%, respectively [30,31]. The agriculture and automotive sectors accounted for 6% and 5% of the total consumption, respectively. Therefore, China’s plastic consumption terminals were mainly the packaging, construction and decoration, electronics and appliances, and automobile fields, among which packaging was the field with the highest plastic consumption.

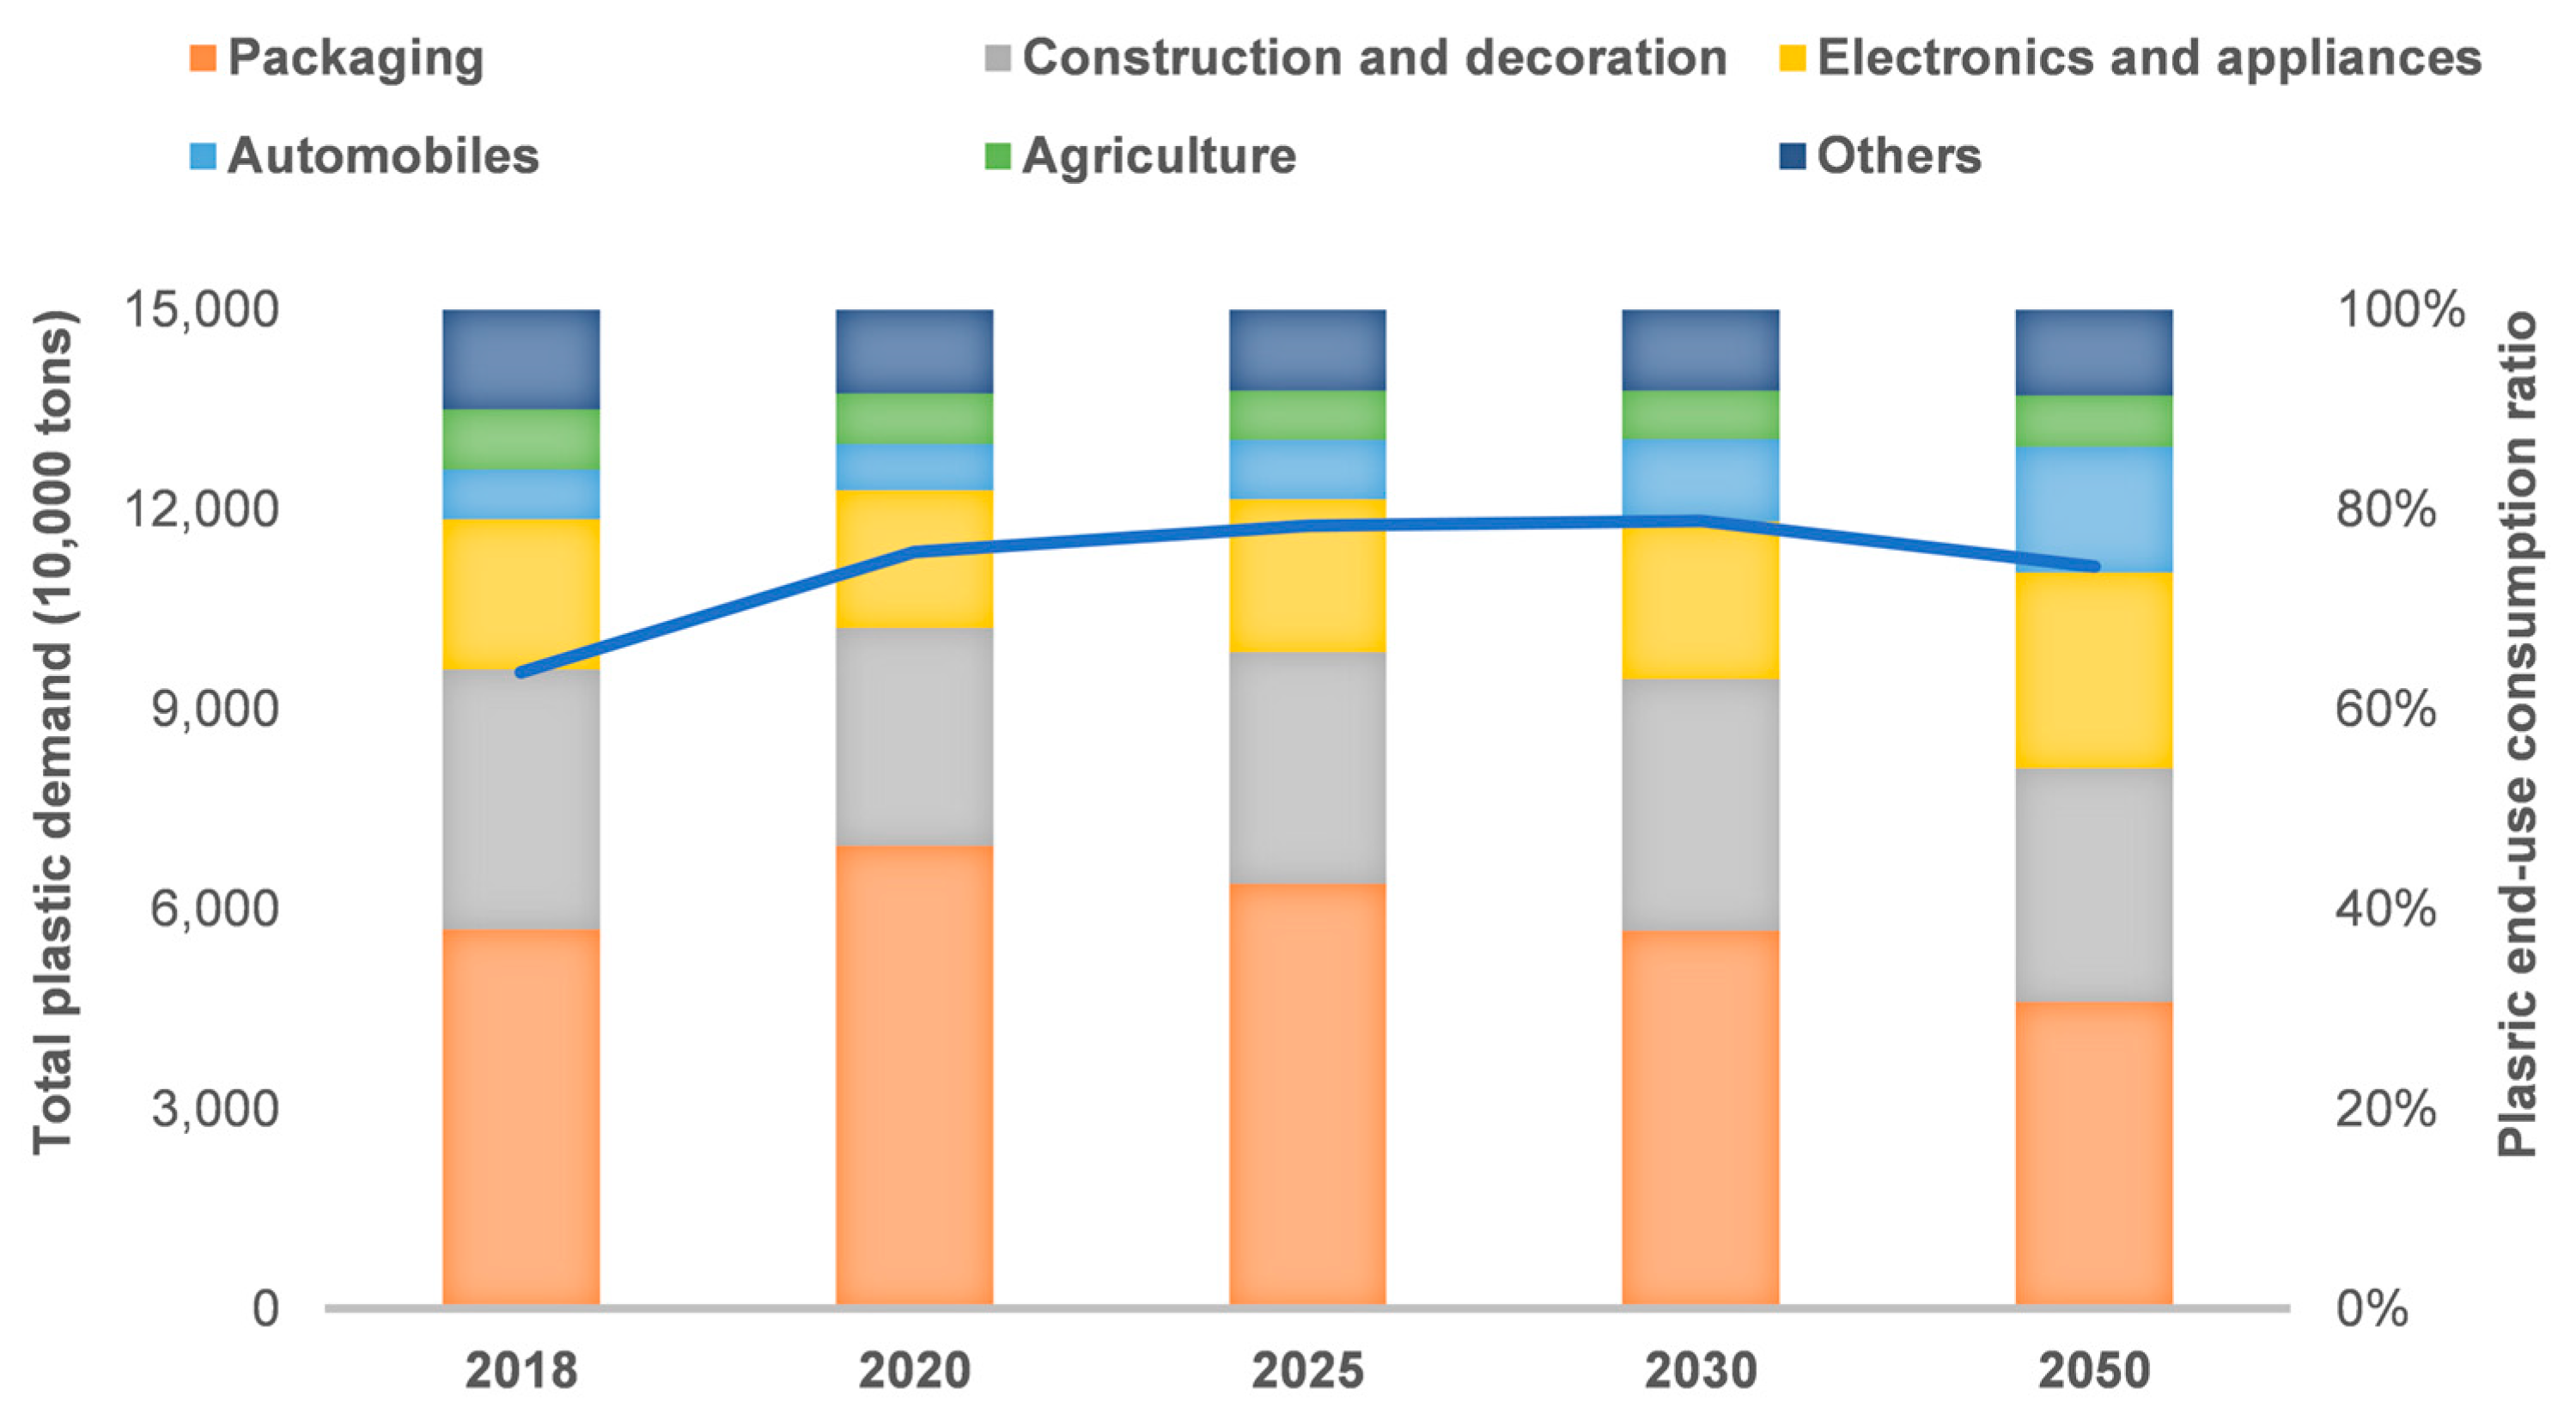
4.3. Analysis of Terminal Consumption Trend in China

At present, China has entered a stage of high-quality development, and the structure of plastic terminal consumption will continue to be optimized and upgraded. In the future, there will be structural changes in key plastic consumption areas, such as packaging, construction and decoration, automobiles, and electronics and appliances. The implementation of the plastic ban policy will lead to a significant drop in the consumption of disposable packaging plastics, while the low-energy consumption for buildings, lightweight materials for automobiles, and advanced products for electronics and appliances will stimulate the demand for related plastics.
The demand for plastics in the packaging field will drop sharply, and advanced materials will become a new demand growth point. With the banning of traditional disposable plastic products [32], the proportion of recyclable plastic packaging will increase, and the demand for packaging plastics by 2025–2050 is expected to decrease by one third compared with the current level. At the same time, advanced materials, such as metallocene polyethylene, high-barrier materials and biodegradable plastics, will be the main demand points in the packaging field in the future. Compared with traditional polyethylene, metallocene polyethylene has the advantages of good toughness, not easy to rupture, good thermal stability and low-temperature thermal sealing. It is mainly used in the production of bottled water, agricultural mulch and other flexible packaging film. In the field of food packaging, high-barrier plastics have developed rapidly in recent years, mainly including nylon, polyvinylidene fluoride and ethylene–vinyl alcohol copolymer (EVOH), which are gradually replacing metal, glass and other materials [33]. Biodegradable plastics are becoming the “popular alternative” to traditional plastics, especially in the application of disposable plastic products, such as straws and delivery food boxes. In the future, the packaging field will change from the expansion of quantity to the improvement of quality. While the total plastic demand declines, the demand for advanced plastics, such as metalcene, polyethylene and high barrier materials, will increase significantly.
With the development of green and energy-saving buildings, the demand for new functional materials in the construction and decoration field will also increase. Wall thermal insulation materials, high-performance coatings and various types of pipes will become the key elements driving the growth of plastic demand in the construction and decoration market. The energy-saving new materials mainly include high-quality and multi-functional new wall materials, such as solar tiles, vinyl siding and decoration, and plastic composite floors; sealing materials, such as plastic caulking, sealant and insulating vinyl floors; energy-saving doors, windows and glass, such as fiberglass and foam doors, polycarbonate skylight and vinyl windows; and building pipes, such as cross-linked vinyl pipes, acrylonitrile butadiene styrene (ABS) pipes and chlorinated polyvinyl chloride (CPVC) pipes. At present, the use of plastic per unit area in China is 6 kg/m2, which is equivalent to the amount of plastic per unit area in Japan. In the future, with the wide use of energy-saving insulation materials, the use of plastic per unit area will increase.
In the field of electronics and appliances, new high-performance materials with lightweight and low-carbon characteristics are becoming the main growth trend in the demand for plastics [34]. With the construction of 5G and the rapid development of intelligent home appliances and wearable devices, the main growth points of plastic demand in the electronics and appliances field are printed circuit board (PCB) substrate polytetrafluoroethylene (PTFE) and polyimide. PTFE has been used in advanced PCB boards, which is one of the core components of 5G, and it is expected that 5G will bring more than 200,000 tons of demand for PTFE materials [33]. The main material of flexible circuit boards is polyimide or polyethylene terephthalate (PET) film. More than 60% of the world’s flexible circuit boards are produced in China, and there is a huge replacement space for this part of the market. The main demand points of plastics in the field of electronic and appliance are safety materials, lightweight materials and energy-saving and low-carbon new materials. In 2018, the consumption demand for advanced plastics in China was about 2.5 million tons, mainly concentrated in the fields of engineering plastics and high-performance fiber-reinforced materials. With the development of the new energy vehicles and electronics industries, the demand for advanced plastics in these areas is expected to increase significantly by 2050.
Plastic is one of the core materials of the lightweight development of automobiles. With the popularization and application of “plastic instead of steel” in the field of transportation, modified polypropylene, modified polyvinyl chloride, modified polyethylene, fiber composite material, metal matrix composite material, thermoplastic resin composite material and so on are gradually widely used as automobile manufacturing materials. At present, the highest use of automobile plastic composite materials is in German cars, which is 300~365 kg/car, accounting for 22.5% of the total car weight; the average level of European and American cars is 210~260 kg/car, accounting for 16% of the total car weight; the average level of Japanese cars is 126~150 kg/car, accounting for 10% of vehicle weight; and the average level in Chinese cars is 90~110 kg, accounting for 8% of the whole weight [35]. With the rapid development of electric vehicles, the increasing requirements for battery range and a lightweight body will promote the use of modified plastics and carbon fiber-reinforced composites in automobile manufacturing, and it is expected that the use of plastics in a single car in China will reach 300~500 kg by 2050.
In 2020, affected by the outbreak of COVID-19, the consumption of disposable protective equipment and nucleic acid detection packaging supplies increased [36,37], which led to an increase in packaging plastics. Meanwhile, plastic consumption in the field of construction and decoration and agriculture has maintained the level of 2018, and plastic consumption in the fields of electronics and appliances and automobiles increased by 9% and 10%, respectively, compared with 2018; thus, China’s plastic consumption was estimated to be 113.6 million tons in 2020. Due to the uncertain impact of the epidemic, it was assumed that by 2025, 2030 and 2050, plastic consumption in the packaging field will be reduced by 5%, 15% and 35% from 2020, and the reduction will mainly be for single-use plastic products. It was assumed that plastic consumption in the field of electronics and appliances will increase by 15%, 20% and 40% relative to 2020, and the increase will mainly be advanced plastic materials. It was assumed that the consumption of plastics in the construction and decoration field will increase by 10%, 20% and 5% relative to 2020, where the rapid increase before 2030 will mainly be caused by infrastructure construction and the energy-saving renovation of green buildings, and the significant decrease from 2030 to 2050 will be due to the fact that the peak of the domestic population will have already passed, and the demand for housing and construction will continue to decrease. If the single-car plastic consumption in the automobile field reaches the level of German cars in 2050, assuming that China’s single-car plastic consumption by 2025, 2030 and 2050 will be 200, 250 and 300 kg, and by then the production of cars will be 35, 39 and 40 million units, then the plastic consumption will reach 7, 9.75 and 14 million tons. Referring to the historical trend of plastic terminal consumption in developed countries such as Japan and those in the European Union, we assumed that plastic consumption in agriculture and other fields will remain the same in 2020. Based on the above forecast of the terminal consumption trend, China’s plastic consumption demand will stabilize at about 110 million to 120 million tons from 2025 to 2050, of which the plastic consumption demand will be 119 million tons in 2030 and drop to 110 million tons in 2050. From 2020 to 2050, packaging, construction and decoration, electronics and appliances, and automobiles will still be the four major plastic consumption terminals, with consumption shares of 38%, 25%, 16% and 8%, respectively, in 2030, and the consumption proportions will be adjusted to 31%, 23%, 20% and 13% in 2050 (Figure 8). China’s demand for plastics in the future will experience a process of slow growth and then decline; plastic consumption will change from quantitative expansion to quality improvement; and advanced plastics in the fields of electronics and appliances and automobiles will be the main demand growth points in the future.

5. Countermeasures for the Sustainable Development of Plastics

With the deepening of the policy of the whole-chain management of plastic pollution, the demand for disposable plastic products is expected to decrease significantly; however, the demand for advanced plastics in the fields of packaging, construction and decoration, electronics and appliances, and automobiles remains strong. To promote the control of plastic pollution and the development of advanced plastics in an integrated manner, we should improve the whole-chain management system of plastics, upgrade the recycling level of waste plastics [38] and establish a sustainable model for the development of a plastic circular economy.
(1) Improve the transparency of the plastic value chain and establish a comprehensive management system. Promote the implementation of the recyclable design of plastic products, improve the transparency of production materials and chemical additives, and strengthen the monitoring of the flow of plastic products so as to build a comprehensive management system. At the same time, it is necessary to further identify the key links in the whole-chain management of plastics. In addition to continuing to strengthen the reduction and substitution of single-use plastic products, it is urgent to emphasize the construction of efficient collection and disposal facilities for plastic waste so as to prevent the environmental leakage of plastic waste.
(2) Connect with the global ecological design standards and improve the recycling level of waste plastics. The negotiations on the global plastic pollution control treaty will formulate global ecological design standards for plastic, and China needs to actively participate in the formulation and docking of global standards to enhance the sustainable development of plastic production and consumption. At the same time, it is necessary to further broaden the plastic waste recycling channels; adopt new recycling modes, such as “Internet + recycling”; and improve the recycling efficiency of waste plastics. For high-value waste plastics from the electronics and appliance and automobile fields, physical recycling technology should be preferred; for low-value waste plastics, which are difficult to physically recycle, chemical recycling technology should be adopted.
(3) Balance environmental and economic benefits and establish a sustainable plastic circular economy development model. Plastic pollution control is essential to prevent the leakage of plastics into the environment. There is a need to combine dredging and blocking to achieve the balance between economic benefits and environmental benefits so as to form a sustainable development model. Specifically, on the production side, promote the implementation of the extended producer responsibility system, and establish the value compensation mechanism by means of taxation and subsidies to mobilize the initiative of plastic production enterprises to participate in pollution control. On the consumption side, explore the innovative business model and use incentives, such as the deposit return mechanism, to guide consumers to send the discarded plastic bottles and other plastic bottles to the collection point so as to enhance the efficiency of the collection of plastic wastes. On the waste treatment side, develop and apply intelligent and efficient sorting technology and high-value recycling technology to improve the recycling level of waste plastics and further promote the development of the plastic recycling economy.

6. Conclusions

This study evaluated China’s future plastic demand up to 2030 and 2050 through an international comparative analysis, with a focus on four major consumption terminals—the packaging, construction, electronics and automobile sectors—which collectively account for over 80% of total plastic consumption. Although China accounts for one-third of world’s plastic production, China’s per capita plastic consumption is much lower than Japan and the EU. The results indicate that China’s plastic demand will reach 118 and 110 million tons by 2030 and 2050, respectively. Structural shifts in consumption patterns are anticipated, driven by stringent plastic management policies and industry low-carbon transition efforts. To reconcile economic growth with environmental sustainability, this paper advocates for a holistic management framework, enhanced recycling infrastructure and a circular economy model for plastics. These measures are important for the high-quality development of the plastics industry and the realization of global plastic pollution control targets.

Author Contributions

Conceptualization, S.C. and H.X.; methodology, S.C.; validation, S.C. and H.X.; formal analysis, S.C.; investigation, S.C.; resources, H.X.; data curation, S.C.; writing—original draft preparation, S.C.; writing—review and editing, H.X.; supervision, H.X.; project administration, S.C.; funding acquisition, H.X. All authors have read and agreed to the published version of the manuscript.

Funding

This research was funded by National Natural Science Foundation of China (NSFC), grant number 72243005.

Institutional Review Board Statement

Not applicable.

Informed Consent Statement

Not applicable.

Data Availability Statement

The raw data supporting the conclusions of this article will be made available by the authors on request.

Conflicts of Interest

The authors declare no conflicts of interest. The funders had no role in the design of this study; in the collection, analyses, or interpretation of the data; in the writing of this manuscript; or in the decision to publish the results.

References

  1. Rhodes, C.J. Solving the plastic problem: From cradle to grave, to reincarnation. Sci. Prog. 2019, 102, 218–248. [Google Scholar] [CrossRef] [PubMed]
  2. Plastic & Climate: The Hidden Costs of a Plastic Planet. Available online: https://www.ciel.org/project-update/plastic-climate-the-hidden-costs-of-a-plastic-planet (accessed on 8 December 2024).
  3. Zhang, Y.; Kang, S.; Allen, S.; Allen, D.; Gao, T.; Sillanpää, M. Atmospheric microplastics: A review on current status and perspectives. Earth-Sci. Rev. 2020, 203, 103118. [Google Scholar] [CrossRef]
  4. Ali, I.; Cheng, Q.; Ding, T.; Yiguang, Q.; Yuechao, Z.; Sun, H.; Peng, C.; Naz, I.; Li, J.; Liu, J. Micro- and nanoplastics in the environment: Occurrence, detection, characterization and toxicity—A critical review. J. Clean. Prod. 2021, 313, 127863. [Google Scholar] [CrossRef]
  5. Li, Y.; Chen, L.; Zhou, N.; Chen, Y.; Ling, Z.; Xiang, P. Microplastics in the human body: A comprehensive review of exposure, distribution, migration mechanisms, and toxicity. Sci. Total Environ. 2024, 946, 174215. [Google Scholar] [CrossRef]
  6. Summary of the Fifth Resumed Sessions of the Open Ended Committee of Permanent Representatives and the United Nations Environment Assembly and the Commemoration of UNEP@50: 21 February–4 March. Available online: https://enb.iisd.org/sites/default/files/2022-03/enb16166e.pdf (accessed on 8 December 2024).
  7. Notifications of Intergovernmental Negotiating Committee on Plastic Pollution. Available online: https://www.unep.org/inc-plastic-pollution/notifications (accessed on 8 December 2024).
  8. Invitation of Members of the Committee to the Second Part of the Fifth Session of the Intergovernmental Negotiating Committee on Plastic Pollution, Including in the Marine Environment (INC-5.2). Available online: https://wedocs.unep.org/bitstream/handle/20.500.11822/47193/Invitation_Letter_INC_Members_INC5.2.pdf (accessed on 8 December 2024).
  9. Abate, T.G.; Elofsson, K. Environmental taxation of plastic bags and substitutes: Balancing marine pollution and climate change. J. Environ. Manag. 2024, 359, 120868. [Google Scholar] [CrossRef]
  10. Plastics Strategy. Available online: https://environment.ec.europa.eu/strategy/plastics-strategy_en (accessed on 8 December 2024).
  11. Resource Circulation Strategy for Plastics May 2019. Available online: https://www.env.go.jp/content/000050297.pdf (accessed on 8 December 2024).
  12. France’s Antiwaste and Circular Economy Law: Eliminating Waste and Promoting Social Inclusion. Available online: https://circulareconomy.europa.eu/platform/sites/default/files/case_studies_-_french_anti_waste_law_aug21.pdf.pdf (accessed on 8 December 2024).
  13. The U.S. Plastics Pact. Available online: https://usplasticspact.org/ (accessed on 8 December 2024).
  14. The National Development and Reform Commission and the Ministry of Ecology and Environment Jointly Issued the Document on Further Strengthening the Control of Plastic Pollution. Available online: https://www.mee.gov.cn/xxgk2018/xxgk/xxgk15/202001/t20200121_760620.html (accessed on 8 December 2024).
  15. The National Development and Reform Commission and the the Ministry of Ecology and Environment Jointly Issued the Notice on the “14th Five-Year Plan” Action Program on Plastic Pollution Control. Available online: https://www.mee.gov.cn/xxgk2018/xxgk/xxgk10/202109/t20210916_945621.html (accessed on 8 December 2024).
  16. Summary Report, 25 November–1 December 2024. Available online: https://enb.iisd.org/plastic-pollution-marine-environment-negotiating-committee-inc5-summary (accessed on 8 December 2024).
  17. Jiang, X.; Wang, T.; Jiang, M.; Xu, M.; Yu, Y.; Guo, B.; Chen, D.; Hu, S.; Jiang, J.; Zhang, Y.; et al. Assessment of Plastic Stocks and Flows in China: 1978–2017. Resour. Conserv. Recy. 2020, 161, 104969. [Google Scholar] [CrossRef]
  18. Tan, Y.; Wang, Y.; Hu, Y.; Wen, Z.; Kosajan, V.; Zheng, K. Assessing plastics usage and its drivers from final demand perspectives: A case study from China. J. Clean. Prod. 2022, 376, 134277. [Google Scholar] [CrossRef]
  19. Ren, Y.; Zhu, H.; Jiang, M.; Cao, Y.; Li, C.; Yu, Y.; Chen, D.; Xu, M.; Guo, B.; Zhu, B. Filling the Gaps: Tracing 12 Types of Non-commodity Plastics in China’s Plastic Socioeconomic Metabolism. Environ. Sci. Technol. 2025, 59, 5001–5011. [Google Scholar] [CrossRef]
  20. Bolbakov, R.G.; Sinitsyn, A.; Tsvetkov, V.Y. Methods of comparative analysis. J. Phys. Confer. Ser. 2020, 1679, 052047. [Google Scholar] [CrossRef]
  21. A Short Introduction to Comparative Research. Available online: https://www.researchgate.net/publication/336278925_A_Short_Introduction_to_Comparative_Research (accessed on 23 April 2025).
  22. Roig-Tierno, N.; Gonzalez-Cruz, T.F.; Llopis-Martinez, J. An overview of qualitative comparative analysis: A bibliometric analysis. J. Innov. Knowl. 2017, 2, 15–23. [Google Scholar] [CrossRef]
  23. Plastics—The Facts 2006-2020. Available online: https://plasticseurope.org/resources/publications/ (accessed on 17 December 2024).
  24. Arijeniwa, V.F.; Akinsemolu, A.A.; Chukwugozie, D.C.; Onawo, U.G.; Ochulor, C.E.; Nwauzoma, U.M.; Kawino, D.A.; Onyeaka, H. Closing the loop: A framework for tackling single-use plastic waste in the food and beverage industry through circular economy—A review. J. Environ. Manag. 2024, 359, 120816. [Google Scholar] [CrossRef]
  25. Notice of the State Council on the Issuance of the National Population Development Plan (2016–2030). Available online: http://www.gov.cn/zhengce/content/2017-01/25/content_5163309.htm (accessed on 25 December 2024).
  26. Launch of the Green Paper on Population and Labor: Statement on Population and Labor in China No.19. Available online: http://iple.cass.cn/xshd_46047/201901/t20190107_4807400.shtml (accessed on 25 December 2024).
  27. Pottinger, A.S.; Geyer, R.; Biyani, N.; Martinez, C.C.; Nathan, N.; Morse, M.R.; Liu, C.; Hu, S.; de Bruyn, M.; Boettiger, C.; et al. Pathways to reduce global plastic waste mismanagement and greenhouse gas emissions by 2050. Science 2024, 386, 1168–1173. [Google Scholar] [CrossRef]
  28. Houssini, K.; Li, J.; Tan, Q. Complexities of the global plastics supply chain revealed in a trade-linked material flow analysis. Commun. Earth Environ. 2025, 6, 257. [Google Scholar] [CrossRef]
  29. Plastic Products, Plastic Waste and Resource Recovery [1996–2019]. Available online: https://www.pwmi.or.jp/english/ (accessed on 19 December 2024).
  30. Luan, X.; Liu, W.; Cui, Z.; Liu, Y.; Chen, Y.; Lu, S.; Wang, Y. Study on the metabolism of plastic resources in China based on material flow analysis. Resour. Sci. 2020, 42, 372–382. [Google Scholar]
  31. Dai, T.j.; Xiao, Q.F. Analysis of material metabolism of plastic packaging waste. Ecol. Econ. 2017, 33, 97–101. [Google Scholar]
  32. Deng, Y.X.; Wang, Y.P.; Zhang, C.L. Research on alternative management strategies for disposable plastic products. Environ. Sci. Res. 2020, 33, 1973–1978. [Google Scholar]
  33. Xu, Y.; Wang, D.M.; Ye, Q. Advanced plastics market has great room for growth in China. China Petrochem. 2021, 2, 44–47. [Google Scholar]
  34. Issifu, I.; Dahmouni, I.; Sumaila, U.R. Assessing the ecological and economic transformation pathways of plastic production system. J. Environ. Manag. 2025, 374, 124104. [Google Scholar] [CrossRef]
  35. Jiang, X.; Jiang, J.; Chen, D.; Zhou, W.; Zhu, B. Dynamic material flow analysis of passenger car plastics in China. Environ. Sci. China 2020, 40, 4106–4114. [Google Scholar]
  36. Jiang, H.; Chen, D.J.; Zhu, B. Systematic Quantification of Consumption and Disposal of Single-Use Plastic Products in China. Res. Environ. Sci. 2025, 38, 386–394. [Google Scholar]
  37. Issifu, I.; Deffor, E.W.; Sumaila, U.R. How COVID-19 could change the economics of the plastic recycling sector. Recycling 2021, 6, 64. [Google Scholar] [CrossRef]
  38. Jehanno, C.; Alty, J.W.; Roosen, M.; De Meester, S.; Dove, A.P.; Chen, E.Y.; Leibfarth, F.A.; Sardon, H. Critical advances and future opportunities in upcycling commodity polymers. Nature 2022, 603, 803–814. [Google Scholar] [CrossRef] [PubMed]
Figure 1. Global plastics production pattern.
Sustainability 17 04218 g001
Figure 2. China’s plastic consumption and imports and exports situation.
Sustainability 17 04218 g002
Figure 3. Global per capita consumption of plastics.
Sustainability 17 04218 g003
Figure 4. Forecast of future plastic consumption demand in China.
Sustainability 17 04218 g004
Figure 5. The plastic consumption terminals and historical trends in the EU. (a) Main plastics consumption terminals; (b) historical trends.
Sustainability 17 04218 g005
Figure 6. The plastic consumption terminals and historical trends in Japan. (a) Main plastics consumption terminals; (b) historical trends.
Sustainability 17 04218 g006
Figure 7. Plastic terminal consumption pattern in China.
Sustainability 17 04218 g007
Figure 8. Change trend of future plastic consumption terminals in China.
Sustainability 17 04218 g008
Disclaimer/Publisher’s Note: The statements, opinions and data contained in all publications are solely those of the individual author(s) and contributor(s) and not of MDPI and/or the editor(s). MDPI and/or the editor(s) disclaim responsibility for any injury to people or property resulting from any ideas, methods, instructions or products referred to in the content.

