


Experimental Analysis of Energy Savings in a Combined Rotary Desiccant Dehumidifier with a Purge Section


Abstract
1. Introduction
1.1. Background and Objectives
1.2. Literature Review
- (1)
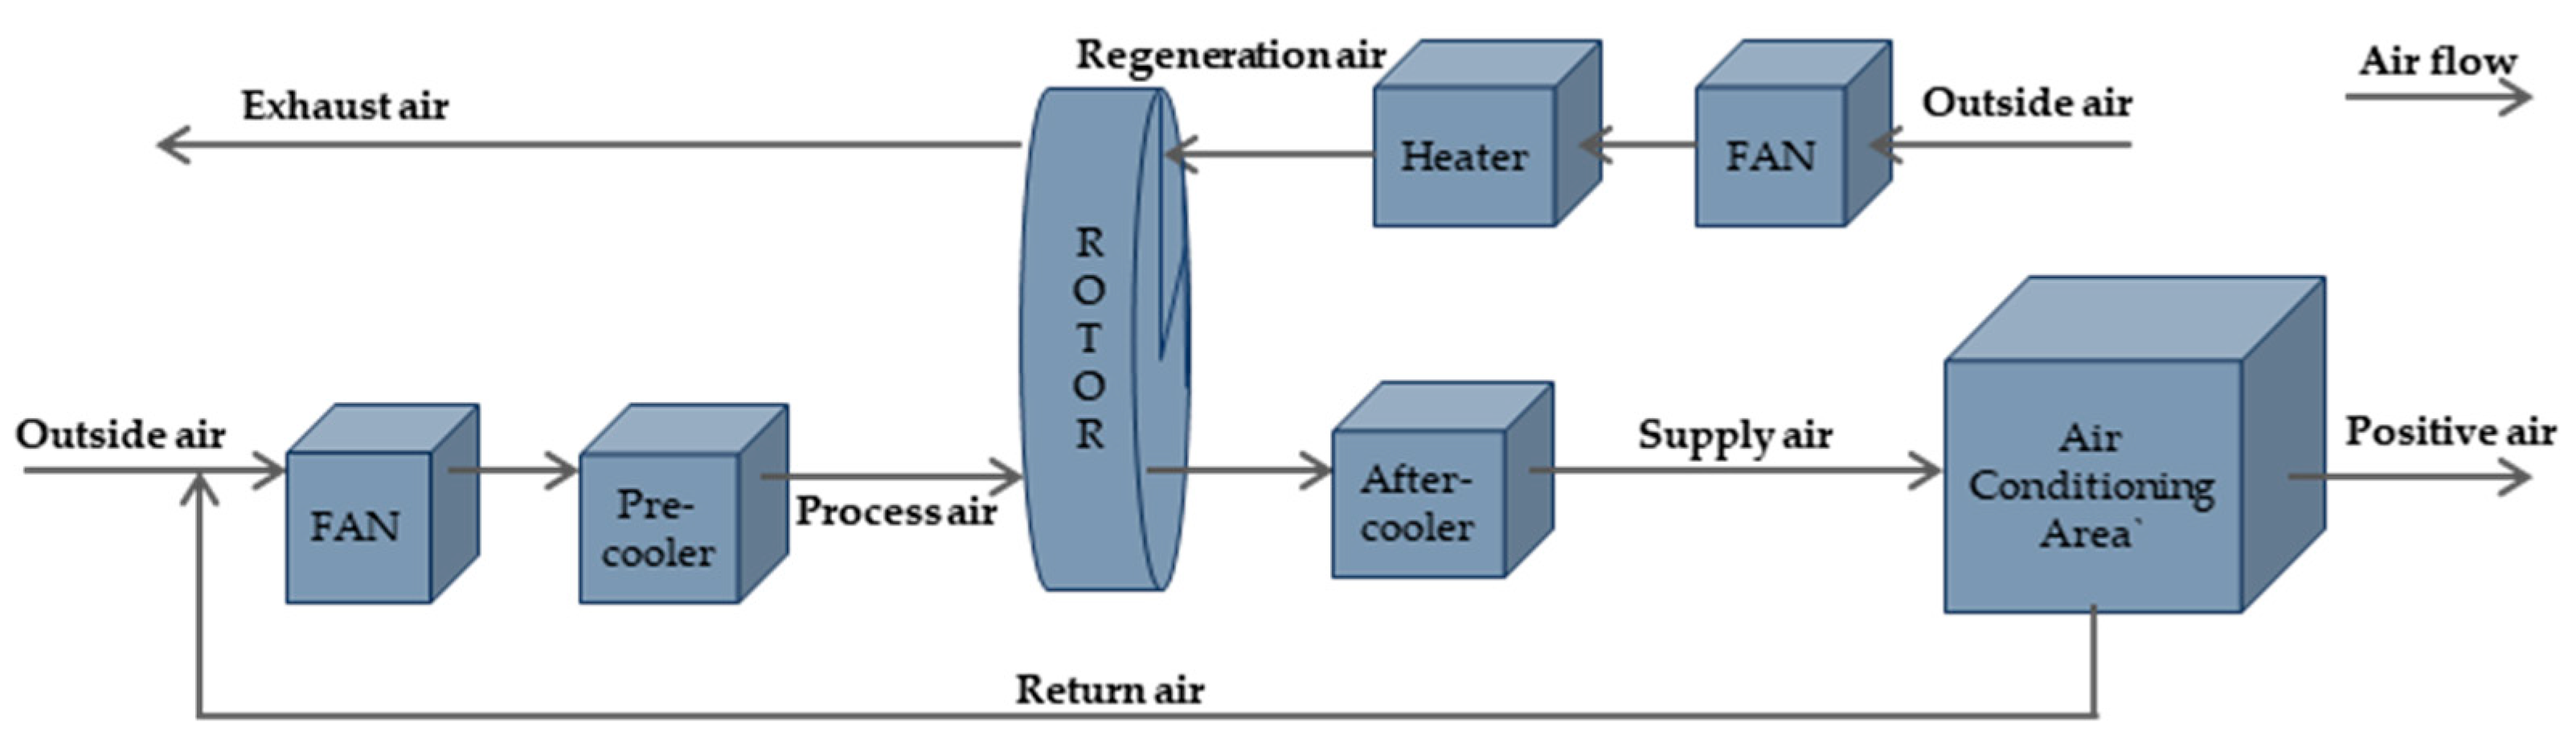
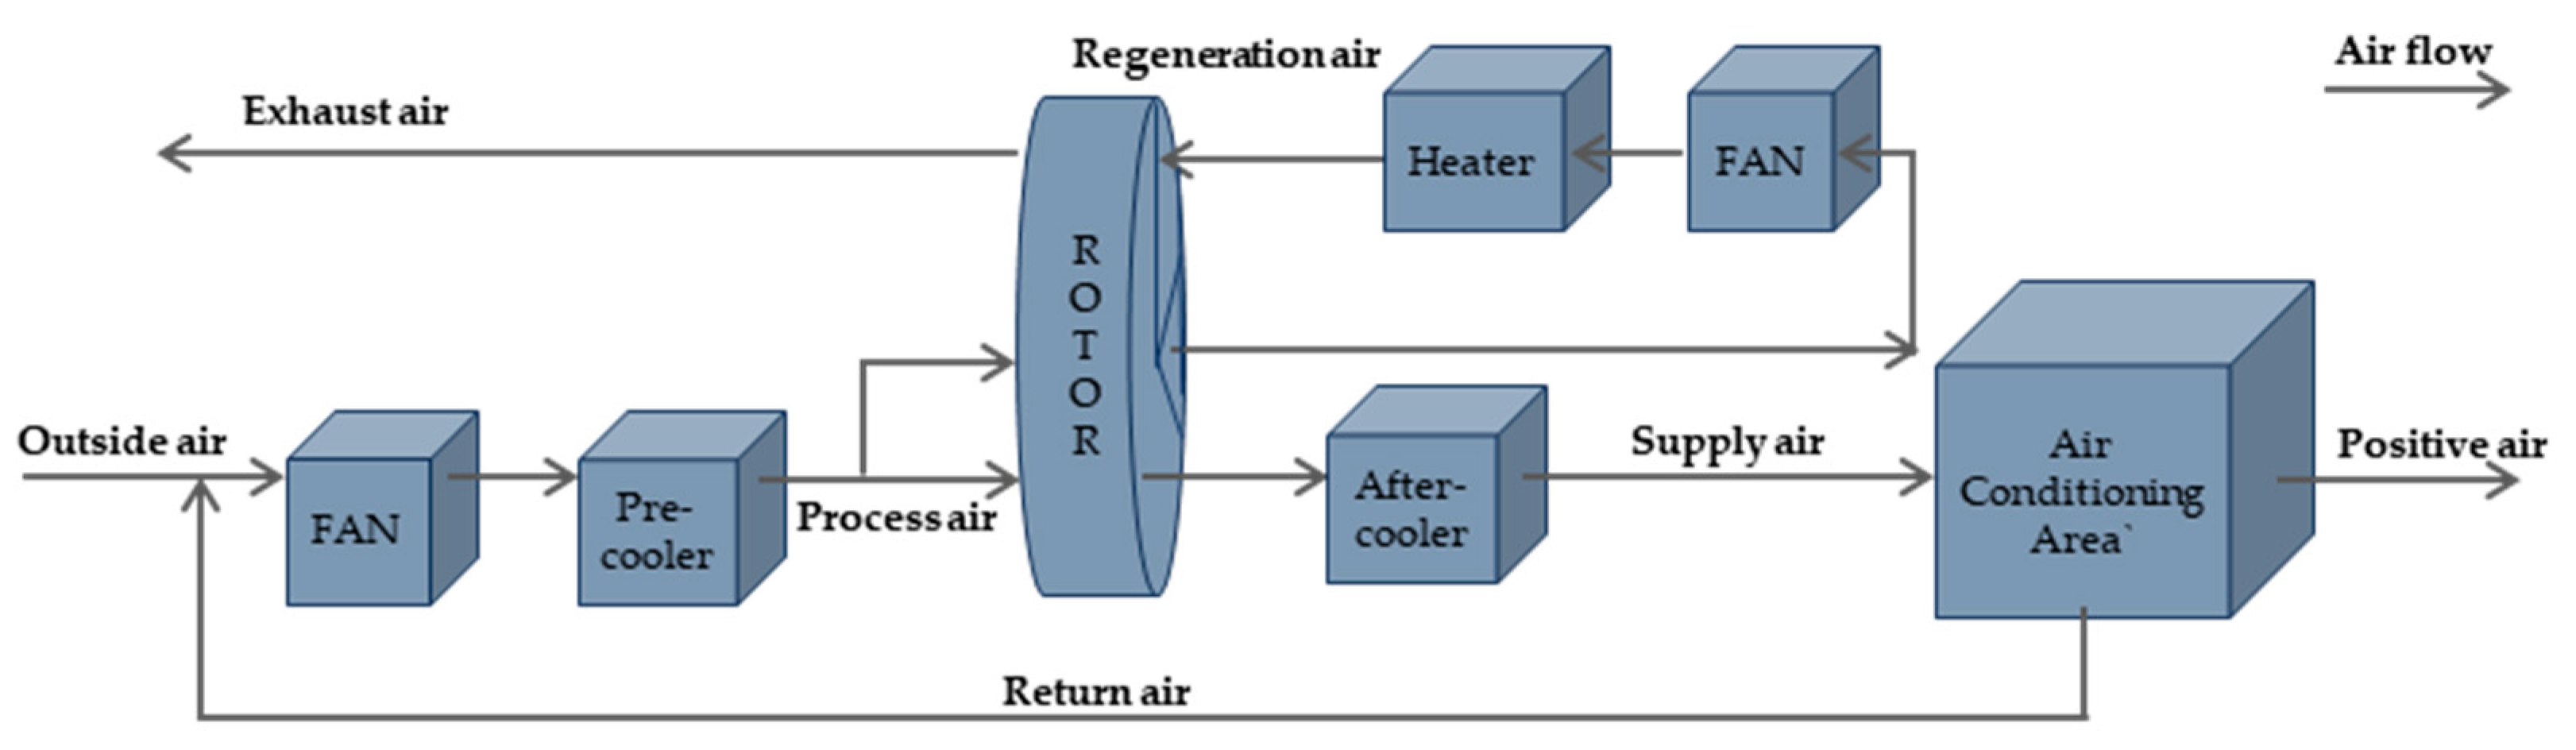
- System Configuration
- (2)
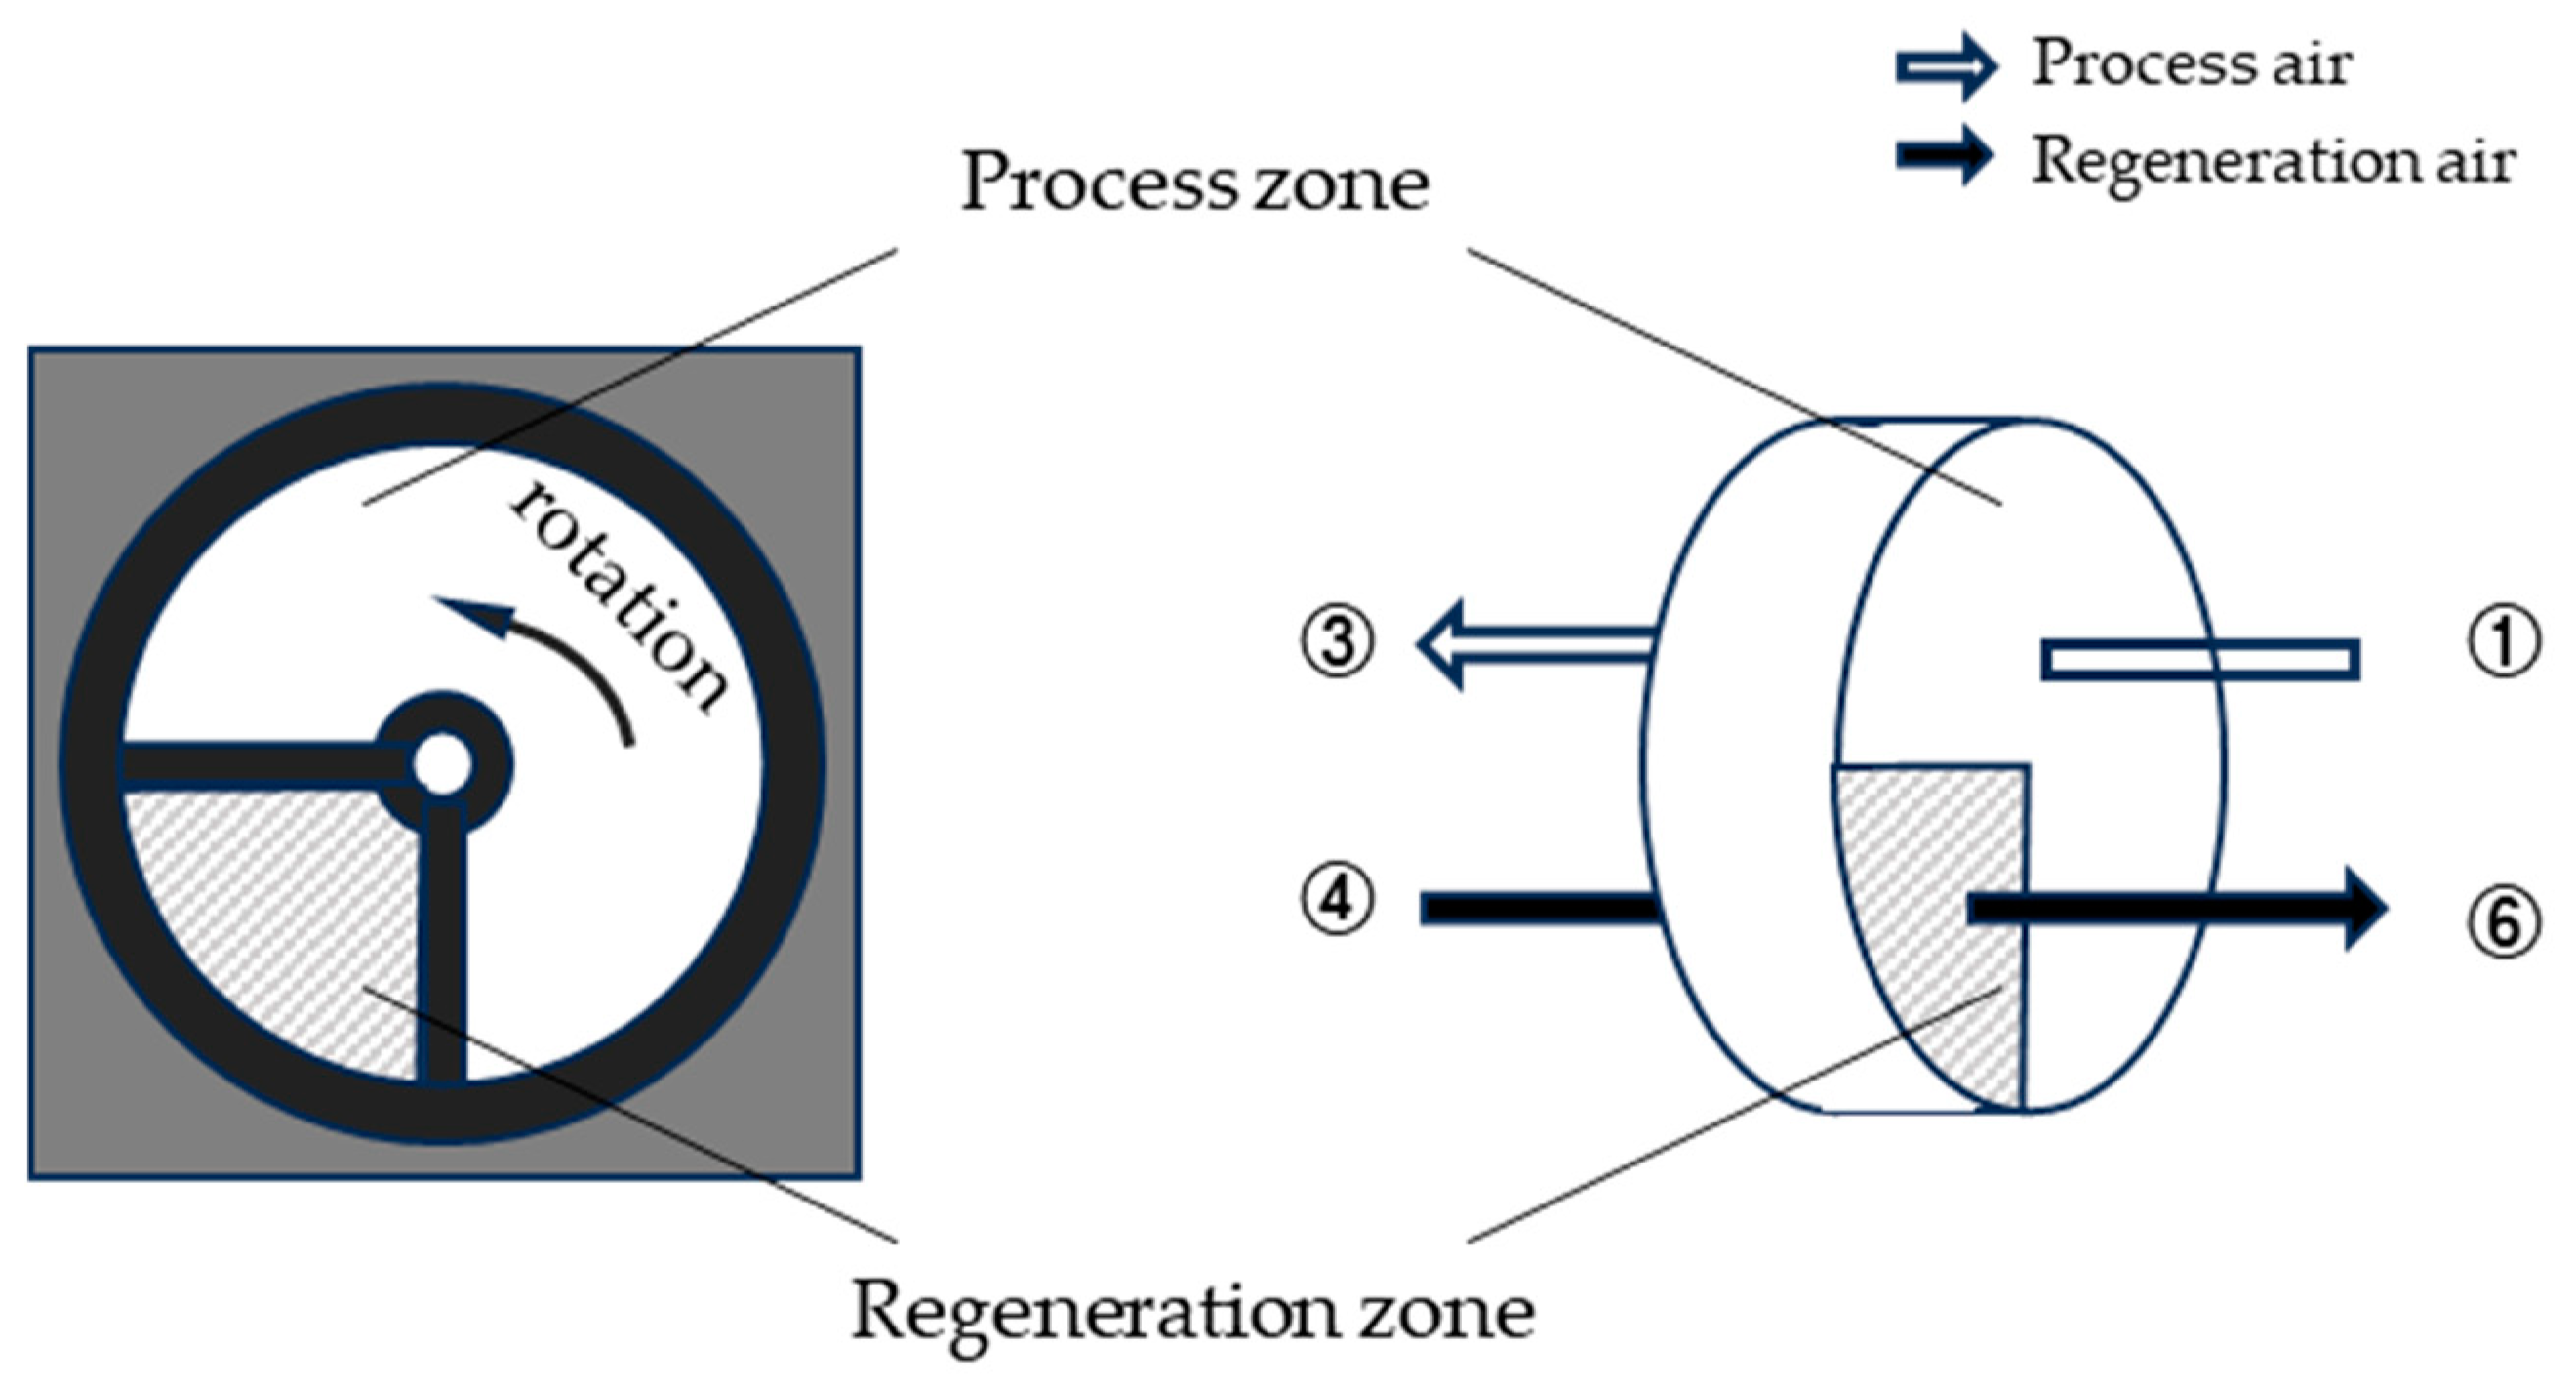
- Types of Rotors
- (3)
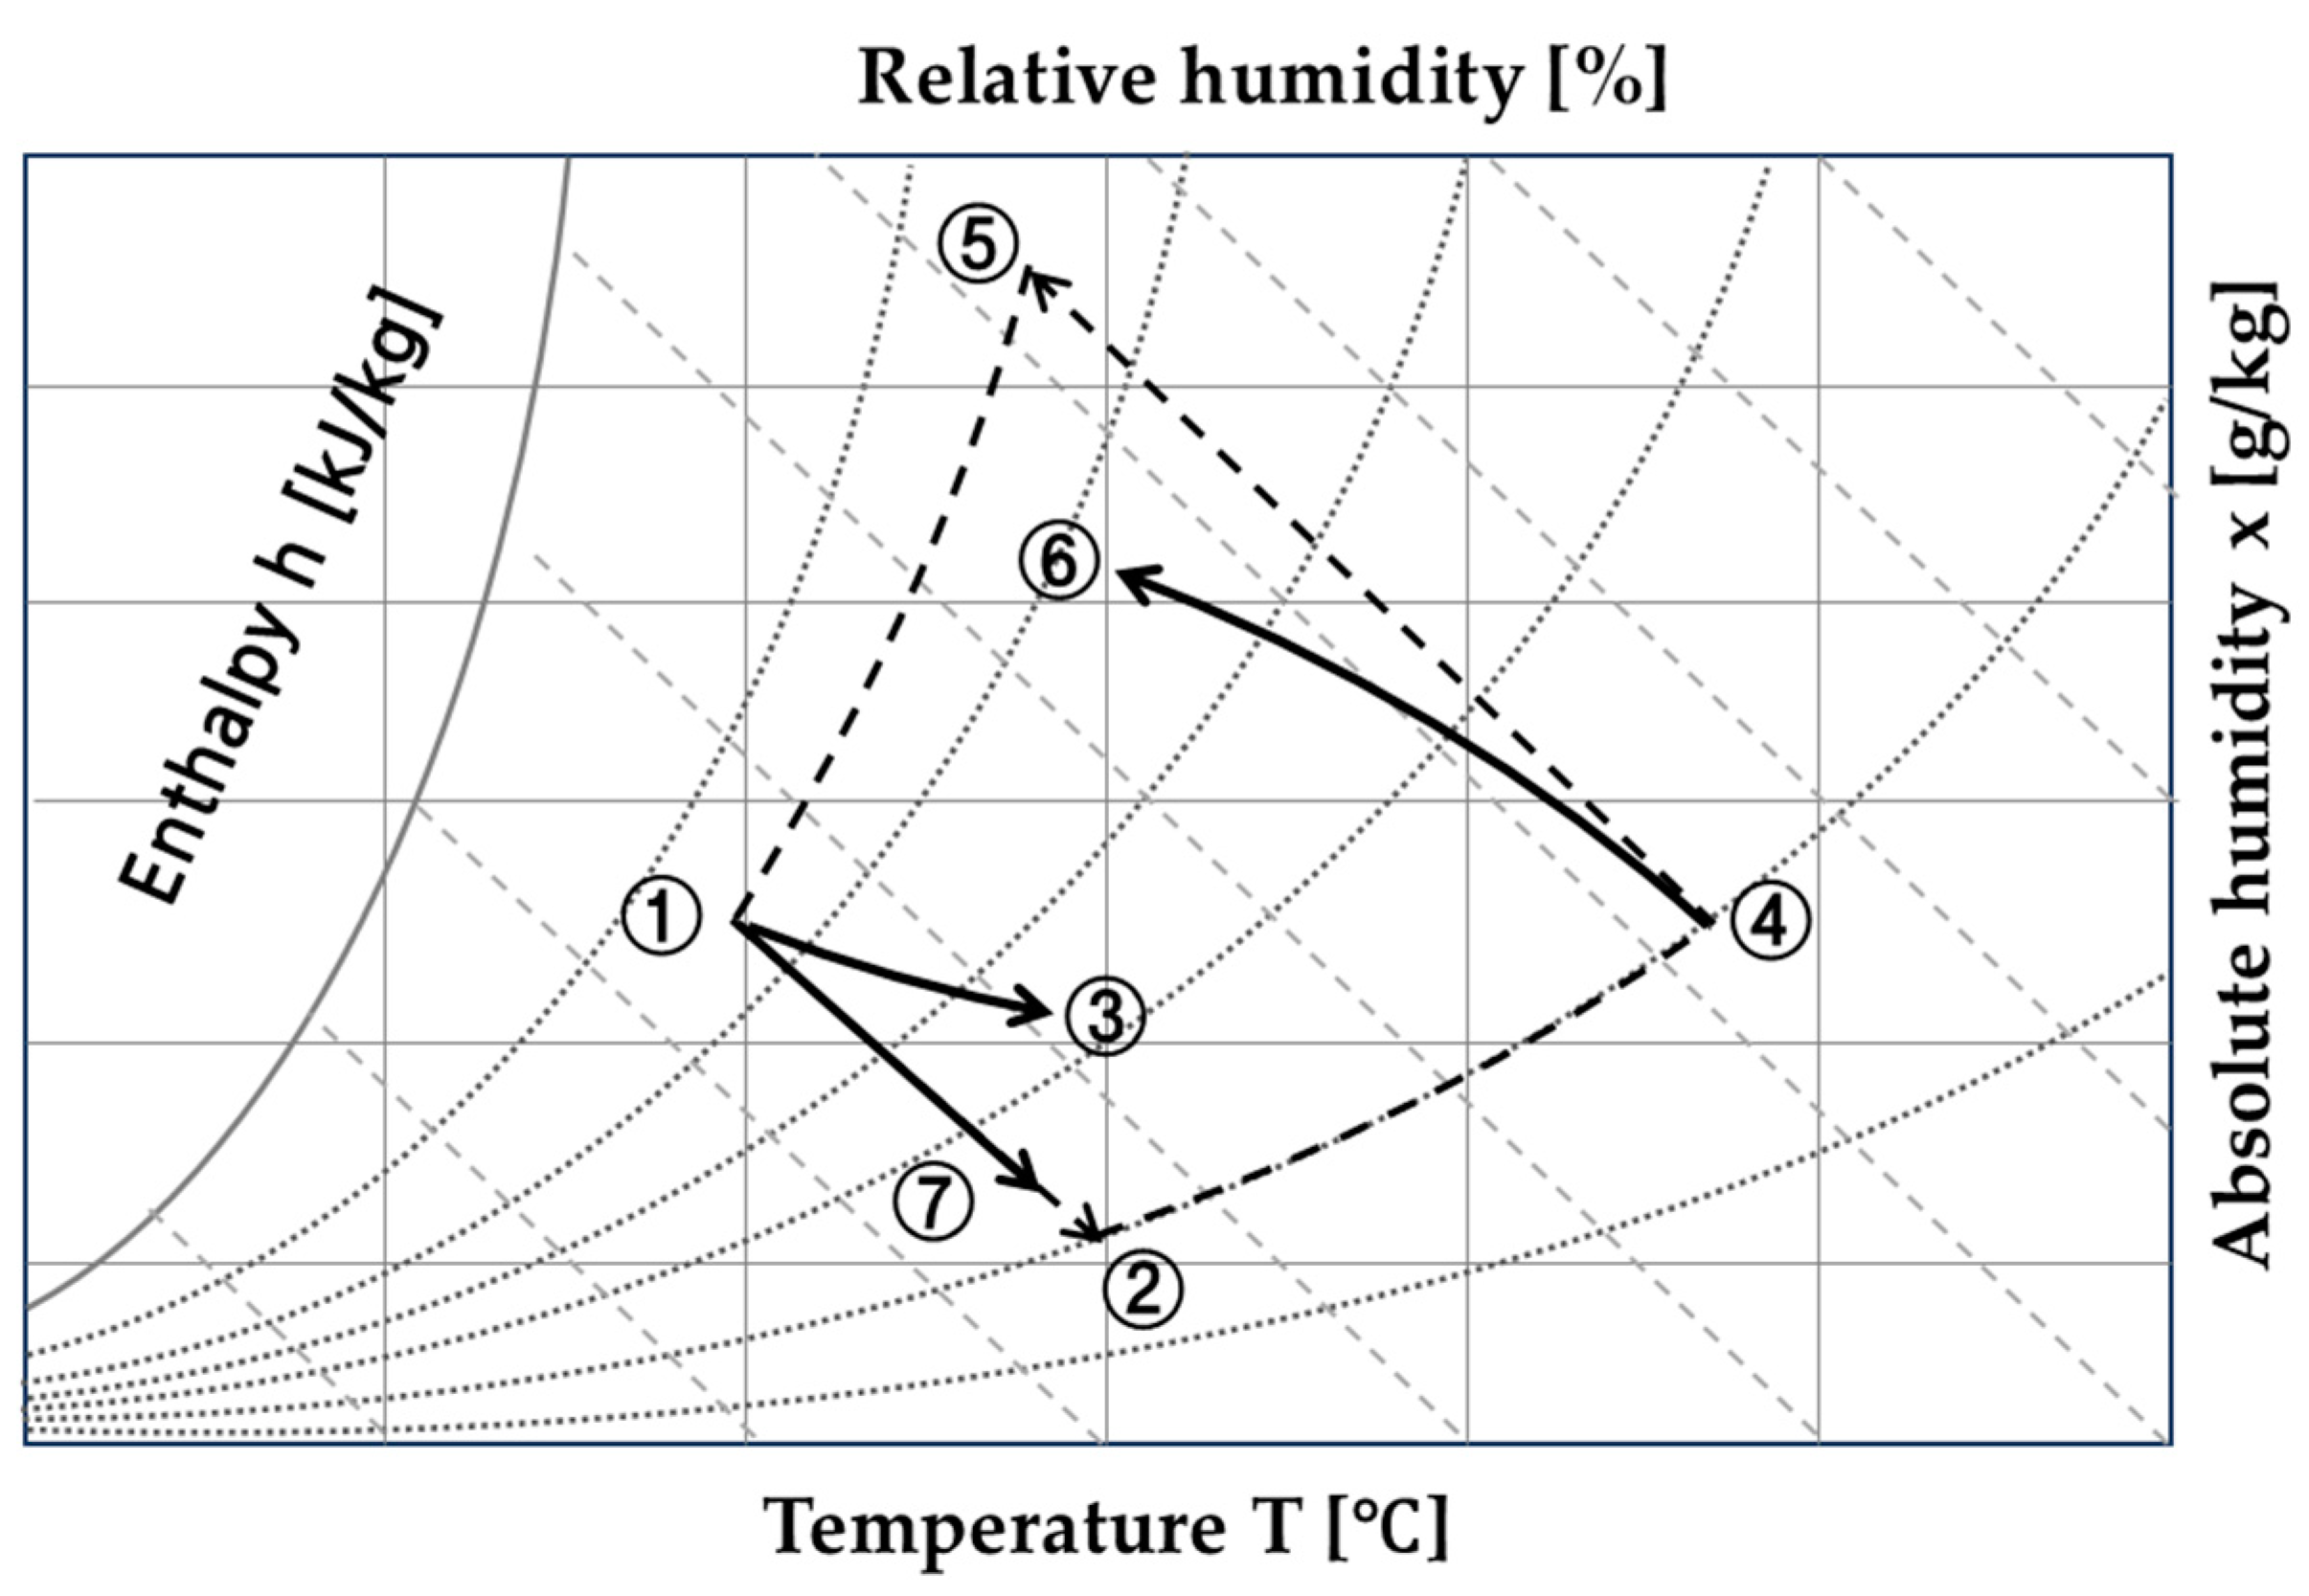
- Definition of Performance Indicators
- (4)
- Key parameters influencing dehumidification performance
- (1)
- An increase in indoor temperature leads to an increase in the dehumidification capacity.
- (2)
- An increase in indoor humidity results in a higher dehumidification capacity.
- (3)
- As the regeneration temperature rises, the dehumidification capacity also increases.
- (4)
- An increase in the rotor’s rotational speed initially enhances the dehumidification capacity; however, beyond a certain threshold, it causes a significant decline.
- (5)
- An increase in the frontal air velocity across the rotor leads to an increase in dehumidification capacity.
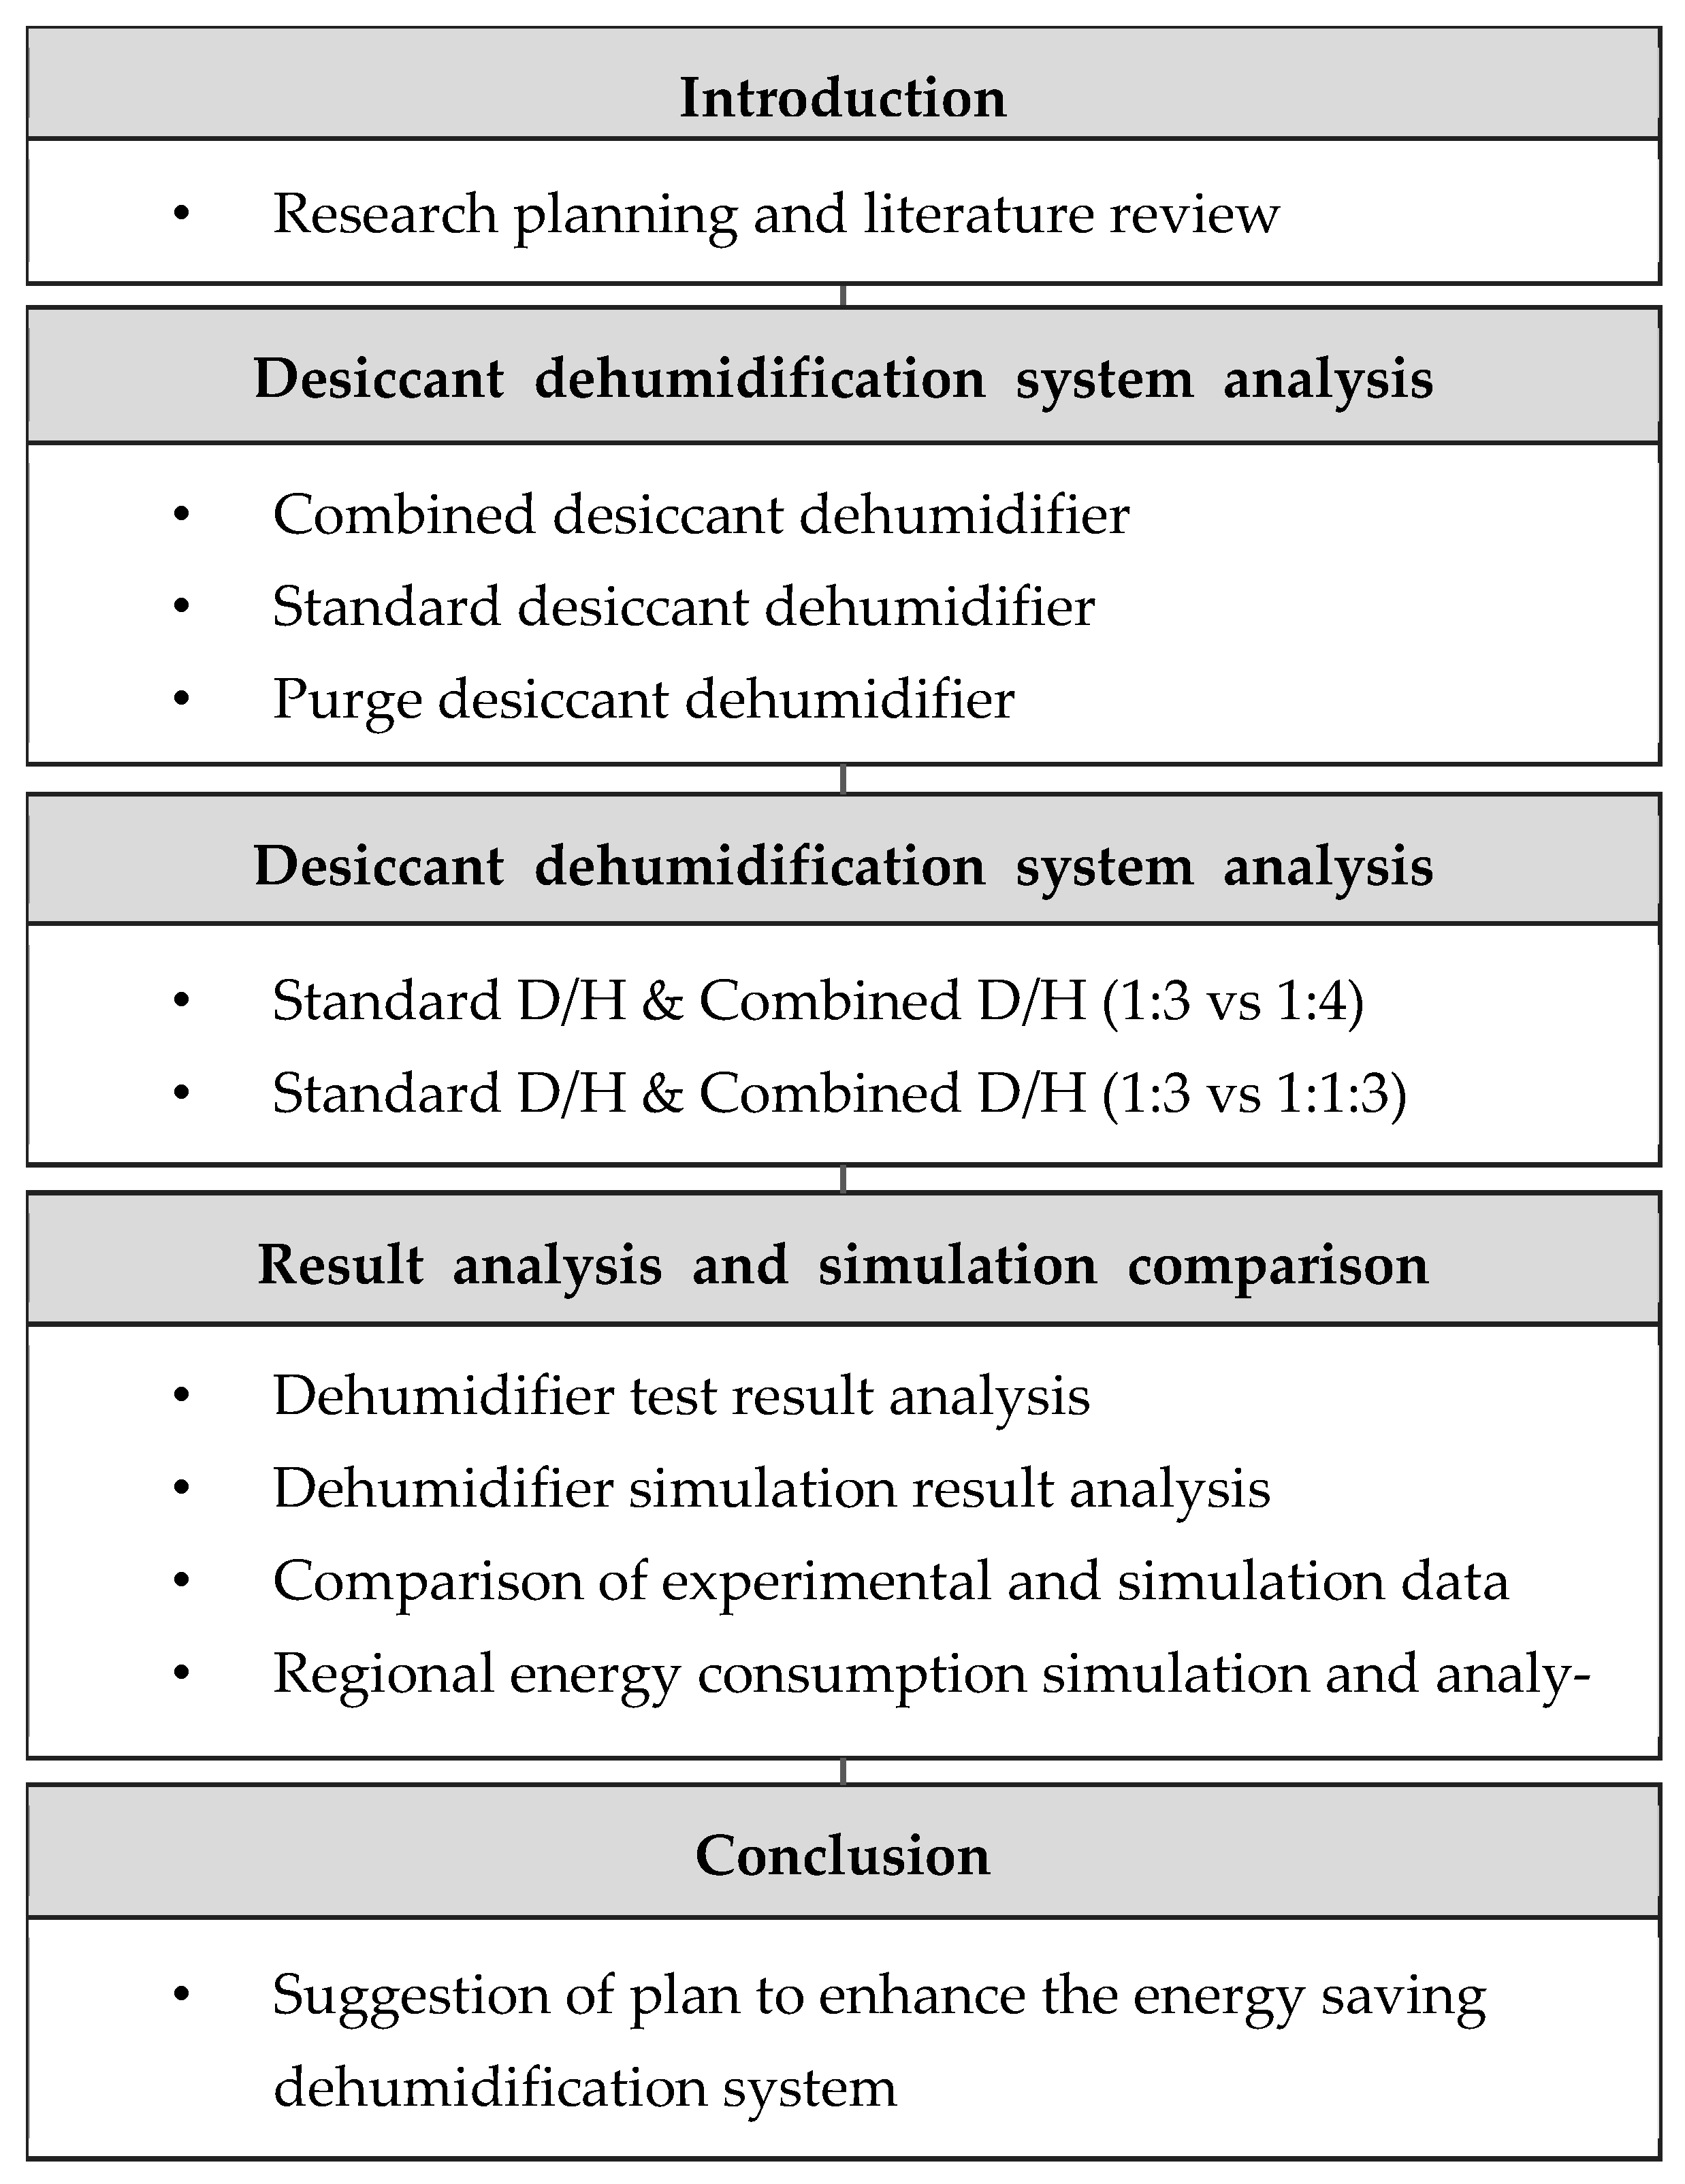
2. Materials and Methodology
- (1)
- Literature Review: A review of previous studies was conducted on the factors influencing the performance of desiccant dehumidifiers, and the differences between these studies and the present research were analyzed.
- (2)
- Selection and Manufacturing of Test Equipment: In order to obtain experimental data, each piece of equipment was designed and manufactured to create the experimental environment. The experiments were prepared to operate simultaneously under the same conditions.
- (3)
- Performance and Energy Evaluation: Based on the experimental results, the required dehumidification performance, dehumidification efficiency, and energy consumption were analyzed.
- (4)
- Comparison of Performance by Operating Mode: Energy consumption for each mode was predicted using the rotor dehumidification performance simulation program.
- (5)
- Effectiveness analysis: The predicted values obtained using the rotor performance program were compared with the actual experimental results to determine whether the new dehumidification operating method is advantageous. Additionally, the validity of the analysis method using the program was evaluated.
- (6)
- Economic Analysis and Evaluation: The economic impact of implementing the new dehumidifier in different regional environments within the country was analyzed, and its applicability was evaluated.
- (7)
- Based on the analysis results, the prospects for technological advancements in the domestic dehumidification market and future directions for improvement were proposed.
2.1. Review of Dehumidification Method
2.2. Desiccant Dehumidifier Experiment and Simulation
2.2.1. Desiccant Dehumidifier Specification
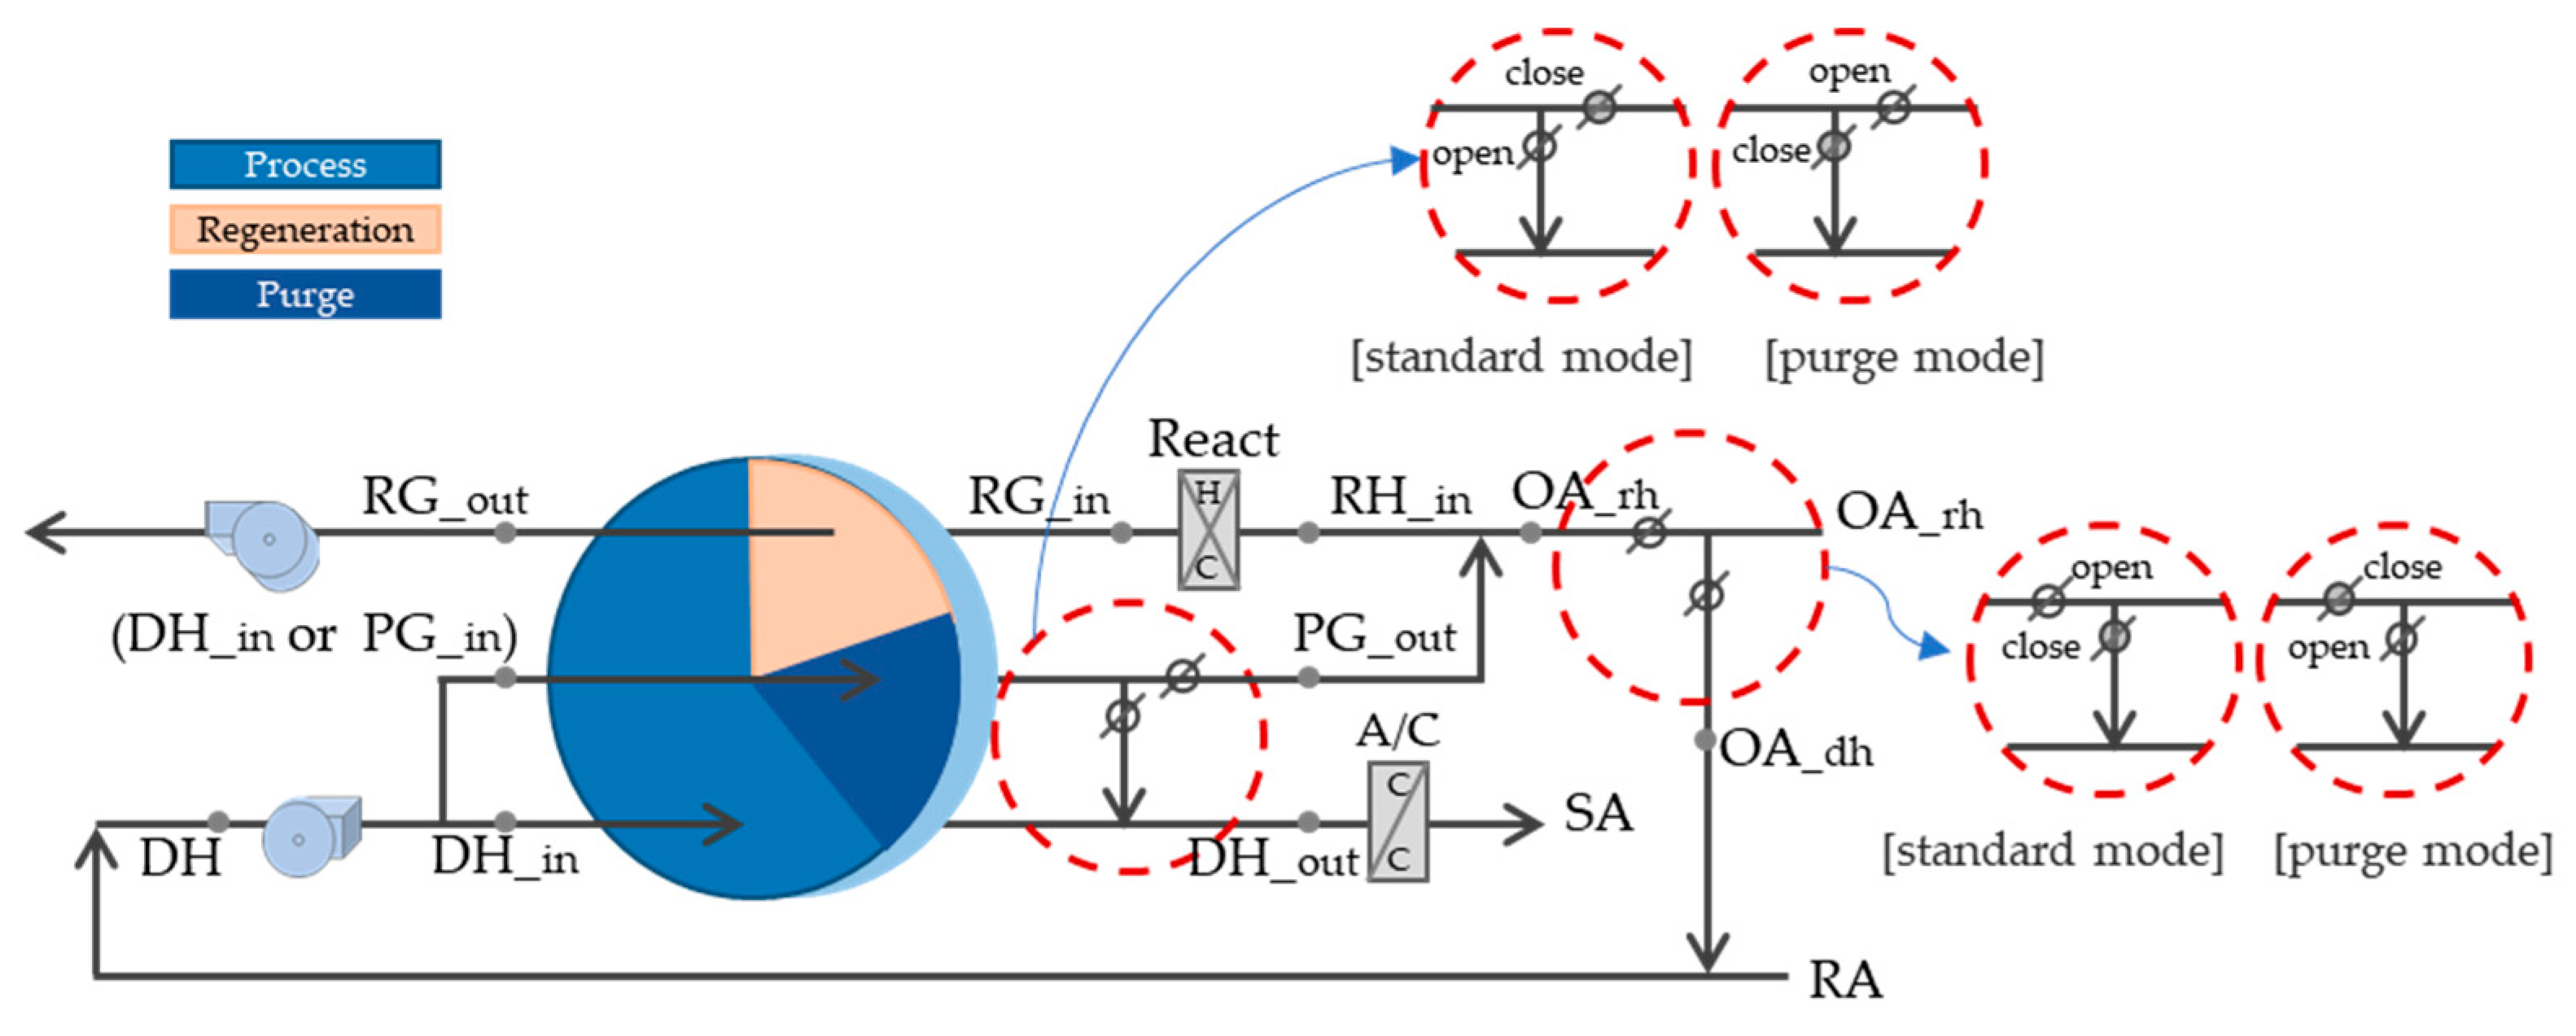
2.2.2. System Diagram and Data Measurement Location
2.2.3. Measuring Equipment Specification
2.2.4. Test Condition and Method
- (1)
- The equipment was pre-heated for more than 30 min and measured for more than 30 min.
- (2)
- The operating modes of the equipment were divided into Case A and Case B, and the tests were conducted sequentially.
- (3)
- The simulator applied a load to the indoor space using a fan heater and air conditioner.
- (4)
- The airflow and power consumption of the dehumidifier were measured and recorded using an anemometer and power meter.
- (5)
- The temperature and humidity of the supply air (SA) and return air (RA) were measured and recorded every minute using an automatic data recorder.
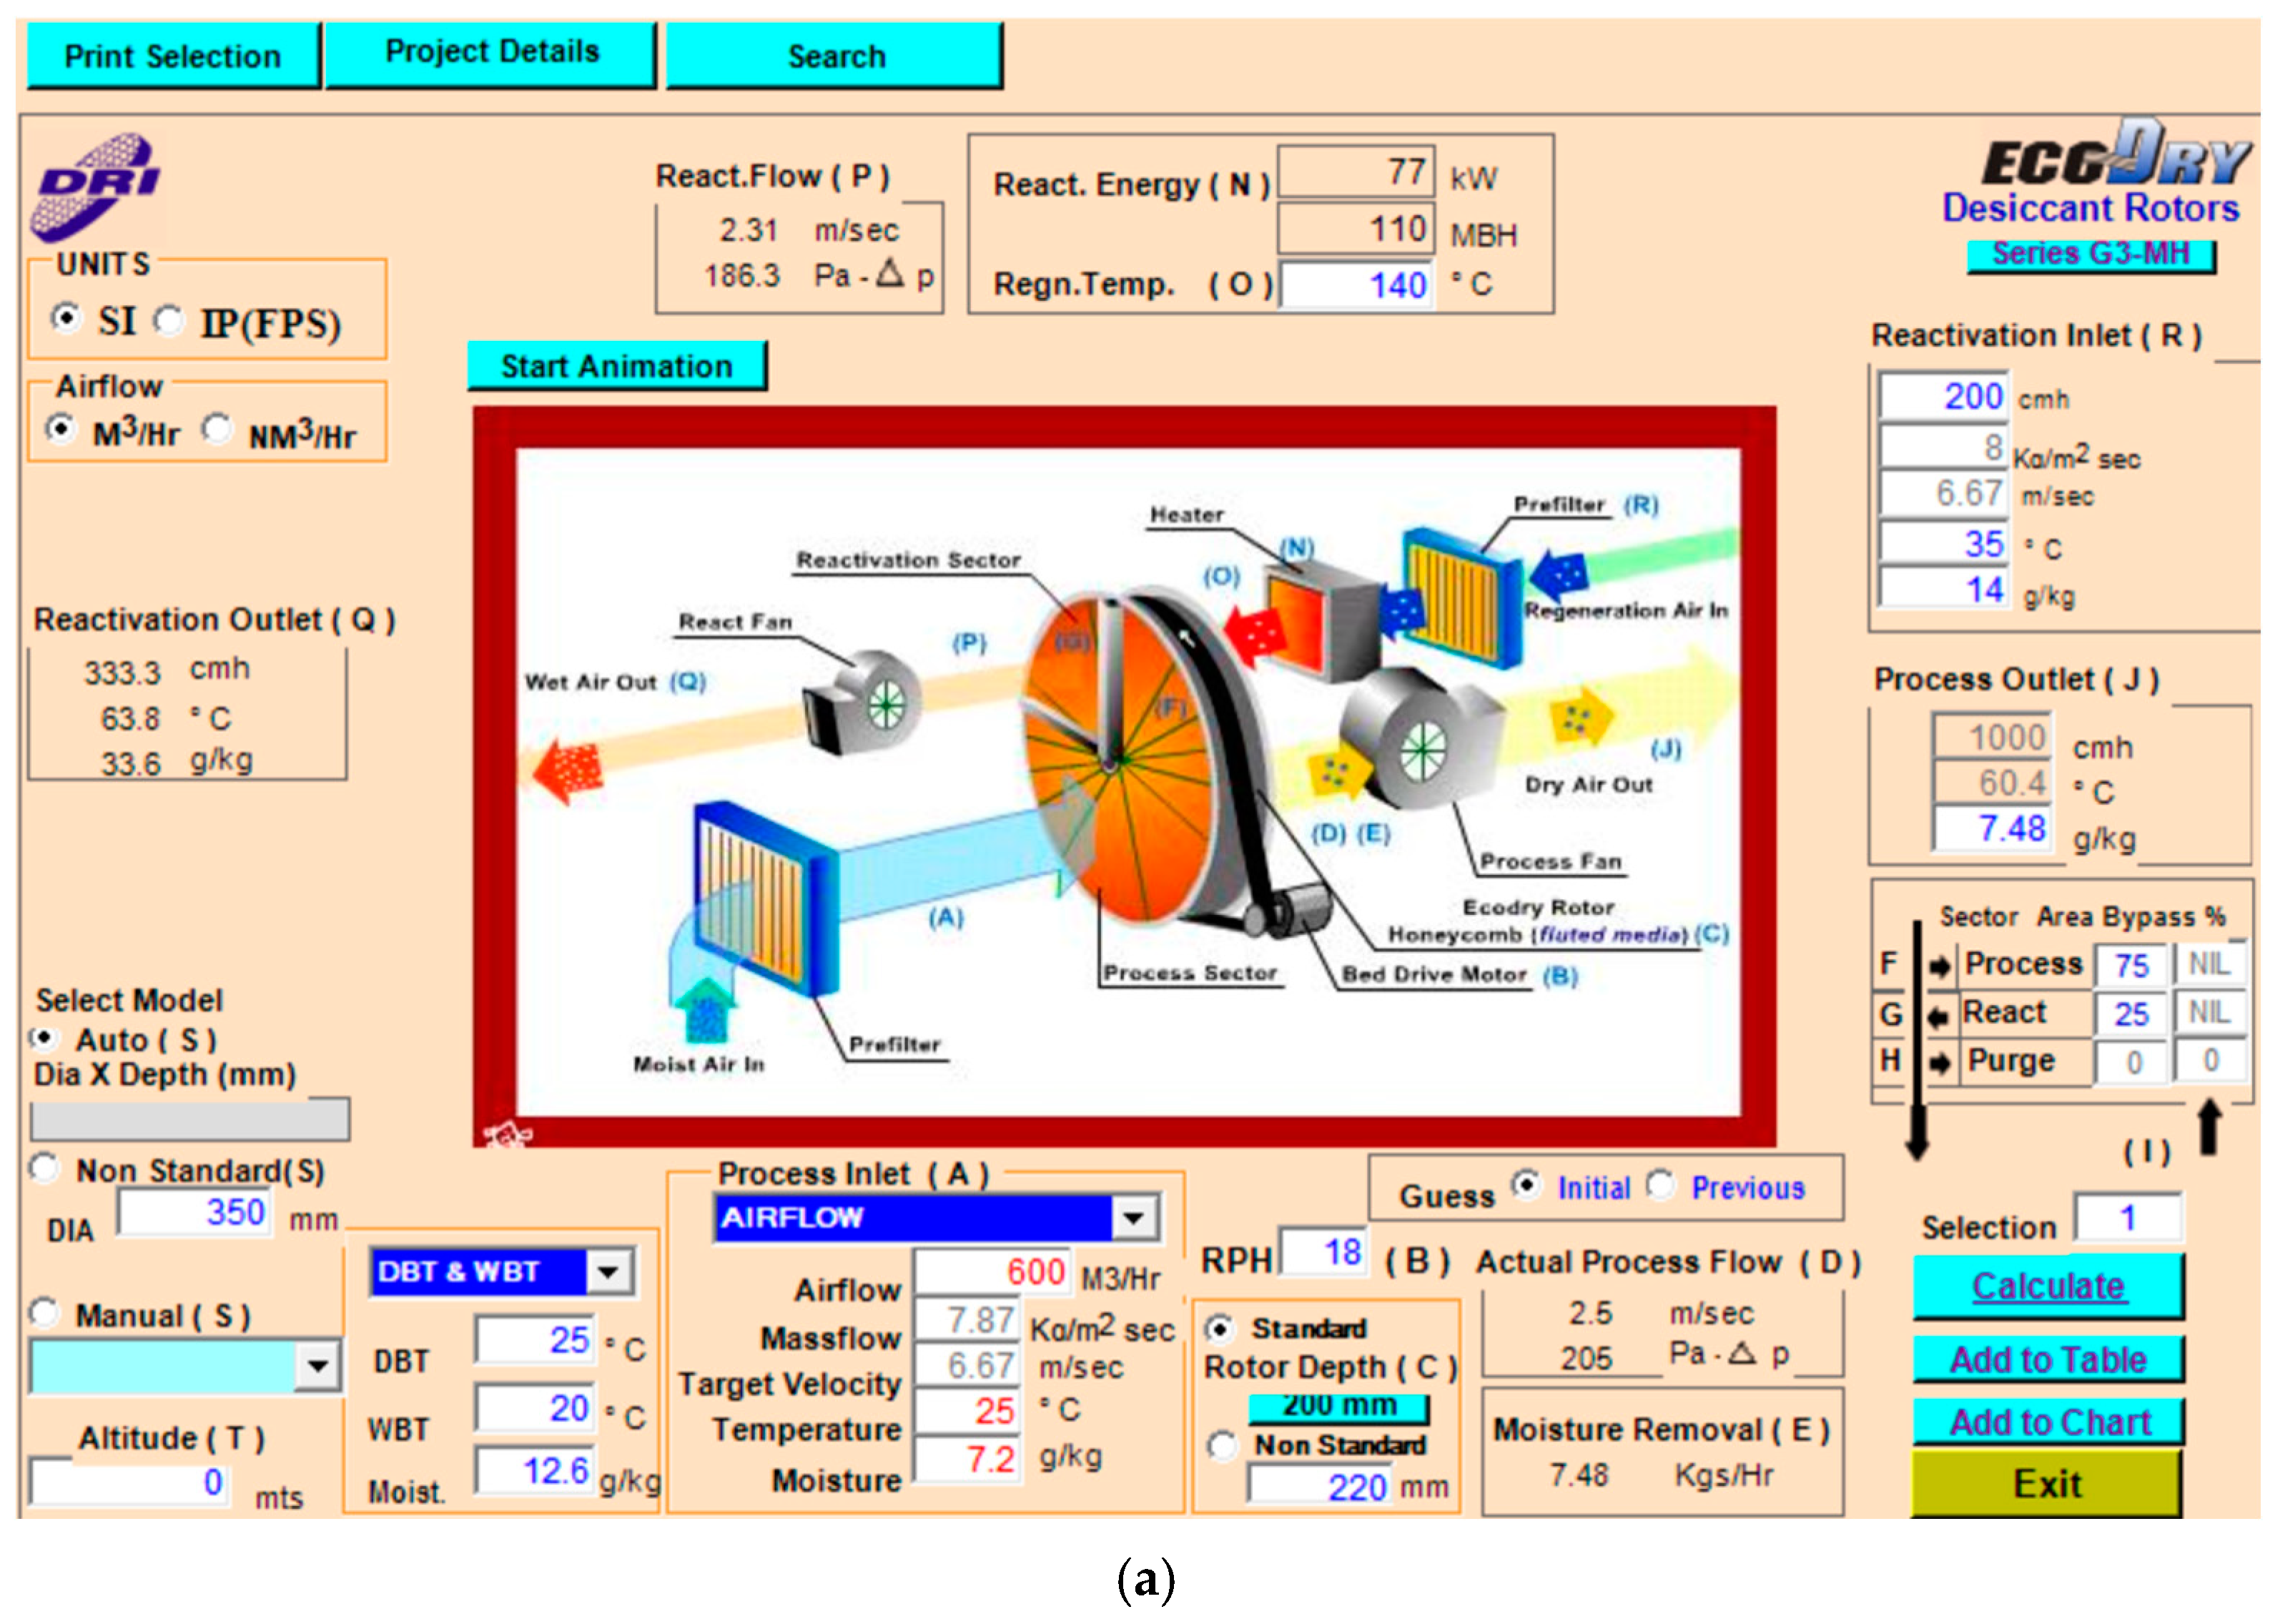
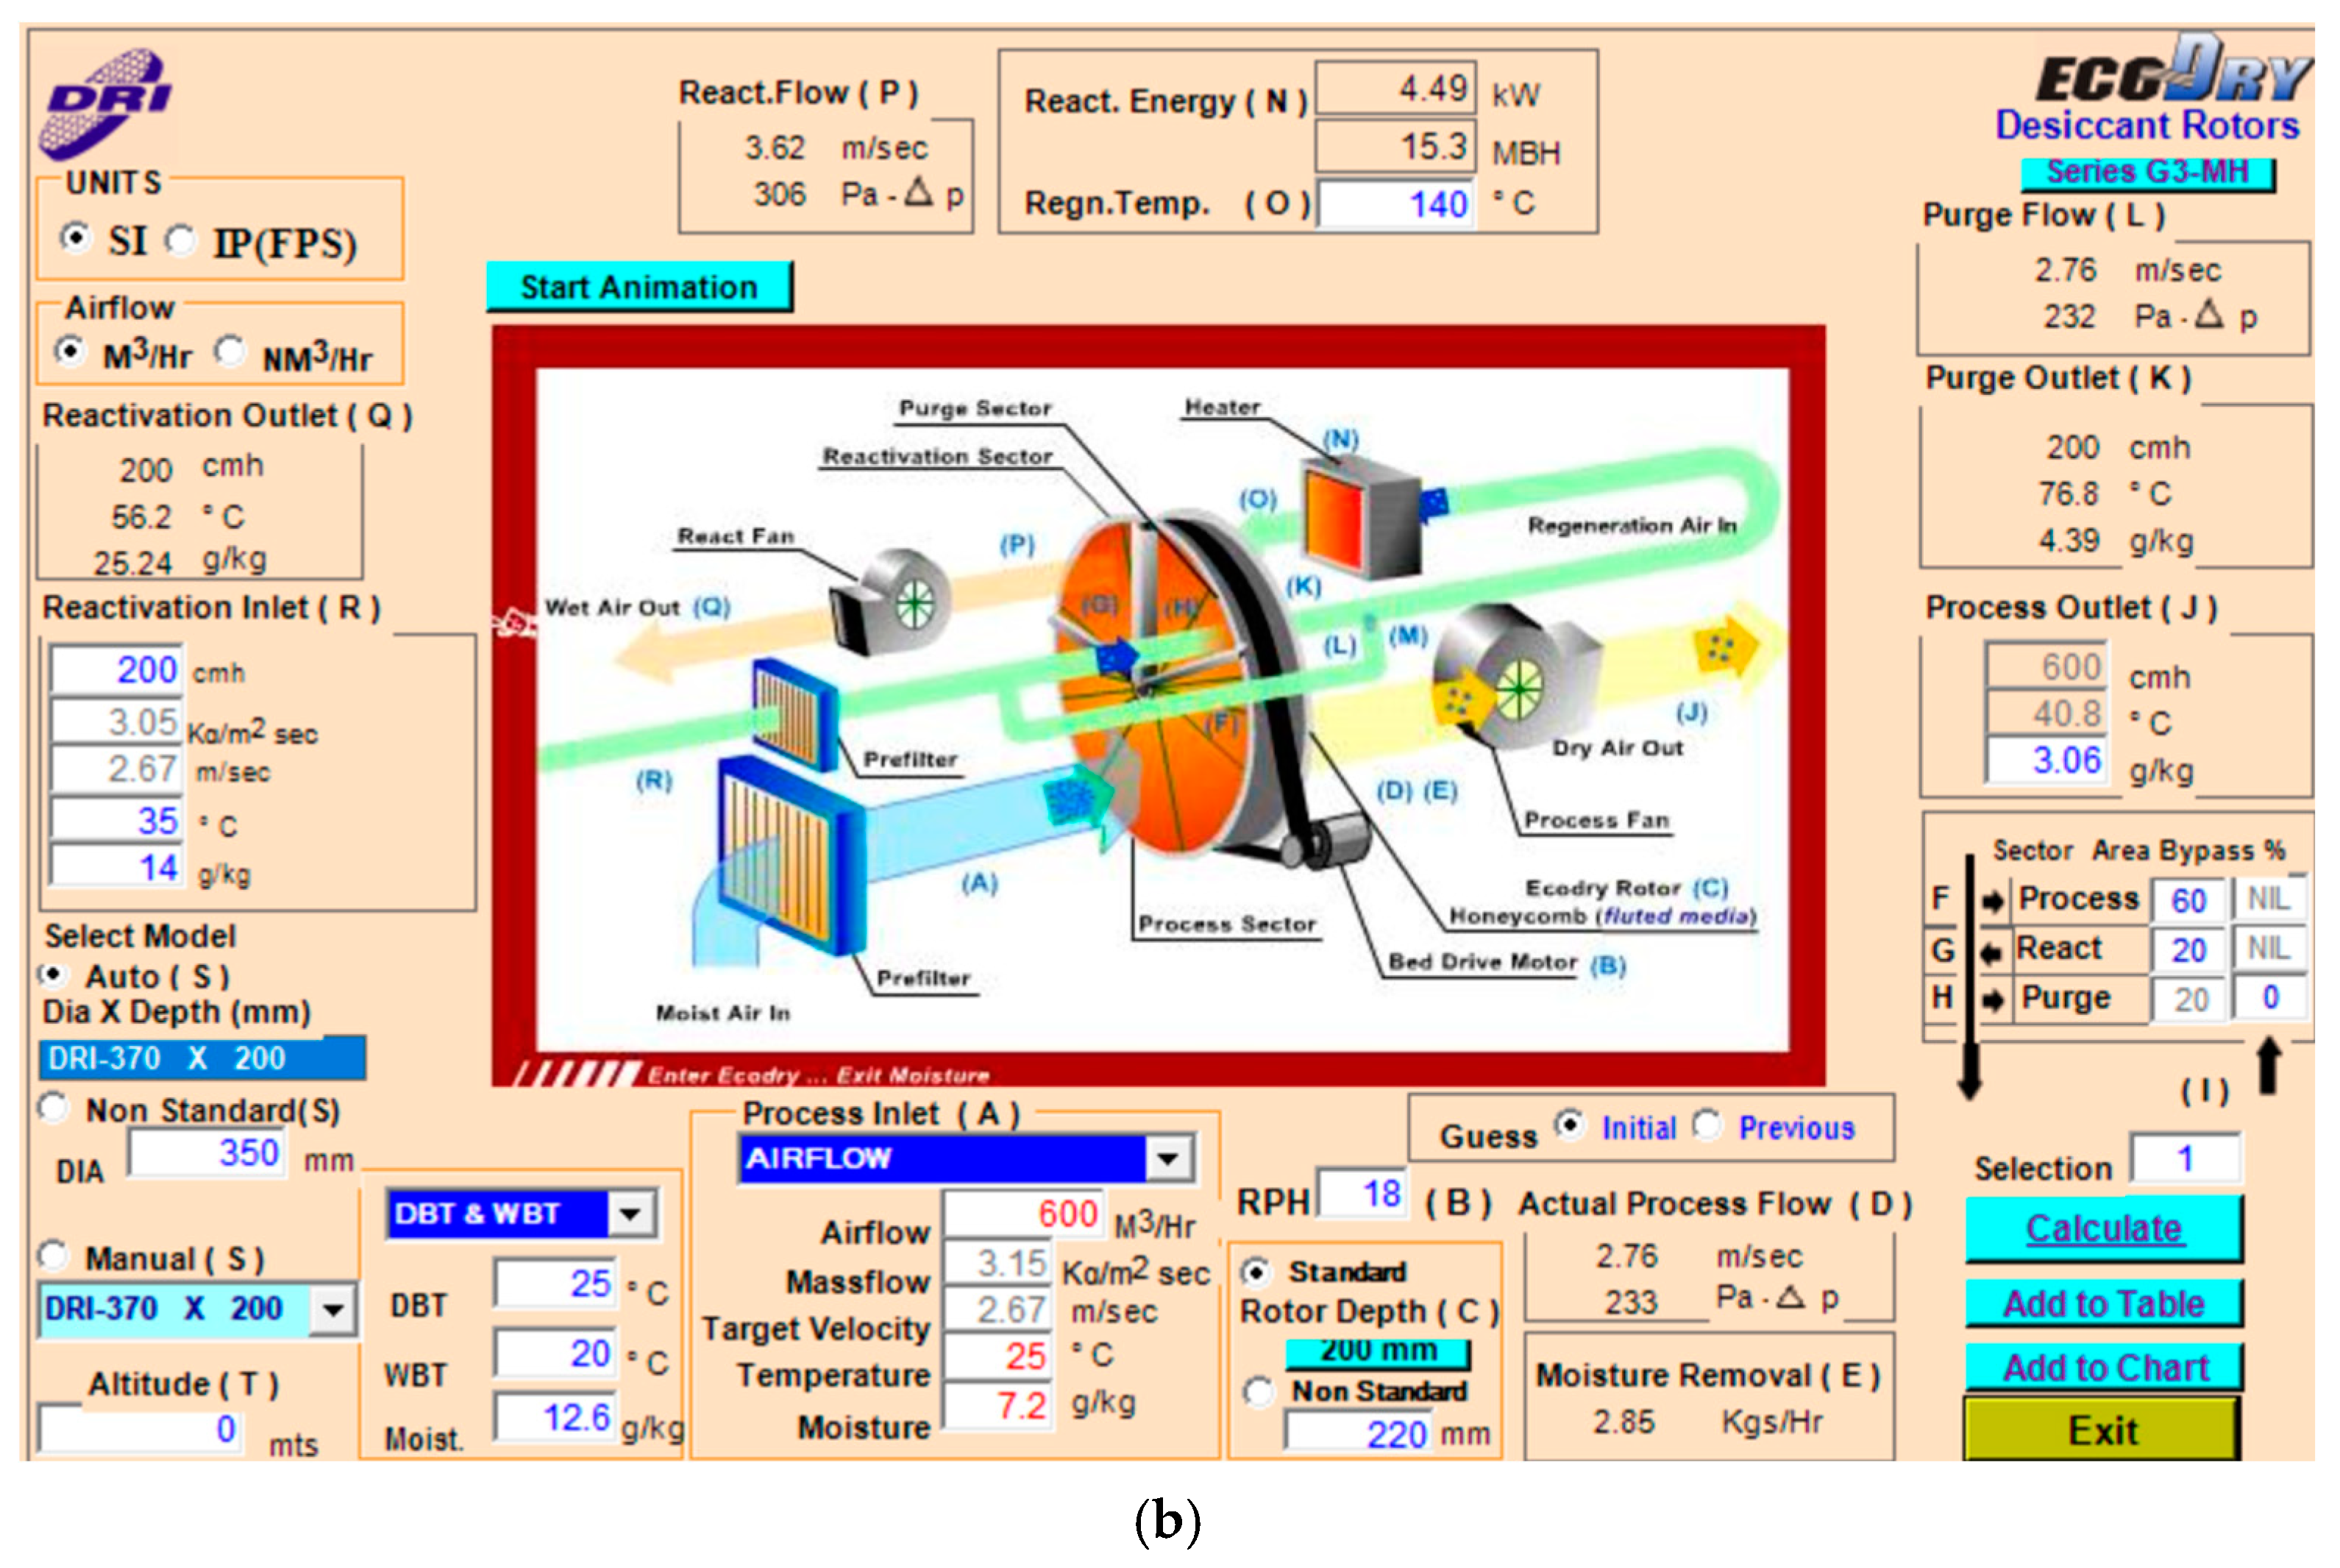
2.3. Simulation
2.4. Prediction of Dehumidification Energy Consumption by Region and Temperature–Humidity Conditions
2.4.1. Setting of Equipment and Indoor Conditions
2.4.2. Outdoor Condition Setup
3. Results
3.1. Analysis of Experimental Results
3.2. Experimental Results and Accuracy Analysis of the Simulation
3.3. The Prediction Results of Energy Consumption by Region
4. Discussion
5. Conclusions
- (1)
- According to the experimental results, the power consumption of the combined desiccant dehumidifier in general mode was 11.5% higher than that of the standard desiccant dehumidifier in general mode. However, the dehumidification capacity in-creased by 17.9%, resulting in a 5.2% improvement in dehumidification efficiency. Additionally, compared to the standard dehumidifier in general mode, the purge mode of the combined dehumidifier showed a slight reduction in dehumidification capacity by 0.7%, but the power consumption decreased by 9.8%, leading to a 10.5% improvement in dehumidification efficiency
- (2)
- The simulation results under the same conditions as the experiment showed that the dehumidification coefficient deviated by 0% at a 1:3 ratio and +5% at a 1:4 ratio in Case A, and by −7% at a 1:3 ratio and −9.5% at a 1:1:3 ratio in Case B. These deviations are within a ±10% error margin.
- (3)
- Based on the monthly average temperature and humidity conditions of three representative cities in Korea, energy consumption was simulated. The combined desiccant dehumidifier showed superior performance, with energy consumption reduced by 35% in Seoul, 35% in Daejeon, and 33% in Busan.
- (4)
- In the energy consumption simulations conducted under varying indoor humidity conditions, the combined desiccant dehumidifier demonstrated energy savings of 24.4% for Case 1 (10% RH), 33.5% for Case 2 (20% RH), 38.8% for Case 3 (30% RH), and 40.7% for Case 4 (40% RH). The results indicate that the combined desiccant dehumidifier achieves greater energy savings under conditions with higher indoor humidity requirements.
Author Contributions
Funding
Institutional Review Board Statement
Informed Consent Statement
Data Availability Statement
Conflicts of Interest
References
- Park, S. Desiccant Air Conditioning System; Technical Documentation; ATENG Co., Ltd.: Shanghai, China, 2011. [Google Scholar]
- Go, Y. Performance Experiment and Energy Simulation of Indoor Temperature and Humidity Control System Using Desiccant Rotor. Master’s Thesis, Graduate School of Kyung Hee University, Seoul, Republic of Korea, 2021. [Google Scholar]
- Jung, J. Manufacture and Characterization of Honeycomb Desiccant Rotors Containing Silica Gel and Zeolite. Master’s Thesis, Graduate School of Chungbuk National University, Cheongju, Republic of Korea, 2010. [Google Scholar]
- Hong, S.; Park, S.; Geum, J.; Park, J.; Park, S.; Lee, S. Energy Consumption Comparison between Dry Room Twin-Rotor Dehumidifier and Single-Rotor Dehumidifier. In Proceedings of the Korean Society of Air-Conditioning and Refrigeration Engineers (KSACRE) Conference, Jeju, Republic of Korea, 18–21 May 2012; Volume 6, pp. 580–583. [Google Scholar]
- Choi, S. Ventilation Performance in a Dry Room. Master’s Thesis, Hanyang University Graduate School, Seoul, Republic of Korea, 2001. [Google Scholar]
- Park, S. Design and Application Cases of Ultra-Low Humidity Dry Room Dehumidifiers. In Magazine of the SAREK 41.4; 2012; Available online: www.sarek.or.kr/html/sub06_01.jsp (accessed on 23 March 2025).
- Korea Meteorological Administration, National Climate Data Center. Available online: https://data.kma.go.kr/ (accessed on 23 March 2025).
- Sultan, M.; El-Sharkawy, I.I.; Miyazaki, T.; Saha, B.B.; Koyama, S. An overview of solid desiccant dehumidification and air conditioning systems. Renew. Sustain. Energy Rev. 2015, 46, 16–29. [Google Scholar] [CrossRef]
- La, D.; Dai, Y.J.; Li, Y.; Wang, R.Z.; Ge, T.S. Technical development of rotary desiccant dehumidification and air conditioning: A review. Renew. Sustain. Energy Rev. 2010, 14, 130–147. [Google Scholar] [CrossRef]
- Mazzei, P.; Minichiello, F.; Palma, D. Desiccant HVAC systems for commercial buildings. Appl. Therm. Eng. 2002, 22, 545–560. [Google Scholar] [CrossRef]
- Hwang, D.Y. Numerical Study on Indoor Temperature Variation Due to the Installation of Dehumidifiers and Airflow Circulation Fans in an Indoor Ice Rink. Master’s Thesis, Graduate School of Engineering, Inha University, Incheon, Republic of Korea, 2010. [Google Scholar]
- Sim, K.S. Performance Evaluation of a Hybrid Dehumidification and Air Conditioning System in an Underground Subway Platform. Master’s Thesis, Pusan National University, Busan, Republic of Korea, 2021. [Google Scholar]
- Marcus, V.; Klemens, K.; Artem, T.; Felipe, C.; Sebastian, T.; Christoph, H. Model-based energy analysis of a dry room HVAC system in battery cell production. Procedia CIRP 2021, 98, 157–162. [Google Scholar]
- Frendo, D.; Refalo, P.; Farrugia, R.N.; Balzan, N. Energy efficient dry-storage systems in the semiconductor manufacturing industry. Procedia Comput. Sci. 2024, 232, 2810–2820. [Google Scholar] [CrossRef]
- Ahmed, S.; Nelson, P.A.; Dees, D.W. Study of a dry room in a battery manufacturing plant using a process model. J. Power Sources 2016, 326, 490–497. [Google Scholar] [CrossRef]
- Kosfeld, M.; Westphal, B.; Kwade, A. Moisture behavior of lithium-ion battery components along the production process. J. Energy Storage 2023, 57, 106174. [Google Scholar] [CrossRef]
- Park, S.T. Understanding and Application of Desiccant Dehumidification Systems. Mag. SAREK 2006, 35, 44–56. [Google Scholar]
- Daou, K.; Wang, R.Z.; Xia, Z.Z. Desiccant cooling air conditioning: A review. Renew. Sustain. Energy Rev. 2006, 10, 55–77. [Google Scholar] [CrossRef]
- Abd-Elhady Mahmoud, M.; Salem Mohamed, S.; Hamed Ahmed, M.; El-Sharkawy Ibrahim, I. Solid desiccant-based dehumidification systems: A critical review on configurations, techniques, and current trends. Int. J. Refrig. 2022, 133, 337–352. [Google Scholar] [CrossRef]
- Rambhad Kishor, S.; Walke Pramod, V.; Tidke, D.J. Solid desiccant dehumidification and regeneration methods—A review. Renew. Sustain. Energy Rev. 2016, 59, 73–83. [Google Scholar] [CrossRef]
- Panaras, G.; Mathioulakis, E.; Belessiotis, V. Solid desiccant air-conditioning systems—Design parameters. Energy 2011, 36, 2399–2406. [Google Scholar] [CrossRef]
- Muzaffar, A.; Farhan, H.M.; Nadeem, A.S.; Javed, A.; Haq, G.S.I.U. Experimental investigation of an integrated absorption-solid desiccant air conditioning system. Appl. Therm. Eng. 2022, 203, 117912. [Google Scholar]
- Mei, L.; Dai, Y.J. A technical review on use of liquid-desiccant dehumidification for air-conditioning application. Renew. Sustain. Energy Rev. 2008, 12, 662–689. [Google Scholar] [CrossRef]
- Kim, N.H. Experimental Study on the Effect of Regeneration Area Ratio on the Performance of Small Household Dehumidification Rotors. J. Facil. Eng. 2015, 27, 277–282. [Google Scholar]
- Seo, J.N.; Kim, Y.I.; Park, S.T. Cycle Analysis for the Influence of Inlet Conditions, Regeneration Conditions, and Rotor Rotation Speed on Hybrid Dehumidifiers. Proc. Korean Soc. HVAC Refrig. Eng. Conf. 2010, 6, 1018–1022. [Google Scholar]
- Pi, C.H.; Kang, B.H.; Chang, Y.S. Dehumidification Performance Analysis Based on the Change in Rotor Rotation Cycle of a Dehumidification Cooling System. J. Korean Soc. Mech. Eng. B 2012, 36, 523–531. [Google Scholar] [CrossRef]
- Jeong, J.D.; Lee, D.Y.; Yoon, S.M. The Effect of Desiccants and Channels on the Performance of Dehumidification Rotors. J. Korean Soc. Mech. Eng. 2007, 19, 569–576. [Google Scholar]
- Pi, C.H.; Chang, Y.S.; Kang, B.H.; Kang, M.C. Performance Simulation Based on Desiccant Rotor Rotational Speed. Proc. Spring Fall Annu. Conf. Korean Soc. Mech. Eng. 2011, 10, 1511–1516. [Google Scholar]
- Pi, C.H.; Chang, Y.S.; Kang, B.H. Experimental Study on the Leakage Characteristics of Desiccant Rotors. Proc. Korean Soc. HVAC Sanit. Eng. Conf. 2010, 11, 544–549. [Google Scholar]
- Lee, D.Y.; Song, G.E. Determination of the Optimal Rotational Speed of Desiccant Rotors by Theoretical Methods. J. HVAC Sanit. Eng. 2009, 21, 575–582. [Google Scholar]
- Panaras, G.; Mathioulakis, E.; Belessiotis, V.; Kyriakis, N. Theoretical and experimental investigation of the performance of a desiccant air-conditioning system. Renew. Energy 2010, 35, 1368–1375. [Google Scholar] [CrossRef]
- Subramanyam, N.; Maiya, M.P.; Murthy, S.S. Application of desiccant wheel to control humidity in air-conditioning systems. Appl. Therm. Eng. 2004, 24, 2777–2788. [Google Scholar] [CrossRef]
- Korean Society of Facility Engineering. Performance Testing Method for Constant Temperature and Humidity Equipment. SPS-KARSE B 0002-164:2015, 2015. Available online: www.karse.or.kr/pages_standards/state_standards.vm (accessed on 23 March 2025).
- Korean Society of Facility Engineering. Coolers. SPS-KARSE B 0024-0186:2000. 2018. Available online: www.karse.or.kr/pages_standards/state_standards.vm (accessed on 23 March 2025).
- Korean Society of Air-Conditioning and Refrigeration Engineers. Performance Test Method for Desiccant Cooling Systems Based on High-Performance Desiccants. SAREK 102-2017. 2017. Available online: www.karse.or.kr/pages_standards/state_standards.vm (accessed on 23 March 2025).
- Korean Society of Air-Conditioning and Refrigeration Engineers. Performance Test Method for Desiccant Dehumidifiers Based on Thermally Regenerable Solid Desiccants, SAREK Standard 202-2014. 2014. Available online: www.karse.or.kr/pages_standards/state_standards.vm (accessed on 23 March 2025).
- Lee, D.Y.; Lee, G.B.; Kim, M.S. Proposal of Performance Indicators for Desiccant Rotors. J. Soc. HVAC Refrig. Eng. 2007, 19, 537–544. [Google Scholar]
- Lee, J.J. Experimental Study on the Effectiveness of Desiccant Rotors Under Different Operating Conditions. Master’s Thesis, Graduate School of Kookmin University, Seoul, Republic of Korea, 2011. [Google Scholar]
- Han, G.C. Study on the Performance Testing and Analysis of Small Desiccant Rotors Used in Household Dehumidifiers. Master’s Thesis, Incheon National University, Incheon, Republic of Korea, 2015. [Google Scholar]
- Angrisani, G.; Roselli, C.; Sasso, M. Effect of rotational speed on the performances of a desiccant wheel. Appl. Energy 2013, 104, 268–275. [Google Scholar] [CrossRef]
- Jeong, G.J. Dynamic Energy Simulation of Hybrid Desiccant Cooling and Ventilation System Applied to Zero Energy Buildings. Master’s Thesis, Graduate School of Kyung Hee University, Seoul, Republic of Korea, 2024. [Google Scholar]
- Kim, J.Y. A Study on Hybrid Dehumidification Cooling System Linked with District Heating. Master’s Thesis, Graduate School of Kookmin University, Seoul, Republic of Korea, 2014. [Google Scholar]
- Kim, H.T. Application of Hybrid Desiccant Cooling System for Cooling, Dehumidification, and Ventilation in High-Rise Residential Buildings. Master’s Thesis, Graduate School of Seoul National University, Seoul, Republic of Korea, 2020. [Google Scholar]
- Wang, E.S.; Lee, B.J.; Shin, H.K.; Kang, E.C.; Kim, Y.J. Configuration of a 1RT Heat Pump System with a Desiccant Rotor. Proc. Korean Soc. Air-Cond. Refrig. Eng. Annu. Conf. 2021, 6, 410–412. [Google Scholar]
- Choo, B.S.; Kim, T.W.; Lee, K.H.; Park, J.Y.; Park, S.J. Dehumidification Air Conditioning System for Electric Vehicles Using Desiccant Rotors. Proc. Korean Soc. Automot. Eng. Div. Conf. 2022, 6, 1183. [Google Scholar]
- Kim, N.k.; Park, K.H.; Cho, S.G. Solar-Powered Dehumidification and Cooling System for Residential Use. Proc. Korean Sol. Energy Soc. Conf. 2020, 10, 39. [Google Scholar]
- Kim, H.J.; Park, S.T.; Yoo, K.R.; Lee, H.J. Desiccant Dehumidifier Selection Program. Proc. Korean Soc. Facil. Eng. Conf. 2009, 2009, 224–229. [Google Scholar]
- Zhang, X.J.; Dai, Y.J.; Wang, R.Z. A simulation study of heat and mass transfer in a honeycombed rotary desiccant dehumidifier. Appl. Therm. Eng. 2003, 23, 989–1003. [Google Scholar] [CrossRef]
- Tanthapanichakoon, W.; Prawarnpit, A. New simple mathematical model of a honeycomb rotary absorption-type dehumidifier. Chem. Eng. J. 2002, 86, 11–16. [Google Scholar] [CrossRef]
- Shamim Jubair, A.; Wei-Lun, H.; Soumyadeep, P.; Lili, Y.; Hirofumi, D. A review of solid desiccant dehumidifiers: Current status and near-term development goals in the context of net zero energy buildings. Renew. Sustain. Energy Rev. 2021, 137, 110456. [Google Scholar] [CrossRef]
- White, S.D.; Goldsworthy, M.; Reece, R.; Spillmann, T.; Gorur, A.; Lee, D.Y. Characterization of desiccant wheels with alternative materials at low regeneration temperatures. Int. J. Refrig. 2011, 34, 1786–1791. [Google Scholar] [CrossRef]
- Kim, J.H. Study on the Optimal Condition of a Dehumidifier with the Desiccant System. Ph.D. Dissertation, Pukyong National University, Busan, Republic of Korea, 2010. [Google Scholar]
- Hwang, W.B. A Study on the Performance Evaluation of Hybrid Dehumidifying Air Conditioning System. Master’s Thesis, Graduate School of Korea University, Seoul, Republic of Korea, 2011. [Google Scholar]
- Yoon, C.H. Performance Characteristics of Hybrid Dehumidification Cooling System in Residential Environments. Master’s Thesis, Graduate School of Kookmin University, Seoul, Republic of Korea, 2012. [Google Scholar]
- Park, J.I.; Park, S.T. Energy Savings Factor Analysis of Hybrid Desiccant Dehumidification Method. J. Soc. Air-Cond. Refrig. Eng. Korea 2015, 27, 603–608. [Google Scholar]
- Yuan, W.; Zheng, Y.; Liu, X.; Yuan, X. Study of a new modified cross-cooled compact solid desiccant dehumidifier. Appl. Therm. Eng. 2008, 28, 2257–2266. [Google Scholar]
- Ge, F.; Wang, C. Exergy analysis of dehumidification systems: A comparison between the condensing dehumidification and the desiccant wheel dehumidification. Energy Convers. Manag. 2020, 224, 113343. [Google Scholar] [CrossRef]
- Jani, D.B.; Manish, M.; Sahoo, P.K. Solid desiccant air conditioning—A state of the art review. Renew. Sustain. Energy Rev. 2016, 60, 1451–1469. [Google Scholar] [CrossRef]
- Yulho, L.; Park, S.; Kang, S. Performance analysis of a solid desiccant cooling system for a residential air conditioning system. Appl. Therm. Eng. 2021, 182, 116091. [Google Scholar]
- Liu, H.; Yang, H.; Qi, R. A review of electrically driven dehumidification technology for air-conditioning systems. Appl. Energy 2020, 279, 115863. [Google Scholar] [CrossRef]
- Korea Society of Facility Engineering. Hybrid Air Conditioning System Combining Dehumidifying Air Conditioner and Electric Air Conditioner, SPS-B KARSE 0062-7516:2022. 2022. Available online: www.karse.or.kr (accessed on 23 March 2025).
- Dhar, P.L.; Singh, S.K. Studies on solid desiccant based hybrid air-conditioning systems. Appl. Therm. Eng. 2001, 21, 119–134. [Google Scholar] [CrossRef]
- Kim, D.S. Analysis Model of Hybrid Desiccant Dehumidifiers. J. Facil. Eng. 2021, 33, 218–232. [Google Scholar]
- Mohamed, A.; Saber Mohamed, A.; Bassuoni, M.M.; Khaira Ahmad, M. Comparative analysis of a new desiccant dehumidifier design with a traditional rotary desiccant wheel for air conditioning purpose. Appl. Therm. Eng. 2023, 222, 119945. [Google Scholar]
- Yutong, L.; Hongxing, Y. Investigation on solar desiccant dehumidification process for energy conservation of central air-conditioning systems. Appl. Therm. Eng. 2008, 28, 1118–1126. [Google Scholar] [CrossRef]
- Zhang, Y.; Wang, W.; Zheng, X.; Cai, J. Recent progress on composite desiccants for adsorption-based dehumidification. Energy 2024, 302, 131824. [Google Scholar] [CrossRef]
- Abdelgaied, M.; Saber, M.A.; Bassuoni, M.M.; Khaira, A.M. Solid desiccant air conditioning system using desiccant dehumidifiers with cooling technique and thermal recovery unit: Experimental investigation and performance analysis. J. Clean. Prod. 2023, 421, 138387. [Google Scholar] [CrossRef]
- Zhang, L.Z.; Fu, H.X.; Yang, Q.R.; Xu, J.C. Performance comparisons of honeycomb-type adsorbent beds (wheels) for air dehumidification with various desiccant wall materials. Energy 2014, 65, 430–440. [Google Scholar] [CrossRef]
- Seung, D.H.; Choi, T.G.; Lee, J.H.; Hong, H.K. Experimental Study on a Solar-Powered Hybrid Desiccant Cooling System. Proc. Korean Soc. Air-Cond. Refrig. Eng. Annu. Conf. 2019, 11, 128–131. [Google Scholar]
- Kim, N.K.; Park, K.H.; Cho, S.G. Experimental Operation of a Solar Desiccant Cooling System. Proc. Korean Sol. Energy Soc. Annu. Conf. 2020, 6, 80. [Google Scholar]
- Park, S.T. Application of Dehumidification Air-Conditioning Systems Receiving New Financial Support from the Energy Efficiency Fund. Facil. J. 2014, 43, 52–62. [Google Scholar]


| Principle | Device | Areas of Use |
|---|---|---|
| Cooling type (condensing) | Cooling dehumidifier using refrigerant compression Cooling dehumidifier using cold water Electronic dehumidifier (Peltier effect) | HVAC (Commonly used) |
| Solid adsorption type dehumidifier Liquid adsorption type dehumidifier | Used in precision equipment | |
| Chemical type | Liquid adsorption type dehumidifier | HVAC (Industrial, dry room) |
| Compression type | Compression type dehumidifier | HVAC (not used often) |
| Description | System Diagram | Features | Rotor |
|---|---|---|---|
| Standard desiccant dehumidifier | 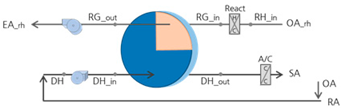 |
| Rotor area ratio [regen./purge/process] 1:0:3 |
| Purge desiccant dehumidifier | 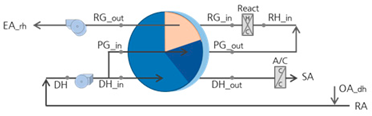 |
| Rotor area ratio [regen./purge/process] 1:1:3 |
| Combined desiccant dehumidifier | 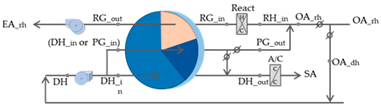 |
| Rotor area ratio [regen./purge/process] 1:0:4 (standard) 1:0:4 (purge mode) 1:1:3 |
| Image | Combined Desiccant Dehumidifier | ||
|---|---|---|---|
| Contents | Q’ty | Value | |
 | Frame | - | 1.2~5.0 mm |
| Casing | - | 1.2~5.0 mm | |
| Process fan | 1 | 600 m3/h | |
| Regeneration fan | 1 | 200 m3/h | |
| Desiccant rotor | 1 | D350, 200 mm [1:3, regeneration/process] | |
| Heater | 1 | 8.0 kW | |
| Geared motor | 1 | 220 V, 25 W | |
| Controller | 1 | PLC | |
| Damper | 4 | D100 | |
| Image | Standard Desiccant Dehumidifier | ||
|---|---|---|---|
| Contents | Q’ty | Value | |
 | Frame | - | 1.2~5.0 mm |
| Casing | - | 1.2~5.0 mm | |
| Process fan | 1 | 600 m3/h | |
| Regeneration fan | 1 | D350, 200 mm | |
| Desiccant rotor | 1 | D350, 200 mm [1:4 ] or [1:1:3] | |
| Heater | 1 | 8.0 kW | |
| Geared motor | 1 | 220 V, 25 W | |
| Controller | 1 | PLC | |
| Motor damper | 4 | D100 | |
| Location | Item | Location | Item |
|---|---|---|---|
| A1 | T, H, ῡ, V | B1 | T, H, ῡ, V |
| A2 | T, H, ῡ, V | B2 | T, H, ῡ, V |
| A3 | T, H, ῡ, V | B3 | T, H, ῡ, V |
| A4 | T, H, ῡ, V | B4 | T, H, ῡ, V |
| E1 | E | E2 | E |
| Item | Temperature and Humidity Sensor | Item | Power Meter | ||
| Value | Image | Value | Image | ||
| Model | Testo 435 |  | Model | Hioki 3280-10F |  |
| Manufacturer | Testo (Germany) | Manufacturer | Hioki (Japan) | ||
| Temperature | −20~+70 °C (±0.2 °C) | AC | 42/420/1000 A (±1.5%) | ||
| Humidity | +2~+98%RH (±2%RH) | AC voltage | 4.2/42/420/600 V (±1.0%) | ||
| Velocity | +0.6~+40 m/s (±0.03 m/s) | Resistence | 420/4.2 k/420 k/4.2 M/42 MΩ (±2.0%) | ||
| Dimension | 74 W × 220 H × 46 D (428 g) | Dimension | 57 W × 175 H × 160 D, 100 g | ||
| Item | Temperature and Humidity Recorder | Item | Temperature and Humidity Recorder | ||
| Value | Image | Value | Image | ||
| Model | ST-50A | 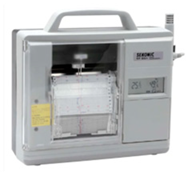 | Model | SDR100 (input ± 0.1%) |  |
| Manufacturer | SEKONIK (Japan) | Manufacturer | Samwon Technology (Republic of Korea) | ||
| Temp. range | −20~80 °C (±0.5 °C) | Display | 5.7” TFT LCD | ||
| Humid. range | 0~100%RH (±3%RH) | 640 W × 480 H | |||
| Usage environment | −20~50 °C, 20~90%RH | Sampling time | 500 ms | ||
| Dimension | 300 W × 245 H × 105 D, 2.9 kg | Dimension | 144 W × 144 H 188 D, 1.1 kg | ||
| Item | Outdoor Air | Indoor Air | Note | |
|---|---|---|---|---|
| Case A | Temperature (°C) | 16.9~17.7 | 19.3~23.2 | Air-conditioner and heater |
| Relative humidity (%) | 75.3~79.9 | 50.5~59.6 | ||
| Case B | Temperature (°C) | 18.5~21 | 20.4~28.2 | |
| Relative humidity (%) | 62.4~69.4 | 32.7~57.1 | ||
| Image | Parameter | |
|---|---|---|
 | Room Cooling Load | No cooling load |
| Person | 18.6 m2/person 80(m2)/18.6(m2/person) = 4.3 person → 4 person | |
| Dehumidification Load | Latent heat load 0.6 kW/(person, h) × 4 person = 2.4 kW 0.3 kW/0.695 kWh/kg = about 0.5 kg/ | |
| Positive air | 100 m3/h | |
| Exhaust air | 0 m3/h | |
| Pre cooler | No pre cooling | |
| After cooler | EER 3.6~7.6 | |
| Regenerating heater | 90 °C (min.)~180 °C (max.) | |
| Description | Case 1 | Case 2 | Case 3 | Case 4 |
|---|---|---|---|---|
| Dry-bulb temperature (°C, DB) | 23 °C | 23 °C | 23 °C | 23 °C |
| Wet-bulb temperature (°C, WB) | 9.33 | 11.22 | 12.99 | 14.66 |
| Relative humidity (%, RH) | 10% | 20% | 30% | 40% |
| Absolute humidity (g/kg, x) | 1.73 | 3.47 | 5.22 | 6.98 |
| Dew-point temperature (°C, DP) | −9.11 | −1.01 | 4.51 | 8.69 |
| Enthalpy (kJ/kg, h) | 27.52 | 31.94 | 36.39 | 40.86 |
| Month | Dry-Bulb Temperature (°C, DB) | Relative Humidity (%, RH) | Absolute Humidity (g/kg, x) | Dew-Point Temperature (°C, DP) | Enthalpy (kJ/kg, h) | Density (kg/m3, γ) |
|---|---|---|---|---|---|---|
| 1 | −2.0 | 55.7 | 1.78 | −8.82 | 2.42 | 1.30 |
| 2 | 0.8 | 54.1 | 2.16 | −6.59 | 6.21 | 1.28 |
| 3 | 6.4 | 54.3 | 3.22 | −1.90 | 14.53 | 1.25 |
| 4 | 12.8 | 54.5 | 4.99 | 3.87 | 25.45 | 1.22 |
| 5 | 18.4 | 59.6 | 7.84 | 10.41 | 38.37 | 1.19 |
| 6 | 22.9 | 65.8 | 11.49 | 16.17 | 52.24 | 1.18 |
| 7 | 25.7 | 75.8 | 15.76 | 21.11 | 66.00 | 1.15 |
| 8 | 26.3 | 73.6 | 15.86 | 21.20 | 67.22 | 1.15 |
| 9 | 21.8 | 66.6 | 10.87 | 15.31 | 49.53 | 1.18 |
| 10 | 15.2 | 62.2 | 6.67 | 8.03 | 32.14 | 1.20 |
| 11 | 7.6 | 60.4 | 3.89 | 0.43 | 17.43 | 1.25 |
| 12 | 0.0 | 57.6 | 2.17 | −6.53 | 5.42 | 1.28 |
| Month | Dry-Bulb Temperature (°C, DB) | Relative Humidity (%, RH) | Absolute Humidity (g/kg, x) | Dew-Point Temperature (°C, DP) | Enthalpy (kJ/kg, h) | Density (kg/m3, γ) |
|---|---|---|---|---|---|---|
| 1 | −1.1 | 64.9 | 2.23 | −6.20 | 4.47 | 1.30 |
| 2 | 1.5 | 59.6 | 2.50 | −4.88 | 7.77 | 1.28 |
| 3 | 6.9 | 57.2 | 3.51 | −0.86 | 15.77 | 1.25 |
| 4 | 13.2 | 56.4 | 5.30 | 4.73 | 26.65 | 1.22 |
| 5 | 18.6 | 61.9 | 8.25 | 11.16 | 39.62 | 1.19 |
| 6 | 22.9 | 69.1 | 12.08 | 16.94 | 53.74 | 1.18 |
| 7 | 25.7 | 79.0 | 16.45 | 21.78 | 67.74 | 1.15 |
| 8 | 26.2 | 78.2 | 16.78 | 22.10 | 69.10 | 1.15 |
| 9 | 21.4 | 75.3 | 12.01 | 16.85 | 52.02 | 1.18 |
| 10 | 14.8 | 71.9 | 7.52 | 9.79 | 33.89 | 1.20 |
| 11 | 7.9 | 69.0 | 4.55 | 2.58 | 19.38 | 1.25 |
| 12 | 0.9 | 67.7 | 2.72 | −3.89 | 7.72 | 1.28 |
| Month | Dry-Bulb Temperature (°C, DB) | Relative Humidity (%, RH) | Absolute Humidity (g/kg, x) | Dew-Point Temperature (°C, DP) | Enthalpy (kJ/kg, h) | Density (kg/m3, γ) |
|---|---|---|---|---|---|---|
| 1 | 3.5 | 46.1 | 2.23 | −6.21 | 9.11 | 1.27 |
| 2 | 5.5 | 49.3 | 2.75 | −3.79 | 12.42 | 1.27 |
| 3 | 9.4 | 56.1 | 4.09 | 1.10 | 19.74 | 1.23 |
| 4 | 13.9 | 61.1 | 6.01 | 6.54 | 29.17 | 1.22 |
| 5 | 18.0 | 67.8 | 8.71 | 11.97 | 40.17 | 1.19 |
| 6 | 21.2 | 76.3 | 12.02 | 16.86 | 51.85 | 1.18 |
| 7 | 24.7 | 82.9 | 16.26 | 21.59 | 66.22 | 1.15 |
| 8 | 26.4 | 78.0 | 16.94 | 22.25 | 69.72 | 1.15 |
| 9 | 22.7 | 72.7 | 12.56 | 17.55 | 54.76 | 1.16 |
| 10 | 18.0 | 62.6 | 8.03 | 10.77 | 38.45 | 1.19 |
| 11 | 12.1 | 55.7 | 4.87 | 3.52 | 24.44 | 1.23 |
| 12 | 5.6 | 47.5 | 2.66 | −4.14 | 12.32 | 1.27 |
| Description | Case A | Case B | |||
|---|---|---|---|---|---|
| Dehumidifier Type | Standard | Combined | Standard | Combined | |
| Operation mode | General operation | General operation | General operation | Purge | |
| Rotor area ratio [regeneration/process] or [regeneration/purge/process] | 1:3 Rotor | 1:4 Rotor | 1:3 Rotor | 1:1:3 Rotor | |
| Supply air | Temperature (°C, DB) | 44.9 | 51.2 | 48.2 | 46.4 |
| Relative humidity (%, RH) | 7.4 | 5.3 | 6.0 | 5.8 | |
| Absolute humidity (g/kg) | 4.35 | 4.30 | 4.21 | 3.72 | |
| Enthalpy (kJ/kg) | 56.36 | 62.62 | 59.34 | 56.25 | |
| Density (kg/m3) | 1.10 | 1.08 | 1.09 | 1.10 | |
| Exhaust air | Temperature (°C, DB) | 41.2 | 40.7 | 43.7 | 46.1 |
| Relative humidity (%, RH) | 52.5 | 59.1 | 42.1 | 34.3 | |
| Absolute humidity (g/kg) | 26.46 | 29.12 | 24.07 | 22.15 | |
| Enthalpy (kJ/kg) | 109.59 | 115.92 | 106.06 | 103.61 | |
| Density (kg/m3) | 1.08 | 1.08 | 1.08 | 1.06 | |
| Return air | Temperature (°C, DB) | 21.1 | 21.1 | 26.0 | 26.0 |
| Relative humidity (%, RH) | 54.9 | 54.9 | 39.4 | 39.4 | |
| Absolute humidity (g/kg) | 8.55 | 8.55 | 8.25 | 8.25 | |
| Enthalpy (kJ/kg) | 42.92 | 42.92 | 47.16 | 47.16 | |
| Density (kg/m3) | 1.18 | 1.18 | 1.16 | 1.16 | |
| Process air | Temperature (°C, DB) | 21.1 | 21.1 | 26.0 | 24.3 |
| Relative humidity (%, RH) | 54.9 | 54.9 | 39.4 | 45.0 | |
| Absolute humidity (g/kg) | 8.55 | 8.55 | 8.25 | 8.56 | |
| Enthalpy (kJ/kg) | 42.92 | 42.92 | 47.16 | 46.09 | |
| Density (kg/m3) | 1.18 | 1.18 | 1.16 | 1.05 | |
| Outside air | Temperature (°C, DB) | 17.4 | 17.4 | 19.5 | 19.5 |
| Relative humidity (%, RH) | 77.5 | 77.5 | 66.8 | 66.8 | |
| Absolute humidity (g/kg) | 9.60 | 9.60 | 9.44 | 9.44 | |
| Enthalpy (kJ/kg) | 41.80 | 41.80 | 43.55 | 43.55 | |
| Density (kg/m3) | 1.19 | 1.19 | 1.19 | 1.19 | |
| Air volume | Supply air (m3/h) | 598 | 695 | 598 | 547 |
| Exhaust air (m3/h) | 191 | 133 | 191 | 190 | |
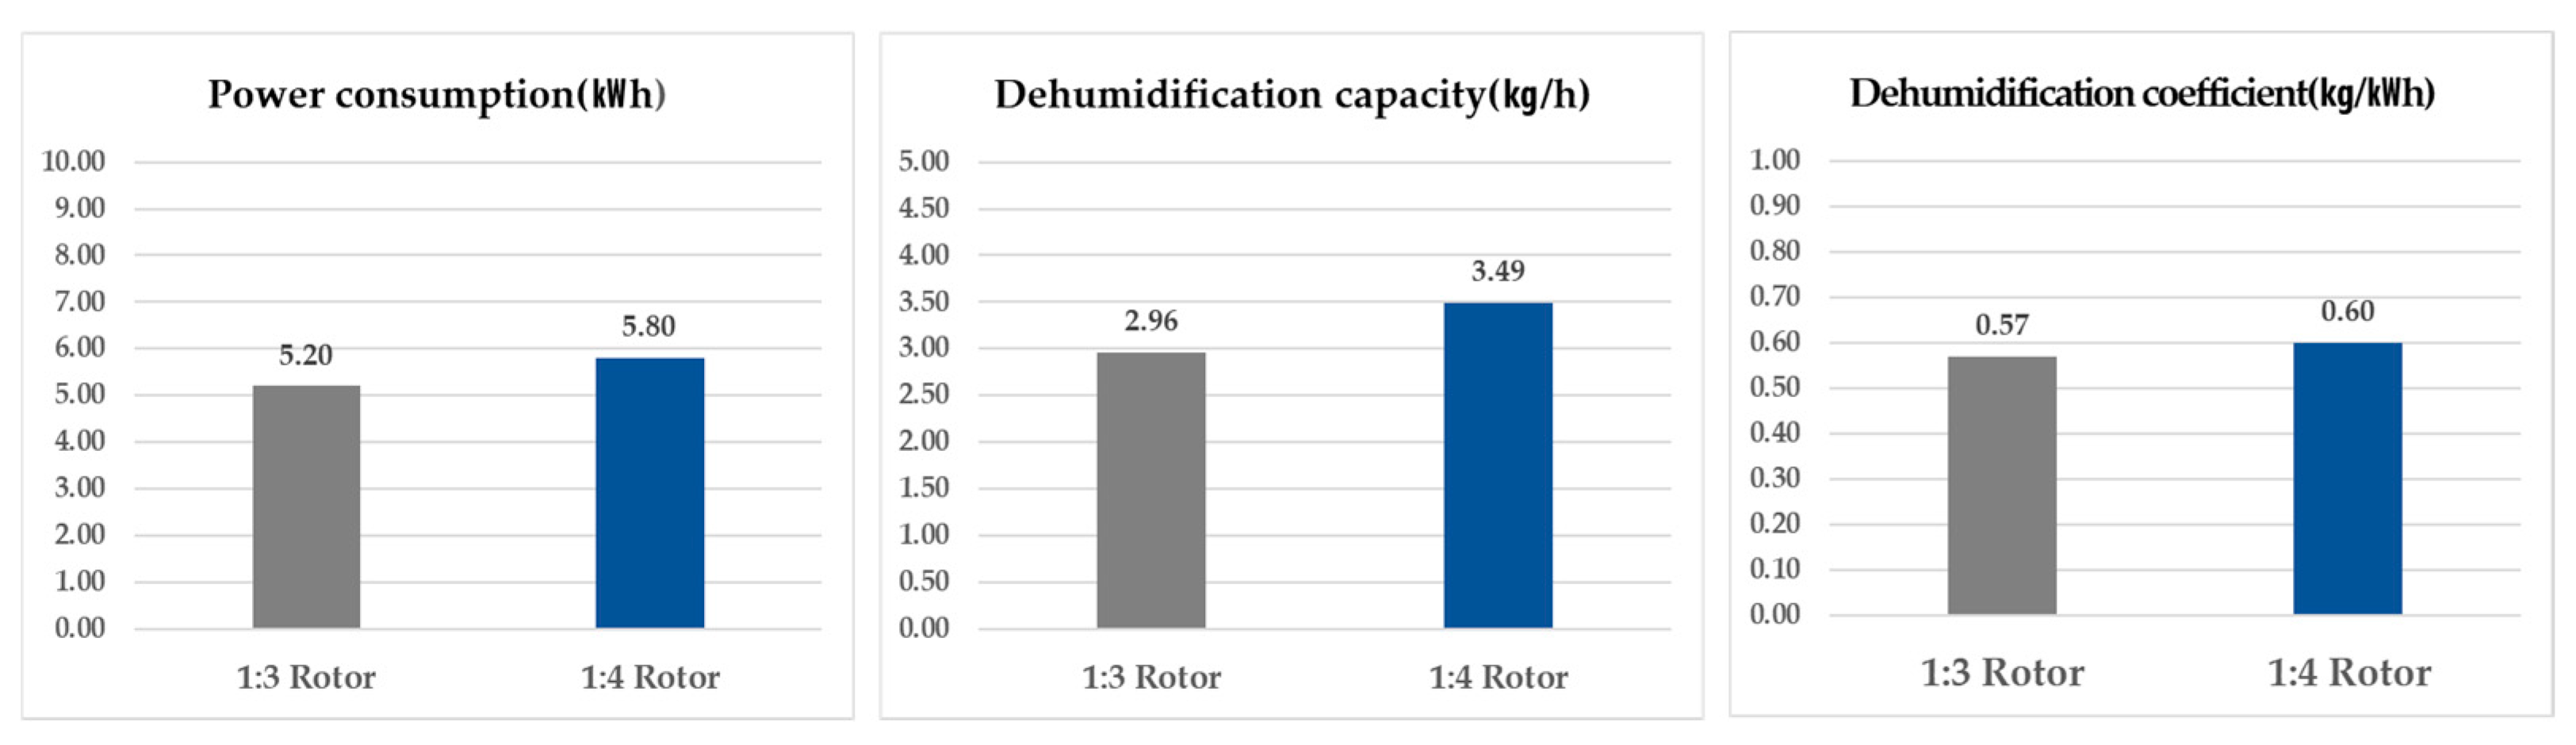
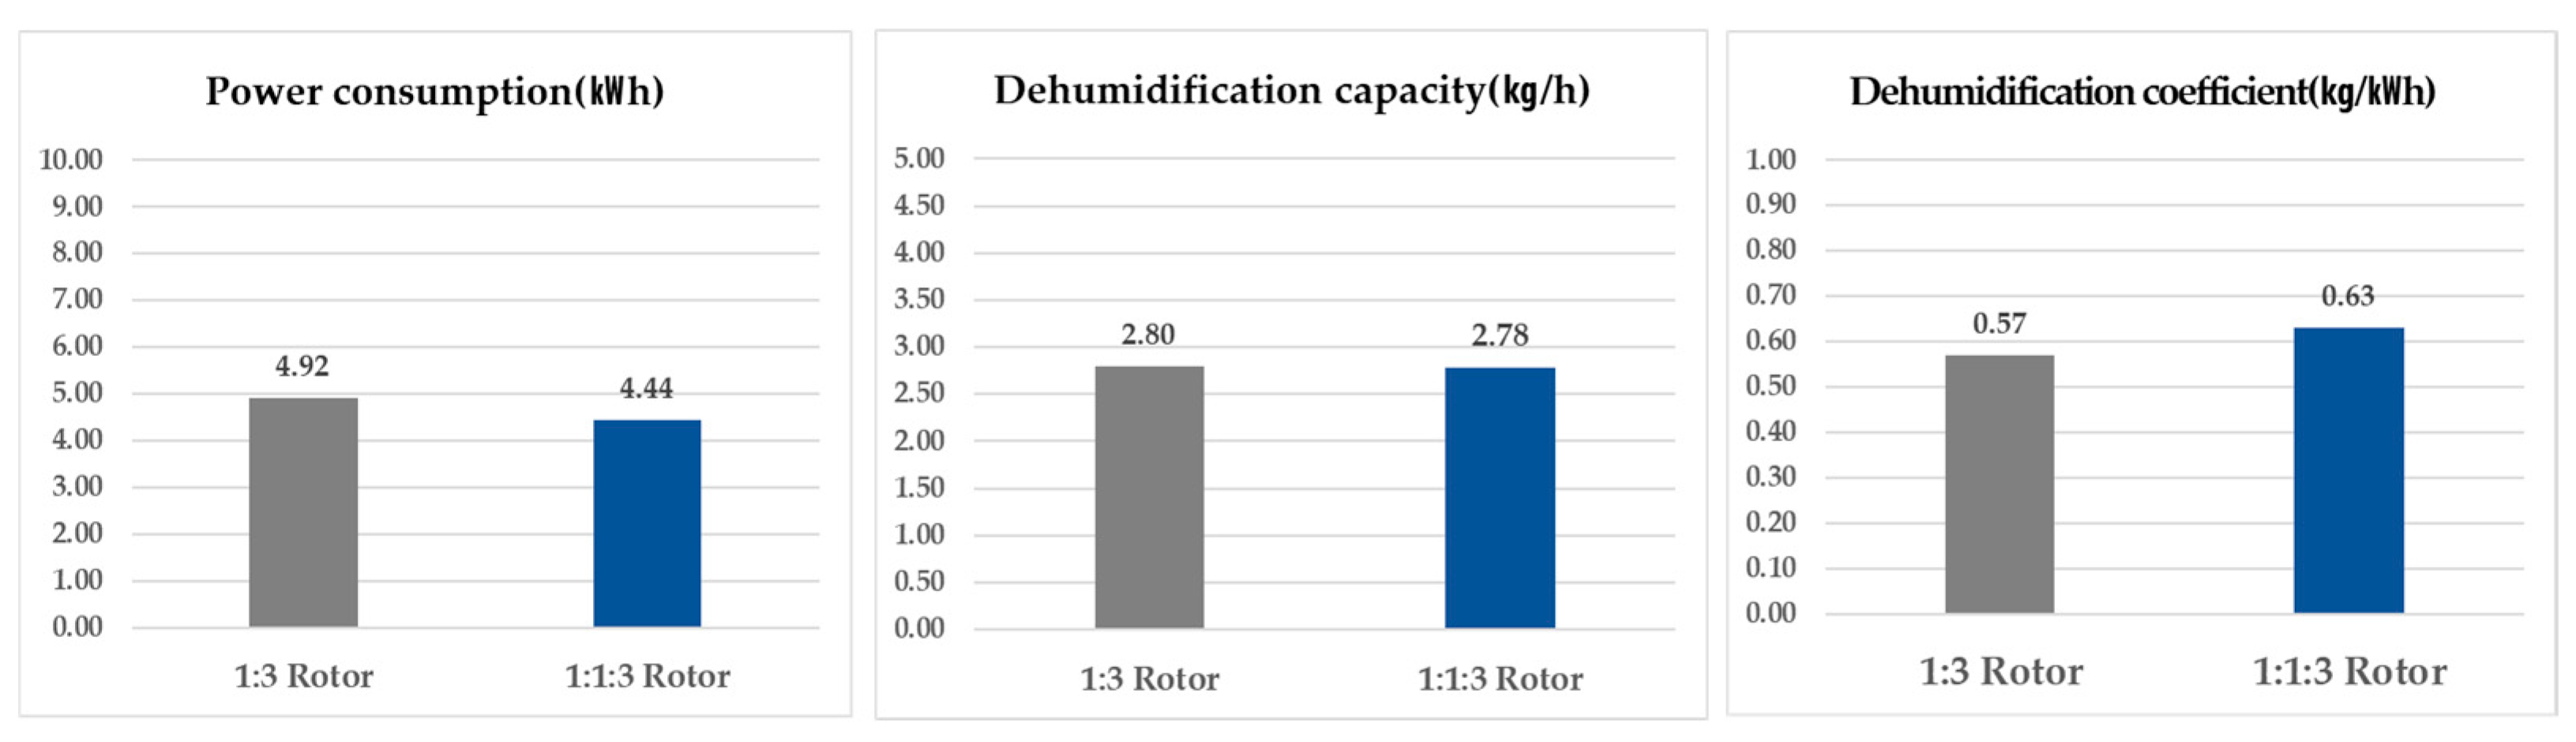
| Power consumption (kWh) | 5.20 | 5.80 | 4.92 | 4.44 | |
| Dehumidification capacity (kg/h) | 2.96 | 3.49 | 2.80 | 2.78 | |
| Dehumidification coefficient (kg/kWh) | 0.57 | 0.60 | 0.57 | 0.63 | |
| Description | Case A | Case B | |||
|---|---|---|---|---|---|
| Dehumidifier Type | Standard | Combined | Standard | Combined | |
| Operation mode | General operation | General operation | General operation | Purge | |
| Rotor area ratio [regeneration/process] or [regeneration/purge/process] | 1:3 Rotor | 1:4 Rotor | 1:3 Rotor | 1:1:3 Rotor | |
| Supply air | Temperature (°C, DB) | 37.0 | 38.3 | 41.6 | 38.5 |
| Relative humidity (%, RH) | 11.2 | 10.3 | 8.5 | 8.8 | |
| Absolute humidity (g/kg) | 4.35 | 4.30 | 4.21 | 3.72 | |
| Enthalpy (kJ/kg) | 48.4 | 49.55 | 52.66 | 48.26 | |
| Specific weight (kg/m3) | 1.14 | 1.12 | 1.11 | 1.12 | |
| Exhaust air | Temperature (°C, DB) | 37.9 | 41.3 | 43.6 | 49.9 |
| Relative humidity (%, RH) | 53.9 | 57.1 | 38.5 | 26.0 | |
| Absolute humidity (g/kg) | 22.60 | 29.04 | 21.82 | 20.74 | |
| Enthalpy (kJ/kg) | 96.19 | 116.35 | 100.15 | 103.93 | |
| Specific weight (kg/m3) | 1.10 | 1.08 | 1.08 | 1.05 | |
| Return air | Temperature (°C, DB) | 21.1 | 21.1 | 26.0 | 26.0 |
| Relative humidity (%, RH) | 54.9 | 54.9 | 39.4 | 39.4 | |
| Absolute humidity (g/kg) | 8.55 | 8.55 | 8.25 | 8.25 | |
| Enthalpy (kJ/kg) | 42.92 | 42.92 | 47.16 | 47.16 | |
| Specific weight (kg/m3) | 1.18 | 1.18 | 1.16 | 1.16 | |
| Process air | Temperature (°C, DB) | 21.1 | 21.1 | 26.0 | 24.3 |
| Relative humidity (%, RH) | 54.9 | 54.9 | 39.4 | 45.0 | |
| Absolute humidity (g/kg) | 8.55 | 8.55 | 8.25 | 8.56 | |
| Enthalpy (kJ/kg) | 42.92 | 42.92 | 47.16 | 46.09 | |
| Specific weight (kg/m3) | 1.18 | 1.18 | 1.16 | 1.05 | |
| Outside air | Temperature (°C, DB) | 17.4 | 17.4 | 19.5 | 19.5 |
| Relative humidity (%, RH) | 77.5 | 77.5 | 66.8 | 66.8 | |
| Absolute humidity (g/kg) | 9.60 | 9.60 | 9.44 | 9.44 | |
| Enthalpy (kJ/kg) | 41.80 | 41.80 | 43.55 | 43.55 | |
| Specific weight (kg/m3) | 1.19 | 1.19 | 1.19 | 1.19 | |
| Air volume | Supply air (m3/h) | 598 | 695 | 598 | 547 |
| Exhaust air (m3/h) | 191 | 133 | 191 | 190 | |
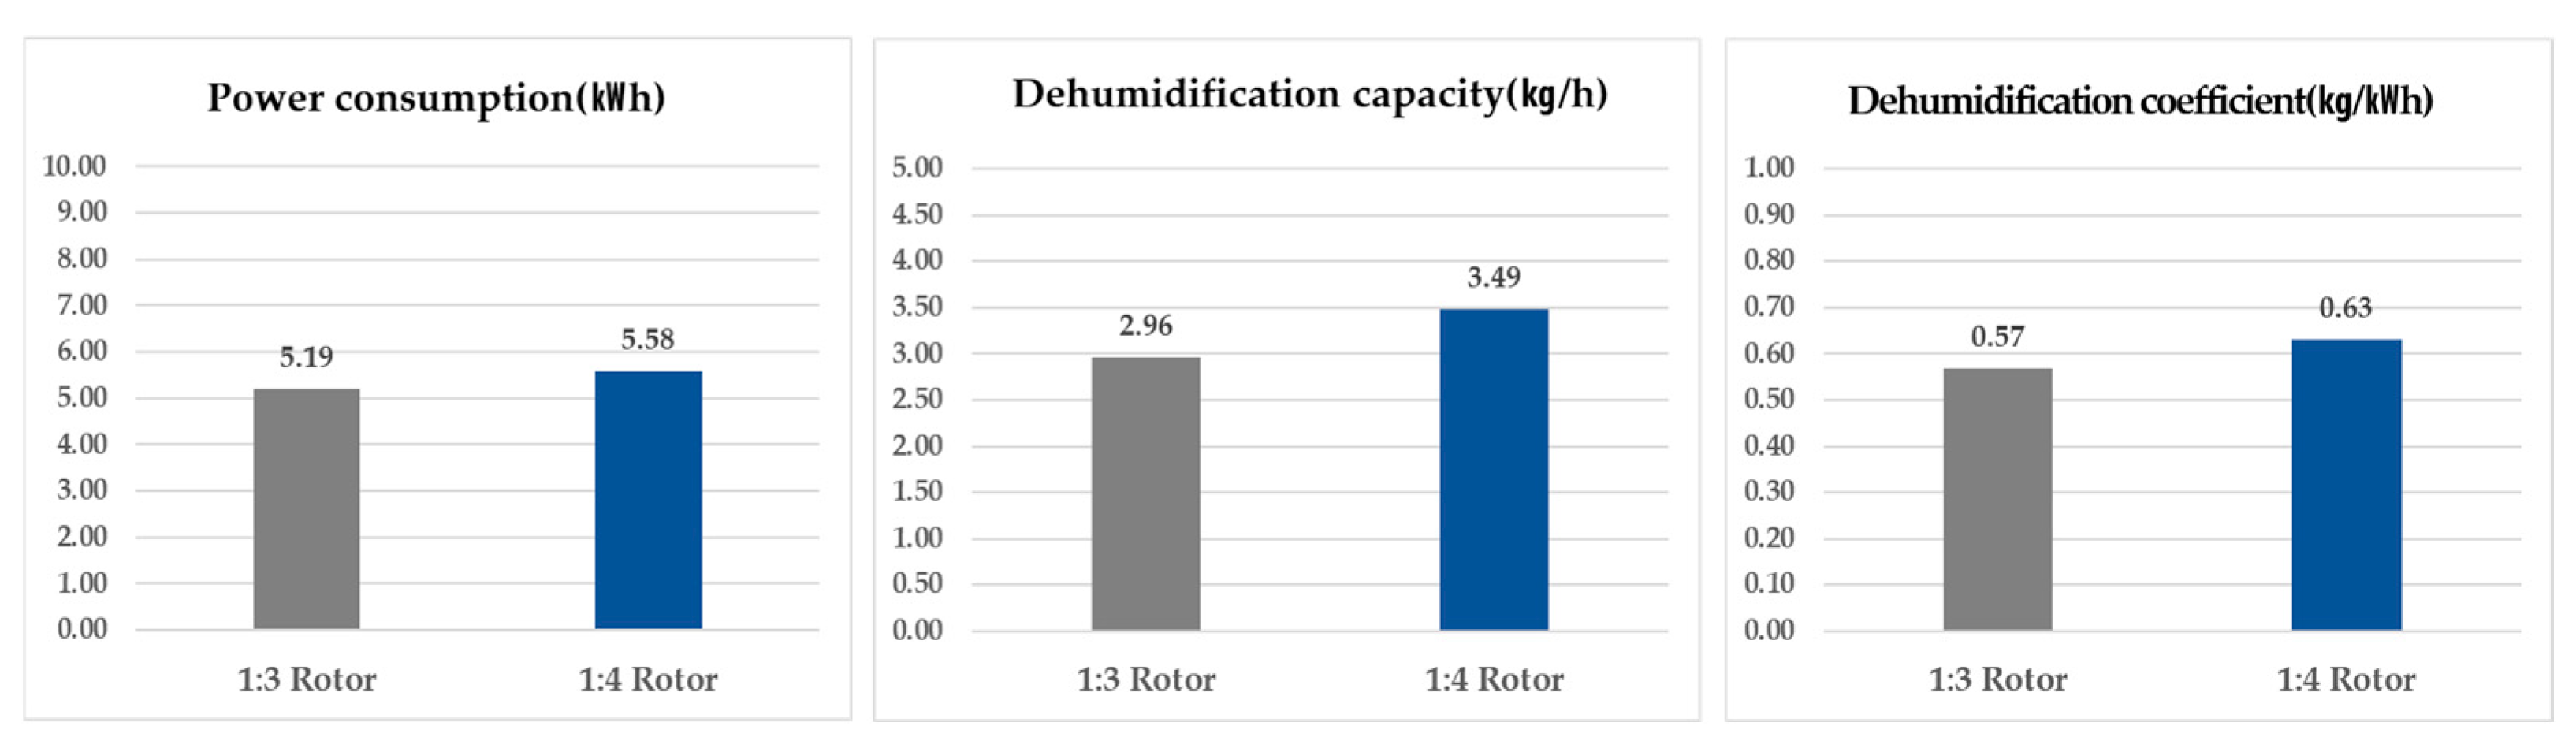
| Power Consumption (kWh) | 5.19 | 5.58 | 5.30 | 4.88 | |
| Dehumidification Capacity (kg/h) | 2.96 | 3.49 | 2.80 | 2.78 | |
| Dehumidification Coefficient (kg/kWh) | 0.57 | 0.63 | 0.53 | 0.57 | |
| Description | Power Consumption (kWh) | D/H Capacity (kg/h) | D/H Coefficient (kg/kWh) | ||||||
|---|---|---|---|---|---|---|---|---|---|
| 1:3 | 1:4 | Ratio (%) | 1:3 | 1:4 | Ratio (%) | 1:3 | 1:4 | Ratio (%) | |
| Test | 5.20 | 5.80 | 112% | 2.96 | 3.49 | 118% | 0.57 | 0.60 | 105% |
| Simulation | 5.19 | 5.58 | 108% | 2.96 | 3.49 | 118% | 0.57 | 0.63 | 111% |
| Test/Simulation | 99.8% | 96.3% | 100% | 100% | 100% | 105% | |||
| Deviation | −0.2% | −3.7% | 0% | +5.0% | |||||
| Description | Power Consumption (kWh) | D/H Capacity (kg/h) | D/H Coefficient (kg/kWh) | ||||||
|---|---|---|---|---|---|---|---|---|---|
| 1:3 | 1:4 | Ratio (%) | 1:3 | 1:4 | Ratio (%) | 1:3 | 1:4 | Ratio (%) | |
| Test | 4.92% | 4.44 | 90% | 2.80 | 2.78 | 99% | 0.57 | 0.63 | 111% |
| Simulation | 5.30% | 4.88 | 92% | 2.80 | 2.78 | 99% | 0.53 | 0.57 | 108% |
| Test/Simulation | 107.7% | 109.9% | 100% | 100% | 93.0% | 90.5% | |||
| Deviation | +7.7% | +9.9% | −7.0% | −9.5% | |||||
| Description | Case 1 | Case 2 | Case 3 | Case 4 | ||||
|---|---|---|---|---|---|---|---|---|
| 23 °C DB, 10% RH | 23 °C DB, 20% RH | 23 °C DB, 30% RH | 23 °C DB, 40% RH | |||||
| Standard | Combined | Standard | Combined | Standard | Combined | Standard | Combined | |
| Seoul | 0.20 | 0.32 | 0.24 | 0.35 | 0.26 | 0.32 | 0.25 | 0.28 |
| Daejun | 0.20 | 0.27 | 0.32 | 0.41 | 0.41 | 0.52 | 0.48 | 0.60 |
| Busan | 0.21 | 0.27 | 0.33 | 0.41 | 0.42 | 0.52 | 0.50 | 0.59 |
| Average | 0.20 | 0.29 | 0.30 | 0.39 | 0.36 | 0.45 | 0.41 | 0.49 |
| Ratio (%) | 100% | 145.0% | 100% | 130.0% | 100% | 125.0% | 100% | 119.5% |
| Gap. | +45.0% | +30.0% | +25.0% | +19.5% | ||||
 | ||||||||
| Description | Case 1 | Case 2 | Case 3 | Case 4 | ||||
|---|---|---|---|---|---|---|---|---|
| 23 °C DB, 10% RH | 23 °C DB, 20% RH | 23 °C DB, 30% RH | 23 °C DB, 40% RH | |||||
| Standard | Combined | Standard | Combined | Standard | Combined | Standard | Combined | |
| Seoul | 77,473 | 57,950 | 76,439 | 50,211 | 76,957 | 46,504 | 77,336 | 45,024 |
| Daejun | 77,716 | 58,676 | 76,224 | 50,241 | 76,743 | 46,512 | 77,078 | 44,485 |
| Busan | 75,982 | 58,026 | 74,345 | 50,457 | 74,536 | 46,412 | 72,700 | 45,274 |
| Average | 77,057 | 58,217 | 75,669 | 50,303 | 76,079 | 46,476 | 75,705 | 44,928 |
| Ratio (%) | 100% | 75.6% | 100% | 66.5% | 100% | 61.1% | 100% | 59.3% |
| Gap. | −24.4% | −33.5% | −38.9% | −40.7% | ||||
 | ||||||||
Disclaimer/Publisher’s Note: The statements, opinions and data contained in all publications are solely those of the individual author(s) and contributor(s) and not of MDPI and/or the editor(s). MDPI and/or the editor(s) disclaim responsibility for any injury to people or property resulting from any ideas, methods, instructions or products referred to in the content. |
© 2025 by the authors. Licensee MDPI, Basel, Switzerland. This article is an open access article distributed under the terms and conditions of the Creative Commons Attribution (CC BY) license (https://creativecommons.org/licenses/by/4.0/).
Share and Cite
Yang, J.; Kim, Y. Experimental Analysis of Energy Savings in a Combined Rotary Desiccant Dehumidifier with a Purge Section. Sustainability 2025, 17, 4126. https://doi.org/10.3390/su17094126
Yang J, Kim Y. Experimental Analysis of Energy Savings in a Combined Rotary Desiccant Dehumidifier with a Purge Section. Sustainability. 2025; 17(9):4126. https://doi.org/10.3390/su17094126
Chicago/Turabian StyleYang, Jeongsu, and YoungIl Kim. 2025. "Experimental Analysis of Energy Savings in a Combined Rotary Desiccant Dehumidifier with a Purge Section" Sustainability 17, no. 9: 4126. https://doi.org/10.3390/su17094126
APA StyleYang, J., & Kim, Y. (2025). Experimental Analysis of Energy Savings in a Combined Rotary Desiccant Dehumidifier with a Purge Section. Sustainability, 17(9), 4126. https://doi.org/10.3390/su17094126