Article

Soil CO2 as a Function of Soil Properties and Tillage Systems on Loamy Soil in Lithuania

by
Mykola Kochiieru
*,
Virginijus Feiza
,
Yuliia Kochiieru
and
Jonas Volungevičius
*
Institute of Agriculture, Lithuanian Research Centre for Agriculture and Forestry, Kėdainiai District, 58344 Akademija, Lithuania
*
Authors to whom correspondence should be addressed.
Sustainability 2025, 17(8), 3630; https://doi.org/10.3390/su17083630
Submission received: 19 February 2025 / Revised: 8 April 2025 / Accepted: 15 April 2025 / Published: 17 April 2025

Abstract

:
Investigations of CO2 emissions in the context of different tillage systems are relevant not only for studying the effects of climate change but also for evaluating the sustainability of soil management. To better understand the influence of soil physico-chemical properties on CO2 emissions, an experiment was conducted to measure the direct and indirect effects of these soil properties on CO2 efflux. Soil CO2 efflux is measured using a closed chamber method (LI-COR LI-8100A) under various tillage in two soil textures. Our research revealed that soil temperature, water content, soil organic carbon, total nitrogen, available phosphorus and pH significantly affected the soil–atmosphere CO2 exchange rate. Soil CO2, volumetric water content and soil temperature were higher in loam soil than in sandy loam soil. Soil CO2 efflux was 8.6% lower in conventional tillage than under reduced and no tillage. Total nitrogen and soil organic carbon contents are dependent on tillage and decreased from no tillage to conventional tillage. Soil agrochemical properties such as SOC, total nitrogen, available phosphorus, available potassium and soil pH were higher evaluated in loam soil than in sandy loam soil. The results of this research are valuable contributions to knowledge on soil management in relation to CO2 emissions on morainic loamy soil.

1. Introduction

Soil respiration is one of the main factors that help us understand soil vitality. Soil temperature and moisture content are recognized as key factors [1], positively effecting CO2 efflux from soil; they are also driven by heterotrophic respiration [2], which in turn is influenced by soil organic carbon, nutrients and microbial composition [3,4]. Soil CO2 efflux can vary annually because the fluxes respond differently to changes in environmental variables such as root volume, macroporosity, soil temperature, soil water content [5], nitrogen content and nutrient availability [6,7]. The influence of soil water content and soil temperature on CO2 release from soil plays an important role in regulating the carbon cycle [8,9].
Recent research revealed that physical processes significantly influence the response of soil respiration to soil moisture and soil temperature and demonstrate that soil temperature, moisture, structure and texture are nonlinearly related in their influence on soil respiration [10]. Soil water is one of the most important factors affecting biogeochemical processes, soil carbon storage and cycling [11].
Tillage method has been identified as one of the main determinants of CO2 emissions. The reduction in tillage during the intensification process contributed to the release of CO2 from the soil [12]. Gao et al. [13] noted that no tillage is a suitable strategy to stimulate soil carbon cycling potential by changing soil composition.
Tillage may negatively affect soil quality, in particular, by reducing the content of organic carbon in the soil [14]. However, the result of this influence strongly depends on meteorological conditions, tillage method, soil type and depth, plant residue and other factors [15].
Experimental studies by Buragiene et al. [6,16] showed that tillage increases CO2 emissions and no-tillage technology such as direct crop rotation reduce CO2 release from soil [17]; however, some researchers [18,19] found a significant increase or no difference. A reduction in soil CO2 can be associated with a decrease in soil temperature [17], while an increase in soil CO2 emission can be associated with an increase in microbial activity caused by higher soil moisture [20]. This means that environmental factors have a significant impact on soil respiration and emission processes, as soil temperature and soil moisture are the factors that have a great influence on soil CO2 emission rates.
An experimental study by Buragiene et al. [16] demonstrated that soil temperature, air temperature and precipitation significantly influenced soil CO2 efflux and showed a negative effect of soil temperature on soil CO2 efflux. Another experimental study conducted by Buragiene et al. [6] showed a positive effect of plant available phosphorus and plant available potassium on soil CO2 emissions.
Soil pH is of great importance for the mineralisation of organic matter, intensity of microbiological processes, decomposition of minerals and other chemical and physical processes occurring in the soil [21,22]. Reduction in soil tillage resulted in increased accumulation of organic matter and had a positive effect on humus content in the soil [23].
At the location of the long-term field experiments in Central Lithuania, the predominant soil type is Cambisol of morainic origin. This soil type occupies about 17% of the Lithuanian territory and is actively used in agriculture [24]. Worldwide, Cambisols cover about 1.5 billion hectares [25].
The lack of published works with information reflecting the influence of soil properties acting as direct and indirect factors on soil CO2 emission under contrasting tillage systems makes this issue very relevant to the climate change topic.
In summary, the influence of different factors under different tillage systems on CO2 emissions is a very complex task, so it is necessary to comprehensively analyse the role of physical and chemical processes that influence the dynamics of CO2 processes in soil to understand the main mechanisms. The aim of this paper is to determine the influence of direct and indirect factors on CO2 release from soil under different tillage methods’ applications to identify the CO2 emission rate from morainic loamy soil as an indicator of sustainable soil management.

2. Materials and Methods

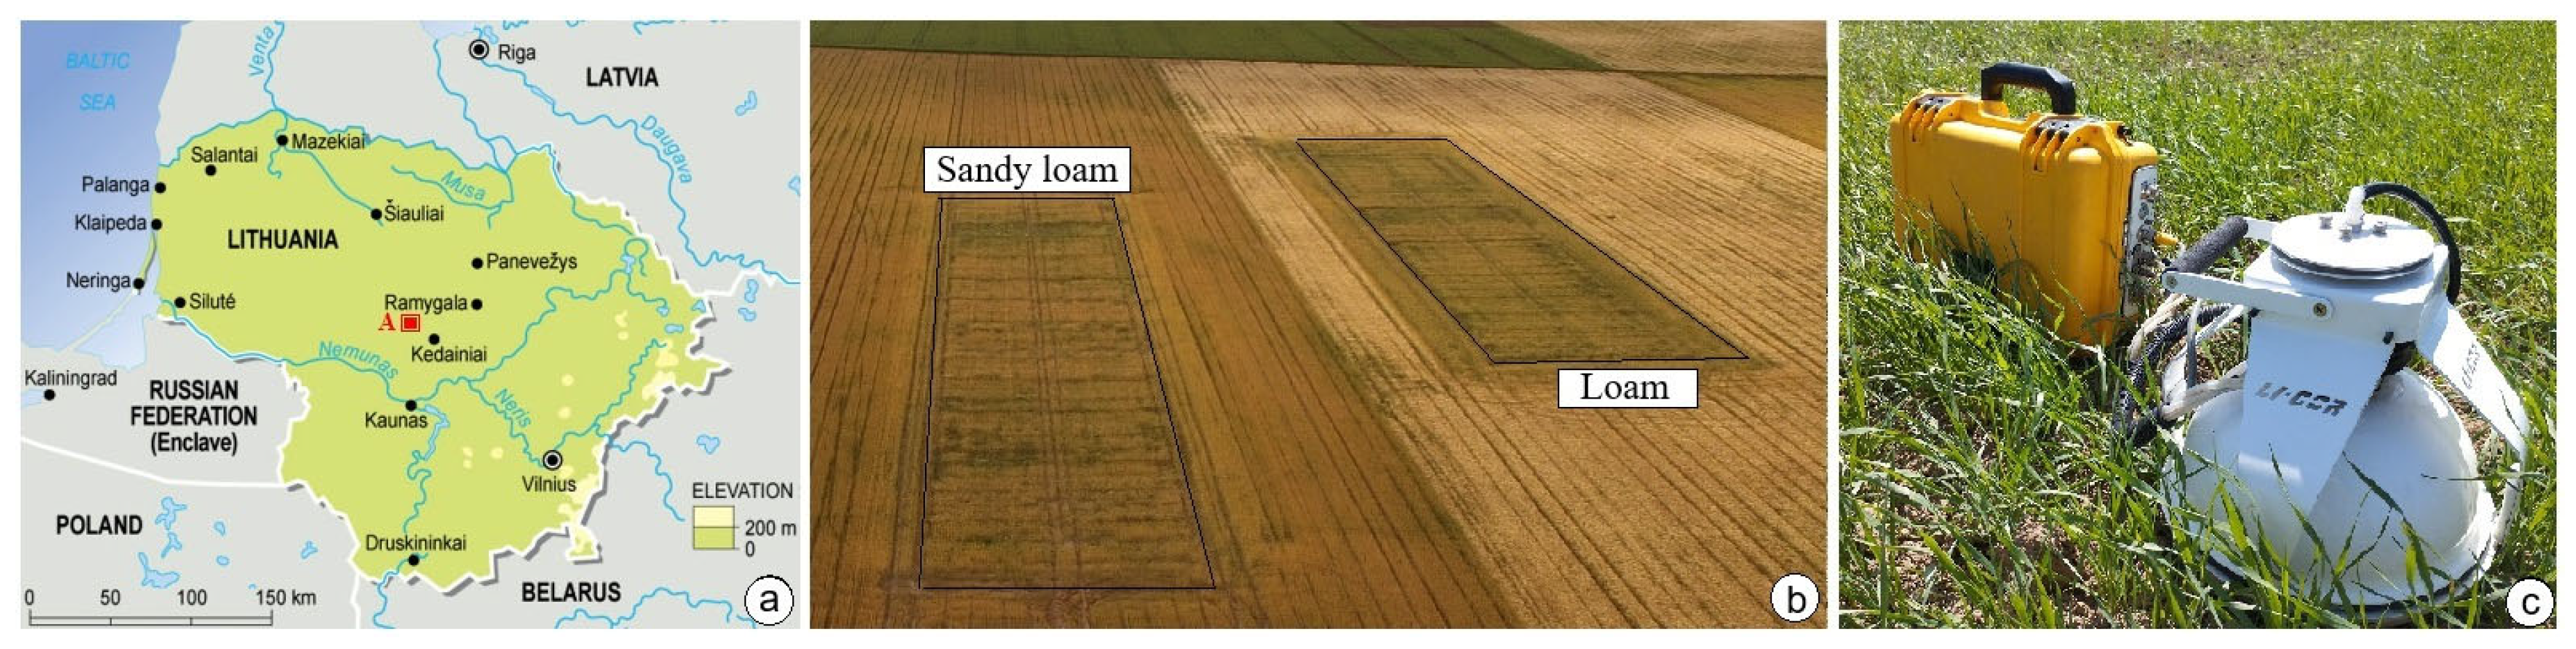
2.1. Description of the Site and Soil

The study was conducted as a long-term field experiment in Central Lithuania (Figure 1a). The local soil site is categorized as Cambisol (loamy, drained) according to the WRB [25]. Soil texture composition was determined using pipette method according to the FAO (Table 1).
Different soil textures (sandy loam and loam), three soil tillage systems (conventional, reduced and no tillage) and a crop residue management system (crop residue removed) in combination with mineral NPK fertilizers were used in the experiment. Fertilizers were applied during pre-sowing tillage. Conventional tillage involved stubble cultivation and mouldboard ploughing 3 weeks after stubble cultivation. Reduced tillage involved stubble cultivation and herbicide glyphosate application 3 weeks after crop harvesting. Direct drilling was carried out with a disc seed-drill. This seed drill was used in all treatments for sowing. The size of each individual treatment was 3.3 m by 20 m. Long-term experiments were described by Kochiieru et al. [24]. A detailed research methodology is presented in Figure 1b.

2.2. Meteorological Conditions

The annual mean air temperature was 7.5 °C, and the mean air temperature during the growing season was 14.7 °C. Total precipitation for the growing season in 2021 was 357.4 mm, and total precipitation for the year was 565.9 mm (data from Dotnuva meteorological station).

2.3. Agrochemical Analysis

Disturbed soil samples (two field replications) were taken from the 0–10 and 10–20 cm soil depths randomly by using a steel auger in sandy loam soil and loam soil from the same location where CO2 efflux measurements were taken in April 2021. All samples were air-dried, visible roots and plant residues were manually removed. Then, the samples were crushed, sieved through a 2 mm sieve and homogeneously mixed. For chemical analyses soil samples were passed through a 0.25 mm sieve. Soil pHKCl was identified using an AS-3010D potentiometer in 1M KCl (1:2.5, w:v). Soil organic carbon was determined by the titrimetric (classical) method of Tyurin [26]. Available phosphorus and available potassium were determined by the Egner–Riehm–Domingo (A-L) method [27]. Total nitrogen was analysed by the Dumas method using a Vario EL III CNS autoanalyzer [28]. The data were averaged for the 0–20 cm soil depth.

2.4. Research of CO2 Efflux from Soil, Temperature and Humidity

To explore CO2 from soil, 3 cylinders (20 cm diameter) were prepared at fixed locations on the plot. The field crop in the measurement site in 2021 was winter wheat (Triticum aestivum L.). Soil water content and soil temperature were recorded using portable sensor HH2 WET. Soil parameters were determined at the same site and time as measurements of soil CO2 efflux were proceeded. Soil CO2 efflux (µmol m−2 s–1) was measured 5 times per growing season (from 29 April to 4 August 2021) by using a closed CO2 efflux measurement chamber LI-8100A (Figure 1c) Automated Soil CO2 Flux System (LI-COR Inc., Lincoln, NE, USA).

2.5. Statistical Analysis

SAS 7.1 statistical software package was used to calculate mean values and standard errors. Data were compared using Duncan’s multiple range tests at probability levels of p < 0.01 and p < 0.05. Correlation–regression analysis was also performed. Path analysis was performed to process statistically data collected [29]. The principal diagram for path coefficient analysis (Figure 2) was developed in line with the study described by Kochiieru et al. [30].

3. Results

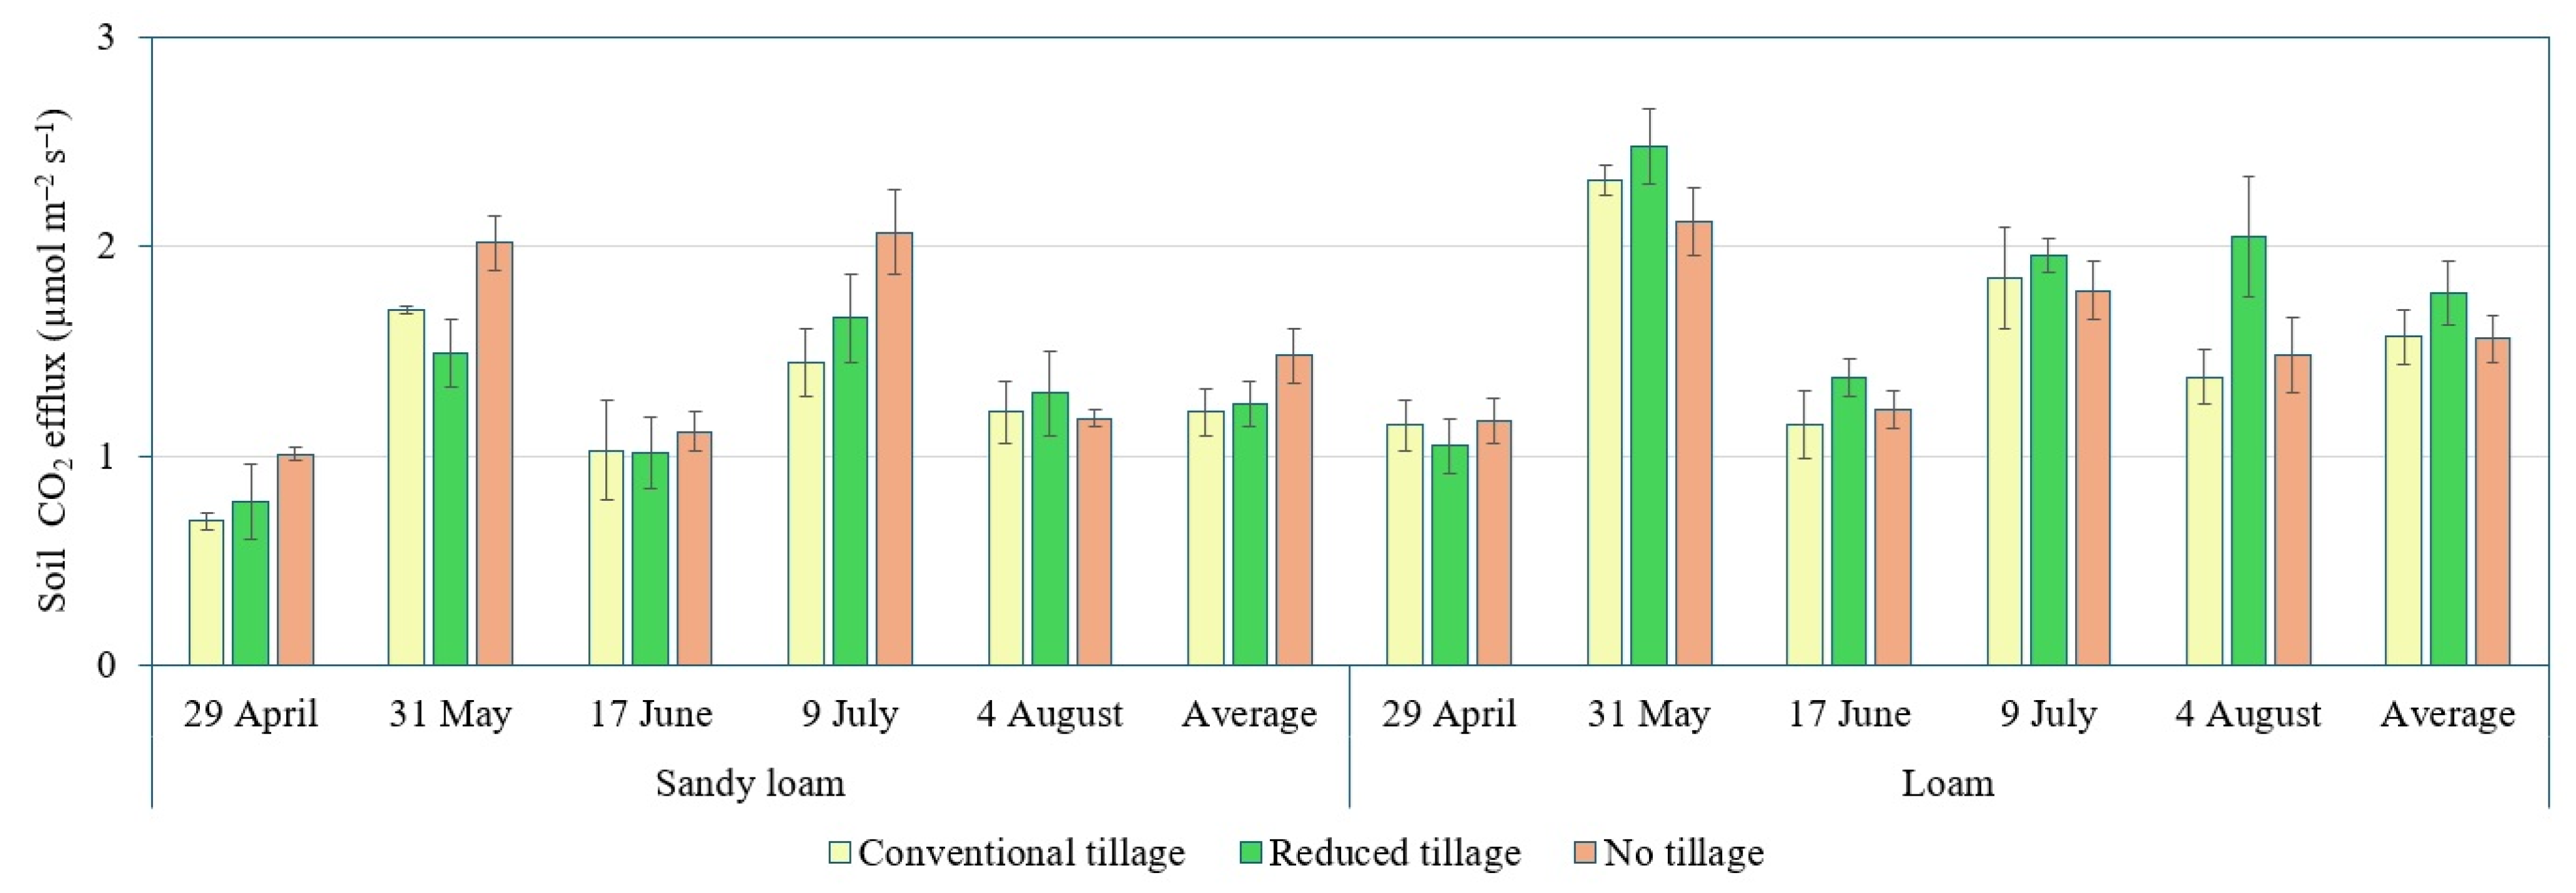
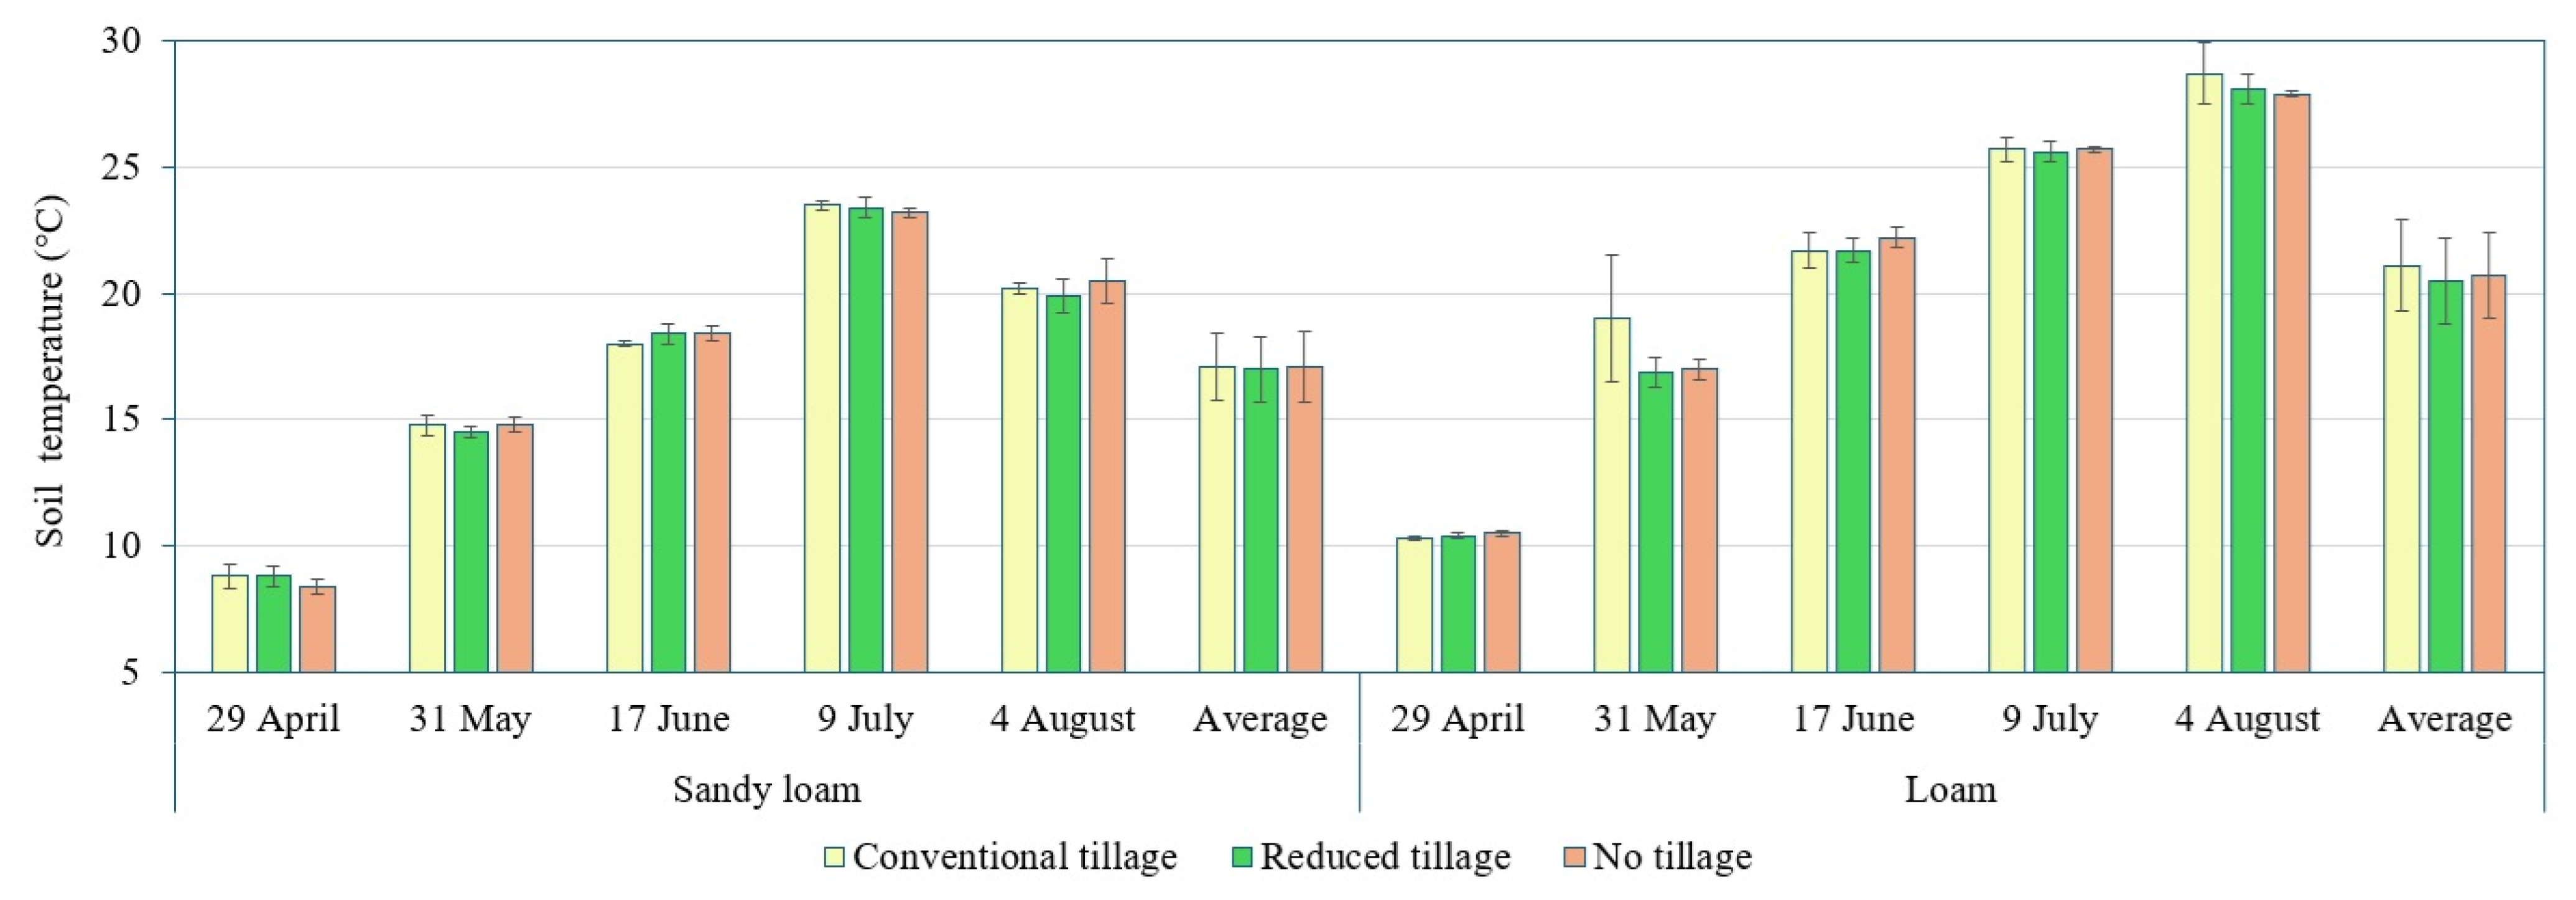
3.1. The Impact of Tillage and Soil Texture on CO2 Efflux, Volumetric Water Content and Soil Temperature

The influence of soil texture on CO2 efflux and soil temperature was statistically significant at p < 0.004, while the effect on volumetric water content was not significant. The effect of tillage on soil CO2 efflux, soil temperature and soil water content was also not significant (Table 2).
Soil CO2 efflux was 20.1% higher in loam soil than in sandy loam soil. Under conventional tillage, soil CO2 efflux was 8.6% lower than under reduced tillage and no tillage. Soil temperature was 18.3% lower in sandy loam soil than on loam. Soil volumetric water content was 5.1% higher in loam soil than in sandy loam soil (Table 2).

3.2. Change in Soil CO2 Efflux, Soil Temperature and Moisture

Trends of CO2 efflux, soil temperature and volumetric water content in different soil texture and tillage are presented in Figure 3, Figure 4 and Figure 5. Soil CO2 efflux increased gradually by reaching its maximum from late May to early July under various tillage treatments in both soil textures. Soil CO2 content amounted to 0.69–2.07 µmol CO2 m–2 s–1 in sandy loam soil and 1.05–2.48 µmol CO2 m–2 s–1 in loam soil (Figure 3).
Soil CO2 efflux, average across data, tended to decrease in the following order: no tillage > reduced tillage > conventional tillage in sandy loam soil and reduced tillage > conventional tillage > no tillage in loam soil (Figure 3).
Soil temperature varied from 8.4 °C to 23.5 °C in sandy loam soil and from 10.3 °C to 28.7 °C in loam soil (Figure 4).
Average soil temperature tended to increase in the following order: reduced tillage (17.01 °C) < conventional tillage (17.05 °C) < no tillage (17.07 °C) in sandy loam soil and reduced tillage (20.52 °C) < no tillage (20.65 °C) < conventional tillage (21.08 °C) in loam soil (Figure 4).
Soil volumetric water content varied from 5.6% to 18.3% in sandy loam soil and from 6.0% to 18.0% in loam soil. Average soil volumetric water content, tended to decrease in the following order: no tillage (12.0%) > conventional tillage (11.3%) > reduced tillage (10.2%) in sandy loam soil and reduced tillage (12.2%) > no tillage (11.8%) > conventional tillage (11.5%) in loam soil (Figure 5).

3.3. The Interaction of Soil CO2 Efflux with Volumetric Water Content and Soil Temperature

The correlation matrix for different soil textures for CO2 content, soil temperature and volumetric water content for different tillage are presented in Table 3.
A significant correlation between soil CO2 efflux and soil temperature during growing season was found in reduced tillage (p < 0.01—sandy loam and p < 0.05—loam) and under conventional tillage (p < 0.05) in sandy loam soil. Significant positive relationship between soil CO2 efflux and soil temperature was observed under no tillage (p < 0.05—sandy loam and p < 0.01—loam), under reduced tillage (p < 0.01—sandy loam and loam) and under conventional tillage (p < 0.01—sandy loam and loam). No correlations between volumetric water content and soil temperature were found under all tillage systems in sandy loam and loam (Table 3).

3.4. Soil Chemical Properties

Intensive tillage accelerates the degradation of soil organic matter. Which leads to increased CO2 emissions into the atmosphere. The influence of soil texture on total nitrogen (N), soil organic carbon (SOC), available phosphorus (P2O5) and soil pH value (pH) was statistically significant at p = 0.0001, while the effect on C/N was not significant. The effect of soil texture on available phosphorus was statistically significant at p < 0.05, while the effect on available potassium (K2O) was not significant. The effect of tillage on SOC, N, P2O5, K2O, C/N and pH was not significant (Table 4).
Averaged SOC and total N, tended to decrease in the following order: no tillage (8.6 g kg–1 and 1.00 g kg–1) > conventional tillage (8.2 g kg–1 and 0.94 g kg–1) > reduced tillage (7.8 g kg–1 and 0.91 g kg–1) in sandy loam soil and no tillage (12.5 g kg–1 and 1.46 g kg–1) > reduced tillage (11.4 g kg–1 and 1.36 g kg–1) > conventional tillage (11.1 g kg–1 and 1.21 g kg–1) in loam soil, respectively. Available phosphorus content in loam soil (0.171–0.273 g kg–1) was 31.7% higher than in sandy loam soil (0.265–0.370 g kg–1) under various tillage treatments. Available potassium content in sandy loam soil (0.167–0.228 g kg–1) was 15.8% lower than in loam soil (0.180–0.263 g kg–1) under various tillage treatments within 0–20 cm soil depth. Average available phosphorus and potassium content from 0 to 20 cm depth tended to decrease in the following order: reduced tillage (0.273 g kg–1 and 0.228 g kg–1) > no tillage (0.216 g kg–1 and 0.181 g kg–1) > conventional tillage (0.171 g kg–1 and 0.167 g kg–1) in sandy loam soil and no tillage (0.370 g kg–1 and 0.263 g kg–1) > reduced tillage (0.332 g kg–1 and 0.241 g kg–1) > conventional tillage (0.265 g kg–1 and 0.180 g kg–1) in loam soil, respectively (Table 4).
The pH values observed from 0 to 20 cm soil depth were indicated to be moderately acidic (range from 5.5 to 6.0) in sandy loam soil and neutral (range from 6.7 to 7.0) in loam. Soil pH in loam soil was 17.4% higher than in sandy loam (Table 4).

3.5. The Interaction of CO2 Efflux with Different Soil Environmental Properties

The correlation matrix of soil quality parameters is presented in Table 5. Soil CO2 efflux was positively related to soil environmental properties. Soil temperature and volumetric water content closely positively correlated with soil CO2 efflux (r = 0.80 and r = 0.77; p < 0.01; Table 5 and Table 6) and acted the most strongly as an indirect factor for soil CO2 efflux (Table 6). Total nitrogen positively correlated with soil organic carbon (r = 0.99; p < 0.01; Table 5). Soil organic carbon content closely positively correlated with soil CO2 efflux (r = 0.81; p < 0.01; Table 5 and Table 6) and acted as a direct dominant factor for soil CO2 efflux (Px3y = −2.968; Table 6). Total nitrogen content closely correlated with soil CO2 efflux (r = 0.82; p < 0.01; Table 5 and Table 6) and acted the most strongly as an indirect factor for soil CO2 (Table 6).
Content of available phosphorus positively correlated with soil CO2 efflux (r = 0.66; p < 0.05; Table 5 and Table 6) and acted as a direct dominant factor for soil CO2 (Px5y = –2.697; Table 6). Content of available potassium positively correlated with soil CO2 efflux (but not significant, r = 0.43, Table 5 and Table 6), while acting as an indirect factor for soil CO2 efflux (Table 6). Soil pH positively correlated with soil CO2 efflux (r = 0.83; p < 0.01; Table 5 and Table 6), and also apparently acted as an indirect factor (Table 6).

4. Discussion

The amount of CO2 released from cultivated soils is a key process to understanding carbon dynamics in soils with different textures, which helps us understand soil vitality.
Our studies have shown that, although CO2 emissions increase significantly with tillage, loam soil has a higher CO2 efflux concentration than sandy loam soil. This suggests that in the case of tillage on different soil textures, CO2 emissions are a consequence of soil viability with some impact on climate change.
Soil CO2 emissions are very dynamic because of their sensitivity to changes in environmental variables such as soil moisture content, soil temperature and soil environmental properties. Assessing carbon dynamics in different ecosystems, the most suitable approach is to quantify soil CO2 emissions. It should also be considered that even between the main parameters of regulation of soil CO2 emissions there are dynamic dependencies on soil temperature [31], which are indicators of CO2 release from soils, and on soil water content [16]. Lazdins and Lupikis [2] wrote that temperature is one of the most influential factors affecting CO2 fluxes (both soil heterotrophic respiration and ecosystem respiration). In contrast, Clark et al. [32] reported that soil moisture and temperature, which are typical influencing factors on soil CO2 efflux, have relatively weak effects on soil respiration rates. Our results showed that soil temperature and volumetric water content resulted in soil CO2 efflux increase under different tillage systems on Cambisol of morainic origin (Table 5 and Table 6). A similar trend was confirmed by the results of Tavares et al. [33]. In addition, soil CO2 emission, which depends on soil temperature [7] and water content [24], is the result of plant root respiration, microbial activities [34] and organic matter decomposition [35]. Increased soil water content affects biological activity in the soil as well as root growth and respiration. Yadav et al. [20] reported that soil moisture is an important factor that affects soil organisms by changing soil porosity, which in turn affects soil CO2 emissions.
Based on the response of CO2 release from soil to soil temperature and soil moisture, the values were established, related to soil properties such as total nitrogen, SOC, available phosphorus, available potassium and soil pH. The results published by Li et al. [7] indicated that nitrogen had a positive impact on the release of CO2 from soil, which confirms our results as well (Table 5 and Table 6). Buragiene et al. [6] found a strong correlation between soil pH (range from 6.7 to 7.0) with CO2 emission from soil at the 0–15 cm soil depth under different tillage, which also confirms our results (soil pH with range from 5.5 to 7.0) (Table 5 and Table 6). Soil pH and fine texture were the strong factors for CO2 efflux in forest soil [4]. Reth et al. [36] and Chappell and Johnson [37] found that soil pH is significantly correlated with CO2 emission, but Li et al. [7] did not register the relationship between soil pH (pH > 8.0) and CO2 from soil under conventional and no tillage. Reth et al. [36] indicated that, for the same soil water content and soil temperature, the soil with higher pH values r has released more CO2 from the soil. An experimental study by Buragiene et al. [6] showed that there was a strong positive significant correlation between soil CO2 emissions and plant available phosphorus, and a correlation was also found between soil CO2 and plant available potassium (from 0.072 g kg–1 to 0.089 g kg–1), which are in line with our results as well (Table 5 and Table 6).
Soil physico-chemical properties, which can change quickly in response to anthropogenic disturbances, are considered good indicators of soil health. Soil organic carbon content was higher under no tillage than under conventional and reduced tillage, highlighting the potential of conservation agriculture for sustainable soil health [38].
Studies published by Ferduch and Paul [39] and Sun et al. [40] revealed the linkage of soil CO2 dynamics to changes in soil moisture, which, in turn, affected biological and chemical processes. Among soil chemical properties, such indicators as SOC, pH and soil nutrient status have been found to affect carbon emission from the soil [41]. Liptzin et al. [42] demonstrated that SOC especially is closely related to soil health. According to our study, soil organic carbon content, available phosphorus, total nitrogen and pH were also closely related to soil CO2 efflux (Table 5 and Table 6). This confirms the statement that soil CO2 emission may be used as an indicator of soil health evaluation under contrasting soil management systems.

5. Conclusions

Soil CO2 efflux, soil temperature and volumetric water content were higher in loam soil than in sandy loam soil. Soil agrochemical properties such as soil organic carbon, total nitrogen, available phosphorus, available potassium and soil pH in loam soil were higher evaluated in loam soil than in sandy loam soil. Soil organic carbon and total nitrogen content depended on tillage and increased in direction from conventional tillage towards no tillage.
Our study revealed that soil organic carbon and available phosphorus had a direct effect on soil CO2 efflux, while soil temperature, volumetric water content, total nitrogen and pH had an indirect effect, in spite of how closely related they were to soil CO2 efflux.
Soil temperature, volumetric water content, soil organic carbon, total nitrogen, available phosphorus and pH significantly influenced the soil environment–atmosphere CO2 exchange rate. Soil CO2 efflux was dependent on tillage. It decreased from no tillage to conventional tillage application. This phenomenon can be explained by more favourable soil conditions for soil biota, root development and soil aggregates’ stability representing the soil index of the soil health environment.
The results of this paper can be used to highlight CO2 as an indicator of the good condition of soil of morainic origin, which is currently very important.

Author Contributions

Conceptualization, M.K.; methodology, M.K.; investigation, M.K., V.F. and J.V.; writing—original draft preparation, M.K. and Y.K.; writing—review and editing, M.K. and J.V.; visualization, M.K. and Y.K.; project administration, V.F.; funding acquisition, V.F. All authors have read and agreed to the published version of the manuscript.

Funding

This study was partly supported by the research programme “Productivity and sustainability of agricultural and forest soils” implemented by the Lithuanian Research Centre for Agriculture and Forestry. This study was partly supported by EJP SOIL project “Mechanisms underlying TRAde-offs between Carbon sequestration, greenhouse gas emissions and nutrient losses in Soils under conservation agriculture in Europe (TRACE-Soils) as part of Horizon 2020 Programme”.

Data Availability Statement

The data presented in this study are available on request from the corresponding authors.

Conflicts of Interest

We declare that we have no know competing financial interests or personal relationships that could have appeared to influence the work reported in this study.

References

  1. Nissan, A.; Alcolombri, U.; Peleg, N.; Galili, N.; Jimenez-Martinez, J.; Molnar, P.; Holzner, M. Global warming accelerates soil heterotrophic respiration. Nat. Commun. 2023, 14, 3452. [Google Scholar] [CrossRef] [PubMed]
  2. Lazdiņš, A.; Lupiķis, A. LIFE REstore project contribution to the greenhouse gas emission accounts in Latvia. In Sustainable and Responsible After-Use of Peat Extraction Areas; Priede, A., Gancone, A., Eds.; Baltijas Krasti: Riga, Latvia, 2019; pp. 21–54. [Google Scholar]
  3. Rodtassana, C.; Unawong, W.; Yaemphum, S.; Chanthorn, W.; Chawchai, S.; Nathalang, A.; Brockelman, W.Y.; Torngern, P. Different Responses of Soil Respiration to Environmental Factors across Forest Stages in a Southeast Asian Forest. Ecol. Evol. 2021, 11, 15430–15443. [Google Scholar] [CrossRef] [PubMed]
  4. Heger, A.; Becker, J.N.; Vasconez, L.K.; Holl, D.; Eschenbach, A. Soil texture and pH affect soil CO2 efflux in hardwood floodplain forests of the lower middle Elbe River. Eur. J. Soil Sci. 2022, 74, e13331. [Google Scholar] [CrossRef]
  5. Yang, X.; Wang, R.; Yang, M.; Liu, Q.; Zhang, W.; Guo, S. Differential responses of soil CO2 dynamics along soil depth to rainfall patterns in the Chinese Loess Plateau. Agric. Ecosyst. Environ. 2025, 378, 109306. [Google Scholar] [CrossRef]
  6. Buragienė, S.; Šarauskis, E.; Romaneckas, K.; Adamavičienė, A.; Kriaučiūnienė, Z.; Avižienytė, D.; Marozas, V.; Naujokienė, V. Relationship between CO2 emissions and soil properties of differently tilled soils. Sci. Total Environ. 2019, 662, 786–795. [Google Scholar] [CrossRef]
  7. Li, Z.; Zhang, Q.; Li, F.; Li, Z.; Qiao, Y.; Du, K.; Yue, Z.; Tian, C.; Leng, P.; Cheng, H.; et al. Soil CO2 emission reduction with no-tillage and medium nitrogen fertilizer applications in semi-humid maize cropland in North China Plain. Eur. J. Agron. 2023, 147, 126838. [Google Scholar] [CrossRef]
  8. Chen, S.; Zhang, M.; Zou, J.; Hu, Z. Relationship between Basal Soil Respiration and the Temperature Sensitivity of Soil Respiration and Their Key Controlling Factors across Terrestrial Ecosystems. J. Soils Sediments 2022, 22, 769–781. [Google Scholar] [CrossRef]
  9. Dhital, D.; Manandhar, R.; Manandhar, P.; Maharjan, S. Soil CO2 Efflux Dynamics and Its Relationship with the Environmental Variables in a Sub-Tropical Mixed Forest. Open J. For. 2022, 12, 312–336. [Google Scholar] [CrossRef]
  10. Huang, Z.D.; Liu, Y.; Huang, P.F.; Li, Z.Y.; Zhang, X.X. A new concept for modelling the moisture dependence of heterotrophic soil respiration. Soil Biol. Biochem. 2023, 185, 109147. [Google Scholar] [CrossRef]
  11. Li, J.; Wu, J.; Yu, J.; Wang, K.; Li, J.; Cui, Y.; Shangguan, Z.; Deng, L. Soil enzyme activity and stoichiometry in response to precipitation changes in terrestrial ecosystems. Soil Biol. Biochem. 2024, 191, 109321. [Google Scholar] [CrossRef]
  12. Buivydiene, A.; Deveikyte, I.; Versuliene, A.; Feiza, V. Tillage Practices Effect on Root Distribution and Variation of Soil CO2 Emission under Different Cropping Strategies. Agronomy 2024, 14, 1768. [Google Scholar] [CrossRef]
  13. Gao, Y.; Liang, A.; Zhang, Y.; Huang, D.; McLaughlin, N.; Zhang, Y.; Wang, Y.; Chen, X.; Zhang, S. Effect of tillage practices on soil CO2 emissions, microbial C-fixation, and C-degradation functional gene abundance in Northeast China. J. Soils Sediments 2023, 23, 446–458. [Google Scholar] [CrossRef]
  14. Krauss, M.; Wiesmeier, M.; Don, A.; Cuperus, F.; Gattinger, A.; Gruber, S.; Haagsma, W.K.; Peigne, J.; Chiodelli Palazzoli, M.; Schulz, F.; et al. Reduced tillage in organic farming affects soil organic carbon stocks in temperate Europe. Soil Tillage Res. 2022, 216, 105262. [Google Scholar] [CrossRef]
  15. Silva, B.O.; Moitinho, M.R.; Santos, G.A.A.; Teixeira, D.D.B.; Fernandes, C.; La Scala, N., Jr. Soil CO2 emission and short-term soil pore class distribution after tillage operations. Soil Tillage Res. 2019, 186, 224–232. [Google Scholar] [CrossRef]
  16. Buragienė, S.; Šarauskis, E.; Romaneckas, K.; Sasnauskienė, J.; Masilionytė, L.; Kriaučiūnienė, Z. Experimental analysis of CO2 emissions from agricultural soils subjected to five different tillage systems in Lithuania. Sci. Total Environ. 2015, 514, 1–9. [Google Scholar] [CrossRef]
  17. Lu, X.; Lu, X.; Tanveer, S.; Wen, X.; Liao, Y. Effects of tillage management on soil CO2 emission and wheat yield under rain-fed conditions. Soil Res. 2016, 54, 38–48. [Google Scholar] [CrossRef]
  18. Zhang, Z.; Chen, J.; Liu, T.; Cao, C.; Li, C. Effects of nitrogen fertilizer sources and tillage practices on greenhouse gas emissions in paddy fields of central China. Atmos. Environ. 2016, 144, 274–281. [Google Scholar] [CrossRef]
  19. Huang, Y.; Ren, W.; Wang, L.; Hui, D.; Grove, J.H.; Yang, X.; Tao, B.; Goff, B. Greenhouse gas emissions and crop yield in no-tillage systems: A meta analysis. Agric. Ecosyst. Environ. 2018, 268, 144–153. [Google Scholar] [CrossRef]
  20. Yadav, G.S.; Das, A.; Kandpal, B.K.; Badu, S.; Lal, R.; Datta, M.; Das, B.; Singh, R.; Singh, V.K.; Mohapatra, K.P.; et al. The food-energy-water-carbon nexus in a maize-maize-mustard cropping sequence of the Indian Himalayas: An impact of tillage-cum-live mulching. Renew. Sustain. Energy Rev. 2021, 151, 111602. [Google Scholar] [CrossRef]
  21. Dewangan, S.K.; Shivastava, S.K.; Kumari, L.; Minj, P.; Kumari, J.; Sahu, R. The effect of soil pH on soil health and environmental sustainability: A review. J. Emerg. Technol. Innov. Res. (JETIR) 2023, 10, d611–d616. [Google Scholar]
  22. Jakab, G.; Madarasz, B.; Masoudi, M.; Karlik, M.; Kiraly, C.; Zachary, D.; Filep, T.; Dekemati, I.; Centeri, C.; Al-Graiti, T.; et al. Soil organic matter gain by reduced tillage intensity: Storage, pools, and chemical composition. Soil Tillage Res. 2023, 226, 105584. [Google Scholar] [CrossRef]
  23. Wang, C.; Kuzyakov, Y. Soil organic matter priming: The pH effects. Glob. Change Biol. 2024, 30, e17349. [Google Scholar] [CrossRef] [PubMed]
  24. Kochiieru, M.; Veršulienė, A.; Feiza, V.; Feizienė, D.; Shatkovska, K.; Deveikytė, I. The Action of Environmental Factors on Carbon Dioxide Efflux per Growing Season and Non-Growing Season. Sustainability 2024, 16, 4391. [Google Scholar] [CrossRef]
  25. IUSS Working Group WRB. World Reference Base for Soil Resources 2014, Update 2015. International Soil Classification System for Naming Soils and Creating Legends for Soil Maps, 4th ed.; International Union of Soil Sciences (IUSS): Vienna, Austria, 2022. [Google Scholar]
  26. Nikitin, B.A. A method for soil humus determination. Agric. Chem. 1999, 3, 156–158. [Google Scholar]
  27. Egner, H.; Riehm, H.; Domingo, W.R. Untersuchungen über die chemische Bodenanalyse als Grundlage für die Beurteilung desNährstoffzustandes der Böden II. Chemische Extraktionsmethoden zur Phosphor-und Kaliumbestimmung. K. Lantbrukshögskolans Ann. 1960, 26, 199–215. [Google Scholar]
  28. Saint-Denis, T.; Goupy, J. Optimization of a nitrogen analyser based on the Dumas method. Anal. Chim. Acta 2004, 515, 191–198. [Google Scholar] [CrossRef]
  29. Williams, W.A.; Jones, M.B.; Demment, M.W.A. Concise table for path analysis statistics. Agron. J. 1990, 82, 1022–1024. [Google Scholar] [CrossRef]
  30. Kochiieru, M.; Feiziene, D.; Feiza, V.; Volungevicius, J.; Velykis, A.; Slepetiene, A.; Deveikyte, I.; Seibutis, V. Freezing-thawing impact on aggregates stability as affected by land management, soil genesis and soil chemical and physical quality. Soil Tillage Res. 2020, 203, 104705. [Google Scholar] [CrossRef]
  31. Zhang, X.; Xin, X.; Yang, W.; Ding, S.; Ren, G.; Li, M.; Zhu, A. Soil respiration and net carbon flux response to long-term reduced/no-tillage with and without residues in a wheat-maize cropping system. Soil Tillage Res. 2021, 214, 105182. [Google Scholar] [CrossRef]
  32. Clark, L.; Strachan, I.; Strack, M.; Roulet, N.; Knorr, K.H.; Teickner, H. Duration of extraction determines CO2 and CH4 emissions from an actively extracted peatland in eastern Quebec, Canada. Biogeosciences 2023, 20, 737–751. [Google Scholar] [CrossRef]
  33. Tavares, R.L.M.; Souza, Z.M.; La Scala, N., Jr.; Castioni, G.A.F.; Souza, G.S.; Torres, J.L.R. Spatial and temporal variability of soil CO2 flux in sugarcane green harvest systems. Rev. Bras. Cienc. Solo 2016, 40, e0150252. [Google Scholar] [CrossRef]
  34. Jia, S.; Liang, A.; Zhang, S.; Chen, X.; McLaughlin, N.B.; Sun, B.; Zhang, X.; Wu, D. Effect of tillage system on soil CO2 flux, soil microbial community and maize (Zea mays L.) yield. Geoderma 2021, 384, 114813. [Google Scholar] [CrossRef]
  35. Wei, L.; Zhu, Z.; Liu, S.; Xiao, M.; Wang, J.; Deng, Y.; Kuzyakov, Y.; Wu, J.; Ge, T. Temperature sensitivity (Q10) of stable, primed and easily available organic matter pools during decomposition in paddy soil. Appl. Soil Ecol. 2021, 157, 103752. [Google Scholar] [CrossRef]
  36. Reth, S.; Reichstein, M.; Falge, E. The effect of soil water content, soil temperature, soil pH-value and the root mass on soil CO2 efflux—A modified model. Plant Soil 2005, 268, 21–33. [Google Scholar] [CrossRef]
  37. Chappell, C.; Johnson, A. Influence of pH and bulk density on carbon dioxide efflux in three urban wetland types. Prof. Agric. Work. J. 2015, 3, 5. Available online: https://tuspubs.tuskegee.edu/pawj/vol3/iss1/5 (accessed on 18 February 2025).
  38. Steponaviciene, V.; Ziuraitis, G.; Rudinskiene, A.; Jackeviciene, K.; Boguzas, V. Long-Term Effects of Different Tillage Systems and Their Impact on Soil Properties and Crop Yields. Agronomy 2024, 14, 870. [Google Scholar] [CrossRef]
  39. Ferduch, J.; Paul, V. A review on the possible factors influencing soil inorganic carbon under elevated CO2. Catena 2021, 204, 105434. [Google Scholar] [CrossRef]
  40. Sun, Y.; Liu, C.; Zhao, M.; Liu, L.; Liang, S.; Wang, Y.; Chen, Y. Influence of extreme rainfall events on soil carbon release in the Loess Hilly Region. China Catena 2023, 220, 106652. [Google Scholar] [CrossRef]
  41. Raghavendra, M.; Sharma, M.P.; Ramesh, A.; Richa, A.; Billore, S.D.; Verma, R.K. Soil Health Indicators: Methods and Applications. In Soil Analysis: Recent Trends and Applications; Rakshit, A., Grosh, S., Chakraborty, S., Philip, V., Datta, A., Eds.; Springer: Singapore, 2020. [Google Scholar] [CrossRef]
  42. Liptzin, D.; Norris, C.E.; Cappellazzi, S.B.; Mac Bean, G.; Cope, M.; Greub, K.L.; Rieke, E.L.; Tracy, P.W.; Aberle, E.; Ashworth, A.; et al. An evaluation of carbon indicators of soil health in long-term agricultural experiments. Soil Biol. Biochem. 2022, 172, 108708. [Google Scholar] [CrossRef]
Figure 1. Investigation of soil properties and CO2 efflux ((a)—site for long-term field experiments (A); (b)—two fields trials with different soil texture; (c)—CO2 efflux measurement by LI-COR LI-8100A) in action.
Sustainability 17 03630 g001
Figure 2. Representation for dependent variable (Y = (CO2)—soil CO2 efflux) relationship with soil parameters investigated: X1—soil temperature (T); X2—soil volumetric water content (VWC); X3—soil organic carbon (SOC); X4—total nitrogen (N); X5—available phosphorus (P); X6—available potassium (K); X7—ration between SOC and N (C/N); X8—soil pH value (pH).
Sustainability 17 03630 g002
Figure 3. Change in soil CO2 efflux under different tillage methods on two textured soils. Bars represent standard error; n = 3.
Sustainability 17 03630 g003
Figure 4. Change in soil temperature under different tillage methods on two textured soils. Bars represent standard error; n = 3.
Sustainability 17 03630 g004
Figure 5. Change in soil volumetric water content under different tillage methods on two textured soils. Bars represent standard error; n = 3.
Sustainability 17 03630 g005
Table 1. The texture data at 0–20 cm soil layer at the study site.
FieldTillageSoil Structure Data (%) ± Standard ErrorTexture
Sand
>0.050 mm
Silt
0.002–0.050 mm
Clay
<0.002 mm
Sandy loamConventional tillage52.12 ± 1.5131.39 ± 2.8016.49 ± 1.29Sandy loam
Reduced tillage53.53 ± 0.1332.65 ± 0.5313.82 ± 0.50Sandy loam
No tillage53.38 ± 1.1033.65 ± 1.6612.96 ± 0.68Sandy loam
LoamConventional tillage48.69 ± 0.9736.69 ± 1.8914.62 ± 1.28Loam
Reduced tillage48.20 ± 0.4935.99 ± 0.7115.81 ± 0.69Loam
No tillage49.81 ± 0.5236.47 ± 1.1213.73 ± 1.07Loam
Table 2. Impact of soil texture and tillage on CO2 efflux, temperature and water content in the soil.
Soil TextureTillageCO2 Efflux
(µmol m–2 s–1)
Soil Temperature (°C)Volumetric Water Content (v/v, %)
Sandy loam 1.31 b ± 0.0717.0 b ± 0.811.2 a ± 0.7
Loam 1.64 a ± 0.0820.8 a ± 1.011.8 a ± 0.5
Conventional tillage1.39 a ± 0.0919.1 a ± 1.211.4 a ± 0.8
Reduced tillage1.52 a ± 0.1018.8 a ± 1.111.2 a ± 0.8
No tillage1.52 a ± 0.0818.9 a ± 1.111.9 a ± 0.6
Actions:FPr > FFPr > FFPr > F
Soil texture 9.870.00239.050.00340.650.4235
Tillage 0.590.55820.020.98170.270.7674
Factor data followed by the same letters are not significantly different at p < 0.05. ± standard error; n = 90.
Table 3. Interaction matrix of CO2 efflux, water content and soil temperature.
TillageParametersCorrelation Coefficient
Sandy LoamLoam
TVWCTVWC
CTCO2 efflux (µmol m–2 s–1)0.53 *0.79 **0.17 ns0.79 **
T—soil temperature (°C)1.00−0.02 ns1.00−0.03 ns
VWC—water content (%) 1.00 1.00
RTCO2 efflux (µmol m–2 s–1)0.72 **0.68 **0.46 *0.72 **
T—soil temperature (°C)1.000.02 ns1.00−0.17 ns
VWC—water content (%) 1.00 1.00
NTCO2 efflux (µmol m–2 s–1)0.42 ns0.46 *0.17 ns0.85 **
T—soil temperature (°C)1.00−0.26 ns1.00−0.20 ns
VWC—water content (%) 1.00 1.00
CT—conventional tillage, RT—reduced tillage, NT—no tillage. **—p < 0.01; *—p < 0.05; ns—not significant. n = 15.
Table 4. Soil chemical properties (0–20 cm) as a function of soil texture and tillage.
Soil Texture
(A)
Tillage
(B)
A × BSOCNP2O5K2OC/NpH
g kg–1
SL 8.2 ± 0.3 b0.95 ± 0.04 b0.220 ± 0.03 b0.192 ± 0.02 a8.8 ± 0.3 a5.7 ± 0.1 b
L 11.7 ± 0.4 a1.34 ± 0.06 a0.322 ± 0.03 a0.228 ± 0.03 a8.8 ± 0.3 a6.9 ± 0.1 a
CT 9.6 ± 0.6 a1.08 ± 0.06 a0.218 ± 0.02 a0.173 ± 0.01 a9.0 ± 0.4 a6.1 ± 0.2 a
RT 9.6 ± 0.8 a1.13 ± 0.10 a0.303 ± 0.03 a0.234 ± 0.04 a8.5 ± 0.2 a6.5 ± 0.2 a
NT 10.6 ± 0.8 a1.23 ± 0.12 a0.293 ± 0.05 a0.222 ± 0.04 a8.8 ± 0.5 a6.3 ± 0.3 a
SL-CT8.2 ± 0.5 b0.94 ± 0.05 bc0.171 ± 0.01 c0.167 ± 0.01 a8.7 ± 0.5 a5.5 ± 0.2 b
SL-RT7.8 ± 0.5 b0.91 ± 0.04 c0.273 ± 0.06 abc0.228 ± 0.06 a8.6 ± 0.2 a6.0 ± 0.1 b
SL-NT8.6 ± 0.6 b1.00 ± 0.13 bc0.216 ± 0.05 bc0.181 ± 0.04 a9.0 ± 0.9 a5.7 ± 0.3 b
L-CT11.1 ± 0.6 a1.21 ± 0.07 ab0.265 ± 0.01 abc0.180 ± 0.02 a9.3 ± 0.8 a6.7 ± 0.1 a
L-RT11.4 ± 0.7 a1.36 ± 0.09 a0.332 ± 0.01 ab0.241 ± 0.05 a8.4 ± 0.3 a7.0 ± 0.1 a
L-NT12.5 ± 0.5 a1.46 ± 0.11 a0.370 ± 0.08 a0.263 ± 0.06 a8.6 ± 0.3 a6.9 ± 0.1 a
Soil texture F56.7829.277.140.990.0065.52
Pr > F0.00010.00010.01390.33000.97450.0001
Tillage F0.560.671.611.110.450.66
Pr > F0.57910.52280.22340.34960.64090.5274
Soil texture × F12.977.042.550.760.2815.71
Tillage Pr > F0.00010.00080.06530.58930.91540.0001
Soil chemical properties (±standard error) followed by the same letters are not significantly different at p < 0.05. SL—sandy loam, L—loam, CT—conventional tillage, RT—reduced tillage, NT—no tillage, SOC—soil organic carbon, N—total nitrogen, P2O5—available phosphorus, K2O—available potassium, C/N—ration between SOC and N, pH—soil pH value. n = 12.
Table 5. Correlation matrix of soil environmental quality parameters.
IndicesCorrelation Matrix
CO2TVWCSOCNP2O5K2OC/N
CO2—Soil CO2 efflux (µmol m–2 s–1)
T—Soil temperature (°C)0.80 **
VWC—Volumetric water content (%)0.77 **0.50 *
SOC—Soil organic carbon (g kg–1)0.81 **0.95 **0.61 *
N—Total nitrogen (g kg–1)0.82 **0.90 **0.63 *0.99 **
P2O5—Available phosphorus (g kg–1)0.66 *0.73 **0.25 ns0.81 **0.85 **
K2O—Available potassium (g kg–1)0.43 ns0.44 ns0.06 ns0.57 *0.67 *0.93 **
C/N—Ratio between SOC and N–0.09 ns0.02 ns0.07 ns–0.10 ns–0.25 ns–0.45 ns–0.69 *
pH—Soil pH value0.83 **0.94 **0.40 ns0.92 **0.92 **0.90 **0.69 *–0.23 ns
**—p < 0.01; *—p < 0.05; ns—not significant. n = 6.
Table 6. Soil CO2 efflux pathways as a function of soil temperature, volumetric water content, SOC, N, P2O5, K2O, C/N and pH.
IndicesPath CoefficientCO2
(rY)
TVWCSOCNP2O5K2OC/NpH
T—Soil temperature (°C)0.4900.352–2.8201.850–1.9630.9480.0191.9270.80 **
VWC—Volumetric water content (%)0.2450.704–1.8161.295–0.6640.1250.0550.8290.77 **
SOC—Soil organic carbon (g kg–1)0.4660.431–2.9682.020–2.1731.230–0.0831.8830.81 **
N—Total nitrogen (g kg–1)0.4420.445–2.9262.048–2.2981.430–0.1991.8800.82 **
P2O5– Available phosphorus (g kg–1)0.3570.173–2.3901.745–2.6971.991–0.3611.8430.66 *
K2O—Available potassium (g kg–1)0.2160.041–1.7001.363–2.5002.148–0.5611.4210.43 ns
C/N—Ratio between SOC and N0.0110.0480.306–0.5041.203–1.4900.809–0.473–0.09 ns
pH—Soil pH value0.4600.284–2.7221.876–2.4211.487–0.1862.0530.83 **
CO2—soil CO2 efflux (µmol m–2 s–1). **—p < 0.01; *—p < 0.05; ns—not significant. Number in bold—direct effect, underlined number—dominant effect. n = 6.
Disclaimer/Publisher’s Note: The statements, opinions and data contained in all publications are solely those of the individual author(s) and contributor(s) and not of MDPI and/or the editor(s). MDPI and/or the editor(s) disclaim responsibility for any injury to people or property resulting from any ideas, methods, instructions or products referred to in the content.

