Article

Integrated Smart City Solutions: A Multi-Axis Approach for Sustainable Development in Varanasi

Department of Astronautical, Electrical and Energy Engineering (DIAEE), Sapienza University of Rome, 00184 Rome, Italy
*
Author to whom correspondence should be addressed.
Sustainability 2025, 17(7), 3152; https://doi.org/10.3390/su17073152
Submission received: 13 January 2025 / Revised: 22 February 2025 / Accepted: 10 March 2025 / Published: 2 April 2025

Abstract

:
In this era of perpetual advancement and innovation, the term “smart” is frequently misused. Linking smartness to a city should reflect and solve multiple problems with a single solution. A city, district, or area can only be smart when it contemplates different development axes rather than having just a single strength. This work is an effort to make an area of Varanasi in Uttar Pradesh, India, smart by concentrating the actions on five principal axes—Environment, Energy, Mobility, Community, and Economy. Practical indicators have been selected and well formalised to obtain an output value that can support the methodology to rank each action in its executable manner. Software like ENVI-met (to simulate greening and pollution) and PVSyst (to simulate rooftop solar PV) have been used to simulate the actions proposed, and a detailed discussion for each result has been presented. The methodology involves the creation of a model based on morphological, structural, and environmental data, as well as using SWOT analysis and community feedback to identify key areas for intervention. The results demonstrate the effectiveness of the proposed interventions, with notable reductions in CO2 emissions, improved air quality, and significant energy savings through the implementation of Nature-Based Solutions, solar PV systems, and electric mobility.

1. Introduction

Smart cities [1] are urban areas that utilise technology and data to enhance the efficiency of various services, improve the quality of life for their residents, and optimise resource usage [2]. The core idea behind this concept is to integrate information and communication technology (ICT) solutions across different sectors, such as transportation, energy, healthcare, and governance, to create a more sustainable and interconnected urban environment [3,4].
Using sensors, devices, and data analytics, smart cities gather real-time information, enabling better decision-making and resource allocation [5]. For instance, smart transportation systems leverage data to optimise traffic flow and reduce congestion [6], while energy-efficient technologies promote sustainability [7]. Furthermore, smart cities significantly emphasise citizen engagement [8], fostering active participation through digital platforms to encourage community and collaboration [9].
The need for smart city optimisation arises from rapid urbanisation, population growth, and the increasing demand for sustainable and liveable environments. As urban areas face congestion, pollution, and resource constraints, adopting smart technologies becomes essential for effective resource management, improved quality of life, and the creation of resilient urban ecosystems [10]. Notable examples of smart cities, each with its characteristics, showcase different strategies and technological applications to address urban challenges. In a recent study [11], Sarachaga identified Singapore as a pioneering smart city due to the country’s substantial investments in an extensive network of sensors and cameras for urban monitoring and management. Furthermore, the city has also allocated SGD 73 million to pursue three main areas of development: digital government, digital economy, and digital society. This firm commitment to innovation and technology has positioned Singapore among the leading cities in the 2021 IMD-SUTD Smart City Index (SCI) [12]. Similarly, other cities, including Seoul (South Korea) and Copenhagen (Denmark), have implemented bespoke solutions to address their distinctive urban requirements. Seoul has prioritised using big data analytics for intelligent traffic and waste management systems, exemplifying its commitment to technological efficiency [13]. On the other hand, Copenhagen is distinguished by its commitment to eco-innovation and sustainability, with 22% of its urban area dedicated to green spaces [14]. These examples highlight the need for tailored and integrated solutions to meet specific urban contexts’ needs while demonstrating adaptability and scalability.
To address these challenges, dividing the characteristics of a city into distinct axes can simplify the analysis of urban issues and the formulation of solutions. This approach allows the creation of indicators that evaluate multiple dimensions, such as quality of life, and facilitates comparative analyses between cities. The aforementioned axes permit a systematic examination of urban contexts concerning several key domains, including culture, the environment, energy, the economy, and social issues [15]. The axes employed in this study are as follows: Smart Energy, Smart Environment, Smart Mobility, Smart Economy, and Smart Community.

1.1. Literature Review

The concept of smart cities has been extensively explored in recent years, yielding significant advancements in isolated domains such as energy systems, mobility, and environmental sustainability. However, integrating these domains into a cohesive multi-axial framework remains challenging in urban planning. Existing studies have demonstrated the optimisation of renewable energy systems in smart city contexts, highlighting improvements in energy efficiency and reductions in carbon emissions through the optimal allocation of resources [16]. Similarly, advancements in smart grid communication technologies have enhanced energy management; however, these studies often focus primarily on energy infrastructure without addressing the broader interaction with other urban systems [17].
Regarding economic development, studies have examined how smart infrastructure can promote economic growth, focusing on the socio-technical dimensions of technology, people, and institutions [18]. While this research outlines the economic benefits of smart cities, it does not fully explore the interaction of economic development with environmental and social sustainability. Further work has evaluated how technological advancements can drive economic growth, emphasising the role of the digital economy [19]. Yet, these remain narrowly focused on technological innovations without addressing other urban priorities, such as community engagement and environmental health. Other research has taken a more integrated approach, addressing the need to collectively consider smart city development’s economic, environmental, and social aspects [20]. However, much of this work’s practical framework for prioritising actions across these domains remains undeveloped. Urban spatial intelligence has been explored as a potential solution, advocating for data-driven strategies that adapt to real-time changes in urban environments. However, these studies have not provided clear methodologies for evaluating the feasibility and impact of specific actions [21].
Environmental sustainability is another focal area in smart city research. Various studies have emphasised the importance of multi-level governance in managing climate change at the urban level, calling for coordinated actions between local and national authorities [22]. While this work addresses governance challenges, it lacks a focus on specific environmental actions such as greening and pollution control, which are critical to achieving smart city goals. Urban parks and green spaces have also been highlighted as a key factor in sustainable city planning, linking environmental initiatives with social well-being [23]. However, there is a limited exploration of how these spaces interact with other urban systems, such as energy or mobility.
In urban mobility, research has shown the potential of electric vehicle car-sharing schemes to reduce emissions and enhance transport sustainability [24,25]. However, this work focuses primarily on electric vehicles without considering the broader spectrum of mobility solutions, such as cycling infrastructure, a critical component of integrated urban transport systems. Other studies have compared cycling infrastructures in different cities, recommending policies to promote cycling as a sustainable mode of transport. Still, these do not address how mobility interacts with energy use or environmental impact [26].
Decision-making tools are essential for managing the complexity of smart city development. Multi-criteria decision-making frameworks have been proposed to evaluate urban projects, but these lack the practical ranking systems necessary for prioritising actions based on feasibility and impact [25,
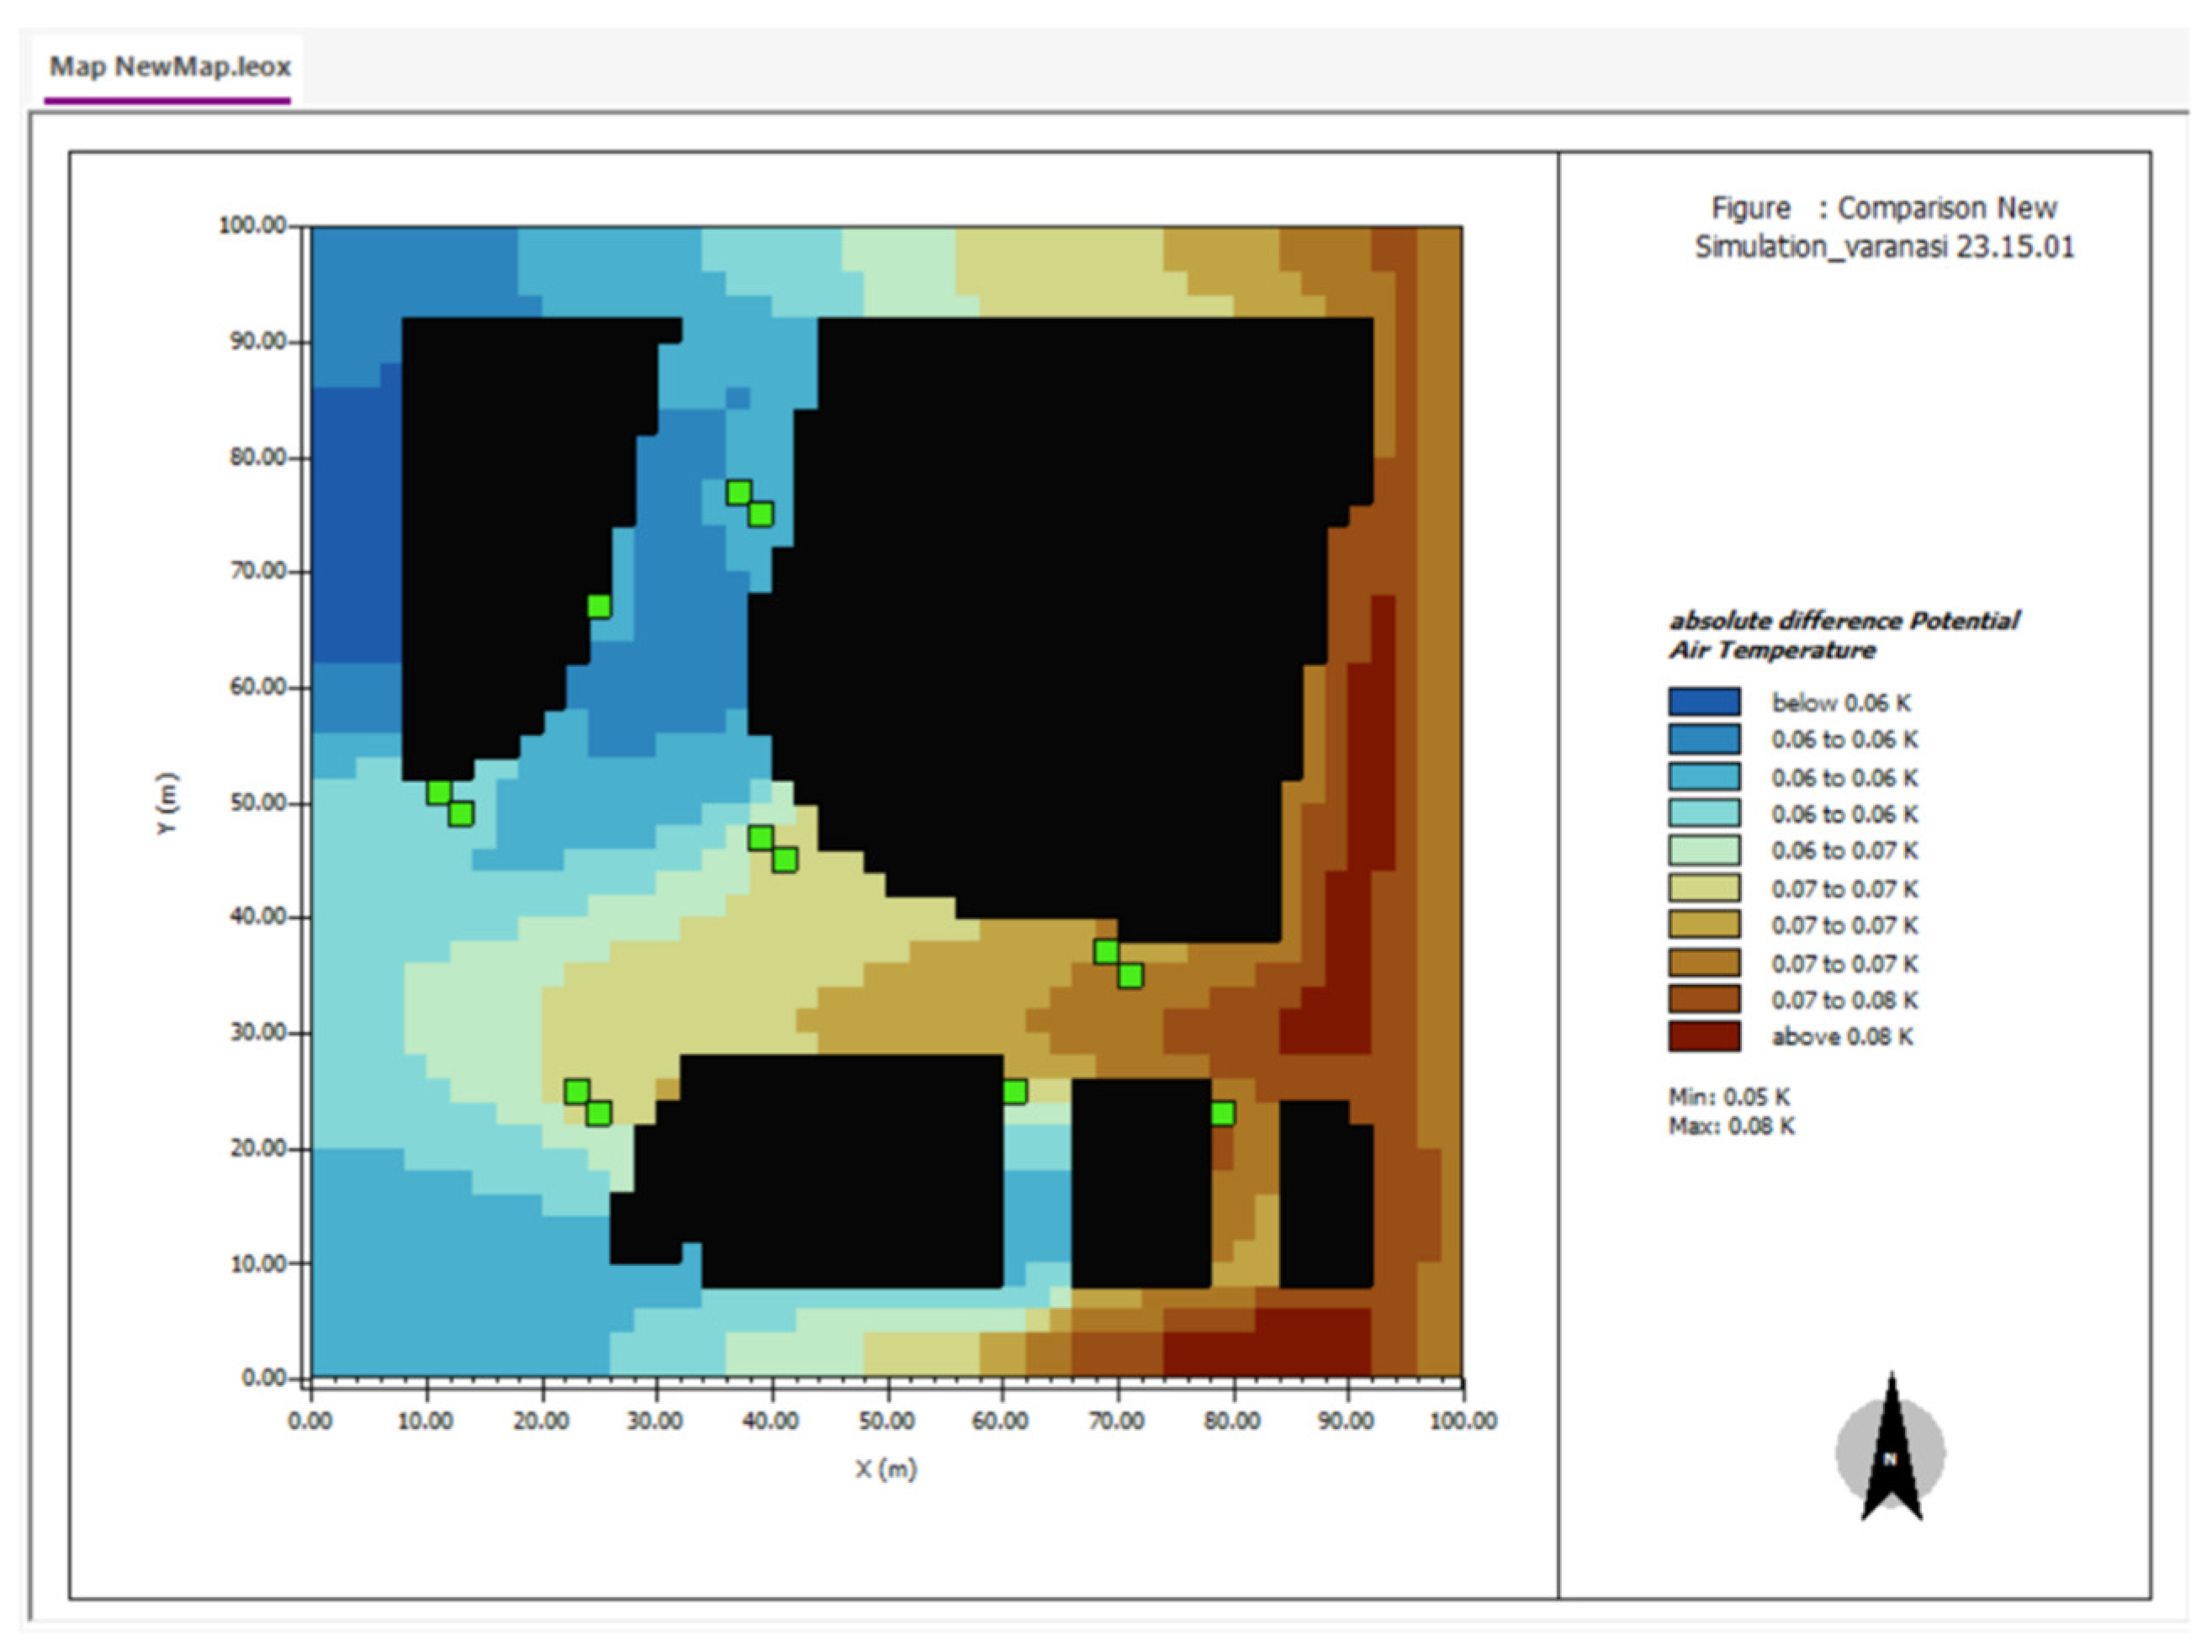
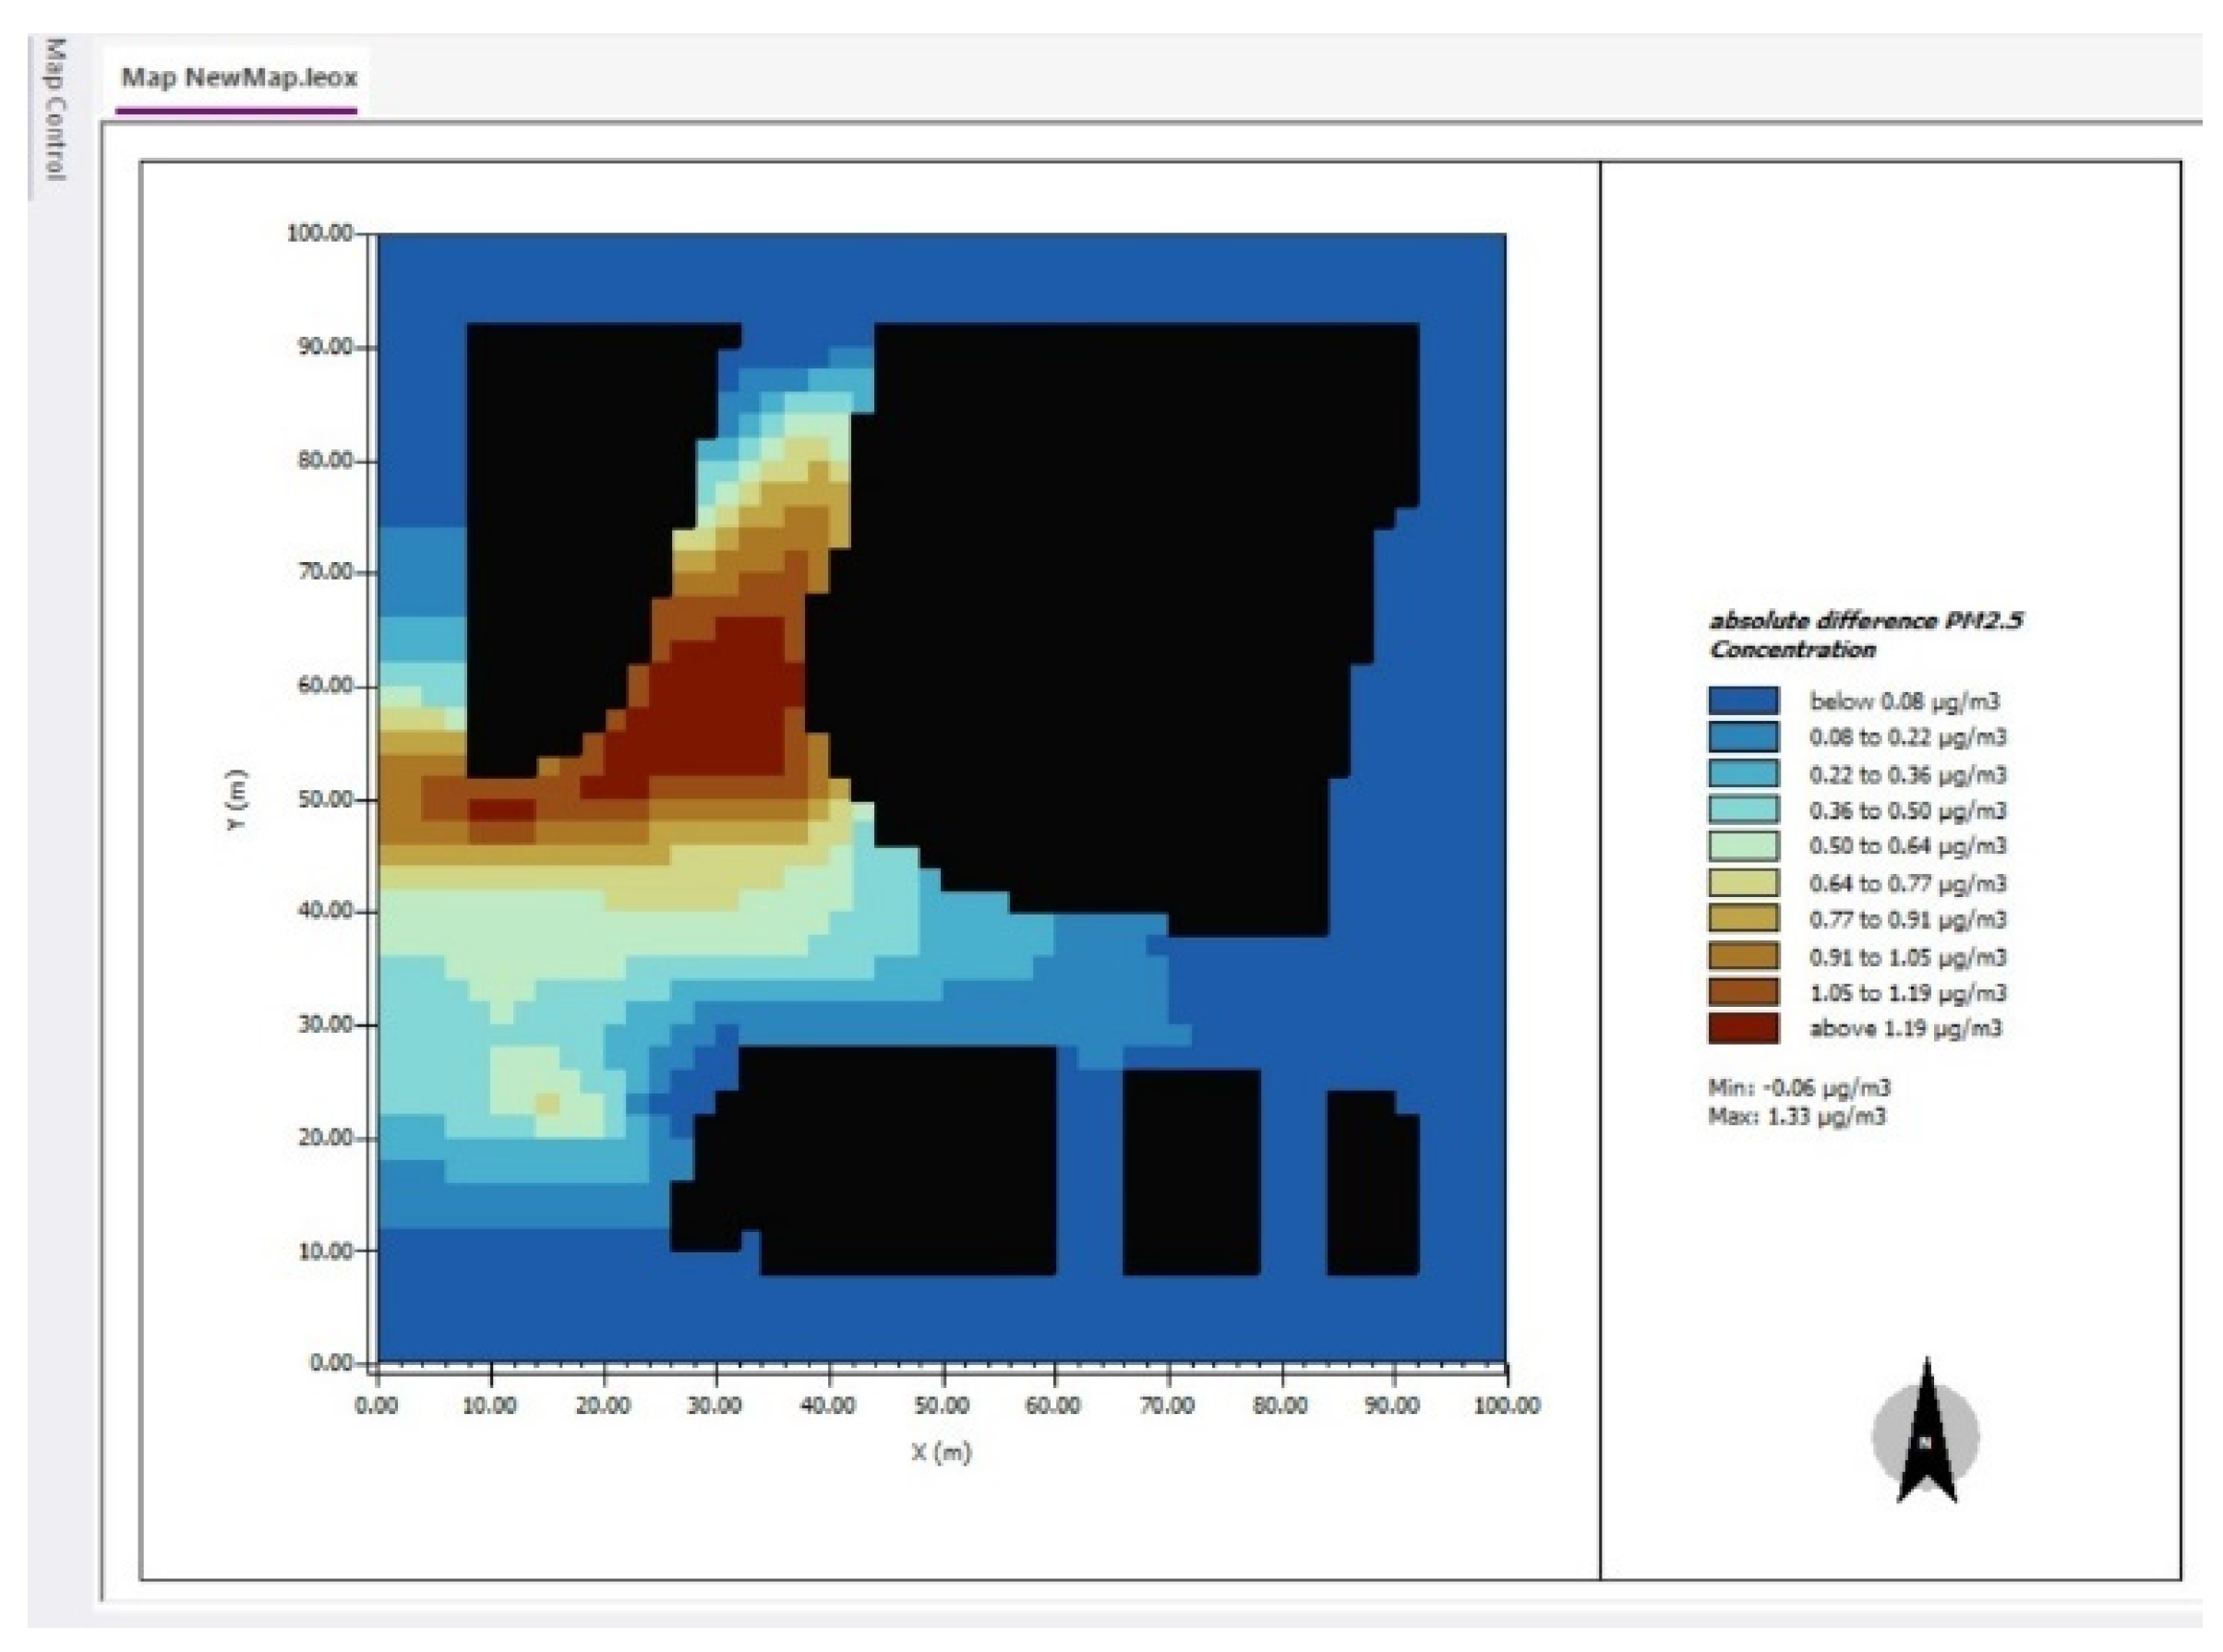
27]. While theoretical models have been developed to guide urban decision-making, they remain abstract and difficult to apply in real-world scenarios, requiring a structured, action-oriented approach. Simulation tools play a critical role in smart city planning. ENVI-met, for example, has been widely used to model urban climates and assess the impact of environmental initiatives such as greening [28]. However, its application has been limited to environmental simulations, with little energy or mobility considerations integration. Similarly, other studies have used ENVI-met to simulate urban thermal environments, achieving valuable insights into the urban heat island effect without incorporating broader urban systems such as energy planning or transport infrastructure [29,30].
Regarding urban energy systems, studies have explored the potential of renewable energy integration, including solar PV systems, to reduce emissions and improve energy sustainability [31]. However, these studies focus primarily on rural electrification or energy infrastructure without considering the urban context where energy systems must interact with other urban needs, such as mobility and environmental sustainability [32]. Other research has explored the role of green-blue spaces in mitigating the urban heat island effect, demonstrating environmental benefits but without addressing the interaction between green spaces and energy systems [33].
Governance and policy are crucial to the successful implementation of smart city initiatives. Several studies have emphasised the importance of aligning local actions with broader sustainability goals, using frameworks such as smart urban metabolism to guide urban resource management [34]. However, while these studies provide a valuable theoretical foundation, they often lack practical tools for prioritising actions based on feasibility and potential impact. Comparative analyses of sustainable and smart city models have identified key differences in their approach to environmental, social, and economic challenges. Still, these studies are largely theoretical, without concrete methodologies for assessing the feasibility of different smart city initiatives [35,36].
Several studies have focused on strengthening specific smart axes within cities. For instance, one study developed the mobility axis by implementing smart traffic lights to reduce CO2 emissions and improve traffic flow at intersections in a small Portuguese city [37]. However, this study did not segregate the analysis into different axes, nor did it create an incidence matrix to assess the impact of one action on another. Similarly, other research [38] explored the integration of photovoltaics, energy storage, and electric vehicles by introducing an energy management system (EMS), highlighting a reduction in energy costs. In a different study [39], researchers examined the planning process for developing the Reininghaus District, focusing on optimising energy technology networks and scenarios. This research contributed to the framework for energy planning, leveraging accumulated knowledge to design smart energy supply solutions and guide stakeholders in the city quarter development process. Another study [40] analysed interviews with 392 citizens from five neighbouring cities in southern Brazil. The findings provided valuable insights for urban planners and social researchers, identifying factors influencing residents’ sense of community and city evaluation. This work offered essential elements for academic and political debates.
While some studies have employed multivariate comparative analysis, yielding novel contributions to smart city development, these results also present opportunities for further scientific exploration [41]. Similarly, Correia et al. discussed using multi-criteria analysis to derive a final equation capable of assessing cities by incorporating the three primary axes. This methodology included citizen participation throughout the process by first allocating weights among indicators and then evaluating the weight of each axis [42]. However, this study lacked a comprehensive approach incorporating key axes and an incidence matrix to quantify the actions and their interrelationships.

1.2. Aim of the Work

This work aims to present multi-axial solutions that address the defined axes simultaneously, aiming to enhance cities’ environmental and energy sustainability. This study evaluates the effectiveness of integrated smart city initiatives, ensuring alignment with long-term sustainability goals and contributing to reducing environmental impacts.
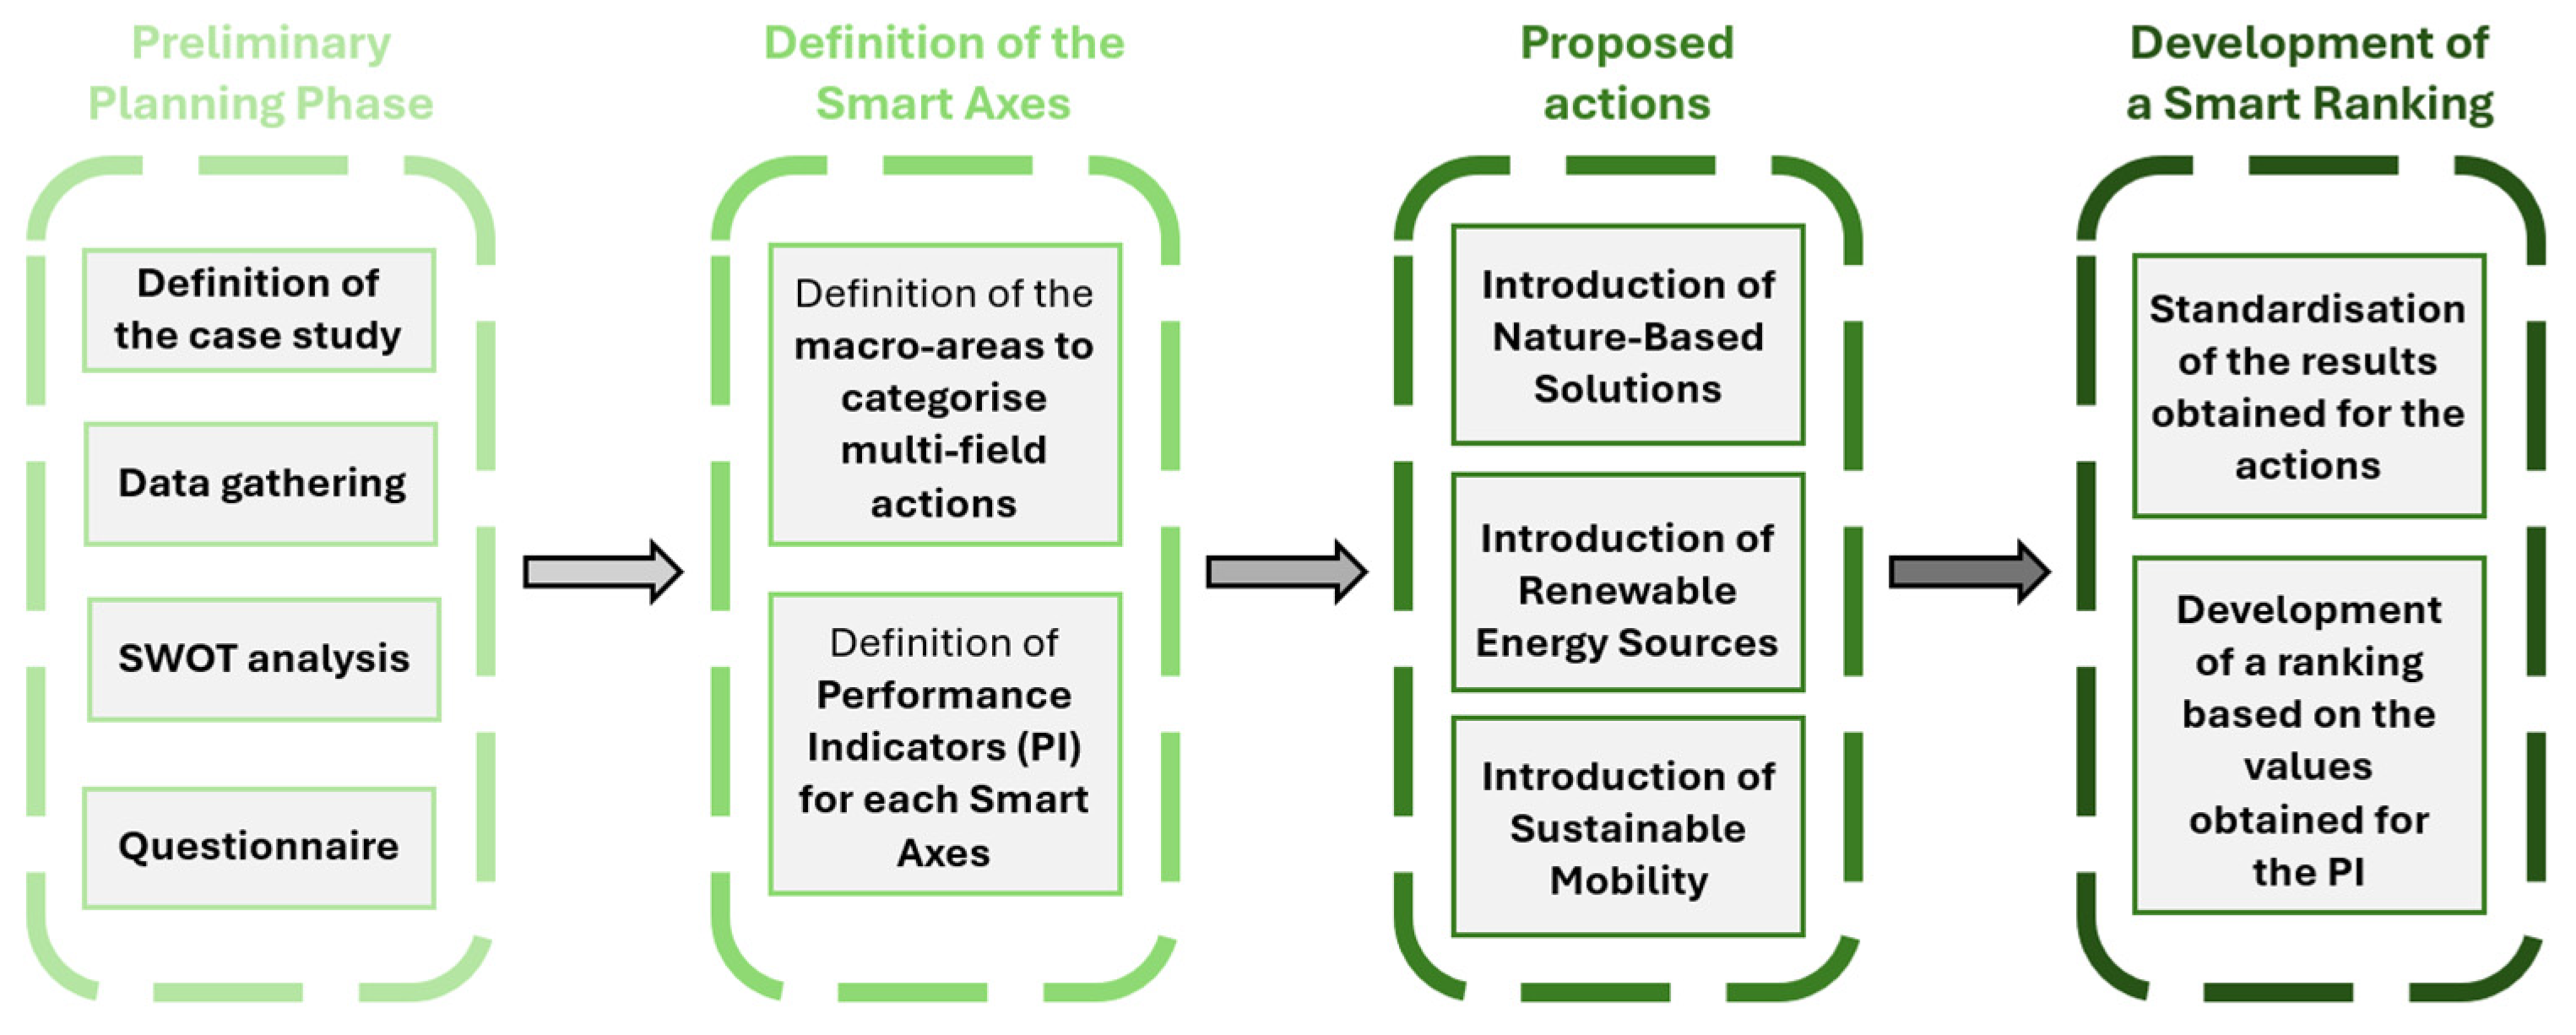
Potential solutions to the selected district’s challenges were initially identified. Although the proposed interventions were developed by analysing specific data from a particular urban context, the measures proposed can be generalised and applied in other cities.
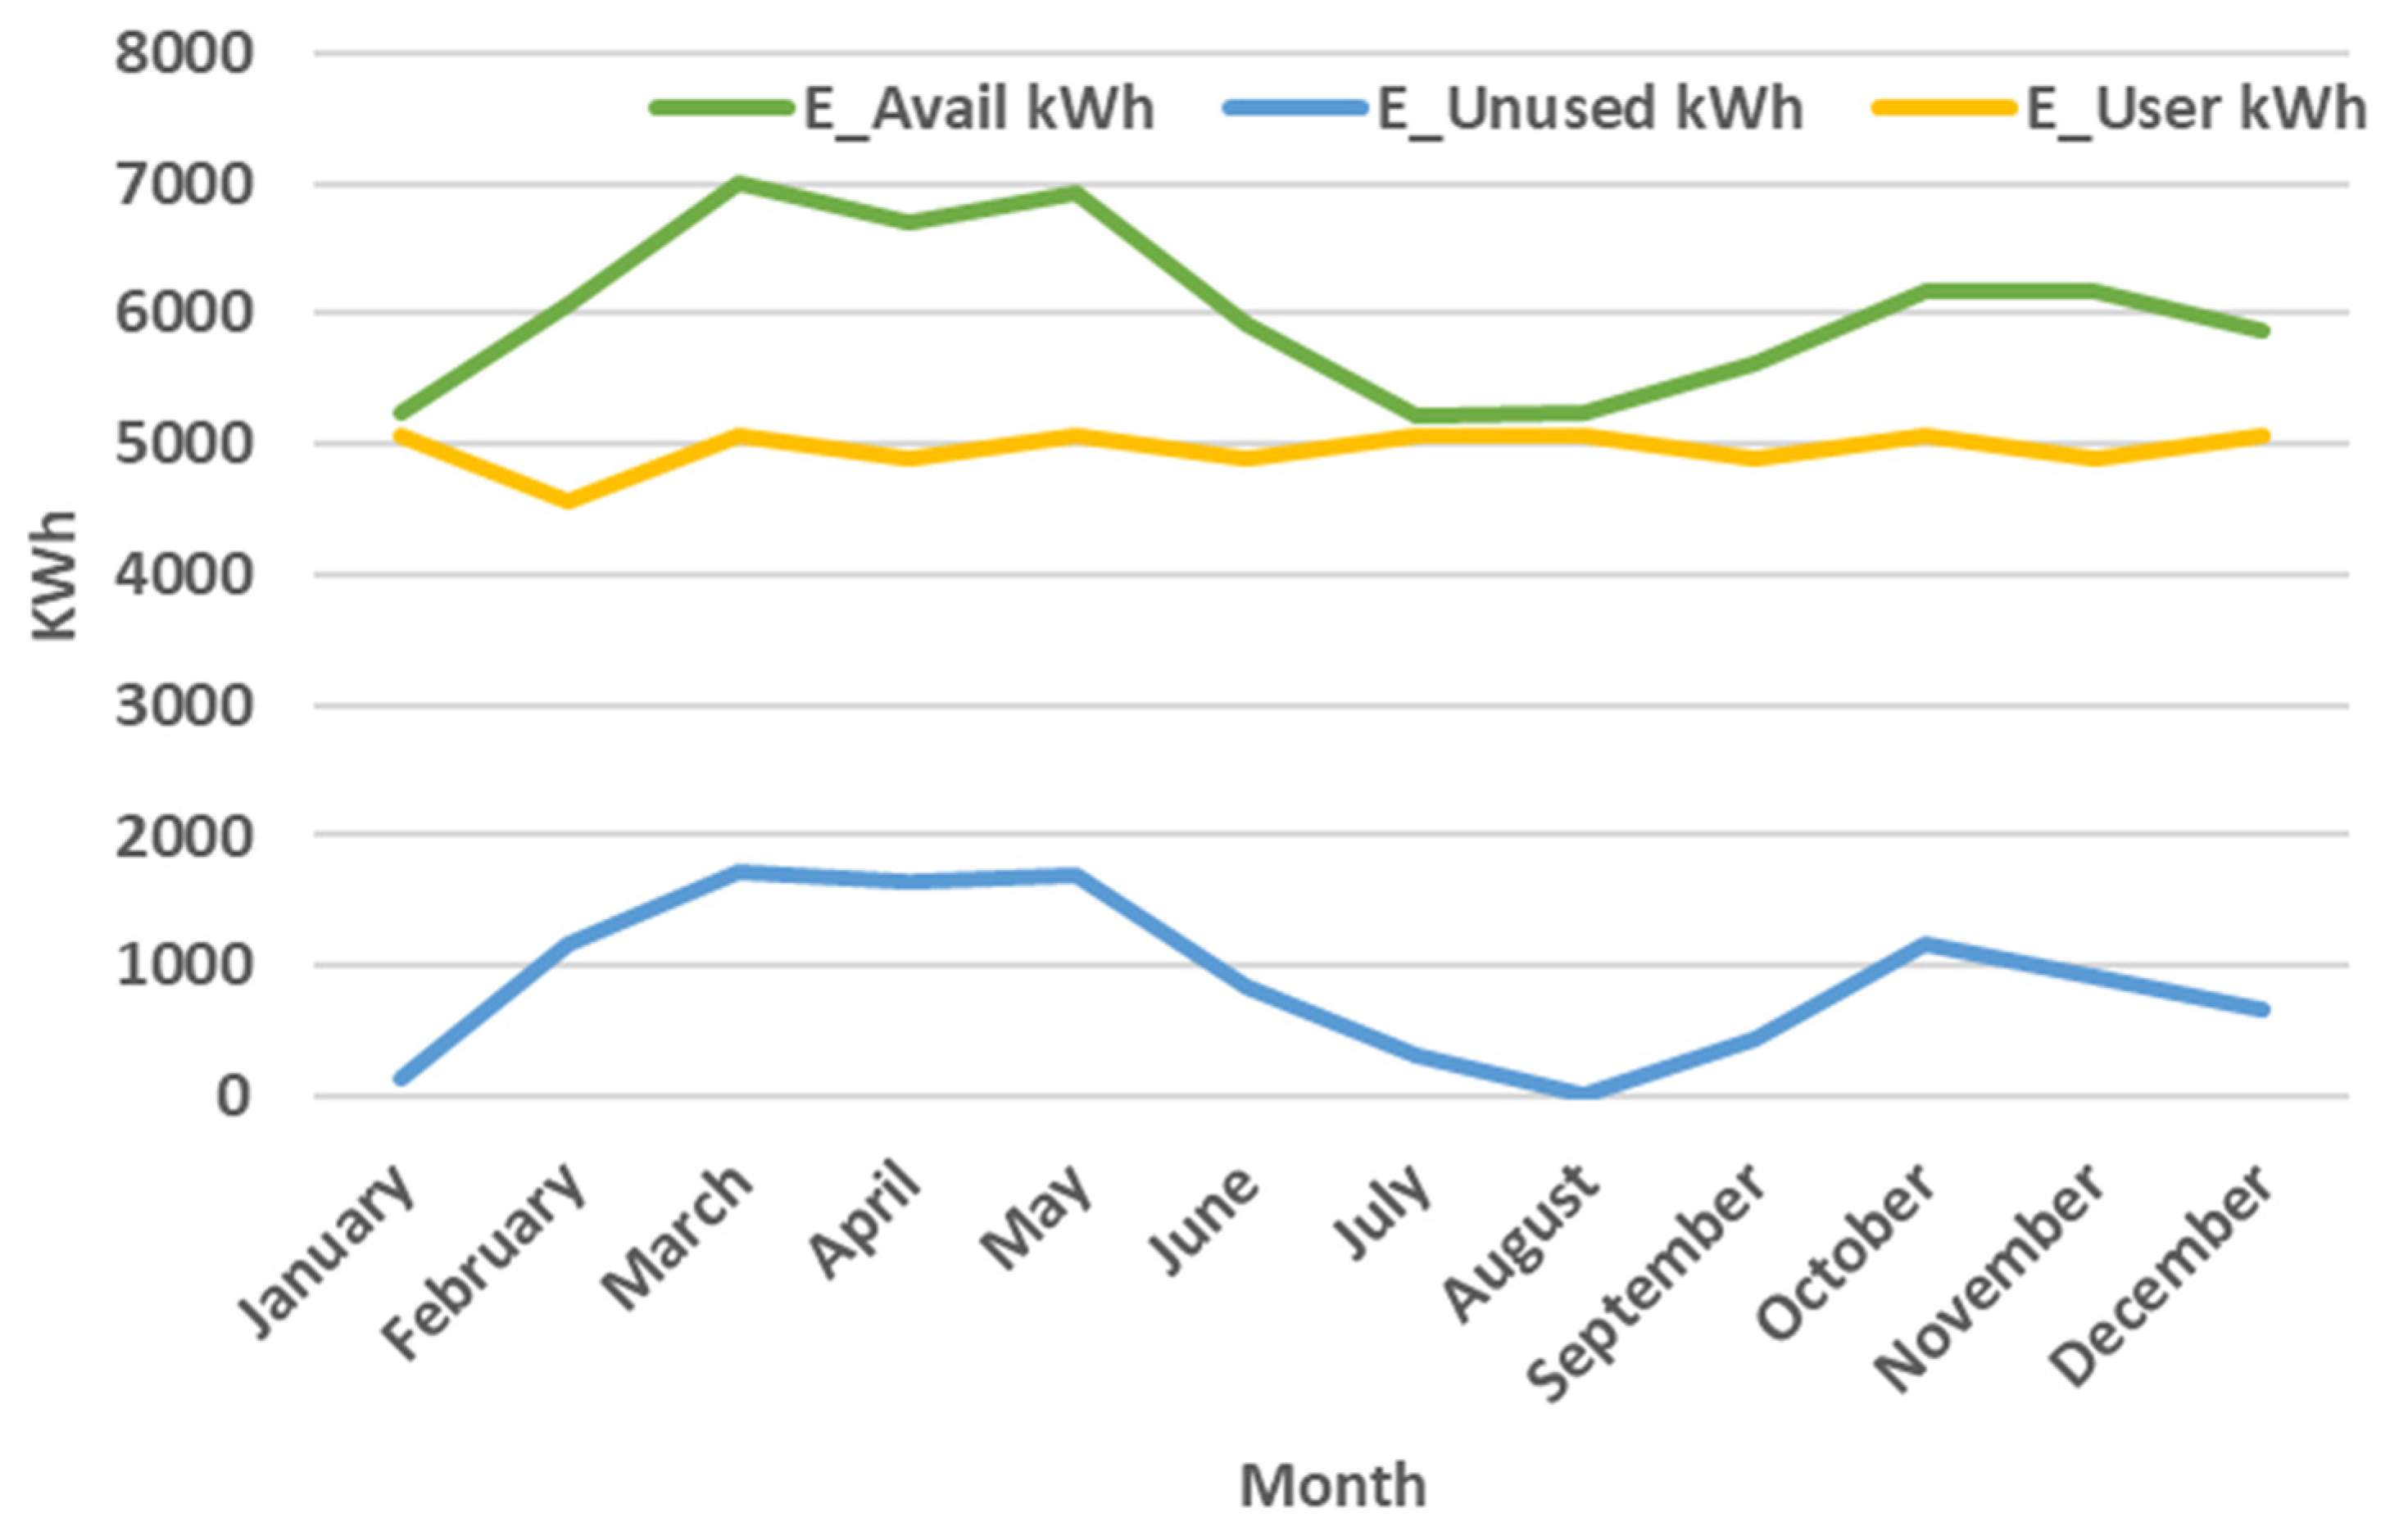
The solutions involve integrating green spaces, a photovoltaic system, and sustainable mobility initiatives within a district where vehicular pollution, high temperatures, and energy consumption are interlinked. While the actions aim to encompass more than one of the project’s five primary axes simultaneously, a smart method was used to assess the benefits of these solutions and guide the municipality in setting a priority plan [15]. Using indicators, the multi-axial nature of the proposed actions is highlighted, providing an evidence-based approach to addressing complex urban challenges effectively.
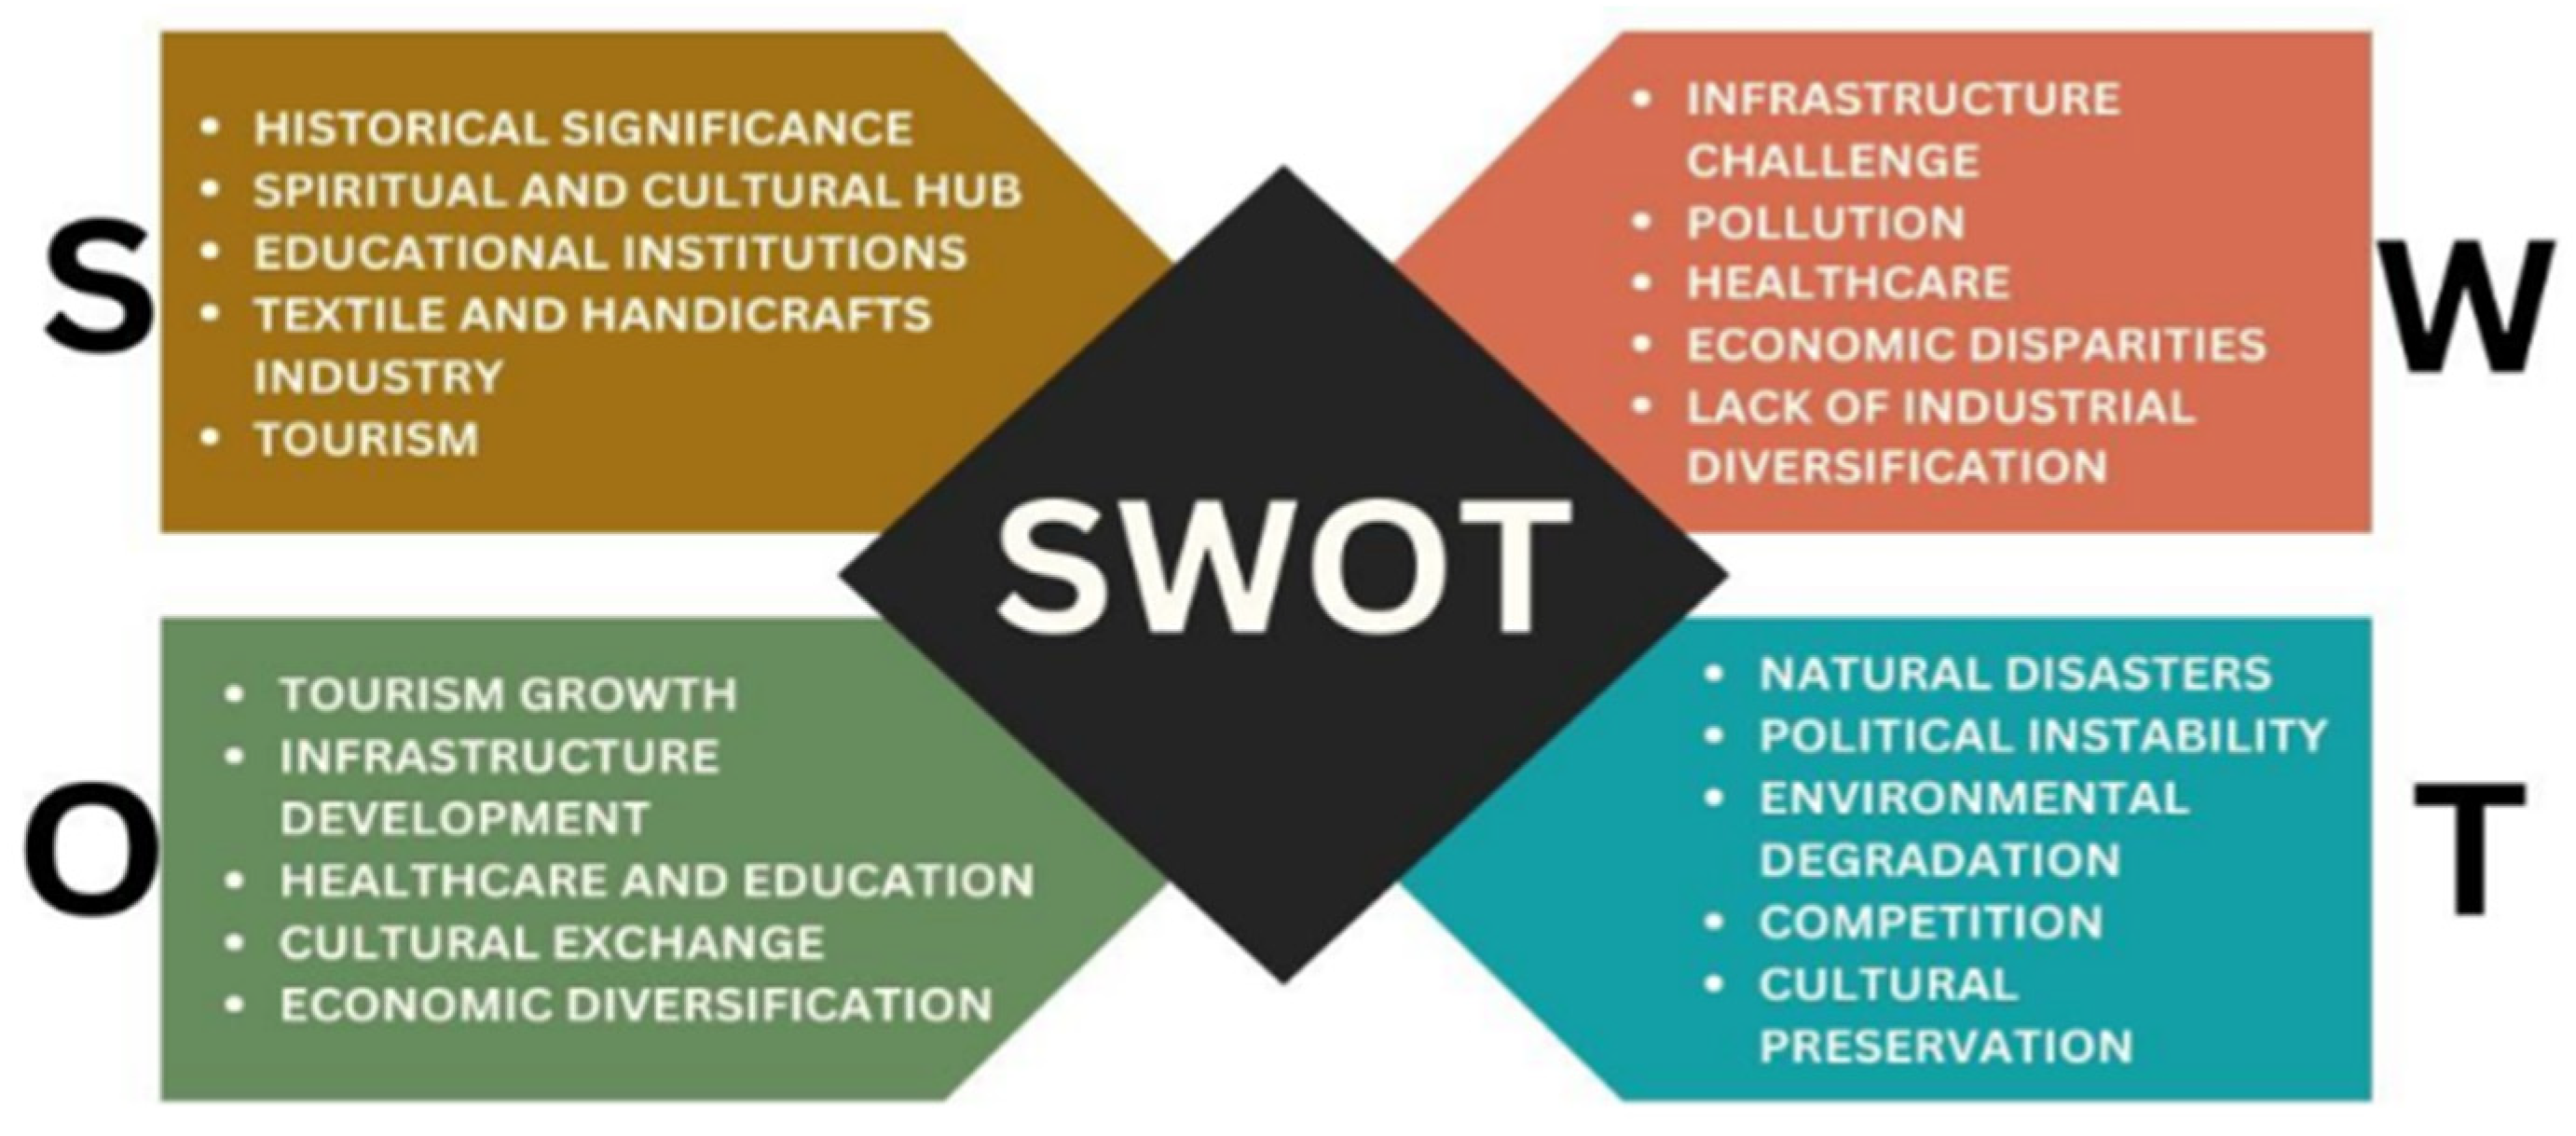
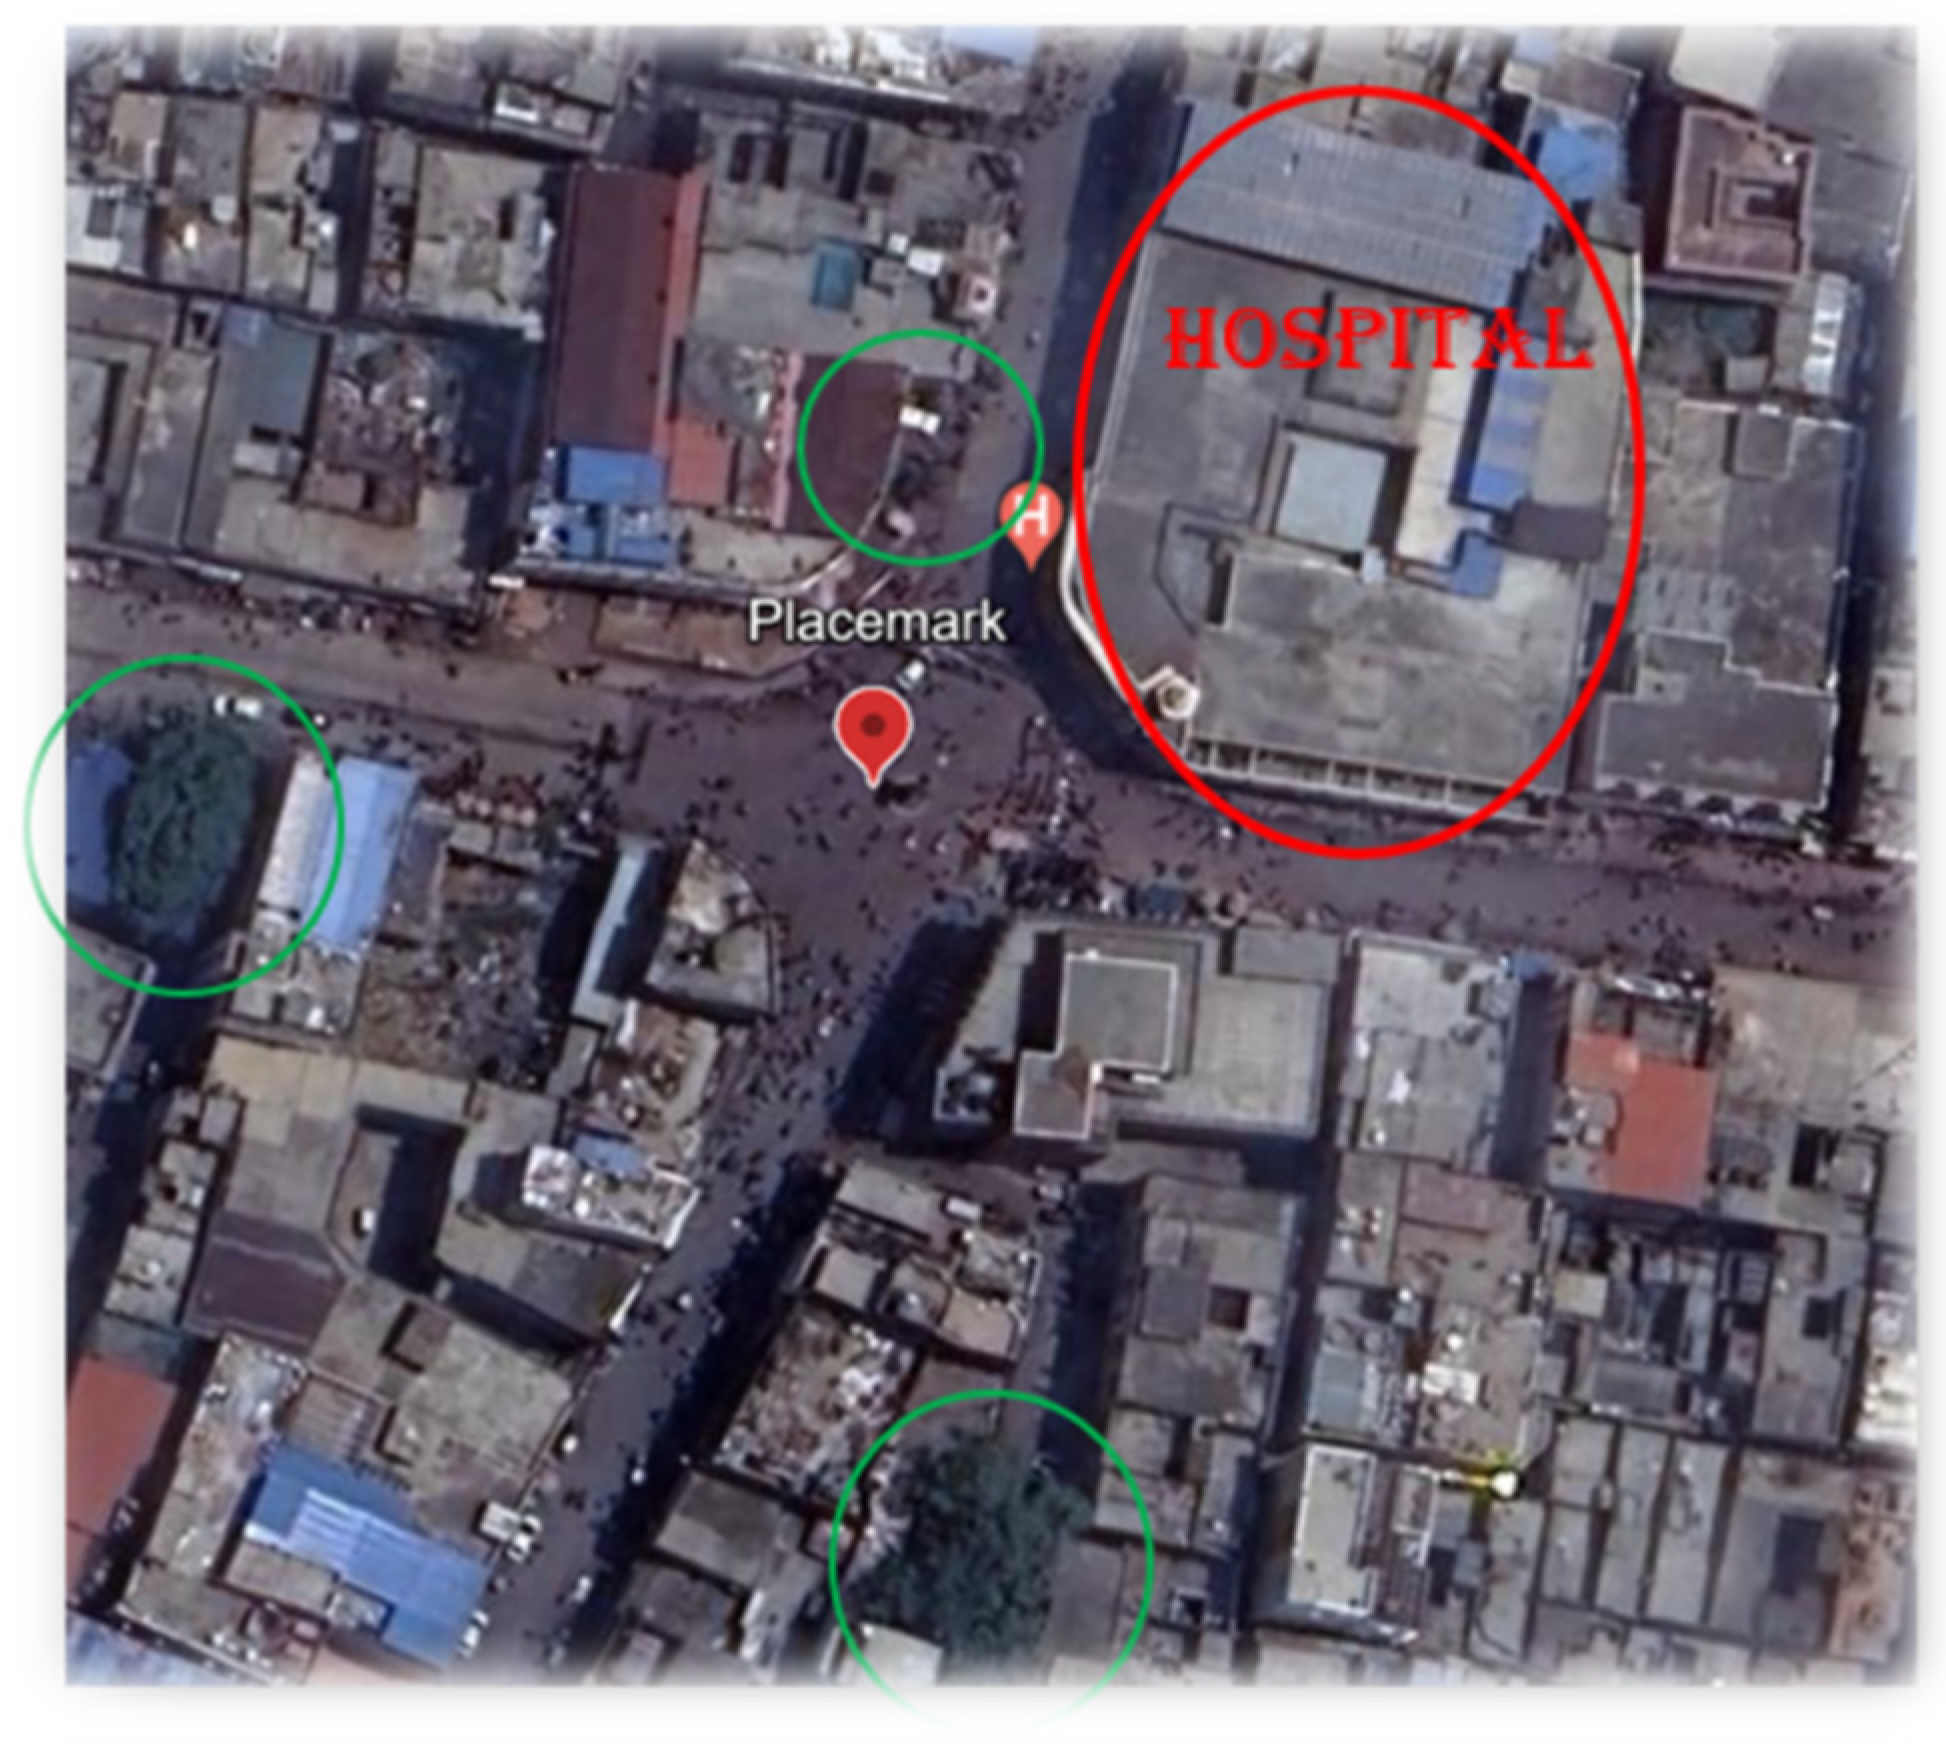
The selected case study for this research is a district of Varanasi (Uttar Pradesh, India). This complex and dynamic urban environment exemplifies the challenges and opportunities for smart city interventions.

2. Materials and Methods

The following section provides a comprehensive analysis of the methodology employed for modelling and simulating scenarios, including a detailed exposition of the underlying assumptions and simplifications and an exposition of the quantitative matrix used for ranking interventions.

2.1. Methodology Overview

The initial stage of the process involves a preliminary planning phase, which includes defining the case study, starting with its morphological characteristics, followed by the collection of structural, climatic, and environmental data. The data are then used to create a model of the case study in all its dimensions, thereby providing a reference scenario against which the effectiveness of the proposed interventions can be assessed. A SWOT analysis was then conducted to gather additional information on the case study—precisely its challenges and strengths. Based on the insights obtained from this analysis, a questionnaire focusing on the key points of interest identified by the authors was developed and distributed virtually to the city’s residents. The results were then analysed and tabulated to provide a comprehensive view of the expressed issues and set out the guidelines for smart design.
The subsequent phase of the process involves defining the ‘smart axes’, the macro-areas within which multi-field actions are categorised. In the context of this case study, the definition of these axes is based on those previously identified by the authors in previous work and the existing literature on the subject. The definition of the smart axes is centred on identifying the areas of interest upon which the effectiveness of the proposed solutions will be evaluated. The effectiveness of a solution is directly proportional to the number of smart axes it impacts. After the delineation of the smart axes, performance indicators were identified for each to characterise the various interventions that will be proposed. A series of actions were selected to address the significant issues that emerged from the analyses above to address the most pressing challenges effectively. The proposals encompass a wide range of potential interventions, including the introduction of Nature-Based Solutions (NBS), an increase in renewable energy production and self-consumption through installing a photovoltaic system on the roof of the district’s most energy-intensive building. Furthermore, the proposal included introducing a sustainable mobility system to reduce pollution and congestion in the area. The various solutions were modelled using appropriate software tools, including ENVI-met 5.5.1 for the analysis of the effects of urban greenery on microclimate and pollutants and PVsyst 7.2 for modelling the photovoltaic system.
The final stage of the process involves the development of a Smart Ranking, which is based on the alignment of the proposed solutions with the selected Smart Indicators. Once the results had been standardised, the Performance Index (PI) established the priority ranking of the proposed strategies, indicating which interventions had a positive or negative impact following the adopted methodology. As illustrated in Figure 1, a graphical representation of the methodology was deemed useful in order to more clearly delineate the path followed.

2.2. Case Study

This case study examines the Godowlia neighbourhood in Varanasi, India, a vibrant and historically significant area close to several iconic landmarks, including Dashashwamedh Ghat and Kashi Vishwanath Temple. As a central hub of commerce and culture, the area attracts thousands of visitors daily, contributing to its dynamic atmosphere while highlighting several challenges. Some data related to the case study are reported in Table 1.
The primary concerns are severe congestion caused by narrow and crowded streets, elevated air and noise pollution levels, and a significant lack of green spaces. These challenges are exacerbated by the nearby bustling market, street food stalls, and Marwari Hospital, one of the most essential healthcare institutions in the city. Additionally, the area lacks adequate parking facilities for two- and four-wheelers, worsening traffic congestion. A 2014 report indicated that only 5% of Varanasi’s total area is green [46], amounting to 8 km2 out of 160 km2, while 33% is recommended to meet per capita standards. This deficit in green spaces directly impacts the quality of life and underscores the necessity for urban greening initiatives.
Marwari Hospital, located centrally within the neighbourhood, performs a pivotal role. Its proximity to Dashashwamedh Ghat and other attractions further underscores its strategic importance. The hospital’s deep roots in the community align perfectly with the objectives of proposed sustainable interventions. As part of an ongoing energy management initiative, the purpose is twofold: firstly, to reduce the hospital’s energy costs and emissions, and secondly, to enhance its operational efficiency. These initiatives are expected to support broader efforts to improve environmental quality and public health in Varanasi. This initiative indicates the hospital’s ongoing commitment to community service and its pioneering role in adopting sustainable practices within the healthcare sector.
From a climatic perspective, the city of Varanasi experiences highly variable conditions throughout the year. The city’s average monthly temperature ranges from 11 °C in December to 39 °C in May, with cool, dry winters and hot, humid summers. The city’s monsoon season, characterised by heavy rainfall and high humidity, significantly impacts urban activities and living conditions. Table 2 provides the monthly average high for summer months and low for winter months temperatures for the reference year, offering a detailed overview of the city’s climate.
Regarding the energy mix, Uttar Pradesh, where Varanasi is situated, relies heavily on coal for electricity generation [47], with smaller contributions from solar, nuclear, oil, and gas sources. This energy context (Figure 2) emphasises the necessity to diversify energy sources and increase the integration of renewable energy to reduce environmental impact and enhance regional sustainability.

2.3. SWOT Analysis and Survey

In the preliminary stages of the study, a comprehensive SWOT analysis was carried out to assess the strengths, weaknesses, opportunities, and threats associated with the area under consideration. This analysis provided a structured framework for understanding the current conditions of the area and identifying factors influencing its potential development. The SWOT analysis results, shown in Figure 3, provided a fundamental understanding of the internal and external dynamics of the area and guided the subsequent stages of the study.
Following the SWOT analysis, a questionnaire was designed to gather additional insights directly from the local community. The questionnaire aimed to assess the problems faced by the residents of Varanasi, identify their needs, and explore potential smart solutions tailored to the specific context. The questions were formulated to address all five axes of the study, ensuring a comprehensive approach to data collection across social, environmental, and infrastructural dimensions. A detailed list of the questions included in the survey is presented in the table below.
The questionnaire included both qualitative and quantitative questions. Some questions used a scale-based rating system (e.g., yes-maybe-no) to assess traffic congestion, transport coverage, and healthcare quality. In addition, two of the questions were multiple-choice, allowing respondents to select multiple options regarding what could boost the city’s economic growth and what renewable energy sources could benefit Varanasi.
There were 154 participants in the survey, selected to represent a range of perspectives within the community. The questionnaire was sent to the Varanasi locals in various age groups and professions. It was observed that 34 participants were students and professors, 42 were in business (retailers and wholesalers), 41 were homemakers, and the remaining 37 had mixed professions (tourist guides, currently unemployed, retired, etc). Moreover, the participants were between 20 and 62 years old. The data collected provided valuable insights consistent with the SWOT analysis findings, providing a detailed understanding of the challenges and opportunities within the study area. Based on the combined findings of the SWOT analysis and the survey results, key indicators across the five axes were identified to guide the formulation of strategies and recommendations for the region’s sustainable development. Table 3 shows the questions proposed in the questionnaire, while Figure 4 and Figure 5 show the answers obtained for the multiple-choice and two other questions, respectively.

3. Proposed Interventions

Following a thorough initial analysis that considered both the challenges and opportunities in the city of Varanasi, alongside the concerns expressed by its citizens, a set of smart initiatives has been suggested. These initiatives aim to address multiple facets concurrently. For instance, in the vicinity of the hospital, where green spaces are lacking, and vehicular pollution is a significant issue, the proposal includes the introduction of green areas, mitigation measures for pollution around the hospital, and the implementation of a solar photovoltaic system to cater to the hospital’s energy needs. This approach not only contributes to the energy axis but also has positive impacts on the environment and the local community.
The proposed smart actions (Table 4) have been designed to tackle the issues frequently raised by citizens intelligently and practically and are intended to simultaneously encompass more than one of the project’s five primary axes.

3.1. Action 1: Nature-Based Solutions

Nature-based solutions (NBS) are a novel and sustainable approach to addressing urban and environmental challenges by leveraging natural processes and ecosystems. These solutions are designed to enhance biodiversity, improve climate resilience, and provide socio-economic benefits, making them a key tool in achieving sustainable development goals. In urban contexts, NBS can mitigate issues such as air pollution, heat islands, and water management while fostering community well-being and connectivity with nature. Integrating natural elements into urban planning and infrastructure is a cost-effective and adaptable strategy for creating healthier, more liveable cities.
As highlighted in the case study, the Godowlia area in Varanasi suffers from significant issues, including traffic congestion, high levels of air pollution, and a lack of green spaces. As illustrated in Figure 6, the area is represented before implementing any interventions, with green circles highlighting the only trees in the area. To address these challenges, a series of NBS was proposed, involving planting trees and roof and façade greening for buildings near the Marwari Hospital. The ENVI-met software was utilised to simulate these proposals and analyse their effects on temperature and pollution levels.

3.1.1. ENVI-Met Software

ENVI-met is an advanced tool that employs computational fluid dynamics to simulate three-dimensional microclimatic and environmental conditions, making it well-suited for urban areas. Its detailed spatial resolution enables the study of small and medium-scale interactions, capturing the nuanced dynamics of urban microclimates [49].
A significant strength of ENVI-met lies in its ability to assess the role of vegetation in urban environments, a capability validated by extensive applications in studies worldwide [studio con ENVI-met]. By modelling the interplay between urban elements, such as buildings, surfaces, vegetation, and airflows, ENVI-met provides a comprehensive view of how these factors interact under specific climatic conditions. Furthermore, the software extends its utility to air quality analysis, allowing for the simulation of pollutant concentrations, including PM2.5, PM10, and NOx, under varying urban scenarios. The capacity of ENVI-met software to evaluate and optimise a proposed green space has been the subject of extensive research and validation in the academic literature. In their study, Ling et al. discussed and validated the software by evaluating the proposed area’s temperature reduction [50].
Furthermore, the capacity of ENVI-met to quantify PM2.5 concentration has been analysed and validated in the existing literature [51]. Despite certain limitations, such as the need for significant computational power, especially for large-scale urban areas or high-resolution models, and the simplification of certain environmental processes, ENVI-met is considered suitable for simulations due to its established ability to evaluate and optimise green spaces and quantify air quality parameters like PM2.5 concentrations. These strengths have been demonstrated in previous academic work, supporting its application in similar contexts. However, it is important to note that ENVI-met simulations may be subject to constraints such as protracted simulation times, even when utilising high-performance computing facilities. Additionally, while the model provides valuable insights into microclimate processes, it simplifies certain real-world physics—such as heat exchange—, which may not be as detailed as those produced by more complex Computational Fluid Dynamics (CFD) models. Moreover, modelling vegetation growth and evapotranspiration is somewhat simplified, which may not fully capture seasonal variations. Finally, using predefined weather conditions in the simulations limits the model’s adaptability to variable conditions.

3.1.2. ENVI-Met Simulation Setup

The simulation process was initiated with a baseline model of the area (Figure 7a), incorporating detailed data on building heights, asphalt roads, and meteorological conditions. The initial settings included hourly temperature and relative humidity values for a warm spring day retrieved from publicly available weather databases [52]. The chosen timeframe for the simulation was spring, a period of the year characterised by increased congestion attributable to more favourable weather conditions that encourage more significant movement and activity [53]. Additionally, this season represents when urban greenery is at its most vibrant, providing a realistic basis for evaluating the impacts of greening interventions. The parameters set to configure the module are shown in Table 5.
These inputs were configured in the SPACES module of ENVI-met, and the complete setup was saved using the ENVI-guide module. The ENVI-core module was subsequently employed to execute the simulation, generating a comprehensive overview of the area’s current environmental conditions.
For the greening scenario, the layout was modified to include nine strategically placed trees and roof and façade greening for buildings surrounding the Marwari Hospital. The developed design is shown in Figure 7b. ENVI-met’s grid-based approach facilitated an accurate assessment of the available space, resulting in an estimated 800 m2 for roof greening. It was calculated that this area could accommodate approximately 1600 plants or saplings, which, based on the literature’s values, are expected to absorb 22 kg/year/tree [54] and 5 kg/year/plant of CO2 [55].

3.1.3. Pollutant Analysis

A secondary simulation was conducted to evaluate air quality, focusing on the concentrations of PM2.5 and PM10. These parameters were selected due to their frequent exceedance of permitted limits throughout the year. To facilitate this assessment, the DB Manager module in ENVI-met was utilised for data collection. The number and type of vehicles passing through the designated area within 24 h were used as inputs, including cars, motorcycles, and heavy vehicles, thereby providing a comprehensive overview of traffic patterns and their associated air quality implications. Utilising these data, the software automatically extrapolated the emission levels of pollutants such as NO2, NO, NOx, PM2.5, and PM10. As the Central Pollution Control Board reported, these extrapolations were performed using ratios such as 50% NO2 in NOx and 45% PM2.5 in PM10 [56]. This process enabled the accurate replication of real-world pollution scenarios in the area.
These configurations were replicated for the layout with greening to assess the impact of vegetation on pollutant dispersion. An example of the pollution model setup is shown in Figure 8.
The same settings were replicated for the layout with greening.

3.2. Action 2: Installing Solar PV System on the Rooftop of the Hospital

Energy is pivotal to advancing a smart city, powering its sophisticated infrastructure and underpinning its innovative technologies. The transition towards sustainability in smart cities heavily relies on integrating renewable energy sources, such as solar and wind, which form an environmentally friendly basis for urban development. This focus on renewable energy is complemented by efforts to optimise energy usage through intelligent grids, energy-efficient buildings, and smart transportation systems. A resilient and reliable energy infrastructure is essential to ensure the continuous operation of smart city systems, even in the face of potential disruptions. Furthermore, smart metres engage citizens in energy conservation, directly contributing to sustainability goals. It is important to note that energy supports data centres and information processing. It drives innovation in clean energy solutions, underscoring its critical role in advancing smart and environmentally conscious urban environments.
As part of the study, a rooftop solar photovoltaic (PV) system was proposed for the Marwari Hospital. ENVI-met simulations revealed an available rooftop area of approximately 1600 m2, thus making it a viable candidate for solar panel installation. The Global Solar Atlas [53] estimates an average solar irradiance of 5.2 kWh/m2/day for the region, thereby highlighting the potential of solar energy to meet a significant portion of the hospital’s energy needs. Rooftop solar PV systems have gained widespread acceptance in India, bolstered by government incentive schemes designed to promote their adoption. Based on surveys and observations from similar facilities [57], the hospital’s yearly energy demand was estimated at approximately 608 kWh/bed/day. A system designed for 100 hospital beds was modelled, leveraging the rooftop area to supplement grid reliance and provide an emergency power source. As illustrated in Table 6, the following data pertains to the electricity demand of the hospital.
The PVsyst software was a key tool in this study to model and optimise the proposed solar PV system.

3.2.1. PVsyst Software

PVsyst is a versatile software extensively used in the solar energy sector to design and analyse photovoltaic (PV) systems. It is suitable for projects of varying scales and configurations. The software has advanced tools that enable detailed system optimisation and performance evaluation. The software facilitates precise modelling of PV system components, encompassing the technical specifications of photovoltaic modules, the efficiency of inverters, and the impact of shading. PVsyst generates highly accurate energy production simulations tailored to each system’s unique characteristics by incorporating parameters such as tilt angle, orientation, and shading conditions.
In addition, PVsyst incorporates comprehensive economic analysis tools, thereby enabling the assessment of the viability of solar projects. The capacity of PVsyst software to optimise and simulate standalone or off-grid photovoltaics (PV) projects has been discussed and validated in the existing literature [58].
Despite certain limitations, PVsyst is deemed suitable for analyses related to renewable energy production, particularly in optimising and simulating PV systems. These limitations include using a simplified 3D shading model, which may not accurately capture complex shading effects from irregular objects. Moreover, the accuracy of simulations depends heavily on the precision of input parameters such as solar radiation, temperature, and module characteristics. While minor inaccuracies in input data can affect energy yield predictions, the data used in the simulations for this study were carefully selected, ensuring their accuracy and reliability. It should also be noted that PVsyst’s battery storage modelling is less comprehensive than dedicated energy storage simulation tools, and the estimation of soiling loss is simplistic, not accounting for seasonal variations or local environmental factors such as humidity and dust accumulation.
Additionally, the module degradation models in PVsyst are based on linear assumptions, which may not fully represent real-world degradation patterns. Furthermore, the software does not allow the import of real-time weather data from external sources, such as satellites or IoT sensors, which limits its adaptability to highly dynamic weather conditions. Nonetheless, given its proven ability to model PV systems effectively and carefully select input data, PVsyst remains a reliable renewable energy production analysis tool.

3.2.2. PVsyst Simulation Setup

In this study, PVsyst was utilised to simulate a standalone system for the hospital, with the dual objective of supplementing grid power during routine operations and ensuring energy independence during emergencies. Its ability to assess system feasibility and performance provided a robust foundation for integrating solar PV into the hospital’s energy infrastructure.
In PVsyst, the modelling process involved defining the site location, importing meteorological data, and specifying load requirements. Subsequently, the PV system components (modules, inverters, and layout) were configured, and simulations were performed to evaluate system performance and optimise the design.
To evaluate the positive impact of the installed PV system compared to previous energy consumption, it is crucial to assess the reductions in CO2 and PM2.5 emissions. Coal-fired power plants, known for their high carbon intensity, emit approximately 2.2 to 2.5 pounds (1 to 1.14 kg) of CO2 per kilowatt-hour (kWh) of electricity generated. In contrast, natural gas power plants, considered cleaner-burning, produce between 0.6 and 2.2 pounds (0.27 to 1 kg) of CO2 per kWh, depending on the efficiency of the plant and the combustion technology used [59,60].
Particulate matter emissions, particularly PM2.5, are another critical factor, especially in Uttar Pradesh, where coal dominates the energy mix. Average emission factors for PM2.5 from coal-fired power plants can range widely, typically within a few to several dozen micrograms per kilowatt-hour (µg/kWh). From the most representative coal-fired power plant in Uttar Pradesh, an average estimated 40 microgram/KWh emission of PM2.5 [61] was considered.

3.3. Action 3: Electric Bicycle and Route

As previously discussed, the congestion issue in this area is predominantly driven by the presence of the hospital and major tourist attractions, followed by nearby markets. Addressing this challenge required implementing a system to regulate vehicle flow in the region. The high prevalence of petrol-powered rickshaws and motorbikes contributes significantly to noise and air pollution, particularly as many vehicles transport visitors to tourist destinations. To mitigate these effects, 50 electric bicycles and a dedicated route to facilitate their use have been proposed as transformative measures to enhance accessibility while promoting sustainable and efficient transportation.
The electric bicycles, developed by the Yulu brand in India, utilise lithium-ion batteries due to their superior energy density, longer lifespan, and lighter weight compared to alternative battery technologies. Each battery has a capacity of 400 Wh, making it ideal for medium-range trips commonly undertaken in this area. A manual battery replacement system is proposed to ensure grid stability during battery charging. This supports sustainable operations and creates new employment opportunities for battery maintenance and replacement.
The dedicated route starts at Varanasi Cantt railway station, the primary arrival point for tourists, and ends at Godowlia, the central hub of tourist attractions. Spanning an estimated 3.9 km, this route has been strategically designed to connect key points of interest while minimising congestion. Yulu electric bicycle can travel up to 50 km on a single charge, depending on terrain, rider weight, and assist level. At an average speed of 20 km/h, the journey along the proposed route would take approximately 12 min. Assuming each bicycle is used approximately 25 times daily, the total daily distance covered per bicycle would be 100 km, amounting to an annual distance of roughly 36,500 km.
This action is expected to yield significant environmental benefits. Considering the data from OMO Bikes in India [62] and the tables derived on annual CO2 emissions from diesel and petrol vehicles from reference [63], the yearly mean CO2 emissions avoided per bicycle is estimated at 5055.25 kg/year, calculated for the assumed annual travel distance. It should be acknowledged that the reported value is an average, which is influenced by various factors, such as vehicle weight, number of passengers, and fuel efficiency. However, the minimum and maximum values for CO2 emissions per kilometre can be deduced from the website [64], and the values presented in Table 7 and Table 8 are derived based on the fuel efficiency assumptions outlined therein. Furthermore, by reducing reliance on petrol-powered rickshaws and motorcycles, the initiative would substantially lower PM2.5 emissions, with an average rate of 0.01 g/km used for analysis [65]. The reductions address air pollution, mitigate noise pollution, and alleviate traffic congestion, creating a more liveable urban environment.
The data presented in the table underscore the potential environmental impact of the intervention, demonstrating its capacity to promote cleaner air, reduced noise, and enhanced accessibility in the area.

3.4. Actions 4 and 5: Advertisement and Job Creation

In order to define and analyse the incidence matrix with maximum accuracy, in addition to the three primary actions, which are the subject of discussion in the preceding section, the present study considers two additional actions. The primary action is concerned with fostering citizen engagement, with methods such as billboard and Instagram advertisements focusing on inclusivity and empowerment; the overarching aim is to create a city more responsive to the needs and aspirations of its residents. The values associated with the aforementioned action were derived from a survey conducted among 154 Varanasi residents. The second action focuses on job creation and its contribution to overall economic prosperity, highlighting its role in enhancing the city’s socio-economic landscape.

3.5. Incidence Matrix

The Incidence Matrix is a strategic instrument utilised to analyse proposed interventions quantitatively. It employs specific indicators to evaluate the impact of these interventions on various dimensions, referred to as “smart axes”. These indicators provide actionable insights. Five actions were selected in this study based on survey results and the researchers’ informed judgement. These actions were chosen carefully, considering their diverse impacts across the identified smart axes, ensuring a comprehensive approach to addressing urban challenges.
The smart axes, thus, form the core of the Incidence Matrix, offering a structured framework for assessing the effectiveness of the actions. The indicators, in turn, provide measurable insights into performance, ensuring both transparency and accountability in achieving the project’s objectives. The smart axes employed in this study are as follows:
  • Environment: this axis aims to reduce environmental degradation, promote green infrastructure, and enhance biodiversity.
  • Energy: the focus here is on advancing clean energy solutions, improving energy efficiency, and fostering renewable energy adoption.
  • Mobility: this axis promotes sustainable and efficient transportation systems to reduce congestion and environmental impact.
  • Community: efforts here centre on enhancing social cohesion, citizen engagement, and access to essential services.
  • Economy: this axis seeks to drive economic growth through innovation, job creation, and efficient resource management.
At least one indicator was used to quantify the actions of each smart axe. However, for some smart axes, more than one indicator was used (Table 9).
After quantifying the actions, it is necessary to normalise and scale the values obtained. In normalising and scaling [66], the “distance to mean” approach is selected. Initially, the mean is computed for each indicator using Equation (1), where “i“ represents the indicators, “j” signifies each action, “m” denotes the total indicators, and “n” stands for the overall number of suggested actions. Subsequently, the distance to the mean is determined for each indicator using Equation (2).
M i = j n x i j n
a i j = x i j   M i M i ,
where i = ind1, ind2, ind3… m, and xij is the value of the i-indicator due to the j-intervention.
To enable a comprehensive comparison across all indicators, including a scaling factor becomes imperative. The scaling is established by considering each action’s maximum and minimum magnitudes, with scores ranging from −5 to 5. The score ranges are designed such that if the action magnitudes fall below 0, they will be assigned a score of 0 or below. This implies the existence of 6 ranges for negative scores and only 4 for positive ranges. This distribution favours alternatives that demonstrate superior performance in the indicators. This methodological approach facilitates a precise identification of the relative impact of each action on the proposed smart axes, thereby underscoring priorities for strategic planning.
The equations used for the scaling are as follows:
x s + 1 + x m i n 5 ;   for   s > 4
x s 1 + x m a x 4 ;   for   s > 0 .
In this process, where “s” denotes the score, and xmin and xmax represent the minimum and maximum magnitudes of the actions, the outlined procedure must be iteratively applied for all indicators of interest. This repetition continues until the entire matrix is thoroughly normalised and scaled, ensuring a comprehensive and consistent treatment across all indicators.
Again, the scaling in the scale of 0 to 1 is performed for the economic and time feasibility. To estimate the time and economic feasibility, the following assumptions were made:
  • The Roof and Façade greening on surrounding houses and planting trees: 1095 days
  • Installing solar PV system on the rooftop of the hospital: 60 days
  • 50 electrical bicycle proposals and route: 210 days
  • Others: 7 days
The final ranking is obtained by summing the values for each scenario.

4. Results and Discussion

This section is organised into subsections to clearly and systematically present the experimental results. Each subsection provides a concise and precise description of the findings, followed by their interpretation and analysis.

4.1. Action1: Nature-Based Solutions

The impact of planting trees and implementing façade greening was analysed using the Leonardo module of the ENVI-MET software. Two simulations were conducted: one representing the baseline scenario without any greening interventions and another incorporating the proposed addition of nine trees in designated locations along with façade greening. The simulations generated multiple files for various time steps, and a comparative analysis was performed by examining paired files (with and without greening) for identical time intervals. The absolute temperature differences between the two scenarios were observed.
Figure 9 shows the result based on the absolute temperature difference at 2 PM of a warm and dry March (the results are easy to observe). A maximum of 0.08 K is observed in the result. However, the maximum value is from the region that is further away from the intervention and, hence, less significant. It is important to note that due to the façade and rooftop greening, there is a temperature difference (in the range of 0.06 K–0.07 K) around the neighbouring buildings of the hospital.
The findings demonstrated that greening initiatives resulted in slightly diminished mean temperatures compared to the reference scenario. This outcome validates the efficacy of the implemented strategy in reducing urban heat, predominantly through shading and evapotranspiration. Although the observed reduction was confined to a specific area, it underscores the capacity of such methodologies to tackle urban heat islands. The results imply that greening enhances thermal comfort and fortifies the urban ecosystem’s capacity to withstand the repercussions of elevated temperatures.
To quantify the environmental benefits, the reduction in CO2 emissions was assessed. As assessed in the methodology, average values for CO2 reduction per tree and per plant (from façade greening) were derived from the existing literature. Adding nine trees resulted in an annual reduction of 204.3 kg of CO2, while roof and façade gardening for buildings surrounding the hospital contributed an additional 8000 kg/year of CO2. The collective effect of these interventions resulted in an annual reduction of approximately 8.2 tons of CO2.
This substantial decrease in CO2 emissions underscores the pivotal role of urban greenery in carbon sequestration. While the findings are specific to the intervention area, they underscore the potential for such measures to be implemented on a larger scale in urban areas. This finding demonstrates the efficacy of nature-based solutions in complementing broader efforts to mitigate climate change by reducing greenhouse gas concentrations in urban environments.
Furthermore, the introduction of trees and façade greening resulted in an augmentation of the total green area within the city. The intervention added 0.01 km2 (100 × 100 m2) of greenery, representing an approximate 1% increase in urban green space. While the percentage increase may appear negligible, its implications are far-reaching. Green spaces enhance urban biodiversity, aesthetic value, and community well-being. When implemented systematically across an urban area, such interventions have the potential to foster significant ecological and social benefits.
In the context of air quality assessment, the Leonardo module was utilised to evaluate reductions in PM2.5 concentrations. The simulation results indicated a maximum reduction of 1.33 µg/m3 in PM2.5 concentrations due to the greening interventions, translating into a total annual reduction of 11,650.8 µg/m3. Figure 10 shows the result based on the absolute difference of PM2.5 concentration at 6 PM of a day in March (most vehicles on the road). It is important to note that the maximum reduction in the PM2.5 concentration is near the crossroad, where maximum vehicle density is expected. Moreover, the reduction in PM2.5 is concentrated in the pollution source (vehicles on roads).
The observed reduction in PM2.5 concentrations thus demonstrates the capacity of urban greening to improve air quality by capturing particulate matter. While the decrease may appear negligible per unit, its cumulative impact over time and across multiple areas can substantially enhance public health outcomes. The positive impact on public health, as evidenced by the reduction in respiratory and cardiovascular diseases, underscores the significance of air quality in sustainable urban development. These results reinforce the importance of integrating nature-based solutions into urban planning frameworks to tackle pressing environmental issues. Additionally, the incremental increase in green coverage contributes to long-term sustainability by fostering biodiversity, improving aesthetic value, and enhancing the overall liveability of urban areas.
In conclusion, the findings demonstrate that even small-scale greening interventions can yield tangible environmental and social benefits. By expanding such strategies across multiple regions, cities can achieve significant progress toward sustainability and resilience in the face of climate and pollution challenges.

4.2. Action 2: Installing Rooftop Solar PV System on the Hospital Rooftop

The results for this intervention were obtained using the software PVsyst, which was employed to simulate the proposed area using the monthly meteorological data from the PVsyst built-in database (Varanasi − Meteonorm 7.2 (1991–2010, Sat = 100% − Synthetic)). Most settings, including Albedo, design conditions, and design limitations, were left as their default settings. However, site-specific sizing temperatures can be entered under the “Design Condition” tab.
Once the site and the meteorological inputs of the project had been defined, the first variant of the project was created. This process involved the optimal plane tilt and azimuth angle, followed by selecting the solar PV module and inverter. The solar panel used by the BenQ solar manufacturer for the study is based on panel availability in the Indian market. The solar panels were arranged in series and parallel configurations, with 12 panels in each configuration. The battery used was an 11,000 Ah model. The total area required for the module was determined to be 235 m2. A Maximum Power Point Tracking (MPPT) controller was employed to optimise the energy production from the solar PV system. The load requirements of the hospital were then defined to align with its daily energy needs, as determined by the study.
Table 10 shows the result based on the settings and simulation in the software PVsyst, as discussed in the actions section. The E_user column indicates the total energy consumed or delivered to meet the hospital’s demand, which is 59.58 MWh/year. The system is marginally oversized for emergencies. Consequently, unused energy is abundant (battery full) in most months. The column entitled ‘E_Unused’ denotes the value of energy deemed to have been wasted, equivalent to 10.73 MWh/year, in contrast to the demand of 60.8 MWh/yr. It is imperative to minimise the loss and wastage of energy. It is important to note that the actual annual requirement is 60.8 MWh/year; however, only 59.58 MWh/year is consumed. It is evident that the battery and the unused energy, if required, are sufficient to meet the requirement.
  • E_Avail represents the total available energy at the system’s output, which typically accounts for the energy produced by the photovoltaic (PV) array after considering losses such as shading, temperature effects, and soiling. However, it does not yet consider energy management issues such as storage limitations or demand constraints.
  • E_Unused represents the total unused energy when the battery is fully charged, also called wasted energy.
  • E_User represents the total energy consumed or delivered to the hospital, whether from solar, battery, or both, depending on the need and load curve.
The graphical representation of the aforementioned results is shown in Figure 11.
The analysis of the rooftop photovoltaic (PV) system was thus found to be a beneficial and effective solution for addressing pollution while meeting the hospital’s sustainable energy requirements.
Furthermore, given the hospital’s annual energy requirement of 60.8 MWh, the projected CO2 emissions from coal or natural gas-fired power plants are as follows (Table 11).
As can be seen from the aforementioned data, the amount of CO2 emissions per year that can be reduced by implementing a rooftop solar PV system is significant. The potential exists to extend this intervention to other city areas for greater impact. The total average reduction in CO2 emissions per year is estimated to be 65 tons.
Moreover, the study of PM2.5 emissions from the coal-fired power plant indicates that 60.8 MWh/year of renewable energy from the solar PV system for the hospital would result in a total PM2.5 reduction of 2,432,000 μg/year.

4.3. Action3: Electric Bicycle and Route

The introduction of 50 electric bicycles from the emerging Yulu brand was proposed as a strategic intervention to address congestion, air pollution, and noise in one of the city’s busiest areas. Each bicycle is equipped with a 400 Ah battery, enabling mid-range travel, and it is estimated that each bicycle will be used approximately 25 times per day, covering an estimated annual distance of 36,500 km per bicycle. The proposal was designed to reduce reliance on approximately 1250 diesel- and petrol-powered vehicles, contributing to significant environmental and mobility improvements.
The impact of this intervention was analysed in terms of reductions in CO2 and PM2.5 emissions. Utilising the average CO2 emission values for diesel cars and petrol motorcycles per kilometre, it is estimated that introducing electric bicycles will reduce approximately 253 tons of CO2 emissions per year. This substantial reduction underscores the environmental benefits of transitioning to electric mobility, particularly in urban areas with high traffic density. Replacing internal combustion engine vehicles directly reduces greenhouse gas emissions, aligning with global and local sustainability targets.
The effect on particulate matter emissions was equally significant. Utilising the average PM2.5 emission values per kilometre for diesel cars and petrol motorcycles, it was estimated that the annual distance traversed by the 50 bicycles (1,825,000 km) would result in a reduction of 18,250 g (18.25 × 10⁶ μg) of PM2.5. This reduction is critical in improving air quality, especially in areas with heavy vehicular traffic where particulate pollution poses serious health risks. A reduction in PM2.5 levels has been associated with a decrease in the prevalence of respiratory and cardiovascular illnesses, thus providing both environmental and public health benefits.
The introduction of electric bicycles has the potential to address both emission-related challenges and noise pollution. The quieter operation of electric bicycles compared to conventional vehicles has been shown to enhance the overall urban environment, creating a more pleasant and less stressful atmosphere for residents and visitors alike. Additionally, by improving mobility and reducing congestion, the intervention supports the efficiency of urban transport systems, demonstrating the potential of sustainable transportation solutions in addressing urban challenges.

4.4. Actions 4 and 5: Advertisement and Job Creation

The survey responses, which included 154 participants, were used to determine the prioritisation of the proposed actions. This was achieved by calculating the percentage of agreement for each action. These percentages reflect the perceived impact of each intervention. For instance, 23% of respondents identified Action 1 as having the greatest potential to create a significant impact compared to the other actions.
Concerning job creation, the number of jobs generated by each proposed action varies depending on the scale of the project, its complexity, local labour practises, and the time required to complete the task. The following assumptions were made regarding the labour demands for each action:
  • The Roof and Façade greening on surrounding houses and planting trees: 15 workers;
  • Installing solar PV system on the rooftop of the hospital: 20 workers;
  • 50 electrical bicycle proposals and routes: 18 workers;
  • Others: 5 workers.

4.5. Incidence Matrix

Five actions are proposed, and their impact on the aforementioned axes is measured using the most representative indicators. Subsequently, the values for the actions are normalised. This section ranks the actions according to their impact, cost, and time feasibility.
The impact of each action was observed on different axis and the values obtained are as follows in Table 12.
At this stage, time and economic feasibility calculations are conducted and shown in Table 13, incorporating a detailed analysis of the timeframes required and the associated costs for each proposed intervention (both time and economic feasibility consider only the commissioning phase). Time feasibility is considered only when commissioning time is considered, and the number of days is assumed based on similar interventions [67]. Simultaneously, the entire scaling process is implemented to ensure data consistency and enable meaningful comparisons among the various proposed actions. As a result of these operations, Table 14 presents the final normalised and scaled values for all the analysed actions. This table provides a concise and systematic representation of the results, forming a robust basis for decisions regarding implementing the proposals.
Again, scaling on a scale of 0 to 1 is performed to determine economic and time feasibility.
In conclusion, the final ranking is as shown in Table 15.

5. Conclusions, Future Developments and Limitations of the Study

This study proposed and evaluated a multi-axis approach to address sustainable development challenges in a specific district of Varanasi, integrating solutions targeting the environment, energy, mobility, community, and economy. Various interventions were analysed using simulation tools such as ENVI-met and PVsyst, including nature-based solutions, photovoltaic system installations, and the introduction of electric bicycles. A ranking system was employed to prioritise actions based on their impact, economic feasibility, and implementation timeline.
The key findings are as follows:
  • Nature-Based Solutions: Adding trees and façade greening resulted in potential localised temperature reductions of up to 0.07 °C and an annual decrease in CO2 emissions of approximately 8.2 tons. Furthermore, improvements in air quality were observed, with PM2.5 concentrations potentially reduced by 1.33 µg/m3 in areas experiencing high traffic.
  • Photovoltaic System: Installing solar panels on the hospital’s rooftop could meet 98% of the building’s energy demand, preventing approximately 65 tons of CO2 emissions annually compared to conventional energy sources.
  • Electric Mobility: Electric bicycles could substantially reduce CO2 emissions, estimated to be over 250 tons annually. The intervention also had beneficial effects on air quality and noise pollution.
The findings underscore the efficacy of integrated strategies in enhancing urban living conditions and promoting environmental sustainability. However, the replicability of such interventions requires context-specific adjustments and robust community engagement. Policymakers should therefore prioritise integrating multi-axis strategies that simultaneously address environmental, energy, mobility, community, and economic challenges. Such integration can be achieved by leveraging various tools and techniques, including simulation software and community engagement initiatives. These will ensure the effectiveness and sustainability of the interventions. Implementing such integrated approaches can enhance urban living conditions, reduce CO2 emissions, and improve air quality while concomitantly fostering long-term economic and social benefits.
Future research could focus on scaling up these interventions and assessing their long-term impacts. This multi-faceted approach underscores the importance of effectively aligning technological, environmental and social solutions to urban challenges. Several effective future studies can be carried out for the energy axis, which may include a grid-connected PV system (oversized) to meet the demand of the hospital and surrounding houses by selling the extra energy produced. Given the critical nature of effective waste management in urban areas, a biogas plant could be a viable alternative. Within the environment axis, the proposed green area extension plan can be extended to other significant locations in the city, including busy areas such as Luxa road and Cantt road. Furthermore, implementing an effective noise reduction strategy in the city’s busiest areas can prove to be a significant action. In terms of mobility, the introduction of new routes and an increase in the number of electric bicycles could be effective in reducing traffic congestion.
Nevertheless, the limitations of the present study can be developed and improved, including strengthening the community and economic axes by proposing smart indicators and studying actions. The enhancement of the economic axis could facilitate a sensitivity analysis, encompassing factors such as investment cost, payback period, inflation, and annual savings. This analysis would influence the ranking of actions. Additionally, the quantification of the effect of a proposed action on another can be facilitated by using a smart indicator. For instance, the area temperature can be measured before and after installing a rooftop solar PV system. Furthermore, given the limitations of the aforementioned software, it is recommended that advanced industrial software be employed to minimise the error band and provide real-time results.

Author Contributions

Conceptualization, F.B. and F.V.; methodology, F.B. and F.V.; software, T.G. and B.A.; formal analysis, F.V.; investigation, T.G.; data curation, T.G. and B.A.; writing—original draft preparation, T.G. and F.V.; writing—review and editing, F.V. and T.G.; supervision, F.B. All authors have read and agreed to the published version of the manuscript.

Funding

This research received no external funding.

Institutional Review Board Statement

Not applicable.

Informed Consent Statement

Not applicable.

Data Availability Statement

The original data presented in the study are openly available.

Conflicts of Interest

The authors declare no conflict of interest.

References

  1. Harrison, C.; Eckman, B.; Hamilton, R.; Hartswick, P.; Kalagnanam, J.; Paraszczak, J.; Williams, P. Foundations for Smarter Cities. IBM J. Res. Dev. 2010, 54, 1–16. [Google Scholar] [CrossRef]
  2. Goldsmith, S. As the Chorus of Dumb City Advocates Increases, How Do We Define the Truly Smart City? Available online: https://datasmart.hks.harvard.edu/chorus-dumb-city-advocates-increases-how-do-we-define-truly-smart-city (accessed on 9 March 2025).
  3. Peris-Ortiz, M. Sustainable Smart Cities; Peris-Ortiz, M., Bennett, D.R., Pérez-Bustamante Yábar, D., Eds.; Springer International Publishing: Cham, Switzerland, 2017; ISBN 978-3-319-40894-1. [Google Scholar]
  4. Boyd, C. The 3 Generations of Smart Cities Inside the Development of the Technology Driven City; The Fast Company: New York, NY, USA, 2015. [Google Scholar]
  5. Fadhel, M.A.; Duhaim, A.M.; Saihood, A.; Sewify, A.; Al-Hamadani, M.N.A.; Albahri, A.S.; Alzubaidi, L.; Gupta, A.; Mirjalili, S.; Gu, Y. Comprehensive Systematic Review of Information Fusion Methods in Smart Cities and Urban Environments. Inf. Fusion 2024, 107, 102317. [Google Scholar] [CrossRef]
  6. Oladimeji, D.; Gupta, K.; Kose, N.A.; Gundogan, K.; Ge, L.; Liang, F. Smart Transportation: An Overview of Technologies and Applications. Sensors 2023, 23, 3880. [Google Scholar] [CrossRef] [PubMed]
  7. Razmjoo, A.; Gandomi, A.H.; Pazhoohesh, M.; Mirjalili, S.; Rezaei, M. The Key Role of Clean Energy and Technology in Smart Cities Development. Energy Strategy Rev. 2022, 44, 100943. [Google Scholar]
  8. Gil, O.; Cortés-Cediel, M.E.; Cantador, I. Citizen Participation and the Rise of Digital Media Platforms in Smart Governance and Smart Cities. Int. J. E Plan. Res. 2019, 8, 19–34. [Google Scholar] [CrossRef]
  9. Simonofski, A.; Asensio, E.S.; Wautelet, Y. Citizen Participation in the Design of Smart Cities. In Smart Cities: Issues and Challenges; Elsevier: Amsterdam, The Netherlands, 2019; pp. 47–62. [Google Scholar]
  10. Shahidehpour, M.; Li, Z.; Ganji, M. Smart Cities for a Sustainable Urbanisation: Illuminating the Need for Establishing Smart Urban Infrastructures. IEEE Electrif. Mag. 2018, 6, 16–33. [Google Scholar] [CrossRef]
  11. Diaz-Sarachaga, J.M. Developing an Assessment Governance Framework for Urban Digital Twins: Insights from Smart Cities. Cities 2025, 156, 105558. [Google Scholar] [CrossRef]
  12. 2021 Global Smart City Index. Available online: https://www.quantumesco.it/En/2021-Global-Smart-City-Index/#:~:Text=Singapore%20(1st)%2C%20Zurich%20(,Of%20the%20COVID%2D19%20pandemic (accessed on 9 March 2025).
  13. Towards a Sustainable Future, K-Smart City. Available online: https://smartcity.go.kr/en/2024/10/31/towards-a-sustainable-future-k-smart-city/ (accessed on 9 March 2025).
  14. Addas, A. The Concept of Smart Cities: A Sustainability Aspect for Future Urban Development Based on Different Cities. Front. Environ. Sci. 2023, 11, 1241593. [Google Scholar] [CrossRef]
  15. Mangialavori, M.; Pompei, L.; Nardecchia, F.; Bisegna, F.; Fichera, A.; Rizzo, G.; Tronchin, L.; Schibuola, L. Towards the Definition of a Sustainable Smart Model for the Suburbs Redevelopment. In Proceedings of the 2020 IEEE International Conference on Environment and Electrical Engineering and 2020 IEEE Industrial and Commercial Power Systems Europe (EEEIC/I&CPS Europe), Madrid, Spain, 9–12 June 2020; pp. 1–6. [Google Scholar]
  16. Wang, H.; Wang, Y. Smart Cities Net Zero Planning Considering Renewable Energy Landscape Design in Digital Twin. Sustain. Energy Technol. Assess. 2024, 63, 103629. [Google Scholar] [CrossRef]
  17. Güngör, V.C.; Sahin, D.; Kocak, T.; Ergüt, S.; Buccella, C.; Cecati, C.; Hancke, G.P. Smart Grid Technologies: Communication Technologies and Standards. IEEE Trans. Industr. Inform. 2011, 7, 529–539. [Google Scholar] [CrossRef]
  18. Nam, T.; Pardo, T.A. Conceptualizing Smart City with Dimensions of Technology, People, and Institutions. In Proceedings of the 12th Annual International Digital Government Research Conference: Digital Government Innovation in Challenging Times, College Park, MD, USA, 12–15 June 2011; pp. 282–291. [Google Scholar]
  19. Ismagilova, E.; Hughes, L.; Dwivedi, Y.K.; Raman, K.R. Smart Cities: Advances in Research—An Information Systems Perspective. Int. J. Inf. Manag. 2019, 47, 88–100. [Google Scholar] [CrossRef]
  20. Caragliu, A.; del Bo, C.; Nijkamp, P. Smart Cities in Europe. J. Urban Technol. 2011, 18, 65–82. [Google Scholar] [CrossRef]
  21. Komninos, N. Intelligent Cities: Variable Geometries of Spatial Intelligence. Intell. Build. Int. 2011, 3, 172–188. [Google Scholar] [CrossRef]
  22. Bulkeley, H.; Betsill, M.M. Rethinking Sustainable Cities: Multilevel Governance and the “urban” Politics of Climate Change. Environ. Polit. 2005, 14, 42–63. [Google Scholar] [CrossRef]
  23. Chiesura, A. The Role of Urban Parks for the Sustainable City. Landsc. Urban Plan. 2004, 68, 129–138. [Google Scholar] [CrossRef]
  24. Mounce, R.; Nelson, J.D. On the Potential for One-Way Electric Vehicle Car-Sharing in Future Mobility Systems. Transp. Res. Part A Policy Pract. 2019, 120, 17–30. [Google Scholar] [CrossRef]
  25. Delitheou, V.; Meleti, V.; Athanassopoulos, C.G.E. Green Economy and Smart City. J. Reliab. Intell. Environ. 2019, 5, 235–240. [Google Scholar] [CrossRef]
  26. Pucher, J.; Buehler, R. Making Cycling Irresistible: Lessons from The Netherlands, Denmark and Germany. Transp. Rev. 2008, 28, 495–528. [Google Scholar] [CrossRef]
  27. Cerreta, M.; Panaro, S. From Perceived Values to Shared Values: A Multi-Stakeholder Spatial Decision Analysis (M-SSDA) for Resilient Landscapes. Sustainability 2017, 9, 1113. [Google Scholar] [CrossRef]
  28. Bruse, M.; Fleer, H. Simulating Surface-Plant-Air Interactions inside Urban Environments with a Three Dimensional Numerical Model. Environ. Model. Softw. 1998, 13, 373–384. [Google Scholar]
  29. Zomers, A.N. Rural Electrification. Ph.D. Thesis, University of Twente, Twente, The Netherlands, 2001. [Google Scholar]
  30. Yang, J.; Hu, X.; Feng, H.; Marvin, S. Verifying an ENVI-Met Simulation of the Thermal Environment of Yanzhong Square Park in Shanghai. Urban For. Urban Green. 2021, 66, 127384. [Google Scholar] [CrossRef]
  31. Pastore, L.M.; de Santoli, L. 100% Renewable Energy Italy: A Vision to Achieve Full Energy System Decarbonisation by 2050. Energy 2025, 317, 134749. [Google Scholar] [CrossRef]
  32. Kumar, P.; Debele, S.E.; Khalili, S.; Halios, C.H.; Sahani, J.; Aghamohammadi, N.; de Andrade, M.F.; Athanassiadou, M.; Bhui, K.; Calvillo, N.; et al. Urban Heat Mitigation by Green and Blue Infrastructure: Drivers, Effectiveness, and Future Needs. Innovation 2024, 5, 100588. [Google Scholar] [CrossRef] [PubMed]
  33. Shahrokni, H.; Årman, L.; Lazarevic, D.; Nilsson, A.; Brandt, N. Implementing Smart Urban Metabolism in the Stockholm Royal Seaport: Smart City SRS. J. Ind. Ecol. 2015, 19, 917–929. [Google Scholar] [CrossRef]
  34. Ahvenniemi, H.; Huovila, A.; Pinto-Seppä, I.; Airaksinen, M. What Are the Differences between Sustainable and Smart Cities? Cities 2017, 60, 234–245. [Google Scholar] [CrossRef]
  35. Anthopoulos, L.G. Understanding Smart Cities: A Tool for Smart Government or an Industrial Trick? Springer: Berlin/Heidelberg, Germany, 2017. [Google Scholar]
  36. Kitchin, R. The Real-Time City? Big Data and Smart Urbanism. GeoJournal 2014, 79, 1–14. [Google Scholar] [CrossRef]
  37. Santos, O.; Ribeiro, F.; Metrôlho, J.; Dionísio, R. Using Smart Traffic Lights to Reduce CO2 Emissions and Improve Traffic Flow at Intersections: Simulation of an Intersection in a Small Portuguese City. Appl. Syst. Innov. 2023, 7, 3. [Google Scholar] [CrossRef]
  38. Jiang, J.; Li, Y.; Li, Y.; Li, C.; Yu, L.; Li, L. Smart Transportation Systems Using Learning Method for Urban Mobility and Management in Modern Cities. Sustain. Cities Soc. 2024, 108, 105428. [Google Scholar] [CrossRef]
  39. Maier, S. Smart Energy Systems for Smart City Districts: Case Study Reininghaus District. Energy Sustain. Soc. 2016, 6, 23. [Google Scholar] [CrossRef]
  40. Macke, J.; Rubim Sarate, J.A.; de Atayde Moschen, S. Smart Sustainable Cities Evaluation and Sense of Community. J. Clean. Prod. 2019, 239, 118103. [Google Scholar] [CrossRef]
  41. Tundys, B.; Wiśniewski, T. Smart City and Sustainable Energy—Evidence from the European Union Capital Cities. Energies 2024, 17, 4678. [Google Scholar] [CrossRef]
  42. Correia, D.; Teixeira, L.; Marques, J. Triangular pyramid trunk: The three axes of the smart city assessment tool. In WIT Transactions on Ecology and the Environment; WIT Press: Southampton, UK, 2020; pp. 79–90. [Google Scholar]
  43. Available online: https://en.wikipedia.org/wiki/Varanasi_district (accessed on 3 March 2024).
  44. Available online: https://www.census2011.co.in/census/city/153-varanasi.html (accessed on 9 March 2025).
  45. Available online: https://weatherspark.com/y/110718/average-weather-in-varanasi-india-year-round (accessed on 3 March 2024).
  46. Available online: https://timesofindia.indiatimes.com/city/varanasi/varanasis-green-cover-loses-%20sheen/articleshow/38938286.cms (accessed on 3 March 2024).
  47. Available online: https://iced.niti.gov.in/energy (accessed on 3 March 2024).
  48. Google Maps. Godowlia, Varanasi, Uttar Pradesh 221001, India. Available online: https://www.google.com/maps/place/Godowlia,+Varanasi,+Uttar+Pradesh+221001,+India/@25.3096207,83.006504,17z/data=!3m1!4b1!4m6!3m5!1s0x398e2e1dd92f9889:0xa61275607925c1fc!8m2!3d25.3100747!4d83.0096485!16s%2Fg%2F11c1m_vl0s?entry=ttu&g_ep=EgoyMDI1MDMyNS4xIKXMDSoASAFQAw%3D%3D (accessed on 27 January 2024).
  49. Michael Bruse and Team. ENVI-Met Manual; 2010; Available online: https://envi-met.info/documents/onlinehelpv3/hs20.htm (accessed on 9 March 2025).
  50. Qi, L.; Li, T.; Chang, B.; Xiong, W. Research on Thermal Comfort Evaluation and Optimization of Green Space in Beijing Dashilar Historic District. Buildings 2024, 14, 3121. [Google Scholar] [CrossRef]
  51. Du, M.; Zhao, Y.; Yang, J.; Wang, W.; Luo, X.; Zhong, Z.; Huang, B. Impact of ENVI-Met-Based Road Greening Design on Thermal Comfort and PM2.5 Concentration in Hot–Humid Areas. Sustainability 2024, 16, 8475. [Google Scholar] [CrossRef]
  52. Available online: https://Weatherspark.Com/h/y/110718/2022/Historical-Weather-during-2022-in-Varanasi-India#Figures-Temperature (accessed on 27 January 2024).
  53. Available online: https://globalsolaratlas.info/map?C=25.918526,83.010635,11&s=25.312262,83.005005&m=site&pv=medium,180,23,100 (accessed on 3 March 2024).
  54. Available online: https://www.fortomorrow.eu/en/blog/co2-tree (accessed on 27 January 2024).
  55. Seyedabadi, M.R.; Eicker, U.; Karimi, S. Plant Selection for Green Roofs and Their Impact on Carbon Sequestration and the Building Carbon Footprint. Environ. Chall. 2021, 4, 100119. [Google Scholar] [CrossRef]
  56. Available online: https://Cpcb.Nic.in/Annual-Report/ (accessed on 27 January 2024).
  57. Energy Efficiency in Hospitals—Best Practice Guide March 2009. Available online: https://www.beeindia.gov.in/sites/default/files/HospitalEnergyEfficiencyBestPracticesGuide.pdf (accessed on 9 March 2025).
  58. Ali, A.; Volatier, M.; Darnon, M. Optimal Sizing and Assessment of Standalone Photovoltaic Systems for Community Health Centers in Mali. Solar 2023, 3, 522–543. [Google Scholar] [CrossRef]
  59. Carbon Emissions in TCO2 at IIT (BHU) Varanasi. 2023. Available online: https://www.iitbhu.ac.in/sites/default/files/institute/admin/doc/admin_carbon_emissions%20in_co2.pdf (accessed on 3 March 2024).
  60. Electricity Generation and Related CO2 Emissions. Planète Énergies Article. Available online: https://www.planete-energies.com/en (accessed on 9 March 2025).
  61. Guttikunda, S.K.; Jawahar, P. Atmospheric Emissions and Pollution from the Coal-Fired Thermal Power Plants in India. Atmos. Environ. 2014, 92, 449–460. [Google Scholar] [CrossRef]
  62. Available online: https://omobikes.com/blogs/a-complete-guide-on-electric-cycle-and-ebike/making-india-co2-negative-one-cycle-at-a-time-omo-bikes-electric-mtb-hybrid-cycle (accessed on 27 January 2024).
  63. Available online: https://travelandclimate.org/transport-calculations (accessed on 3 March 2024).
  64. Available online: https://www.gov.uk/vehicle-tax-rate-tables/rates-for-cars-registered-on-or-after-1-march-2001 (accessed on 27 January 2024).
  65. Shahne, M.Z.; Arhami, M.; Hosseini, V.; El Haddad, I. Particulate Emissions of Real-World Light-Duty Gasoline Vehicle Fleet in Iran. Environ. Pollut. 2022, 292, 118303. [Google Scholar] [CrossRef]
  66. Vespasiano, F.; Vespasiano, D.; Troiani, C.; Nardecchia, F.; Pompei, L. Towards Smart Communities: Evaluation of Solar Photovoltaic Panels on a Parking Depot. In Proceedings of the 2023 IEEE International Conference on Environment and Electrical Engineering and 2023 IEEE Industrial and Commercial Power Systems Europe (EEEIC/I&CPS Europe), Madrid, Spain, 6–9 June 2023; pp. 1–5. [Google Scholar]
  67. Available online: https://www.cnet.com/home/energy-and-utilities/what-is-the-solar-panel-installation-timeline-from-purchase-to-power/ (accessed on 3 March 2024).
Figure 1. Graphical methodology.
Sustainability 17 03152 g001
Figure 2. Energy mix for the state of Uttar Pradesh [47].
Sustainability 17 03152 g002
Figure 3. SWOT analysis for the city of Varanasi.
Sustainability 17 03152 g003
Figure 4. Answers to the multiple-choice questions.
Sustainability 17 03152 g004
Figure 5. Answers to the questions with a rating system.
Sustainability 17 03152 g005
Figure 6. Case study [48]. Map data @ 2024.
Sustainability 17 03152 g006
Figure 7. Model overview with (a) and without the greenings (b).
Sustainability 17 03152 g007
Figure 8. Pollution model setup.
Sustainability 17 03152 g008
Figure 9. Absolute difference in potential air temperature (in K) at 2 PM.
Sustainability 17 03152 g009
Figure 10. Absolute difference of PM2.5 concentration (in µg/m3) at 6 PM.
Sustainability 17 03152 g010
Figure 11. Graphical representation of PVsyst results.
Sustainability 17 03152 g011
Table 1. Case study.
DataValue
Geographical data [43]Stretched between
82°56′ E–83°03′ E and 25°14′ N–25°23.5′ N
Varanasi district 1535 km2
Population [44]1.7 million (2024) (approx.)
Climate [45]Avg. temperature 16–33 °C
Avg. Relative humidity 45–84%
Table 2. Average temperatures and weather conditions.
MonthAverage TemperatureWeather Highlights
January12.00Cool, occasional fog
February14.00Mild, clear skies
March19.00Warm, dry
April37.00Very hot, dry
May39.00Extremely hot, dry
June37.00Hot, onset of monsoon
July33.00Monsoon rains, high humidity
August32.00Heavy rain, high humidity
September33.00Monsoon tapering off
October32.00Pleasant, dry
November15.00Mild, clear skies
December11.00Cool, dry
Table 3. Questions of the survey proposed.
Question NumberSurvey QuestionQuestion Type
1How would you rate the traffic congestion of Varanasi?Rating 1–5 (1 worst)
2How would you rate the transportation coverage around the city?Rating 1–5 (1 worst)
3Do you think Varanasi’s electricity condition has improved?Yes/No/Maybe
4Do you think the River Ganga’s cleanness has been improved?Yes/No/Maybe
5Do you think air pollution is an essential cause of concern in Varanasi?Yes/No/Maybe
6Do you think the quality of healthcare is good in Varanasi?Yes/No/Maybe
7Do you think the quality of educational services is good in Varanasi?Yes/No/Maybe
Table 4. Actions proposed.
Action DescriptionAction #
Nature Based Solutions (NBS)Action 1
Installing solar PV system on the rooftop of the hospitalAction 2
50 electrical bicycle proposals and routeAction 3
Advertisement: Billboard and InstagramAction 4
Job creationAction 5
Table 5. Model configuration parameters.
Case Study
LocationVaranasi, India
Climate typeHumid subtropical climate
Simulation period11 March
Total simulation duration24 h
Spatial resolution2 × 2 × 2
Domain size50 × 50 × 16
Model rotation
Table 6. Electricity demand of the hospital.
DescriptionValueUnit
Average Electricity Consumption608[kWh/bed/year]
Number of Beds100#
Average Daily Energy Demand166.6[kWh/day]
Average yearly Energy Demand for 100 beds60.8[MWh/year]
Available Space1600[m2]
Table 7. Estimated emissions for Diesel cars.
DescriptionValue
Fuel Efficiency6 L/100 km
CO2 Emission per Litre of Diesel2.7 kg
CO2 Emission per Kilometre0.162 kg/km
Annual Distance Travelled36,500 km
Estimated Annual CO2 Emission5913 kg/year
Table 8. Estimated emissions for Petrol cars.
DescriptionValue
Fuel Efficiency5 L/100 km
CO2 Emission per Litre of Petrol2.3 kg
CO2 Emission per Kilometre0.115 kg/km
Annual Distance Travelled36,500 km
Estimated Annual CO2 Emission4197.5 kg/year
Table 9. Key Performance Indicators.
Smart Axis Smart IndicatorsCodeDescriptionUnit
EnvironmentReduction of CO2Env1Reduction of CO2 emissions[Tons/year]
Proposal of greeningEnv2Green areas to promote biodiversity and recreation [%]
Air Quality IndexEnv3Monitoring and improving air quality
Reduction in PM2.5
[Micro g/m3]
EnergyEnergy produced by renewable sourcesEne1Energy generated from rooftop solar PV[MWh/year]
MobilityCongestion Mob1Car or motorcycle reduction[#/day]
Cycling routeMob2Route for Electric bicycle[KM]
Clean energy transportMob3Electrical bicycle use[#]
CommunityCommunity participation measuresCom1Advertisement via billboard and Instagram[%]
EconomyJob opportunitiesEco1Job creation[#]
Table 10. Results obtained from PVsyst.
MonthE_Avail [KWh]E_Unused [KWh]E_User [KWh]
January52391425060
February606411764570
March700817315060
April669416424897
May693116895060
June59168494897
July52153055060
August525005060
September56224494897
October617311755060
November61739154897
December58786575060
Total72,16410,73059,580
Table 11. CO2 emissions for Coal and Natural Gas Power Plants.
Power Plants CO2 EmissionCO2 Emission for 60.8 MWh
Coal Fired Power plant 1.14 kg/kWh69,312 kg
Natural Gas Power Plant1 kg/kWh60,800 kg
Table 12. Summary of quantifying impact of actions in each axe.
Smart Axis CodeAction 1Action 2Action 3Action 4Action 5Mean
EnvironmentEnv18.2652530065.240
Env2100000.20
Env311,650.82,432,00018,250,000,000003,650,488,730.16
EnergyEne1060.800012.16
MobilityMob100125000250.00
Mob2003.9000.78
Mob300500010.00
CommunityCom123501161020.00
EconomyEco11520183211.60
Table 13. Economic and time feasibility of the actions.
Action 1Action 2Action 3Action 4Action 5
Time feasibility10956021070
Economic feasibility900,0005,000,00018,000,000100,000100,000
Table 14. Final data for the different actions.
Smart Axis CodeAction 1Action 2Action 3Action 4Action 5
EnvironmentEnv1−40500
Env250000
Env3−4−4500
EnergyEne105000
MobilityMob100500
Mob200500
Mob300500
CommunityCom115−30−3
EconomyEco1254−40
Time feasibility 00.9450.8080.9941
Economic feasibility 0.9550.7260.0001.0001.000
Sum 0.9612.6726.81−2.01−1.00
32154
Table 15. Final ranking.
Action DescriptionRankingAction #
50 electrical bicycle proposals and route1Action 3
Installing solar PV system on roof top of hospital2Action 2
Roof and Façade greening on surrounding houses
and planting trees
3Action 1
Job creation4Action 5
Advertisement: Billboard and Instagram5Action 4
Disclaimer/Publisher’s Note: The statements, opinions and data contained in all publications are solely those of the individual author(s) and contributor(s) and not of MDPI and/or the editor(s). MDPI and/or the editor(s) disclaim responsibility for any injury to people or property resulting from any ideas, methods, instructions or products referred to in the content.

