Abstract
Economic transformation is an effective strategy for resource-based regions to avoid the “resource curse”. In China’s high-quality development stage, using new-generation IT to guide economic structure adjustment, industrial upgrading, and technological innovation is of great practical significance. It also helps regions achieve ecological and high-quality development. Based on SDM, this paper takes smart eco-innovation as the driving force for high-quality transformation. The system constructed is built from five aspects: innovation, coordination, green development, openness, and sharing. Additionally, based on the interrelationships among the subsystems, this paper constructs causal loop diagrams and flow diagrams. Taking Daqing City in China as an example, it conducts a scenario simulation of high-quality transformation driven by smart eco-innovation. The finding shows that the combined policy effects of smart eco-innovation are the most significant for the high-quality transformation of resource-based regions. This study provides a new perspective. It explores the transformation of resource-based regions driven by a “smart eco-style” approach and provides references for such regions in China.
1. Introduction
Since the 21st century, rapid advancements in ICT have sparked a new round of technological and industrial transformations, reshaping the global economic landscape. Examples include the American Manufacturing Renaissance Act, Germany’s “Industry 4.0” strategy, and China’s Made in China 2025 action program. ICT is also driving the evolution of urban development concepts. Originating from IBM’s “Smarter Planet” in 2008, smart ecology has emerged as a key direction for modern cities [1]. Smart eco-cities integrate technologies like AI, big data, and cloud computing. Smart ecology emphasizes two core principles: intelligence and ecological sustainability. The goal is the comprehensive development of society, the economy, culture, and the environment [2]. In 2018, China introduced the concept of “harmonious coexistence between humanity and nature”. This was followed by the Overall Layout Plan for Digital China Construction in 2023, which provided policy support for smart ecology construction. Therefore, strengthening smart ecology construction is crucial for urban development.
The transformation of resource-based cities is a major challenge for many countries [3,4]. In China, resource-based regions have extracted over 52.9 billion tons of raw coal and 5.5 billion tons of crude oil. These regions have played a crucial role in forming China’s industrial system and energy supply system. However, since 2000, they have faced issues like low resource efficiency and severe environmental damage, drawing high government attention. In 2021, the Chinese government approved the Implementation Plan for Promoting High-Quality Development of Resource-Based Regions during the 14th Five-Year period. This plan offers new opportunities for regions’ transformation. In the context of “digital drive and smart development”. China has adopted smart ecology as a new urban development pattern. This is strategically important. It helps integrate economic, social, and ecological benefits while supporting the high-quality transformation of China’s resource-based regions.
When resource-based regions use smart technologies for eco-innovation, they create a smart ecological environment that is innovative, coordinated, green, open, and shared. Smart eco-innovation merges resource-based industries with the digital economy. It makes resources more efficient and creates an innovative environment. It also spawns new business forms like the smart economy, smart management, and smart livelihoods, driving coordinated social and economic development. Intelligent green tech boosts mineral resource efficiency and cuts pollutant emissions, pushing regional industries in a greener direction. Smart eco-innovation upgrades ecological, transportation, and communication resources. This enhances connections with developed areas and boosts regional openness. It also promotes the sharing of achievements. Building smart infrastructure, energy systems, and mining industry platforms has spurred the shared economy and service economy. Smart eco-innovation attracts key factors like talent, capital, tech, and information. It also promotes industrial coordination and new business formation, providing the momentum for high-quality transformation in resource-based regions.
In smart eco-city research, scholars mainly conducted analysis from three aspects: construction, evaluation, and effects of smart cities and eco-cities. Smart cities use advanced tech and data to conserve resources and boost ecological well-being [5,6,7,8]. Xu et al. argued building smart cities involves tech, infrastructure, policy, and human values, with a focus on public and economic benefits [9]. Battarra et al. ranked 38 cities and found key factors: e-government, economy, tech, human capital, ecology, education, and connectivity [10]. Guo et al.’s research indicated that smart cities in China help with energy savings and emission cuts [11]. Eco-cities focus on environmental sustainability and ecological balance [12]. Vandergert et al. created three urban models with eco-patterns like clean tech and ecological design, comparing eco-innovation methods from different cities [13]. Naphade et al. proposed that smart cities are innovative ecosystems, using modern tech to build smart eco-cities [14]. Bibri et al. suggested that smart eco-cities use the Internet of Things and big data technologies for sustainability, blending social, economic, and emerging tech like AI to drive urban comprehensive development [2].
The transformation of resource-based cities is crucial for economic growth, industrial upgrading, and social progress. Why transform? Theories like the life cycle [15,16], resource curse [17,18], and crowding-out effect [19] explain the urgency. For industrial transformation, studies focused on resource endowment, environmental regulation, and tech innovation [20,21], highlighting incentives for structure, innovation, and regulation. Social and economic transformation was also key, with studies on economic growth, income, and social welfare [22,23,24]. Green development is explored through environmental quality [25,26]. On transformation paths, scholars studied policy impacts and business turnover, analyzing economic and social effects [27,28,29]. Cała et al. found Europe’s energy transition would shake up society, requiring public support and solutions for re-employment and mining area restoration [28]. Kim and Lin showed that government involvement was crucial for the economic transformation of resource-based regions [30].
“High-quality development” in China means better development with less input, more efficiency, and lower environmental costs [31]. Chinese studies covered the meaning, evaluation, and influencing factors of high-quality economic development [32,33,34]. Studies have evaluated the transformation and sustainable development of resource-based cities in terms of regional resilience and carrying capacity [35,36,37,38]. Sustainable cities need social equity [39], environmental friendliness [40], and balanced growth [41]. To arrive there, studies suggested using digital tech [42], pollution control, and innovation [43]. New tech like AI and the Internet of Things boosted innovation, resource efficiency, and pollution reduction [44,45]. These technologies will drive “smart eco-style” development in resource-based regions.
Current studies on smart eco-cities, resource-based region transformation, and sustainable development offer useful strategies for guiding regional transformation. However, the existing literature pays little attention to the key role of smart eco-innovation in driving regional development, especially in new-generation IT. There is also a lack of specific analytical models for quantitative analysis in this area. To fill this gap, this paper performs SDM to drive the high-quality transformation of resource-based regions and explores the “smart eco-style” path.
Compared with previous studies, this paper offers new insights. First, it combines the high-quality transformation of resource-based regions with smart eco-innovation. This approach is forward-looking and innovative. It creates a smart-ecological framework, focusing on high-quality change, using smart eco-innovation as the driver and policy as the safeguard. This fills a gap in research on smart-ecological issues in regional transformation. Second, it performs SDM to drive the high-quality transformation of resource-based regions, identifying key patterns. Third, this paper builds a regional transformation drive system based on the principles of “innovation, coordination, green development, openness, and sharing”. It provides a fresh perspective for studying the “smart eco-style” transformation of resource-based regions.
2. Materials and Methods
2.1. System Dynamics Modeling (SDM)
Forrester introduced system dynamics [46] with the aim of analyzing and solving inventory management issues in corporate production. It uses computer simulations to explain cause-and-effect relationships and dynamic changes within systems. Scholars mainly use it to study complex systems [47]. SDM is concentrated on the relationships and mechanisms among various entities. They are applicable, data-driven, accurate, and realistic, fitting the needs of high-quality transformation in resource-based regions.
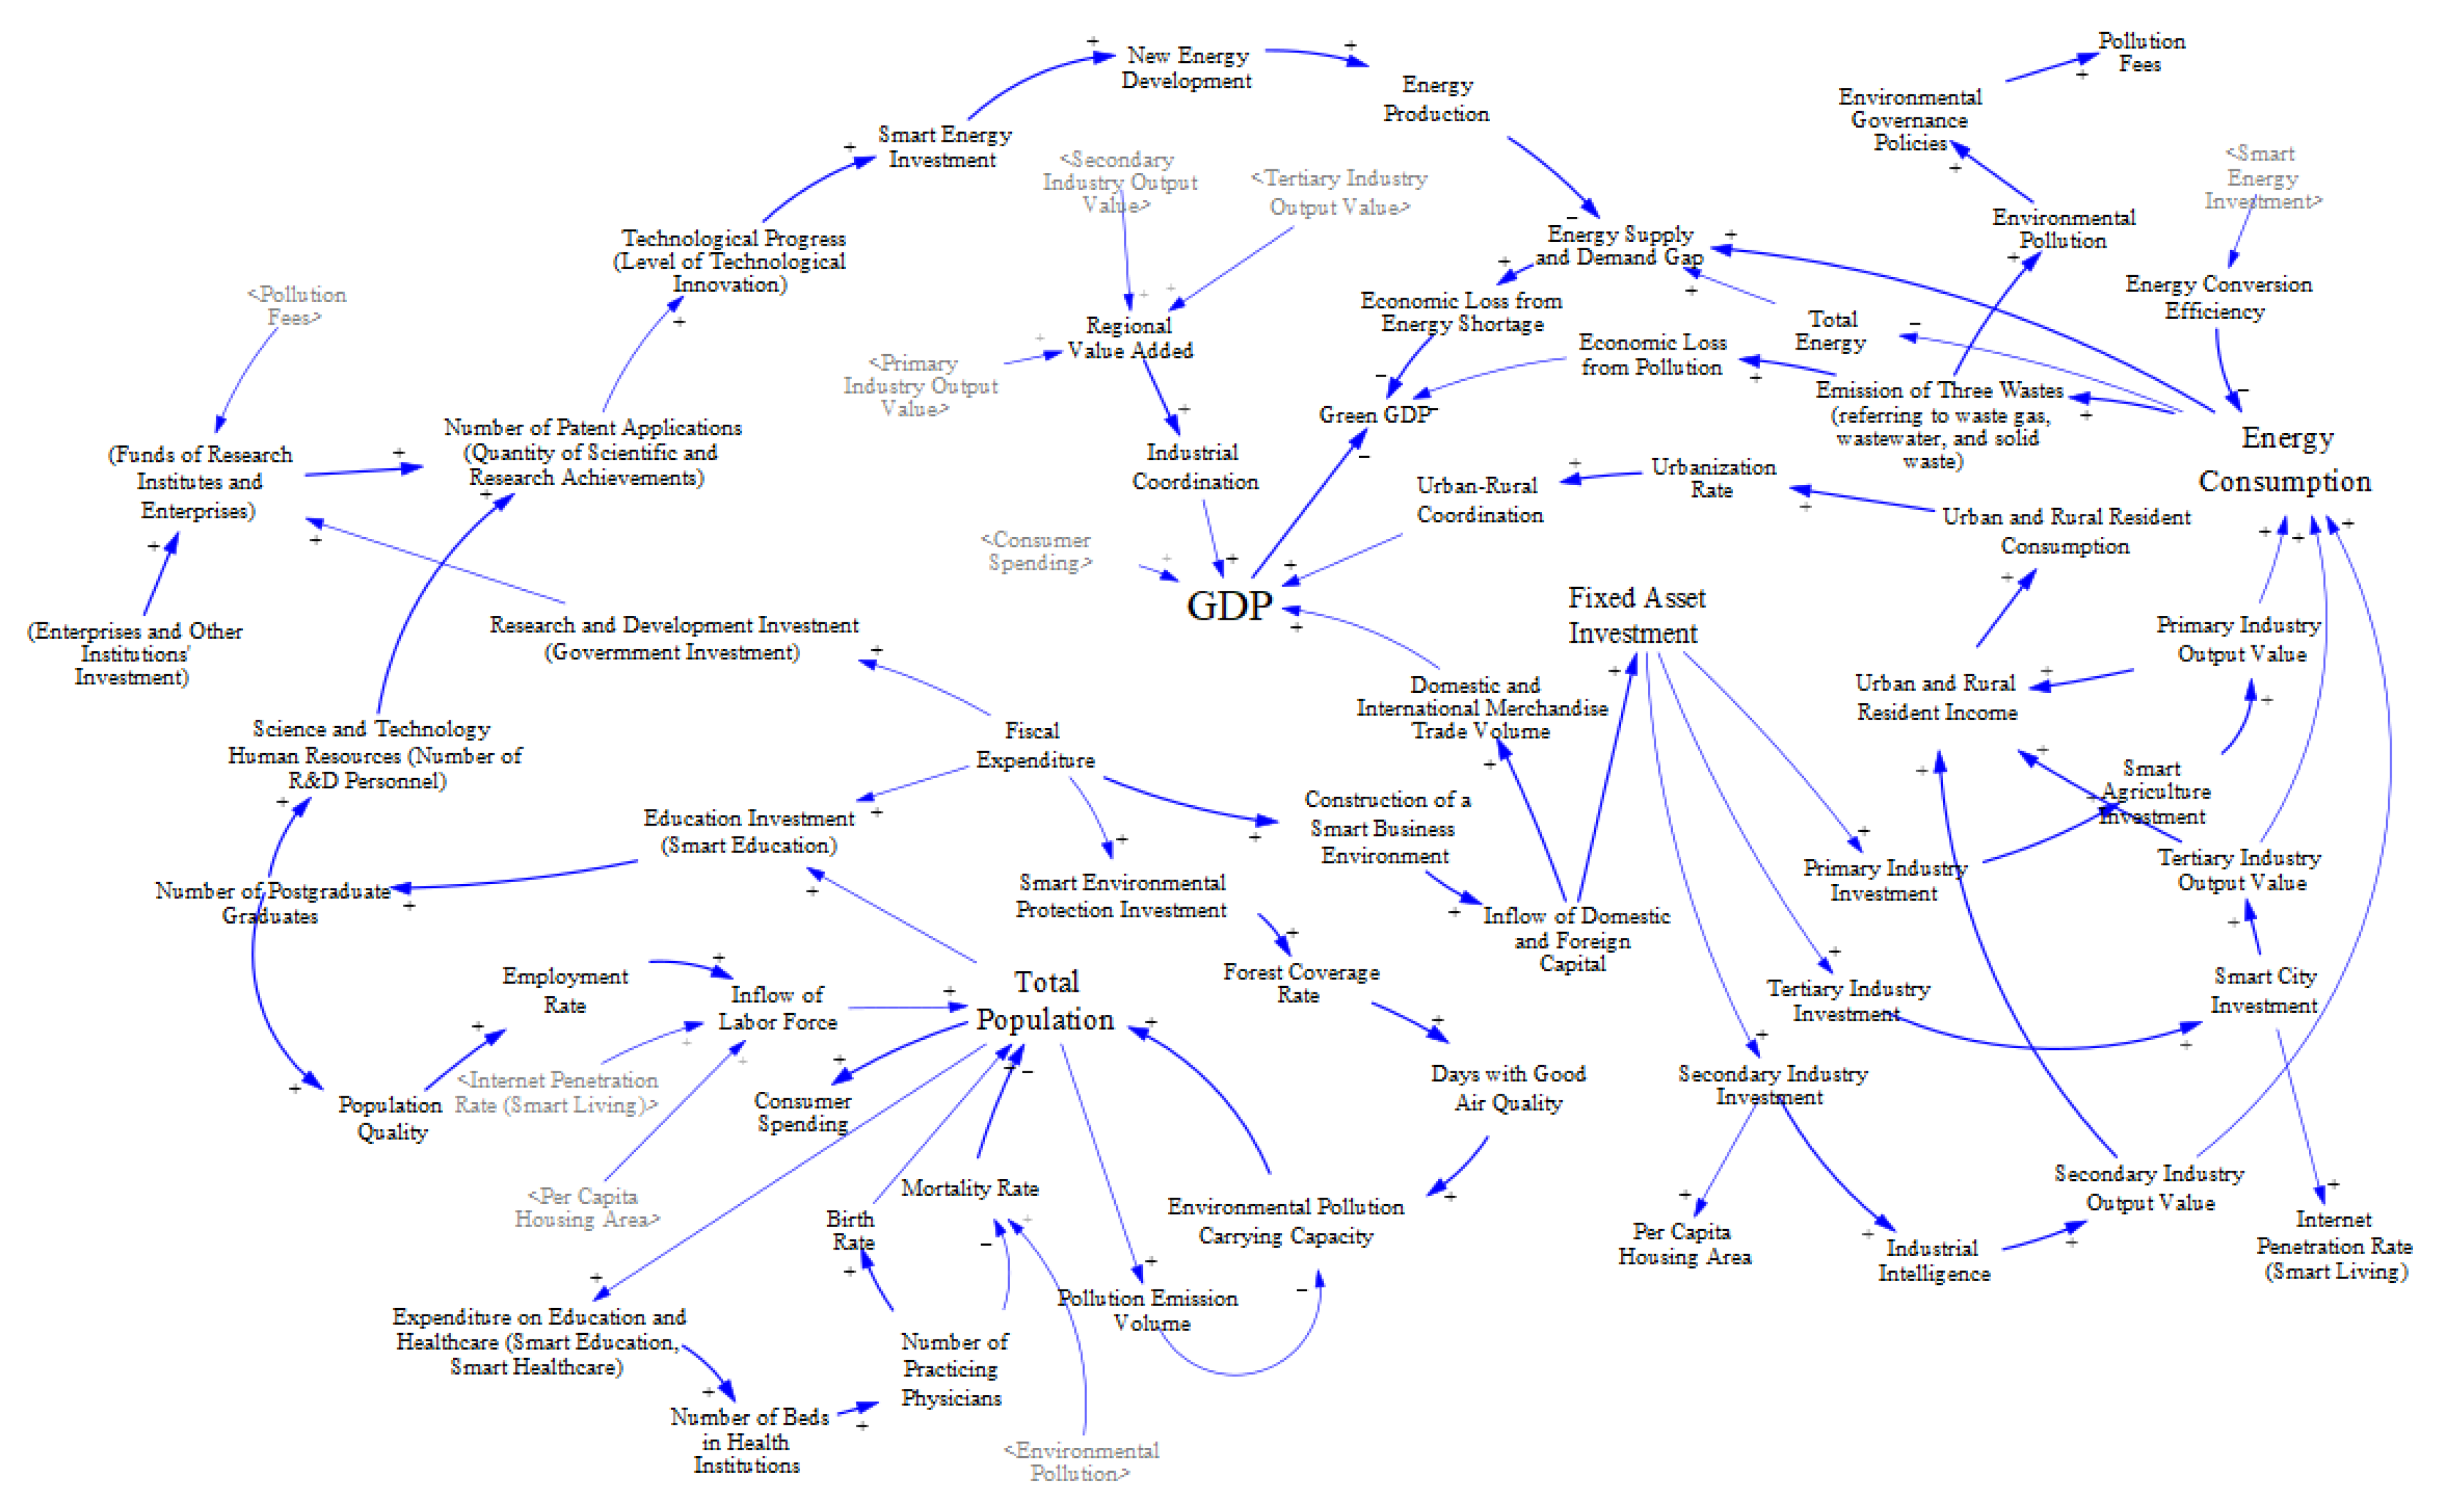
In the high-quality development stage, resource-based regions are no longer driven by simple factors like “investment dividend” or “demographic dividend”. Instead, a complex multi-factor dynamic system drives their development. Smart eco-innovation, spurred by IT, offers a new driver for regional high-quality development. To design a dynamic system for this transformation, we need to link the region’s information transfer, energy flow, and material cycling through information, capital, and material flows. This creates a tightly connected and stable system structure. We use smart eco-innovation as the driving force. From a holistic perspective, we build a dynamic system for the high-quality transformation of resource-based regions (as shown in Figure 1). Furthermore, this paper uses causal loop diagrams and stock-and-flow diagrams to illustrate relationships among system entities, clarifying interdependencies.
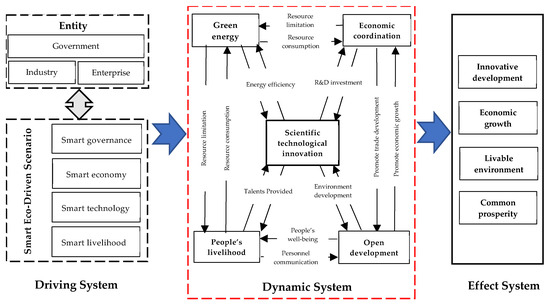
Figure 1.
The system of smart eco-innovation-driven high-quality transformation in resource-based regions.
2.2. System Design
The design approach for the high-quality transformation dynamic system of resource-based regions is as follows: (1) Define the framework. (2) Establish system boundaries according to new development concepts, including innovation, coordination, green development, openness, and sharing. (3) Analyze interactions among subsystems within the context of smart eco-innovation and establish causal relationships for the dynamic system. (4) Based on the causal relationships and the driving relationships of smart eco-innovation, select relevant variables to construct the dynamic system flow diagram. Determine variable parameters and develop functional equations. (5) Test the SDM model through structural, consistency, and extreme condition tests. Refine the model to ensure it accurately represents real-world dynamics. (6) Apply SDM to simulate Daqing City. This includes designing policy scenarios, adjusting input variables, observing dynamic trends, analyzing simulation results, and providing recommendations.
The system shown in Figure 1 has multiple inputs, outputs, and feedback loops. It includes three main components: the driving system, the dynamic system, and the effect system.
(1) Driving System. The driving forces originate from both internal and external sources. Endogenous drivers, including governments, industries, and enterprises, are primary catalysts. They optimize the business environment, foster industrial development, create innovative conditions for enterprises, and build livable communities, all influenced by regional policies. Exogenous drivers, such as capital, new technologies, talent inflows, and data utilization, promote regional transformation through the foundation laid by endogenous drivers.
Therefore, governments, industries, and enterprises in resource-based regions need to create a high-quality development environment through integrated innovation. The government’s capacity for reform and innovation, digital construction, and a smart business environment have the greatest impact on attracting external drivers. Industries optimize their structure through digital transformation, smart energy, smart agriculture, emerging digital clusters, and tertiary sector development to form new industrial ecosystems. Enterprises, as implementers of industrial policies, benefit from the smart innovation environment, which supports regional high-quality transformation.
(2) Dynamic System. The dynamic system includes the economic system, energy system, population system, social system, environmental system, and technological system. Based on the existing research [48,49] and the development patterns of resource-based regions, this study constructs a dynamic system from five aspects: innovation, coordination, green development, openness, and sharing. This creates a scenario driven by smart eco-innovation. Among them, the innovation subsystem is the core. The five subsystems reflect technological innovation capacity, coordinated economic development, green energy status, open trends, and social welfare conditions, respectively.
(3) Effect System. This paper evaluates the effects based on the formation of regional innovation development, economic growth, livable environment, and common prosperity. These criteria reflect the effectiveness of the transformation dynamic system.
2.3. System Structural Relationships and Variable Setting
2.3.1. Causal Relationship
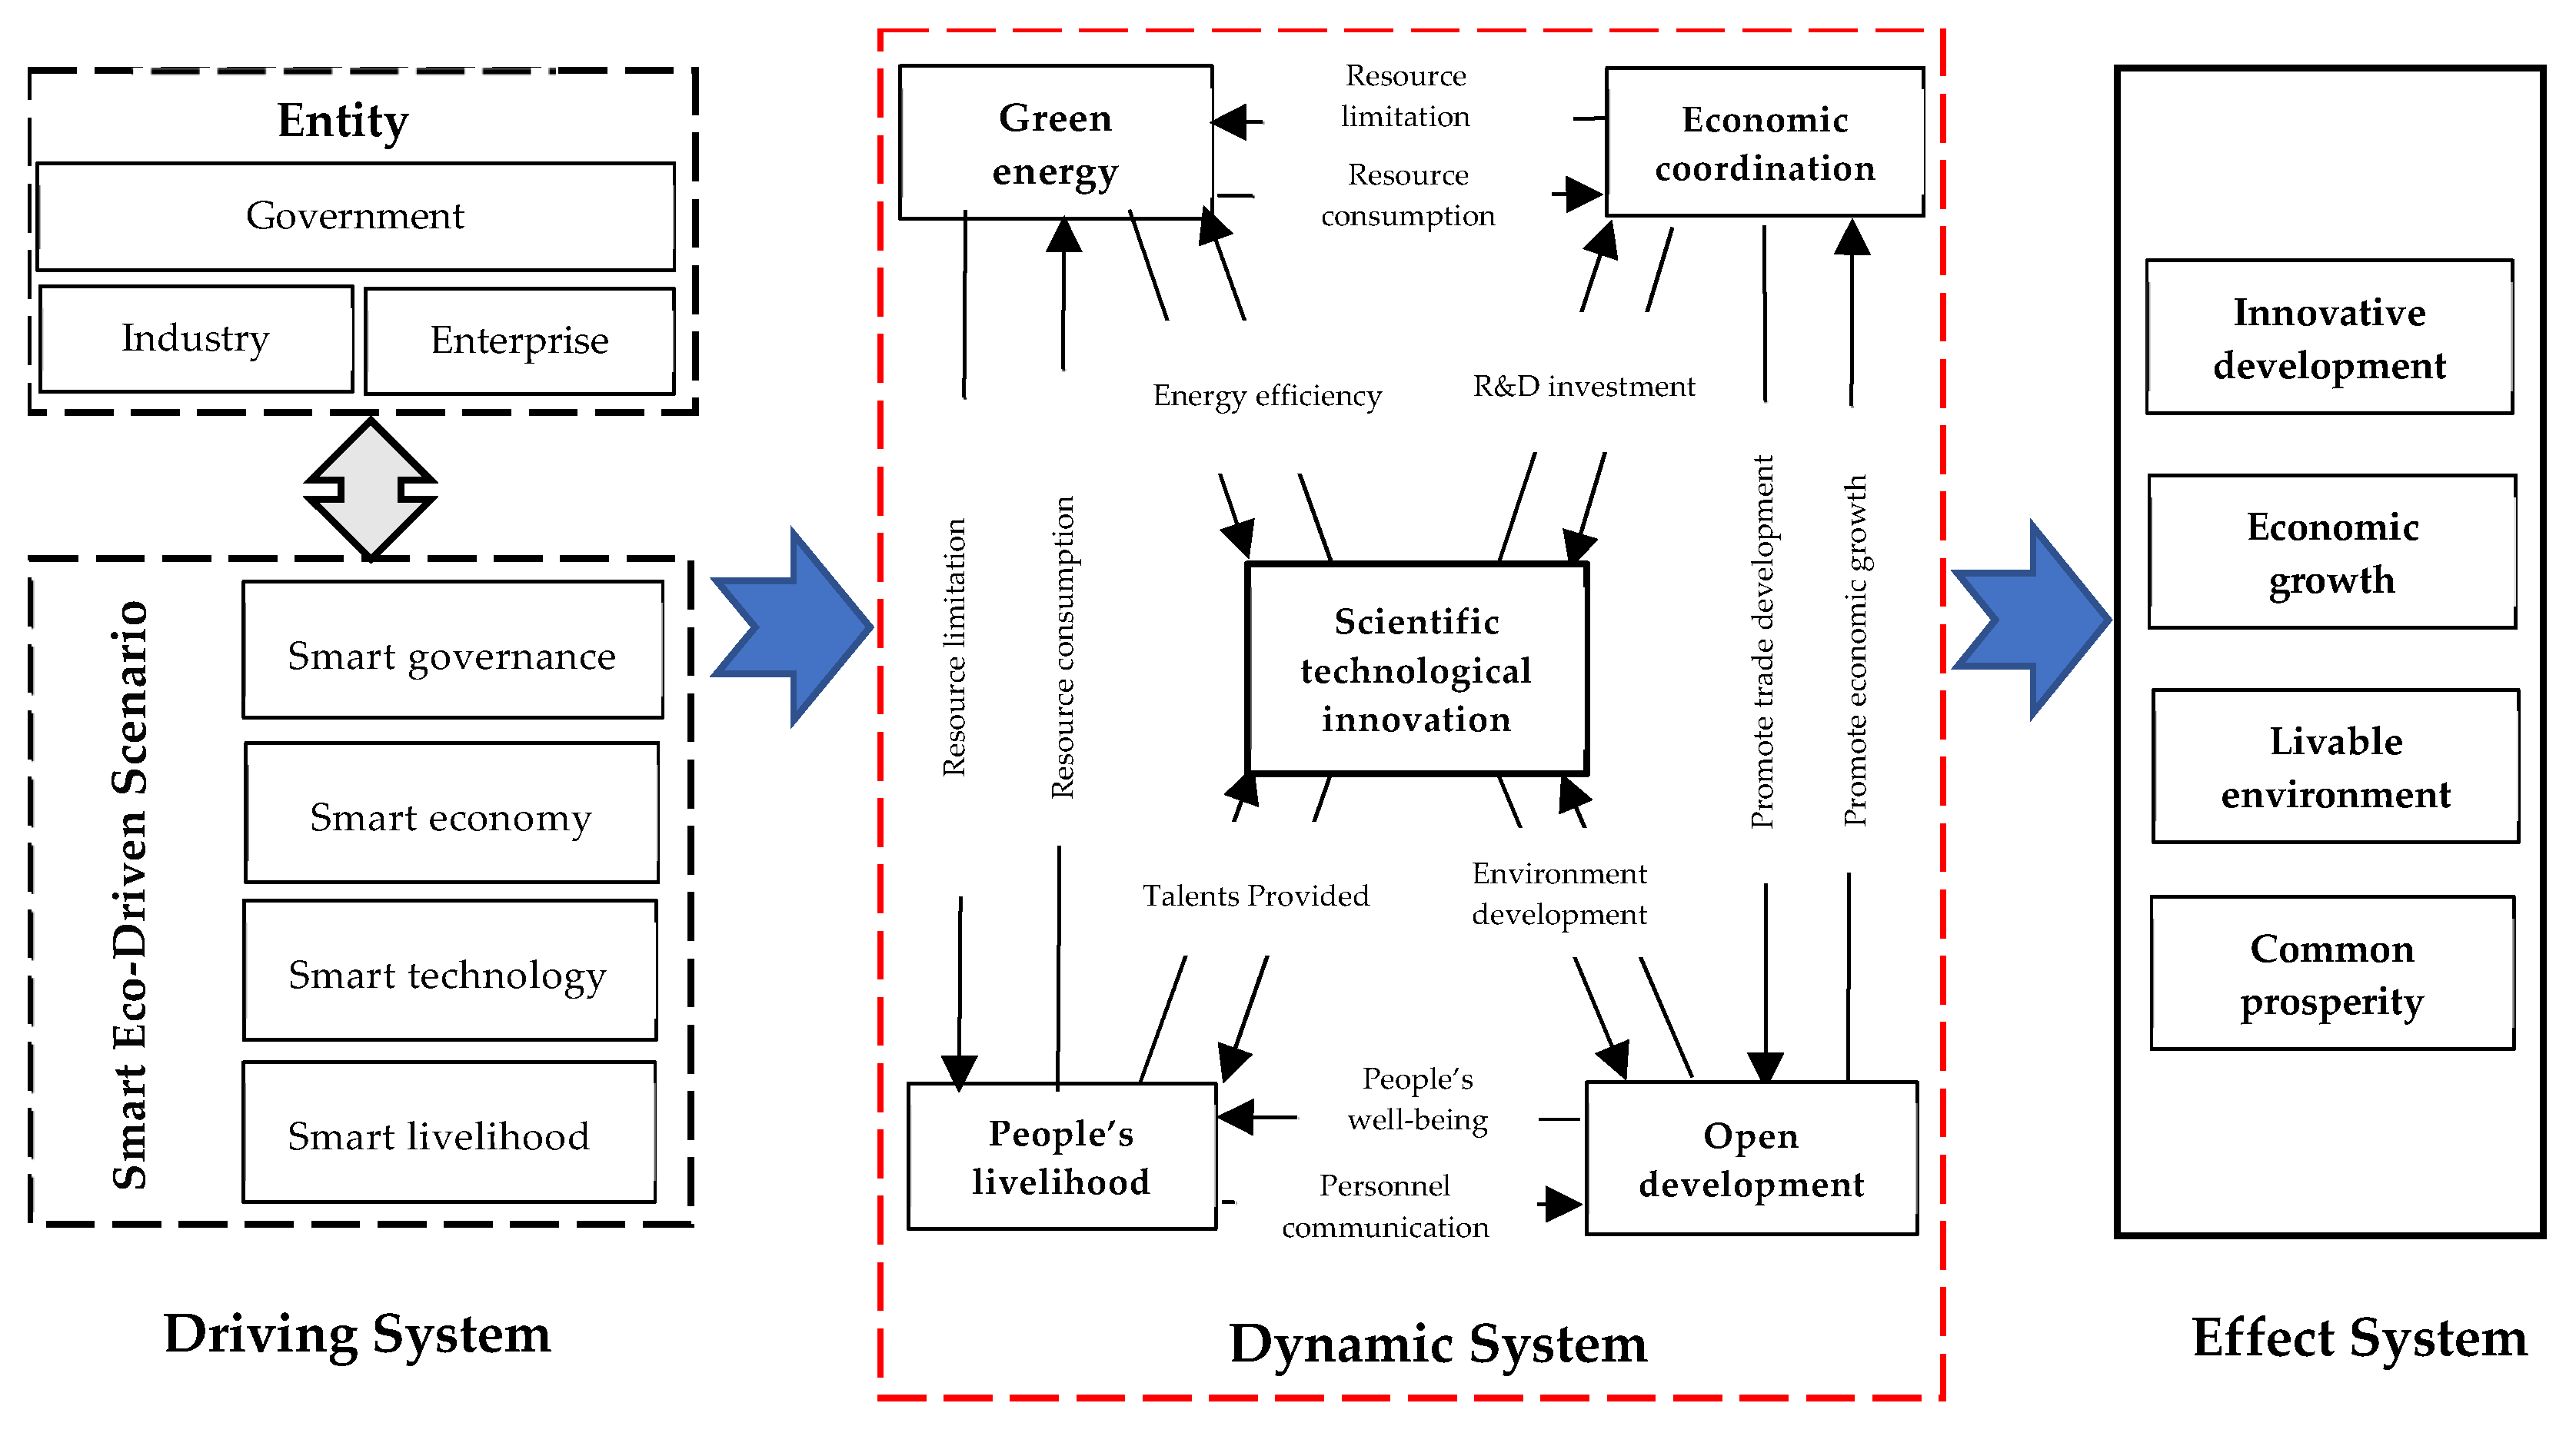
This paper examines the interrelationships among the five subsystems in the dynamic system from the perspective of smart eco-innovation. It identifies key elements and illustrates their feedback mechanisms using Vensim-PLE 10.2.2. The causal relationship diagrams are shown in Figure 2.
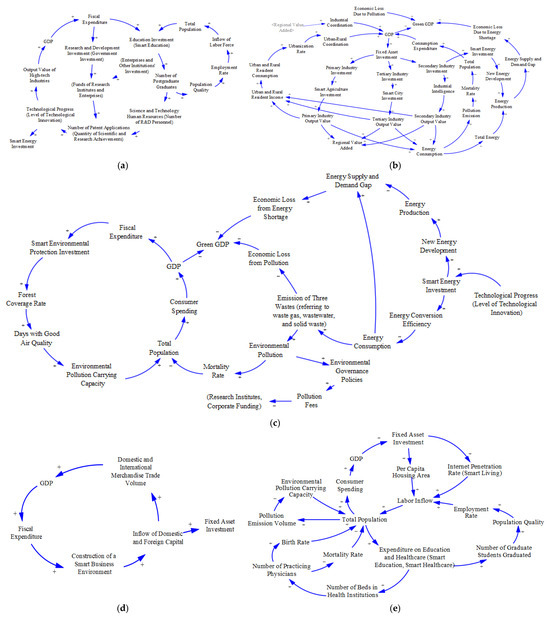
Figure 2.
Causal loop diagrams of the five subsystems. (a) Scientific and technological innovation subsystem; (b) economic coordination subsystem; (c) green energy subsystem; (d) open development subsystem; (e) people’s livelihood subsystem. The blue arrow indicates the effect of A on B. “+” indicates a promoting effect, while “−” indicates an inhibitory effect.
(1) Scientific and technological innovation subsystem. Regional scientific and technological innovation is influenced by the economy and human capital [50,51]. Increasing research and education expenditure in fiscal spending attracts social capital to invest in regional scientific research infrastructure, fostering a favorable ecosystem for scientific and technological investment. Consequently, local government and enterprise investments in these resources form a regional innovation ecosystem through three main feedback loops, as shown in Figure 2a.
(2) Economic coordination subsystem. Resource-based regions develop a smart investment ecosystem through investments in smart agriculture, smart energy, and smart cities. This promotes industrial structure adjustment [52,53,54] and coordinates regional industries and urban–rural areas [55]. It supports the intelligent transformation of resource-based industries and the ecological layout of regional smart industries, providing momentum for high-quality transformation. This subsystem generates three main feedback loops and three branches (as shown in Figure 2b).
(3) Green energy subsystem. The green energy subsystem focuses on balancing energy production, demand, pollution, and environmental protection [56,57]. Resource-based regions support regional high-quality development through smart energy investment and environmental protection. These actions guide green and low-carbon energy development and create an ecological and livable environment. This subsystem generates two main feedback loops (as shown in Figure 2c).
(4) Open development subsystem. A favorable open development environment attracts external factors and resources, providing financial, technological, and talent support for transformation [58]. Resource-based regions can foster an open development ecosystem by creating a smart business environment and attracting domestic and foreign capital. This injects financial momentum into regional industrial investment and transformation. This subsystem generates one main feedback loop (as shown in Figure 2d).
(5) People’s livelihood subsystem. Resource-based regions enhance residents’ well-being by constructing smart and livable environments, including smart education and healthcare. This improves residents’ happiness and establishes a smart foundational ecosystem for transformation. This subsystem generates three main feedback loops (as shown in Figure 2e).
This paper integrates the interrelationships between key variables across subsystems. For example, it examines the relationship between smart energy investment in Figure 2c and new energy development in Figure 2b, the relationship between domestic and foreign capital inflows in Figure 2d and fixed asset investment, and the relationship between total population in Figure 2e and educational investment in Figure 2a. These relationships are used to describe causal feedback relationships in the system model, as shown in Figure 3.
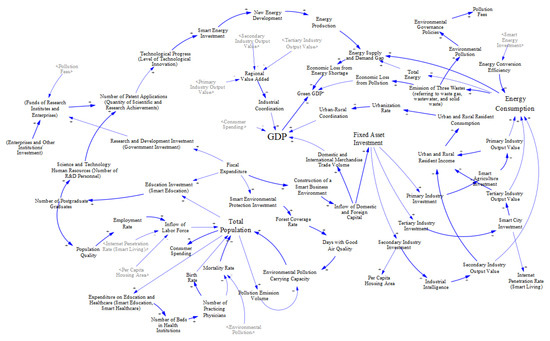
Figure 3.
Causal loop diagrams of the whole system. The blue arrow indicates the effect of A on B. “+” indicates a promoting effect, while “−” indicates an inhibitory effect.
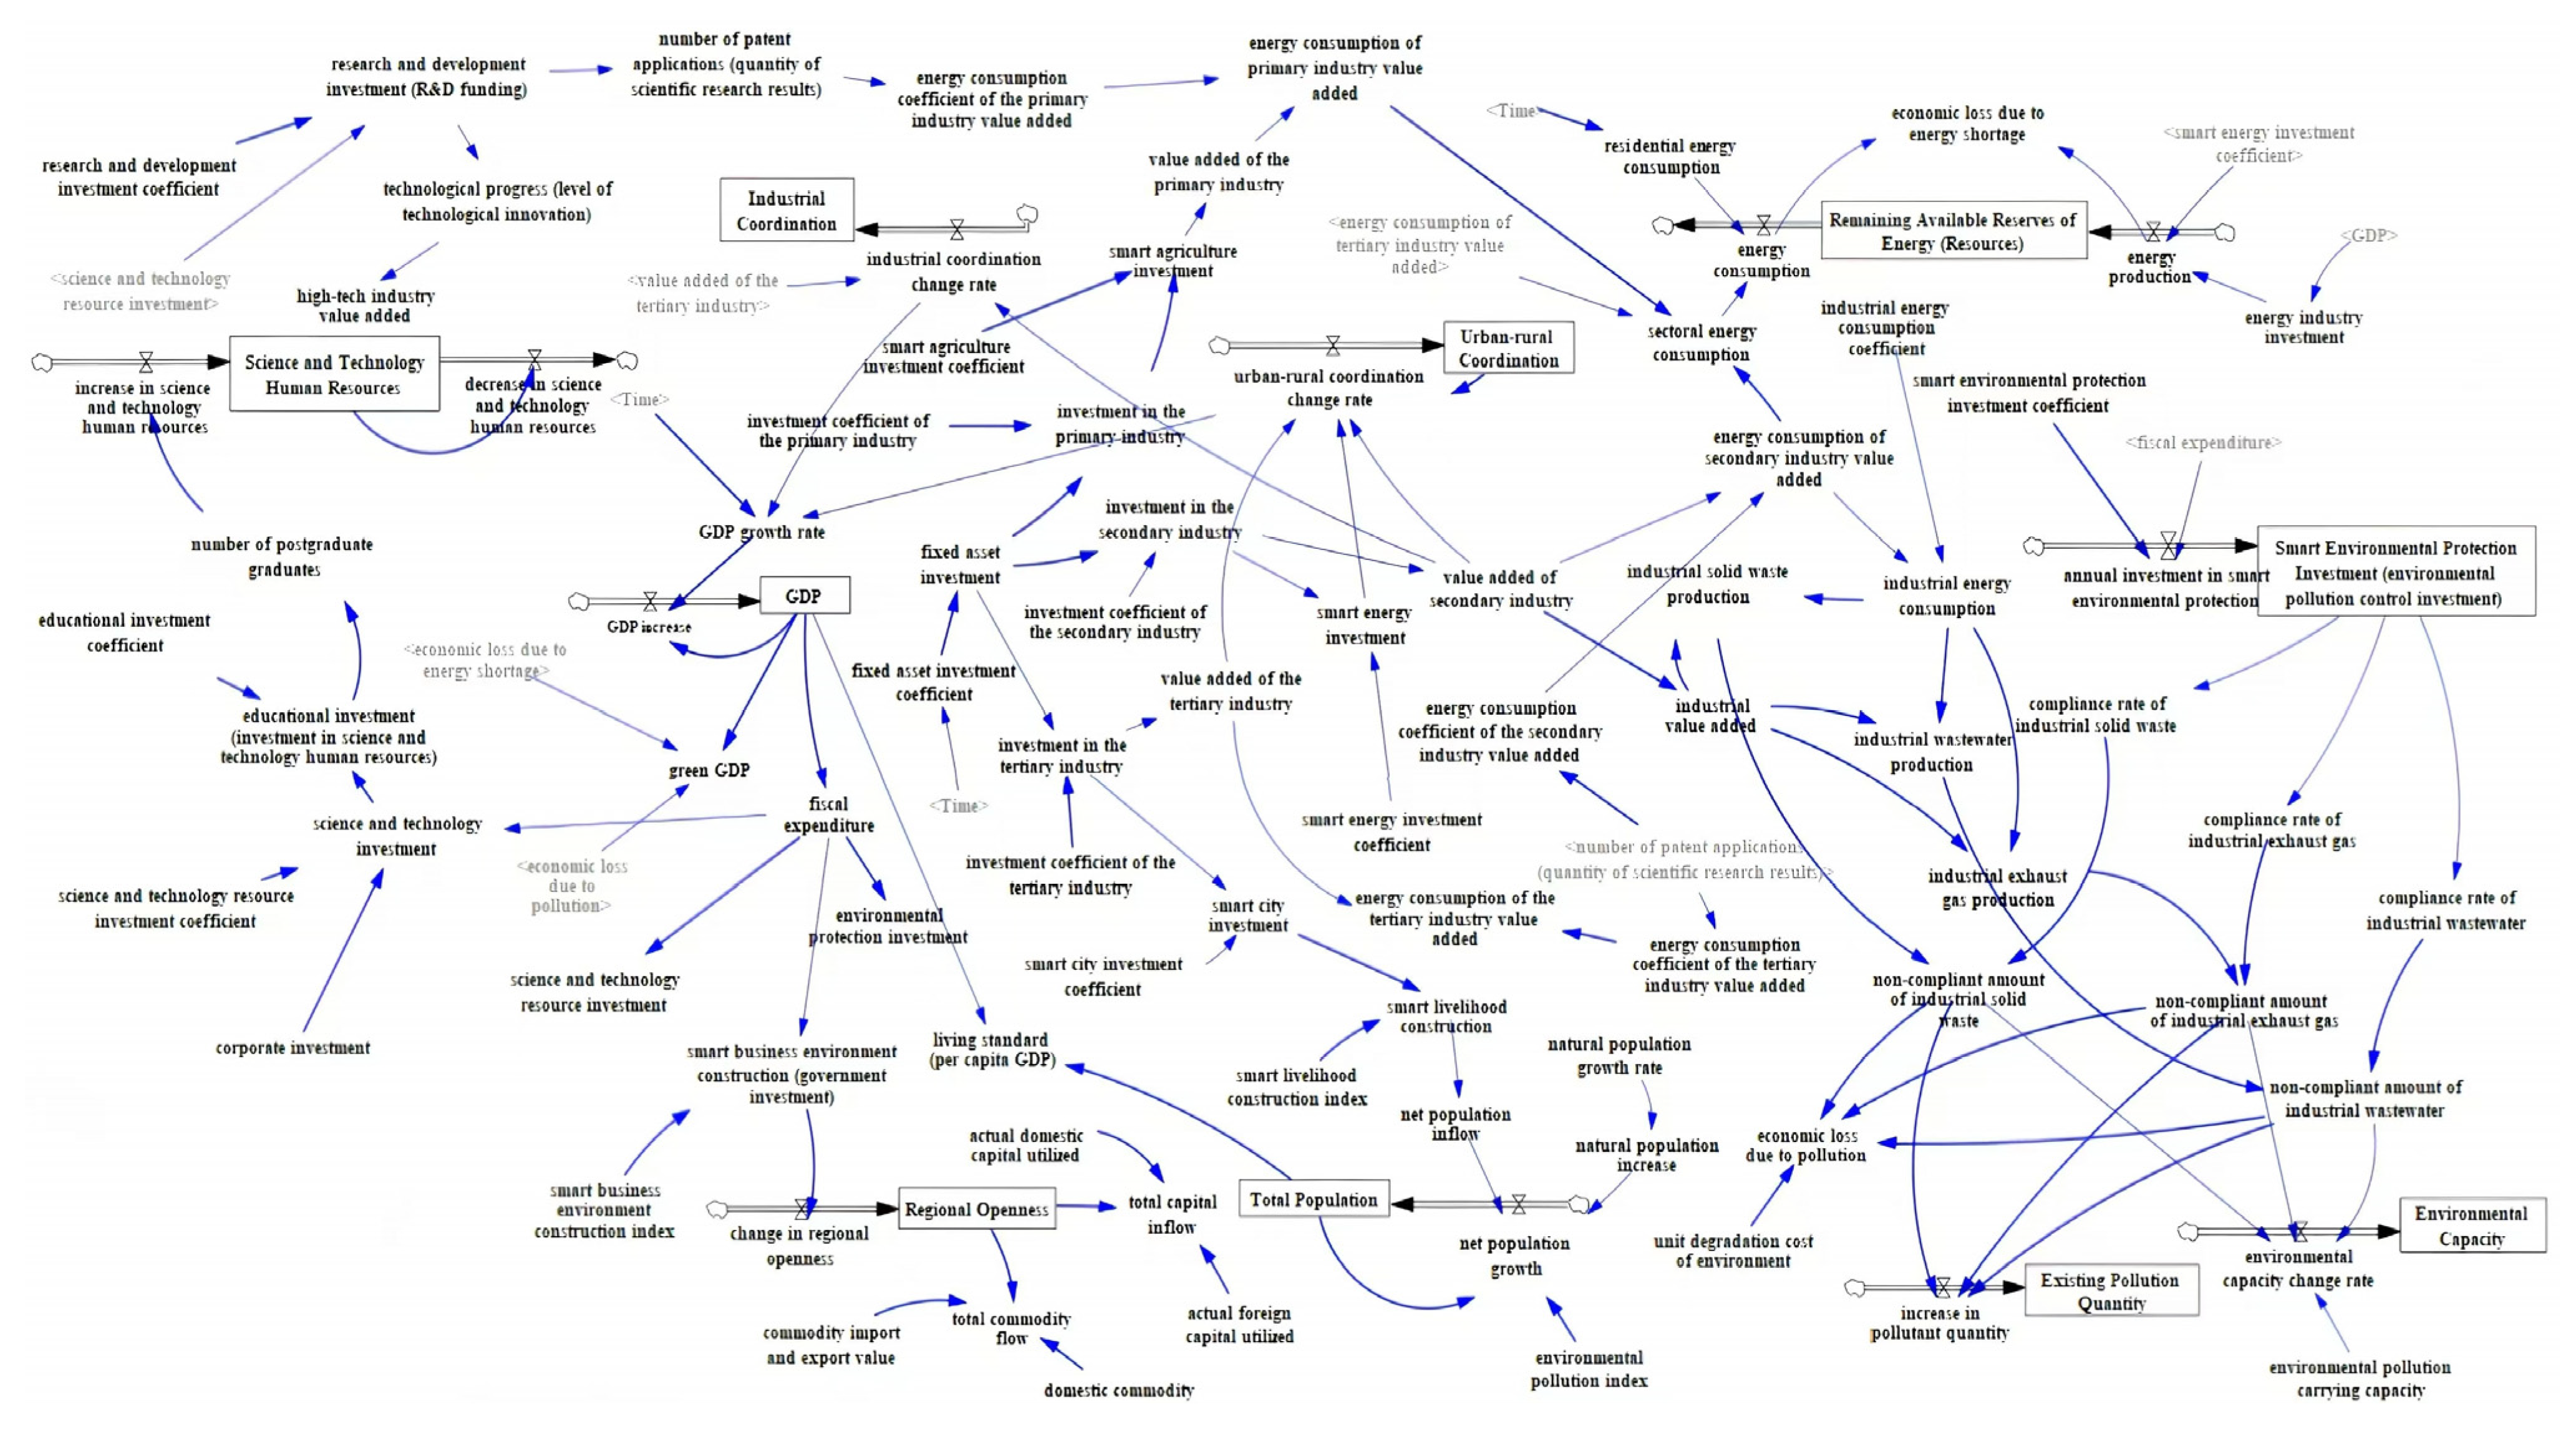
2.3.2. Flow Diagrams
This study, guided by the requirements for high-quality transformation and data availability, establishes logical relationships among factor variables in the dynamic system. The system model includes 81 variables, consisting of 10 state variables, 12 rate variables, and 45 auxiliary variables, with 14 constants (Table A1 in Appendix A). Based on functional relationships of key variables, the flow diagram is constructed using Vensim-PLE 10.2.2, as shown in Figure 4.
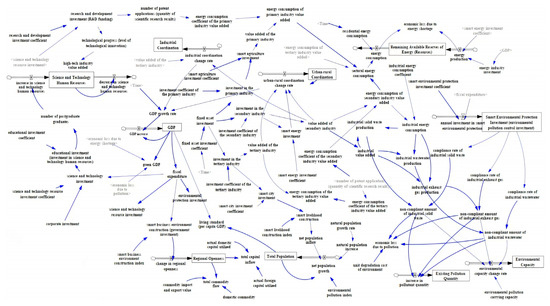
Figure 4.
Flow diagram of the whole system.
2.3.3. Setting of Input and Output Variables
Based on the “government–industry–enterprise” smart eco-innovation-driven system, referring to the existing literature [59,60,61] and the actual situation of Daqing City, this study constructs a dynamic system model for high-quality transformation. The model includes six input variables: smart technology investment, industrial investment, smart energy construction, pollution control investment, smart business environment construction, and livelihood construction. These variables represent the subsystems of scientific and technological innovation, economic coordination, green energy, open development, and people’s livelihood, respectively. Corresponding to these inputs, six output variables are included: patent applications, GDP growth rate, remaining available energy reserves, pollution stock, total capital inflow, and total population. In the indicator design, smart and ecological indicators of input and output variables are integrated to achieve the target effects of high-quality transformation, as shown in Table 1.

Table 1.
Input and output variables.
3. Simulation Result Analysis
3.1. Selection of Study Region
This study focuses on Daqing City, located in northeastern China. Daqing is a “mature” resource-based city that has thrived due to oil. The city has been engaged in crude oil development for over 60 years. Daqing Oilfield used to be the largest crude oil production base in China, with a cumulative crude oil production of 2.5 billion tons by 2023. But its output was gradually surpassed. Due to its heavy reliance on resource-based industries, Daqing faces challenges in high-quality transformation.
Firstly, regional economic growth has weakened. Daqing’s GDP increased steadily from CNY 102.935 billion in 2000 to CNY 410.005 billion in 2013. However, it began to decline after 2014, reaching CNY 230.107 billion in 2020—a decrease of 43.88% compared to 2013. The rate of the oil and gas industry’s contribution to GDP has dropped below 50%.
Secondly, oil production is declining. Daqing Oilfield is in the late stage of oil and gas extraction, with the main old oilfields having a comprehensive water cut rate exceeding 95%. Although the expansion of shale oil extraction may alleviate this situation, the high extraction costs limit further development.
Thirdly, there has been a continuous outflow of residents and labor. Since 2014, declining oil prices and reduced production, coupled with harsh winter conditions, have led to population decline and labor outflow. Compared to 2010, Daqing’s total population decreased by 122,970 people in 2020, a decline of 4.23%. The proportion of population aged 15–59 also decreased by 7.82%.
3.2. Data Sources and Processing
In this study, data for Daqing from 2011 to 2021 were selected, adhering to principles of completeness, availability, comparability, and consistency. Data sources included the Daqing Statistical Yearbook, Daqing City National Economic and Social Development Statistical Bulletin, Heilongjiang Province Statistical Yearbook, Heilongjiang Province Environmental Conditions Bulletin, Heilongjiang Province Science and Technology Expenditure Statistical Bulletin, China City Statistical Yearbook, China Science and Technology Statistical Yearbook, China Energy Statistical Yearbook, and China Environmental Statistical Yearbook.
Data calculations were primarily based on regional historical statistics. For missing data, values were derived using methods such as arithmetic mean calculation, regression analysis, and trend extrapolation.
3.3. Parameter Setting and Validation
Based on China’s “Smart City” vision in 2010, the “High-Quality Development” concept in 2017, and Daqing’s designation as a “Dual Pilot City for Smart City Construction”, this study integrated investment factors related to Smart Daqing into the model. The initial values were set for 2011, with historical data ranging from 2011 to 2021 and a forecast period from 2022 to 2030. Input variable initial values were assigned using the mean method, as shown in Table 2.
Table 2.
Initial values of input variables.
The model structure and equations were validated against historical data, with a simulation time from 2011 to 2021 and a step length of 1 year. The results showed average error rates of 6.09% for patent applications, 4.49% for total capital inflow, and 0.55% for total population. The simulated values closely matched actual values, passing validation and confirming the model’s reasonableness for prediction and simulation.
3.4. Simulation Scenario Design
This paper selected six policy-related input variables to observe the effects under different scenarios by transformation policy, as shown in Table 3. Meanwhile, six output variables were also chosen, with transformation effects that will be analyzed through changes in these output variables.
Table 3.
Policy scenario variation plan for high-quality transformation of Daqing driven by smart eco-innovation.
Current: This was the natural scenario based on historical average values of input variables without adjusting policy coefficients.
C1-1 and C1-2: These scenarios examined the impact on output variables when the coefficient of science and technology investment was increased or decreased by 20%, respectively, while other policy coefficients remained unchanged.
C2-1 and C2-2: These scenarios assessed the impact when the industrial investment structure coefficient was increased or decreased by 20%, with other coefficients held constant.
C3-1 and C3-2: These scenarios evaluated the impact when the smart energy investment coefficient was increased or decreased by 20%, while other coefficients remained unchanged.
C4-1 and C4-2: Analyzed the impact when the smart environmental protection investment coefficient was increased or decreased by 20%, with other coefficients unchanged.
C5-1 and C5-2: These scenarios explored the impact when the smart business environment construction coefficient was increased or decreased by 20%, while other coefficients remained constant.
C6-1 and C6-2: These scenarios examined the impact when the smart livelihood construction coefficient was increased or decreased by 20%, with other coefficients unchanged.
C7: This scenario assessed the combined impact when all six input variables were increased by 20%, focusing on the integrated policy effects on transformation outcomes.
3.5. Result
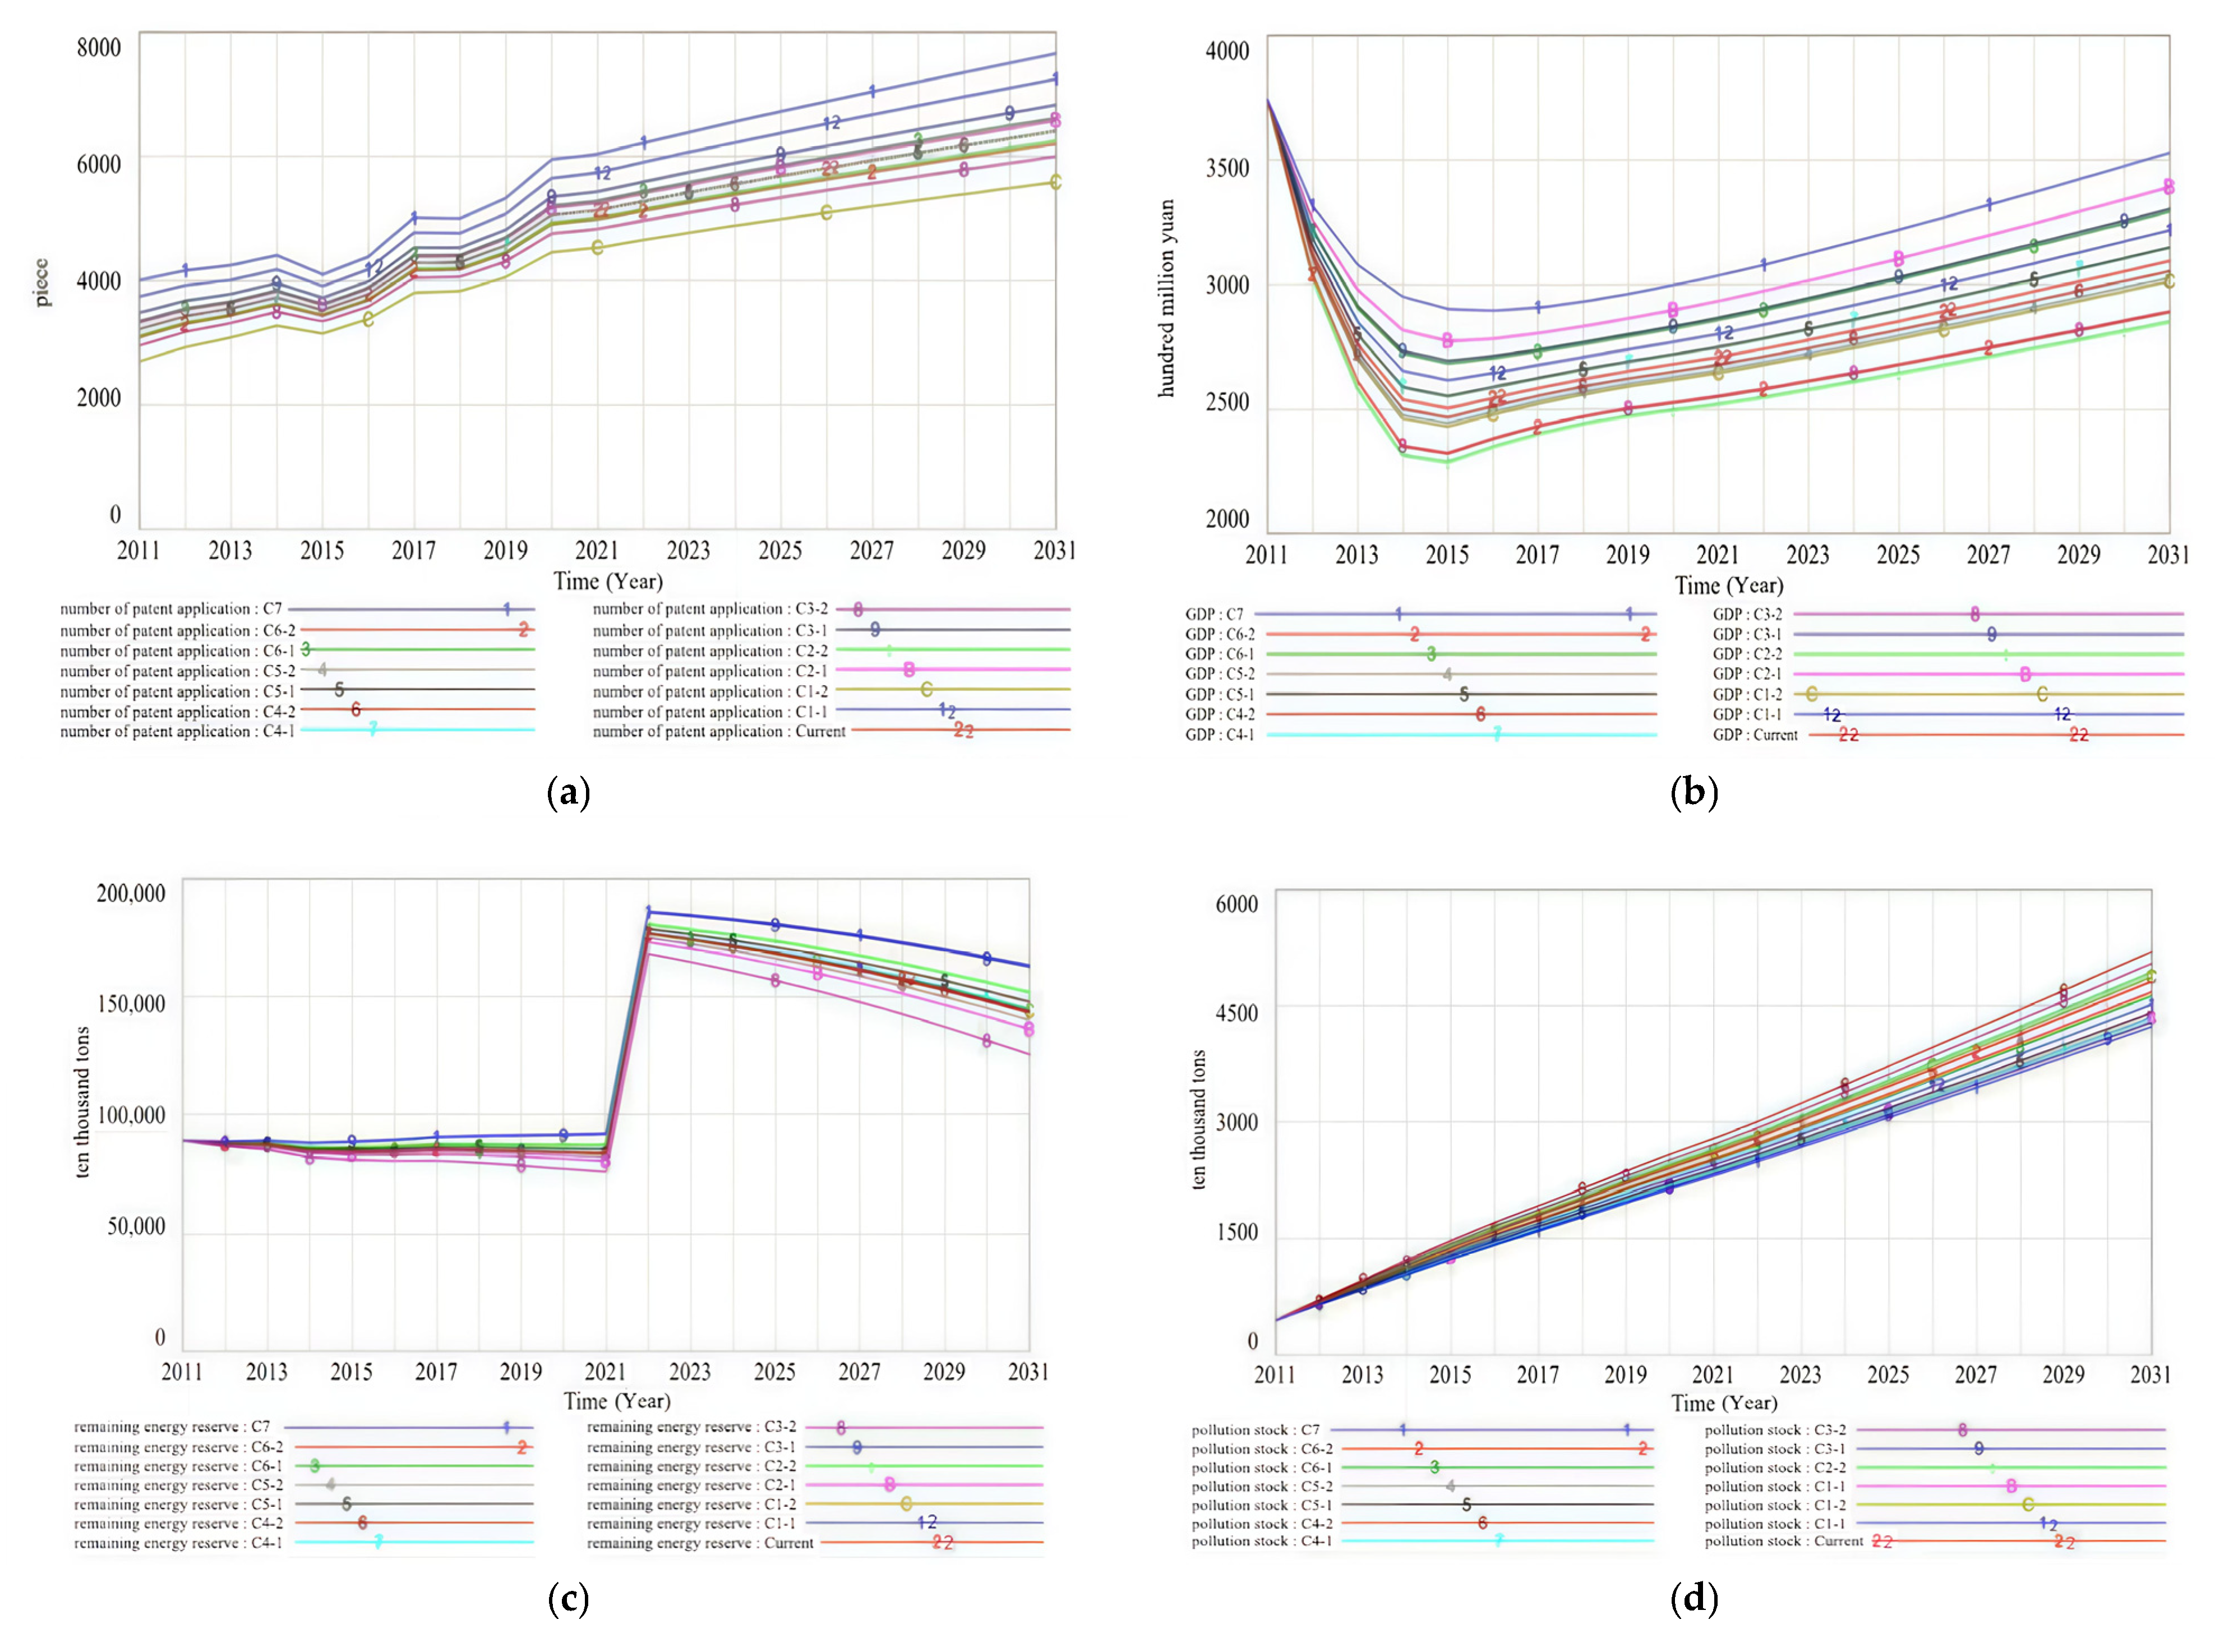
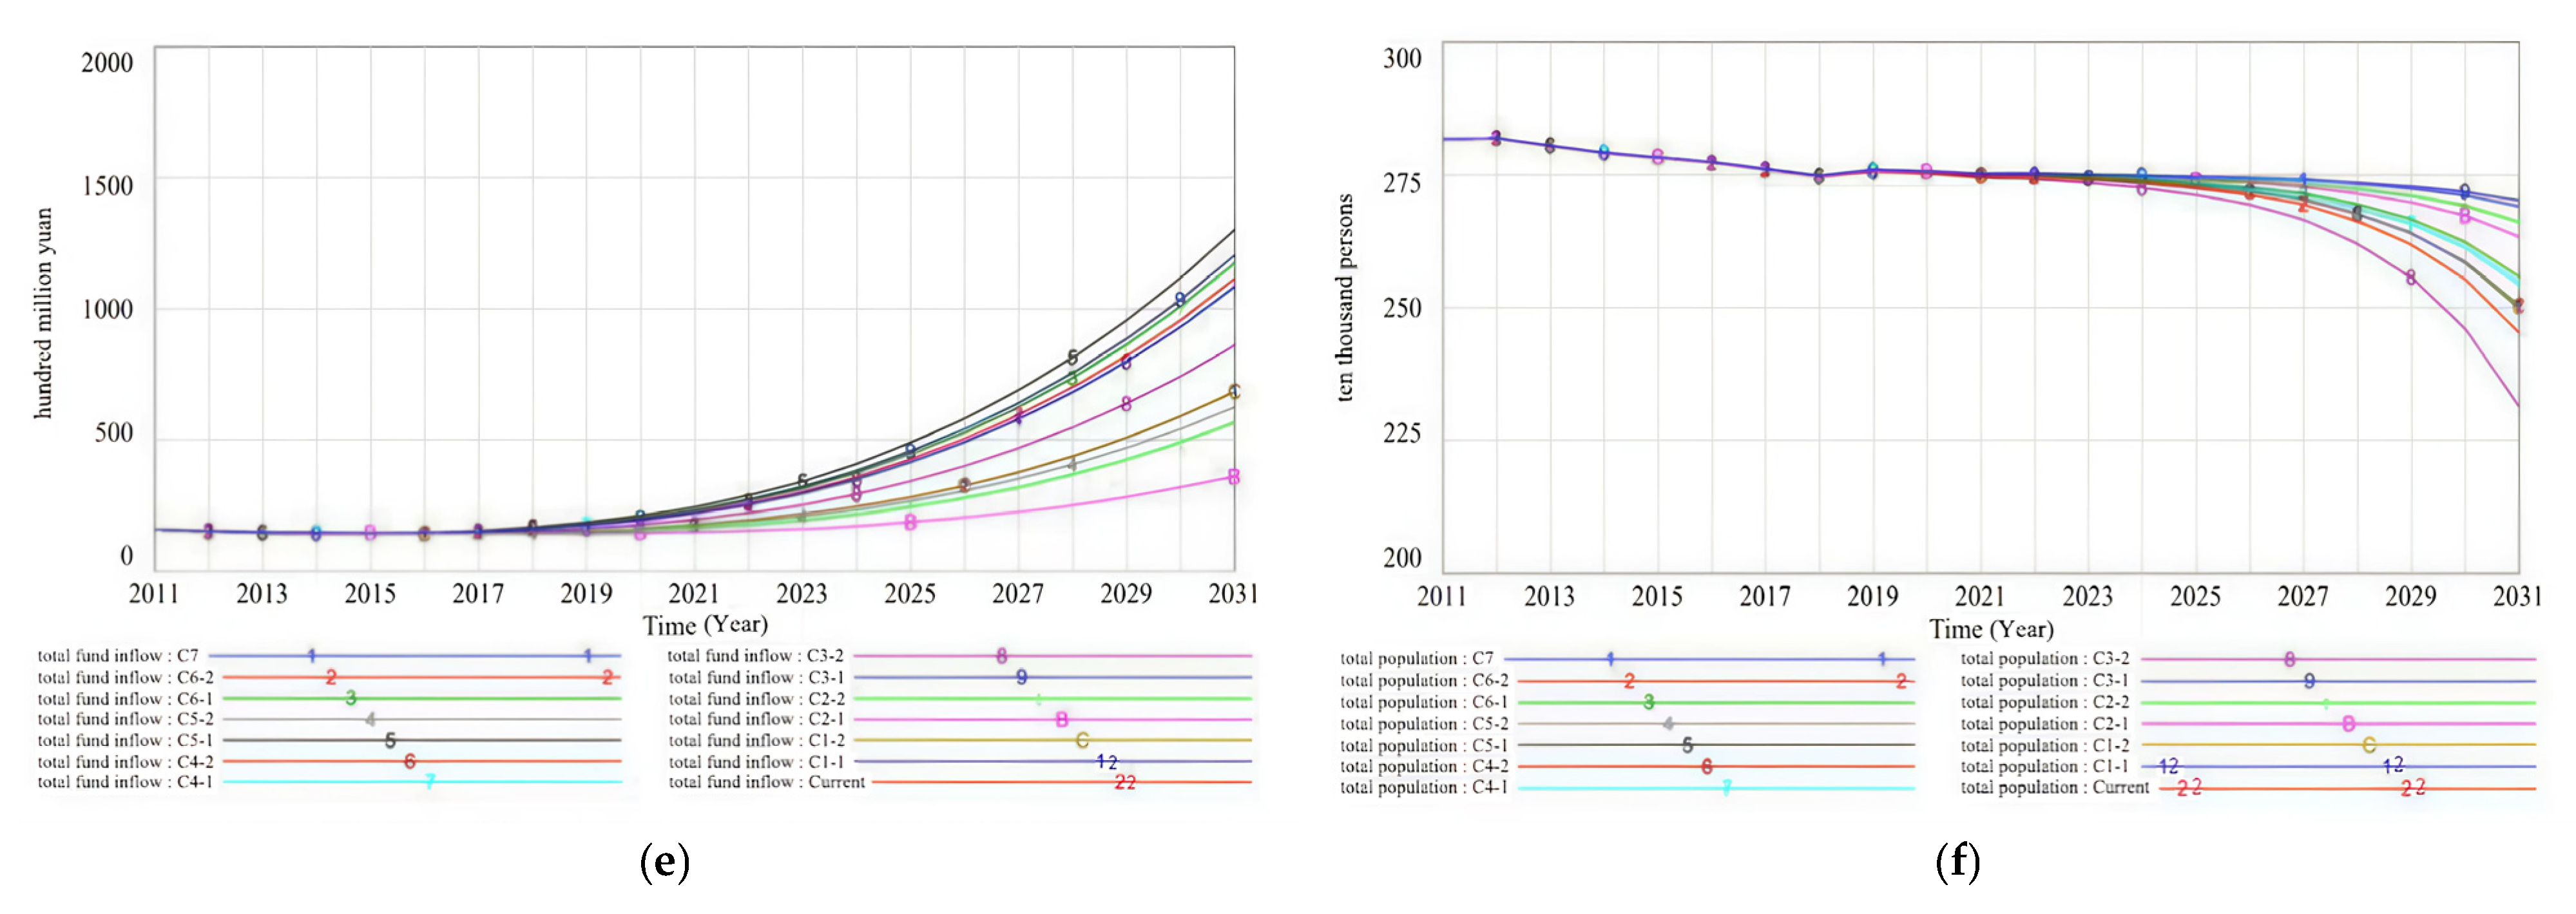
The simulation period was set from 2011 to 2030 with a step length of 1 year. The results for the six output variables under the 14 policy scenarios were obtained, as shown in Figure 5.
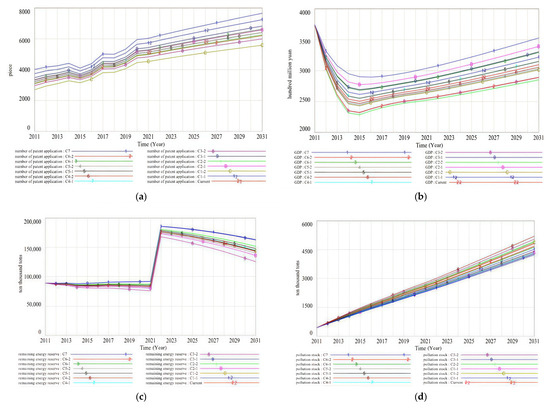
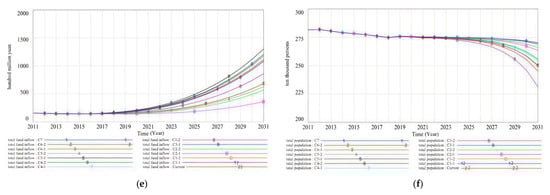
Figure 5.
Policy simulation results. (a) Patent applications; (b) GDP growth rate; (c) remaining available energy reserves; (d) pollution stock; (e) total capital inflow; (f) total population.
This study combined simulation results with the effects of policy scenario changes for ranking and statistical analysis (as shown in Figure 6). Comparing the results of Current, C1-1, C1-2, and other scenarios revealed distinct effects of different policy variations, as detailed below.

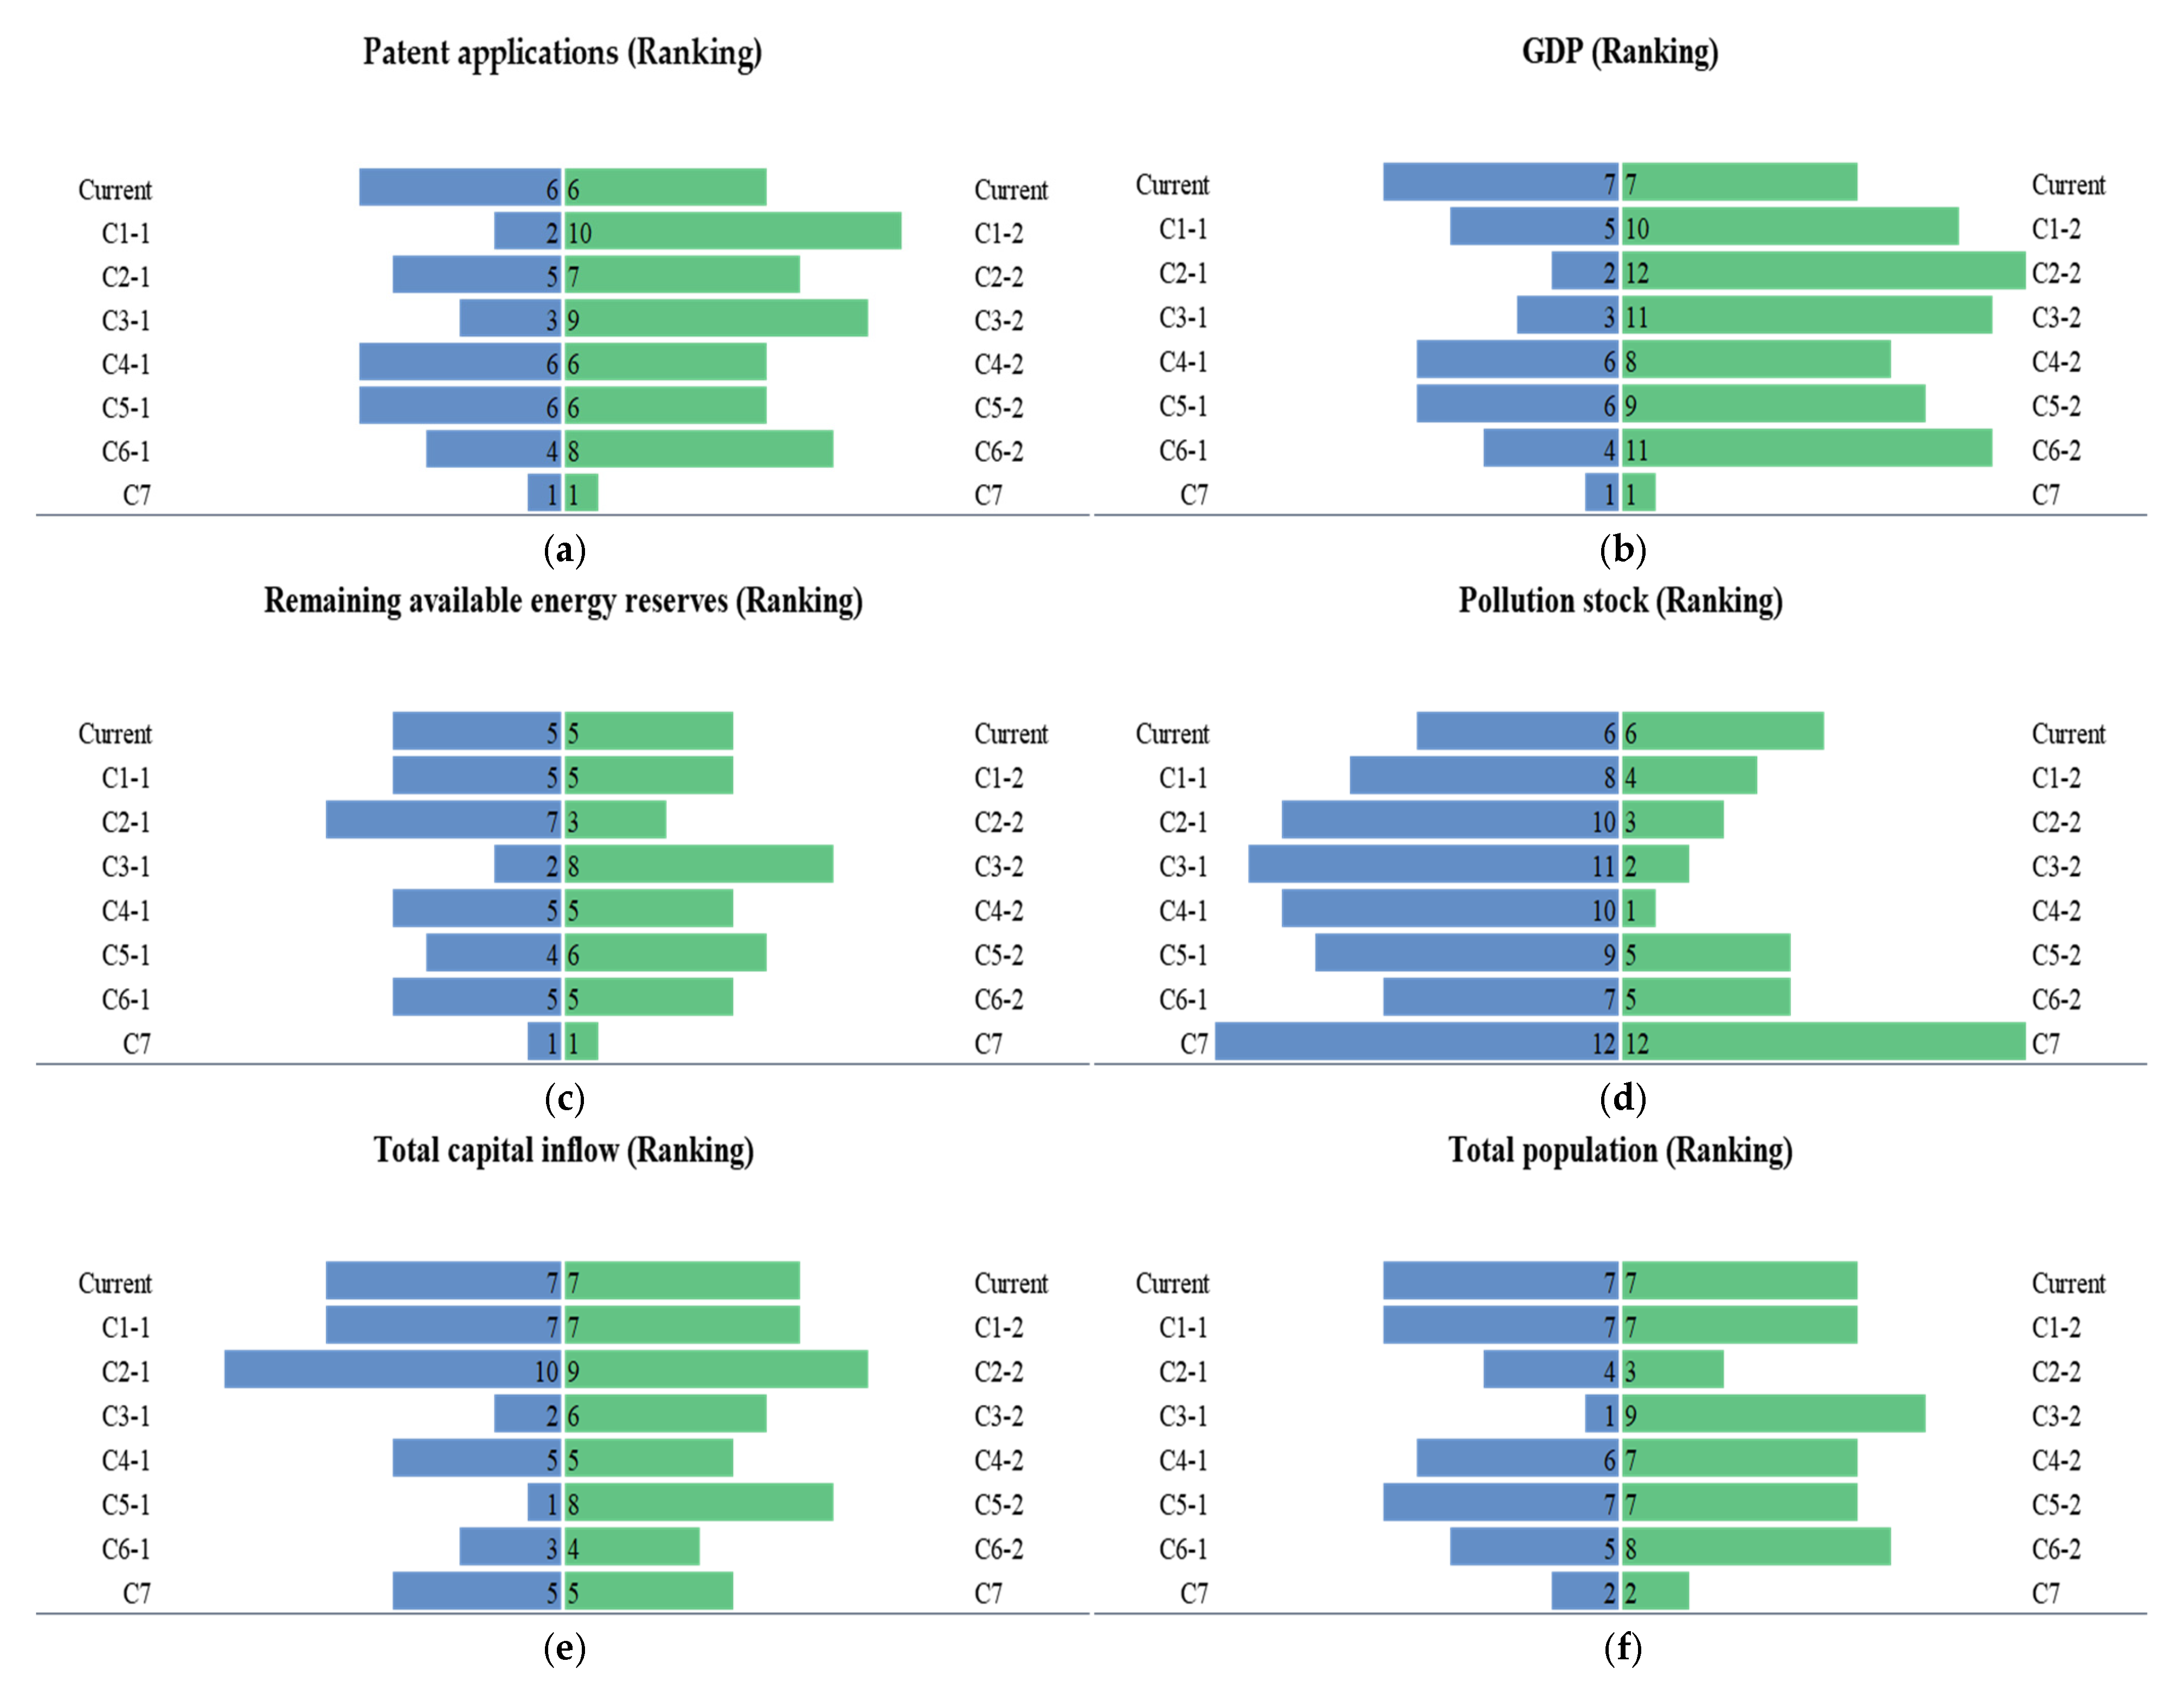
Figure 6.
Ranking and statistical analysis of scenario simulation results. (a) Patent applications ranking; (b) GDP growth rate ranking; (c) remaining available energy reserves ranking; (d) pollution stock ranking; (e) total capital inflow ranking; (f) total population ranking. The lengths of the blue and green bars indicate the rank. In Figure 5, smaller numbers indicate higher-ranked lines, while larger numbers indicate lower-ranked lines. For example, number 1 represents the topmost line. Identical numbers for multiple policy scenarios indicate overlapping lines that cannot be distinguished in ranking. For instance, in the patent application ranking, five policy scenarios share the number 6, indicating their effects are indistinguishable at rank 6.
(1) Increasing investment in science and technology resources effectively boosts scientific research output. In Figure 6a, the simulation result of C1-1 is ranked 2, which indicates that investment in science and technology resources can enhance technological innovation capabilities and build a smart innovation ecosystem. The ranking results in Figure 6b–d also indicate that it also drives regional economic growth and reduces industrial energy consumption and pollution stock. However, it has a limited impact on retaining Daqing’s population and slowing population outflow, as shown in Figure 6, due to the labor displacement effect from improved oil and gas technologies.
(2) Adjusting the industrial investment structure significantly promotes economic growth. In Figure 6b, the ranking of C2-1 is 2, indicating that the GDP growth rate is second only to C7. As the tertiary sector develops, industrial energy consumption decreases, pollution accumulation slows, and population outflow declines. This validates the conclusion that industrial structure upgrading promotes the economic transformation of resource-based cities [62]. However, in Figure 6e, the ranking of C2-1 is 8, which indicates that reduced investment in the secondary industry is not conducive to attracting capital inflows.
(3) Smart energy construction has a comprehensive impact. Apart from Figure 6d, the ranking results of C3-1 are all in the top three. An intelligent oilfield drives technological progress, promotes environmentally friendly oil and gas extraction, and increases clean energy use. This reduces industrial and residential energy consumption, lowers pollution, and improves livability, resulting in less population decline compared to other scenarios. Previous studies have also demonstrated that smart energy, through highly intelligent coordination, enhances energy efficiency and cleanliness, thereby achieving sustainable development goals [63,64]. Moreover, it also has the lowest population outflow among all scenarios.
(4) Smart environmental protection policies create a green environment. In the various ranking results in Figure 6, the ranking of C4-1 in Figure 6d is favorable. Increased government investment in smart environmental protection has improved compliance rates for industrial “three wastes”, reduced emissions of these pollutants, and slowed the accumulation of pollution, leading to better regional ecology.
(5) Smart business environment construction significantly attracts investment. C5-1 ranks 1 in Figure 6e, which indicates that the construction of a smart business environment can promote capital inflow. Over the past decade, Daqing’s government has optimized the regional business environment through digital transformation and smart governance. The development of shale oil and large-scale “oil-to-chemicals” projects has led to substantial capital inflows, providing continuous funding.
(6) Smart city construction provides a fundamental guarantee for high-quality transformation. Under the six scenarios in Figure 6, the ranking range of C6-1 is 3 to 7. Developing smart infrastructure in regions enhances innovation, optimizes the business environment, reduces pollutant emissions, and increases GDP output. This is consistent with the conclusion that the construction of smart cities in China promotes technological innovation, energy efficiency, and green production and growth in cities [65,66].
(7) The comprehensive policy scenario C7 yields the best simulation results, indicating that combined effects of smart eco-innovation policies are the most significant. For resource-based regions, pursuing a smart eco-innovation transformation path will gradually lead to a new pattern of high-quality development.
4. Discussion
This study integrates smart eco-innovation with high-quality transformation, exploring how it drives the transformation of resource-based regions. Specifically, smart eco-innovation creates an innovative, coordinated, green, open, and shared environment. It guides production factor flows to resource-based regions, promotes industry and market integration, and adjusts regional industrial structures. Additionally, smart technologies can form standalone industries or integrate with others, driving innovations in industrial forms and models. Digitalization of industries and industrialization of digital technologies are the outcomes of smart technologies. Building digital mines and smart oil fields can significantly transform the industrial forms of resource-based regions [67,68,69].
Based on these insights, we developed a high-quality transformation system model for Daqing City and designed simulation scenarios. The model is applicable not only to Daqing but also to other resource-based regions in China. Although adjustments may be needed based on data availability and regional conditions, the model is also adaptable. China has 116 resource-based regions [70], most of which face common challenges such as single industrial structures, environmental pollution, and ecological destruction due to rapid economic development and population growth.
Moreover, the SDM model used in this study can be integrated with other models to analyze ecological and economic issues. For example, Uehara et al. (2018) developed a fully dynamic input–output/SDM to analyze the dynamic relationships within and between ecological and economic systems [71]. Additionally, the SDM model can be used to analyze urban resilience across economic, social, environmental, and infrastructural dimensions [72]. This suggests that the model has broader potential for extended applications beyond resource-based region development research.
5. Conclusions and Implications
5.1. Conclusions
Based on data of Daqing City, China, from 2011 to 2021, this paper constructs a smart ecological dynamic model for the high-quality transformation of resource-based regions. It includes the driving system, the dynamic system, and the effect system. This paper conducts a simulation analysis of a high-quality transformation dynamic system. Fourteen scenarios are designed to simulate and analyze the effects on patent applications, GDP, remaining available energy reserves, pollution stock, total capital inflow, and total population.
The results show that implementing smart eco-innovation as a fundamental driving force for high-quality transformation can achieve multiple goals. Strengthening investment in the tertiary sector, smart energy, and smart cities [73], increasing investment in science and technology resources and smart environmental protection, and optimizing the smart business environment can create a foundation for regional innovation and development. For example, increased investment in smart energy attracted significant capital to Daqing, boosting oil and gas exploration. In 2021, Daqing Oilfield added 1.268 billion tons of shale oil reserves. This increased available energy reserves, ensured sustainable exploitation, and provided a buffer period for Daqing’s transformation. These measures can increase the technological content of industrial output, ensure the rational development and utilization of resources, promote the digital and intelligent transformation of resource-based industries, and cultivate new forms of regional smart economy [74]. At the same time, they can reduce energy consumption, manage environmental pollution, create a livable environment, optimize the business environment [75,76], and control the decline in the total regional population.
5.2. Implications
Based on the conclusions above, this paper draws the following implications:
First, establish a smart eco-innovation system to empower the upgrading of traditional resource-based industries [77]. Resource-dominant enterprises should lead the creation of a favorable environment for smart eco-innovation. Governments in resource-based regions can establish smart innovation platforms, such as resource industrialization labs, enterprise R&D centers, and experimental bases. These platforms can foster collaboration among businesses, universities, and research institutions. Innovation resources should be integrated into enterprises. Diversified investment and financing mechanisms for smart eco-innovation could be developed. Tax relief policies should be implemented. Green transformation of industries can be guided through catalogs. These measures can stimulate market vitality in smart eco-innovation and promote smart ecological industry development [9].
Second, extend the industrial chain and upgrade resource-based industries with smart technologies. Regions should leverage their resource endowments and leading industries to extend the industrial chain from processing and manufacturing to high-end areas such as product design and R&D [62]. They can deploy smart technologies, including cloud computing, intelligent sensing, and satellite positioning, to develop new industries like smart environmental protection and technology experimental bases. They can also develop sectors such as new energy, new materials, and tourism. Using smart eco-innovation to create green industries and cultivating smart energy-saving and environmental protection industries can optimize the integration of resource-based and non-resource-based industries. This can promote the development of green finance, green smart logistics, and green smart consumption.
Third, build regional smart ecology and use smart technologies to create the software and hardware environment for regions. On the one hand, regions should strengthen the intelligent construction of mines and oilfields, integrating data to enhance production, safety, and logistics support systems for resources. In addition, the construction of smart cities needs to be carried out in collaboration with multiple fields [78]. Regions can improve inter-city transportation information, road networks, and livelihood infrastructure (e.g., smart education and healthcare) to create hardware facilities for smart construction in resource-based regions [49]. On the other hand, enhancing government services and establishing a scientific social governance mechanism could achieve coordinated public value ecology involving the government, market, and society [79]. Regions can fully leverage government leadership to build a smart public supervision system and optimize the allocation of public service resources [80,81].
6. Limitations and Future Recommendations
This study provides preliminary evidence for the “smart eco-style” transformation of resource-based regions, yet it also has certain limitations that could be further explored as future research topics.
First, this paper conducts the system dynamics analysis of the high-quality transformation of resource-based regions driven by smart eco-innovation, but it does not quantify the “smart eco-style” transformation. Future research could evaluate the value effects of smart ecology and measure its impact on regional development. For example, using intelligent energy management and ecological monitoring as practiced in smart parks can quantify the effects of “smart eco-style” transformation.
Second, this paper introduces how smart eco-innovation promotes regional high-quality transformation in the Introduction section briefly. However, the mechanism is complex and could be analyzed in detail in future research. Smart eco-innovation includes both technological upgrades and the synergistic effects of managerial innovation, policy support, and social participation. Future research can delve into the interactions among these factors and explore how to achieve coordinated regional development in economic, social, and environmental aspects through such innovation.
Finally, due to data limitations, this paper does not investigate the spatial differentiation model of smart ecological economic zones. Instead, future research could analyze this model and propose specific implementation suggestions for different regions. For example, we can design tailored plans for smart ecological economic zones based on local resources, industries, and ecology. Also, integrating the SDM can help analyze the impacts of “smart eco-style” on regional economic structure and layout, thus supporting evidence-based policy-making.
Author Contributions
Conceptualization, methodology, data curation, software, validation, writing—original draft, writing—review and editing were performed by L.C. (Liying Cui). Conceptualization, supervision, methodology, formal analysis, validation, writing—review and editing were conducted by M.P. Supervision, formal analysis, validation, writing—review and editing were finished by H.Z. Supervision, formal analysis, writing—review and editing were finished by L.C. (Liwei Cui). All authors have read and agreed to the published version of the manuscript.
Funding
This research was funded by the Basic Research Operating Expenses of Provincial High Education Institutions in Heilongjiang for Scientific Research Projects of China project (Grant Number: 2022YDW-01; 2023-YDW-03) and Daqing City Philosophy and Social Science Planning Research Project for 2025 (Project Number: DSGB2025152).
Institutional Review Board Statement
Not applicable.
Informed Consent Statement
Not applicable.
Data Availability Statement
The datasets used and/or analyzed during the current study are available from the corresponding author on reasonable request.
Conflicts of Interest
Author Liwei Cui was employed by The Fourth Oil Extraction Plant of Daqing Oilfield Co., Ltd. The remaining authors declare that the research was conducted in the absence of any commercial or financial relationships that could be construed as a potential conflict of interest.
Abbreviations
The following abbreviations are used in this manuscript:
| eco-innovation | Ecological innovation |
| IT | Information technology |
| ICT | Information and communication technology |
| AI | Artificial intelligence |
| SDM | System dynamics modeling |
| tce | Ton of standard coal equivalent |
| three wastes | Waste water, waste gas, solid waste |
Appendix A
Table A1.
Key indicator variables and attributes of the subsystems.
Table A1.
Key indicator variables and attributes of the subsystems.
| Primary Indicator | Secondary Indicator | Unit | Indicator Attribute | Secondary Indicator | Unit | Indicator Attribute |
|---|---|---|---|---|---|---|
| Scientific and technological innovation subsystem | Science and technology human resources (number of R&D personnel) | ten thousand people | state variable | R&D investment | hundred million yuan | auxiliary variable |
| Increase in science and technology human resources | ten thousand people | rate variable | Education investment | hundred million yuan | auxiliary variable | |
| Decrease in science and technology human resources | ten thousand people | rate variable | R&D investment coefficient | / | constant | |
| Number of postgraduate graduates | people | auxiliary variable | Education investment coefficient | / | constant | |
| Science and technology resource investment | hundred million yuan | auxiliary variable | Number of patent applications | piece | auxiliary variable | |
| Science and technology resource investment coefficient | / | constant | ||||
| Economic coordination subsystem | GDP | hundred million yuan | state variable | Smart agriculture investment | hundred million yuan | auxiliary variable |
| GDP increase | hundred million yuan | rate variable | Smart agriculture investment coefficient | / | constant | |
| GDP growth rate | % | auxiliary variable | Value added of the primary industry | hundred million yuan | auxiliary variable | |
| Fiscal expenditure | hundred million yuan | auxiliary variable | Value added of the secondary industry | hundred million yuan | auxiliary variable | |
| Fiscal expenditure coefficient | / | constant | Value added of industry | hundred million yuan | auxiliary variable | |
| Fixed asset investment | hundred million yuan | auxiliary variable | Value added of the tertiary industry | hundred million yuan | auxiliary variable | |
| Fixed asset investment coefficient | / | constant | Energy consumption of the primary industry value added | ten thousand tce | auxiliary variable | |
| Investment in the primary industry | hundred million yuan | auxiliary variable | Energy consumption of the secondary industry value added | ten thousand tce | auxiliary variable | |
| Investment in the secondary industry | hundred million yuan | auxiliary variable | Energy consumption of the tertiary industry value added | ten thousand tce | auxiliary variable | |
| Investment in the tertiary industry | hundred million yuan | auxiliary variable | Energy consumption coefficient for value added of the three industries | / | constant | |
| Investment coefficient of the three industries | / | constant | Industrial coordination | / | state variable | |
| Smart city investment | hundred million yuan | auxiliary variable | Industrial coordination change rate | % | rate variable | |
| Smart city investment coefficient | / | constant | Urban–rural coordination | / | state variable | |
| Smart energy investment | hundred million yuan | auxiliary variable | Urban–rural coordination change rate | % | rate variable | |
| Smart energy investment coefficient | / | constant | ||||
| Green energy subsystem | Remaining available energy reserves | ten thousand tce | state variable | Production of the three wastes | ten thousand tons | auxiliary variable |
| Energy production | ten thousand tce | rate variable | Non-compliant amount of the three wastes | ten thousand tons | auxiliary variable | |
| Energy consumption | ten thousand tce | rate variable | Compliance rate of the three wastes | % | auxiliary variable | |
| Sectoral energy consumption | ten thousand tce | auxiliary variable | Economic loss due to pollution | hundred million yuan | auxiliary variable | |
| Industrial energy consumption | ten thousand tce | auxiliary variable | Environmental capacity | / | state variable | |
| Residential energy consumption | ten thousand tce | auxiliary variable | Rate of change in environmental capacity | % | rate variable | |
| Smart energy investment | hundred million yuan | auxiliary variable | Environmental pollution carrying capacity | / | auxiliary variable | |
| Smart energy investment coefficient | / | constant | Smart environmental protection investment | hundred million yuan | state variable | |
| Economic loss due to energy shortage | hundred million yuan | auxiliary variable | Annual smart environmental protection investment | hundred million yuan | rate variable | |
| Existing pollution quantity | ten thousand tons | state variable | Smart environmental protection investment coefficient | / | constant | |
| Increase in pollutant quantity | ten thousand tons | rate variable | ||||
| Open development subsystem | Regional openness | / | state variable | Total commodity flow value | hundred million yuan | auxiliary variable |
| Change in regional openness | / | rate variable | Commodity import and export value | hundred million dollars | auxiliary variable | |
| Total capital inflow | hundred million yuan | auxiliary variable | Domestic commodity flow value | hundred million yuan | auxiliary variable | |
| Actual foreign capital utilized | hundred million dollars | auxiliary variable | Smart business environment construction | hundred million yuan | auxiliary variable | |
| Actual domestic capital utilized | hundred million yuan | auxiliary variable | Smart business environment construction coefficient | / | constant | |
| People’s livelihood subsystem | Total population | ten thousand people | state variable | Population outflow volume | ten thousand people | auxiliary variable |
| Net population growth | ten thousand people | rate variable | Environmental pollution coefficient | / | auxiliary variable | |
| Volume of growth of natural population | ten thousand people | auxiliary variable | Living standard (per capita GDP) | ten thousand yuan | auxiliary variable | |
| Net population inflow volume | ten thousand people | auxiliary variable | Smart livelihood construction | hundred million yuan | auxiliary variable | |
| Population inflow volume | ten thousand people | auxiliary variable | Smart livelihood construction coefficient | / | constant | |
Table A2.
Explanations of technical terms.
Table A2.
Explanations of technical terms.
| Terms | Meaning |
|---|---|
| Smart ecology construction: | Achieving urban sustainability by promoting harmonious coexistence between humans and nature, optimizing resource utilization, reducing pollution emissions, and enhancing residents’ quality of life through technological innovation and urban planning. |
| High-quality development: | Development driven by innovation, characterized by coordination, embodied in green practices, pursued through openness, and aimed at sharing, seeks to transform economic growth from mere scale expansion to quality and efficiency enhancement, thereby fulfilling people’s aspirations for a better life and achieving comprehensive and sustainable development. |
| New development concept: | A scientific conceptual framework primarily comprising innovation, coordination, green development, openness, and sharing, guiding economic and social development to promote high-quality growth, facilitate comprehensive progress, and achieve sustainability. |
| Oil-to-chemicals: | A development model that uses petroleum as raw material, extends the industrial chain, and enhances product value added through deep processing in the petrochemical industry, thereby transforming a resource-based economy towards diversification and high-end development. |
| Urban resilience: | The capacity of an urban system to withstand, adapt to, and rapidly recover from natural disasters, socio-economic shocks, or other uncertainties, while learning from crises to enhance its own sustainable development. |
References
- Bakıcı, T.; Almirall, E.; Wareham, J. A smart city initiative: The case of Barcelona. J. Knowl. Econ. 2013, 4, 135–148. [Google Scholar] [CrossRef]
- Bibri, S.E.; Krogstie, J.; Kaboli, A.; Alahi, A. Smarter eco-cities and their leading-edge artificial intelligence of things solutions for environmental sustainability: A comprehensive systematic review. Environ. Sci. Ecotechnol. 2024, 19, 100330. [Google Scholar] [CrossRef] [PubMed]
- Li, H.; Dong, L.; Ren, J. Industrial symbiosis as a countermeasure for resource dependent city: A case study of Guiyang, China. J. Clean. Prod. 2015, 107, 252–266. [Google Scholar] [CrossRef]
- An, K.; Wang, C.; Cai, W. Low-carbon technology diffusion and economic growth of China: An evolutionary general equilibrium framework. Struct. Change Econ. Dyn. 2023, 65, 253–263. [Google Scholar]
- Dornhöfer, M.; Weber, C.; Zenkert, J.; Fathi, M. A data-driven smart city transformation model utilizing the green knowledge management cube. In Proceedings of the 2019 IEEE International Smart Cities Conference (ISC2), Casablanca, Morocco, 14–17 October 2019; IEEE: Piscataway, NJ, USA, 2019; pp. 691–696. [Google Scholar]
- Mishra, R.K.; Kumari, C.L.; Janaki Krishna, P.S.; Dubey, A. Smart cities for sustainable development: An overview. In Smart Cities for Sustainable Development; Springer: Singapore, 2022; pp. 1–12. [Google Scholar]
- Sutherland, M.K.; Cook, M.E. Data-Driven Smart cities: A closer look at organizational, technical and data complexities. In Proceedings of the 18th Annual International Conference on Digital Government Research, Staten Island, NY, USA, 7–9 June 2017; pp. 471–476. [Google Scholar]
- Visvizi, A.; del Hoyo, R.P. (Eds.) Smart Cities and the UN SDGs; Elsevier: Amsterdam, The Netherlands, 2021. [Google Scholar] [CrossRef]
- Xu, Y.; Li, W.; Tai, J.; Zhang, C. A Bibliometric-Based Analytical Framework for the Study of Smart City Lifeforms in China. Int. J. Environ. Res. Public Health 2022, 19, 14762. [Google Scholar] [CrossRef]
- Battarra, R.; Gargiulo, C.; Zucaro, F. Future possibility of smart and sustainable cities in the Mediterranean basin. J. Urban Plan. Dev. 2020, 146, 04020036. [Google Scholar] [CrossRef]
- Guo, Q.; Wang, Y.; Dong, X. Effects of smart city construction on energy saving and CO2 emission reduction: Evidence from China. Appl. Energy 2022, 313, 118879. [Google Scholar] [CrossRef]
- Bibri, S.E. Data-driven smart sustainable cities of the future: New conceptions of and approaches to the spatial scaling of urban form. Future Cities Environ. 2021, 7, 1–15. [Google Scholar] [CrossRef]
- Vandergert, P.; Sandland, S.; Newport, D.; Van Den Abeele, P. Harnessing Advances in Eco-Innovation to Achieve Resource Efficient Cities. Green Design, Materials and Manufacturing Processes; Taylor and Francis Group: London, UK, 2013. [Google Scholar]
- Naphade, M.; Banavar, G.; Harrison, C.; Paraszczak, J.; Morris, R. Smarter cities and their innovation challenges. Computer 2011, 44, 32–39. [Google Scholar] [CrossRef]
- Bradbury, J.H. Towards an alternative theory of resource-based town development in Canada. Econ. Geogr. 1979, 55, 147–166. [Google Scholar] [CrossRef]
- Bradbury, J.H.; St-Martin, I. Winding down in a Quebec mining town: A case study of Schefferville. Can. Geogr./Géogr. Can. 1983, 27, 128–144. [Google Scholar]
- Sachs, J.D.; Warner, A.M. The curse of natural resources. Eur. Econ. Rev. 2001, 45, 827–838. [Google Scholar]
- Destek, M.A.; Aydın, S.; Destek, G. Investigating an optimal resource dependency to prevent natural resource curse: Evidence from countries with the curse risk. Resour. Policy 2022, 79, 102981. [Google Scholar] [CrossRef]
- Keller, M. Oil revenues vs domestic taxation: Deeper insights into the crowding-out effect. Resour. Policy 2022, 76, 102560. [Google Scholar] [CrossRef]
- Zheng, F.; Niu, Y. Environmental decentralization, resource endowment and urban industrial transformation and upgrading: A comparison of resource-based and non-resource-based cities in China. Sustainability 2023, 15, 10475. [Google Scholar] [CrossRef]
- Wang, X.; Liu, H.; Chen, Z. Transformation of resource-based cities: The case of Benxi. Front. Environ. Sci. 2022, 10, 903178. [Google Scholar] [CrossRef]
- Mitchell, C.J.; O’Neill, K. Tracing economic transition in the mine towns of northern Ontario: An application of the “resource-dependency model”. Can. Geogr./Géogr. Can. 2016, 60, 91–106. [Google Scholar]
- Douglas, S.; Walker, A. Coal mining and the resource curse in the eastern United States. J. Reg. Sci. 2017, 57, 568–590. [Google Scholar]
- Martinus, K. Regional development in a resource production system: Long distance commuting, population growth, and wealth redistribution in the Western Australia Goldfields. Geogr. Res. 2016, 54, 420–432. [Google Scholar]
- Ma, Y.; Yan, J.; Sha, J.; He, G.; Song, C.; Fan, S.; Ke, W. Dynamic simulation of the atmospheric environment improved by a focus on clean energy utilization of resource-based cities in China. J. Clean. Prod. 2018, 192, 396–410. [Google Scholar] [CrossRef]
- Yang, Y.; Guo, H.; Chen, L.; Liu, X.; Gu, M.; Ke, X. Regional analysis of the green development level differences in Chinese mineral resource-based cities. Resour. Policy 2019, 61, 261–272. [Google Scholar]
- Louw, H.; Marais, L. Mining and municipal finance in Kathu, an open mining town in South Africa. Extr. Ind. Soc. 2018, 5, 278–283. [Google Scholar]
- Cała, M.; Szewczyk-Świątek, A.; Ostręga, A. Challenges of coal mining regions and municipalities in the face of energy transition. Energies 2021, 14, 6674. [Google Scholar] [CrossRef]
- Kaczmarek, J.; Kolegowicz, K.; Szymla, W. Restructuring of the coal mining industry and the challenges of energy transition in Poland (1990–2020). Energies 2022, 15, 3518. [Google Scholar] [CrossRef]
- Kim, D.H.; Lin, S.C. Natural resources and economic development: New panel evidence. Environ. Resour. Econ. 2017, 66, 363–391. [Google Scholar]
- Yuan, T.; Xiang, Y.; Xiong, L. Driving forces and obstacles analysis of urban high-quality development in Chengdu. Sci. Rep. 2024, 14, 24530. [Google Scholar]
- Ma, X.; Xu, J. Impact of environmental regulation on high-quality economic development. Front. Environ. Sci. 2022, 10, 896892. [Google Scholar]
- Shen, L.; He, G. Threshold Effect of Financial System on High-Quality Economic Development. J. Math. 2022, 2022, 9108130. [Google Scholar]
- Luo, C.; Wei, D.; Su, W.; Lu, J. Association between regional digitalization and high-quality economic development. Sustainability 2023, 15, 1909. [Google Scholar] [CrossRef]
- Tan, J. Regional economic resilience of resource-based cities and influential factors during economic crises in China. In Economic Resilience in Regions and Organisations; Springer: Wiesbaden, Germany, 2021; pp. 91–115. [Google Scholar]
- Wang, D.; Shi, Y.; Wan, K. Integrated evaluation of the carrying capacities of mineral resource-based cities considering synergy between subsystems. Ecol. Indic. 2020, 108, 105701. [Google Scholar]
- Yan, D.; Kong, Y.; Ren, X.; Shi, Y.; Chiang, S. The determinants of urban sustainability in Chinese resource-based cities: A panel quantile regression approach. Sci. Total Environ. 2019, 686, 1210–1219. [Google Scholar] [PubMed]
- Ruan, F.; Yan, L.; Wang, D. The complexity for the resource-based cities in China on creating sustainable development. Cities 2020, 97, 102571. [Google Scholar]
- Dempsey, N.; Bramley, G.; Power, S.; Brown, C. The social dimension of sustainable development: Defining urban social sustainability. Sustain. Dev. 2011, 19, 289–300. [Google Scholar]
- While, A.; Jonas, A.E.; Gibbs, D. From sustainable development to carbon control: Eco-state restructuring and the politics of urban and regional development. Trans. Inst. Br. Geogr. 2010, 35, 76–93. [Google Scholar]
- World Economic Forum. Circular Economy in Cities. Evolving the Model for a Sustainable Urban Future; White Paper; World Economic Forum: Cologny, Switzerland, 2018. [Google Scholar]
- Zhou, J.; Xu, W.; Yan, D. Breaking the resource curse: The impact of digital economy on the sustainable transformation of resource-based cities. Sustain. Cities Soc. 2024, 113, 105707. [Google Scholar]
- Qiao, R.; Chen, W.; Qiao, Y. Sustainable development path of resource-based cities—Taking datong as an example. Sustainability 2022, 14, 14474. [Google Scholar] [CrossRef]
- Ab Rahman, A.; Hamid, U.Z.A.; Chin, T.A. Emerging technologies with disruptive effects: A review. PERINTIS eJournal 2017, 7, 111–128. [Google Scholar]
- Bibri, S.E.; Alexandre, A.; Sharifi, A.; Krogstie, J. Environmentally sustainable smart cities and their converging AI, IoT, and big data technologies and solutions: An integrated approach to an extensive literature review. Energy Inform. 2023, 6, 9. [Google Scholar]
- Forrester, J.W. Industrial dynamics: A major breakthrough for decision makers. In The Roots of Logistics; Springer: Berlin/Heidelberg, Germany, 2012; pp. 141–172. [Google Scholar]
- Davies, E.G.; Simonovic, S.P. Global water resources modeling with an integrated model of the social–economic–environmental system. Adv. Water Resour. 2011, 34, 684–700. [Google Scholar]
- Jiang, L.; Niu, H.; Ru, Y.; Tong, A.; Wang, Y. Can carbon finance promote high quality economic development: Evidence from China. Heliyon 2023, 9, e22698. [Google Scholar]
- Wang, X.; Dong, F.; Pan, Y.; Liu, Y. Transport infrastructure, high-quality development and industrial pollution: Fresh evidence from China. Int. J. Environ. Res. Public Health 2022, 19, 9494. [Google Scholar] [CrossRef] [PubMed]
- Xia, K.; Guo, J.K.; Han, Z.L.; Dong, M.R.; Xu, Y. Analysis of the scientific and technological innovation efficiency and regional differences of the land–sea coordination in China’s coastal areas. Ocean Coast. Manag. 2019, 172, 157–165. [Google Scholar]
- Yang, B.; Long, Y.; Yang, T.; Sun, W.; Shao, C. The Influence of the Flow of Scientific and Technological Factors on the High-Quality Development of Regional Economy. Sustainability 2024, 16, 9733. [Google Scholar] [CrossRef]
- Jiang, J.; Li, Y.; Li, Y.; Li, C.; Yu, L.; Li, L. Smart transportation systems using learning method for urban mobility and management in modern cities. Sustain. Cities Soc. 2024, 108, 105428. [Google Scholar]
- Alsamhi, S.H.; Afghah, F.; Sahal, R.; Hawbani, A.; Al-qaness, M.A.; Lee, B.; Guizani, M. Green internet of things using UAVs in B5G networks: A review of applications and strategies. Ad Hoc Netw. 2021, 117, 102505. [Google Scholar]
- Zhan, J.; Dong, S.; Hu, W. IoE-supported smart logistics network communication with optimization and security. Sustain. Energy Technol. Assess. 2022, 52, 102052. [Google Scholar]
- Cong, H.; Zou, D. The research on the mechanism and spatial–temporal differentiation of the coupling coordination development based on industrial cluster agglomeration. Clust. Comput. 2017, 20, 195–213. [Google Scholar]
- Adom, P.K.; Amuakwa-Mensah, F.; Agradi, M.P.; Nsabimana, A. Energy poverty, development outcomes, and transition to green energy. Renew. Energy 2021, 178, 1337–1352. [Google Scholar]
- Androniceanu, A.; Sabie, O.M. Overview of green energy as a real strategic option for sustainable development. Energies 2022, 15, 8573. [Google Scholar] [CrossRef]
- Cheng, P.; Wang, X.; Choi, B.; Huan, X. Green finance, international technology spillover and green technology innovation: A new perspective of regional innovation capability. Sustainability 2023, 15, 1112. [Google Scholar] [CrossRef]
- Ahad, M.A.; Paiva, S.; Tripathi, G.; Feroz, N. Enabling technologies and sustainable smart cities. Sustain. Cities Soc. 2020, 61, 102301. [Google Scholar]
- Chen, C.W. Can smart cities bring happiness to promote sustainable development? Contexts and clues of subjective well-being and urban livability. Dev. Built Environ. 2023, 13, 100108. [Google Scholar]
- Chen, Z.; Peng, W.; Yao, X. A Deep Neural Network-Based Intelligent Forecasting Approach for Multi-Dimensional Economic Indexes in Smart Cities. J. Circuits Syst. Comput. 2024, 33, 2450191. [Google Scholar]
- Li, X.; Zhuang, X. Eco-city problems: Industry–city–ecology, urbanization development assessment in resource-exhausted cities. Sustainability 2022, 15, 166. [Google Scholar] [CrossRef]
- Tang, J. How the Smart Energy Can Contribute towards Achieving the Sustainable Development Goal 7. Sustainability 2024, 16, 7822. [Google Scholar] [CrossRef]
- Tang, J.; Zhao, P.; Gao, Y. Can smart energy alleviate energy poverty in China?–Empirical evidence using synthetic control methods. J. Clean. Prod. 2024, 449, 141821. [Google Scholar]
- Jiang, Y.; Sun, J. Does smart city construction promote urban green development? Evidence from a double machine learning model. J. Environ. Manag. 2025, 373, 123701. [Google Scholar]
- Wu, J.; Lin, K.; Sun, J. The impact of smart city construction on urban energy efficiency: Evidence from China. Environ. Dev. Sustain. 2024, 1–24. [Google Scholar] [CrossRef]
- Li, Z.; Liang, Y.; Liao, Q.; Wang, B.; Huang, L.; Zheng, J.; Zhang, H. Review on intelligent pipeline technologies: A life cycle perspective. Comput. Chem. Eng. 2023, 175, 108283. [Google Scholar]
- Huang, Z.; Ge, S.; He, Y.; Wang, D.; Zhang, S. Research on the Intelligent System Architecture and Control Strategy of Mining Robot Crowds. Energies 2024, 17, 1834. [Google Scholar] [CrossRef]
- Liu, Y.; Yu, W.; Gao, C.; Chen, M. An auto-extraction framework for cep rules based on the two-layer lstm attention mechanism: A case study on city air pollution forecasting. Energies 2022, 15, 5892. [Google Scholar] [CrossRef]
- National Plan for the Sustainable Development of Resource-Based Cities (2013–2020). Available online: https://www.gov.cn/zfwj/2013-12/03/content_2540070.htm (accessed on 30 January 2025).
- Uehara, T.; Cordier, M.; Hamaide, B. Fully dynamic input-output/system dynamics modeling for ecological-economic system analysis. Sustainability 2018, 10, 1765. [Google Scholar] [CrossRef]
- Datola, G.; Bottero, M.; De Angelis, E.; Romagnoli, F. Operationalising resilience: A methodological framework for assessing urban resilience through System Dynamics Model. Ecol. Model. 2022, 465, 109851. [Google Scholar] [CrossRef]
- Zhao, C.; Zhu, Z.; Wang, Y.; Du, J. The Impact of Industrial Robots on Green Total Factor Energy Efficiency: Empirical Evidence from Chinese Cities. Energies 2024, 17, 5034. [Google Scholar] [CrossRef]
- Wang, Z.; Hao, Y. Can smart cities improve energy resilience? Evidence from 229 cities in China. Sustain. Cities Soc. 2024, 117, 105971. [Google Scholar] [CrossRef]
- Chen, P. Urban planning policy and clean energy development Harmony-evidence from smart city pilot policy in China. Renew. Energy 2023, 210, 251–257. [Google Scholar] [CrossRef]
- Zhao, Y.; Yang, Y.; Leszek, S.; Wang, X. Experience in the transformation process of “coal city” to “beautiful city”: Taking Jiaozuo City as an example. Energy Policy 2021, 150, 112164. [Google Scholar] [CrossRef]
- Höffken, J.I.; Limmer, A. Smart and eco-cities in India and China. In Smart and Sustainable Cities? Routledge: London, UK, 2020; pp. 90–105. [Google Scholar]
- Jaroń, A.; Borucka, A.; Deliś, P.; Sekrecka, A. An assessment of the possibility of using unmanned aerial vehicles to identify and map air pollution from infrastructure emissions. Energies 2024, 17, 577. [Google Scholar] [CrossRef]
- Chen, Z. Application of environmental ecological strategy in smart city space architecture planning. Environ. Technol. Innov. 2021, 23, 101684. [Google Scholar] [CrossRef]
- Yue, J.P.; Zhang, F.Q. Evaluation of industrial green transformation in the process of urbanization: Regional difference analysis in China. Sustainability 2022, 14, 4280. [Google Scholar] [CrossRef]
- Vohra, K.; Marais, E.A.; Bloss, W.J.; Schwartz, J.; Mickley, L.J.; Van Damme, M.; Clarisse, L.; Coheur, P.F. Rapid rise in premature mortality due to anthropogenic air pollution in fast-growing tropical cities from 2005 to 2018. Sci. Adv. 2022, 8, 4435. [Google Scholar]
Disclaimer/Publisher’s Note: The statements, opinions and data contained in all publications are solely those of the individual author(s) and contributor(s) and not of MDPI and/or the editor(s). MDPI and/or the editor(s) disclaim responsibility for any injury to people or property resulting from any ideas, methods, instructions or products referred to in the content. |
© 2025 by the authors. Licensee MDPI, Basel, Switzerland. This article is an open access article distributed under the terms and conditions of the Creative Commons Attribution (CC BY) license (https://creativecommons.org/licenses/by/4.0/).