1. Introduction
Combating human-induced climate change is of utmost urgence, in order to reduce its devastating effects on people and nature [
1]. In 2015, a cornerstone of the turnaround from fossil fuels to renewable energy sources (RESs), namely the Paris Agreement, was been set. This enforces the objective of keeping the temperature increase well below 2 °C, working towards the 1.5 °C value [
2]. The European Union (EU) assumed a leading role in tackling climate change by means of the European Green Deal [
3] and its upgrade, the European Climate Law [
4]. These include the ambitious objective of reaching climate neutrality by 2050 [
5], with 2030 being the first major first stage for reducing the CO
2 emissions by 55% with respect to 1990 levels, as per the Fit For 55 package [
6].
Within the European context, domestic heating represents a considerable proportion of energy consumption and CO
2 emissions [
7,
8], especially in Italy [
9]. In 2022, households accounted for 25.8% of final energy consumption within the European Union (EU), with natural gas constituting 30.9% of this consumption. Within Italy, the reliance on natural gas is even more pronounced, with 49.84% of household energy consumption derived from this source. This heavy reliance on fossil fuels for domestic heating has significant implications for the EU’s decarbonisation objectives, as it leads to substantial CO
2 emissions [
10]. To address this challenge, district heating (DH) has been proposed as a viable option in future energy systems [
11], especially 100% renewable ones [
12,
13,
14] powered by industrial excess heat [
9]. In particular, fourth-generation district heating (4GDH) networks, introduced in 2014 by Lund et al. [
15], are characterised by a lower operating temperature, namely up to 70 °C [
16], with respect to previous generations, which reduces heat losses. Moreover, 4GDH can advance sectorial integration, namely the smart energy systems (SESs) approach [
17], and aid waste heat sources and RES integration due to their low-temperature operation [
18]. In detail, potential couplings with 4GDH networks include solar thermal collectors [
19], geothermal collectors [
20,
21], and photovoltaic thermal (PVT) collectors [
22]. Additionally, waste heat sources from different industrial processes [
23,
24] can be employed for 4GDH networks. Specifically, excess heat resulting from waste management processes related to sewage [
21,
25] and municipal solid waste [
26] can be a potential option, as well as seawater treatment plants [
27], agrothermal processes [
28], data centres [
29], and low-temperature electrolysers [
30]. In detail, Z. Tian, et al. [
31] presented a comprehensive analysis of the development of large-scale solar district heating (SDH) systems in Denmark, highlighting their key components, integration with other renewable energy sources, and factors influencing their widespread adoption. Their results showed that the low cost of solar heat could be the main driver for the expansion of SDH systems, making them highly competitive with electricity and natural gas-based heating. In addition, the consumer-owned structure of district heating companies fosters a strong willingness among end users to invest in SDH systems, which is further facilitated by the availability of inexpensive land. L. Ozgener et al. [
32], on the other hand, assessed the energy and exergy performance of geothermal district heating systems (GDHSs) in Turkey, detailing three specific systems in Balcova, Salihli, and Gonen. The authors pinpoint the critical role of reinjection strategies in improving system performance and ensuring the efficient use of geothermal resources. Additionally, they highlighted the importance of implementing automated control systems for minimizing heat losses, reducing human intervention, and enhancing overall system efficiency. Regarding biomass, K. Ericsson and S. Werner [
33] focused on the long-term sustainability of biomass in district heating applications. The main challenge of such an environmentally friendly fuel for this specific application lies in its competing uses, such as the biomass-based production of transport fuels, chemicals, and plastics. To address this, district heating systems should prioritise heat recovery from these emerging bio-based industries, in order to reinforce the fundamental principle of district heating as an efficient surplus thermal energy exploitation strategy. Lastly, regarding the cost-effectiveness of recovered industrial waste heat in district heating systems, J. Ziemele et al. [
34] showed that the transmission distance between the waste heat source (e.g., an industrial plant) and the district heating network is the main parameter driving the economic feasibility of such projects. Their methodology allows for the calculation of transmission distance threshold limit values for making waste heat integration in district heating systems a cost-effective strategy for CO
2 emissions reduction.
As highlighted by the considerable number of case studies analysed, the extant literature acknowledges the potential role of fourth-generation district heating (4GDH) networks for space heating decarbonization, especially when coupled with renewable energy sources. However, a notable literature gap exists in the detailed techno-economic evaluation of 4GDH systems integrated with distributed photovoltaic generation, especially with regard to the residential building clusters’ scale. Most existing studies either focus on 4GDH integration with large-scale renewable sources [
18] or industrial waste heat [
21,
25,
26,
27,
28,
29,
30] or assess 4GDH systems in theoretical or idealized settings [
35] without time-dependent load profiles [
36]. As a result, the effective combined impact of the PV plant on both the economic (e.g., LCOHE and CAC) and environmental (e.g., CO
2 emissions) performance of 4GDH systems is lacking.
Thus, the key literature gap lies in the system-level analysis of 4GDH networks coupled with distributed PV, considering realistic building cluster demands, semi-dynamic performance modelling, and, especially, sensitivity to energy market conditions. This gap limits the understanding of the conditions under which PV-driven 4GDH systems can be cost-competitive and effective for the district-scale decarbonization of space heating.
In the current scientific literature, despite the theoretical synergy between 4GDH and PV, comprehensive quantitative studies assessing the techno-economic performance of such integrated configurations remain limited.
This study aims to address this gap by comparing three alternative scenarios for meeting the space heating demand of a cluster of 200 dwellings, representative of a typical residential neighbourhood in Rome, Italy.
The first scenario, serving as a reference, is based on decentralized heating through individual natural gas boilers. The second scenario consists of a 4GDH system employing an MW-scale centralized air-source heat pump. The third scenario extends the second one, by implementing a 500 kWp distributed PV plant.
To accurately assess system performance, a semi-dynamic simulation model has been developed in MATLAB/Simulink, allowing for an hourly resolution analysis that accounts for variations in thermal load and outdoor environmental conditions. Each scenario has been evaluated by means of three key performance indicators: the levelized cost of heat (LCOHE), reflecting the total cost per unit of useful heat delivered, annual CO2 emissions, and carbon avoidance cost (CAC), which quantifies the marginal cost associated with avoiding the emission of one ton of CO2 relative to the reference scenario.
Through such a comparative analysis, this study provides valuable insights into the economic viability and decarbonization potential of district-level 4GDH systems, both with and without PV integration. The findings are intended to inform policy-makers, urban planners, and energy system designers about the conditions under which these solutions may become competitive with conventional heating technologies and contribute meaningfully to the energy transition in the residential sector.
2. Materials and Methods
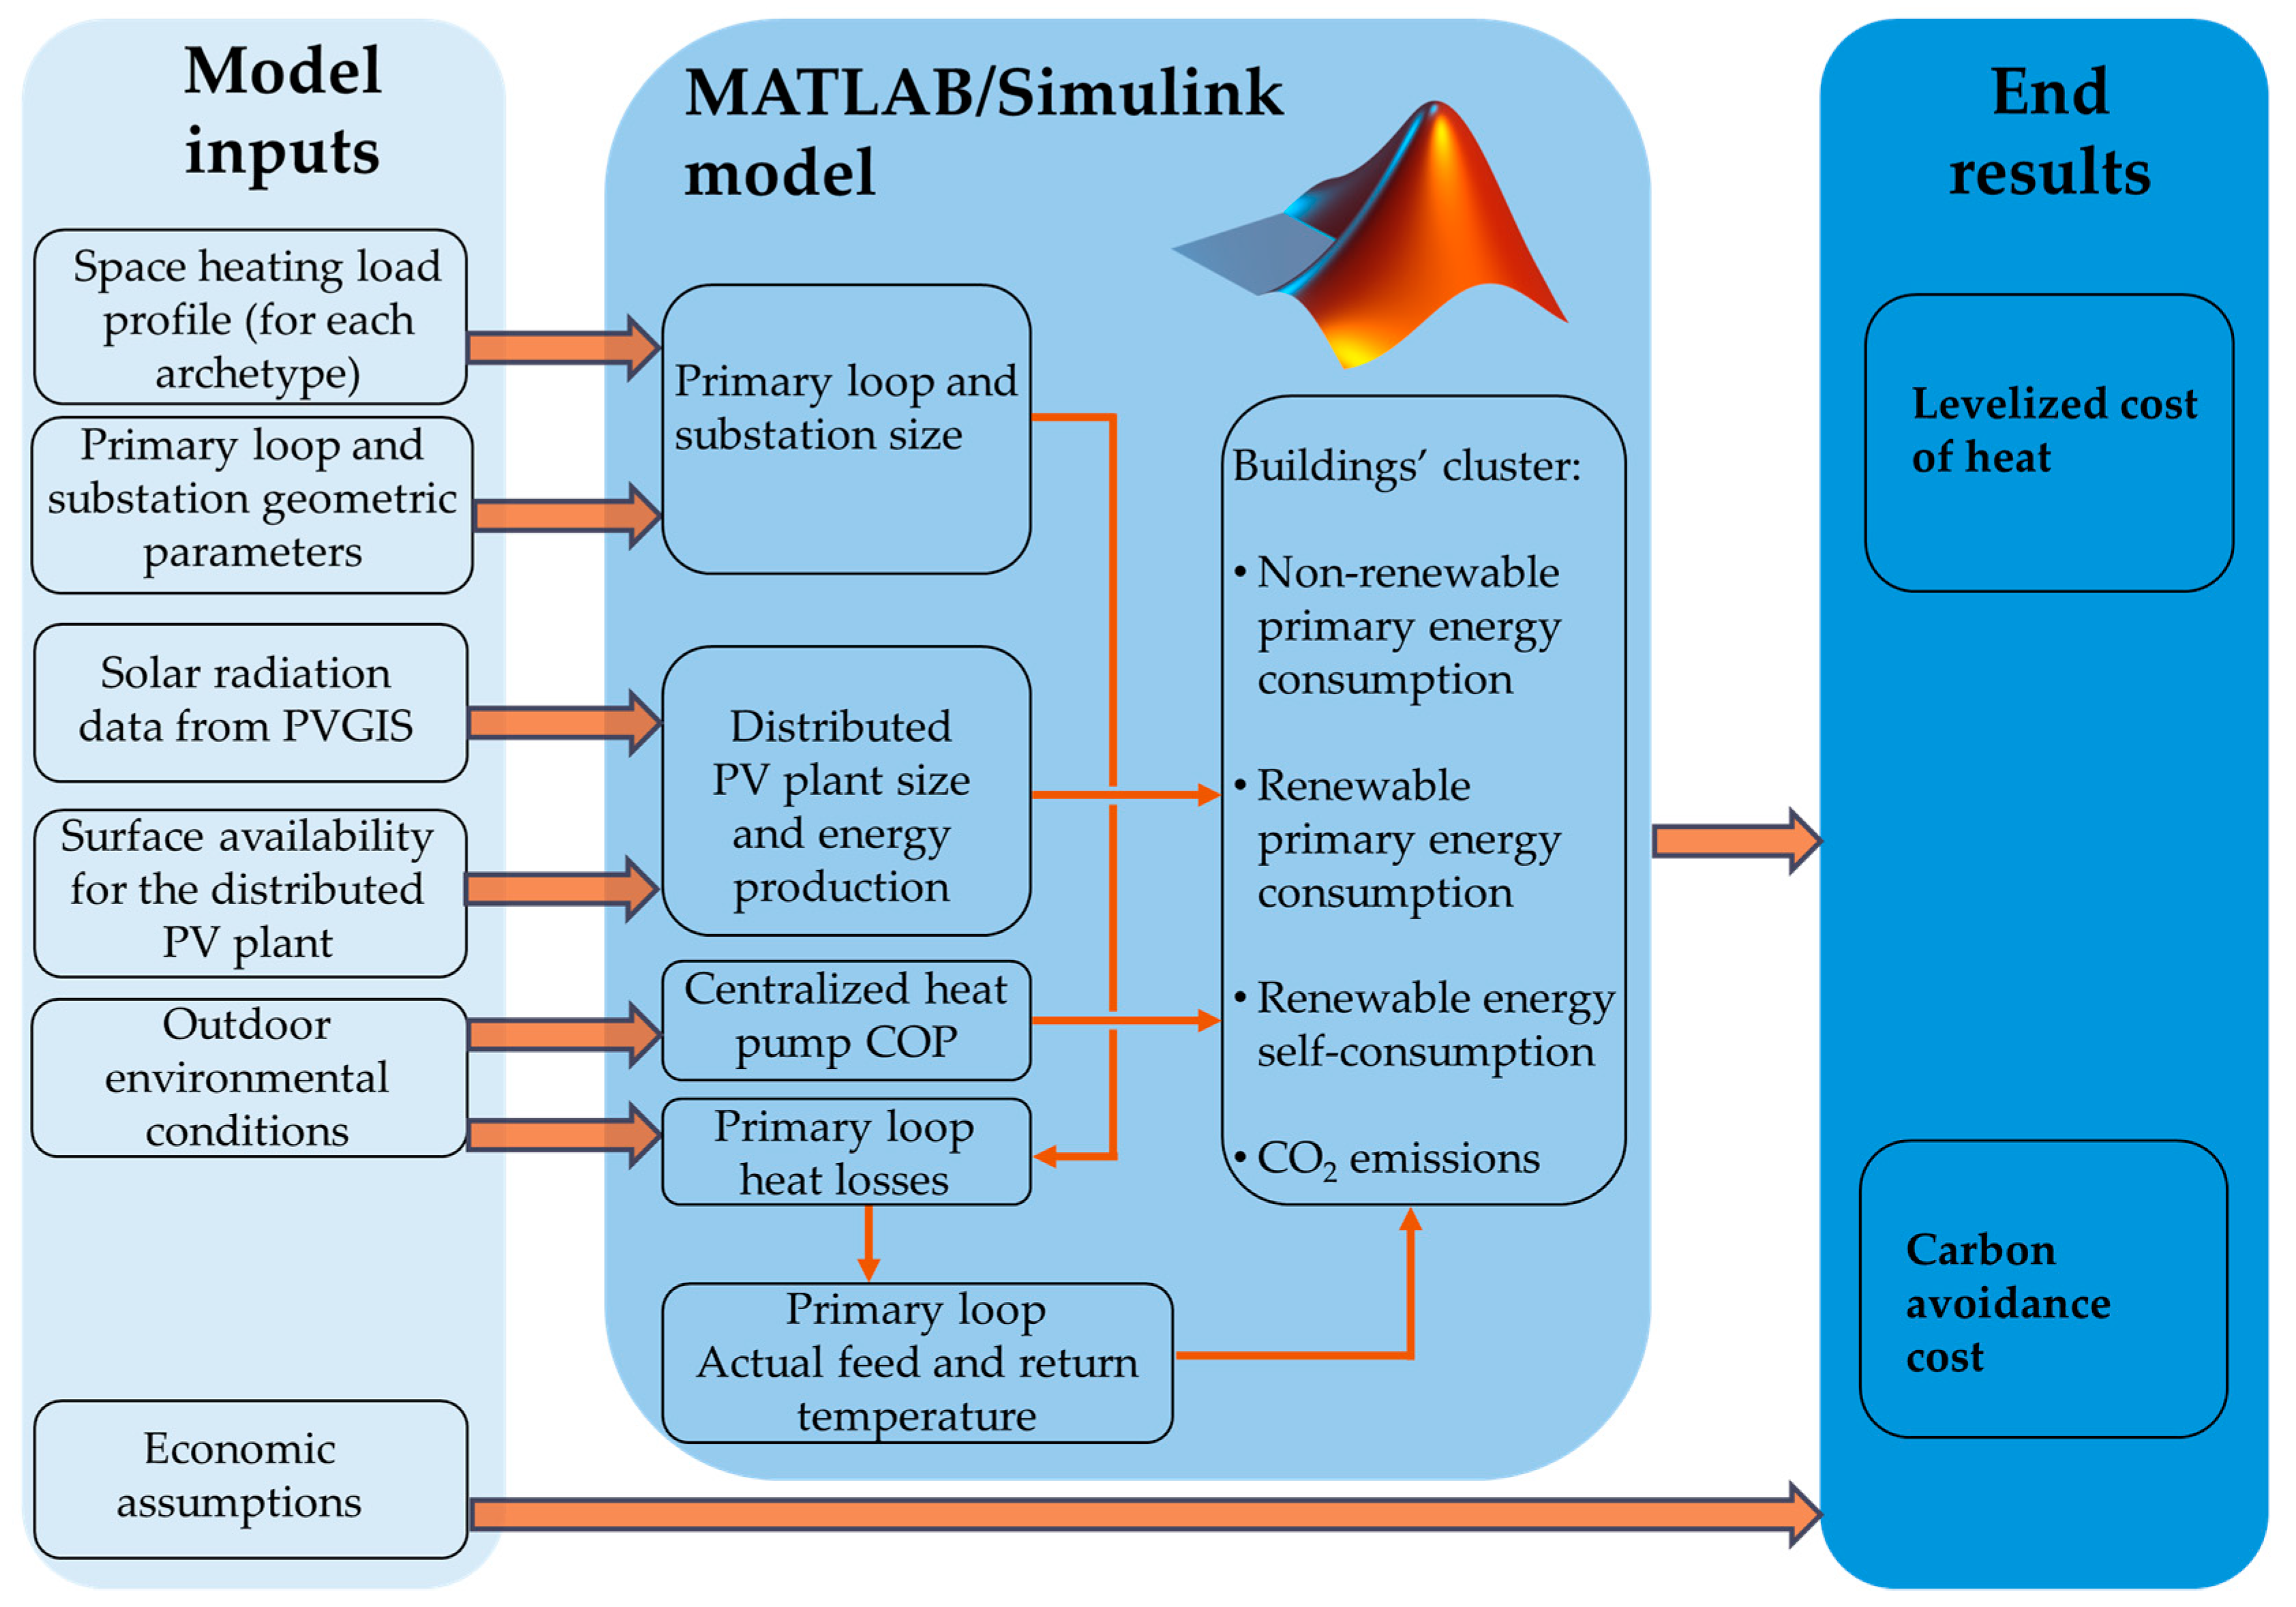
In order to assess the proposed scenarios, the following methodology has been implemented (see
Figure 1). A semi-dynamic MATLAB/Simulink (version R2023a) model has been developed, starting from the domestic clusters’ heating load profile reported in Ref. [
37], the geometric parameters of the primary loop and substations, and the surface availability for the distributed PV plant. The energy production and transportation technologies, namely the centralised heat pump, the distributed PV plant, and the DH network have been evaluated under time-dependent thermal load variations and outdoor environmental temperature conditions, with an hourly resolution, due to their significant impact on overall system efficiency. Fluctuations in outdoor temperature influence the building cluster’s heat demand and the thermal losses in the district heating (DH) network. The latter require the primary loop feed temperature to be greater than the designed one, to ensure proper heat delivery. That temperature adjustment, in turn, adversely affects the HP’s COP. Likewise, the PV plant’s electricity production is intrinsically linked to solar irradiance, which varies hourly and seasonally. Therefore, semi-dynamic modelling, capturing hourly variations in environmental and load-dependent factors is essential to accurately assess the operational performance and comparative viability of the proposed energy supply configurations.
The model calculates all of the parameters required for outputting the chosen KPIs, namely the levelized cost of heat and the carbon avoidance cost.
Figure 1 graphically outlines the aforementioned methodology of the investigation.
The cluster of buildings comprises four different housing archetypes, differentiated by their surface and annual energy consumption for domestic heating. In total, 200 dwellings have been considered, equally distributed among the four archetypes, as depicted in
Table 1. Indeed, the chosen archetypes reflect common buildings in Rome, where the case study is based, in terms of local distribution in the municipality, floor surface, the number of occupants, heat generator typology, and heating needs. Moreover, the selected number of dwellings is consistent with the current regulatory framework for fostering the development of renewable energy communities (RECs) in Italy. According to the Italian Electricity Market Report of 2024 [
38], approximately 34% of established RECs feature an installed renewable generation capacity greater than 200 kW. Given the regulatory limit of 1 MW for renewable capacity connected to the same medium/low voltage (MV/LV) substation, the chosen cluster size, considering typical building typologies and rooftop surface area availability, enables the installation of a 500 kWp distributed PV plant. Such capacity aligns with prevailing trends in REC deployment and maximizes rooftop utilization without exceeding the regulatory limit, hence providing a realistic and policy-compliant scenario for district-level decarbonization strategies.
In the reference scenario, the thermal energy needs are met by means of individual natural gas boilers. Conversely, in the 4GDH scenario, an air-to-water heat pump has been employed for producing the required thermal energy. The latter is delivered to the end-users by a low-temperature district heating network. The design supply and return temperatures of the DH network have been set at 55 C and 50 °C, respectively.
The end-users’ supply and return temperatures, on the other hand, have been set at 45 and 40 °C, respectively, to match the operating temperature difference of fan-coils.
In order to decouple the primary and secondary loop, substations (i.e., plate heat exchangers) have been sized according to Sadik Kakac’s Heat Exchanger book procedure [
39].
Regarding the primary loop configuration, underground pipes have been employed for their better insulation performance, with respect to above-ground installations [
40]. Moreover, as this work focuses on the application of district heating networks, for supplying heat in the residential sector, all of the pipes and connections must only be installed underground, in order to match the urbanistic requirements of a district. Notwithstanding, energy losses due to the temperature difference between the primary loop temperature and the ground temperature are still present. Calculating such losses is necessary for correctly sizing the heat pump capacity to meet the thermal energy needs of the buildings cluster. The actual feed and return temperature of the primary loop, due to those losses, have been calculated according to Equations (1) and (2) [
41].
where
is the mass flow rate of water in the primary loop,
is the ambient temperature,
is the ground thermal resistance,
is the pipe thermal resistance,
is the feed-return pipe thermal resistance, and
and
are the design feed and return temperature of the primary loop, respectively. The thermal resistance values reported in Equations (1) and (2), have been calculated as follows (Equations (3)–(5)).
Here,
is the convective heat exchange coefficient;
and
are the inner and outer diameters of the steel pipe, respectively;
and
are the inner and outer diameters of the insulation layer, respectively; and
and
are the inner and outer diameters of the casing, respectively. Moreover,
is the thermal conductivity of the pipe,
is the thermal conductivity of the insulation layer,
is the thermal conductivity of the outer case,
is the thermal conductivity of the ground,
is the equivalent thermal resistance, and C and H are the distance and the depth of laying, respectively. As regards the pipes’ materials, they mainly affect the commercial diameters and consequently, the head losses. On the other hand, the heat loss performance is substantially the same, as the insulation thickness is given by the Italian technical standard [
42] depending on the diameter. The technical parameters employed in the calculation of the real primary loop feed and return temperature have been reported in
Table 2.
The outdoor environmental temperature is a key parameter for determining the thermal losses along the primary loop of a district heating (DH) network. In this work, the outdoor environmental conditions for the city of Rome have been accounted for, employing the typical meteorological year (TMY) hourly resolution data from the PVGIS (Photovoltaic Geographical Information System). Indeed, as the temperature decreases, the gradient between the supply water in the DH network and the surrounding environment increases, leading to increased heat losses through the distribution pipelines. These losses reduce the overall heat delivery efficiency of, and cause the need for additional thermal input from, the centralized heat pump to meet the cluster’s heat demand. In order to compensate for the thermal losses along the primary loop, the real feed temperature must be greater than its nominal design value. This compensatory increase ensures that, despite progressive heat dissipation along the network, the supply temperature at each substation remains sufficient to meet the end-user thermal demand. However, such a feed temperature increase negatively affects the centralized heat pump’s performance. Specifically, a higher supply temperature at the condenser side of the HP leads to an increased temperature lift between the heat source and sink, thereby reducing the system’s coefficient of performance (COP). As a consequence, minimizing thermal losses in the primary loop is critical not only for maintaining delivery temperatures but also for preserving high HP efficiency.
The relation between the real primary loop feed temperature and the heat pump’s COP [
46] reads as follows (Equation (6)):
where the parameters
,
, and
depend on the heat distribution system. For the case of air-to-water heat pumps, these are equal to 5.06, −0.05, and 0.00006, respectively. ΔT, on other hand, is the temperature difference between the heat sink and heat source temperatures, respectively, equal to the real primary loop feed temperature and the outdoor environmental temperature. By taking into account the variation in both of these temperatures, with an hourly resolution, the centralized heat pump’s COP has been assessed with respect to time-dependent working conditions.
In addition, the head losses in the primary loop have been assessed, starting from the friction factor calculation in accordance with the Colebrook–White iterative equation (Equation (7)).
where Fa is the friction factor, to be calculated through the iterative equation, k is the steel pipe roughness, equal to 0.045 mm, D is the inner diameter of the steel pipe (0.2101 m), and Re is the Reynolds number, equal to 503,932.
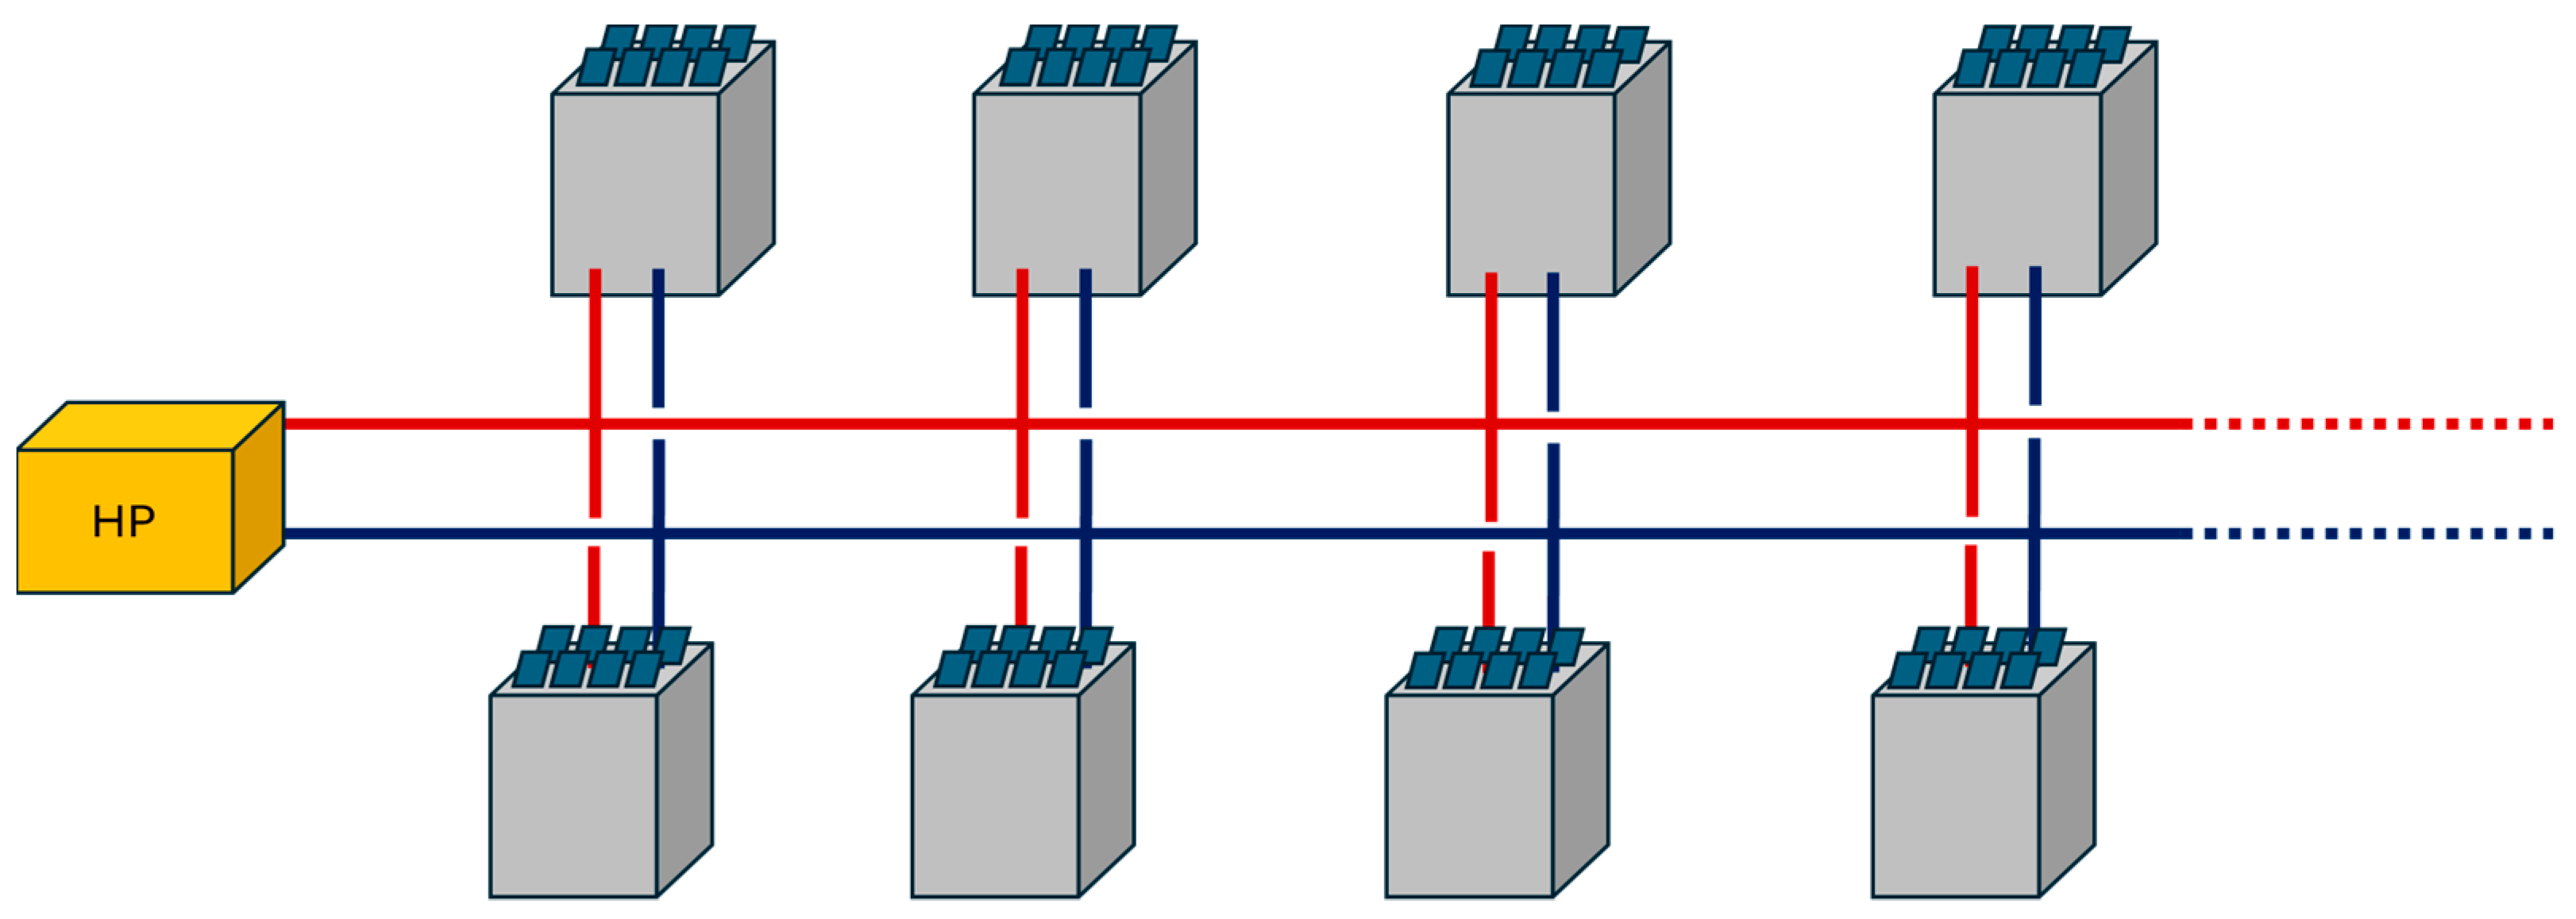
Moreover, for further reducing the building cluster’s non-renewable primary energy consumption, a distributed photovoltaic power plant has been implemented. Setting the rooftop surface area availability as a constraint, the hourly electricity production profile has been derived from PVGIS, for the specific location considered.
A simplified technical scheme of the PV-driven 4GDH layout is depicted in
Figure 2.
In total, three scenarios have been assessed under the techno-economic and environmental point of view: individual natural gas boilers, a heat pump 4GDH network, and a heat pump 4GDH network and PV. To do so, the levelized cost of heat and the carbon avoidance cost [
47,
48] have been employed as KPIs (Equations (8) and (9)).
Here,
(CAPital EXpenditure) and
(OPerational EXpenditure) indicate the investment cost and the operation and maintenance cost of the
i-th technology, while
and
represent the investment cost and the operation and maintenance cost of the
j-th technology, respectively. Subscript “
i” and “
j” indicate the new installed technology and the substituted technology. Similarly,
and
indicate the capital recovery factor of the
i-th and
j-th technology. In detail, the capital recovery factor has been calculated according to Equation (10).
where
represents the interest rate, and
indicates the technology’s lifetime.
In
Table 3, all of the economic assumptions related to the KPI calculations are outlined.
3. Results and Discussion
This work aims to pursue the decarbonization of building clusters’ domestic thermal needs by integrating energy-efficient and environmentally friendly technologies, namely heat pumps and PV, coupled with a low-temperature district heating network.
In order to assess such a decarbonization strategy and compare it with the reference scenario, the LCOHE and the CAC have been employed as metrics, as well as the CO
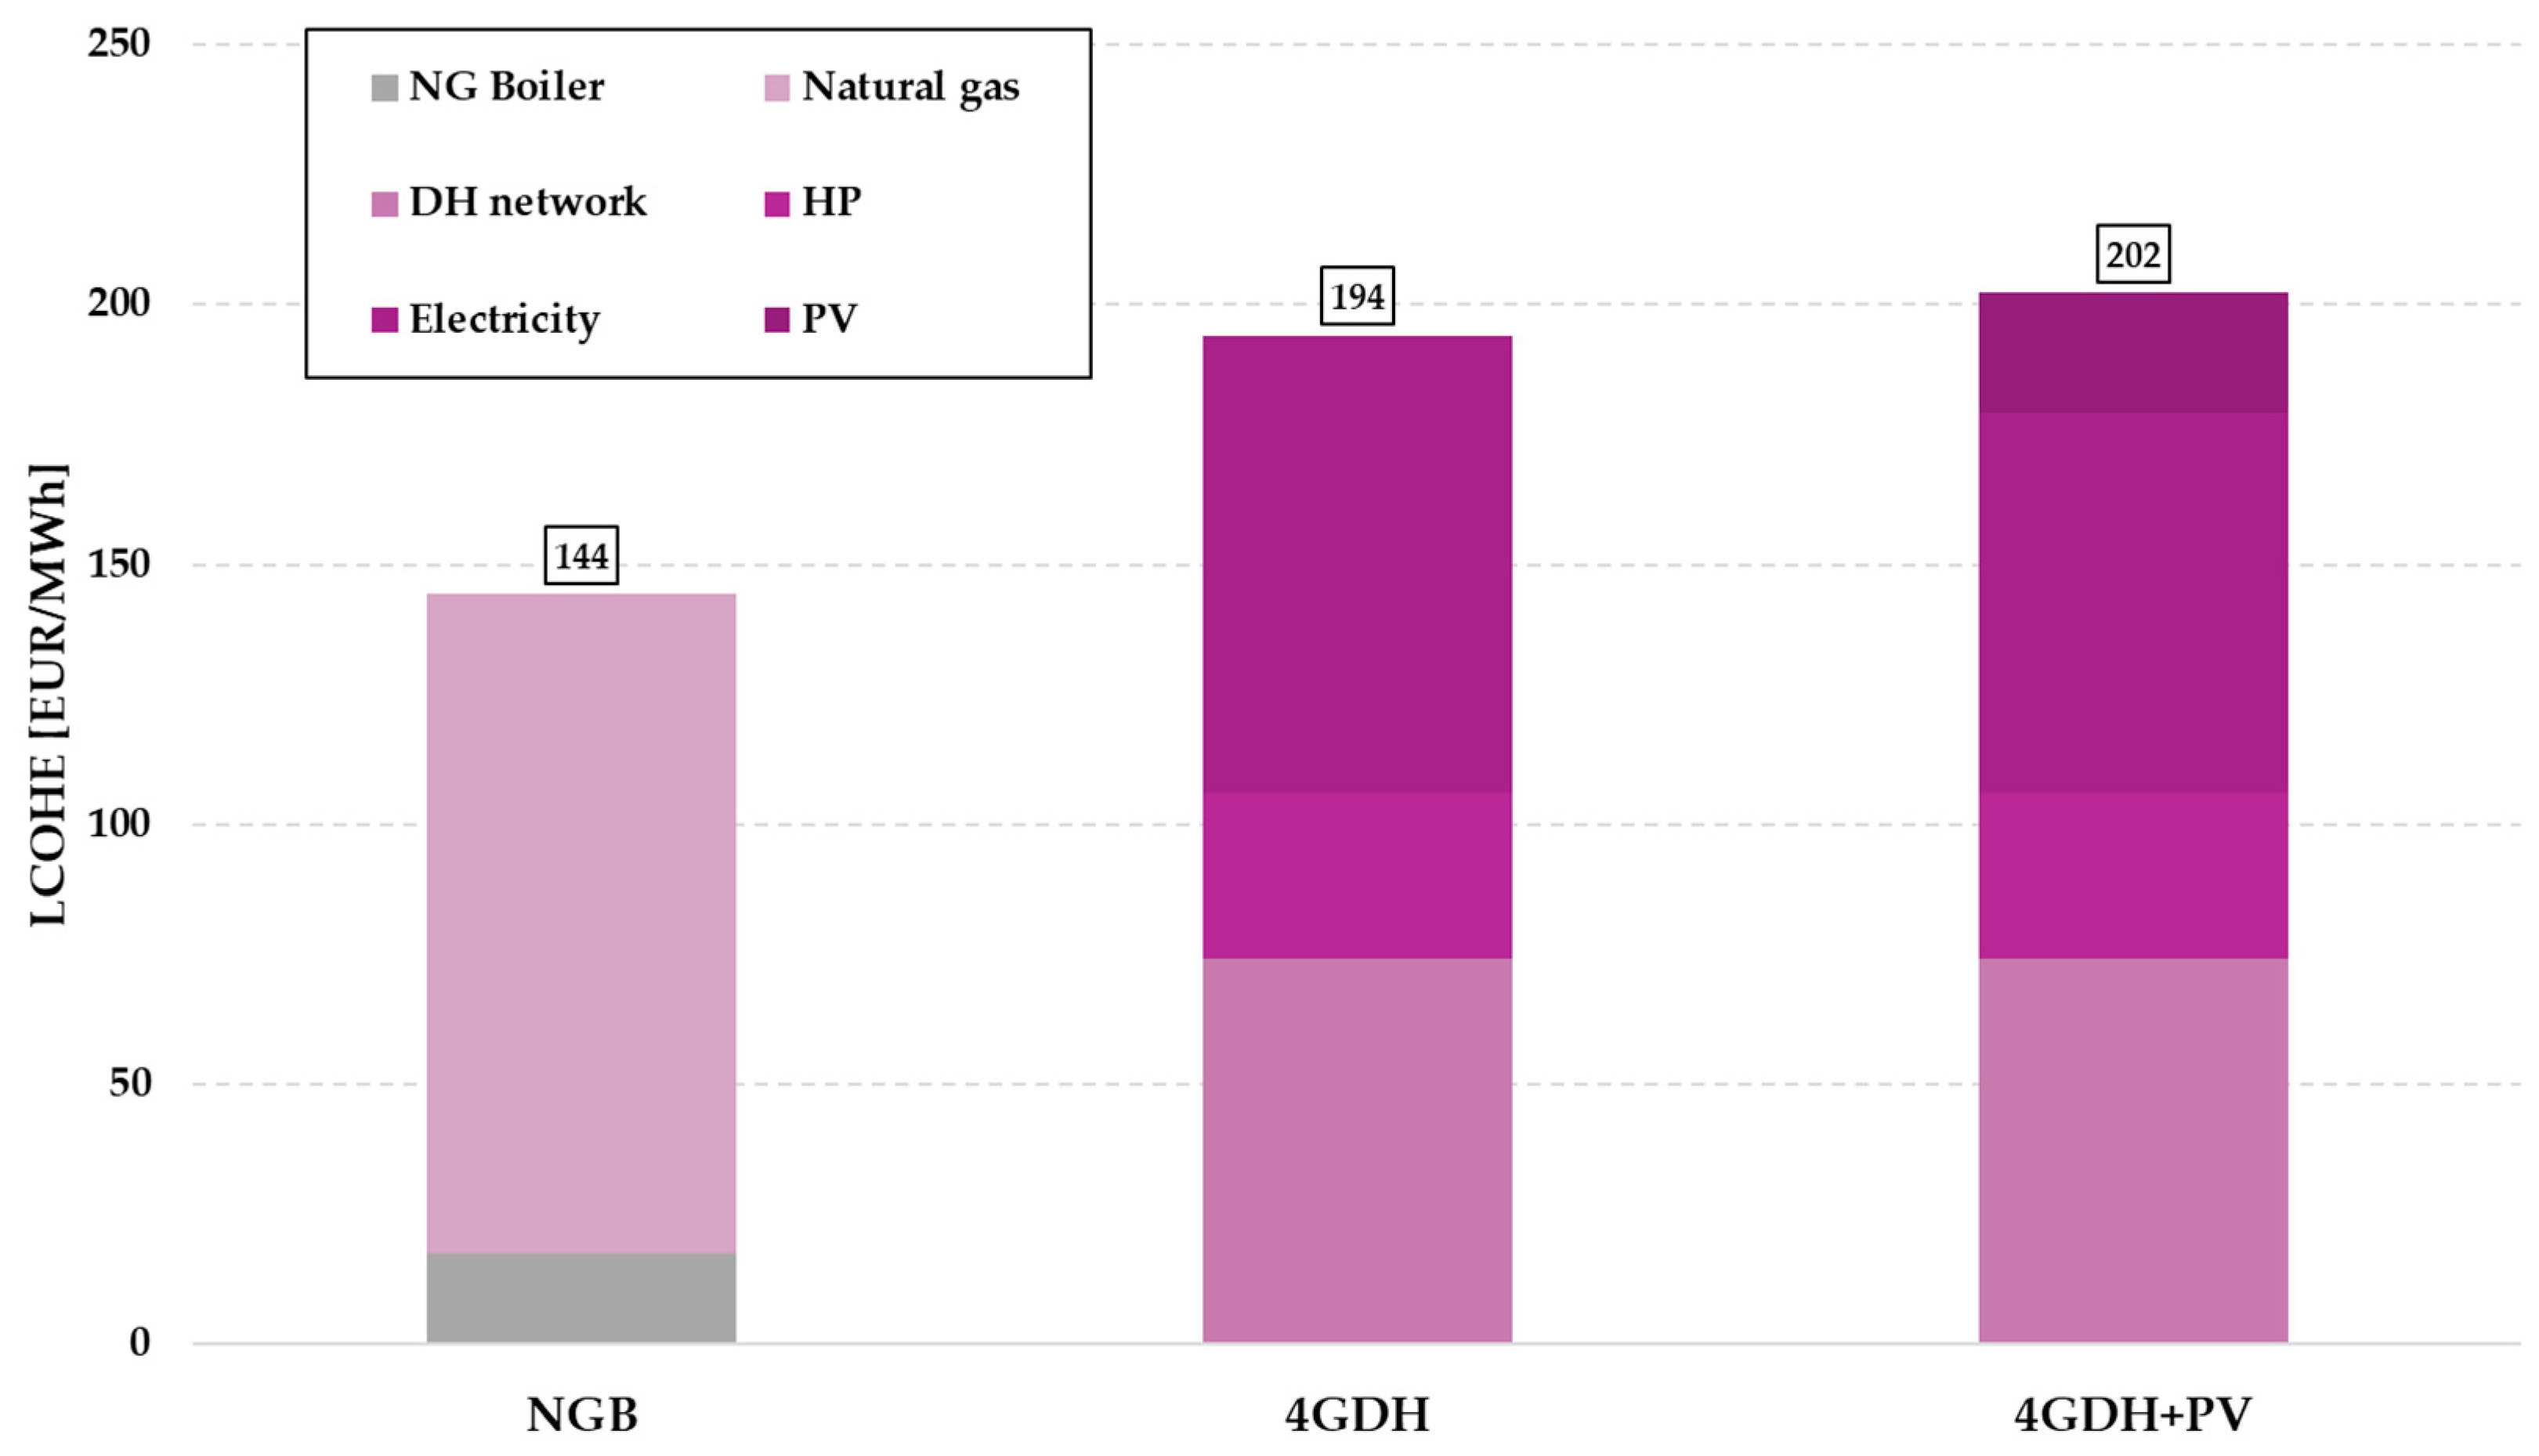
2 emissions. Referring to the LCOHE, a cost breakdown has been performed for each layout, in order to understand which component most influences the final levelized cost of heat. That result is depicted in
Figure 3. The reference scenario is characterized by the lowest LCOHE value, i.e., 144 EUR/MWh, almost entirely dependent on the purchase of natural gas.
Conversely, 4GDH-based layouts are characterised by the highest LCOHE values. In detail, for the 4GDH scenario, without PV, the LCOHE amounts to 194 EUR/MWh. The most influencing parameter is the electricity purchase, weighing 45% of the total levelized cost. The district heating network amounts to 38% of the total LCOHE, while the heat pump contributes to the remaining 17%.
Lastly, for the 4GDH and PV configuration, the final LCOHE amounts to 202 EUR/MWh, which corresponds to a 4% increase, with respect to the 4GDH layout. It is worth noticing how the cost increase associated with the distributed PV plant is almost compensated for by the cost decrease related to the electricity purchase. In detail, the latter decreases from 88 EUR/MWh to 73 EUR/MWh, corresponding to a −15 EUR/MWh cost variation. Conversely, the cost variation due to the distributed PV plant is equal to +23 EUR/MWh. As a result, the final LCOHE value for the two scenarios only differs by 8 EUR/MWh, slightly favouring the one without PV.
Referring to the environmental point of view,
Figure 4 shows the CO
2 emissions of the different scenarios, coupled with their relative LCOHE.
Evidently, the reference scenario is characterised by the highest amount of CO
2 emissions, equal to 410 tCO
2/y, resulting from natural gas utilization. Conversely, when comparing the 4GDH layout and the reference scenario, it emerges how the former allows for a 79% reduction of the CO
2 emissions, from 410 tCO
2/y to 87 tCO
2/y. The LCOHE, on the other hand, increases by 35%, from 144 EUR/MWh to 194 EUR/MWh. Lastly, the comparison between the 4GDH layout and the 4GDH and PV layout, shows that the CO
2 emissions further decrease, from 87 to 75 tCO
2/y, namely a 14% decrease. The LCOHE, instead, increases by 4%, as aforementioned. Those results demonstrate that the marginal environmental benefit from the CO
2 emissions reduction outweighs the marginal economic drawback due to the cost increase. By implementing the 4GDH-based decarbonization strategies, the CO
2 emissions decrease significantly. Notwithstanding, such environmentally virtuous operations imply incurring investment and operation and maintenance costs, related to the carbon-abating technologies. The required cost for preventing the emission of a ton of CO
2 in the atmosphere, is defined as the carbon avoidance cost. This, coupled with the CO
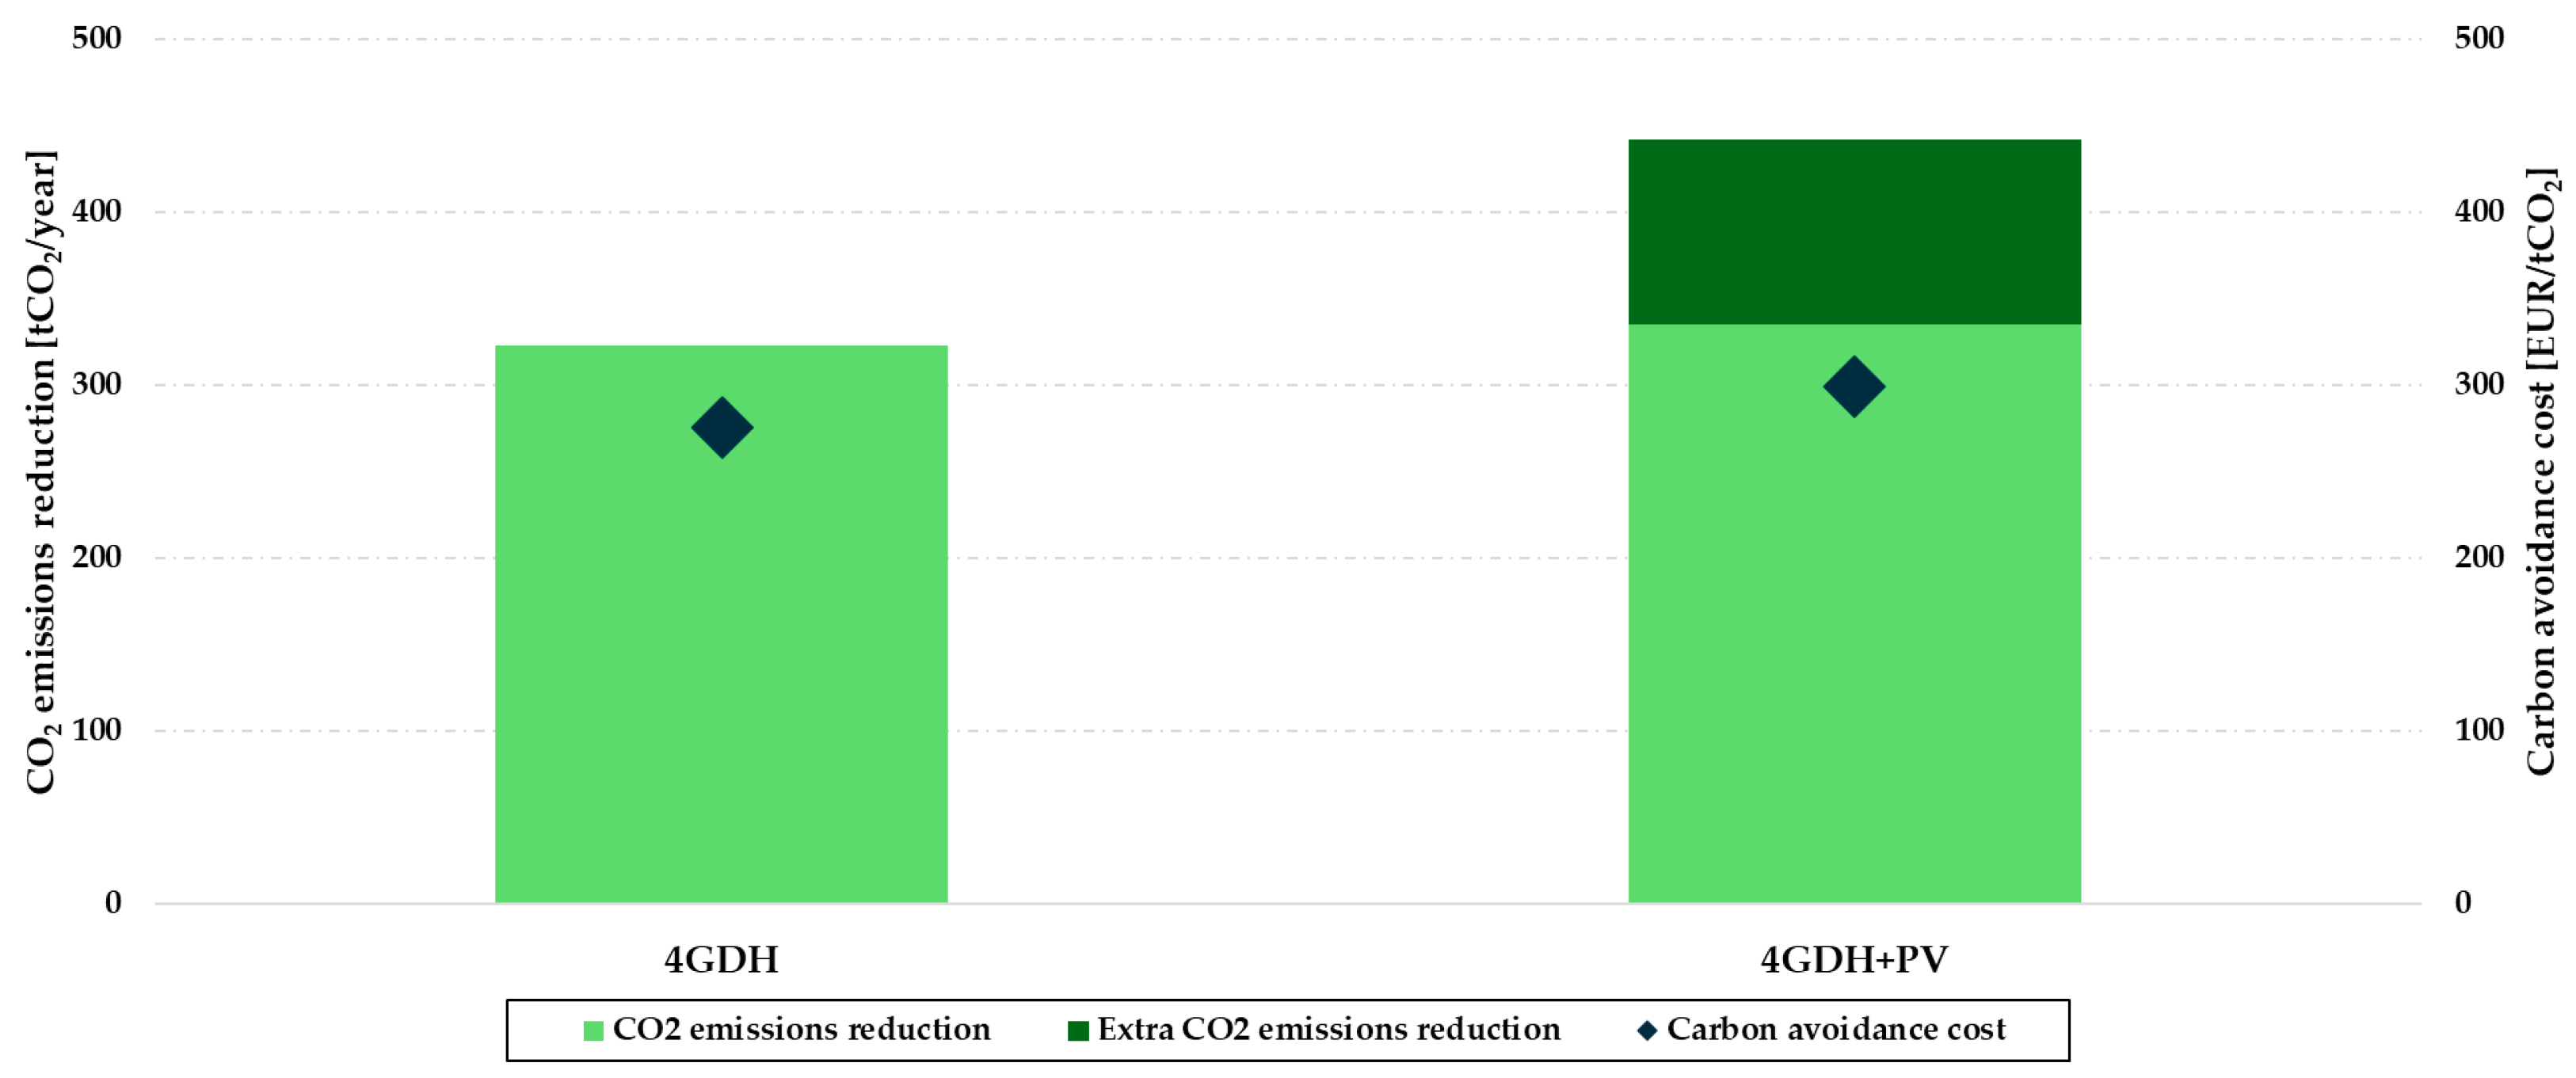
2 emissions reduction and related to each technical layout, is depicted in
Figure 5.
The 4GDH-based layouts allow for a reduction of the CO2 emissions of over 300 tCO2/y. Specifically, in the 4GDH scenario, 322 tCO2/y are avoided. By adding the PV, the CO2 emissions further decrease, from 322 tCO2/y to 335 tCO2/y avoided. Additionally, referring to the carbon avoidance cost, the 4GDH layout obtains a CAC value equal to 275 EUR/ton CO2. The distributed PV plant installation, while boosting the carbon dioxide emissions reduction, also increases the overall CAPEX and OPEX of the energy system. As a result, the CAC increases to 299 EUR/ton CO2, namely 8% more.
Obviously, the PV plants’ decarbonization effect is not limited to the domestic heating need. Indeed,
Figure 5 also depicts the additional CO
2 emissions reduction, due to the decarbonization of the other energy demands, i.e., electricity for lighting, electromotive force, and cooling. In detail, the distributed PV plant allows for reducing the CO
2 emissions by 107 extra tons per year. As a result, the total amount of CO
2 emissions reduction for the 4GDH and PV scenario amounts to 442 tCO
2/y.
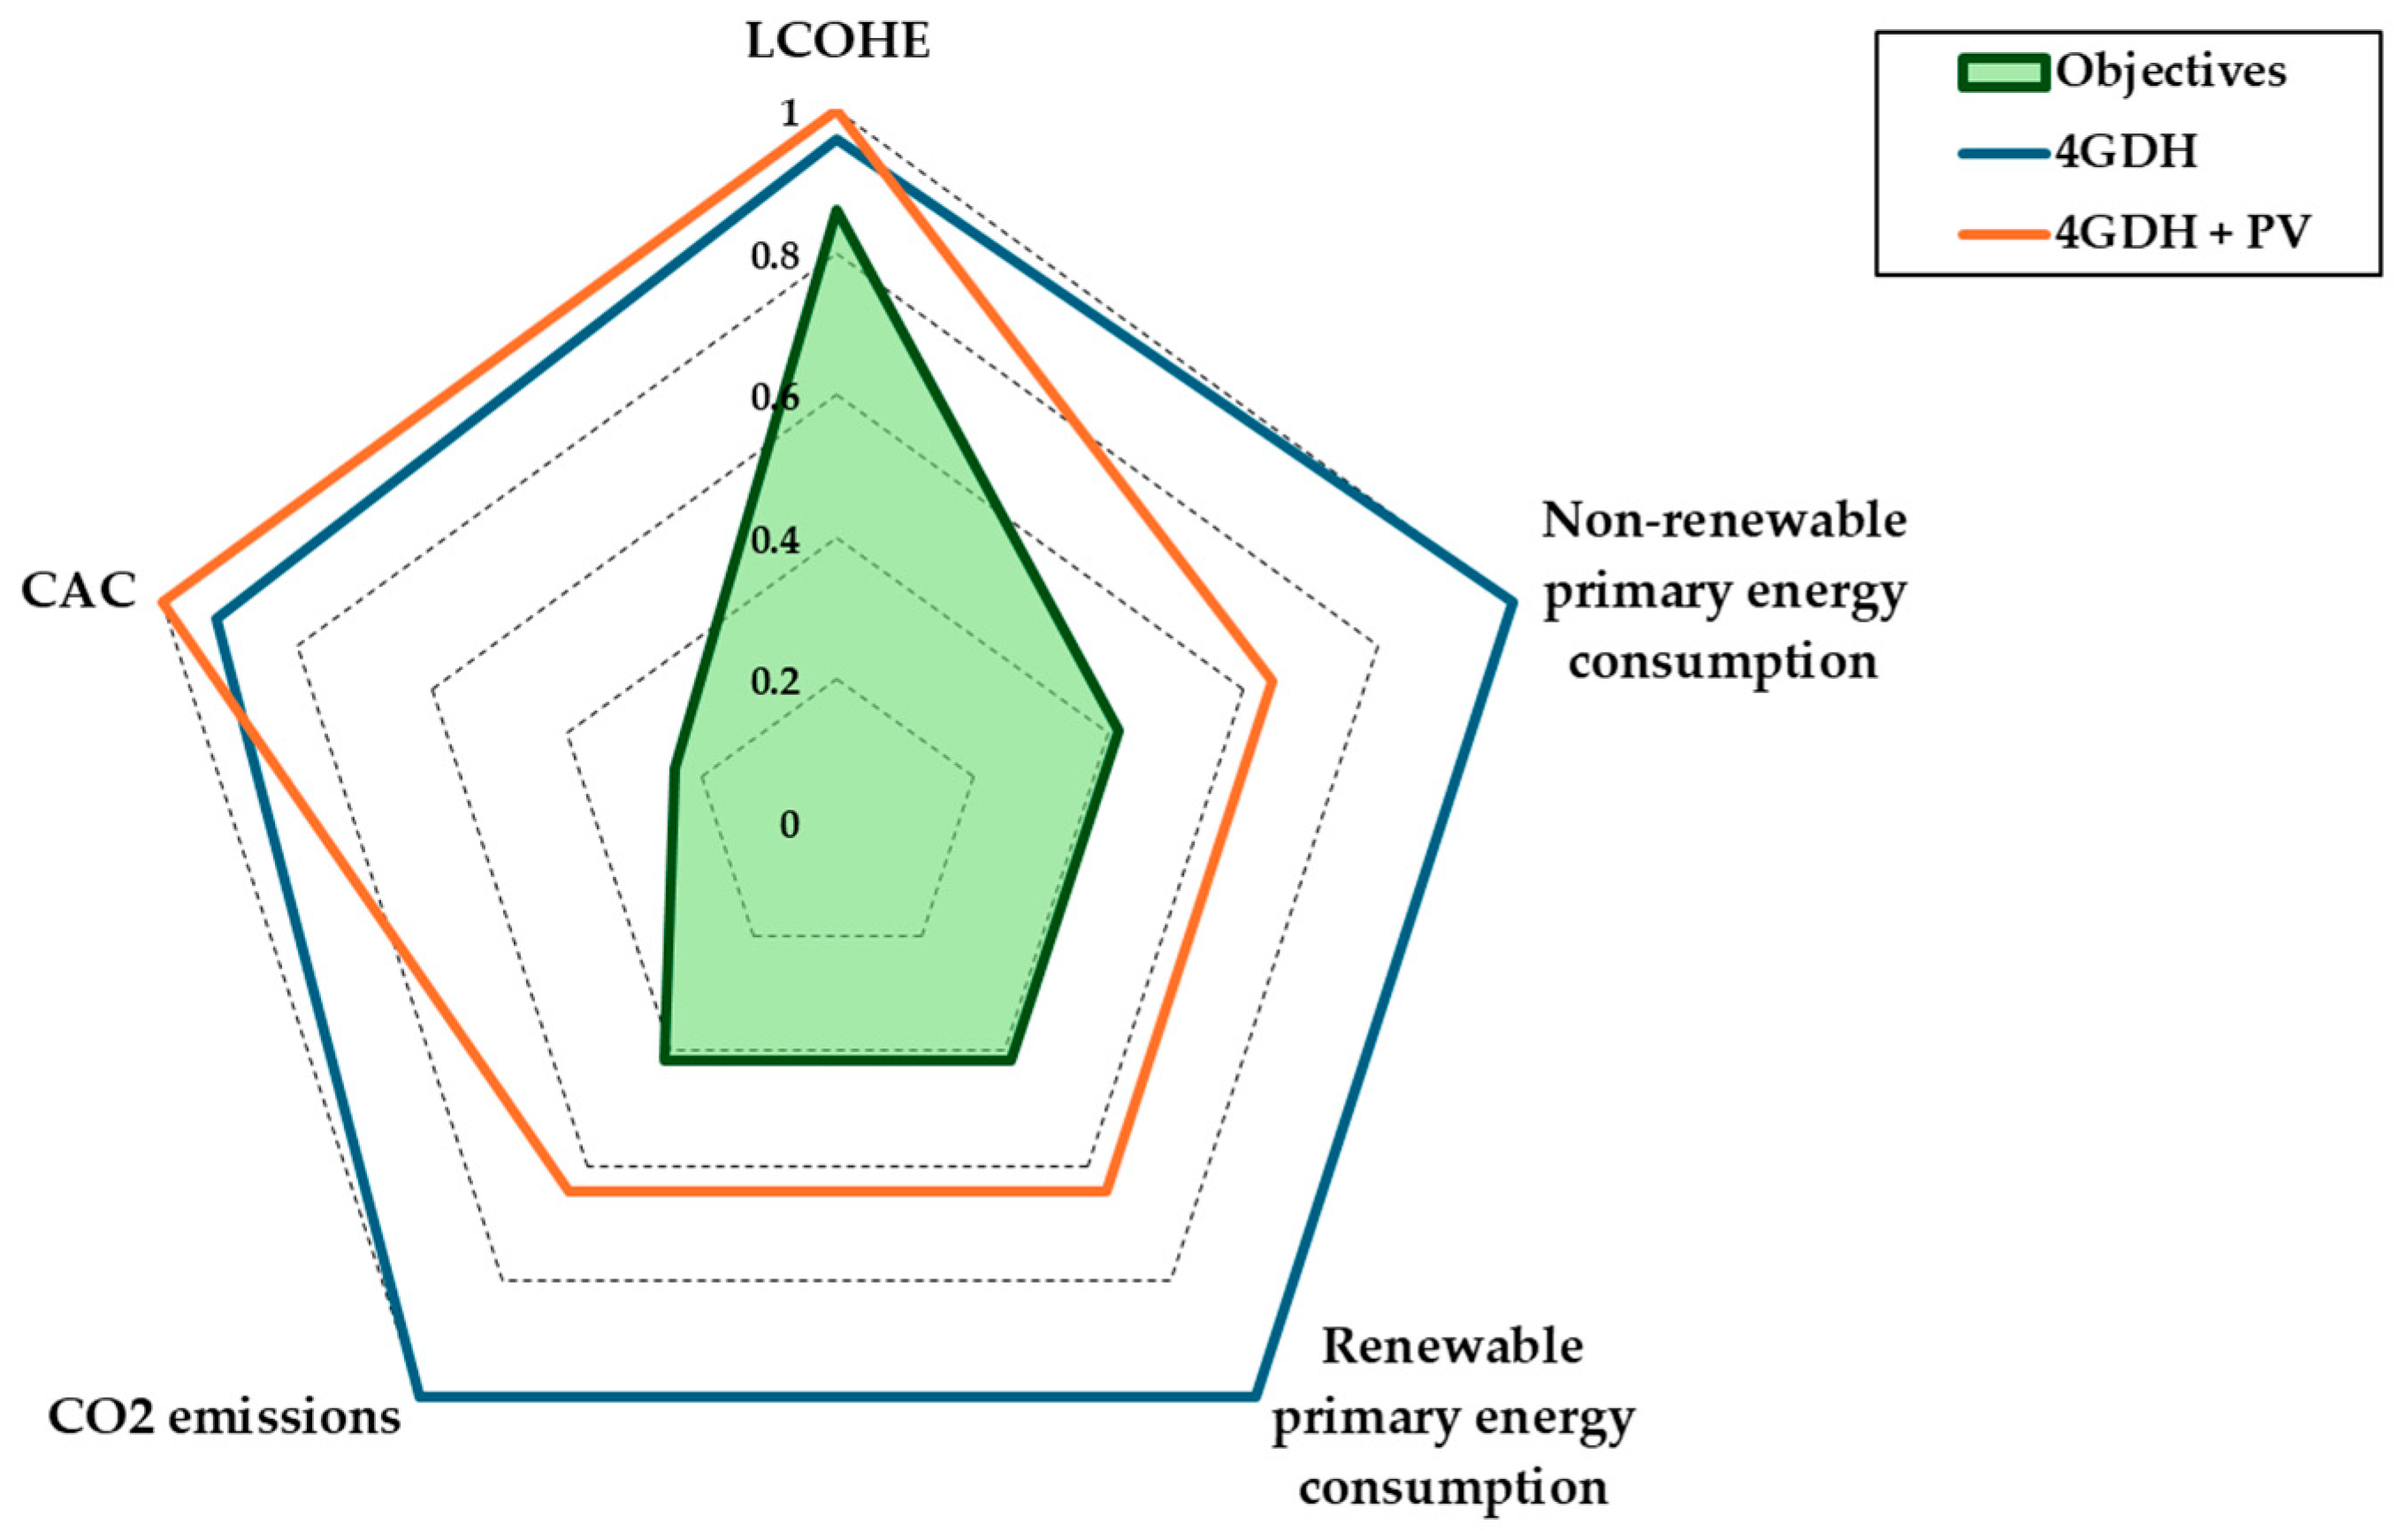
In order to display a clear overview of the techno-economic performance of the 4GDH-based layouts, a radar graph is depicted in
Figure 6. This shows the main evaluation metrics, normalized with respect to the maximum relative value, as well as the objectives, normalized in the same manner, for both the energy-efficient layouts. Referring to the objectives, the non-renewable primary energy consumption and the renewable primary energy consumption for equivalent-surface NZEBs (nearly zero energy building) have been considered (i.e., 10 kWh/m
2 year for domestic heating [
50]), while for the CAC, the time-averaged EU carbon permit value for the February 2024–February 2025 period has been considered [
51]. The concept of nearly zero energy buildings was introduced by the Energy Performance of Buildings Directive EU/31/2010 [
52] which mandates all new buildings to have a high energy performance and very low energy needs, largely covered by RESs.
Figure 6 shows that the levelized cost of heat and the carbon avoidance cost for the 4GDH and PV configuration are the highest, as they are characterized by a unit value. The same can be said for both the renewable and non-renewable primary energy consumption, as well as for the CO
2 emissions, related to the 4GDH only scenario. Indeed, the latter performs slightly better than its PV-driven counterpart, in terms of LCOHE and CAC, namely 0.96 and 0.92, respectively. The addition of the distributed PV plant, on the other hand, causes a greater performance in terms of renewable and non-renewable primary energy consumption, and CO
2 emissions, i.e., 0.64. For those three metrics, the objective value from calculation results is equal to 0.42. This result demonstrates how the implementation of the PV plant has a significant positive impact on the 4GDH and PV environmental performance. It is noteworthy that the environmentally beneficial effect of the photovoltaic plant on the other electric needs of the building cluster has not been accounted for; hence, this result can be interpreted as cautionary.
Additionally, the target values for the LCOHE and the CAC are equal to 0.86 and 0.24, respectively. For the former parameter, both the 4GDH-based technical options obtain values that are close to the objective one. For the latter, on the other hand, the objective value is quite challenging; hence, the layout’s performance is far from the objective one.
Sensitivity Analysis
In order to assess the functional dependence of the energy vectors’ price on the different layouts’ levelized cost of heat, a sensitivity analysis has been carried out. The results of this calculation are presented and discussed in this section.
Focusing on the 4GDH-based scenarios, it is worth noticing how the final LCOHE is strongly dependent on the electricity consumption. This, however, is the cornerstone for warding off the domestic heating energy demand from fossil fuels. Consequently, the impact of the electricity price reduction on the final LCOHE has been assessed to identify the price parity with the reference scenario, given by the geometric intersection (see
Figure 7).
Starting from a reference electricity price of 229 EUR/MWh, this is reduced up to 90%, namely 29 EUR/MWh, in order to identify potential geometric intersections between the 4GDH-based scenarios and the reference one. In detail, both of the energy-efficient technical solutions are characterised by an electricity price value which enables their price parity with the reference scenario. Specifically, for the 4GDH scenario, the electricity price must be reduced to 47 EUR/MWh in order to obtain the price parity. For the PV-driven 4GDH, on the other hand, the cross-over electricity price increases by 110%, namely 99 EUR/MWh. That price-parity difference between the 4GDH-based layouts is owed to the increased investment costs, characterising the PV-driven scenario. However, by analysing the trends in
Figure 7, it emerges how the LCOHE difference between the 4GDH scenarios decreases as the electricity price increases. Indeed, this result provides insights regarding the layout’s sensitivity to the electricity price. Specifically, the PV plant integration decreases the scenario’s susceptibility to energy market trends, in perfect accordance with the energy independence concept.
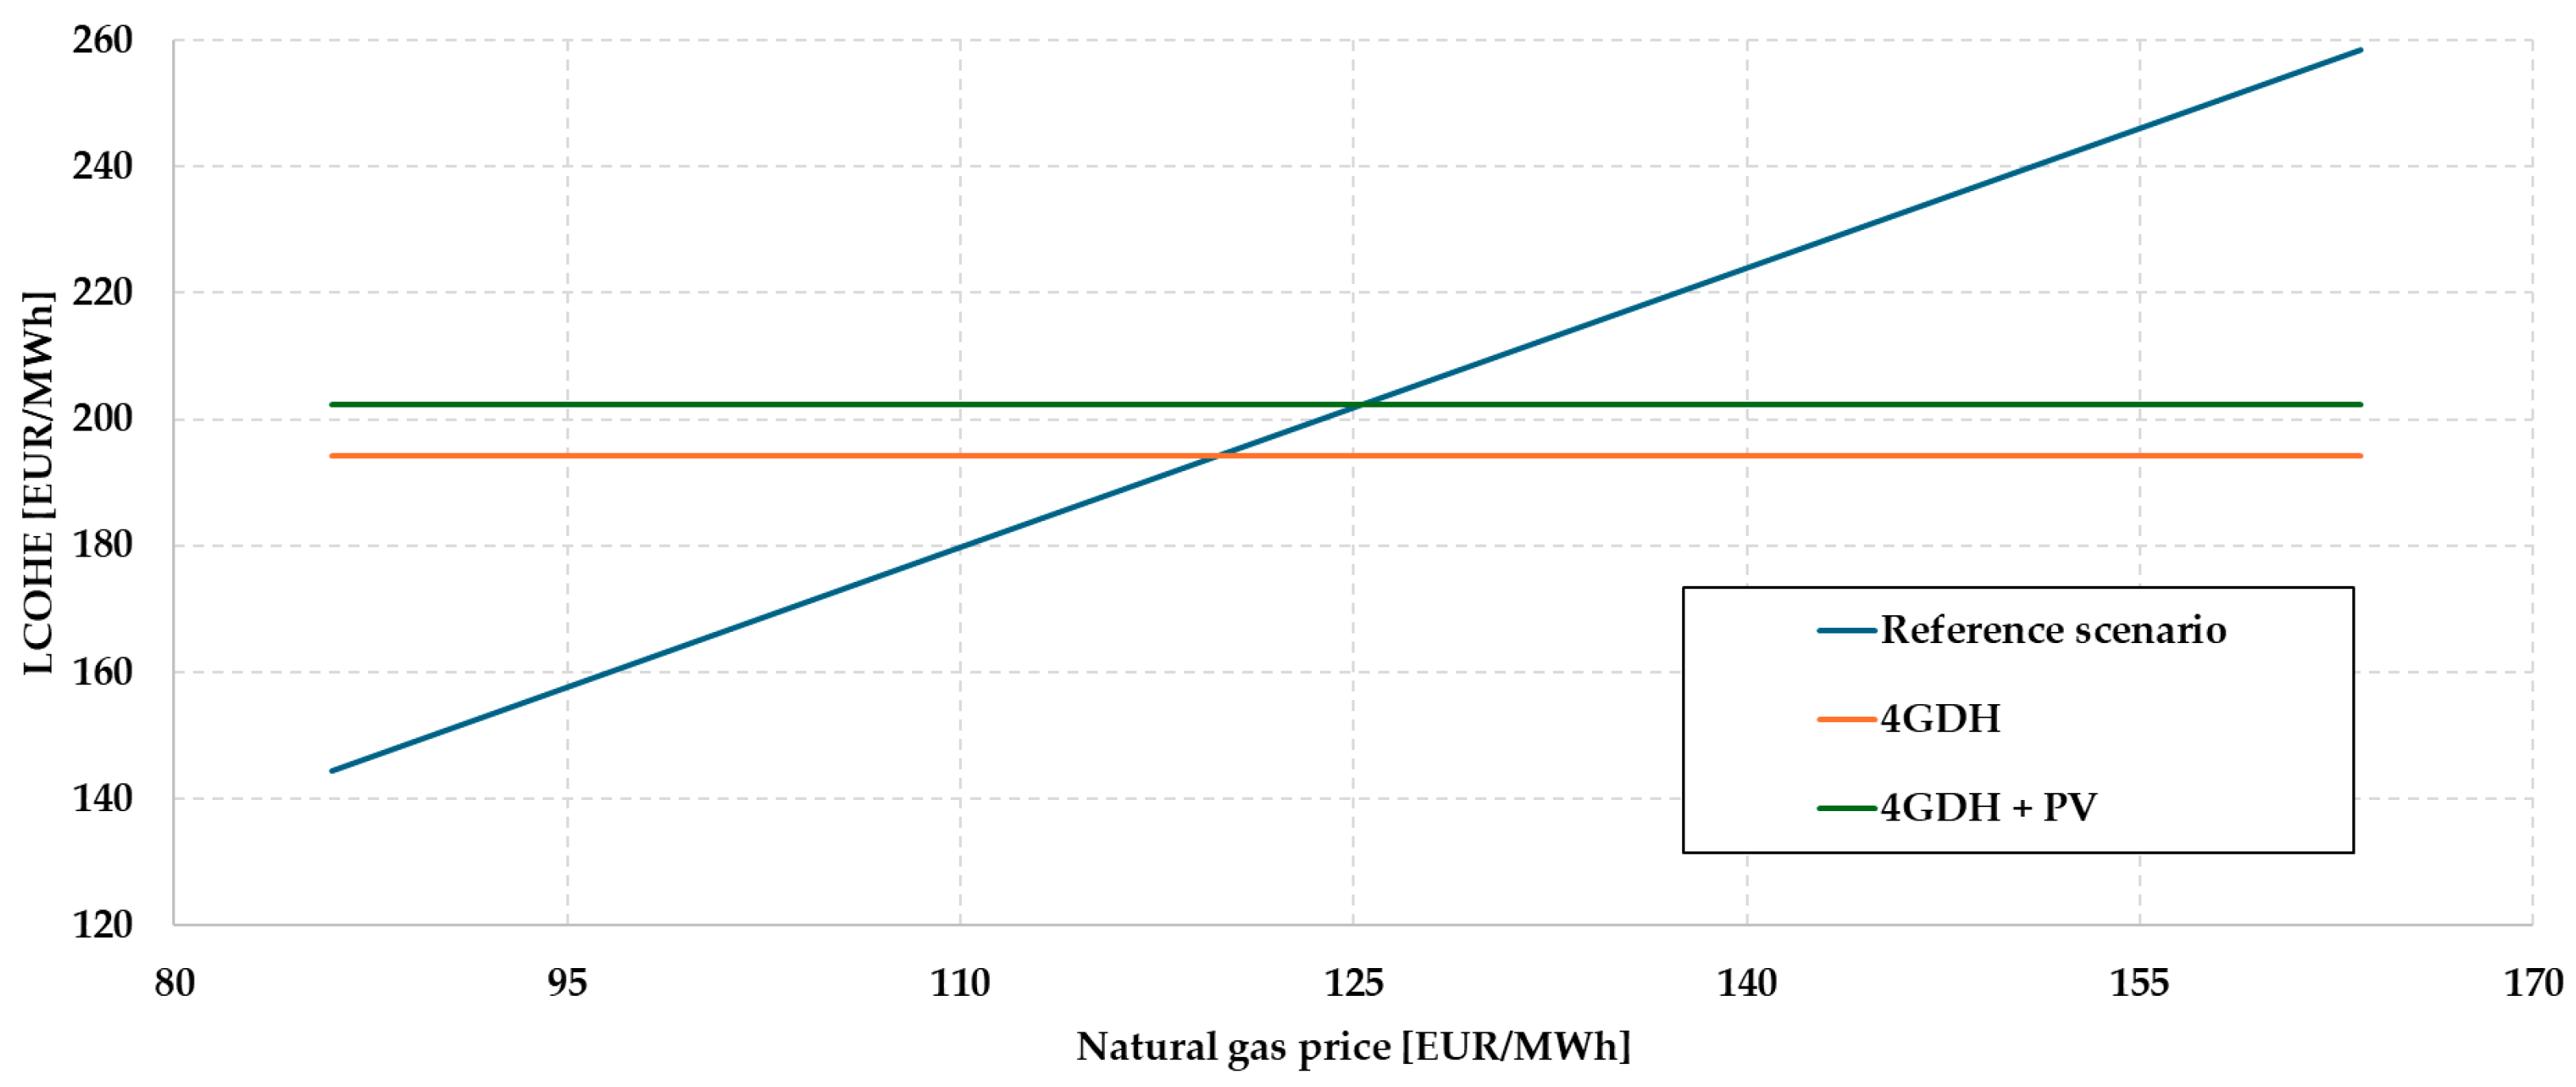
The same methodology for obtaining the price parity between the reference scenario and 4GDH-based layouts has been applied, related to the natural gas price. The results of that procedure are depicted in
Figure 8. Referring to the 4GDH scenario, the cross-over can be pinpointed for a natural gas price equal to 120 EUR/MWh. The distributed PV plant integration, on the other hand, causes an increase in the natural gas price for the two scenarios’ economic parity. Indeed, the threshold value below which the 4GDH and PV layout is economically advantageous, with respect to the reference one, is equal to 125 EUR/MWh.
In order to provide a comprehensive overview of the 4GDH-based LCOHE variation as a function of the main techno-economic parameters, a double spider-graph is depicted in
Figure 9. This shows the LCOHE trend for the two energy-efficient layouts, with respect to the natural gas price, the electricity price, and the HP’s CAPEX. In detail,
Figure 9a focuses on the 4GDH configuration without PV, while
Figure 9b, depicts the PV-driven 4GDH scheme. Referring to the former, a
50% variation in the electricity price results in a
23% variation in the LCOHE. In that case, a 50% reduction of the electricity price causes the levelized cost to decrease from 194 EUR/MWh to 150 EUR/MWh. Symmetrically, the LCOHE increase from its reference value to 238 EUR/MWh, when increasing the electricity price by 50%. Moreover, analysing the HPs’ CAPEX impact on the LCOHE, it becomes apparent how it is less significant with respect to the electricity price. Indeed,
50% variation in the electricity price results in a
8% variation in the LCOHE.
In detail, a 50% reduction of the HP’s CAPEX results in the levelized cost decreasing from 194 EUR/MWh to 178 EUR/MWh. On the other hand, a 50% increase in the HP’s CAPEX causes the LCOHE to increase from its reference value to 210 EUR/MWh.
Referring to the PV-driven 4GDH layout (see
Figure 9b), it arises that electricity price variations have less impact on the LCOHE compared to its counterpart without PV. The same considerations can be made regarding the LCOHE variation with respect to the HP’s CAPEX, when comparing the two plant schemes. Specifically, in varying the electricity price by
50%, the LCOHE undergoes a
18% variation. Thereafter, a 50% reduction of the electricity price causes the levelized cost to decrease from 202 EUR/MWh to 165 EUR/MWh. Likewise, when increasing the electricity price by 50%, the LCOHE increases from its reference value to 238 EUR/MWh. Referring to the heat pump’s CAPEX, the levelized cost varies between 186 EUR/MWh and 218 EUR/MWh, namely an
8% difference compared to the reference value, corresponding to a −50% and +50% investment cost variation, respectively.
The spider graphs reported in
Figure 9 represent a powerful tool for assessing the effect of the combined variation of different parameters on the metric of interest. In this case, they can be used for obtaining the threshold limits for calculating the price parity of the 4GDH-based configurations relative to the reference scenario. In detail, referring to the layout without PV, a combined 50% reduction on both the electricity price and the HP’s CAPEX results in a final LCOHE equal to 134 EUR/MWh. As regards the 4GDH and PV layout, on the other hand, a final levelized cost of heat equal to 150 EUR/MWh can be obtained, with the same variation range. Referring to the 4GDH scheme, the district heating network is the most capitally intensive subsystem. Hence, considerations regarding its CAPEX variation are necessary for a comprehensive LCOHE assessment. Indeed, by lowering both the DH CAPEX and the electricity price by 50%, the final LCOHE amounts to 113 EUR/MWh. Consequently, those conditions reflect an economical advantage with respect to the traditional system, exhibited by a 13% savings on the final LCOHE. Concerning the PV-driven 4GDH layout, under the same cost reduction assumptions, the levelized cost is equal to 129 EUR/MWh.
That result highlights how a 50% reduction of both the DH network’s CAPEX and the electricity price are required to accomplish the price parity between the high-RES-share technical layout and the fossil fuel-based one.
In the end, in order to provide a comprehensive insight into the integration of renewable energy sources with district heating networks, a comparative analysis of the results obtained in this work with the existing literature (see
Table 4) is presented.
The levelized cost of heat (LCOHE) calculated in this work for the 4GDH configuration powered by a centralized air-source HP is equal to 194 EUR/MWh. When that layout is coupled with a 500 kWp distributed PV system, the LCOHE increases to 202 EUR/MWh. These values are consistent with those reported in the literature, and in some cases even favourable, although differences in boundary conditions, building typology, and network scale must be taken into account.
In detail, A. Degelin et al. [
35] focused on geothermal heat pump-based DH systems. Their LCOHE results, for non-refurbished buildings, range from 213 EUR/MWh (75 °C supply, no booster) to 362 EUR/MWh (55 °C with electric heater). Additionally, owing to the higher costs of refurbished buildings, the LCOHE for such scenarios increases up to 407 EUR/MWh when employing low-temperature loops and boosters, primarily due to increased system complexity. Compared to these values, this work demonstrates a significantly lower cost for a system serving non-refurbished buildings, indicating that air-source HP-powered DH networks combined with moderate operating temperatures (≈55 °C) can enhance cost-effectiveness.
O. Angelidis et al. [
53] report an LCOHE of approximately 152 EUR/MWh for a real network based on an air-source heat pump, while their fictional network scenario is characterised by an uncompetitive 596 EUR/MWh. The 194 EUR/MWh LCOHE value result obtained in this paper falls between those two extremes, reflecting a realistic trade-off between idealized modelling and real-world implementation constraints, including distribution losses, temperature penalties, and system operation under time-varying conditions.
Additionally, L. Menin et al. [
54] estimate an LCOHE equal to 253.9 EUR/MWh for a district heating network powered by a centralized biomass CHP plant. The lower cost observed in this work suggests that centralized air-source HPs coupled with low-temperature DH networks may represent a more economically viable solution, even with PV integration, particularly in urban areas with limited access to biomass resources.
Lastly, Zhikun Wang [
55] shows how, in HP-based district heating, the cluster’s size influences the LCOHE. Indeed, this decreases from 140 EUR/MWh, referring to small networks (less than 100 dwellings), to approximately 133 EUR/MWh, for networks serving more than 500 dwellings. Despite the LCOHE value calculated in this work, i.e., 194 EUR/MWh, for a 200-dwelling cluster is higher; this difference can be attributed to the assumptions regarding the HP’s efficiency, the technology’s lifetime, and the interest rate. Notwithstanding, the sensitivity analysis conducted in this work shows how the price parity with fossil-fuel-based systems can be reached under combined reductions in electricity price and technology investment costs, thereby aligning with the favourable trends reported by Wang.
In summary, the present study not only aligns with the upper-mid range of cost values reported in the literature but also fills a critical gap by explicitly assessing the dynamic impact of outdoor temperature on system performance, the integration of distributed PV, and the techno-economic conditions required for achieving competitiveness with conventional heating systems. These contributions are essential for guiding future research and policy on the deployment of low-carbon, cost-effective 4GDH systems across different urban contexts.
4. Conclusions
This study investigates a sustainable pathway for decarbonizing the district-scale residential space heating demand in Rome, Italy, by evaluating the integration of fourth-generation district heating networks with renewable energy sources. A comprehensive techno-economic and environmental comparison has been performed on three different configurations: a reference scenario based on individual natural gas boilers, a 4GDH network powered by a centralized air-to-water heat pump, and a 4GDH system coupled with a distributed PV plant. A semi-dynamic MATLAB/Simulink (version R2023a) model has been developed to simulate hourly heating demand profiles and outdoor environmental conditions, enabling both the accurate sizing of system components and their dynamic performance assessment.
Each configuration’s performance has been summarized by means of three KPIs: the levelized cost of heat (LCOHE), annual CO2 emissions, and carbon avoidance cost (CAC).
The results show that the 4GDH layout can reduce CO2 emissions by approximately 79% compared to the baseline scenario (87 tCO2/year vs. 410 tCO2/year). However, this environmental benefit entails a higher LCOHE (194 EUR/MWh vs. 144 EUR/MWh). The addition of a 500 kWp distributed PV system, sized based on the building’s rooftop surface availability and simulated with PVGIS data, further reduces the cluster’s reliance on non-renewable primary energy. Nonetheless, the PV plant integration leads to a modest increase in both the LCOHE (+4%) and CAC (+9%) due to the added capital and operational costs.
A detailed sensitivity analysis has been conducted to investigate how fluctuations in key economic parameters, namely the electricity and gas prices and the HP’s and DH’s investment cost influence the cost-effectiveness of the proposed layouts. In detail, referring to the 4GDH layout, the findings reveal that a combined 50% reduction in both electricity price and HP investment cost results in the LCOHE being equal to 134 EUR/MWh, making the scenario cost-effective with respect to the baseline one. For the 4GDH and PV plant scenario, on the other hand, such a combined reduction is not sufficient for the configuration’s cost-effectiveness. The LCOHE, in fact, results in 150 EUR/MWh. Indeed, for the PV-driven 4GDH scenario to be economically advantageous with respect to the fossil-fuel based solution, a simultaneous 50% reduction in electricity and DH network capital costs is required. By applying such a cost reduction, the final LCOHE of that scenario is equal to 129 EUR/MWh.
In summary, this work shows how the integration of detailed time-dependent modelling with rigorous economic sensitivity assessments, can bridge a critical gap in the existing literature, which has largely overlooked the combined impact of renewable integration and dynamic pricing conditions on the viability of district-scale 4GDH networks. Moreover, it provides actionable insights for implementing low-temperature district heating systems coupled with PV systems as a district-scale, sustainable alternative to fossil-based solutions.
The methodology and findings are particularly relevant for countries like Italy, where renewable energy communities and decentralized energy systems are gaining increasing policy attention.
Lastly, future developments of this work could include a comparative analysis between the proposed 4GDH-based layouts and alternative ones based on a lower-operating temperature DH network coupled with decentralized high-temperature heat pumps (HTHPs). In such configurations, the primary loop would serve as a distributed cold heat sink, enabling localized heat extraction by building-level HTHPs. Such an approach holds promise for further reducing thermal losses along the distribution network and minimizing supply temperature requirements, consequently increasing overall system efficiency.
Moreover, that investigation would be aimed at assessing the techno-economic feasibility of those alternative layouts, especially in relation to their potential to avoid deep retrofitting interventions on existing buildings, by enabling heat delivery at a conventional radiator temperature, 65 °C and above. Indeed, a thorough comparison in terms of the levelized cost of heat, CO2 emissions, and carbon avoidance cost, would provide valuable insights into the selection of the most cost-effective and environmentally friendly DH-based strategy for district-scale space heating decarbonization.


