Article

From Control to Incentive: How Market-Driven Environmental Regulation Shapes ESG Performance in Manufacturing Industries

1
School of Public Finance and Administration, Harbin University of Commerce, Harbin 150028, China
2
School of Finance, Harbin University of Commerce, Harbin 150028, China
*
Author to whom correspondence should be addressed.
Sustainability 2025, 17(23), 10516; https://doi.org/10.3390/su172310516
Submission received: 10 October 2025 / Revised: 17 November 2025 / Accepted: 20 November 2025 / Published: 24 November 2025

Abstract

Market-based environmental regulation plays a crucial role in aligning industrial development with sustainability goals. Taking the implementation of China’s Environmental Protection Tax (EPT) in 2018 as a quasi-natural experiment, this study employs a difference-in-differences framework using an unbalanced panel of 2677 manufacturing firms from 2010 to 2022 to identify the causal effect of the EPT on corporate ESG performance (MFESG). The findings reveal that the implementation of market-based environmental regulation significantly elevates the ESG performance of manufacturing firms. This positive influence is realized not only directly but also indirectly through improved financing accessibility and innovation capacity. Moreover, the enhancement effect is uneven across firms: non-state-owned enterprises, firms unaudited by the Big Four, and those situated in China’s eastern regions exhibit stronger ESG responses. Across the three ESG pillars, the environmental and social dimensions benefit most from the EPT, suggesting that market mechanisms can be effective catalysts for sustainable industrial upgrading.

1. Introduction

As a cornerstone of China’s economic framework, the manufacturing industry occupies a pivotal role in driving national prosperity, acting as a major catalyst for GDP growth, employment expansion, and technological progress [1]. However, its long-standing dependence on energy-intensive production processes and heavy resource consumption has made it one of the primary contributors to environmental degradation [2]. The continuous release of industrial pollutants—including waste gases, wastewater, and solid residues—has inflicted substantial ecological harm, threatened public health, and hindered the realization of sustainable development objectives. In response to these challenges, recent high-level policy meetings, such as the Third Plenary Session of the 20th Central Committee and the Central Economic Work Conference, have explicitly reaffirmed the strategic importance of building an ecological civilization and fostering green transformation. These national agendas emphasize the improvement of environmental governance mechanisms, the promotion of low-carbon technological innovation, and the establishment of a robust green financial system. Guided by these principles, the Chinese government has intensified policy initiatives to accelerate the green transition of manufacturing enterprises, thereby heightening public awareness of corporate environmental and social accountability. Amid this policy evolution, the ESG framework has been introduced as a crucial measure for evaluating firms’ sustainable development capacity. Superior ESG performance not only contributes to pollution reduction but also strengthens social responsibility, enhances governance transparency, and harmonizes economic efficiency with social value creation [3]. Specifically, the environmental component urges firms to implement pollution control and resource conservation measures; the social component encourages attention to employee welfare and community development; and the governance component emphasizes improved decision-making quality and managerial accountability. Strengthening MFESG has therefore emerged as a key national priority—consistent with the green development vision articulated in the 14th Five-Year Plan and aligned with global sustainability trends—bearing substantial strategic and practical significance.
Existing research on the MFESG remains relatively limited, motivating this study to investigate the determinants that shape corporate ESG outcomes. Although a considerable body of scholarship has examined the drivers of ESG performance, prior studies can generally be grouped into three dimensions: internal, external, and institutional factors. Internal factors originate within the firm and represent the endogenous forces that promote transformation and sustainability-oriented decision-making. These elements enhance ESG performance primarily by optimizing organizational structures, resource deployment, and strategic behavior. Empirical evidence has highlighted several key internal drivers, including regional digitalization [4], supply chain resilience [5], and corporate cultural orientation [6]. In contrast, external factors arise from the firm’s operating environment and function as exogenous pressures or incentives that compel corporate responses to shifting market or societal expectations. Such factors may stimulate ESG improvement by reshaping risk perceptions and strategic adaptation mechanisms. Typical examples include macroeconomic uncertainty [7], geopolitical tensions [8], media scrutiny [9], investor sentiment [10], and the expansion of financial technology [11].
Institutional factors differ from internal and external drivers, referring to formal policy instruments and regulatory systems established by the government to guide corporate sustainability practices. Such mechanisms carry both restrictive and enabling functions: on the one hand, they constrain environmentally harmful production behaviors, and on the other hand, they provide necessary resources to support green transformation. For example, local green finance initiatives [12] and green credit policies [13] impose emission constraints through market-based environmental regulations while encouraging the adoption of cleaner production technologies. Furthermore, the environmental governance model in China is shifting from traditional command-and-control regulation toward a collaborative and incentive-based governance framework involving multiple actors, including government agencies, enterprises, and social organizations. Existing research suggests that achieving net-zero emission goals requires dynamic strategic interactions among these stakeholders, and that building an organically coordinated governance framework can generate sustained incentives for environmental improvement [14]. This perspective provides an important theoretical foundation for examining how market-based environmental regulation, such as the Environmental Protection Tax (EPT), influences corporate ESG performance. At the same time, administrative environmental instruments—such as environmental courts and enforcement mechanisms—play a crucial role by offering direct legal oversight and accountability. Compared with firm-level and market-driven factors, institutional factors exhibit greater systematic influence and coercive authority. Their significance lies not only in compelling enterprises to undertake green transition, but also in establishing the policy and financial infrastructure necessary for long-term sustainable development. Building on this foundation, the present study focuses on how market-based environmental regulation—particularly the EPT—affects the ESG performance of manufacturing firms. By conducting empirical analysis, the study advances understanding of how regulatory mechanisms shape ESG outcomes and provides policy-oriented insights for promoting sustainable industrial development.
The promulgation of the Environmental Protection Tax Law in 2018 represented a landmark moment in China’s transition toward the legalization and institutionalization of environmental governance. Prior to this reform, the nation had relied on a pollution discharge fee system. The introduction of the EPT fundamentally transformed the regulatory framework in two critical ways. First, it established a stronger and more enforceable mechanism for pollution control, thereby exerting a greater deterrent effect on firms with excessive emissions. Second, the tax introduced higher levy rates, significantly enhancing the economic incentives for pollution reduction. The law provides explicit stipulations regarding taxable pollutants and applicable rates, covering major categories such as wastewater, airborne contaminants, industrial noise, and solid waste—all of which constitute the dominant pollution sources in the manufacturing sector.
Given these characteristics, the EPT offers a unique policy context for assessing the influence of market-based environmental regulation on the MFESG. Utilizing the implementation of this law as a quasi-natural experiment allows for a rigorous empirical examination of how fiscal instruments can align corporate behavior with sustainable development objectives. The findings of such research not only enrich theoretical understanding but also yield valuable insights for the optimization of environmental policy design and the advancement of corporate sustainability practices.
Although corporate ESG performance has attracted increasing scholarly attention in recent years, existing studies have not yet provided a systematic and in-depth examination of how market-based environmental regulations—such as the EPT—affect the ESG performance of manufacturing firms. Meanwhile, the effectiveness of market-oriented environmental policies in advancing corporate sustainability remains subject to debate. Some studies argue that market incentives can facilitate green transformation [15,16], whereas others contend that environmental regulation may increase compliance costs and crowd out resources that would otherwise support innovation and responsible governance [17]. In light of existing gaps and mixed findings, this study offers three incremental contributions. First, by using the 2018 Environmental Protection Tax as a quasi-natural experiment and a multi-period difference-in-differences framework, it provides evidence that is closer to causal interpretation regarding the relationship between market-based environmental regulation and firms’ ESG performance. While not definitive, this setting reduces some concerns about endogeneity relative to cross-sectional approaches and complements the existing correlational literature. Second, the paper explores two plausible transmission channels—reduced financing constraints and increased green innovation—thereby offering mechanism-based evidence that may help interpret why effects differ across studies. The results suggest that both channels are operative in this context, though effect sizes vary and should be interpreted with appropriate caution. Third, by examining heterogeneity across ownership and audit characteristics, the study documents that the estimated effects appear more pronounced for non-state-owned firms and firms unaudited by the Big Four. These patterns point to the potential moderating roles of governance structures, external monitoring, and resource endowments, and may be useful for thinking about more targeted regulatory designs. Overall, the findings should be viewed as context-specific and complementary to prior work, and we acknowledge that further research with alternative measures and settings would be valuable.
The remainder of this paper is organized as follows: Section 2 elaborates on the policy background and research hypotheses; Section 3 details the research design; Section 4 presents and discusses the empirical results; Section 5 conducts the heterogeneity analysis; and Section 6 concludes the study by summarizing key findings and proposing corresponding policy recommendations.

2. Institutional Background and Research Hypotheses

2.1. Institutional Background

The EPT represents a cornerstone of China’s market-oriented environmental governance, designed to curb pollutant emissions and stimulate the adoption of green technologies through economic instruments. Originating from the earlier pollution discharge fee system, the EPT was introduced in response to the latter’s limited effectiveness. The fee-based mechanism had long suffered from weak legal enforceability and inconsistent administrative implementation, resulting in inadequate control over pollution discharges. To remedy these institutional shortcomings, China enacted the Environmental Protection Tax Law at the end of 2016, with full enforcement beginning in 2018. This legislative reform signified a fundamental transition from a fee-driven to a tax-based regulatory framework, underscoring the state’s determination to institutionalize environmental protection and strengthen ecological governance.
The conception and design of the EPT drew inspiration from international experiences, particularly from European economies such as Sweden and Germany, which had introduced environmental taxation in the late twentieth century. These nations demonstrated the efficacy of fiscal tools in addressing carbon emissions and energy consumption, thereby achieving substantial improvements in environmental quality. China’s EPT model assimilates key features from these international precedents—including tax rate setting, revenue allocation, and collection mechanisms—while tailoring them to the nation’s unique stage of economic development and its pronounced regional heterogeneity. Compared with the former pollution discharge fee system, the EPT embodies several distinctive institutional innovations. First, it possesses robust legal authority: as a statutory tax, it minimizes administrative arbitrariness and ensures policy continuity and credibility. Second, the tax framework introduces rate flexibility, establishing the original discharge fee as a minimum threshold while allowing local governments to adjust rates according to local economic capacity and pollution control objectives. Third, the reform optimizes fiscal incentives by assigning all tax revenues to local governments, thereby enhancing their motivation and financial capacity for environmental governance. Fourth, the separation of responsibilities between tax collection agencies and environmental monitoring departments strengthens transparency, accountability, and overall enforcement efficiency.
Beyond its regulatory function, the EPT operates as a dynamic market mechanism that steers enterprises toward green transformation. By embedding environmental costs into corporate decision-making, the policy encourages the adoption of energy-efficient and emission-reducing technologies. Furthermore, as an integral component of China’s broader strategy to achieve its “dual carbon” objectives—carbon peaking and carbon neutrality—the EPT transforms pollution control from passive compliance into proactive emission reduction. Through fiscal pressure and incentive alignment, it fosters enterprise-level green innovation and catalyzes the diffusion of sustainable development principles across society.

2.2. Research Hypothesis

As a central pillar of the national economy, the manufacturing sector not only drives industrial output and employment but also bears substantial environmental and social responsibilities due to its inherently high levels of pollution and energy consumption [2]. Market-based environmental regulation addresses these challenges by transforming the externalities of pollution into internal costs through economic instruments. By imposing fiscal constraints and incentive mechanisms, such regulation compels firms to optimize production processes, assume broader social responsibilities, and strengthen corporate governance structures. Rooted in the Pigovian tax framework [18], this mechanism internalizes the social cost of pollution, thereby motivating firms to adopt cleaner technologies and green production methods that minimize emission-related expenditures. Moreover, the heightened regulatory emphasis on social and governance standards encourages enterprises to improve community engagement, enhance transparency, and elevate their overall ESG (Environmental, Social, and Governance) performance.
However, the improvement of ESG performance and the advancement of green transformation require continuous capital input, and manufacturing firms often face financing constraints due to information asymmetry and risk perceptions in capital markets. In this context, market-based environmental regulation not only increases pollution abatement pressure but also enables firms to signal stronger environmental responsibility and compliance credibility to external investors. By doing so, such regulation can reduce financing frictions, enhance investors’ confidence in firms’ sustainable strategies, and improve access to external capital, which further supports continuous investments in environmental governance, social responsibility practices, and governance structure optimization.
The EPT, as the core embodiment of China’s market-based environmental regulation, directly targets the pollution-intensive characteristics of manufacturing operations and promotes ESG advancement through economic leverage. First, since major pollutants generated by manufacturing firms include wastewater, airborne emissions, and solid waste, the EPT establishes explicit tax parameters for each category and penalizes firms exceeding permissible discharge levels. This fiscal pressure compels enterprises to reduce emissions by upgrading production technologies, modernizing equipment, and refining operational processes [19,20]. Second, the transition toward green manufacturing necessitates stronger collaboration between firms and social stakeholders. The EPT indirectly stimulates corporate participation in environmental initiatives, community improvement programs, and employee welfare enhancement, reinforcing the social dimension of ESG. Third, compliance with the EPT requires precise environmental data tracking and effective internal management systems. These demands incentivize firms to improve their governance structures, enhance accountability mechanisms, and strengthen monitoring capacity [21].
Taken together, these mechanisms indicate that the EPT can operate through both cost–constraint effects and financing–resource enhancement effects, jointly promoting sustainable transformation in the manufacturing sector. Based on this theoretical reasoning, the study proposes the following hypothesis:
H1: 
Market-based environmental regulation exerts a positive and significant effect on the ESG performance of manufacturing firms.
Financing constraints describe the obstacles firms encounter when attempting to secure adequate funding at acceptable costs, often arising from information asymmetry, insufficient collateral, or limited credit access [22]. Such constraints restrict firms’ capacity for investment, innovation, and expansion. Within the manufacturing sector, these challenges are particularly acute due to the industry’s capital-intensive nature and high asset specificity, which heighten dependence on external financing sources. However, the sector’s inherent characteristics—namely high pollution intensity and excessive energy consumption—expose firms to elevated credit risk perceptions and restricted lending conditions. Consequently, financing constraints constitute a major impediment to the green transformation and sustainable growth of manufacturing enterprises.
Market-based environmental regulation can play a pivotal role in easing these financial bottlenecks by embedding environmental responsibility into firms’ economic decision-making processes. As a representative form of such regulation, the EPT internalizes the external costs of pollution, linking environmental performance with financial credibility. Its implementation alleviates financing constraints through several interrelated mechanisms. First, the EPT requires enterprises to comply with stricter environmental management and disclosure standards. The resulting transparency enhances investor and creditor confidence in firms’ environmental risk management, thereby reducing perceived credit risks associated with regulatory non-compliance. Second, firms that fulfill their EPT obligations and achieve tangible improvements in pollution control are increasingly recognized as green and socially responsible enterprises. These firms are more likely to access preferential financing—such as green credit facilities and lower-interest loans—from financial institutions seeking sustainable investment opportunities, effectively relieving financing pressure. Third, the fiscal costs imposed by the EPT incentivize firms to channel resources into green technological innovation and cleaner production upgrades. As their technological capabilities and environmental reputation improve, these firms experience positive signaling effects in the capital market, attracting greater investor attention and external funding support. By mitigating financing constraints, the EPT exerts indirect yet multifaceted influences on the ESG performance of manufacturing firms. In the Environmental (E) dimension, reduced financing frictions enable greater investment in clean technologies and energy-efficient infrastructure, thereby curbing emissions and resource waste [23]. In the Social (S) dimension, enhanced financial capacity allows firms to allocate more resources toward employee welfare, community engagement, and philanthropic initiatives, strengthening their social responsibility fulfillment. In the Governance (G) dimension, improved liquidity bolsters internal control systems, strategic decision-making efficiency, and transparency in managing environmental and social issues [24].
Taken together, the above analysis indicates that market-oriented environmental regulation not only reshapes firms’ environmental governance behavior through external cost pressures, but also improves their financing environment by enhancing information transparency, credibility, and sustainability signaling. The alleviation of financing constraints expands firms’ capacity to invest in green technologies, social responsibility initiatives, and internal governance enhancement, thereby promoting a comprehensive improvement in ESG performance. Accordingly, we advance the following hypothesis:
H2: 
Market-based environmental regulation indirectly enhances the ESG performance of manufacturing firms by alleviating financing constraints.
Green innovation encompasses the technological and managerial activities through which firms pursue resource efficiency, pollution reduction, and ecological sustainability by developing or adopting novel products, production processes, or organizational methods [25]. It represents not only a vital pathway for enhancing corporate competitiveness but also a fundamental driver of sustainable industrial transformation. For manufacturing enterprises—characterized by intensive energy consumption and significant pollutant emissions—green innovation plays a particularly pivotal role. It simultaneously elevates environmental performance and provides technological and managerial foundations for fulfilling social responsibilities and improving governance effectiveness.
Market-based environmental regulation serves as an essential external catalyst for stimulating green innovation. In line with the Porter Hypothesis [26], appropriately designed environmental regulation can correct market failures by increasing the cost of pollution and creating economic incentives that encourage firms to innovate. By transforming environmental compliance from a passive obligation into an active source of competitive advantage, such regulation promotes the continuous development and diffusion of green technologies. As a core market-oriented instrument, the EPT exerts a direct influence on firms’ innovative behavior through fiscal mechanisms. First, by imposing taxes on pollutant emissions, the EPT raises operational costs for high-pollution manufacturing firms, compelling them to invest in cleaner production technologies to reduce both emissions and tax liabilities. Second, tax revenues collected under the EPT framework can be redirected toward innovation-supporting initiatives—such as fiscal subsidies and dedicated green technology funds—helping firms overcome the high R&D costs associated with environmental innovation. Third, the widespread implementation of the EPT strengthens public and market recognition of green innovation, thereby enhancing firms’ reputational capital and incentivizing further technological upgrading.
Green innovation functions as a crucial internal mechanism through which manufacturing firms enhance their ESG performance. Technological innovation aimed at sustainable production not only mitigates environmental harm but also improves social and governance outcomes. In the Environmental (E) dimension, green innovation facilitates cleaner production processes and the deployment of energy-efficient equipment, thereby reducing wastewater discharge, exhaust emissions, and solid waste generation [27]. In the Social (S) dimension, innovation enhances workplace safety, employee well-being, and community engagement, reinforcing corporate social responsibility. In the Governance (G) dimension, the integration of innovation into R&D and operational management encourages more effective decision-making, transparency, and resource optimization. However, the realization of green innovation requires substantial and continuous investment in technological upgrading, equipment renewal, and talent development. Market-based environmental regulation—such as the Environmental Protection Tax—creates economic pressure and policy incentives that shift firms’ strategic priorities toward environmental improvement. By increasing the cost of pollutant emissions and strengthening public scrutiny, such regulation encourages firms to internalize environmental risks and seek long-term cost reduction through technological transformation rather than short-term compliance measures. Moreover, firms that successfully adopt green innovation benefit from enhanced market reputation, improved stakeholder trust, and preferential access to green finance, which further reinforces ESG enhancement. For industries characterized by high pollution intensity and energy dependency, green innovation therefore represents not merely a reactive response to regulatory compliance, but a proactive strategy to achieve industrial upgrading, resilient growth, and sustainable competitiveness in the global market. By promoting the adoption and diffusion of green technologies, market-based environmental regulation may thus stimulate firms to continuously improve their ESG performance through innovation-driven pathways. In light of the above reasoning, this study posits the following hypothesis:
H3: 
Market-based environmental regulation indirectly enhances the ESG performance of manufacturing firms by fostering green innovation.
Based on this theoretical framework, the study constructs a conceptual mechanism model, as illustrated in Figure 1.

3. Research Design

3.1. Model

3.1.1. Difference-in-Differences Model

The DID model has emerged as one of the most widely applied econometric techniques for evaluating policy effects, offering clear methodological advantages over traditional empirical models. By constructing treatment and control groups and incorporating temporal dimensions—before and after policy implementation—the DID framework effectively addresses endogeneity concerns stemming from unobserved heterogeneity and common time trends. This design enables a more credible estimation of causal policy impacts and mitigates bias associated with omitted variables and confounding shocks [28,29,30]. Considering the spatial and temporal heterogeneity of the EPT policy, this study employs the DID model as its primary identification strategy. The enactment of the EPT in 2018 provides an appropriate quasi-natural experimental setting, allowing for a robust empirical examination of how market-based environmental regulation influences the MFESG. This approach not only captures the direct impact of the EPT but also sheds light on the underlying mechanisms through which fiscal environmental instruments promote corporate sustainability. By leveraging this econometric design, the analysis aims to provide rigorous and policy-relevant evidence on the effectiveness of market-oriented environmental regulation in driving sustainable business transformation. Following the methodological framework established by Beck et al. (2010), this paper adopts a similar model specification to ensure consistency and comparability with prior research [31]. The model is formally expressed as follows:
Y i t = β 0 + β 1 T r e a t e d i × P o s t i t + λ C o n t r o l s i t + ν i + τ t + ε i t
In model (1), Yit denotes the ESG performance of firm i in year t. Treatedi is the treatment indicator, which equals 1 if firm i is located in a region where the applicable tax rate on water pollutants has been increased, and 0 otherwise. Postit is the time dummy for the policy implementation period, taking the value of 1 in the years after the Environmental Protection Tax (EPT) is officially enforced for firm i, and 0 in the years prior. Controls represent the set of control variables included in the model, covering all firm-level and macro-level factors controlled for in this study. In line with the requirements of the Difference-in-Differences model, individual fixed effects τ t and time fixed effects ν i are controlled for, along with the error term ε i t . In addition, I incorporate province–year fixed effects into the model, which helps to net out regional macro shocks associated with tax rate adjustments and thus enhances the accuracy of the causal identification.

3.1.2. Mediator Effect Model

The mediation model serves as an analytical framework for investigating how an independent variable influences a dependent variable through an intermediate or mediator variable. Originally introduced by Baron and Kenny (1986), this model provides a structured approach to examining indirect relationships among variables, thereby uncovering the underlying mechanisms that transmit the effects of the independent variable to the dependent outcome [32]. By decomposing total effects into direct and indirect components, the mediation framework allows researchers to identify the specific channels through which a causal relationship operates. Drawing upon relevant literature [33], this study employs a two-stage mediation model to empirically test the mechanisms through which the EPT affects the MFESG. This analytical design enables the exploration of whether and how intermediary factors—such as financing constraints or green innovation—mediate the influence of market-based environmental regulation on corporate sustainability outcomes. Furthermore, to ensure the robustness and statistical validity of the mediation effect, the study incorporates the Sobel test, following the methodological approach commonly used in prior research [27]. This additional test provides a formal significance assessment of the indirect pathways identified within the model, thereby enhancing the reliability and interpretive strength of the empirical findings. The general specification of the mediation model is presented as follows:
Y i t = β 0 + β 1 T r e a t e d i × P o s t i t + λ C o n t r o l s i t + ν i + τ t + ε i t M i t = β 0 + β 1 T r e a t e d i × P o s t i t + λ C o n t r o l s i t + ν i + τ t + ε i t
In this model, M represents the mediator variable, which primarily includes financing constraints and green innovation.

3.2. Variable Selection and the Source of the Data

3.2.1. Dependent Variable

Measurement of Manufacturing Firms’ ESG Performance: Although international institutions such as Thomson Reuters, MSCI, and Bloomberg have developed relatively mature ESG evaluation systems, the applicability of these international rating methodologies to Chinese enterprises is limited due to the unique characteristics of China’s institutional context and corporate disclosure environment. Therefore, this study employs the Wind–Sino-Securities Index (CSI) ESG Rating Database as the measurement source for manufacturing firms’ ESG performance (MFESG). The ratings are compiled by Sino-Securities Index Co., Ltd. based on listed firms’ annual reports, corporate social responsibility reports, sustainability reports, environmental information disclosure documents, and third-party media data, ensuring strong contextual relevance to the Chinese market. Under a unified evaluation framework, the rating system assesses corporate sustainability performance across three dimensions: environmental responsibility (E), social responsibility (S), and corporate governance (G), and further aggregates them into a composite ESG score. The E, S, and G sub-scores and the composite ESG index are all derived from the same database and methodological system, ensuring consistency and comparability. The scoring scale ranges from 0 to 100, with higher scores indicating better ESG performance. Moreover, the rating system adopts industry-level standardization (i.e., mean and deviation normalization within industries) to eliminate systematic differences arising from variations in industry size and pollution intensity, and it covers all listed firms in the Chinese capital market, thereby ensuring strong horizontal comparability.

3.2.2. Independent Variable

Market-Based Environmental Regulation: The EPT represents a central pillar of China’s market-oriented environmental regulatory framework, characterized by its legal enforceability, economic incentives, and adaptive flexibility. By imposing taxes on pollutant emissions, the EPT effectively internalizes the external environmental costs of industrial production. This mechanism motivates firms to optimize production processes, adopt cleaner technologies, and reduce pollutant discharges, while simultaneously providing local governments with stable fiscal resources for environmental governance and green development initiatives. Building on these institutional characteristics, this study employs the EPT as a proxy variable for market-based environmental regulation to empirically examine its dual role as both a constraint and an incentive for corporate behavior. Specifically, provinces and municipalities that raised the tax rates for taxable water pollutants are identified as the treatment group, whereas those that maintained their original tax levels constitute the control group (See Appendix A). By comparing differences in the environmental (E), social (S), and governance (G) dimensions of firm performance between these two groups, this study provides an empirical assessment of the policy effectiveness of market-based environmental regulation within the manufacturing sector.

3.2.3. Control Variable

Drawing upon prior research [34,35,36] and in accordance with the analytical requirements of this study, a set of firm-level characteristics is incorporated as control variables to enhance both the robustness of the econometric model and the explanatory validity of the empirical results. These variables are selected to account for firm heterogeneity and to isolate the net effect of market-based environmental regulation on ESG performance. Specifically, the model controls for firm size, leverage ratio (debt-to-asset), profitability (return on assets), cash flow ratio, revenue growth rate, ownership concentration (measured by the shareholding proportion of the top five shareholders), CEO Duality, capital intensity (proxied by the fixed asset ratio), and firm age. The operational definitions, measurement methods, and data sources of these variables are summarized in Table 1.

3.2.4. Mediator Variables

Financing Constraints: A variety of indicators have been developed to measure the degree of financing constraints faced by firms, with different measures being suitable for distinct research contexts and data environments. Among the most commonly applied indices are the Fazzari index, which is derived from cash flow sensitivity [37]; the Kaplan–Zingales (KZ) index, based on investment–cash flow sensitivity [38]; the Cleary index, which captures financial constraint conditions [39]; and the Whited–Wu (WW) index, which is constructed from firm-specific financial characteristics [40]. Given that this study examines the mechanisms through which market-based environmental regulation affects the MFESG, with a particular focus on financial behavior and funding accessibility, the WW index is deemed the most appropriate metric. By integrating multiple dimensions—such as cash flow, leverage, and firm size—the WW index provides a more comprehensive reflection of a firm’s financing condition. Therefore, this study employs the WW index as the principal measure of financing constraints, offering a more robust and context-appropriate quantitative basis for analyzing how the alleviation of financing constraints facilitates the enhancement of MFESG under market-oriented environmental regulation.
Green Innovation: Following the existing literature, this study measures firms’ green technological innovation based on their green patent activities. The identification of green patents is conducted according to the IPC Green Inventory issued by the World Intellectual Property Organization (WIPO), which maps specific International Patent Classification (IPC) codes to technologies with clear environmental benefits. This classification system is widely used in academic research and provides a consistent and internationally comparable standard for defining “green” technologies. Based on this classification, data on green patents are obtained from the China National Intellectual Property Administration (CNIPA). To more accurately capture the realization of innovation outcomes rather than strategic filing behavior, this study adopts the number of granted green patents, rather than patent applications. Specifically, green innovation is measured as the total number of granted green invention patents and granted green utility model patents obtained by each firm in a given year. Considering the right-skewed distribution of patent counts, the variable is defined as: green innovation = natural logarithm of (1 + total granted green patents).
In summary, the definitions, measurement methods, and data sources for all variables are presented in Table 1.
Table 1. Primary variable definitions.
NameAbbreviationDefinition
Dependent VariableManufacturing Firm ESG PerformanceMFESGESG rating of listed companies
Independent VariableEnvironmental Protection TaxEPTThe variable takes the value 1 if the applicable tax rate on water pollutants under the Environmental Protection Tax is increased in the firm’s registered location, and 0 otherwise.
Control VariablesFirm SizeSIZENatural logarithm of total assets
Debt-to-Asset RatioLEVTotal liabilities/Total assets
Return on AssetsROANet profit/Total assets
Cash Flow RatioCFNet cash flow from operating activities/Total assets
Revenue Growth RateGROWThis year’s revenue/Last year’s revenue − 1
Proportion of Shares Held by Top Five ShareholdersTOP5Number of shares held by the top five shareholders/Total shares
CEO DualityDUALSet to 1 if the chairman and CEO are the same person, otherwise set to 0
Fixed Asset RatioFIXEDNet fixed assets/Total assets
Firm AgeFALn (Number of years since the firm was established + 1)
Mediator VariablesFinancing ConstraintsWWCalculated using Whited and Wu’s method [40]
Green InnovationGIln (Sum of granted green invention patents and utility model patents)

3.2.5. Sample Selection and Data Sources

We sincerely thank the reviewer for the insightful suggestion. We have added a discussion of the historical coverage of the Wind–Sino-Securities ESG ratings. Specifically, the coverage was relatively limited during 2010–2012 but gradually expanded and became stable after 2013.
Given that the research specifically targets the manufacturing sector, all non-manufacturing enterprises were excluded from the analytical sample. To mitigate the influence of extreme values and ensure the reliability of the empirical results, all continuous variables were subjected to two-sided winsorization at the 1st and 99th percentiles. To enhance the validity and consistency of the dataset, a rigorous sample-screening procedure was implemented. First, only firms listed on China’s A-share market and classified under the “C” industry category according to the Guidelines for the Industry Classification of Listed Companies (2012 Edition) were retained. Second, firms designated as ST, *ST, or those that had been delisted during the study period were excluded to avoid the influence of financial distress and abnormal trading conditions. Third, firms with missing or incomplete key variables were removed. After these screening steps, the final sample comprises an unbalanced panel dataset of 2677 manufacturing firms covering the period from 2010 to 2022. The primary data sources include the Listed Company ESG Rating Database, the official China Government Website, and the CSMAR Database, among others. Descriptive statistics and variable definitions are summarized in Table 2. The mean value of the EPT variable is 0.445, indicating that approximately 44.5% of the sample firms fall within the treatment group defined by the EPT policy implementation.

4. Empirical Results

4.1. Benchmark Regression Analysis

This study employs Model (1) to empirically investigate the impact of the EPT on the MFESG, with the corresponding estimation results summarized in Table 3. In Column (1), the baseline regression—excluding control variables—indicates that the coefficient of EPT is 0.7828, which is statistically significant at the 1% level, suggesting a strong positive association between market-based environmental regulation and firms’ ESG outcomes. As control variables are progressively introduced across subsequent specifications, both the magnitude and statistical significance of the EPT coefficient remain largely consistent, implying the robustness of the estimated relationship. In Column (4), which incorporates the full set of control variables, the coefficient of EPT remains significantly positive with an estimated value of 0.6549. Given that the ESG score ranges from 0 to 100 and the sample mean of MFESG is 73.19, this effect corresponds to an approximately 0.9% improvement in ESG performance following the implementation of the Environmental Protection Tax. This indicates that the policy not only yields statistically significant effects but also produces substantively meaningful economic benefits by enhancing firms’ sustainability practices. Taken together, these findings provide robust empirical evidence that market-based environmental regulation effectively enhances MFESG, thereby supporting Hypothesis 1 and validating the theoretical expectation that fiscal environmental instruments can drive sustainable corporate transformation.

4.2. Parallel Trend Test

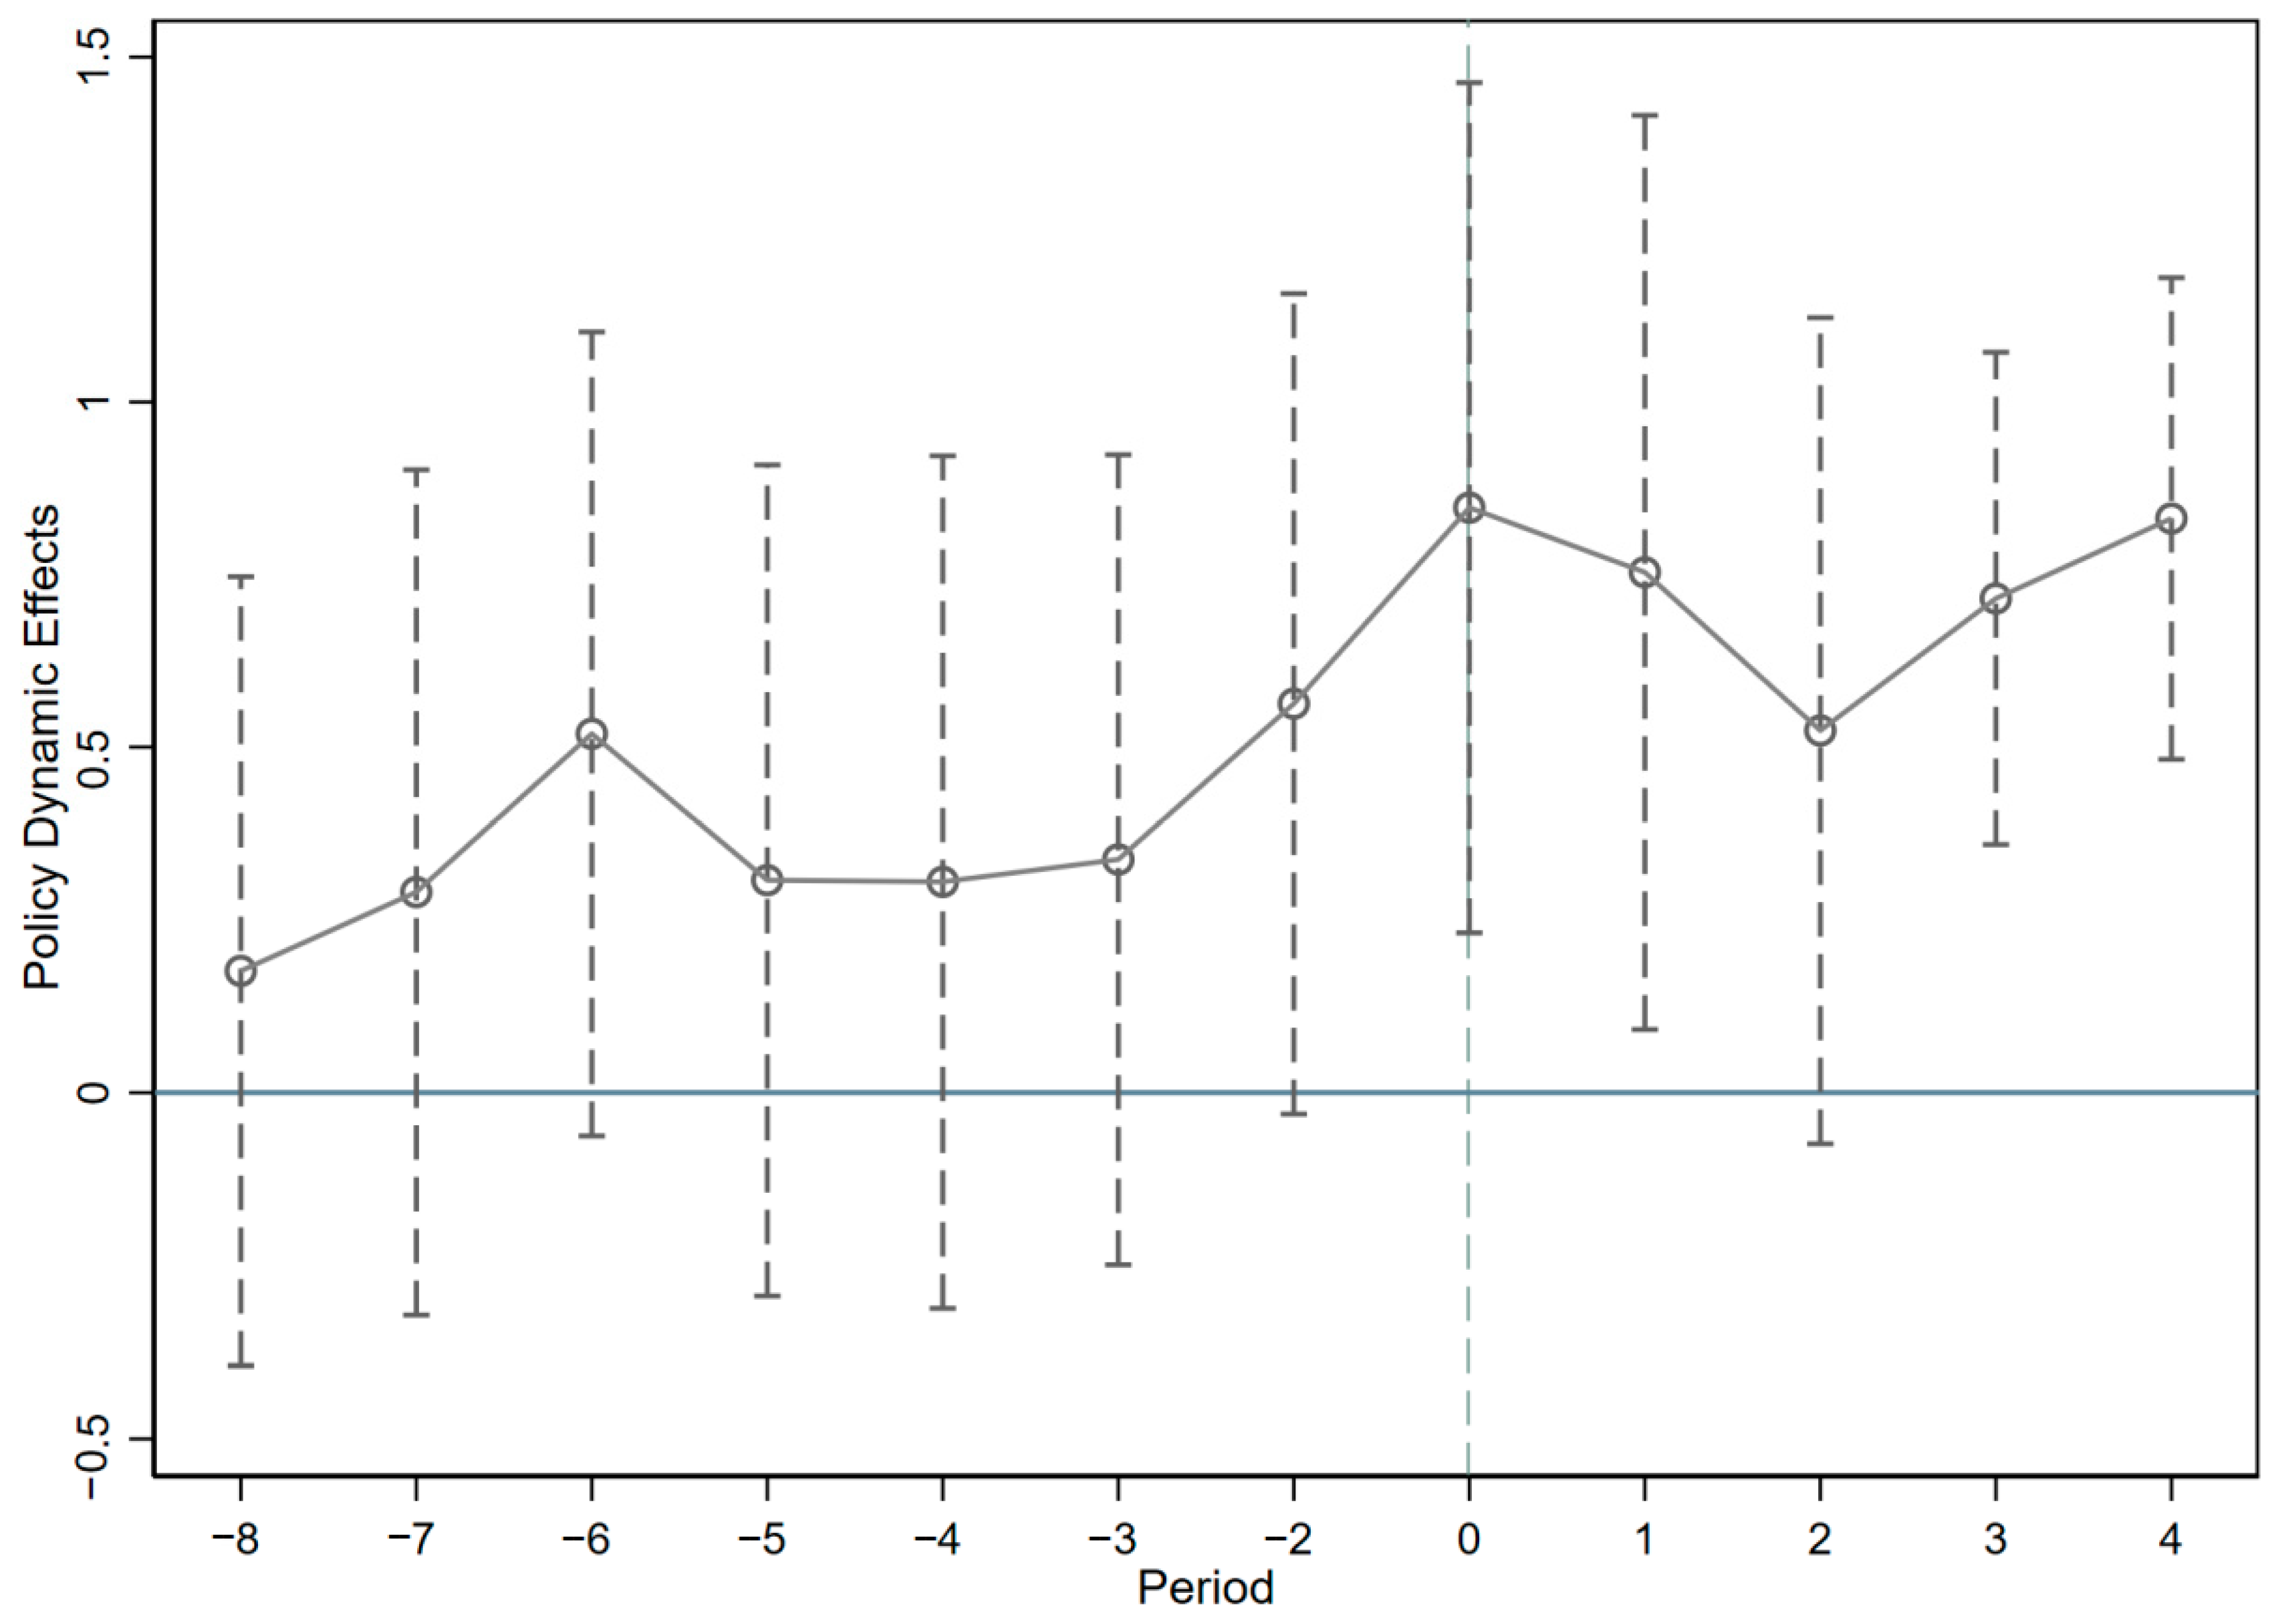
The parallel trends assumption is a fundamental prerequisite for the validity of the DID approach, requiring that, in the absence of policy intervention, the outcome variables of the treatment and control groups would follow comparable trajectories over time [41,42,43]. Only when this assumption holds can the post-policy differences between the two groups be credibly interpreted as the causal effect of the policy rather than the result of underlying structural differences. To empirically assess whether the parallel trends assumption is satisfied, this study adopts an event-study framework to estimate the dynamic effects of the EPT before and after its implementation and plots the corresponding dynamic coefficients over time (see Figure 2). In this analysis, the year immediately prior to the policy implementation (t = −1) is designated as the omitted baseline period, and all coefficients are interpreted relative to this benchmark. As shown in Figure 2, the dynamic coefficients for the pre-policy periods are statistically insignificant, indicating that the treatment and control groups exhibited no systematic differences in ESG performance before the policy. Furthermore, a joint significance test of the pre-policy coefficients confirms that they are jointly insignificant (F = 1.27, p = 0.269 > 0.10), thus supporting the validity of the parallel trends assumption. In addition, to rule out the possibility that firms may have adjusted their ESG behaviors in anticipation of the policy, an anticipation window test is conducted, and the coefficients for the one to two years immediately preceding the policy implementation are likewise insignificant (p = 0.312 > 0.10), suggesting the absence of anticipatory responses. In contrast, the post-policy dynamic coefficients turn significantly positive and exhibit a clear upward trajectory, indicating that the EPT exerts a sustained and progressively strengthening positive effect on firms’ ESG performance. Taken together, these results confirm the credibility and robustness of the DID identification strategy employed in this study.

4.3. Robustness Test

4.3.1. Placebo Test

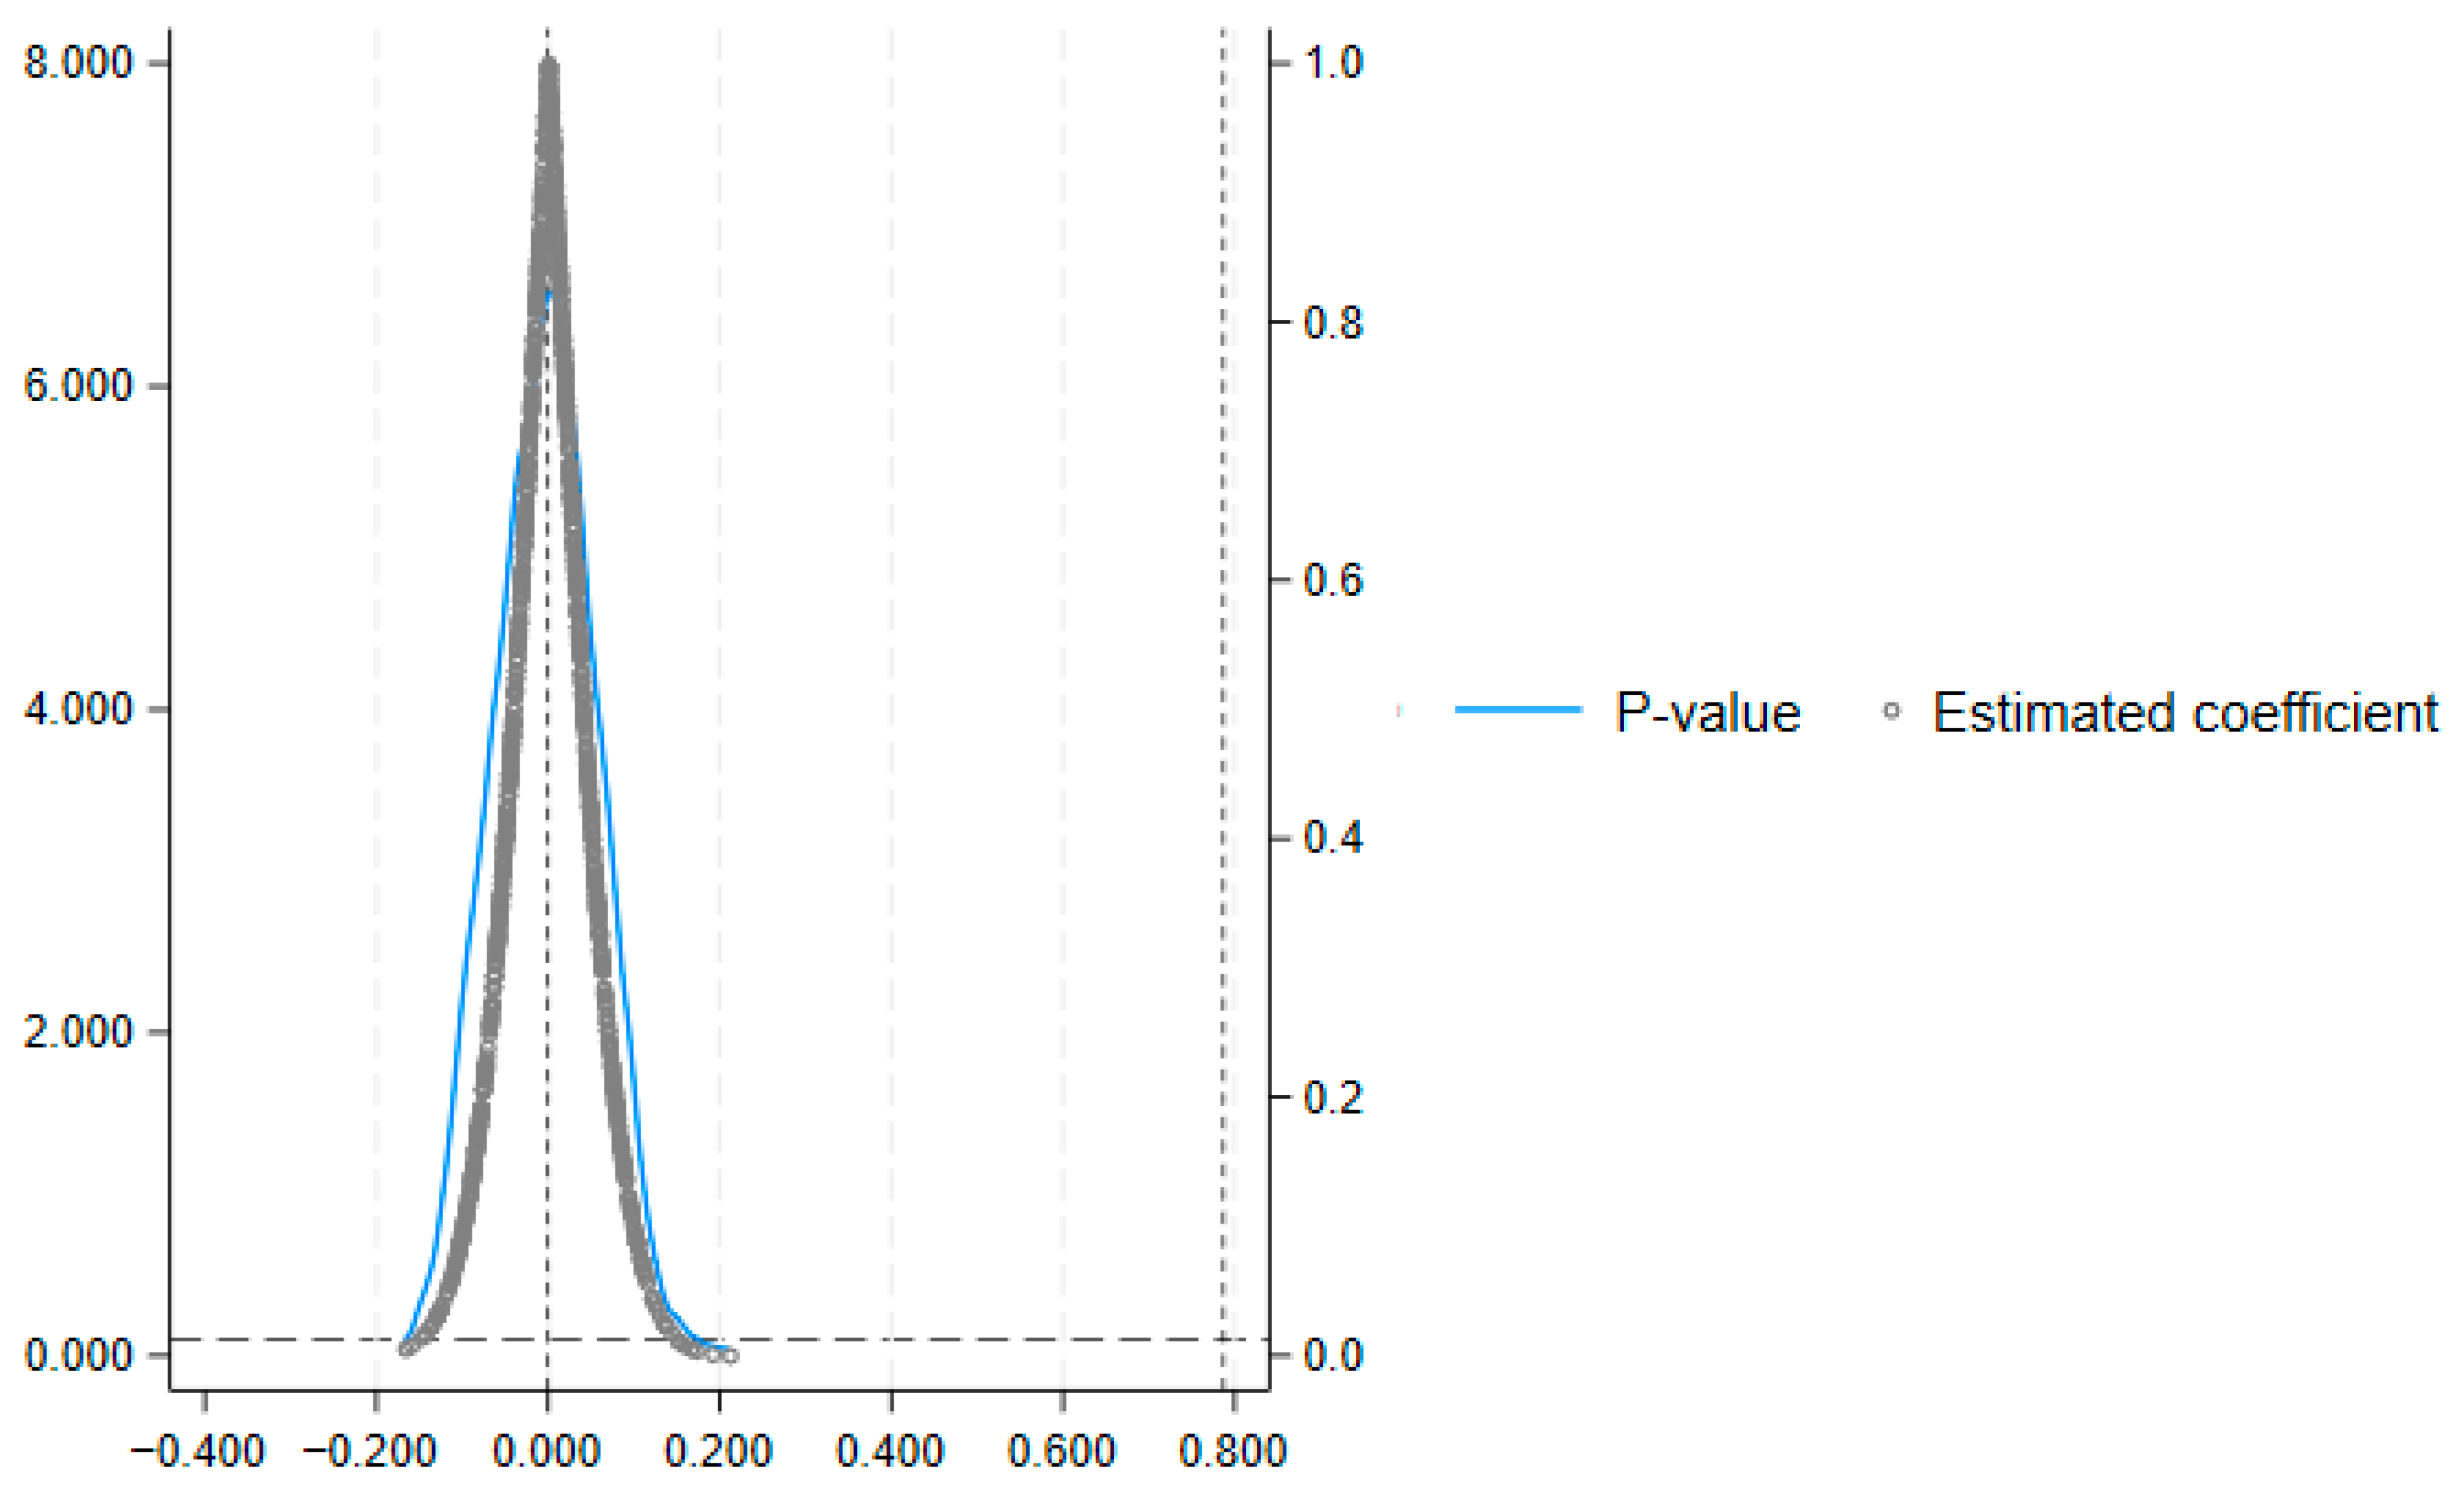
The placebo test serves as an essential robustness check in empirical analysis, designed to determine whether the estimated policy effects stem from the actual treatment rather than from random shocks or unobserved confounding factors. Within the framework of the DID model, this test is implemented by constructing pseudo-policy variables to assess the authenticity of the causal inference. If the estimated coefficients of these pseudo-policy variables are statistically insignificant, it implies that the observed treatment effect is not driven by chance, thereby confirming the reliability of the model and the credibility of the identified policy effect. Following the approach of La Ferrara et al. (2012) [44], this study conducts a placebo test based on the distributional characteristics of the EPT variable used in the baseline regression. Specifically, 1000 pseudo-policy dummy variables are randomly generated, and Model (1) is re-estimated using these simulated policy assignments. The resulting coefficient distribution is illustrated in Figure 3, which shows that the estimated coefficients are tightly clustered around zero, exhibiting neither significant deviation nor discernible systematic trend. This finding suggests that the positive relationship identified between the EPT and the ESG performance of manufacturing firms is not attributable to random variation or spurious correlation. In sum, the placebo test provides strong evidence supporting the robustness and internal validity of the empirical results.

4.3.2. PSM-DID

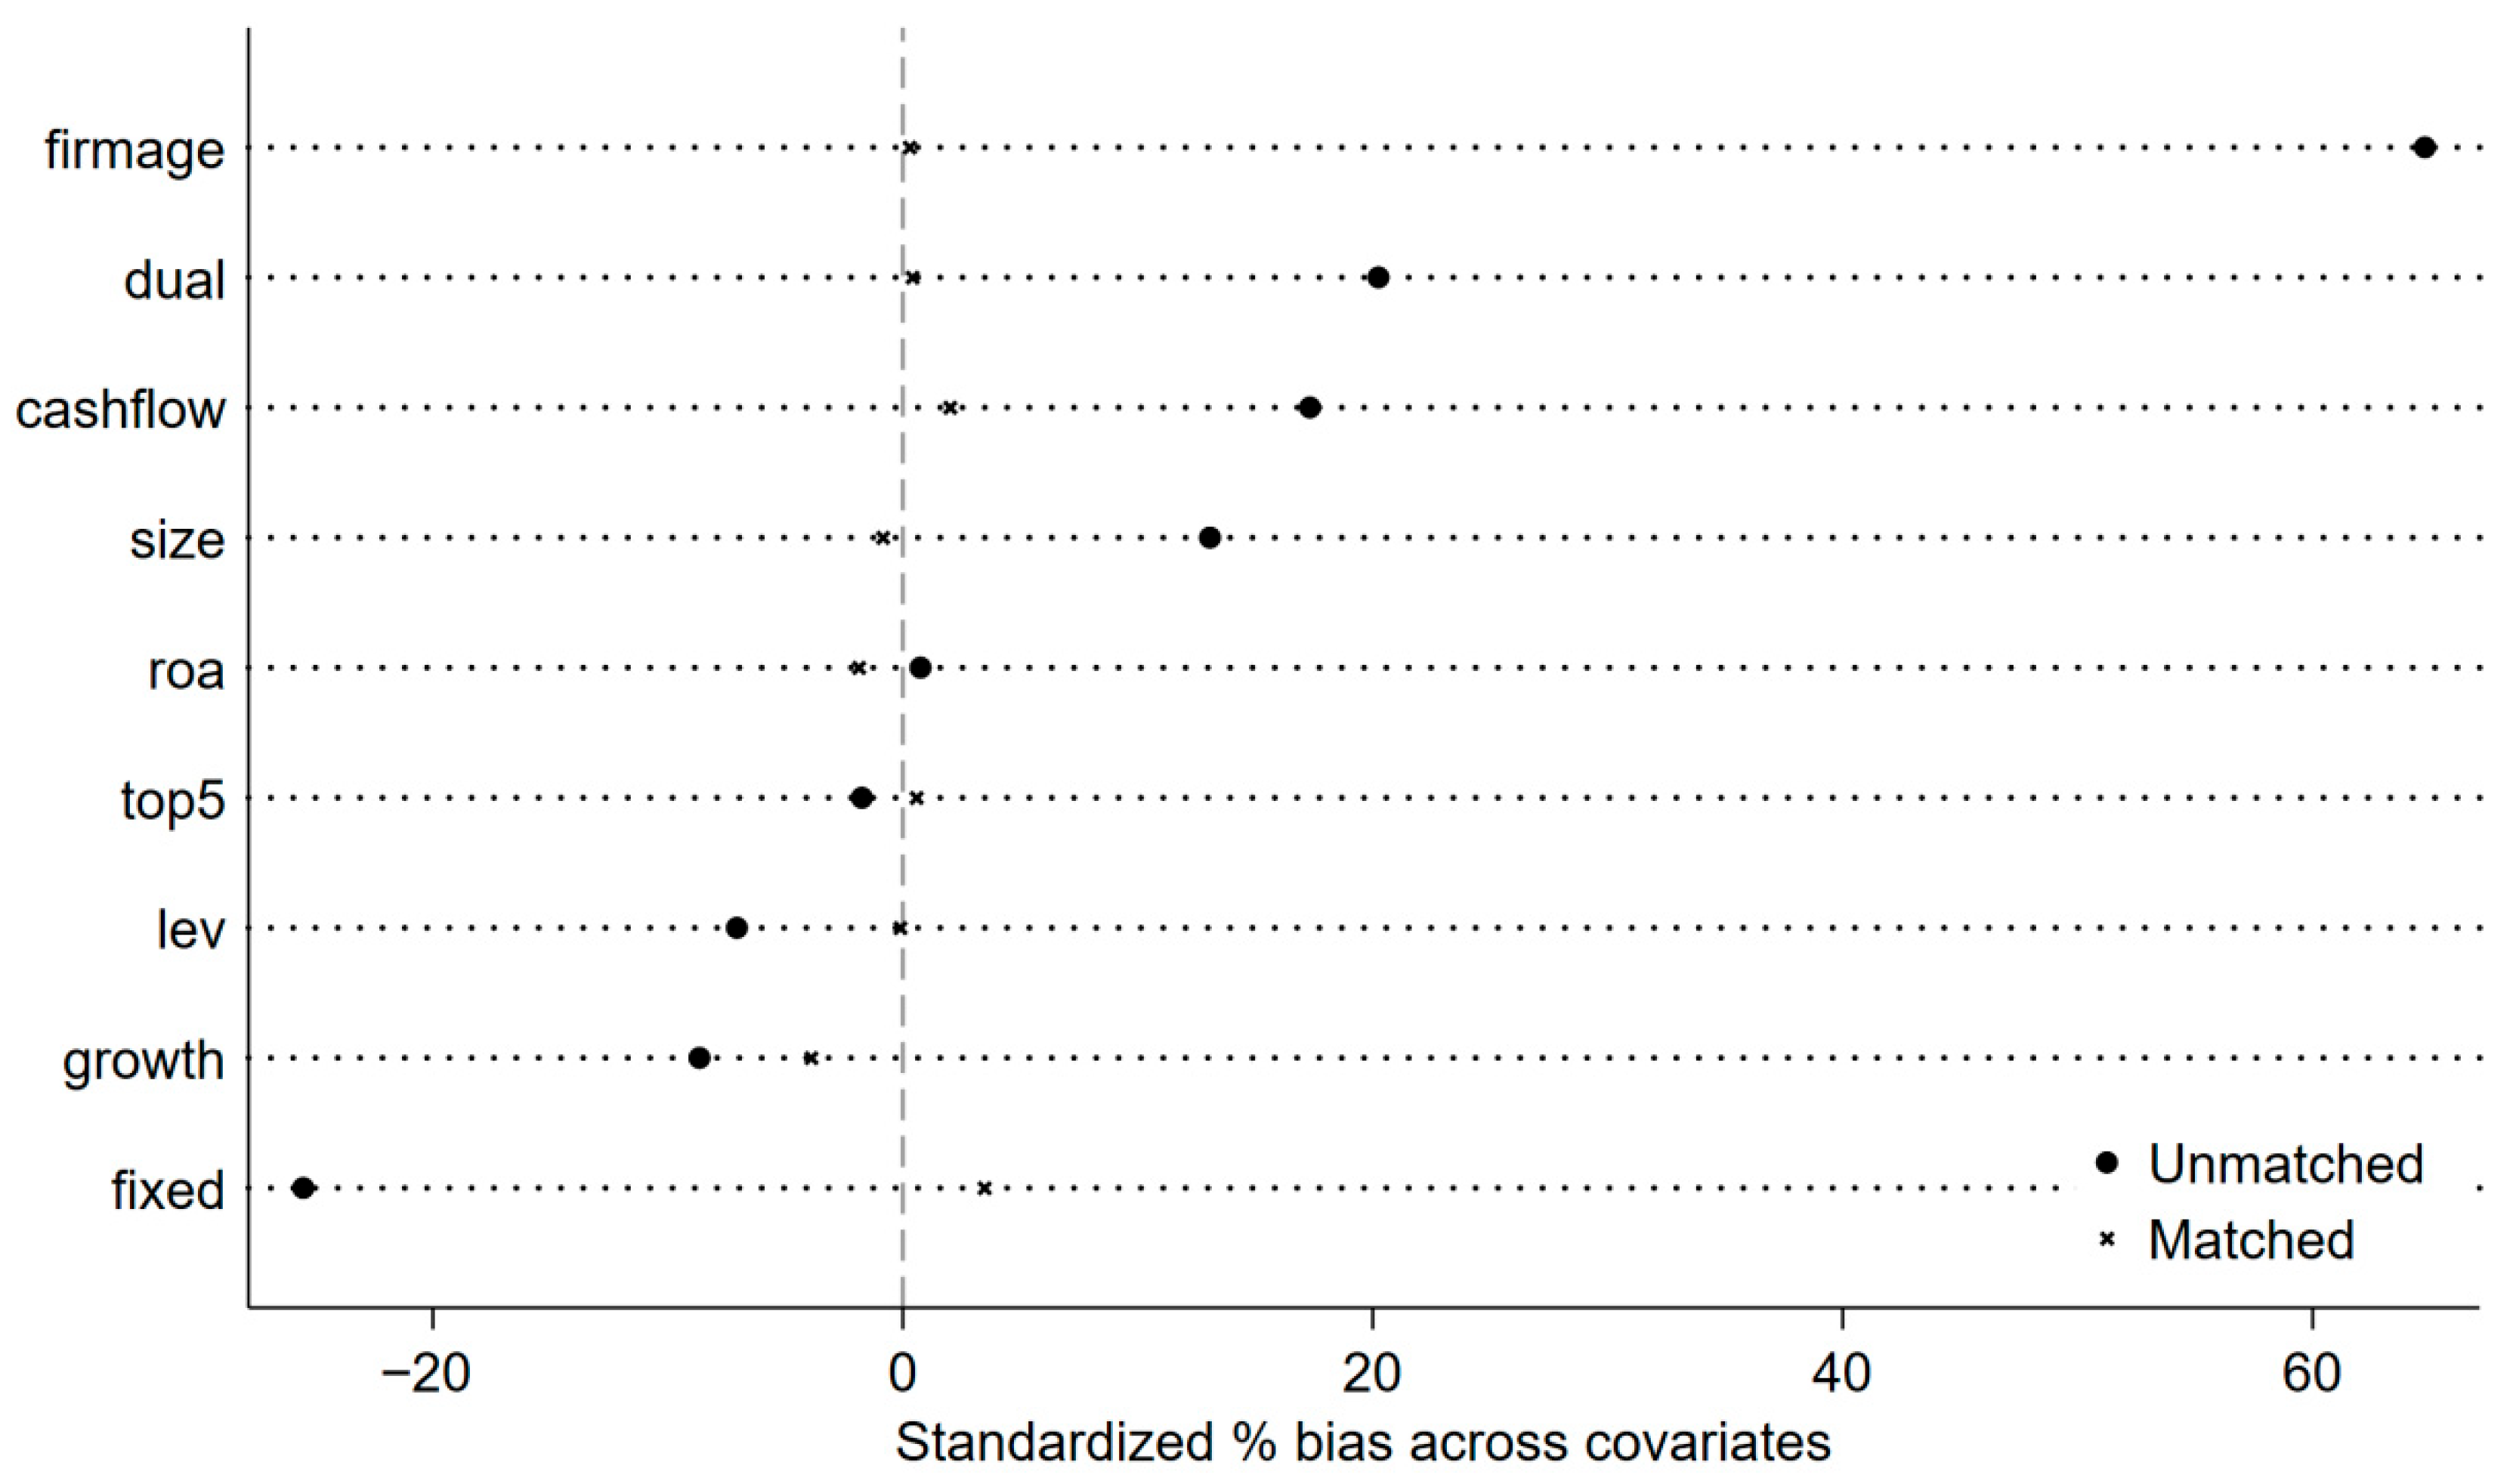
The Propensity Score Matching (PSM) technique is a widely adopted statistical approach for improving comparability between groups in observational studies. By estimating the probability (propensity score) of treatment assignment based on observable covariates, PSM constructs a counterfactual framework in which treated and control units are matched according to similar characteristics, thereby minimizing selection bias arising from non-random group differences [45,46,47]. Within the DID framework, PSM serves as a complementary method that balances the covariate distributions between treatment and control groups, thus enhancing the internal validity and robustness of causal inference. In this study, the caliper nearest-neighbor matching method is applied to perform propensity score matching, and the corresponding results are presented in Figure 4. In the figure, the points labeled “Unmatched” denote the standardized mean bias of covariates prior to matching, while the points labeled “Matched” represent the same bias after the matching procedure. As illustrated, the standardized bias of all covariates decreases substantially following matching and converges toward zero. This indicates that the treatment and control groups exhibit highly comparable covariate characteristics after matching, confirming that the matching procedure achieved a satisfactory balancing effect.
After removing the unmatched observations obtained from the propensity score matching process, a re-estimation of the regression model was conducted, and the results are reported in Column (1) of Table 4. The coefficient of the EPT remains positive and statistically significant, demonstrating that the EPT continues to exert a favorable influence on the MFESG. This finding provides additional empirical support for the conclusion that market-based environmental regulation effectively enhances firms’ ESG performance. The consistency of the estimation results after sample matching further strengthens the robustness and reliability of the study’s core findings, confirming that the observed effects are not driven by sample selection bias or unobserved heterogeneity.

4.3.3. Exclusion of Other Competing Hypotheses

To ensure that the estimated effects of the EPT are not confounded by other concurrent policy interventions, this study further controls for the potential influence of overlapping national initiatives—such as the Smart City Policy, Broadband China Policy, and National Innovation-Oriented City Policy. Specifically, observations from pilot cities implementing these policies were excluded, and the regression analysis was re-estimated accordingly. The corresponding results are reported in Columns (2) through (4) of Table 4. Across all model specifications, the coefficient of EPT remains positive and statistically significant, indicating that the positive relationship between market-based environmental regulation and the MFESG persists even after accounting for alternative policy effects. These findings demonstrate that the estimated impact of the EPT is not driven by confounding policy environments, thereby reinforcing the robustness, stability, and internal validity of the main empirical conclusions presented in this study.

4.3.4. Alternative ESG Measurement

To further validate the robustness of the empirical findings—and acknowledging that ESG performance can be assessed using different measurement frameworks—this study employs the Huazheng ESG rating data as an alternative indicator for robustness testing. Specifically, the original dependent variable is replaced with the Huazheng ESG score, and the regression analysis is re-estimated accordingly. The corresponding results, reported in Column (1) of Table 5, indicate that the coefficient of the EPT is 0.1540 and statistically significant at the 1% level. This consistent and significant relationship suggests that the positive impact of market-based environmental regulation on the MFESG persists even when an alternative ESG measure is employed. These findings effectively eliminate potential concerns regarding measurement bias and confirm that the core conclusions of this study remain robust, credible, and stable across different ESG evaluation systems.

4.3.5. Alternative Measurement of Environmental Protection Tax

The EPT not only stipulates tax rates for water pollutants but also defines corresponding rates for air pollutants. To further evaluate the robustness of the empirical findings, this study adopts the air pollutant tax rate as an alternative proxy for the EPT and redefines the treatment and control groups accordingly for regression analysis. The estimation results, presented in Column (2) of Table 5, reveal that the coefficient of the air-pollutant-based EPT variable (EPT_a) remains positive and statistically significant. This consistent finding demonstrates that, even when the EPT is measured using an alternative policy dimension, the implementation of market-based environmental regulation continues to exert a significant promoting effect on the MFESG. These results further reinforce the robustness and internal validity of the study’s main conclusions, effectively ruling out potential concerns related to measurement differences in policy variables. Overall, the evidence provides stronger empirical support for the credibility and stability of the research findings.

4.3.6. Shortening the Sample Period

Given that the COVID-19 pandemic may have exerted exogenous shocks on firms’ operations and potentially influenced the effectiveness of the EPT, this study conducts an additional robustness test by excluding all observations from 2019 to 2022. This adjustment aims to eliminate possible distortions in the estimation results caused by pandemic-related disruptions and to isolate the pure policy effect of the EPT. The re-estimation results, reported in Column (3) of Table 5, show that the coefficient of EPT remains positive and statistically significant, indicating that the implementation of market-based environmental regulation continues to enhance the MFESG even after removing the pandemic-affected years from the sample. These findings provide further empirical validation of the reliability and robustness of the study’s main conclusions. They demonstrate that the positive policy impact of the EPT is stable, persistent, and resilient, maintaining its effectiveness even under extreme external conditions such as the COVID-19 crisis.

4.3.7. Wild-Cluster Bootstrap with Province-Level Clustering

To address the concern that the relatively small number of provincial clusters (approximately 31) may lead to over-rejection, we further conduct robustness checks using the wild-cluster bootstrap procedure with clustering at the province level. As reported in Column (3) of Table 5, after replacing the inference method with the province-level wild-cluster bootstrap, the coefficient of the key policy variable EPT × Post remains statistically significant at the 1% level, and its economic magnitude and sign are unchanged. This result indicates that our findings are not driven by the choice of clustering strategy and are robust to potential small-cluster inference issues, thereby reinforcing the reliability of our empirical conclusions.

4.3.8. Robustness Test Using Industry-Year Standardized ESG Scores

To ensure that our findings are not driven by the industry-based normalization embedded in the Wind–Sino-Securities ESG rating system, we further construct an industry-year standardized ESG score (ESG_z). The results based on ESG_z are reported in Column (4) of Table 5. The coefficient on EPT × Post remains positive and statistically significant at the 1% level, and both its magnitude and interpretation are consistent with the baseline estimates. This confirms that the improvement in ESG performance following the implementation of the Environmental Protection Tax reflects substantive enhancements in corporate sustainability practices rather than artifacts of rating scale normalization. Therefore, the core conclusions of this study remain robust.

4.3.9. Addressing Omitted Variable Concerns

To address the concern that the estimated effect of the Environmental Protection Tax (EPT) on ESG performance may be driven by omitted confounders, we conduct a parametric bounds analysis following Oster (2019) and Dantas et al. (2023) [48,49]. We compare a baseline regression without fixed effects to the full DID specification and compute the potential influence of unobserved factors (See Table 6). When setting a conservative upper bound for the R-squared (Rmax = 1.3 × RFE2), the coefficient of EPT decreases slightly from 0.655 to 0.618 but remains positive. The implied δ value is 2.87, indicating that unobserved confounders would need to exert nearly three times the explanatory power of the observed covariates to eliminate the estimated effect. Even when adopting a more conservative bound (Rmax = 2), the coefficient remains positive (0.601) with δ = 3.94. These results provide strong evidence that the positive impact of the EPT on ESG performance is not driven by omitted variable bias, and the main findings are thus robust.

4.3.10. Endogeneity and Caveats

This study employs the implementation of the Environmental Protection Tax Law in 2018 as a quasi-natural experiment and adopts a multi-period DID framework to identify the effect of EPT on corporate ESG performance. However, it is important to acknowledge that during the sample period, the global increase in attention to environmental governance, rising policy uncertainty in major economies, the disruptions caused by the COVID-19 pandemic, and the emerging “anti-ESG” sentiment in certain overseas markets may have jointly influenced both the enforcement of environmental policy and firms’ ESG practices. These macro dynamics may introduce a potential “mechanical association” between the independent and dependent variables. To mitigate these concerns and ensure the credibility of the findings, we take the following steps in model design and robustness evaluation. First, model specification and fixed-effects saturation. The baseline regressions include firm fixed effects (controlling for time-invariant firm heterogeneity) and year fixed effects (controlling for common time shocks). To further account for heterogeneous macro trends across industries and regions, we additionally incorporate industry × year fixed effects and province × year fixed effects, which absorb dynamic shocks varying at the sectoral and regional levels. In robustness analysis, we also include firm-specific linear time trends to alleviate concerns regarding gradual unobservable firm-level evolution. Second, event-study based identification validation. We estimate dynamic treatment effects within an event-study specification. The pre-treatment coefficients are statistically indistinguishable from zero, and the joint pre-trend test fails to reject the null, indicating that treated and control firms exhibited parallel trends before the policy intervention. Furthermore, no significant anticipatory effects are detected. These results provide direct empirical support for the DID identification assumption. Third, robustness checks addressing macro shocks. To further ensure that the main conclusions are not driven by specific macro events, we conduct several additional analyses: (i) Sample exclusion: Re-estimating the model after excluding the pandemic-intensive years (2020–2021) yields consistent results; (ii) Alternative fixed-effects specifications: The sign and significance of the EPT coefficient remain stable when including only industry × year or only province × year fixed effects; (iii) Alternative clustering strategies: Adjusting the clustering level to province, or adopting two-way clustering at the firm and province levels, does not materially change the inference; (iv) Alternative outcome measures: The results remain robust when replacing MFESG with its individual E/S/G pillar scores or using alternative ESG rating versions from the same domestic database. While these strategies collectively mitigate key endogeneity concerns, we acknowledge that residual unobservable macro influences cannot be fully ruled out. Therefore, our conclusions should be interpreted as conditional causal inferences, based on the set of controls, identification strategies, and robustness procedures employed. Future research may further explore the interaction between environmental regulation and macro environmental policy shifts in cross-country settings or under alternative exogenous shocks.

4.4. Mechanism Analysis

4.4.1. Financing Constraints

To further investigate the underlying mechanisms through which the EPT influences corporate behavior, this study employs the Whited–Wu (WW) index as a proxy for firms’ financing constraints. The corresponding estimation results are reported in Column (2) of Table 7, which presents the outcomes of the mechanism test related to financial constraints. As shown in Column (2), the coefficient of EPT is −0.0133, indicating a statistically significant negative relationship between the implementation of the EPT and firms’ financing constraints. This result suggests that the EPT effectively alleviates financial frictions, enabling firms to secure greater access to external funding and thereby easing their capital pressures, providing strong empirical support for Hypothesis 2, which posits that market-based environmental regulation indirectly enhances ESG performance by reducing financing barriers.
Furthermore, the Sobel test yields a Z-value of 3.125, which is significant at the 1% level, reinforcing the statistical robustness of this mediating pathway. To ensure the reliability of this mechanism, this study additionally conducts causal mediation analysis based on the Imai–Keele–Tingley framework [50] with 2000 bootstrap replications (see Table 8, Panel A). The Average Causal Mediation Effect (ACME) is positive and statistically significant, although the mediated proportion is relatively small (approximately 0.07%), indicating that the alleviation of financing constraints constitutes a valid but modest transmission channel. Taken together, these results demonstrate that the EPT not only promotes firms’ sustainable development through regulatory incentives but also exerts a positive indirect influence via improved financing conditions.

4.4.2. Green Innovation

The estimation results for the green innovation mechanism are reported in Column (4) of Table 6. As shown in the regression outputs, the coefficient of the EPT is positive and statistically significant, indicating that the implementation of the EPT significantly enhances firms’ green innovation capacity. This finding provides empirical support for Hypothesis 2, confirming that green innovation serves as a vital mediating pathway through which market-based environmental regulation improves MFESG performance.
Furthermore, the Sobel test yields a Z-value of 2.984, demonstrating the statistical significance of this mechanism. To strengthen this conclusion, causal mediation analysis is also performed following the Imai–Keele–Tingley framework with bootstrap inference (see Table 8, Panel B). The ACME is positive and economically meaningful, accounting for approximately 8.75% of the total effect, suggesting that green innovation represents a substantive and influential transmission channel. Together, these results suggest that the EPT not only directly contributes to firms’ ESG improvement but also indirectly promotes sustainable transformation by stimulating technological progress and innovation-driven environmental responsibility.
Furthermore, this paper conducts an in-depth examination of the relationship between GI, the EPT, and the various subcomponents of corporate ESG performance. The results are presented in columns (6) to (8) of Table 7, where we find that both EPT and GI have significantly positive coefficients. This indicates that the Environmental Protection Tax, by promoting green innovation, has driven improvements in the various subcomponents of corporate ESG performance, specifically in the environmental (E), social (S), and governance (G) dimensions. From the coefficients and their significance, it is evident that green innovation plays a more significant mediating role between the Environmental Protection Tax and the ESG performance of manufacturing firms. Specifically, the Environmental Protection Tax significantly improves corporate ESG performance by incentivizing the implementation of green innovation. Our analysis of the coefficients for each subcomponent reveals that green innovation has the most notable impact on the environmental (E) dimension, with a particularly strong effect on improving environmental performance. This suggests that green innovation is a key driver in enhancing corporate environmental (E) performance. At the same time, green innovation also indirectly promotes improvements in the social (S) and governance (G) dimensions, demonstrating that green innovation is not limited to the application of environmental technologies but also drives progress in corporate social responsibility and governance transparency.

5. Further Analysis

5.1. The ESG Dimension Decomposition

Corporate ESG performance is typically evaluated across three interrelated dimensions: Environmental (E), Social (S), and Governance (G). To more precisely capture the heterogeneous effects of market-based environmental regulation, this study conducts separate regression analyses for each ESG dimension. The corresponding results, reported in Table 9, show that the coefficients of the EPT are 0.8413 for the Environmental dimension, 0.6966 for the Social dimension, and 0.5284 for the Governance dimension, with statistical significance levels gradually declining across the three dimensions. These results yield two key insights. First, the EPT exerts a significant positive influence across all three ESG dimensions, demonstrating its effectiveness in enhancing firms’ overall sustainability performance and validating its role as an essential tool of market-based environmental governance. Second, the magnitude of the effect varies by dimension: the impact is strongest in the Environmental (E) and Social (S) dimensions, while the Governance (G) dimension exhibits a relatively smaller, indirect response. This pattern is consistent with prior empirical evidence [51,52].
One plausible explanation is that the EPT directly increases the economic cost of pollution, thereby incentivizing firms to adopt green technologies and cleaner production practices, which immediately improve environmental performance. At the same time, firms tend to engage more actively in socially responsible practices—such as improving employee welfare, strengthening community engagement, and enhancing transparency—to align with heightened environmental standards and public expectations. These actions contribute to the improvement in the Social dimension (S), creating a spillover effect from the Environmental dimension (E) to Social practices.
However, it is important to consider whether these improvements in the Social (S) and Governance (G) dimensions are truly substantive changes or if they represent a reporting artifact. In other words, are firms simply increasing their disclosures in these areas to enhance their ESG scores in response to the environmental regulations? Given that the Environmental Protection Tax directly impacts firms’ environmental costs, firms may choose to report more on their social and governance practices to improve their overall ESG scores, even if there are no significant operational changes in these areas.
This raises the question of whether the improvements observed in the Social and Governance dimensions are driven by actual changes in corporate behavior, such as increased investment in social responsibility initiatives or stronger governance mechanisms, or whether they are simply due to enhanced reporting practices prompted by the scrutiny associated with the EPT. If the latter is the case, the observed spillover effect would be more of a reporting change than a substantive operational change. Therefore, future research could further investigate the relationship between enhanced environmental regulation and the actual operational changes versus increased reporting in the Social and Governance dimensions.
In contrast, improvements in the governance dimension occur more gradually, as they are typically mediated through changes in management practices, disclosure mechanisms, and long-term strategic alignment with sustainability goals. These changes are less immediate and often require deeper organizational commitment, which may explain why the impact on the Governance (G) dimension is more modest compared to the Environmental and Social dimensions.

5.2. Analysis of Heterogeneity

5.2.1. Have They Been Audited by the Big Four

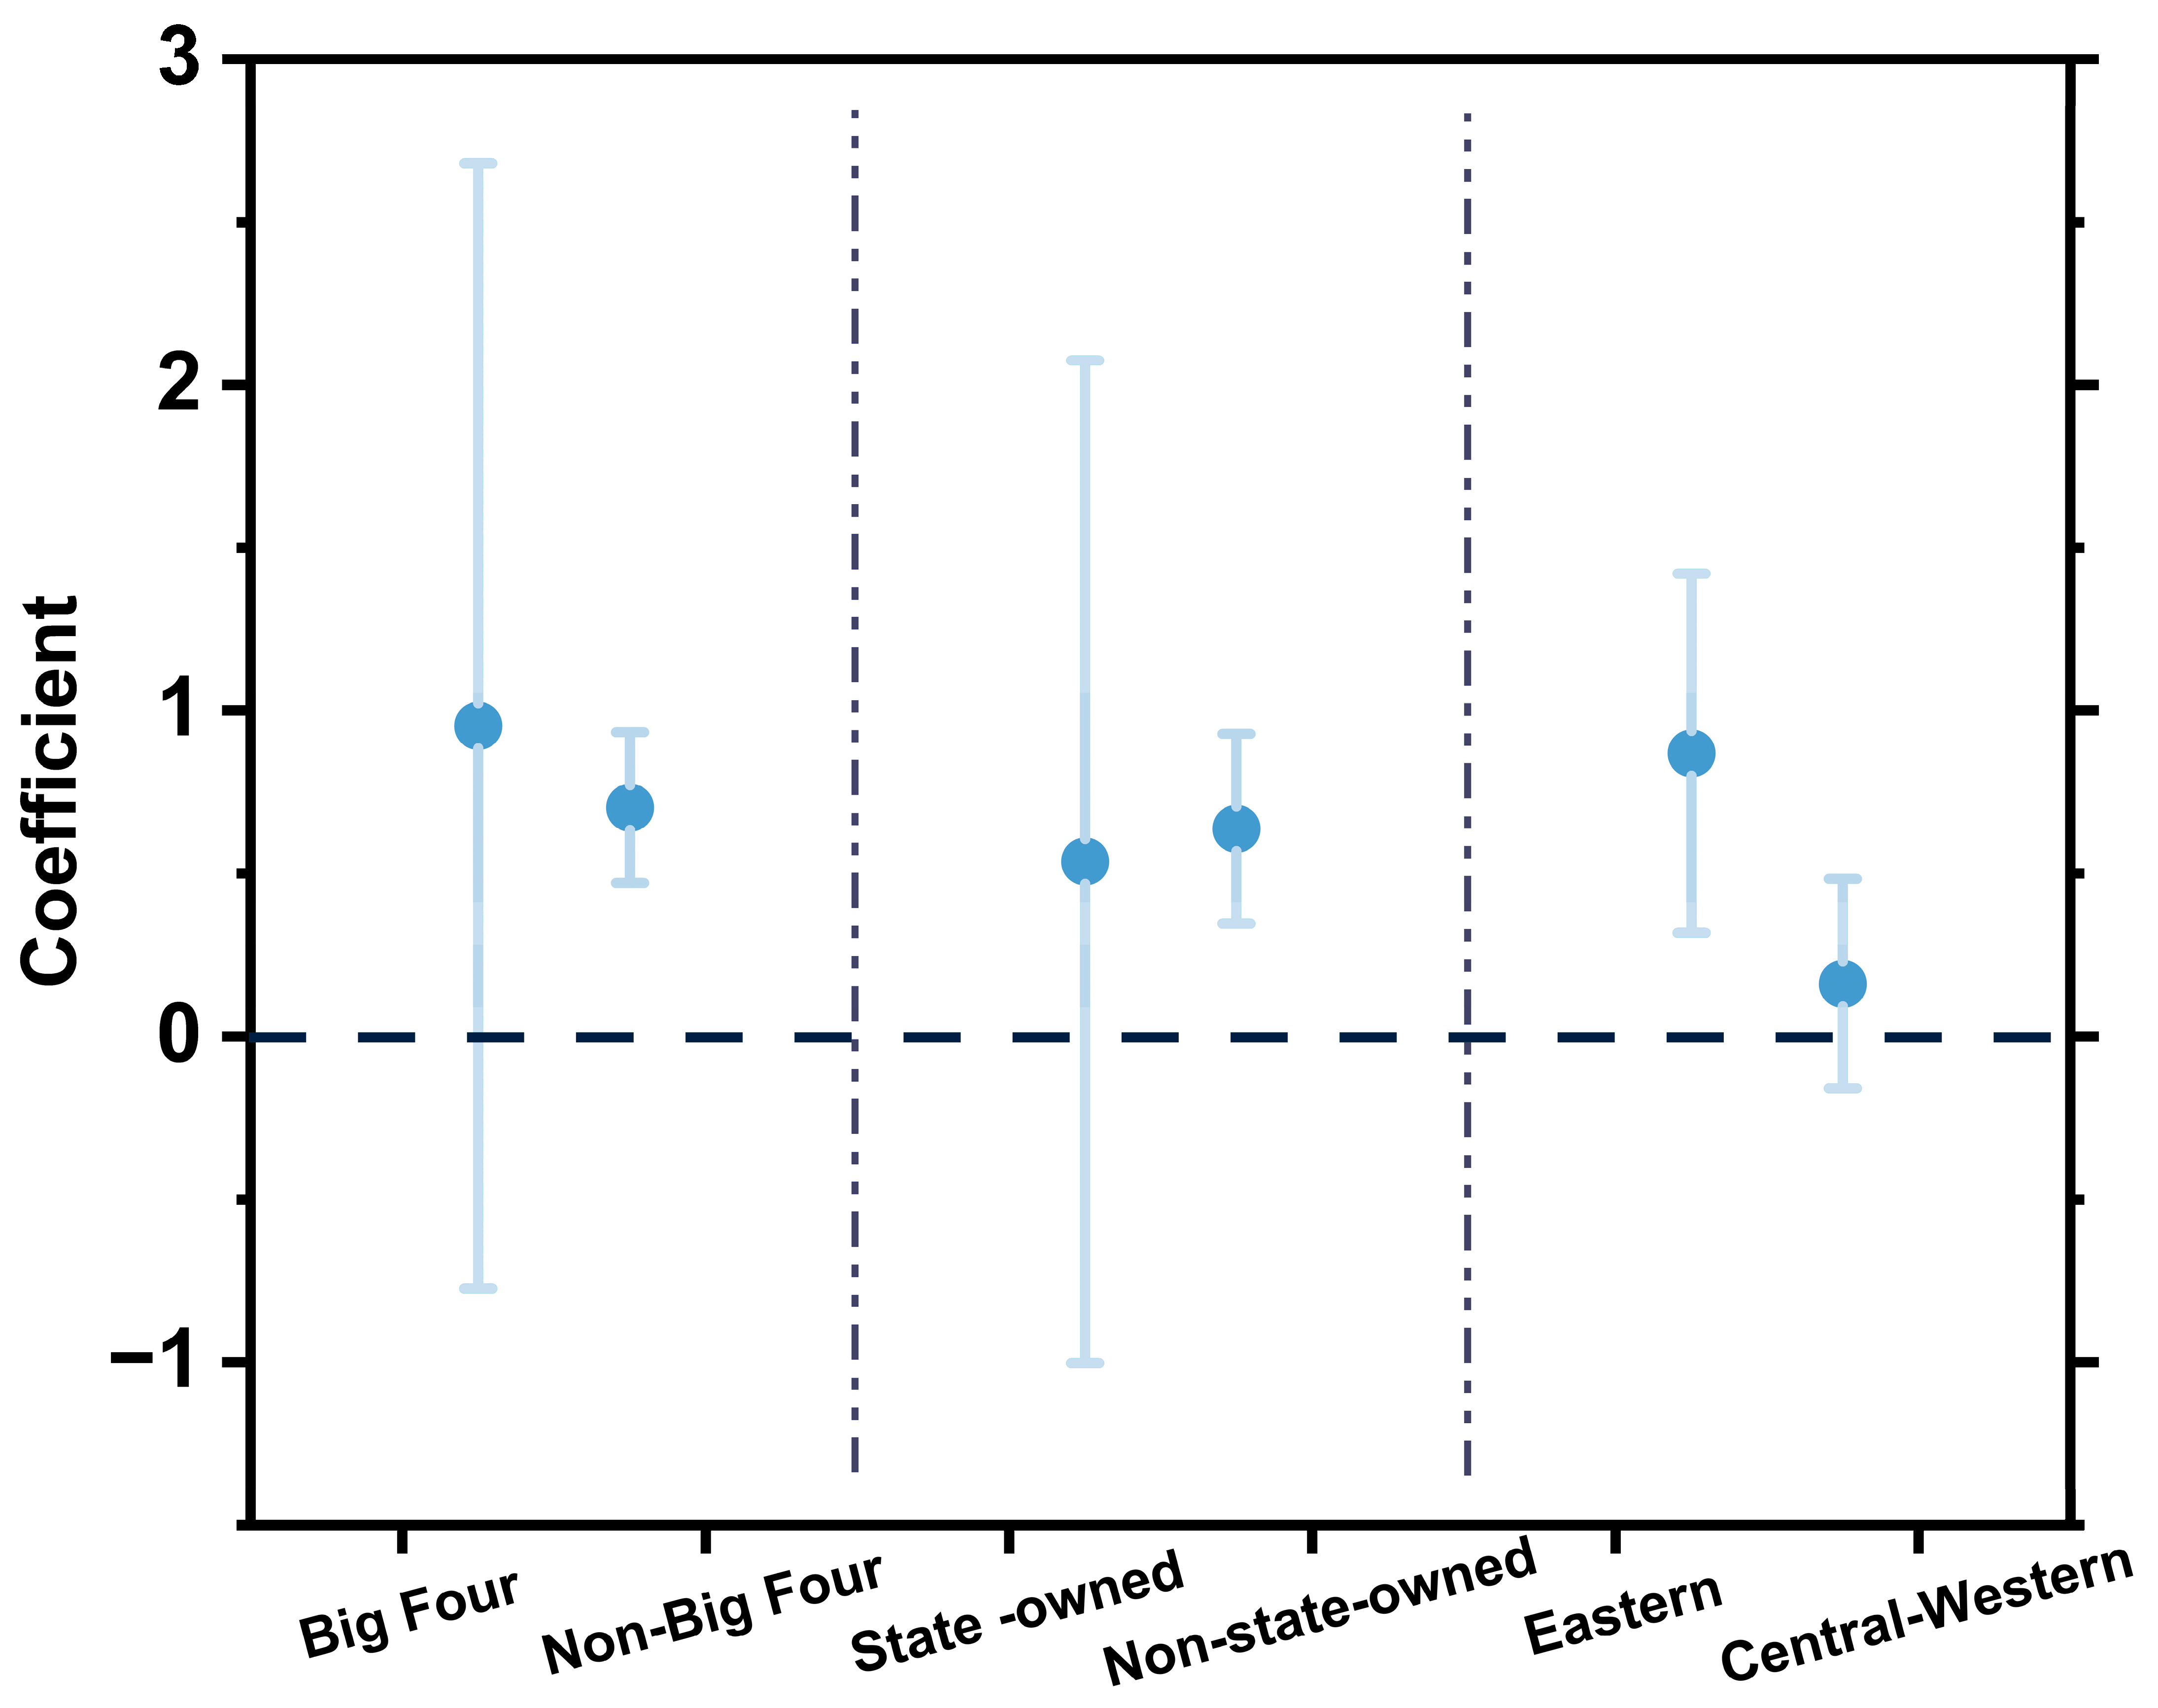
To examine the potential heterogeneity in the effect of market-based environmental regulation on MFESG, this study further differentiates firms based on their audit status—specifically, whether they are audited by one of the Big Four accounting firms. The regression results are presented in Columns (1) and (2) of Table 10. For firms audited by the Big Four, the estimated coefficient of the EPT is 0.9324, but the result is statistically insignificant. In contrast, for firms not audited by the Big Four, the EPT coefficient is 0.7132 and statistically significant, indicating that market-based environmental regulation exerts a stronger positive influence on the ESG performance of firms without Big Four auditing. These findings highlight a clear heterogeneity effect driven by differences in external governance, monitoring intensity, and resource allocation.
For firms not audited by the Big Four, weaker governance structures and lower transparency in information disclosure may limit their internal regulatory capacity. In such cases, the Environmental Protection Tax (EPT) functions as an external disciplinary mechanism, exerting greater pressure to enhance environmental management, fulfill social responsibilities, and improve governance practices. Conversely, firms audited by the Big Four are typically subject to more rigorous external oversight and standardized governance frameworks, resulting in already stable ESG performance levels. Therefore, the marginal impact of market-based environmental regulation on these firms tends to be smaller and less statistically significant.
Moreover, firms audited by the Big Four may already be proficient in ESG reporting (i.e., the content measured by ratings), while the EPT may have forced operational changes in firms not audited by the Big Four. These operational changes, such as improvements in environmental management or social responsibility initiatives, are more likely to be reflected in their ESG ratings after the policy implementation. Therefore, firms not audited by the Big Four may exhibit a stronger response to the EPT, as they are less prepared in terms of reporting or operational transparency compared to firms audited by the Big Four, which may already have stronger reporting capabilities and governance structures in place.

5.2.2. Ownership Type

To further examine the heterogeneity in the effect of market-based environmental regulation, this study classifies firms by ownership type into state-owned enterprises (SOEs) and non-state-owned enterprises (NSOEs). The regression results, presented in Columns (3) and (4) of Table 10, reveal distinct patterns across ownership structures. For SOEs, the coefficient of the EPT is 0.5321, but the effect is not statistically significant. In contrast, for NSOEs, the EPT coefficient is 0.6341 and statistically significant, suggesting that market-based environmental regulation exerts a stronger positive influence on the ESG performance of non-state-owned manufacturing firms. This heterogeneity likely arises from fundamental differences in governance frameworks, incentive structures, and policy dependence between SOEs and NSOEs. State-owned enterprises often operate under strong government oversight and are guided by broader social and political objectives. Consequently, their baseline ESG performance tends to be relatively high even before the implementation of market-based environmental regulations, leaving limited room for marginal improvement. In contrast, non-state-owned enterprises are typically more market-driven and responsive to external economic signals. When confronted with the cost pressures and regulatory incentives introduced by the EPT, NSOEs are more likely to optimize production processes, invest in green technologies, and enhance ESG performance to mitigate compliance costs and strengthen competitiveness. Hence, the incentive effect of market-based environmental regulation is more pronounced among non-state-owned firms, underscoring their greater sensitivity to policy-induced market mechanisms.

5.2.3. Geographical Location

Given the pronounced regional disparities in resource endowment, infrastructure development, and economic capacity, this study conducts a heterogeneity analysis based on geographical location. Following the classification criteria of the National Bureau of Statistics, the sample is divided into eastern and central-western regions. The regression results, presented in Columns (5) and (6) of Table 10, reveal substantial variation across regions. Specifically, the coefficient of the EPT for the eastern region is 0.8312 and statistically significant, whereas the coefficient for the central-western region is 0.1313 and insignificant. These findings indicate that market-based environmental regulation exerts a stronger positive effect on the MFESG in the eastern region than in the central-western region. This heterogeneity can be attributed to structural differences in economic development, institutional environments, and policy enforcement capacity between the two regions. The eastern region, characterized by higher levels of industrialization, stronger financial markets, and more advanced technological infrastructure, provides firms with the resources and incentives necessary to actively respond to market-based environmental regulation. Consequently, firms in this region are better positioned to enhance their ESG performance through green technological innovation, resource optimization, and improved governance practices. Moreover, the implementation and monitoring of environmental policies tend to be more rigorous in the eastern region, amplifying the effectiveness of the EPT. In contrast, firms in the central-western region, where economic conditions and industrial bases are relatively weaker, often face resource and financing constraints that limit their ability to invest in environmental management and innovation. As a result, the marginal impact of the EPT is less pronounced, reflecting both regional economic disparities and institutional capacity differences in environmental governance.
Figure 5 illustrates the estimated coefficients of the key explanatory variables along with their 95% confidence intervals. Control variables and fixed effects are included in all regressions but omitted from the figure for clarity. The horizontal zero line serves as a reference to assess the statistical significance and direction of the effects. Variables whose confidence intervals do not cross zero demonstrate statistically significant effects, while those crossing zero indicate statistically insignificant relationships. This visualization helps to more intuitively compare the relative magnitude and significance of the estimated effects.
Although the heterogeneity analysis involves multiple subgroup comparisons, which may theoretically increase the family-wise error rate, the estimated effects remain consistent in direction and economic significance across groups. Therefore, the core conclusions of this study are not affected.

5.2.4. Discussion of Heterogeneity Results

This study finds that the impact of the Environmental Protection Tax (EPT) on firms’ ESG performance varies significantly across ownership types and regions. These differences are not merely attributable to firm-level characteristics, but rather stem from systematic disparities in institutional constraints, market structures, and local governance capacities. First, the ownership-based heterogeneity reflects the distinct “binding strength” of policy mandates. State-owned enterprises (SOEs) carry stronger policy-oriented objectives and are subject to mandatory expectations regarding environmental and social responsibility. Even in the absence of strong external incentives, they must maintain relatively high ESG standards, which limits the marginal improvement that EPT can induce. In contrast, non-state-owned enterprises (non-SOEs) are more sensitive to market incentives and external supervision. When the EPT increases the economic cost of pollution and enhances monitoring pressures, non-SOEs are more motivated to adjust their ESG strategies in order to reduce regulatory compliance costs, enhance corporate reputation, attract capital, and improve competitive positioning. Thus, the EPT acts primarily as a behavioral incentive mechanism for non-SOEs, whereas for SOEs it functions more as a compliance reinforcement mechanism. Second, the regional heterogeneity indicates the presence of “institutional transmission frictions.” Eastern regions generally possess more mature market governance systems, richer green finance resources, stronger technological absorption capacity, and higher levels of social supervision. These conditions enable the EPT to influence corporate ESG performance through a relatively complete process involving regulatory pressure, reputational improvement, enhanced financing access, increased sustainability-oriented investment, and ultimately ESG enhancement. In contrast, central and western regions often exhibit weaker environmental regulatory capacity, limited green financial support, and potential misalignment between environmental protection objectives and local fiscal or growth incentives. As a result, policy effects may weaken, distort, or fail to fully translate into ESG improvements. Taken together, these heterogeneity patterns lead to a broader structural implication: The effectiveness of environmental regulation depends not solely on the design of the regulatory instrument itself, but on its degree of alignment with regional governance capacity, financial resource conditions, and firms’ internal governance foundations.
Moreover, these findings also suggest the value of situating China’s EPT experience within a broader international policy context. Many countries have transitioned from pollution discharge fee systems to environmental taxation, yet have faced similar challenges related to uneven local regulatory capacity, market structure disparities, and variation in firms’ governance mechanisms. Compared with these cases, China’s EPT features flexible rate adjustment mechanisms, clearer pollutant classifications, and stronger integration with local environmental monitoring and public disclosure systems. These institutional arrangements may provide practical insights for other emerging economies seeking to design environmental tax systems that effectively balance regulatory enforcement with market incentives. In particular, the Chinese experience highlights that the success of environmental taxation depends not only on tax rate design but also on the extent to which fiscal instruments are coordinated with local governance capabilities, financial resource allocation, and enterprise-level sustainability incentives.

6. Conclusions and Policy Recommendations

6.1. Conclusions

In 2018, China officially enacted and implemented its first Environmental Protection Tax Law, marking a critical milestone in the institutionalization and legalization of the nation’s environmental governance framework. By employing tax-based instruments to regulate corporate environmental behavior, this law represents a quintessential example of market-based environmental regulation, aligning economic incentives with ecological objectives. In this study, the implementation of the Environmental Protection Tax (EPT) is treated as an exogenous policy event representing market-based environmental regulation. Using unbalanced panel data from 2,677 manufacturing firms between 2010 and 2022, the analysis systematically investigates the effect of the EPT on manufacturing firms’ ESG performance, with a particular focus on the mediating roles of financing constraints and green innovation. The empirical findings yield several key insights. First, market-based environmental regulation significantly enhances the ESG performance of manufacturing firms. This conclusion remains robust after a comprehensive series of validation procedures—including parallel trend tests, robustness checks, PSM estimation, and the exclusion of competing policy effects—demonstrating both reliability and consistency. Second, such regulation exerts both direct and indirect effects on firms’ ESG outcomes. The direct impact manifests through strengthened environmental management and social responsibility, while the indirect pathways operate via the alleviation of financing constraints and the stimulation of green innovation, thereby revealing the internal mechanisms through which fiscal policy instruments promote sustainable corporate transformation. Third, disaggregated analysis across the three ESG dimensions indicates that the EPT significantly improves firms’ Environmental (E), Social (S), and Governance (G) performance, with particularly strong effects in the environmental and social dimensions. This suggests that the EPT’s economic incentives primarily drive environmental investment, pollution control, and social responsibility initiatives, while governance improvements emerge more gradually. Fourth, the effects of the EPT exhibit substantial heterogeneity across ownership types and regions. Non–state-owned enterprises, firms audited by non–Big Four auditors, and firms located in eastern regions experience stronger ESG improvements, highlighting that corporate governance quality, ownership structure, and regional economic development jointly influence how firms respond to market-based environmental regulation. Overall, this study provides robust empirical evidence supporting the effectiveness of China’s EPT in fostering sustainable industrial transformation. It demonstrates that market-based environmental regulation can serve not only as a constraint but also as an incentive for firms to enhance their long-term sustainability performance.
In terms of academic contribution, this paper advances existing research in three important ways. (1) It provides credible causal evidence of how market-based environmental regulation influences ESG performance within a developing economy context, enriching the literature that has long been dominated by cross-sectional or correlation-based analyses. (2) It reveals the dual mechanisms—relaxation of financing constraints and promotion of green innovation—through which fiscal environmental instruments shape firm-level sustainability, thereby reconciling previous theoretical inconsistencies regarding whether regulation promotes or suppresses sustainable investment. (3) It identifies the institutional and market boundary conditions that determine the differential effectiveness of environmental regulation, offering a new analytical framework for understanding the interaction between policy design, corporate governance, and regional institutional capacity.

6.2. Policy Recommendations

Drawing on the empirical evidence presented in this study, the following policy recommendations are proposed to enhance the effectiveness of market-based environmental regulation and accelerate the sustainable transformation of the manufacturing sector.
To strengthen the incentive effect of the Environmental Protection Tax, it is essential to ensure that EPT revenue is earmarked for environmental purposes rather than absorbed into general fiscal budgets. Specifically, governments may establish specialized green transformation funds that channel EPT revenue into areas such as green technology R&D, pollution control facilities, and clean production upgrades. Enhancing coordination between tax authorities and environmental regulators can help improve the transparency and efficiency of EPT administration. Meanwhile, the adoption of digital environmental monitoring and cross-agency data sharing systems can reduce information asymmetry, curb tax evasion, and reinforce both the disciplinary and incentive functions of regulation. Additionally, through policy guidance, training programs, and industry benchmarking, firms can achieve a clearer understanding of regulatory expectations and strategically integrate environmental responsibility into their development agendas.
To amplify the regulatory effect of the EPT, fiscal and financial instruments should be jointly leveraged. Financial institutions are encouraged to incorporate firms’ EPT compliance records and ESG performance into credit evaluation systems, granting compliant firms preferential loan interest rates, extended credit lines, or collateral flexibility. Meanwhile, the expansion of green financial instruments—including green bonds, sustainability-linked loans, and environmental liability insurance—can attract institutional and private capital toward green industries. Complementary policy tools such as R&D subsidies, tax deductions for environmental investment, and green technology transfer incentives can further reduce the cost of green innovation. Notably, targeted support should be provided to small and medium-sized enterprises (SMEs) that face pronounced financing constraints. Establishing green credit guarantee mechanisms and dedicated green SME funds would lower funding barriers and broaden SME participation in green upgrading.
To achieve comprehensive improvements across Environmental (E), Social (S), and Governance (G) dimensions, policy design should emphasize both pressure and incentive mechanisms. In the Environmental dimension, regulatory authorities should continue strengthening supervision of high-pollution industries while providing rewards—such as tax credits or public recognition—for firms achieving substantial emission reduction or completing green transformation. Coordinating the EPT with carbon emissions trading and pollutant discharge trading schemes can form a multi-layered market-based regulation system that drives continuous improvement in clean production. In the Social dimension, recognizing the positive spillover effects of the EPT on corporate social behaviors, policymakers may introduce CSR rating incentives, procurement preferences, or public recognition programs to encourage firms to invest in employee welfare, community engagement, and responsible supply chain management. In the Governance dimension, improving environmental information disclosure standards, external auditing, and ESG performance evaluation systems remains essential. Linking firms’ EPT compliance records to credit assessments, financing opportunities, and qualification for government support programs can strengthen the alignment between regulatory compliance and corporate governance enhancement.

Author Contributions

Conceptualization, W.Z. and S.Z.; methodology, W.Z.; software, W.Z.; validation, W.Z. and S.Z.; formal analysis, W.Z.; investigation, W.Z.; resources, W.Z.; data curation, W.Z.; writing—original draft preparation, W.Z.; writing—review and editing, W.Z.; visualization, W.Z.; supervision, W.Z.; project administration, W.Z.; funding acquisition, S.Z. All authors have read and agreed to the published version of the manuscript.

Funding

This research was funded by the Heilongjiang Provincial Philosophy and Social Science Research Planning Project, grant number 21JYE396. The APC was funded by the same project.

Data Availability Statement

The financial and corporate governance data used in this study are obtained from the CSMAR database, and the ESG ratings originate from the Wind–Sino-Securities ESG Rating System. Information related to the implementation of the Environmental Protection Tax (EPT) is compiled based on the Environmental Protection Tax Law and relevant regulatory documents. Due to licensing restrictions associated with commercial databases, the raw data cannot be made publicly available. However, detailed descriptions of variable construction, data processing procedures, and empirical model specifications are provided in the manuscript. To further enhance reproducibility, we have prepared a complete variable dictionary and the core Stata code used for empirical analysis. Upon acceptance of the manuscript, these materials will be uploaded and made publicly accessible via the data repository required or recommended by the journal for verification and academic reuse.

Conflicts of Interest

The authors declare no conflict of interest.

Appendix A. Comparison of Sewage Fee and Environmental Tax by Province in China

Table A1. Comparison of Sewage Fee and Environmental Tax by Province in China.
ProvinceAtmospheric PollutantsWater Pollutants
Sewage FeeEnvironmental Protection TaxSewage FeeEnvironmental Protection Tax
BeijingSulfur dioxide,
nitrogen oxides
10
12COD 10, ammonia
nitrogen 12
14
TianjinSulfur dioxide
6.30, nitrogen
oxides 8.50
10COD 7.50, ammonia
nitrogen 9.50
12
Hebei2.4Primary pollutant 9.6 and other pollutants 4.8; Secondary pollutant 6 and other pollutants 4.8; Tertiary pollutant 4.82.8Primary pollutant 9.6 and other
pollutants 4.8; Secondary pollutant 6 and other pollutants 4.8; Tertiary pollutant 4.8
ShanghaiSulfur dioxide,
nitrogen oxides 4
2018: Sulfur dioxide 6.65, nitrogen oxides 7.6, other pollutants 1.2; 2019:COD, ammonia 3COD, ammonia nitrogen 4.8, Class I water pollutants 1.4, others 1.4
ShandongSulfur dioxide,
nitrogen oxides 6,
other 1.2
Sulfur dioxide, nitrogen oxides 6, other
pollutants 1.2
COD, ammonia nitrogen
and five heavy metals 1.4
COD, ammonia nitrogen and five heavy metals3, other pollutants 1.4
Jiangsu3.6Nanjing 8.4, Wuxi, Changzhou, Suzhou, Zhenjiang 6, other areas 4.84.2Nanjing 8.4, Wuxi, Changzhou, Suzhou,
Zhenjiang 7, other areas 5.6
Zhejiang1.2Four heavy metal pollutants 1.8, other pollutants 1.21.4Five heavy metals, COD and ammonia nitrogen 1.8, other pollutants 1.4
Sichuan1.23.91.42.8
Shanxi1.21.81.42.1
Hunan1.22.41.43
Henan1.24.81.45.6
Guizhou, Hainan1.22.41.42.8
Guangdong, Guangxi1.21.81.42.8
Tibet0.61.20.71.4
Chongqing1.22018–2020: 2.4, 2021: 3.51.42018–2020: 3, 2021: 3
Fujian1.21.21.4Five heavy metals, COD and ammonia nitrogen 1.5, other pollutants 1.4
Hubei2.4Sulfur dioxide, nitrogen oxides 2.4,
other pollutants 1.2
2.8Five heavy metals, COD, total phosphorus,
ammonia nitrogen 2.8, other pollutants 1.4
Anhui1.21.2Five heavy metals, COD and ammonia nitrogen
1.4
1.4
Heilongjiang, Liaoning, Jilin, Jiangxi, Gansu, Qinghai, Shaanxi, Ningxia, Xinjiang1.21.21.41.4
Yunnan1.22018: 1.2, 2019: 2.81.42018: 1.4, 2019: 3.5
Inner MongoliaSulfur dioxide,
nitrogen oxides
1.2
2018: 1.2, 2019: 1.8, 2020: 2.41.42018: 1.4, 2019: 3.5
Note: The data comes from the official websites of local governments.

References

  1. Zhang, C.; Fang, J.; Ge, S.; Sun, G. Research on the Impact of Enterprise Digital Transformation on Carbon Emissions in the Manufacturing Industry. Int. Rev. Econ. Financ. 2024, 92, 211–227. [Google Scholar] [CrossRef]
  2. Zhao, S.; Zhang, L.; Peng, L.; Zhou, H.; Hu, F. Enterprise Pollution Reduction through Digital Transformation? Evidence from Chinese Manufacturing Enterprises. Technol. Soc. 2024, 77, 102520. [Google Scholar] [CrossRef]
  3. Wang, Z.; Chu, E. Shifting Focus from End-of-Pipe Treatment to Source Control: ESG Ratings’ Impact on Corporate Green Innovation. J. Environ. Manag. 2024, 354, 120409. [Google Scholar] [CrossRef]
  4. Li, Y.; Zhu, C. Regional Digitalization and Corporate ESG Performance. J. Clean. Prod. 2024, 473, 143503. [Google Scholar] [CrossRef]
  5. Lin, Y.; Li, S. Supply Chain Resilience, ESG Performance, and Corporate Growth. Int. Rev. Econ. Financ. 2025, 97, 103763. [Google Scholar] [CrossRef]
  6. Bai, F.; Shang, M.; Huang, Y. Corporate Culture and ESG Performance: Empirical Evidence from China. J. Clean. Prod. 2024, 437, 140732. [Google Scholar] [CrossRef]
  7. Bin-Feng, C.; Mirza, S.S.; Ahsan, T.; Qureshi, M.A. How Uncertainty Can Determine Corporate ESG Performance? Corp. Soc. Responsib. Environ. Manag. 2024, 31, 2290–2310. [Google Scholar] [CrossRef]
  8. Jiang, Y.; Klein, T.; Ren, Y.-S.; Duong, D. Global Geopolitical Risk and Corporate ESG Performance. J. Environ. Manag. 2024, 370, 122481. [Google Scholar] [CrossRef]
  9. He, F.; Guo, X.; Yue, P. Media Coverage and Corporate ESG Performance: Evidence from China. Int. Rev. Financ. Anal. 2024, 91, 103003. [Google Scholar] [CrossRef]
  10. Zhang, Z.; Zhang, L. Investor Attention and Corporate ESG Performance. Financ. Res. Lett. 2024, 60, 104887. [Google Scholar] [CrossRef]
  11. Hu, H.; Jia, Z.; Yang, S. Exploring FinTech, Green Finance, and ESG Performance across Corporate Life-Cycles. Int. Rev. Financ. Anal. 2025, 97, 103871. [Google Scholar] [CrossRef]
  12. Xue, Q.; Wang, H.; Bai, C. Local Green Finance Policies and Corporate ESG Performance. Int. Rev. Financ. 2023, 23, 721–749. [Google Scholar] [CrossRef]
  13. Han, L.; Shi, Y.; Zheng, J. Can Green Credit Policies Improve Corporate ESG Performance? Sustain. Dev. 2024, 32, 2678–2699. [Google Scholar] [CrossRef]
  14. Zhou, C.; Richardson-Barlow, C.; Fan, L.; Cai, H.; Zhang, W.; Zhang, Z. Towards Organic Collaborative Governance for a More Sustainable Environment. J. Environ. Manag. 2025, 373, 123765. [Google Scholar] [CrossRef] [PubMed]
  15. Wu, X.; Sun, X. Environmental Protection Tax and Green Low-Carbon Development. Financ. Res. Lett. 2025, 86, 108366. [Google Scholar] [CrossRef]
  16. Duan, Y.; Rahbarimanesh, A. The Impact of Environmental Protection Tax on Green Innovation of Heavily Polluting Enterprises in China: A Mediating Role Based on ESG Performance. Sustainability 2024, 16, 7509. [Google Scholar] [CrossRef]
  17. Cheng, Z.; Chen, X.; Wen, H. How Does Environmental Protection Tax Affect Corporate Environmental Investment? Sustainability 2022, 14, 2932. [Google Scholar] [CrossRef]
  18. Pigou, A. The Economics of Welfare; Routledge: New York, NY, USA, 2017. [Google Scholar]
  19. Wang, J.; Zhang, S. Environmental Protection Tax, Green Innovation, and ESG Performance. Financ. Res. Lett. 2024, 65, 105592. [Google Scholar] [CrossRef]
  20. Zhong, S.; Zhou, Z.; Jin, D. Impact of Environmental Protection Tax on Carbon Intensity in China. Environ. Sci. Pollut. Res. 2024, 31, 29695–29718. [Google Scholar] [CrossRef]
  21. He, X.; Jing, Q.; Chen, H. The Impact of Environmental Tax Laws on Heavy-Polluting Enterprise ESG Performance. J. Environ. Manag. 2023, 344, 118578. [Google Scholar] [CrossRef]
  22. Zhu, H.; Li, X. Can Green Finance Improve Corporate ESG Performance? Empirical evidence from Chinese A-share listed companies. Asia-Pac. J. Account. Econ. 2025, 32, 590–607. [Google Scholar] [CrossRef]
  23. Yu, C.-H.; Wu, X.; Zhang, D.; Chen, S.; Zhao, J. Demand for Green Finance. Energy Policy 2021, 153, 112255. [Google Scholar] [CrossRef]
  24. Chen, Y.; Ren, Y.-S.; Narayan, S.; Huynh, N.Q.A. Does Climate Risk Impact ESG Performance? Econ. Anal. Policy 2024, 81, 683–695. [Google Scholar] [CrossRef]
  25. Sethi, L.; Behera, B.; Sethi, N. Do Green Finance and Green Technology Innovation Improve Sustainability? Sustain. Dev. 2024, 32, 2709–2723. [Google Scholar] [CrossRef]
  26. Porter, M.E.; van der Linde, C. Toward a New Conception of the Environment–Competitiveness Relationship. J. Econ. Perspect. 1995, 9, 97–118. [Google Scholar] [CrossRef]
  27. Zhong, S.; Zhou, Z.; Gao, W. Impact of Regional Finance Reform and Innovation Policies on Green Innovation in Pilot Cities. Econ. Anal. Policy 2025, 85, 888–911. [Google Scholar] [CrossRef]
  28. Baker, A.C.; Larcker, D.F.; Wang, C.C.Y. Staggered Difference-in-Differences Estimates. J. Financ. Econ. 2022, 144, 370–395. [Google Scholar] [CrossRef]
  29. Card, D.; Krueger, A.B. Minimum Wages and Employment. Am. Econ. Rev. 1994, 84, 772–793. [Google Scholar]
  30. Imbens, G.W.; Wooldridge, J.M. Recent Developments in Program Evaluation. J. Econ. Lit. 2009, 47, 5–86. [Google Scholar] [CrossRef]
  31. Beck, T.; Levine, R.; Levkov, A. Bank Deregulation in the United States. J. Financ. 2010, 65, 1637–1667. [Google Scholar] [CrossRef]
  32. Baron, R.M.; Kenny, D.A. The Moderator–Mediator Variable Distinction. J. Personal. Soc. Psychol. 1986, 51, 1173–1182. [Google Scholar] [CrossRef]
  33. Zhou, Z.; Zhong, S.; Gao, W. Impact of Legal Commitments on Carbon Intensity. J. Environ. Manag. 2025, 373, 123696. [Google Scholar] [CrossRef] [PubMed]
  34. Cai, C.; Tu, Y.; Li, Z. Enterprise Digital Transformation and ESG Performance. Financ. Res. Lett. 2023, 58, 104692. [Google Scholar] [CrossRef]
  35. Gao, J.; Hua, G.; Huo, B. Green Finance Policies, Financing Constraints and ESG Performance. Oper. Manag. Res. 2024, 17, 1345–1359. [Google Scholar] [CrossRef]
  36. Tu, Z.; Cao, Y.; Goh, M.; Wang, Y. Executive Green Cognition and ESG Performance. Financ. Res. Lett. 2024, 69, 106271. [Google Scholar] [CrossRef]
  37. Fazzari, S.M.; Hubbard, R.G.; Petersen, B.C. Financing Constraints and Corporate Investment; Brookings Papers on Economic Activity; National Bureau of Economic Research: Cambridge, MA, USA, 1988; pp. 141–206. [Google Scholar]
  38. Kaplan, S.N.; Zingales, L. Investment–Cash Flow Sensitivities. Q. J. Econ. 1997, 112, 169–215. [Google Scholar] [CrossRef]
  39. Cleary, S. Firm Investment and Financial Status. J. Financ. 1999, 54, 673–692. [Google Scholar] [CrossRef]
  40. Whited, T.M.; Wu, G. Financial Constraints Risk. Rev. Financ. Stud. 2006, 19, 531–559. [Google Scholar] [CrossRef]
  41. Li, P.; Lu, Y.; Wang, J. Does Flattening Government Improve Economic Performance? J. Dev. Econ. 2016, 123, 18–37. [Google Scholar] [CrossRef]
  42. Guo, Q.; Zhong, J. Smart City Construction Policies. Technol. Forecast. Soc. Change 2022, 184, 122003. [Google Scholar] [CrossRef]
  43. Callaway, B.; Sant’Anna, P.H.C. Difference-in-Differences with Multiple Time Periods. J. Econom. 2021, 225, 200–230. [Google Scholar] [CrossRef]
  44. La Ferrara, E.; Chong, A.; Duryea, S. Soap Operas and Fertility: Evidence from Brazil. Am. Econ. J. Appl. Econ. 2012, 4, 1–31. [Google Scholar] [CrossRef]
  45. Dehejia, R.H.; Wahba, S. Causal Effects in Nonexperimental Studies. J. Am. Stat. Assoc. 1999, 94, 1053–1062. [Google Scholar] [CrossRef]
  46. Lyu, C.; Xie, Z.; Li, Z. Environmental Pollution Liability Insurance. Energy Policy 2022, 171, 113267. [Google Scholar] [CrossRef]
  47. Rosenbaum, P.R.; Rubin, D.B. Propensity Score in Observational Studies. Biometrika 1983, 70, 41–55. [Google Scholar] [CrossRef]
  48. Oster, E. Unobservable Selection and Coefficient Stability: Theory and Evidence. J. Bus. Econ. Stat. 2019, 37, 187–204. [Google Scholar] [CrossRef]
  49. Dantas, M.; Merkley, K.J.; Silva, F.B.G. Government Guarantees and Banks’ Income Smoothing. J. Financ. Serv. Res. 2023, 63, 123–173. [Google Scholar] [CrossRef]
  50. Imai, K.; Keele, L.; Tingley, D. Causal Mediation Analysis. Psychol. Methods 2010, 15, 309–334. [Google Scholar] [CrossRef] [PubMed]
  51. Zhang, Y.; He, Y. Green Financial System and ESG. Energy Econ. 2024, 130, 107287. [Google Scholar] [CrossRef]
  52. Ma, D.; He, Y.; Zeng, L. Can Green Finance Improve ESG Performance? Evidence from green credit policy in China. Energy Econ. 2024, 137, 107772. [Google Scholar] [CrossRef]
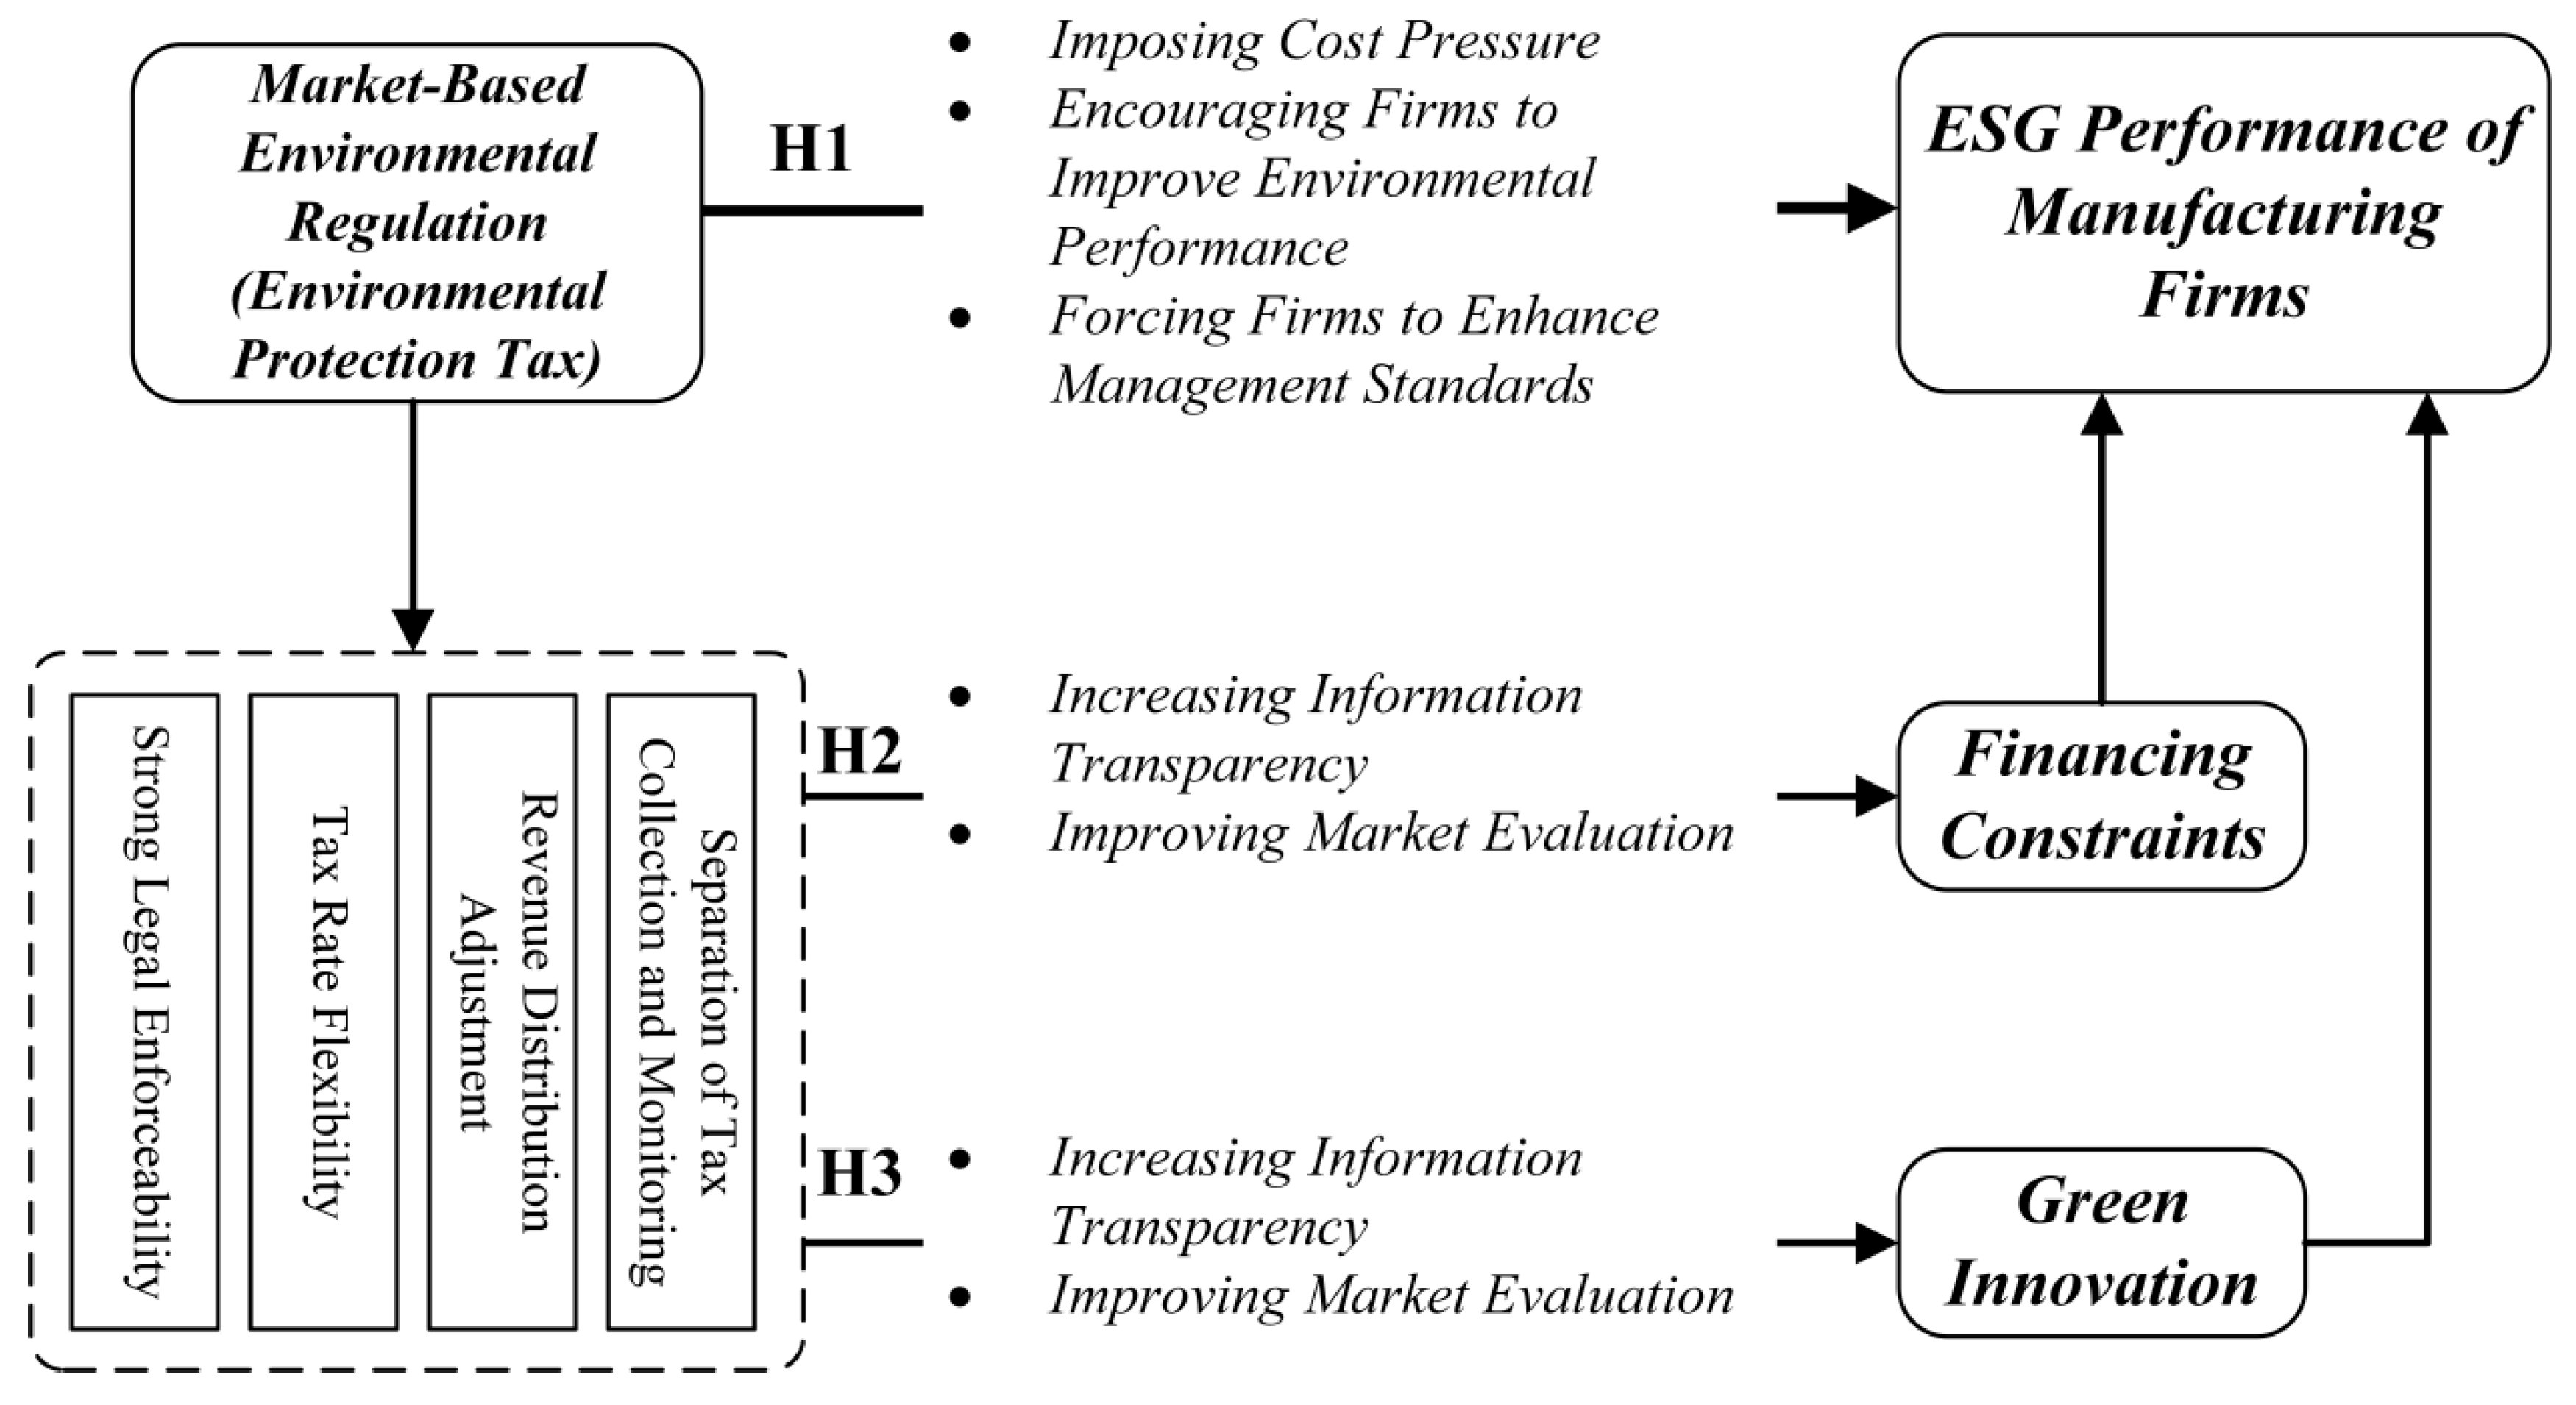
Figure 1. Theoretical mechanism.
Sustainability 17 10516 g001
Figure 2. Parallel trend test results (base period is −1).
Sustainability 17 10516 g002
Figure 3. Placebo test results.
Sustainability 17 10516 g003
Figure 4. Balance test results.
Sustainability 17 10516 g004
Figure 5. Coefficient Estimates with 95% Confidence Intervals.
Sustainability 17 10516 g005
Table 2. Descriptive statistics.
VariableNMeanSDMinMaxData Sources
MFESG20,97173.194.57359.6083.40Listed Company ESG Rating Database
EPT20,9710.4450.49701China Government Website
SIZE20,97122.011.16919.9825.60CSMAR Database
LEV20,9710.3830.1940.05500.864
ROA20,9710.04900.0620−0.1690.214
CF20,9710.04900.0660−0.1340.228
GROW20,9710.1680.331−0.4641.740
TOP520,9710.5370.1490.2120.864
DUAL20,9710.3200.46701
FIXED20,9710.2160.1320.01500.611
FA20,9712.8830.3331.7923.497
WW17,622−1.0120.0670−1.198−0.863
GI20,9710.3330.69403.296
Table 3. Results of the benchmark regression analysis.
(1)(2)(3)(4)
MFESGMFESGMFESGMFESG
EPT0.7828 ***0.6882 ***0.6767 ***0.6549 ***
(3.7335)(3.7628)(3.9901)(3.9552)
SIZE 1.1210 ***1.1122 ***1.1331 ***
(13.1536)(12.9568)(12.5546)
LEV −4.8142 ***−4.2876 ***−4.1724 ***
(−11.8485)(−10.4631)(−10.0047)
ROA 12.7801 ***13.8259 ***13.9686 ***
(13.2847)(14.2506)(13.0752)
CF −1.0190−1.0989 *
(−1.5372)(−1.9117)
GROW −0.8989 ***−0.9617 ***
(−6.7147)(−7.4598)
TOP5 2.4346 ***2.1317 ***
(7.2230)(6.0235)
DUAL 0.0433
(0.4655)
FIXED 0.4588
(0.5800)
FA −0.8059 ***
(−3.7618)
_cons72.8440 ***49.4258 ***48.2679 ***50.1513 ***
(781.1409)(27.1311)(27.4379)(28.1933)
Year FEYESYESYESYES
Stkcd FEYESYESYESYES
Province#Year FEYESYESYESYES
N20963209622095720957
R20.07020.18380.19280.1954
t statistics in parentheses * p < 0.1, *** p < 0.01; This study employs two-way clustering at the firm level and the province level. Note: The following table adopts the same format.
Table 4. Test of robustness I.
(1)(2)(3)(4)
PSM-DIDSmartBBCInnovation
EPT0.6599 ***0.7819 ***1.0240 ***0.6034 ***
(3.9912)(3.2991)(3.7751)(4.0494)
ControlsYESYESYESYES
Year FEYESYESYESYES
Stkcd FEYESYESYESYES
Province#Year FEYESYESYESYES
N17,72712,44865716736
R20.19600.21090.21590.2508
t statistics in parentheses *** p < 0.01.
Table 5. Robustness Test II.
(1)(2)(3)(4)(5)
MFESG_Hua ZhengMFESGShorten the Sample IntervalWild-Cluster BootstrapESG_z (Industry–Year Standardized
EPT0.1387 *** 0.7703 ***0.6549 ***0.141 **
(3.8327) (3.4342)(2.9826)(2.1153)
EPT_a 0.1352 ***
(3.2712)
ControlsYESYESYESYESYES
Year FEYESYESYESYESYES
Stkcd FEYESYESYESYESYES
Province#Year FEYESYESYESYESYES
N2095720957136242095720957
R20.18080.19410.16750.19540.3172
t statistics in parentheses ** p < 0.05, *** p < 0.01.
Table 6. Robustness to Omitted Variable Bias: Oster (2019) Parametric Bounds Analysis.
ModelFixed Effects IncludedCoefficient on EPTR2Rmaxδ (Relative Strength of Unobserved Selection)Interpretation
(1) Baseline OLSNone0.4210.071
(2) Main DID ModelYear + Industry FE0.6550.194Main estimated effect
(3) Oster Bound (Rmax = 1.3R2)Same as (2)0.6180.194 → 0.2520.252δ = 2.87Effect remains positive; robust to omitted variables
(4) Oster Bound (Rmax = 2R2)Same as (2)0.6010.194 → 0.3880.388δ = 3.94Stronger robustness under more conservative bound
Table 7. Results of the mechanistic analysis.
(1)(2)(3)(4)(5)(6)(7)(8)
MFESGWWMFESGGIMFESGESG
EPT0.6579 ***−0.0020 ***0.7514 ***0.0911 **0.5998 ***0.7524 **0.6181 **0.4986 *
(3.9552)(−3.6180)(4.0873)(2.3468)(3.6483)(2.5668)(2.2165)(1.9846)
WW −0.6126 ***
(−3.1234)
GI 0.6376 ***0.9751 ***0.8621 ***0.3272 **
(5.6318)(6.7667)(5.5078)(2.4141)
ControlsYESYESYESYESYESYESYESYES
Year FEYESYESYESYESYESYESYESYES
Stkcd FEYESYESYESYESYESYESYESYES
Province#Year FEYESYESYESYESYESYESYESYES
N2095717614176142095720957209572095720957
R20.19540.87660.21450.17910.20300.24470.20270.2227
Sobel Z 3.125 *** 2.984 *** 2.137 **3.218 ***2.129 **
t statistics in parentheses * p < 0.1, ** p < 0.05, *** p < 0.01.
Table 8. Causal Mediation Analysis Based on the Imai–Keele–Tingley Framework (Bootstrap = 2000).
EffectEstimate95% Confidence Intervalp-Value
Panel A. Mediator: Financing Constraints
ACME (Indirect Effect)0.00047[0.00016, 0.00082]0.002
ADE (Direct Effect)0.65443[0.482, 0.827]0
Total Effect0.6549[0.481, 0.829]0
Mediated Proportion (ACME/Total)0.07%
Panel B. Mediator: Green Innovation
ACME (Indirect Effect)0.0573[0.023, 0.101]0.001
ADE (Direct Effect)0.5976[0.414, 0.771]0
Total Effect0.6549[0.481, 0.829]0
Mediated Proportion (ACME/Total)8.75%
Notes: ACME denotes the Average Causal Mediation Effect (indirect effect), ADE denotes the Average Direct Effect, and Total Effect = ACME + ADE.
Table 9. Regression results of the ESG dimension decomposition.
(1)(2)(3)
E ScoreS ScoreG Score
EPT0.8413 ***0.6966 **0.5284
(3.0489)(2.3488)(1.5957)
ControlsYESYESYES
Year FEYESYESYES
Stkcd FEYESYESYES
Province#Year FEYESYESYES
N209572095720957
R20.23720.19860.2216
t statistics in parentheses ** p < 0.05 *** p < 0.01.
Table 10. Results of the heterogeneity analysis.
(1)(2)(3)(4)(5)(6)
Big FourNon-Big FourState-OwnedNon-State-OwnedEasternCentral-Western
EPT0.93240.7132 ***0.53210.6341 ***0.8312 ***0.1313
(1.2314)(3.2313)(0.9830)(3.5328)(3.2910)(0.7728)
ControlsYESYESYESYESYESYES
Year FEYESYESYESYESYESYES
Stkcd FEYESYESYESYESYESYES
Province#Year FEYESYESYESYESYESYES
N98619897604314440145326388
R20.40010.18920.24890.20420.20340.2197
t statistics in parentheses *** p < 0.01.
Disclaimer/Publisher’s Note: The statements, opinions and data contained in all publications are solely those of the individual author(s) and contributor(s) and not of MDPI and/or the editor(s). MDPI and/or the editor(s) disclaim responsibility for any injury to people or property resulting from any ideas, methods, instructions or products referred to in the content.