Article

Spatiotemporal Heterogeneity and Multi-Scale Determinants of Human Mobility Pulses: The Case of Harbin City

School of Landscape, Northeast Forestry University, Harbin 150040, China
*
Author to whom correspondence should be addressed.
Sustainability 2025, 17(23), 10514; https://doi.org/10.3390/su172310514
Submission received: 22 October 2025 / Revised: 13 November 2025 / Accepted: 19 November 2025 / Published: 24 November 2025

Abstract

To enhance winter tourism competitiveness and address seasonal tourist flow pressures, this study adopts Harbin as a case study and introduces a metamodernist theoretical framework. This framework redefines the “population pulse” phenomenon as a structural oscillation involving periodic switching between the two poles of global tourist consumption and local resident daily needs. By integrating multi-source spatiotemporal data, the study employs X-means clustering to identify population aggregation–dispersion patterns and combines the Geographical Detector and GWR model to construct a complete technical pathway ranging from global factor detection to local heterogeneity analysis. The findings reveal that (1) population activity in Harbin exhibits a “monocentric polarization” pattern during the peak season, which shifts to a “polycentric weak agglomeration” mode in the off-season, reflecting the seasonal oscillation of the city’s functional roles; (2) X-means clustering identifies three types of functional zones: transit-oriented areas on the urban periphery, commercial supporting service zones, and core commercial districts; (3) the Geographical Detector quantifies the independent explanatory power and interactive effects of various influencing factors, identifying the interaction between POI density and road network accessibility as having the strongest explanatory power regarding population aggregation; (4) GWR analysis reveals significant spatiotemporal heterogeneity in the effects of various built environment and socioeconomic driving factors. This study provides specific evidence and technical support for urban planning practices in Harbin and other similar cities, deepens the theoretical understanding of the “constitutive conditions” of urban vitality, and explores a post-paradigmatic research path in geographical methodology that can embrace complexity and analyze oscillatory behavior.

1. Introduction

Against the backdrop of increasing normalization of global tourism, experiencing the culture and landscapes of different cities has become an important part of modern life. Harbin, as a major ice and snow tourism metropolis in China, successfully hosted the 2025 Asian Winter Games, leveraging its unique ice–snow culture and industrial base. This international event further strengthened its brand appeal as a global ice–snow tourism destination, enhanced its international reputation, and attracted a large influx of visitors [1]. However, while short-term tourist concentration brings economic benefits, it also places pressure on urban transportation, public services, and infrastructure systems, affecting the daily commute and quality of life for local residents [2]. During the peak season, core business districts and areas around scenic spots experience severe traffic congestion and overloaded public service facilities; during the off-season, some areas suffer from insufficient vitality and underutilization of facilities. This seasonal pulse phenomenon is not unique to Harbin but is also observed in other similar international ice–snow tourism cities. For instance, Sapporo, Japan, successfully developed ice–snow tourism through its Snow Festival and Olympic legacy, yet also faces pressure from tourist surges during major events. Oslo, on the other hand, has mitigated seasonality fluctuations inherent in purely tourism-oriented development by integrating winter activities into residents’ daily lives [3]. Furthermore, non-coastal regions in Bulgaria exhibit negative public attitudes towards winter tourism due to inadequate natural conditions and lagging tourism services [4]. Small Mediterranean cities like Peñíscola face challenges in balancing tourism development with heritage conservation. The study originates from a surprising empirical pattern observed in seasonal tourism cities: the drastic, rhythmic oscillation of urban spatial vitality between drastically different states. These cases collectively indicate that seasonal tourism cities need to explore resilience development paths suited to their local contexts.
This paper posits that seasonal pulses are not merely an urban management issue but also a typical manifestation of a “structural oscillation” of urban vitality from a metamodernist perspective [5]. Tourism cities undergo periodic switching between “global tourist consumption” and “local resident needs.” This oscillation constitutes a new “constitutive condition” for the development of tourism cities [6]. From this theoretical vantage point, this study delves into a core question: How can major tourism cities manage this inherent, periodic oscillation to build a dynamic and resilient balance between short-term peak tourist flows and long-term healthy development? The focus lies on exploring an urban development model capable of adapting to periodic pulses while maintaining long-term resilience.
Existing research paradigms are often confined to modernist empirical analysis or postmodernist deconstructive critique. The former pursues universal aggregation laws while neglecting spatial heterogeneity, and the latter indulges in relativist narratives, weakening constructive interpretation; both struggle to adequately explain the “pulse” phenomenon in tourism cities. Research on the aggregation and dispersion of urban crowds has progressively deepened from pattern recognition to mechanistic exploration [7]. Early studies mainly focused on identifying basic patterns and extracting features of crowd movement, constructing dynamic characteristics based on inflow/outflow volumes in spatial analysis units, and employing clustering algorithms to identify various typical spatiotemporal patterns of crowd aggregation and dispersion, preliminarily revealing the agglomeration and diffusion laws of crowd activity [8,9]. With methodological advances, scholars began introducing more complex analytical frameworks to quantify the intensity of crowd aggregation/dispersion, such as using the divergence operator from vector field theory to quantitatively calculate aggregation/dispersion intensity, transforming pattern extraction into a time-series clustering problem to identify more representative primary patterns [10]. In recent years, with the widespread application of big data, the research scale has expanded further to the urban agglomeration and regional levels [11]. Studies based on multi-source data like mobile phone positioning data and Location-Based Service data have extended to analyzing characteristics of intercity travel timing [12], travel patterns, and network structures within urban agglomerations [13]. Employing social network analysis and QAP regression models [14], research has systematically examined the spatiotemporal characteristics and structural influencing factors of population mobility networks at the regional scale, expanding the scope from single cities to regional synergy. Methodologically, research has evolved from traditional multiple linear regression models to integrated approaches combining machine learning and spatial analysis [15]. By establishing evaluation models for the spatiotemporal dynamic stability of crowd aggregation/dispersion, studies quantitatively analyze the relationship between aggregation/dispersion stability and urban spatial structure [16], and further explore the intrinsic links between spatiotemporal patterns of crowd aggregation/dispersion and urban functional zones. Concurrently, using emerging data sources like check-in data, research has begun building user movement trajectory prediction models for detailed simulation of individual mobility behaviors [17].
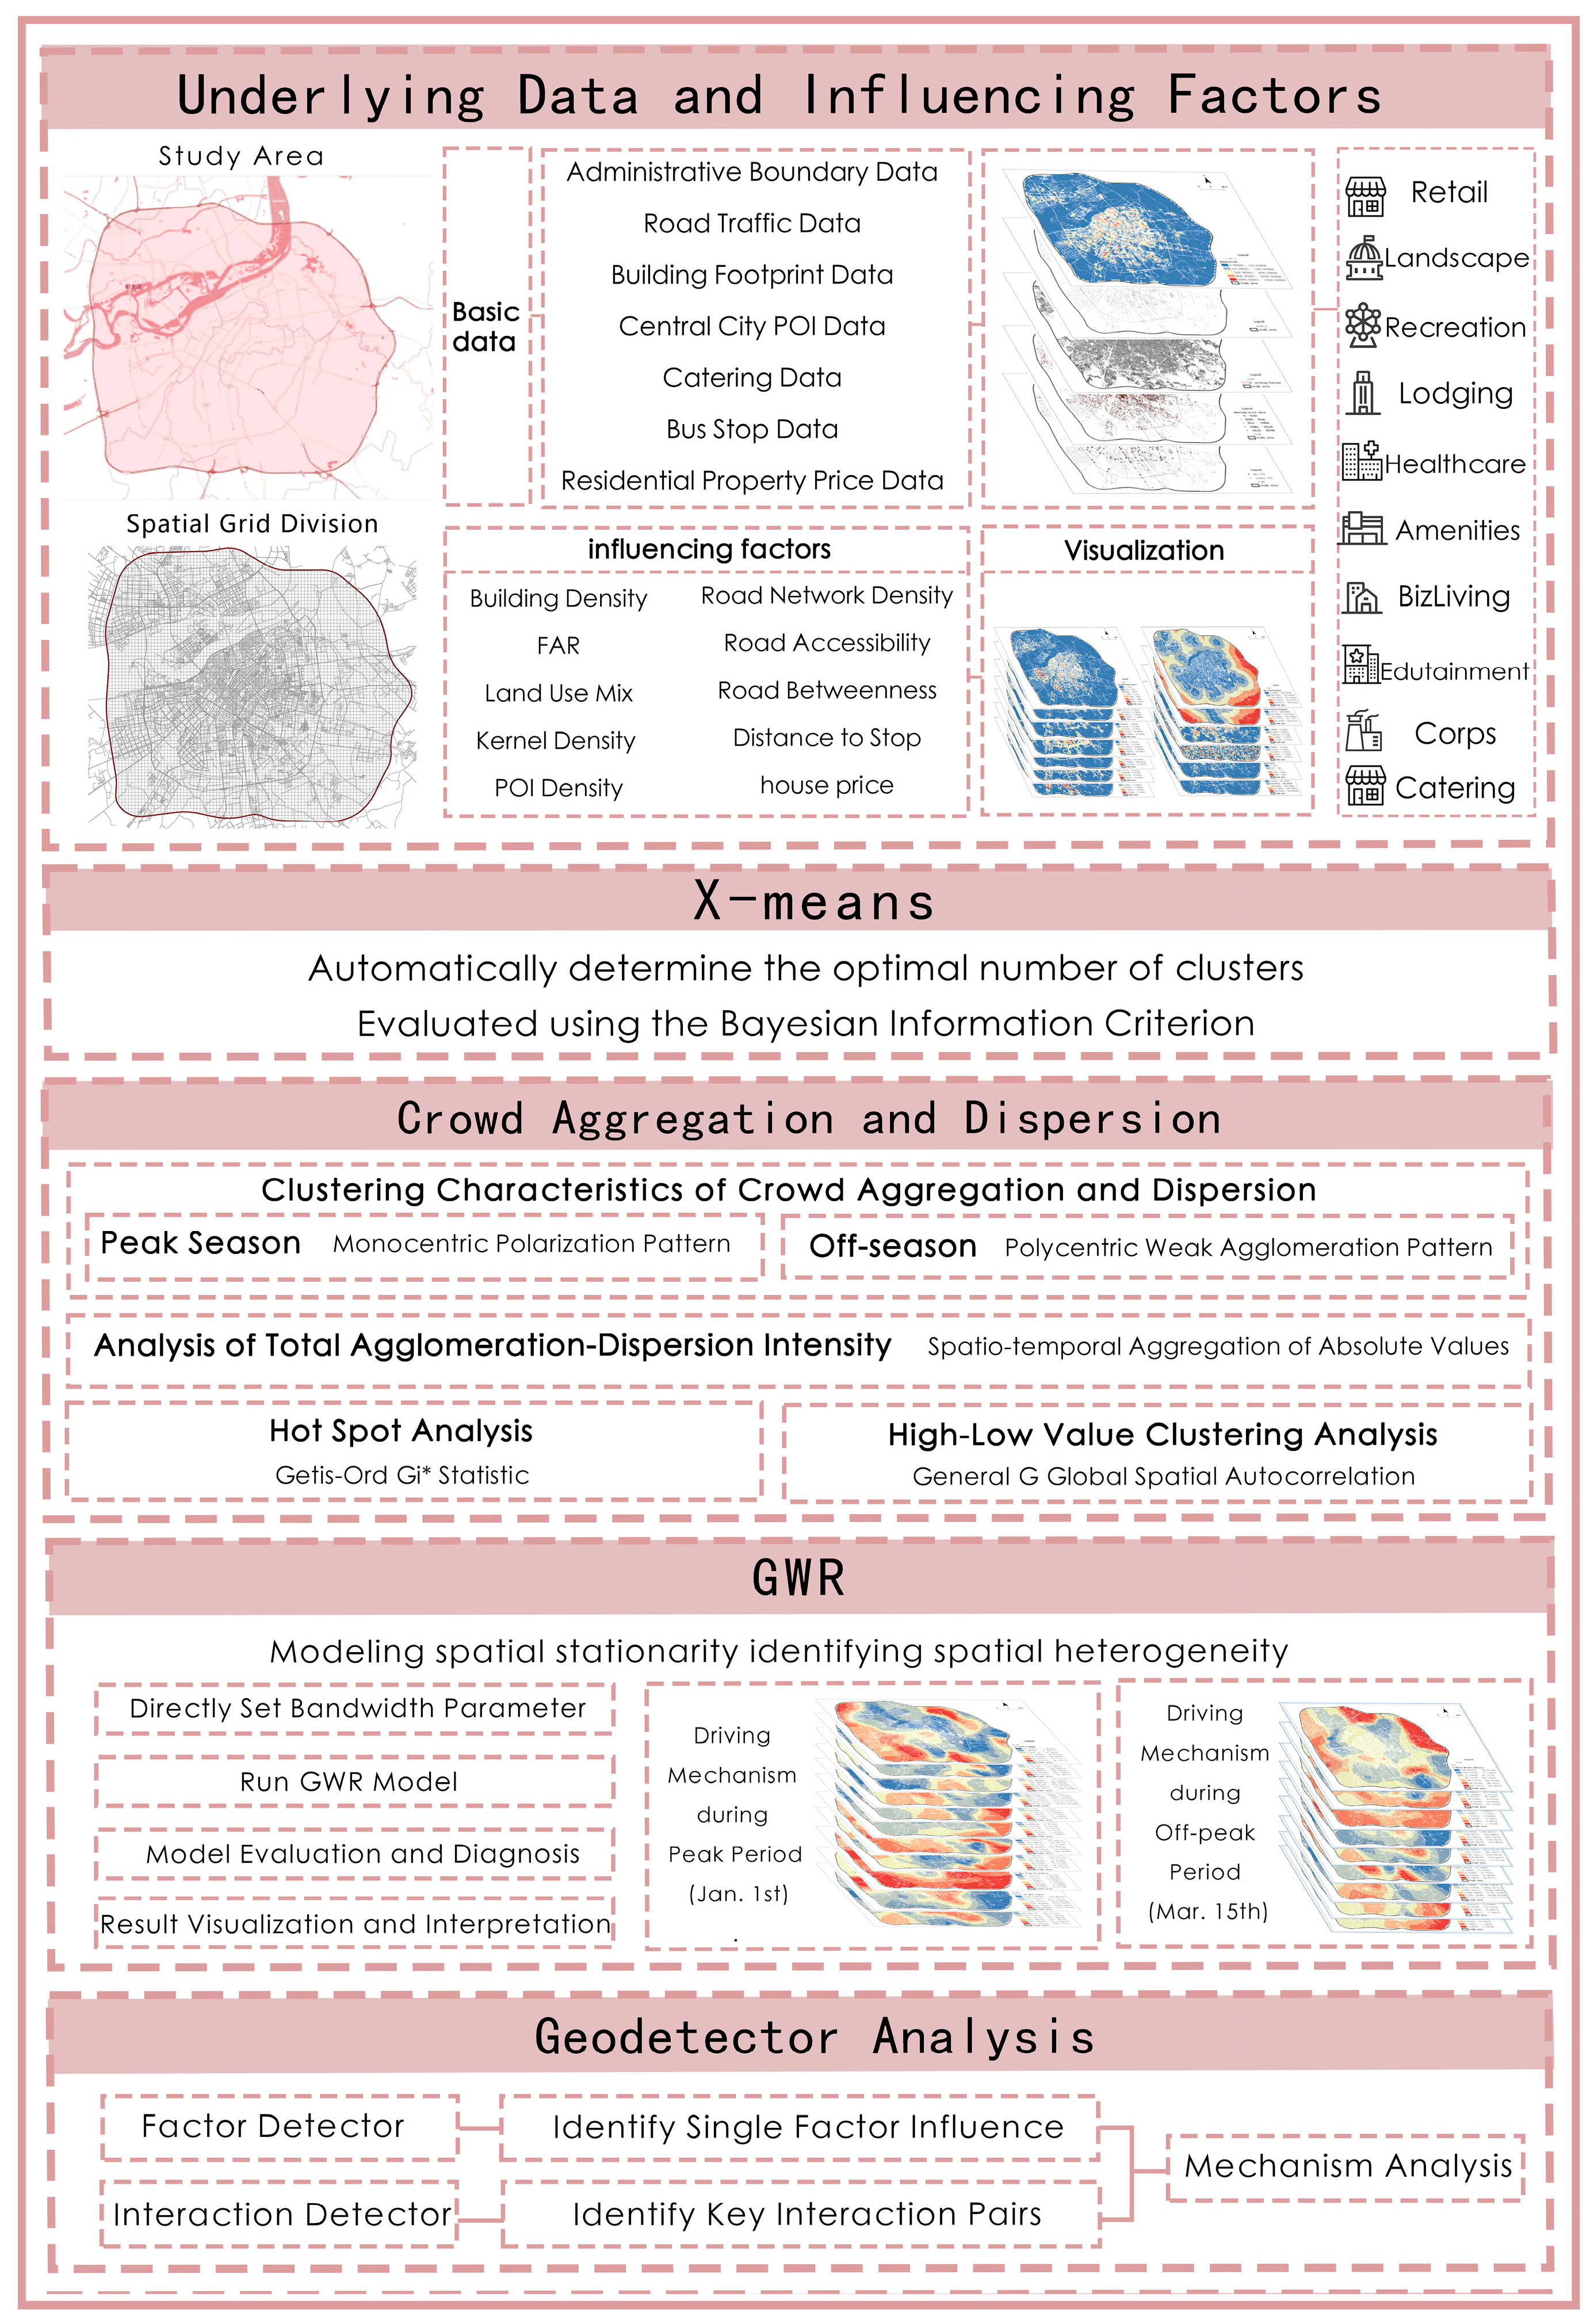
Despite these advancements, shortcomings remain: most studies stop at describing crowd mobility patterns themselves or merely conduct static correlation analyses, constrained by traditional modernist and postmodernist approaches, failing to deeply parse the influence of the micro-environment on mobility. Against this backdrop, this study introduces metamodernism as its theoretical framework, re-examining the spatiotemporal patterns of urban crowd activity from the perspective of an oscillatory ontology. Integrating multi-source spatiotemporal data such as Baidu Heatmap data, POI density, and road network accessibility, and taking Harbin, China, as the study area, this research employs the x-means clustering method to identify the spatiotemporal aggregation and dispersion characteristics of crowds during the off-season and peak holiday season in Harbin. Using the geographical detector method, it quantitatively assesses the explanatory power of various built environment and socioeconomic factors on the spatial heterogeneity of crowd aggregation/dispersion intensity and detects interactions between multiple factors, identifying key drivers. Combined with geographically weighted regression analysis, it reveals the spatiotemporally heterogeneous effects and mechanisms of built environment and socioeconomic factors on crowd aggregation/dispersion intensity, aiming to understand the underlying dynamics of urban crowd flows (Figure 1). This provides not only specific technical pathways for enhancing Harbin’s urban resilience but also achieves a dual breakthrough theoretically and methodologically: Theoretically, the study interprets crowd pulses as “dynamically anchored social kinds,” revealing their mechanism of morphological and functional transformation within seasonal rhythms, thereby elevating the understanding of urban vitality from phenomenological description to a theoretical insight into “constitutive conditions,” promoting the advancement of geographical thought towards a “post-paradigmatic” depth. Methodologically, the research breaks through the limitations of traditional global models, offering a new paradigm for understanding complex human-environment interactions. More importantly, it provides non-empiricist scientific recommendations for urban renewal, management, and spatial optimization in Harbin City, while offering technical support and methodological guidance for enhancing overall urban resilience in response to seasonal fluctuations in tourist flow.

2. Materials and Methods

2.1. Overview of the Study Area

As a vital transportation hub in Northeast China, Harbin occupies a significant position in regional economic development, supported by its comprehensive network of railways, highways, aviation, and water transport. During the 2024–2025 ice and snow season, the city received a cumulative total of 90.357 million tourist visits, a year-on-year increase of 9.7%. Total tourism revenue reached 137.22 billion yuan, reflecting a substantial growth of 16.6%. Specifically, during the Spring Festival holiday period, Harbin welcomed 12.151 million visitors, generating tourism revenue of 19.15 billion yuan, representing increases of 20.4% and 16.6% compared to the previous year, respectively. Concurrently, the inbound tourism market experienced explosive growth. Based on full-year 2024 data, the city received 857,000 inbound tourist visits, a surge of 111.6% year-on-year, underscoring the considerable international appeal and development potential of Harbin’s ice and snow tourism.
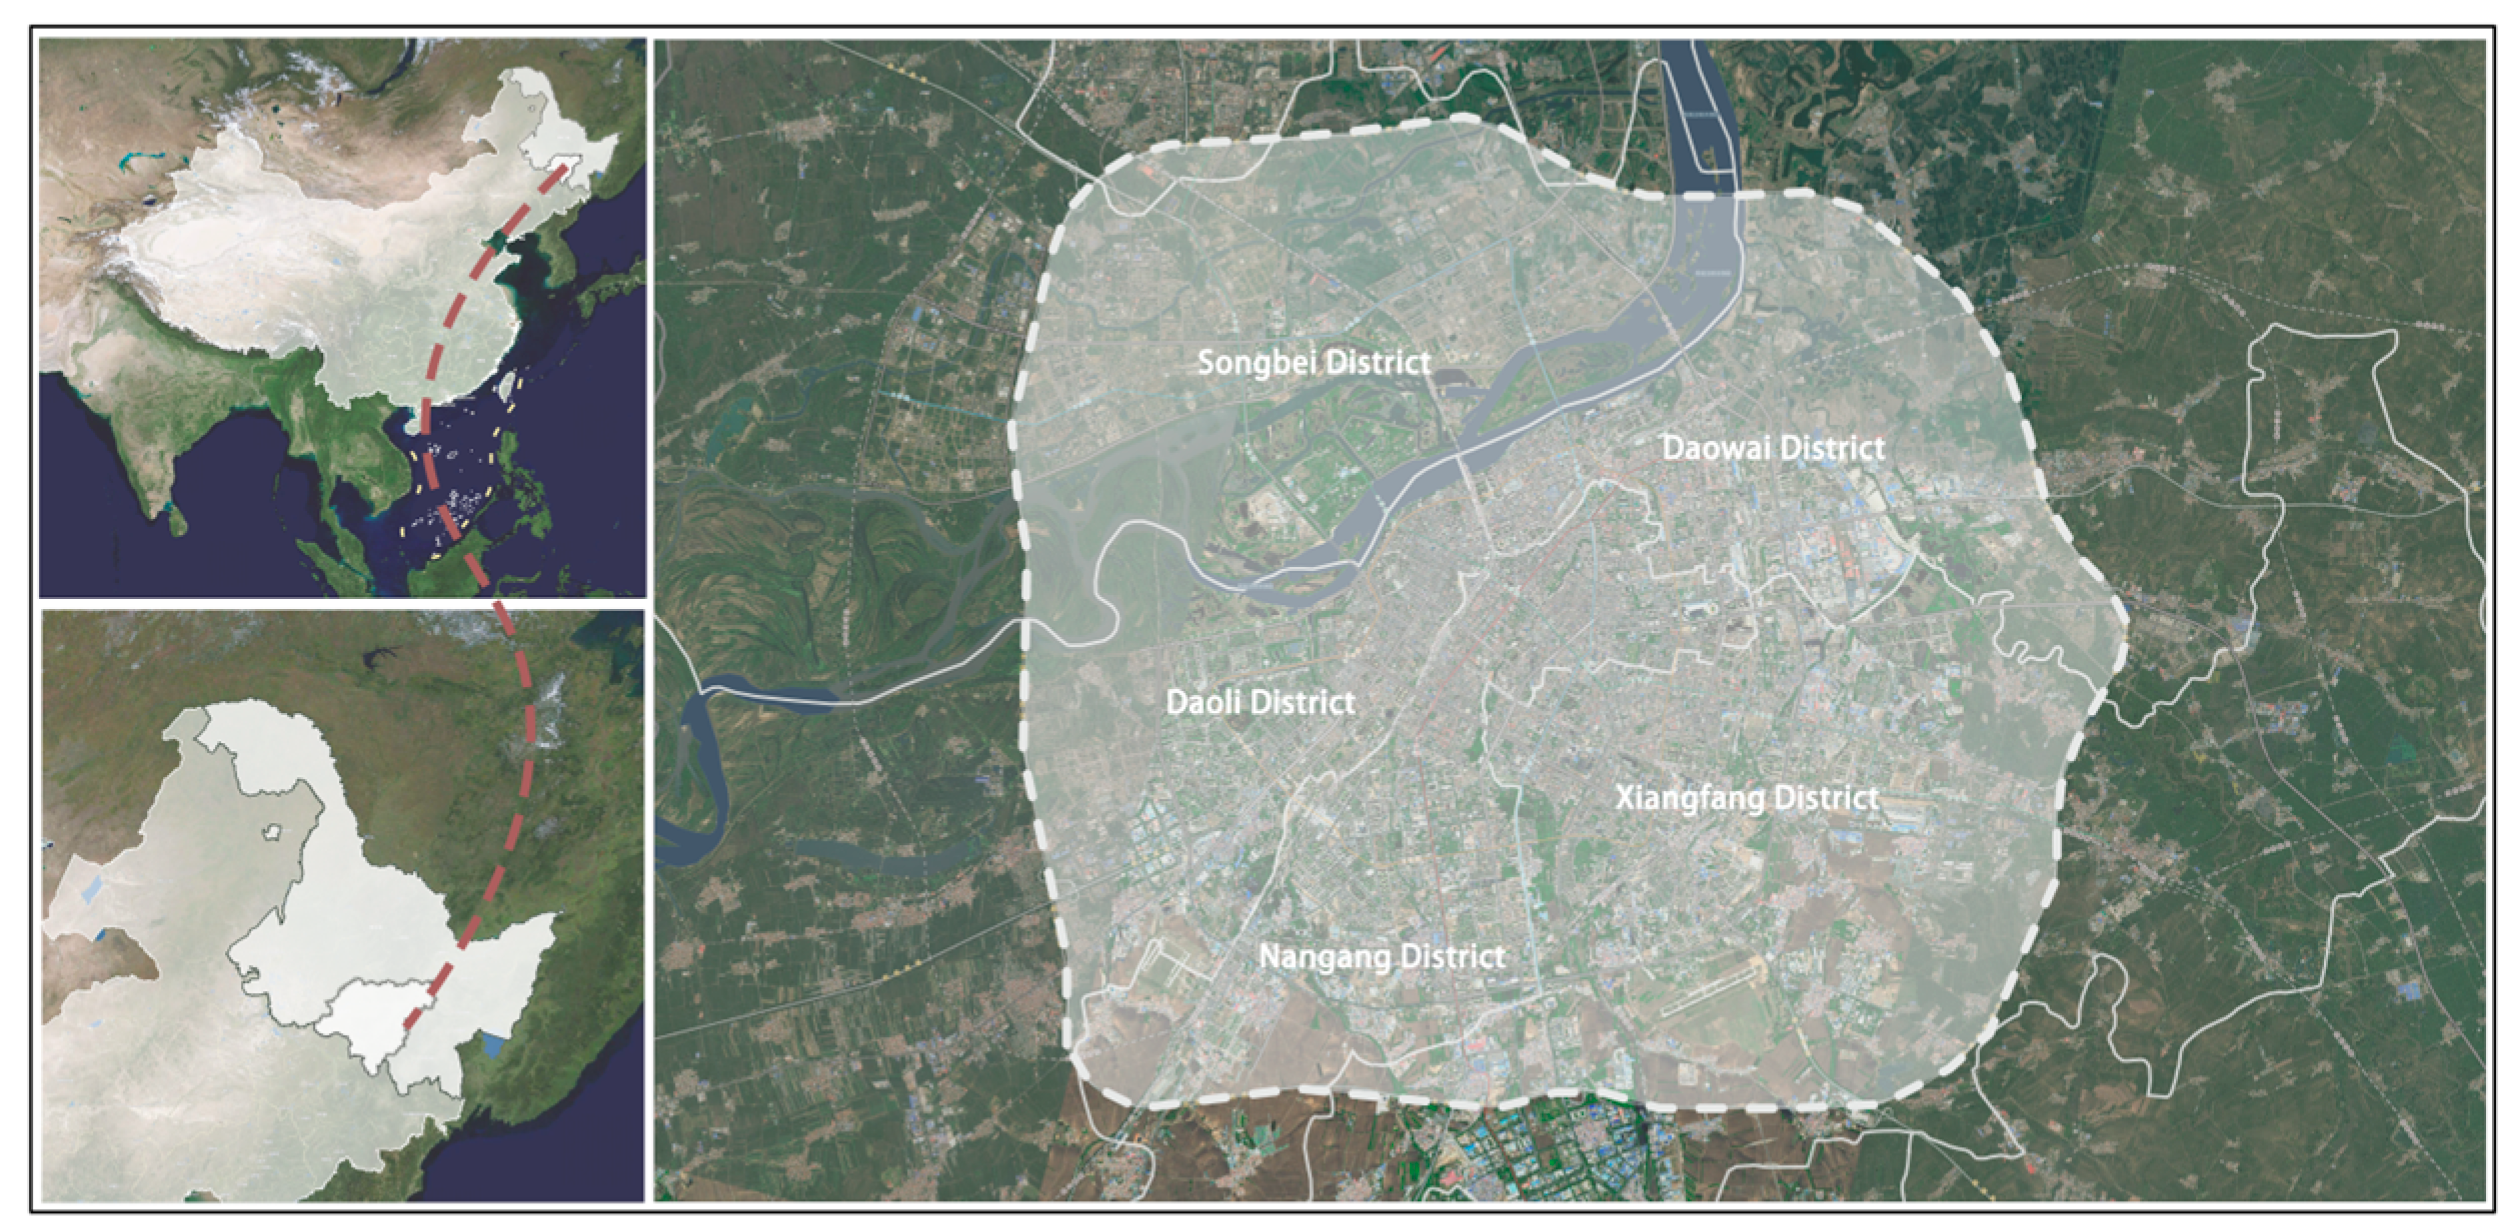
The study area for this research is the region within Harbin’s Fourth Ring Road, covering an area of approximately 600 square kilometers, as specifically illustrated in Figure 2. The Fourth Ring Road functions as the city’s outer ring and beltway highway, connecting multiple administrative districts. With urban development, the area within the Fourth Ring Road has evolved into the core urban space of Harbin, serving as the primary zone accommodating the city’s economic, social, and cultural elements.

2.2. Research Data

2.2.1. Population Heat Data

This study selected 1 January (New Year’s Day, peak season) and 15 March (off-season Saturday) as typical periods for comparative analysis. 1 January, representing the winter tourism peak, exhibits a “monocentric polarization” agglomeration pattern primarily driven by inbound tourist flows, which is conducive to observing urban carrying capacity and holiday economic effects under extreme passenger flow conditions. The off-season Saturday reflects the normalized distribution pattern driven by the daily demands of local residents, revealing the spatial equilibrium of the city’s basic service functions and its underlying daily vitality base. Verification confirms that no public security incidents, data anomalies, or extreme weather interference occurred on either day, ensuring data reliability.
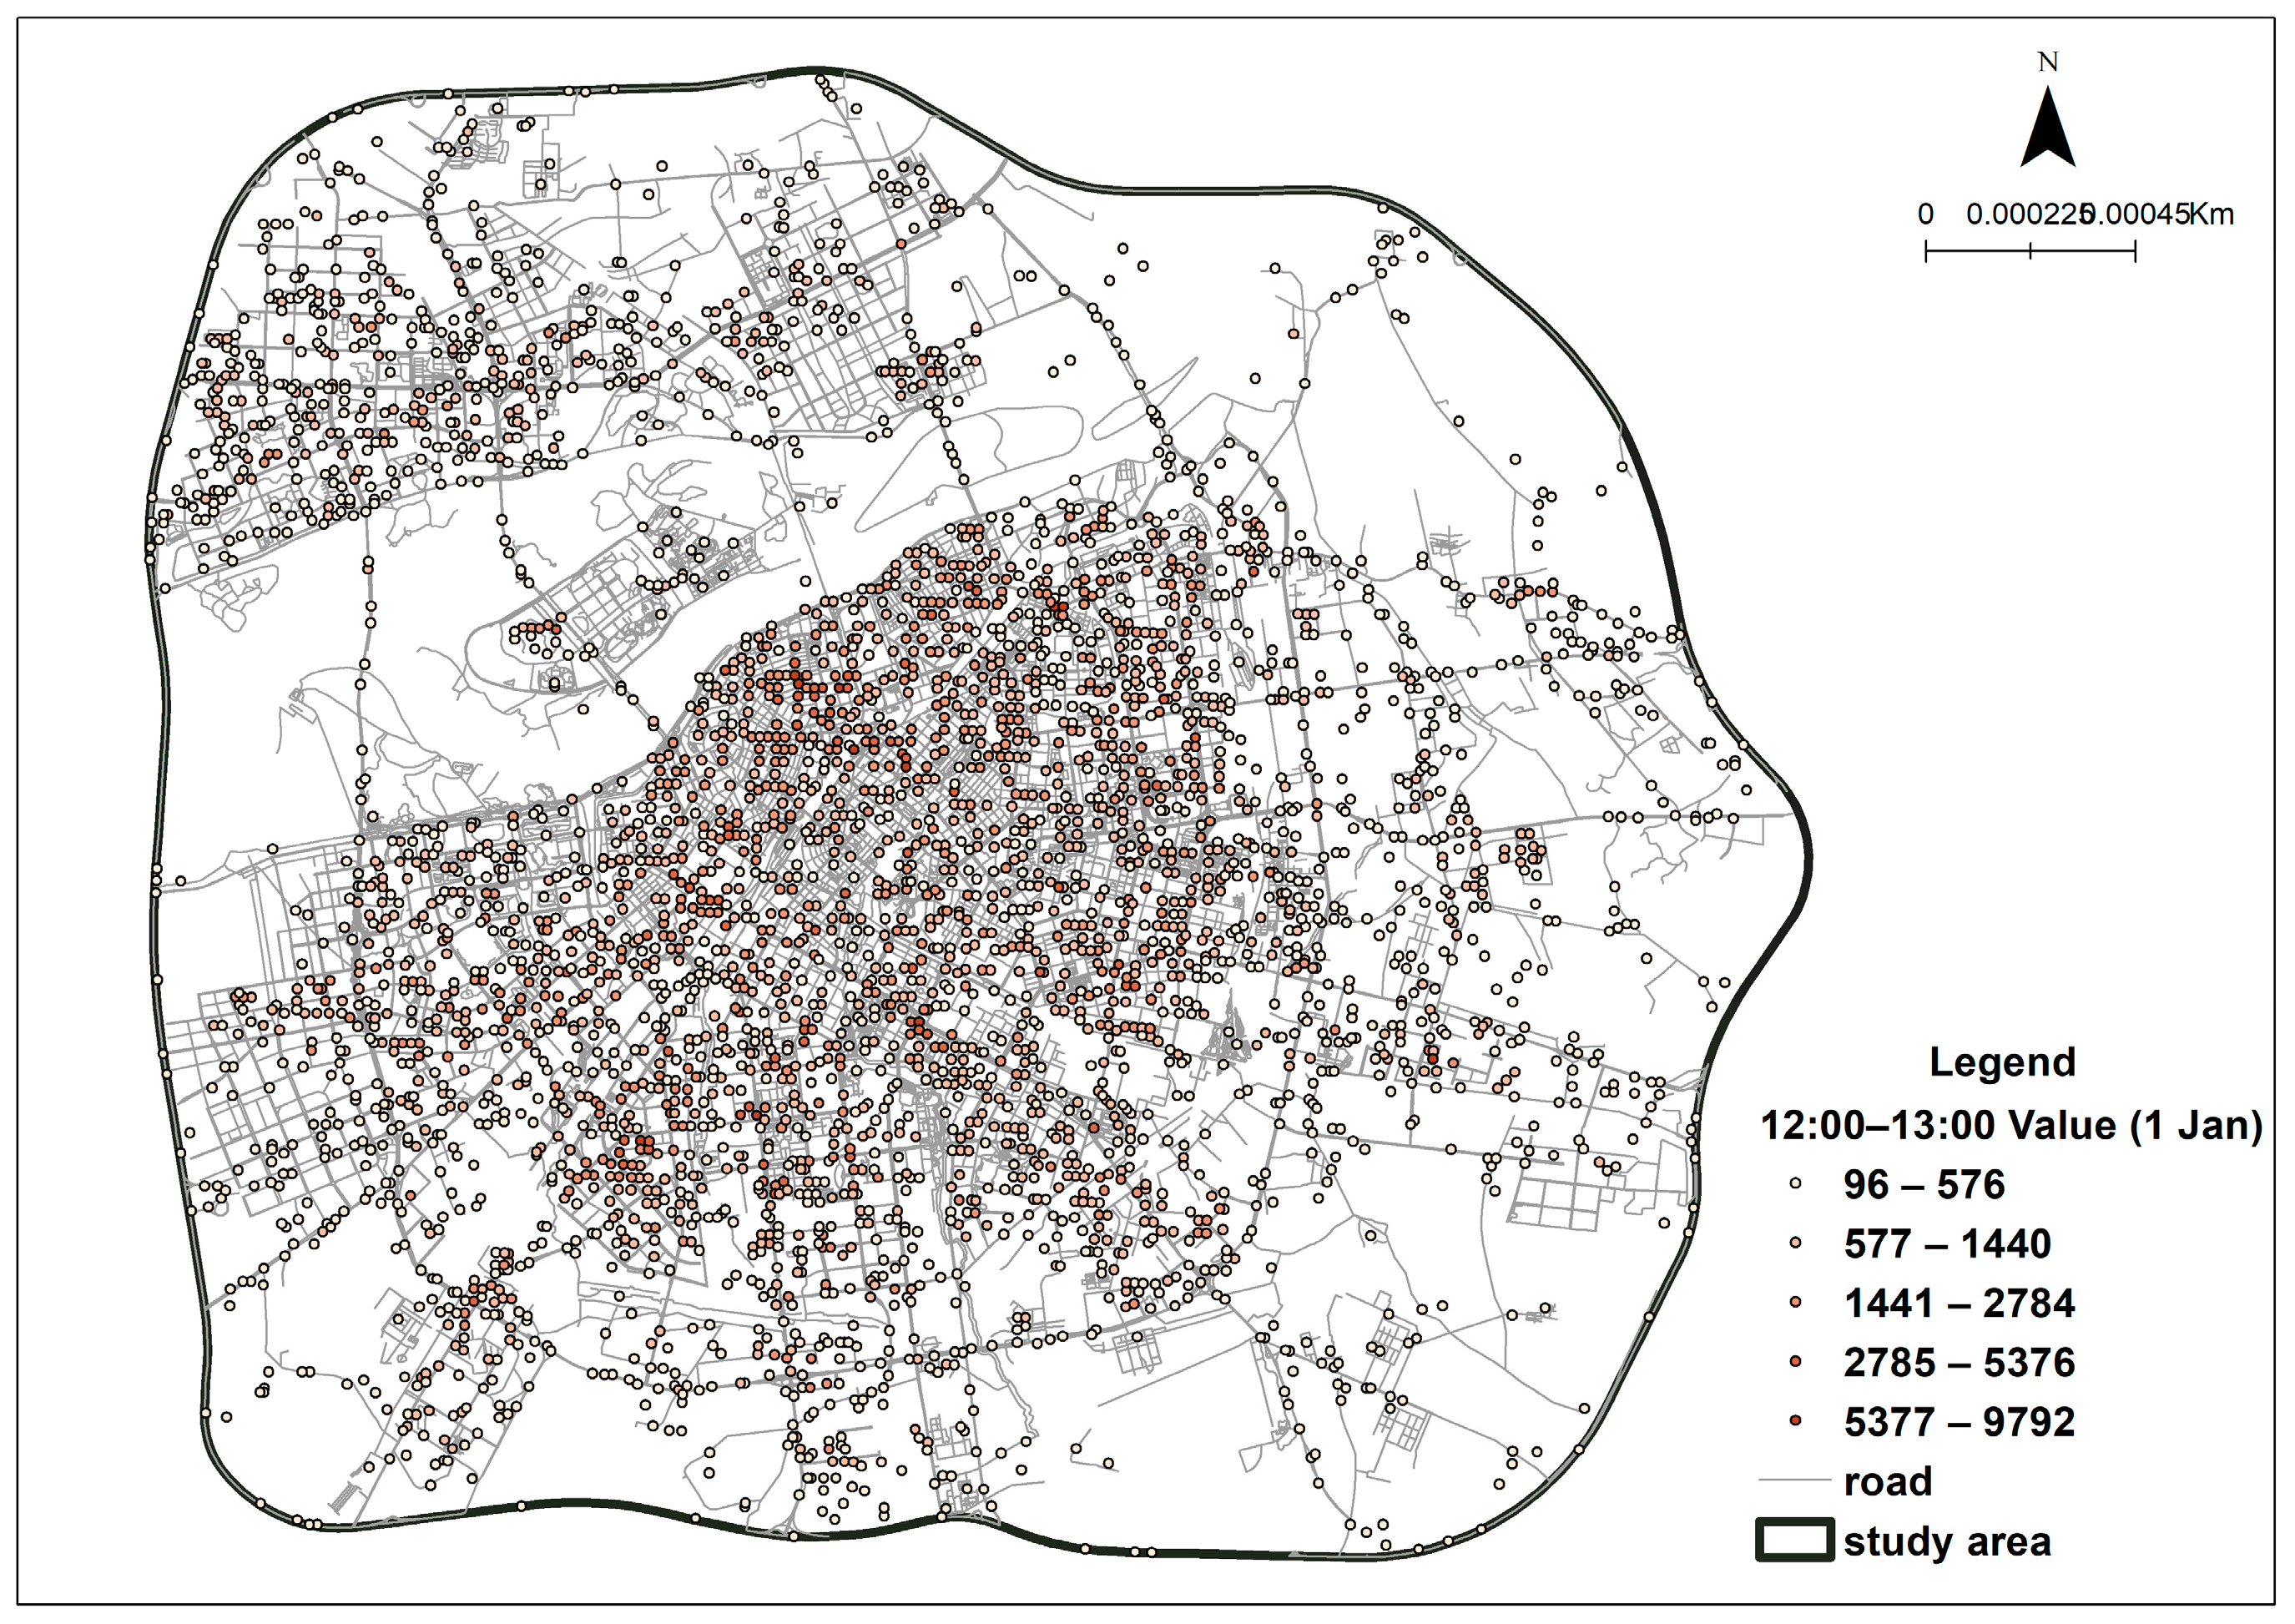
This research employed Python (Anaconda distribution) with key libraries including pandas 0.23.0 and NumPy 1.14.3 to collect population heatmap data for Harbin city from the Baidu Maps Open Platform for two specific dates: 1 January 2025 and 15 March 2025. Data covering the period from 6:00 to 24:00 were acquired at one-hour intervals. The raw data were linked to a fishnet grid, and values were extracted to points at 300 m intervals, resulting in a spatially discrete population dataset. The initial data for 12:00–13:00 on 1 January is presented as an example in Figure 3.

2.2.2. Built Environment Data

This study adopts a multi-source data fusion approach. The data used primarily fall into three categories: (1) fundamental geographic data, including administrative boundaries, road networks, and building footprints, which are mainly used to construct the spatial analysis framework of the study area and calculate key morphological metrics; (2) Point of Interest (POI) and public transport stop data, used to quantify facility distribution density, functional mix, and public transport (bus/subway) accessibility [18]; and (3) socioeconomic data, represented by residential community price data, used to reflect characteristics of residential spatial differentiation [19]. All data were integrated after being unified to the same geographic coordinate system and spatial scale, providing support for subsequent cluster analysis, factor detection, and spatial regression modeling. For details, see Table 1.
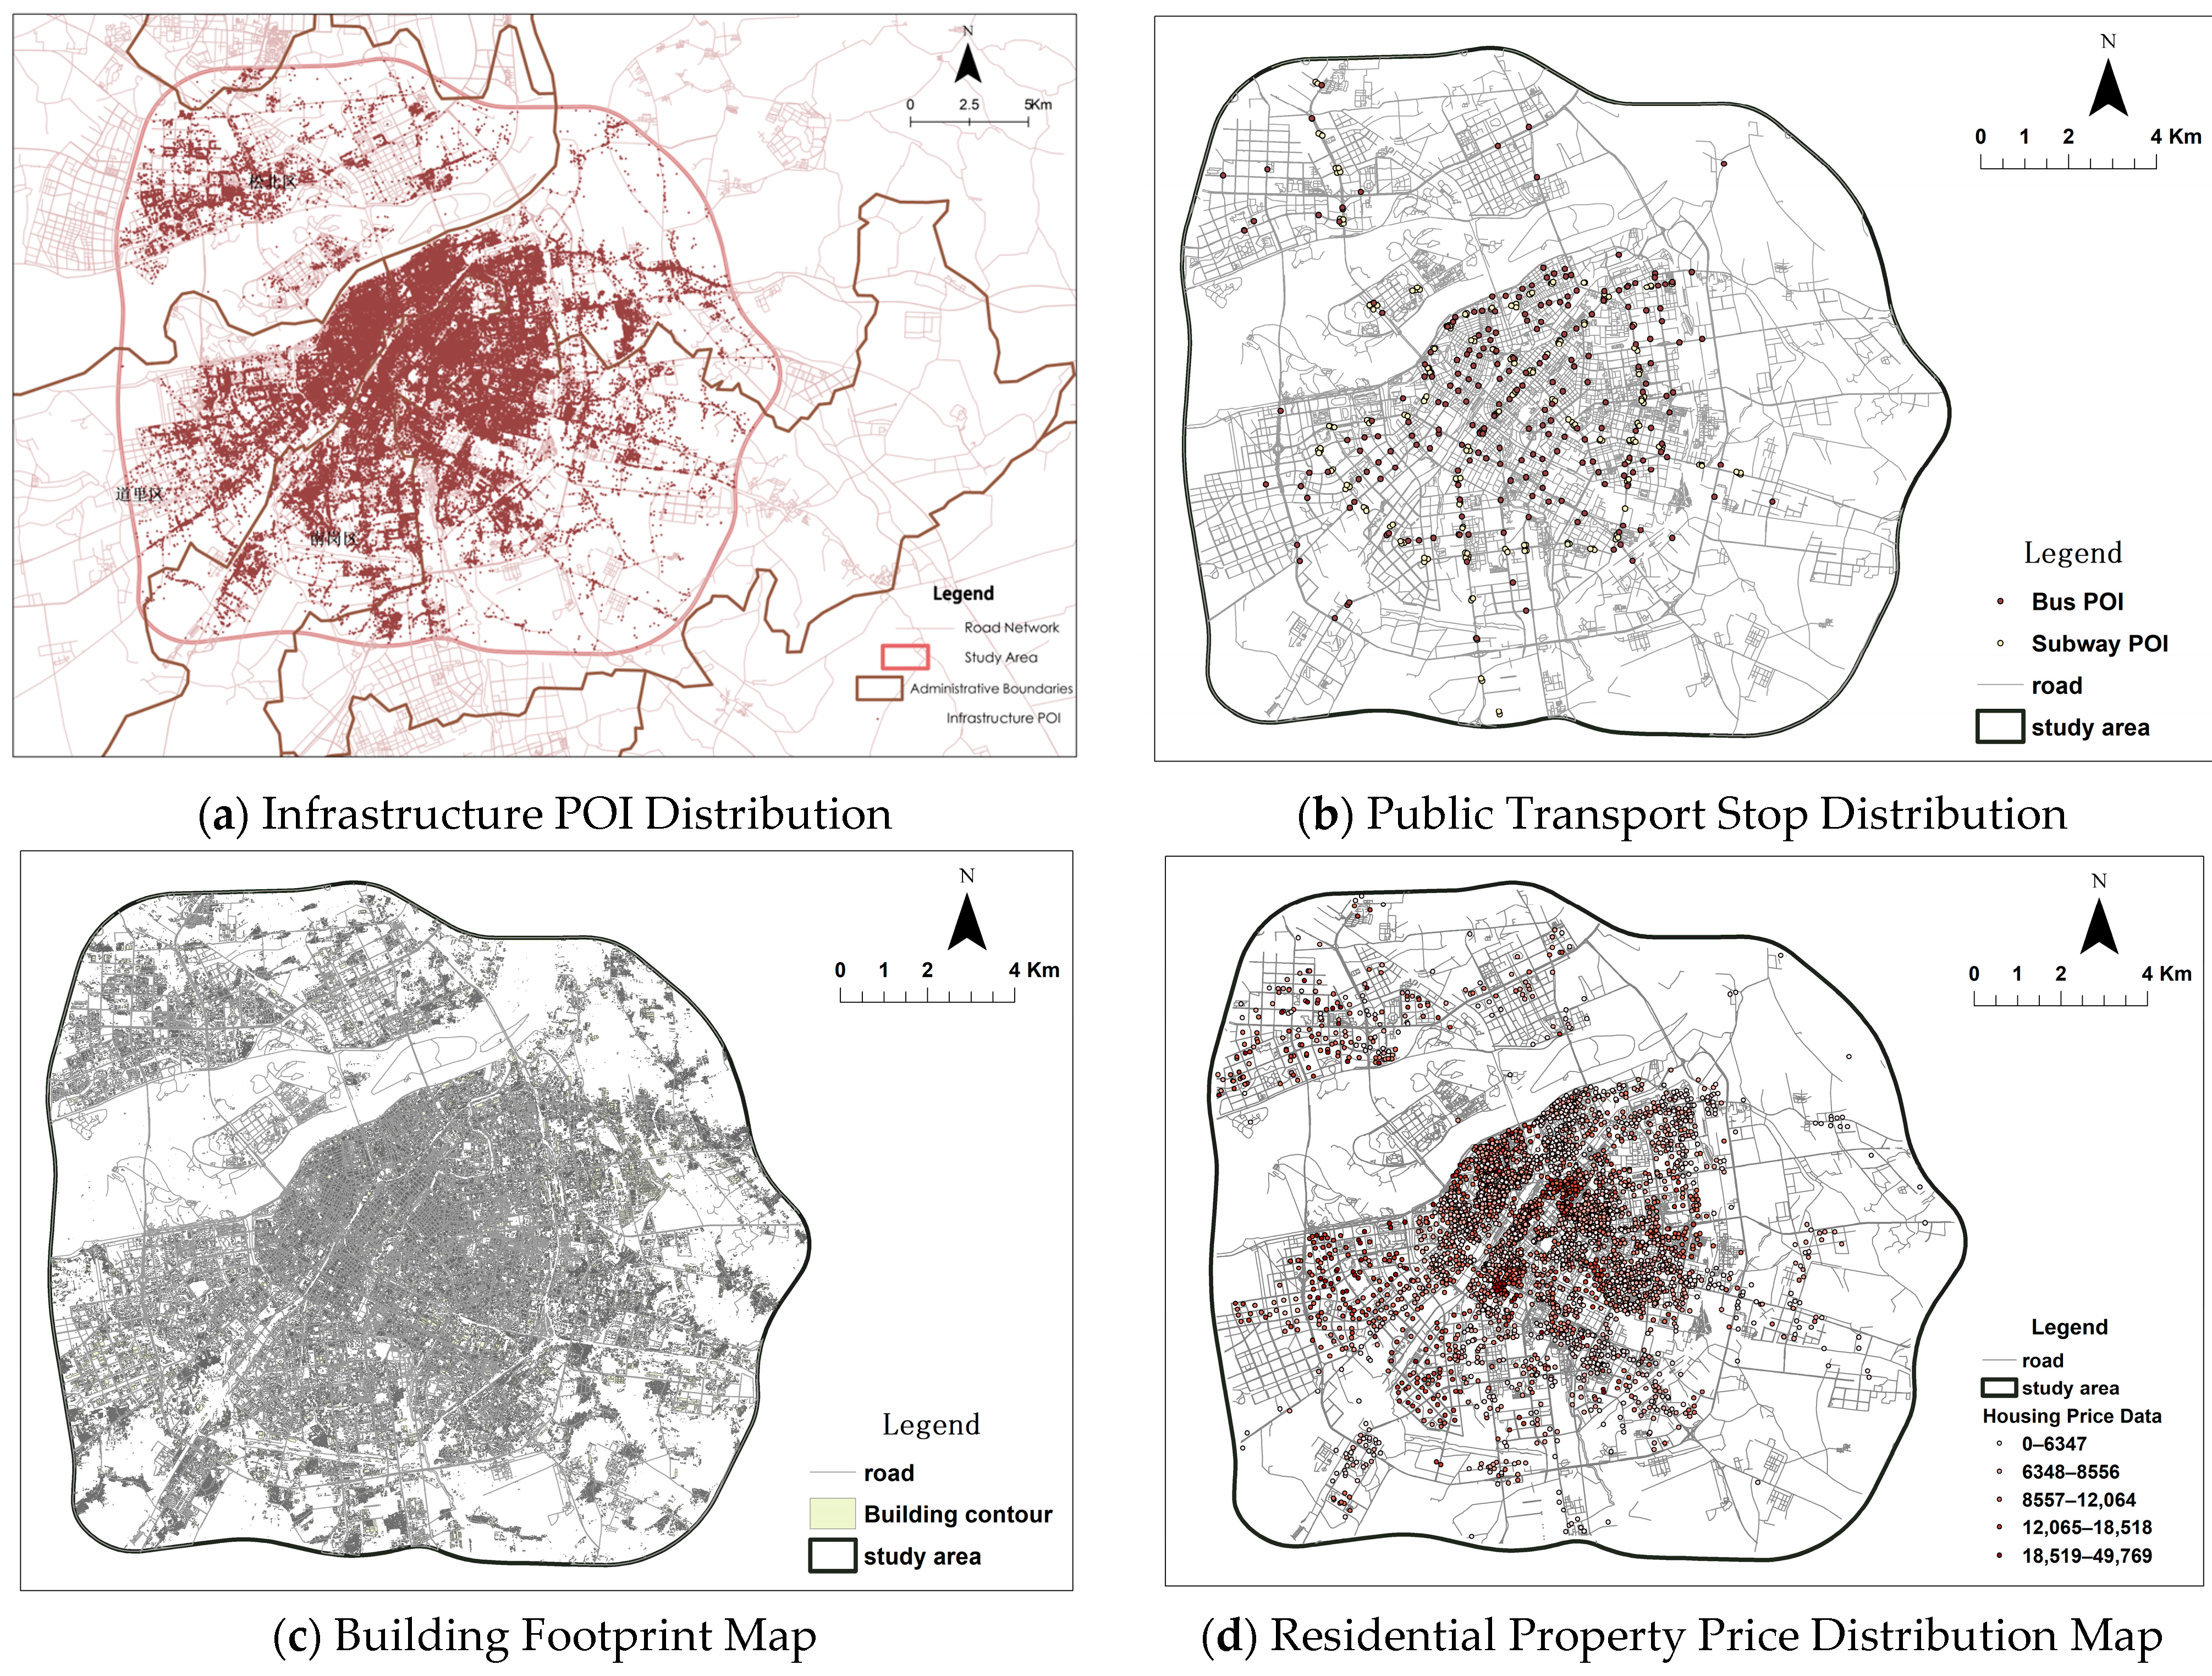
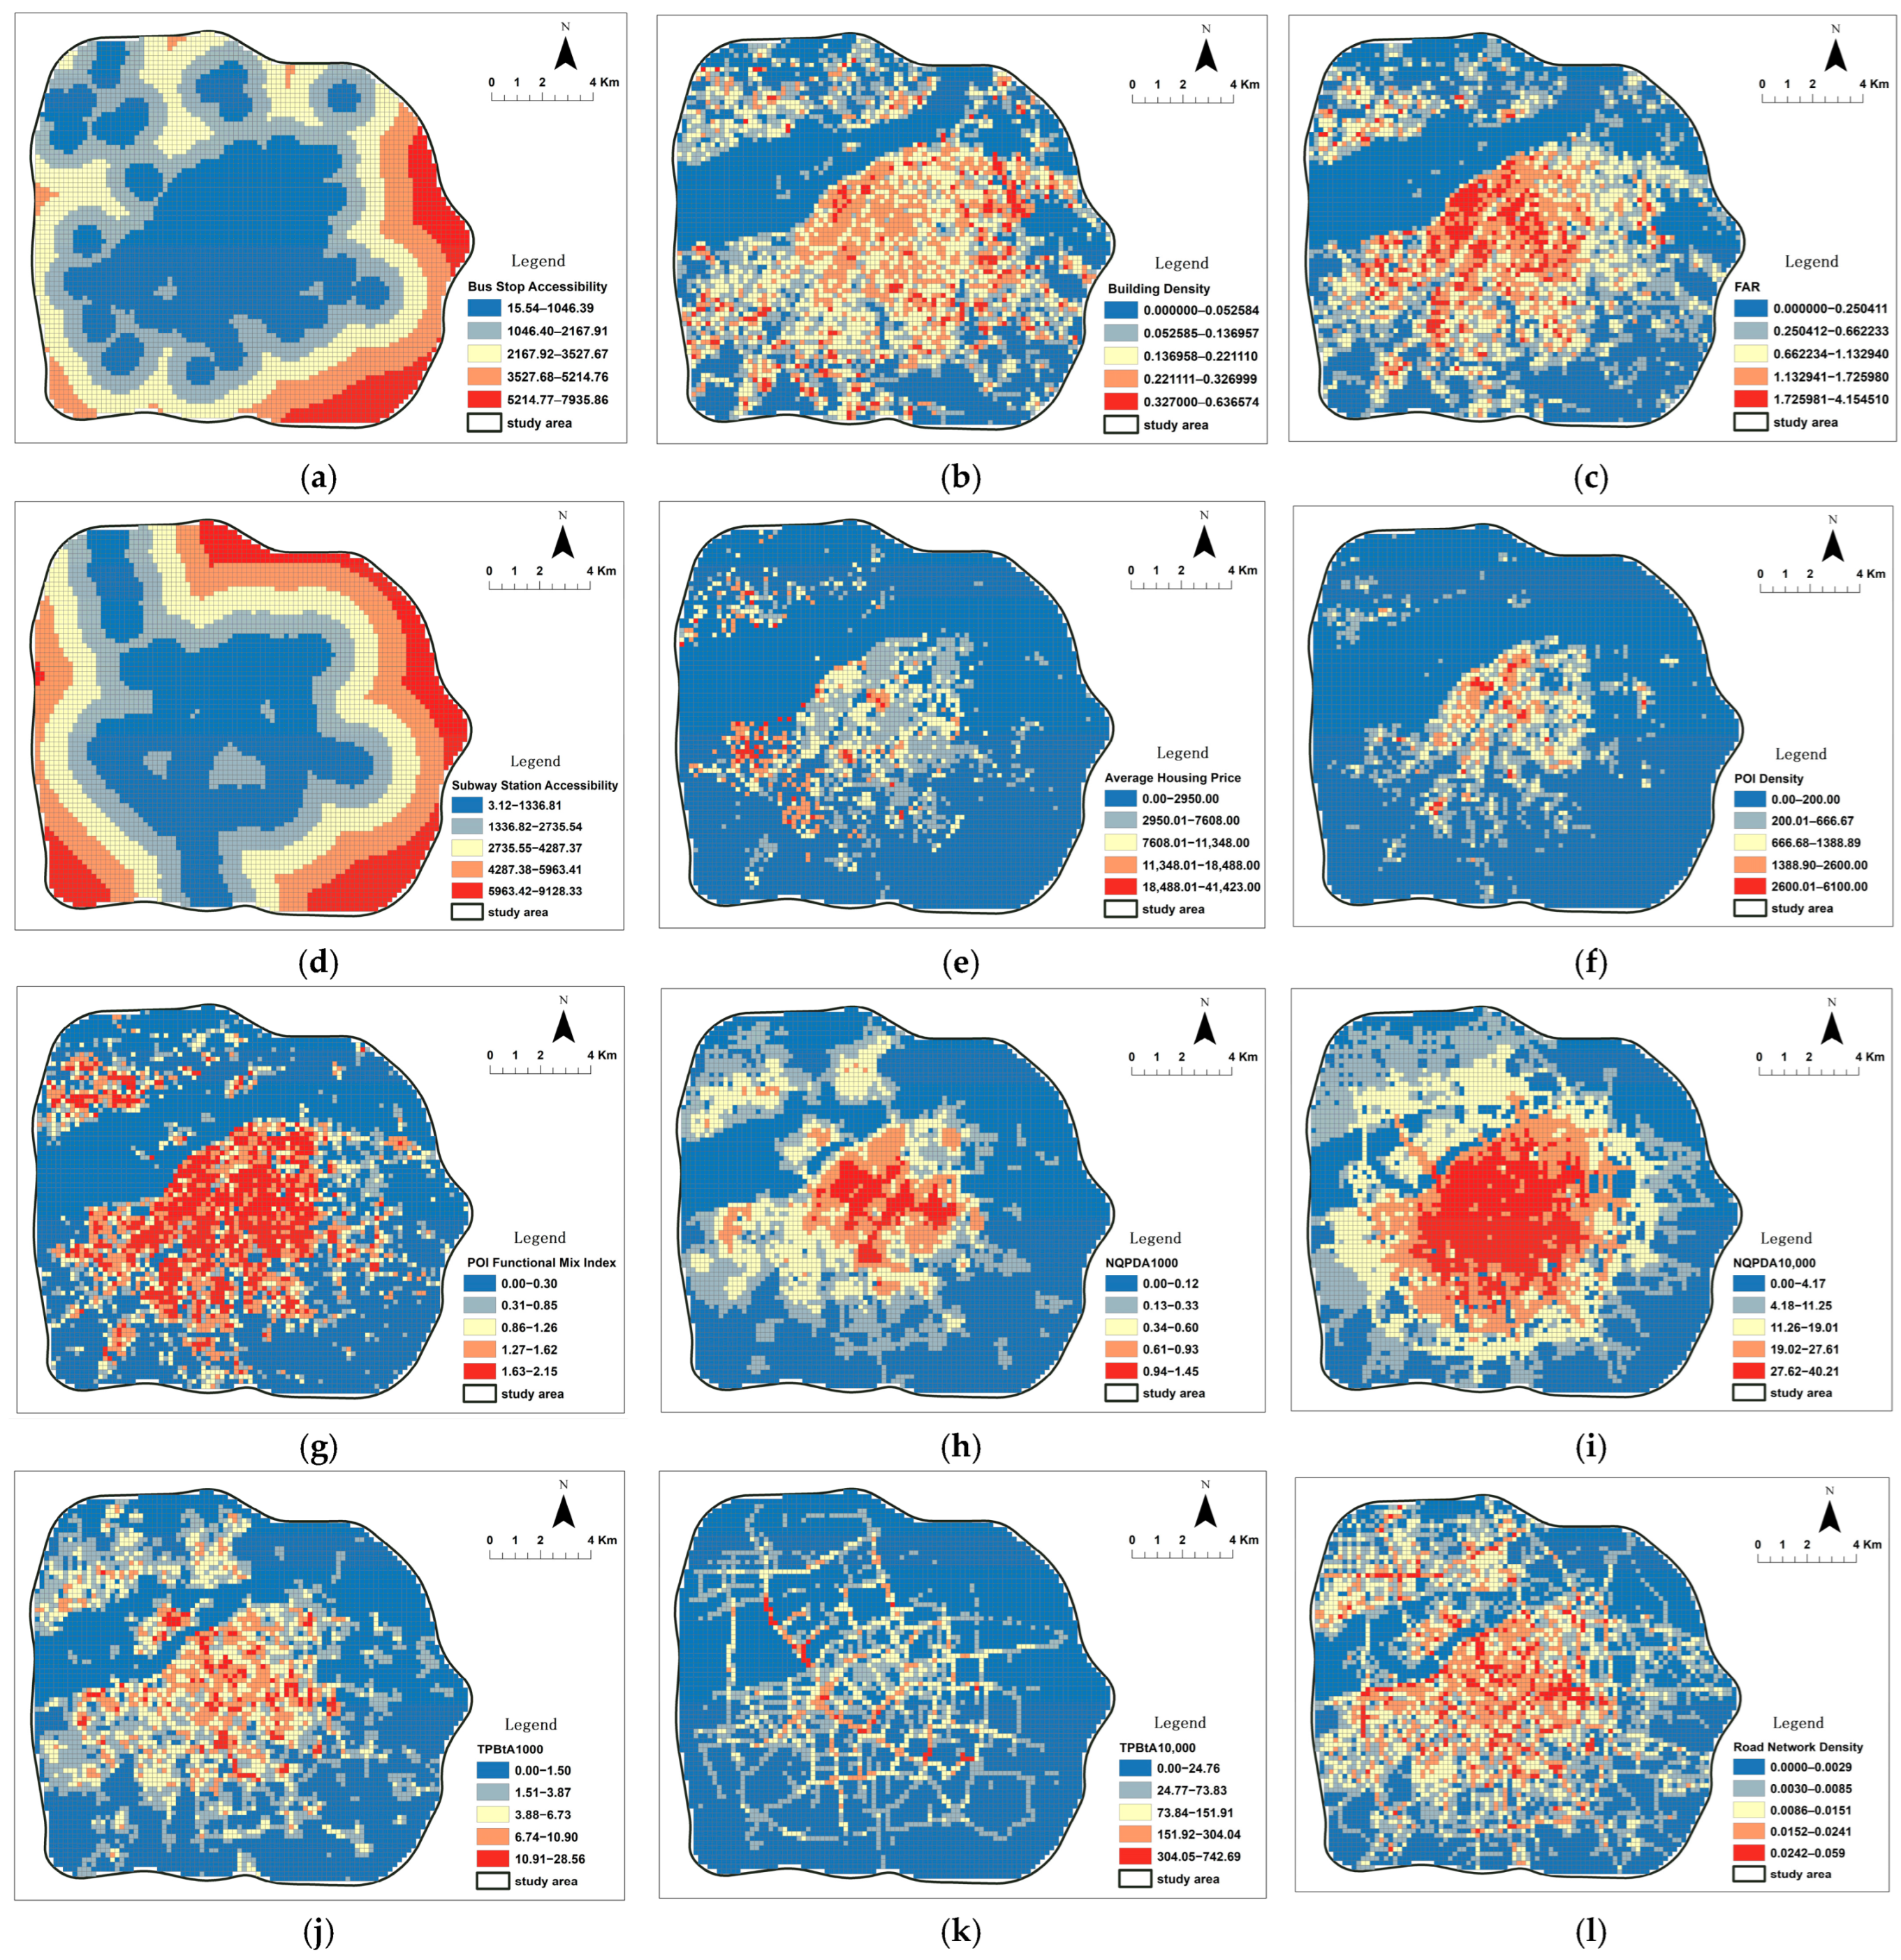
The visualized fundamental geographic data, Point of Interest (POI) data, and socioeconomic data are presented in Figure 4. POI density reflects the aggregation degree of urban functions such as commerce and services (Figure 4a). The distribution of public transport stops (bus and metro) can be used to quantify the level of public transport accessibility in different areas (Figure 4b). Building footprints delineate the boundaries of urban physical space (Figure 4c). Residential property prices, serving as a proxy variable for socioeconomic status, reveal residential spatial differentiation (Figure 4d).

2.3. Explanation Variable Indicators Construction

This study constructed a multidimensional built environment evaluation system to quantify its impact on population activity. The system encompasses four core dimensions [20]: For construction intensity, building density and floor area ratio are adopted, calculated based on building footprint data to measure spatial development compactness. In terms of land use, the functional mix index and kernel densities of eight categories of facilities are computed using POI data to reveal urban functional diversity and distribution patterns [21]. Regarding transportation accessibility, integrating road network data with the sDNA model, the analysis includes road network density, road proximity, betweenness centrality, and distance to public transport stops, assessing spatial connectivity efficiency [22]. Finally, a socioeconomic factor is introduced, represented by the average housing price within each grid cell, to characterize locational value. The specific data calculation methods and the types of explanatory variables are detailed in Table 2.

2.4. Theoretical Framework: The Oscillatory Perspective of Metamodernist Geography

This study adopts metamodernist geography as its core theoretical framework. This framework rejects the absolute truth claims of modernism and the thorough deconstruction of postmodernism, opting instead for an oscillatory stance that allows for the coexistence of multiple, even contradictory, perspectives, methods, and layers of reality, viewing the tension between them as a source of creativity [5]. From this perspective, urban crowd pulses are understood as “metareal” events resulting from the interplay of multiple layers of reality—such as material flows, social interactions, symbolic representations, and technological manifestations. Their essence is a profound socio-spatial process, reflecting the dynamic through which urban space is experienced, contested, and reshaped differentially by various actors under the tension between globalization and localization [23].
Adhering to Storm’s metarealism, this study conceptualizes Harbin’s “crowd pulse” as a multi-layered metareal event, real across different contrastive classes: (a) material/bodily presence of visitors; (b) socioeconomic performance of the winter-tourism system; (c) symbolic performance of “Harbin as ice-and-snow city”; and (d) technologically manifest layer of platform-data traces. The current analysis focuses primarily on (d), the technologically manifest layer as captured by Baidu heatmaps, while explicitly acknowledging that this constitutes only one part of a more complex reality. This justifies the need for further data integration and underscores the insufficiency of a purely empiricist stance [5,6].
Based on this, the study operationalizes the metamodernist framework into three core dimensions:
Oscillatory Ontology: This acknowledges that urban space (e.g., Harbin) presents different “realities” in different seasons and for different actors. The “tourist hot spots” of the peak season and the “resident living circles” of the off-season are oscillating states of the same space under different spatiotemporal contexts; each is real within its specific situation, and they are interwoven.
Post-paradigmatic and Post-disciplinary Methodology: Rejecting either-or methodological choices, this study practices methodological pluralism. It integrates various techniques like X-means clustering, geographical detector, and GWR modeling to capture different facets of urban complexity.
Morphological Analytical Perspective: This perspective treats the built environment (e.g., POIs) as a material-semiotic unity, analyzing how it anchors different meanings to space across seasons and thereby guides crowd behavior [6].
The profound significance of seasonal fluctuations lies in their revelation of a structural oscillation wherein the city periodically switches between different “roles.” This switching is far from a mere “engineering management” issue; it is a core theoretical concern touching upon urban identity, spatial justice, and sustainability [5,6]. The application of this theoretical framework aims to provide a post-paradigmatic analytical tool for understanding such phenomena—one that can embrace complexity, accommodate dynamic tensions, and offer synthetic insights.

2.5. Research Methods

2.5.1. Fishnet Analysis

This study adopts a 300 m by 300 m regular grid as the fundamental spatial analysis unit, which was constructed using ArcMap 10.7 (Esri, Redlands, CA, USA), based on the WGS 1984 UTM Zone 52N projected coordinate system [24]. This projection zone is suitable for areas approximately between 48° N and 54° N, effectively controlling geometric distortion. The determination of the grid size comprehensively considers the spatial coverage requirements of the study area’s total extent (approximately 600 km2) and the need to identify spatial heterogeneity at the neighborhood level. It maintains computational efficiency while balancing the spatial resolution capability for micro-level elements.
Compared to administrative boundaries, regular grids better align with the spatial continuity of human activities, avoiding distortions introduced by artificial demarcations. Although the modifiable areal unit problem (MAUP) exists, the macroscopic patterns and conclusions derived from this study demonstrate considerable robustness to variations in grid parameters [25]. Future research could employ multi-scale analysis to further examine granularity sensitivity and enhance the universality of the conclusions.

2.5.2. SDNA

This study employed the sDNA model to conduct a quantitative analysis of the street network in Harbin. Two core metrics were adopted:
(1)
Betweenness (TPBt): This metric reflects the frequency with which a road segment lies on the shortest paths between all pairs of origins and destinations within the network. A higher value indicates a greater potential for pedestrian and vehicular flow. The calculation formula is shown in Equation (1):
T P B t ( x ) = y N z R y O D ( y , z , x ) W z P z t o t a l   w e i g h t ( y )
where OD(y,z,x) is a shortest-path function, W(z) is the weight of node z, and P(z) is a proportionality factor.
(2)
Closeness (NQPDA): This metric characterizes the ease of reaching all other locations within a search radius from a specific road segment. A higher value indicates stronger accessibility and centrality. The calculation formula is shown in Equation (2):
N Q P D A ( x ) = y R x P ( y ) d θ x , y
where P(y) is the weight of node y, and d θ x , y represents the angular distance between nodes x and y.
Search radii of 1000 m (reflecting a neighborhood scale) and 10,000 m (reflecting an urban scale) were selected for calculating the aforementioned metrics. The results serve as explanatory variables in the subsequent regression analysis.

2.5.3. X-Means Clustering Analysis Method

To identify the spatiotemporal characteristic patterns of crowd activity within urban areas, this study employed the X-means clustering algorithm, which was implemented in Python 3.6 (via the Anaconda distribution) using key libraries including pandas (v0.23.0) and NumPy (v1.14.3), to analyze the hourly aggregation and dispersion intensity data from both the peak and off-seasons. This algorithm is based on the K-means framework and performs clustering by minimizing within-cluster distances. Its core advantage, however, lies in the ability to dynamically evaluate the quality of different cluster numbers (k) using the Bayesian Information Criterion (BIC) to automatically determine the optimal number of clusters. The calculation formula for the Bayesian Information Criterion is shown in Equation (3):
B I C = 2 ln L ^ + k ln n
where L ^ is the maximum likelihood of the model, k is the number of parameters in the model, and n is the sample size. This study partitioned Harbin into several functional zones characterized by typical spatiotemporal fluctuation patterns, thereby enabling an in-depth investigation into the differential responses of various zones to seasonal and holiday variations.

2.5.4. Geographical Detector

The Geographical Detector is a statistical model designed to detect spatial heterogeneity and its relationship with influencing factors in geographical phenomena. This study comprehensively employs two methods—factor detection and interaction detection—to systematically reveal the driving mechanisms behind the spatial aggregation and dispersion intensity of crowds in Harbin, and to identify key influencing factors and their interactions. The core metric of the model is the q-statistic, which quantifies the explanatory power of an independent variable on the spatial heterogeneity of the dependent variable. A higher q-value indicates a greater ability of the independent variable to explain the spatial variation in the dependent variable.The Geographical Detector analysis was performed using its dedicated software (Yang et al., 2010) [26]. The calculation formula is shown in Equation (4):
q = 1 h 1 L N h σ h 2 N σ 2 = 1 S S W S S T
In the formula, h represents the strata (sub-regions) formed by the classification of the independent variable; N h and σ h 2 are the number of samples and the variance of the dependent variable within the h-th stratum, respectively.

2.5.5. GWR

The GWR analysis was implemented using ArcMap 10.7 (Esri, Redlands, CA, USA). GWR is a local modeling technique whose core principle allows regression coefficients to vary with geographic location [27], thereby enabling the revelation of the spatially heterogeneous effects of driving factors. The formula is shown in Equation (5):
Y i = β 0 u i , v i + k = 1 p β k u i , v i X i k + ε i
where Y i is the observed value of the dependent variable for sample i, β 0 u i , v i is the local intercept term, X i k is the value of the k-th explanatory variable at location i, β k u i , v i is its local regression coefficient, and εi is the random error.
This study separately constructed GWR models for the off-season and the peak season. By calculating the local regression coefficients for each grid cell, it delineates the spatial differentiation in the direction and intensity of each driving factor’s influence, thereby identifying key factors and their effective spatial ranges of influence.

3. Results

3.1. Characteristics of Crowd Gathering and Dispersal Intensity

Significance of Spatial Clustering and Differentiation Characteristics of Total Crowd Gathering and Dispersal Intensity

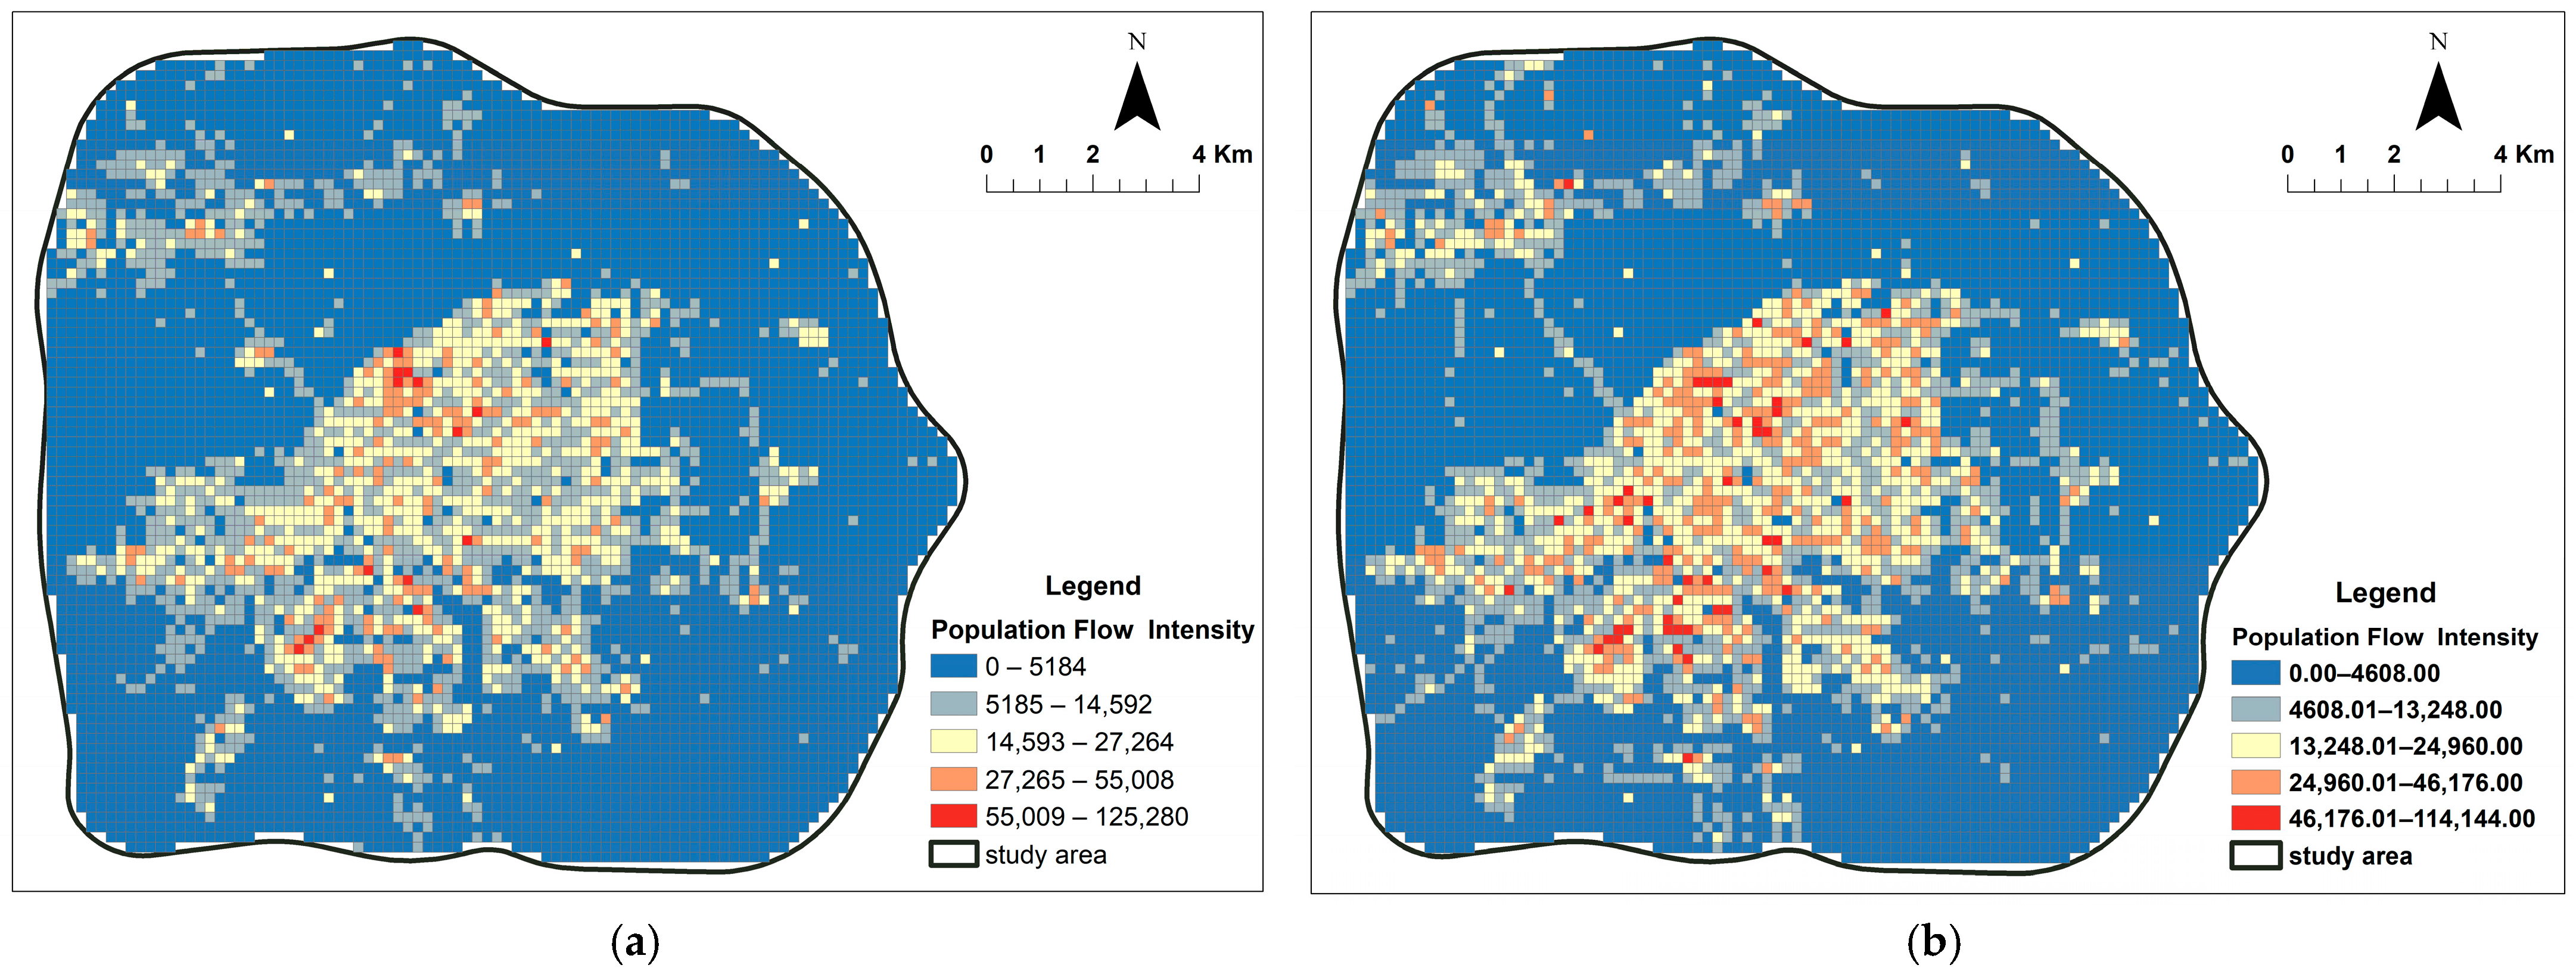
This section summarizes the absolute values of the hourly crowd aggregation and dispersion from 6:00 to 24:00 for each of the two days. The crowd aggregation/dispersal data is derived by calculating the difference between the heatmap data of the subsequent hour and the preceding hour. The results are then joined to the grid cells based on spatial attributes, yielding the total intensity of crowd aggregation and dispersion, as shown in Figure 5.
As shown in the figure, during the peak season holidays, population movement in Harbin exhibits characteristics of high intensity, extensive spatial distribution, and multi-nuclei aggregation. The intensity of population movement increases universally across the city, with simultaneous growth in trips made by both tourists and local residents, resulting in a citywide increase in pedestrian flow. Core scenic areas like Zhongyang Street and the Ice and Snow World, along with major commercial districts such as Haxi Wanda and Qiulin Company, experience a significant rise in population gathering and dispersal scale. Compared to regular periods, the Jiangbei area and the Ice and Snow World emerge as new high-intensity aggregation zones.
During the tourism off-season, urban population activity displays distinct localization and function-oriented characteristics, with the total aggregation intensity noticeably lower than in the peak season. The areas with the highest aggregation intensity are primarily distributed around core commercial districts, urban complexes, hospitals, and distinctive scenic spots. Although it is the off-season, these areas maintain a certain level of vitality supported by the leisure consumption of local residents. Overall, the population movement in Harbin during the off-season holidays presents a pattern dominated by commercial and medical functions. The comparison between the two periods reveals a significant functional transformation of the tourism city: service functions are temporarily expanded based on external consumption during the peak season, whereas the city reverts to an endogenous demand mode dominated by basic services during the off-season.
This seasonal shift is not merely a simple pattern change, but an empirical manifestation of the structural oscillation revealed by metamodernist theory—a periodic switching between the two poles of “global tourist consumption” and “local resident life,” which constitutes an essential characteristic of tourism city development. This oscillation reflects the dynamic anchoring process of urban vitality across different “layers of reality” (such as material flows and social interactions), rather than static functional zoning. These results indicate that for managing population pulses during the peak season, it is necessary to first enhance the carrying capacity and evacuation efficiency of core areas to cope with instantaneous peak passenger flows. Conversely, during the off-season, strategies should focus on activating peripheral urban nodes and enhancing functional mix to prevent insufficient urban vitality, thereby balancing seasonal fluctuations.
(1)
High/Low Clustering Analysis
To test the spatial clustering pattern of population flow, the General G statistic was calculated. The results are shown in Table 3. According to the results, population flow in Harbin during both peak and off-seasons showed statistically significant spatial clustering characteristics. Both periods exhibited strong positive spatial autocorrelation, with very pronounced features of high-value and low-value clustering. This provides a basis for subsequent use of models considering spatial effects.
(2)
Hot Spot Analysis
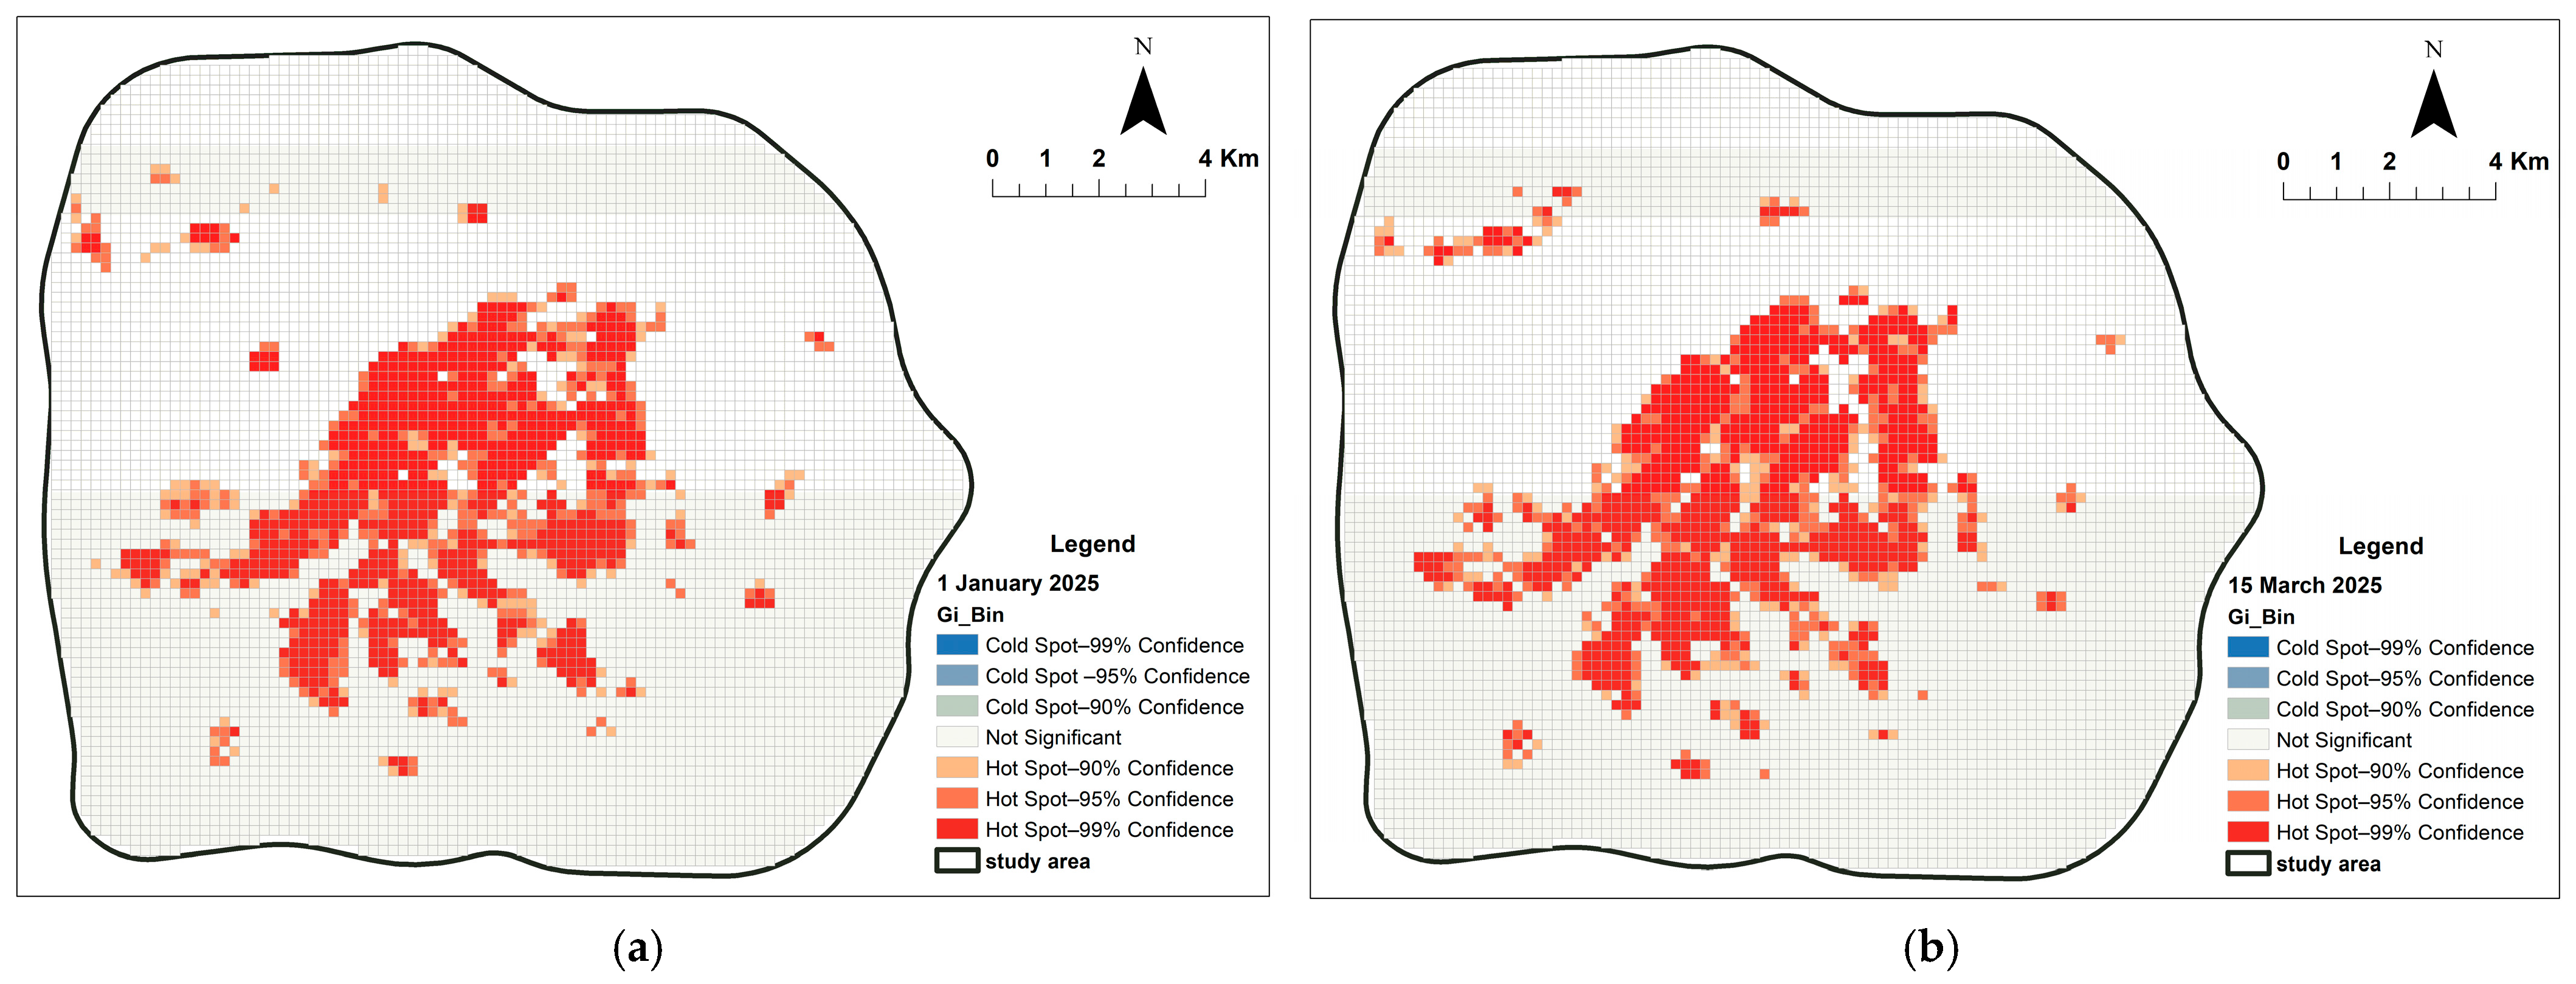
A hot spot and cold spot analysis was performed on the total population aggrega-tion and dispersion intensity for the two days, with the results presented in Figure 6. The spatial distribution displays a clear core-periphery concentric structure, with high-value areas concentrated in the urban center and low-value areas distributed in the periphery [28]. The central and southern parts are dominated by contiguous hot spot areas, showing a high-value spatial positive correlation at the 99% confidence level, indicating extremely significant clustering characteristics of crowd activity intensity. The periph-eral and northern areas, conversely, are primarily distributed with low-value clustered cold spots. Cold and hot spot areas at different confidence levels present a distinct gra-dient variation pattern. The spatial distribution of hot spot areas highly aligns with major commercial centers, transportation hubs, and key scenic areas, while cold spot areas mainly correspond to the urban periphery and underdeveloped zones. This pattern suggests that high-value clustered areas undertake the city’s core commercial, trans-portation, and tourism functions, whereas low-value clustered areas reflect the relatively insufficient vitality of the urban peripheral regions.

3.2. Clustering Characteristics of Crowd Aggregation and Dispersion

This section employs the X-means clustering analysis method to analyze the time series vectors for the off-season and peak season, respectively, covering the daily period from 6:00 to 24:00. The results reveal the types, quantities, distribution, and characteristic features of the two temporal patterns of crowd gathering and dispersal within Harbin’s Fourth Ring Road The analysis of these crowd gathering and dispersal patterns comprehensively reflects the impact of temporal and spatial variations on crowd activity, thereby providing an in-depth understanding of the spatiotemporal behavioral characteristics of the population. For each identified category, a line chart was plotted highlighting the average value line, alongside providing distribution maps for each category.

3.2.1. Analysis of Crowd Gathering and Dispersal Categories During the Peak Season

Clustering analysis was performed on the time series vectors for both the off-season and the peak season, resulting in the identification of three distinct cluster characteristics.
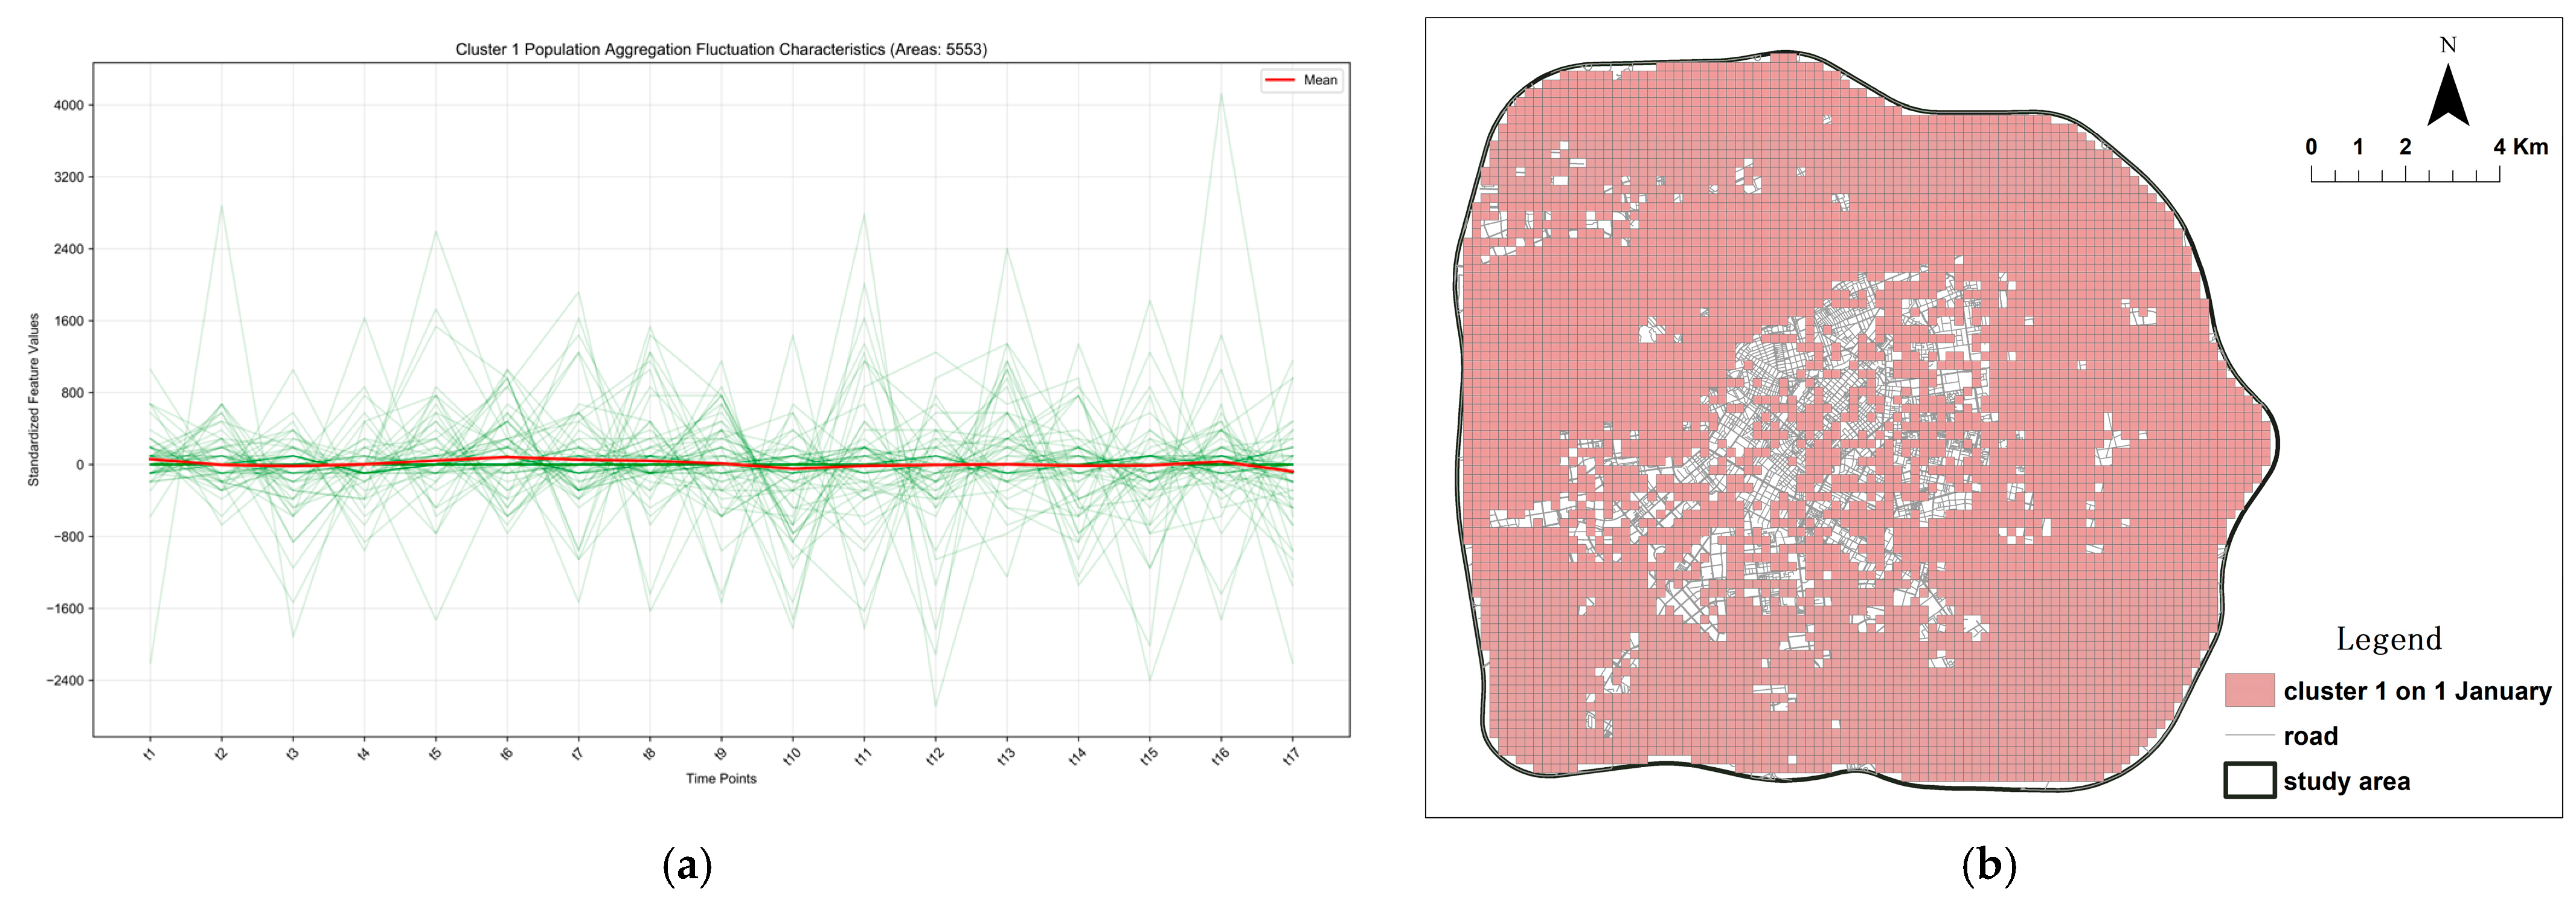
The results for Cluster 1 are shown in Figure 7. It represents typical transit-oriented areas and sparsely populated zones in the urban periphery. The transit-oriented areas exhibit rapid fluctuations throughout the day, being persistently active yet maintaining a consistent total intensity, primarily located along major transportation arteries and urban ring roads. The sparsely populated zones, due to low residential density and the predominance of non-residential land uses, demonstrate consistently low intensity levels with minimal fluctuation amplitude throughout the day. Spatially, these two types of areas combine to form a distinct ring-shaped distribution pattern.
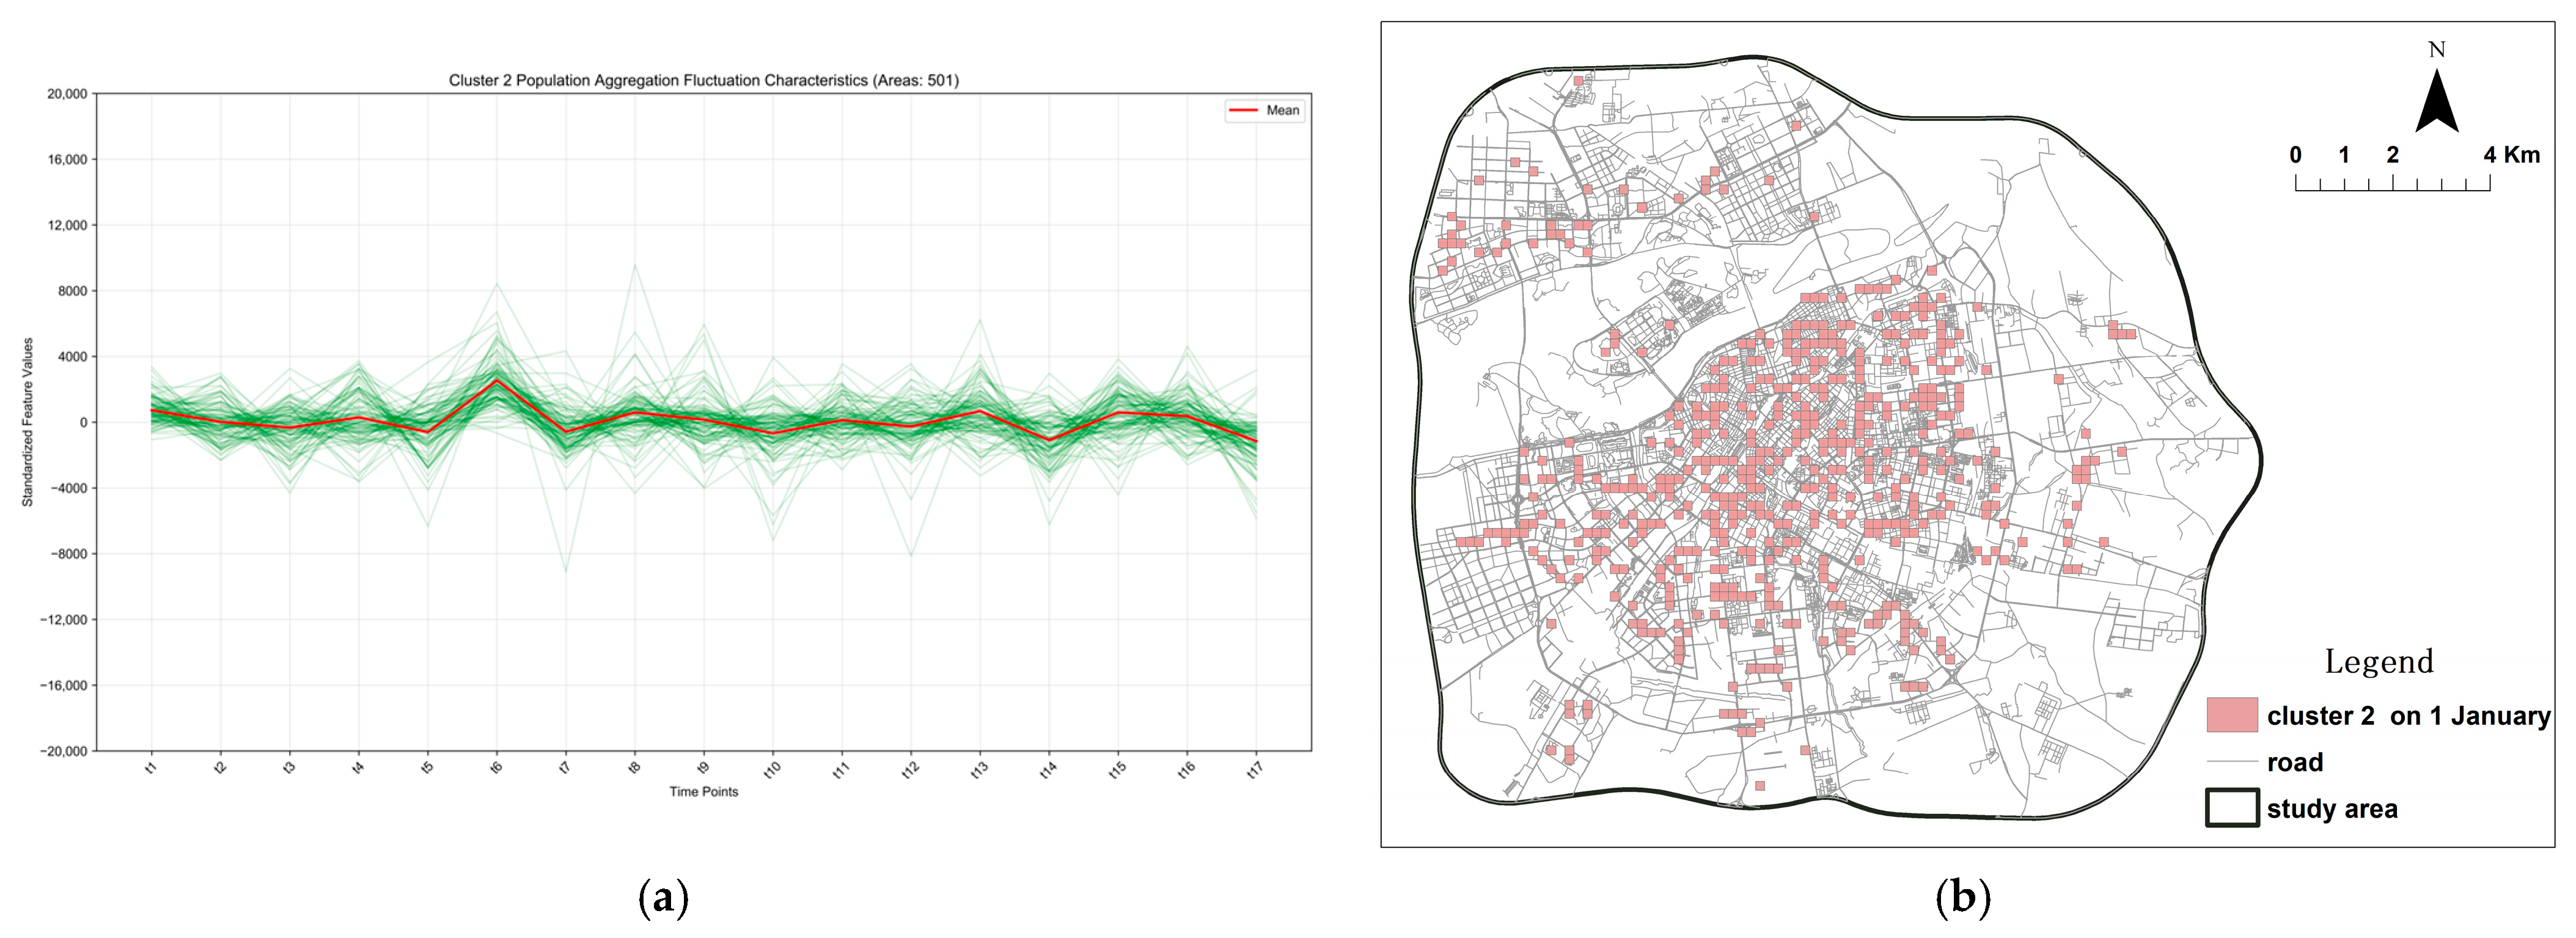
The results for Cluster 2 are shown in Figure 8. This cluster serves the functions of passenger flow distribution and supporting service facilities. It is primarily located in the peripheral areas surrounding core tourist attractions and commercial facilities, based on residential zones. Dominated by through-traffic activity, it primarily handles the aggregation and dispersion of passenger flows. It exhibits continuous fluctuations with small amplitude and high frequency, influenced by the spillover effects of customer flow from the main commercial districts. Distinct peaks are observed only at noon and in the evening.
This spatiotemporal pattern significantly differs from that of Cluster 3, which is characterized by pronounced aggregation and consumption functions. Furthermore, the activity peaks in Cluster 2 lag approximately one hour behind those in Cluster 3, indicating a dependency relationship. From an urban planning perspective, incorporating independent functions into these areas is recommended to enhance their resilience.
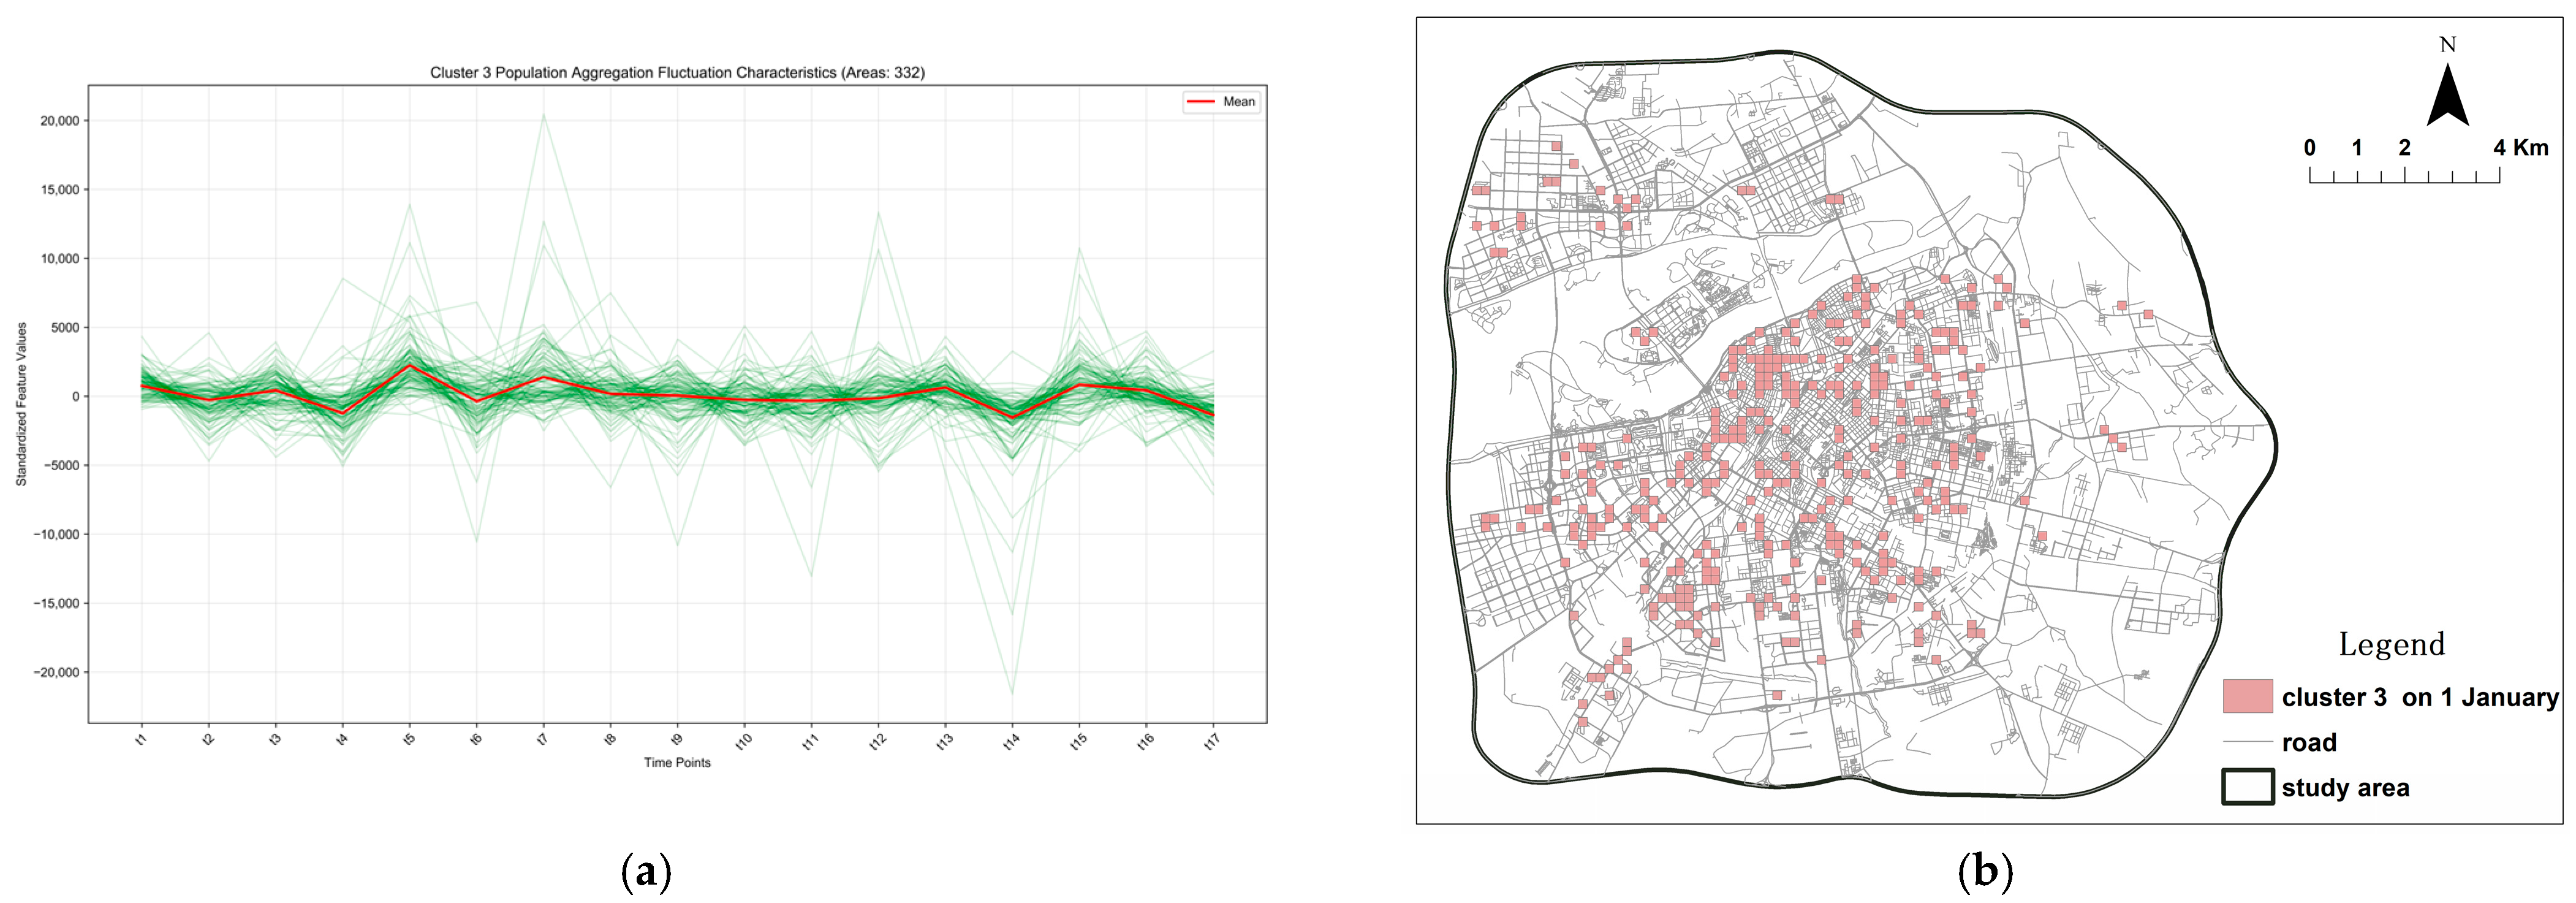
Figure 9 shows the results for Cluster 3, identified as the core commercial area. This cluster exhibits periodic aggregation primarily driven by dining and shopping activities, with its intensity precisely synchronized with business operating hours. As the destination for population activities, it is directly propelled by consumer behavior. Consumers’ habit of staggering their visits leads to a sharp fluctuation occurring approximately one hour earlier at noon compared to Cluster 2. During the afternoon, population aggregation and dispersion remain relatively stable, achieving a dynamic equilibrium which extends customer dwell time. After a sharp decline in the evening, a slight rebound occurs due to nighttime consumption activities, although a clear disconnect exists between these two phases indicating poor transition management. The mixed commercial and residential nature of the area means the residential population serves as both a foundational element and an active participant in the aggregation–dispersion fluctuations, confirming the characteristics of functional zone population mobility.

3.2.2. Analysis of Crowd Gathering and Dispersal Categories During the Off-Season

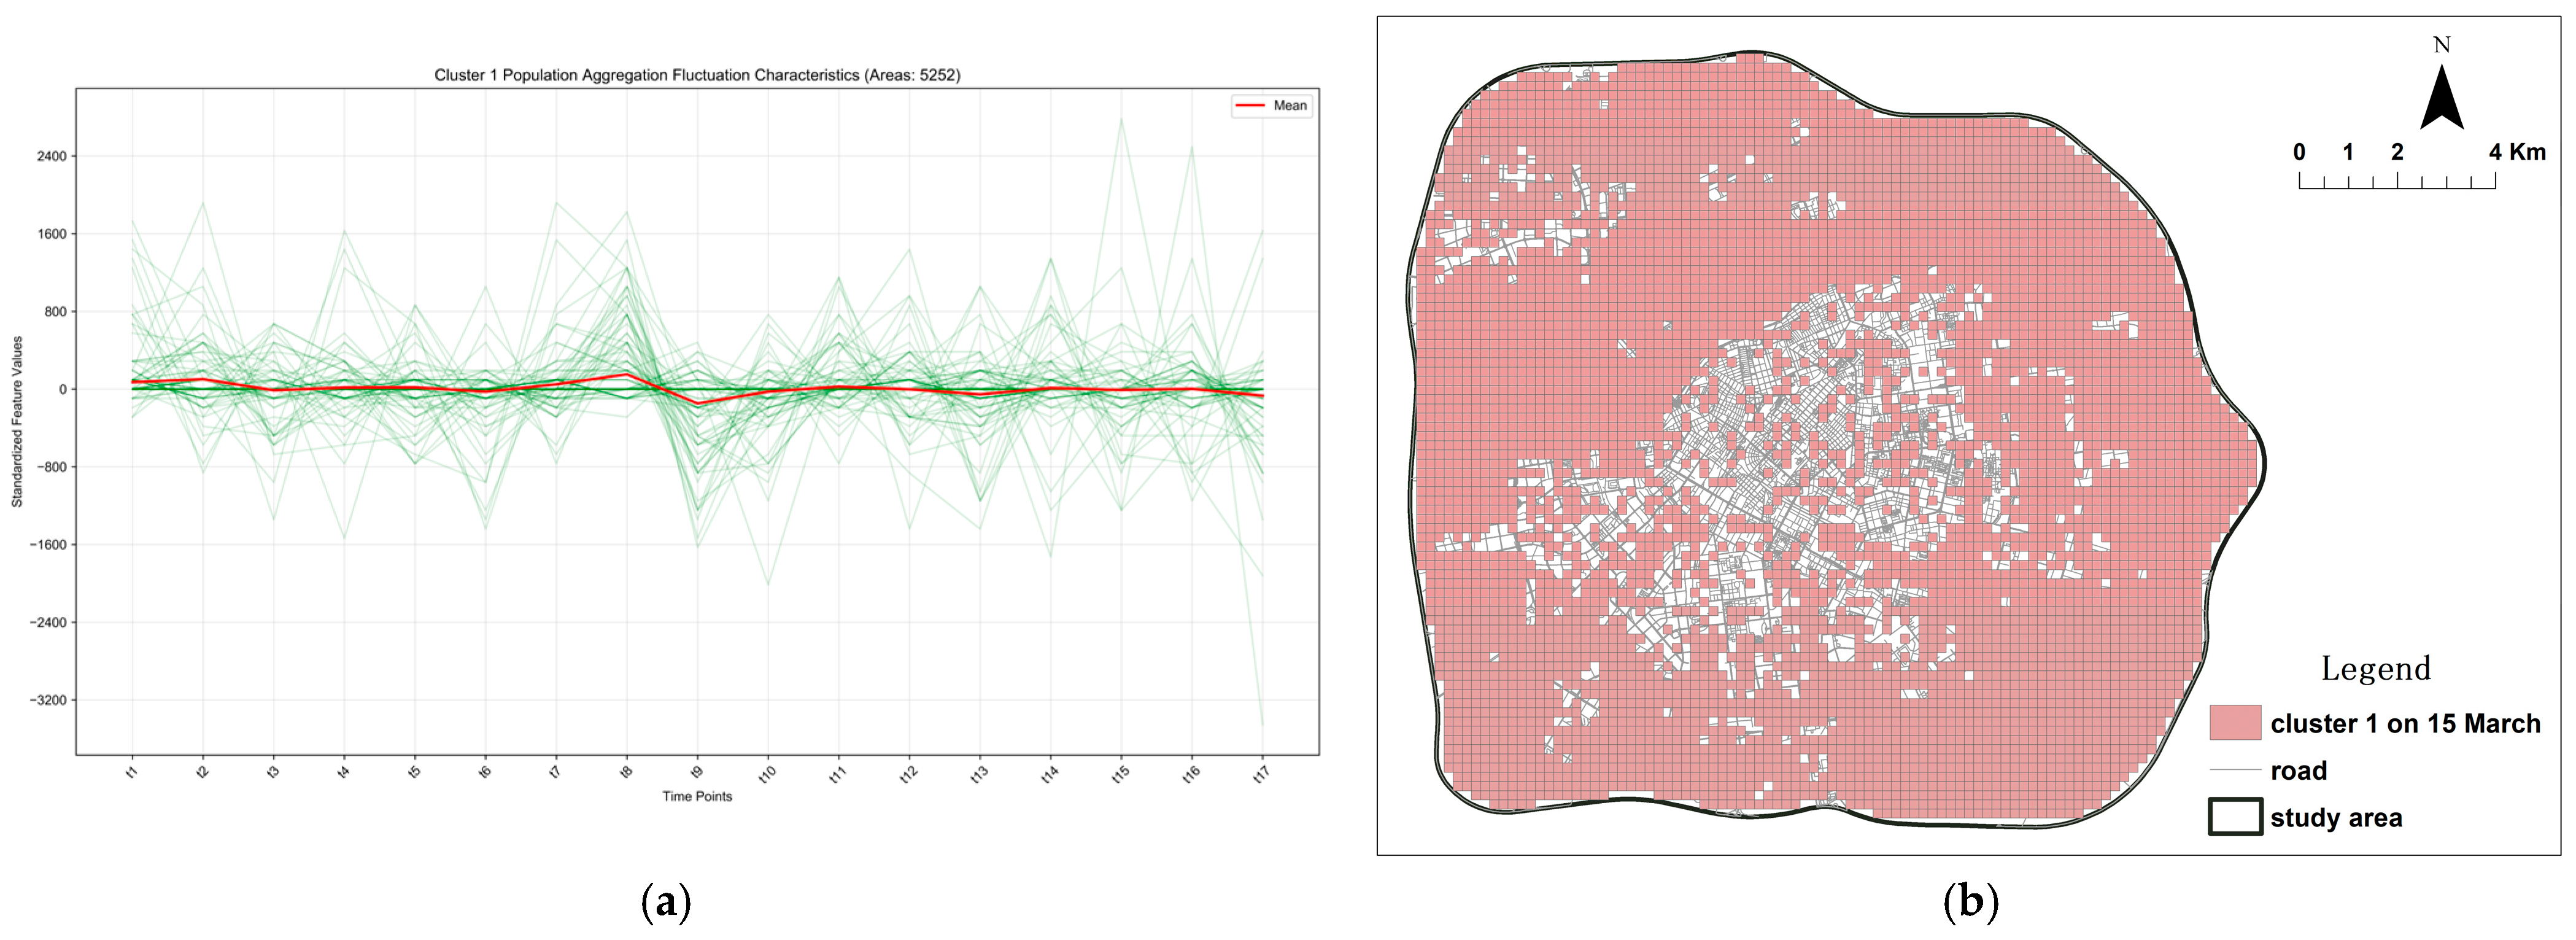
During the tourism off-season, in contrast to the overall gradual and sustained patterns of the peak season, Cluster 1 exhibits a pattern of general stability with localized fluctuations, as detailed in Figure 10. This is primarily because the peak season is driven by a continuous, steadily influx of external tourist traffic flows, whereas the off-season is propelled by the daily commuting and essential life trips of local residents, resulting in a more pulsating and volatile pattern. These areas primarily serve a transit or through-traffic function during the peak season but exhibit lower vitality during the off-season. Consequently, urban management should focus on enhancing the basic services in these areas to improve their year-round resilience and prevent seasonal underutilization or functional decline.
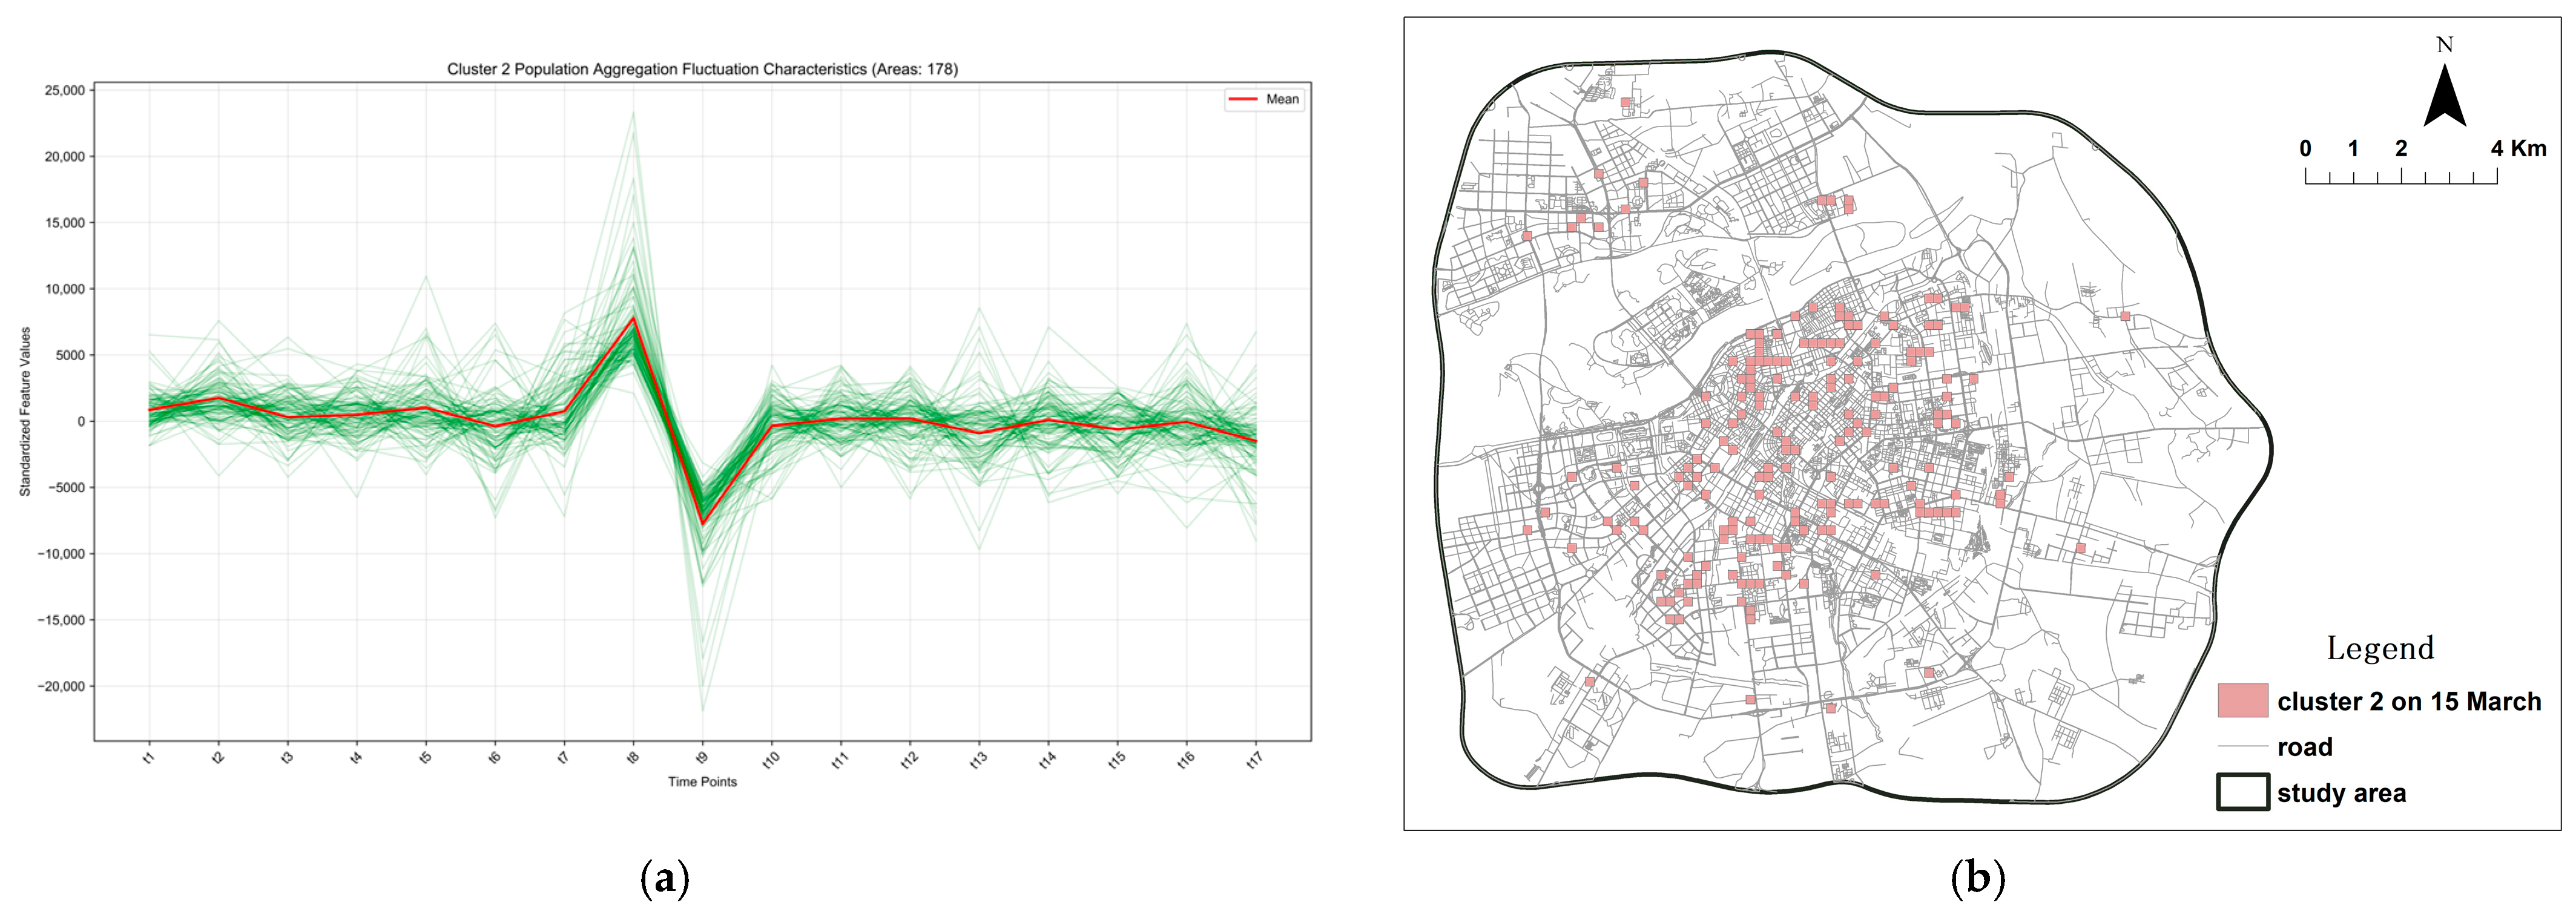
Cluster 2 is located in peripheral areas of commercial districts and scenic spots, exhibiting a distinct nodal distribution pattern as shown in Figure 11. Relying primarily on activities of local residents, its pulsating fluctuations differ significantly from the high-frequency, continuous patterns observed during the peak season. A sharp rise in aggregation intensity occurs between 13:00 and 14:00, forming a prominent pulsating peak, followed by a rapid decline between 14:00 and 15:00. This short-duration, high-intensity aggregation pattern aligns closely with the urban lunchtime peak period, demonstrating the transient and directed nature of its service functions.
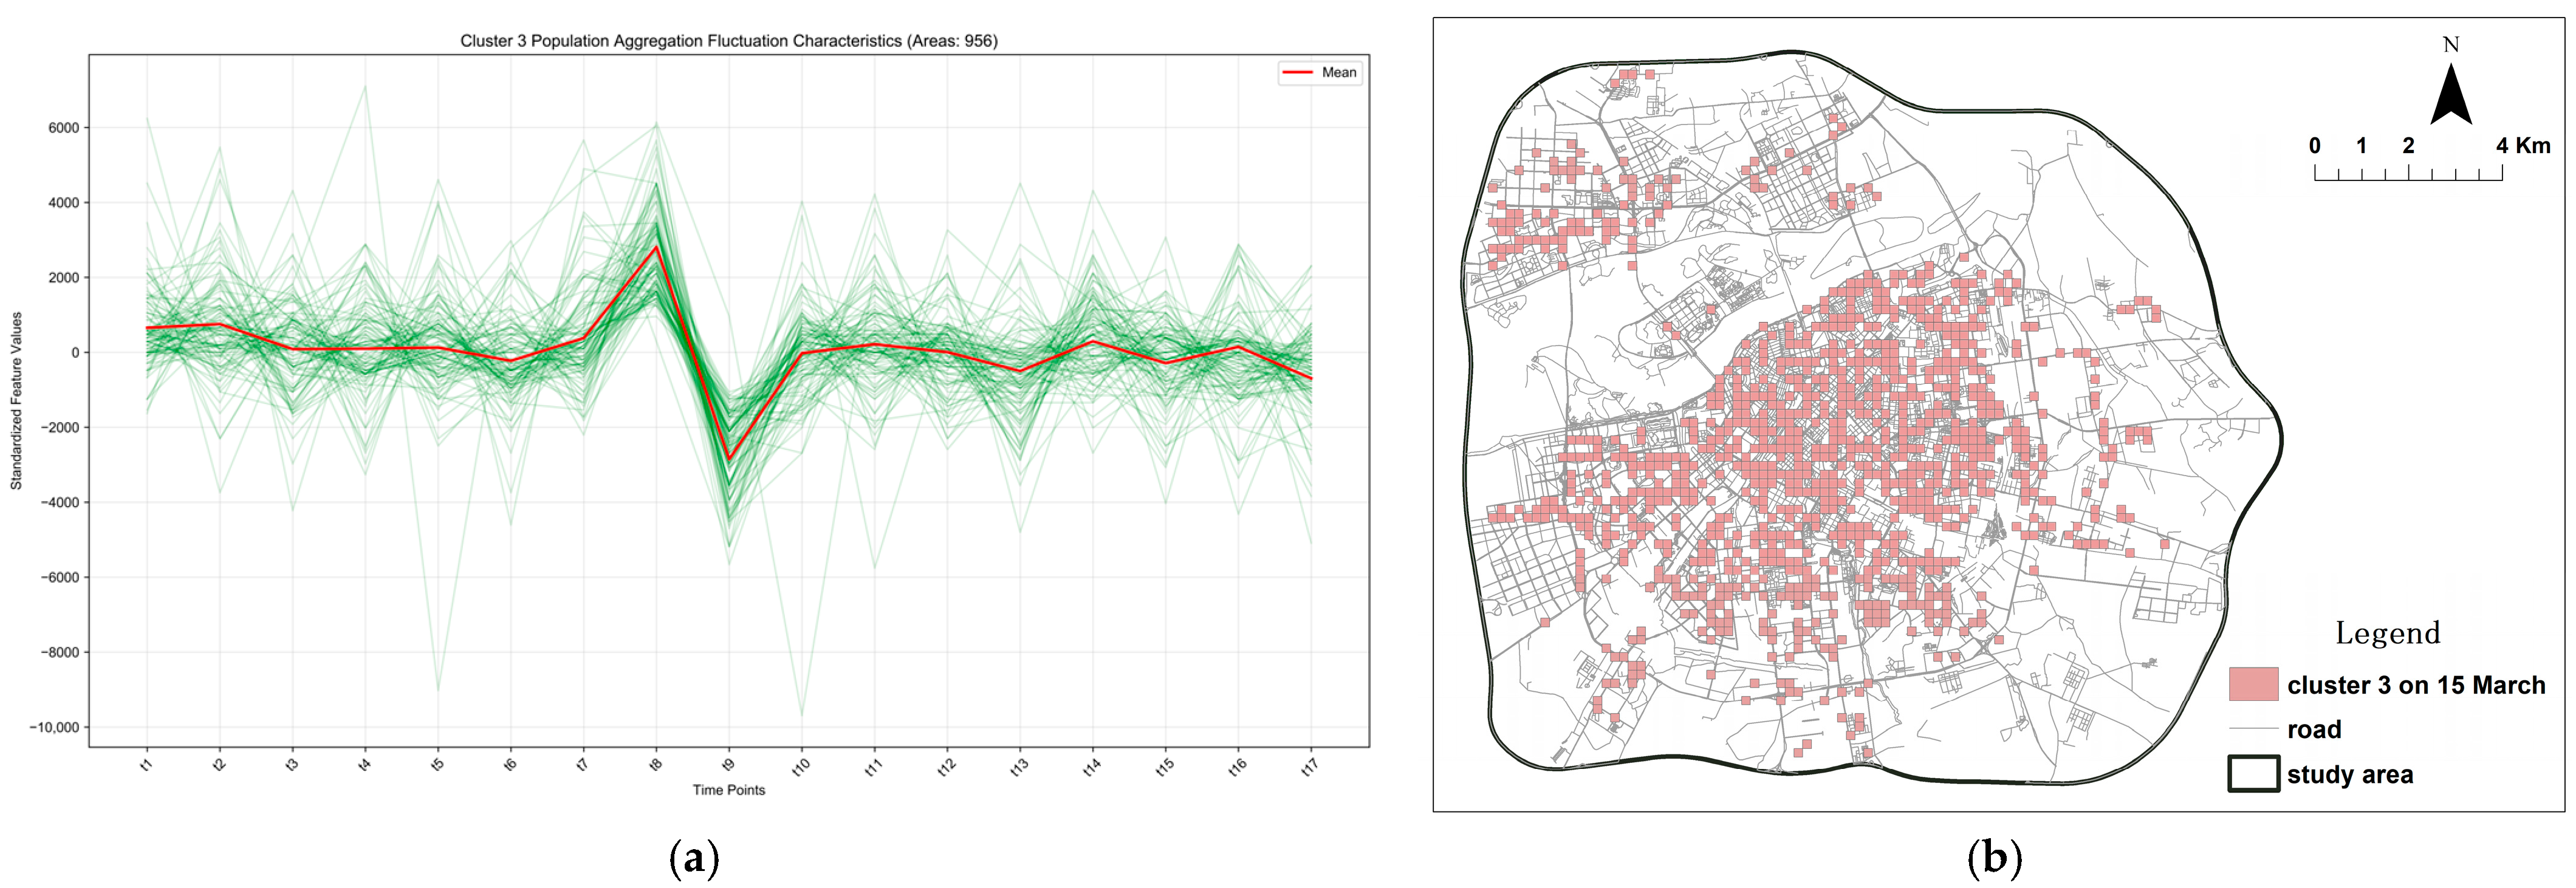
The results for Cluster 3 are shown in Figure 12. Its fluctuation amplitude is greater than that of Cluster 2. Influenced by both consumption activities and residential life, this cluster exhibits higher aggregation/dispersion intensity and a more complex structure. It is densely distributed within commercial districts, scenic spots, and residential areas, showing an areal distribution pattern. Population movement persists even during nighttime hours, supported by the residential population. This enhances the cluster’s resilience, enabling it to better withstand the impact of the off-season. This constitutes a healthier, more sustainable spatial form capable of coping with seasonal fluctuations.
In commercial support zones and commercial districts, management strategies during the peak season should address pulsating tourist flows, for example, by establishing temporary distribution points and implementing measures like timed entry. During the off-season, the focus should shift to maintaining daily vitality through functional mixing, such as introducing local life services and adding new points of interest.

3.2.3. Comparative Analysis of Clustering Characteristics of Crowd Gathering and Dispersal in Peak and Off-Seasons

The aggregation and dispersion patterns of different clusters during peak and off-peak seasons are summarized, with results shown in Figure 13. Comparing the pedestrian flow patterns between the two periods, the peak season exhibits global fluctuations, whereas the off-peak season demonstrates local tidal patterns. During the peak season, fluctuations are more pronounced, with higher and more frequent peaks. Clusters 2 and 3 show a negative correlation during midday, indicating more dispersed pedestrian flows. Population numbers change across all areas, and the activity patterns of different groups vary significantly, reflecting a more dynamic urban environment. In contrast, off-peak urban activities are primarily driven by the daily commutes, work, and life routines of local residents. Activity patterns across different groups are highly similar, with the most intense fluctuations occurring around noon and remaining stable during other times. Population activities are more concentrated, overall characterized by low intensity and stability. During this period, the urban operational rhythm is relatively steady, pedestrian flows are more predictable, and the pressure on public services is relatively reduced.
Building on Storm’s theory of social kinds and anchoring mechanisms, this study reframes the functional zones identified by X-means clustering—transit-oriented areas, supporting service zones, and core commercial districts—not as static functional partitions, but as dynamically anchored social kinds. These are seasonally activated configurations whose stability is maintained through distinct anchoring processes.
Taking the “core commercial district in the peak season” as an example, it is not a fixed entity but a social kind that is seasonally activated and sustained through the following mechanisms: Nominal anchoring through official narratives and city branding such as ‘Host City of the Asian Winter Games’ and ‘International Ice and Snow Tourism Destination,’ which assign specific symbolic meanings to the area; Mimetic anchoring through the replication and dissemination of successful ice and snow landscape designs, creating replicable spatial templates that enable the tourism function of the ‘core commercial district’ to be reproduced across regions; and Ergonic anchoring through the construction of specialized winter infrastructure, dense hotel networks, and tourism service facilities, ensuring this social kind can materially and functionally accommodate pulse-like tourist flows.
This perspective transforms urban space from a static “container” into a tension-filled “process.” The “population pulse” is not an external shock to a stable system, but an outward expression of the city’s inherent oscillatory vitality. Recognizing that urban space is “dynamically anchored” rather than “statically zoned” helps to develop more flexible planning strategies that adapt to periodic changes, achieving sustainable urban vitality within the tension between global flows and local embeddedness.

3.3. Analysis of the Operational Mechanisms of Driving Factors

3.3.1. Spatial Characteristics Analysis of Explanatory Variables

After processing the initial data, the explanatory variables required for this study were obtained, and their visualizations are shown in Figure 14. Before conducting an in-depth analysis of the spatial distribution characteristics of each explanatory variable, this study first performed a global spatial autocorrelation test on all variables. As shown in Table A1, the Moran’s I values for all variables were positive and passed the significance test (p < 0.01), indicating the presence of highly significant spatial dependence. This provides both theoretical justification and necessity for the subsequent use of the GWR model to detect their local influences, satisfying the prerequisite for spatial visualization and subsequent spatial modeling analysis.
On this basis, the visualized spatial distribution patterns of the variables clearly reveal that the built environment explanatory variables exhibit significant spatial heterogeneity, forming an overall pattern where a “strong core” coexists with “secondary centers” within the city. In the transportation dimension, the urban core area and main arterial roads possess the highest movement potential at both pedestrian and vehicular levels, demonstrating a concentric structure that peaks in the central urban area and gradually attenuates outward along the radial and ring road network. In terms of morphology and function, high-value areas for building density and floor area ratio are densely distributed within the traditional built-up area inside the Third Ring Road, particularly represented by historical cores such as Zhongyang Street and the Qiulin commercial district, showcasing high-intensity, continuous development characteristics. The spatial distributions of various POI densities and the functional mix index are highly coupled with the development intensity pattern, but secondary nodes have also gradually emerged in newer areas such as Qunli and Haxi. Housing prices are relatively higher in the Qunli New Area, Haxi, and Jiangbei. Based on these variables, the following analysis will explore the heterogeneity of population aggregation and dispersion in Harbin.

3.3.2. GWR Analysis for the Peak Season

  • Variable Selection and GWR Model Specification
To ensure the robustness of the model, a rigorous variable selection process was conducted prior to constructing the final Geographically Weighted Regression (GWR) model to eliminate multicollinearity interference. The specific procedure, detailed in Appendix A (Table A2, Table A3, Table A4 and Table A5), was as follows: initial significant variables were identified based on a global Ordinary Least Squares (OLS) model (Appendix A Table A2 and Table A3); subsequently, variables with high correlation were eliminated according to the criterion of Variance Inflation Factor (VIF) < 5, and indicators inconsistent with theoretical expectations were excluded, resulting in the final variable set for GWR analysis (Appendix A Table A4 and Table A5).
This study employed the GWR tool in the ArcMap 10.7 platform for local estimation. The key parameters were set as follows: the kernel type was specified as ADAPTIVE. This selection aims to better adapt the model to the uneven urban spatial form of Harbin by using a smaller neighborhood in the data-intensive central urban area to capture fine-grained variations and a larger neighborhood in the data-sparse peripheral areas to ensure estimation stability. The bandwidth method utilized the AICc minimization criterion. This parameter combination automatically determines the optimal bandwidth, effectively balancing model complexity and goodness-of-fit. Consequently, the model precisely adapts to the uneven urban spatial morphology of Harbin, providing a robust methodological foundation for analyzing local effects.
2.
Performance Comparison of Peak-Season Models and Analysis of Driving Mechanisms
Based on the aforementioned model specification, a performance comparison between the GWR and OLS models (Table 4) reveals that the GWR model achieves an R2 value of 0.736 and an Adjusted R2 of 0.723, both significantly higher than the corresponding values of 0.679 for the OLS model. Furthermore, the AICc value of the GWR model is substantially lower. The GWR model demonstrates superior performance over the global OLS model across all key metrics, exhibiting stronger explanatory power and a greater capability to capture the spatial heterogeneity inherent in population activity.
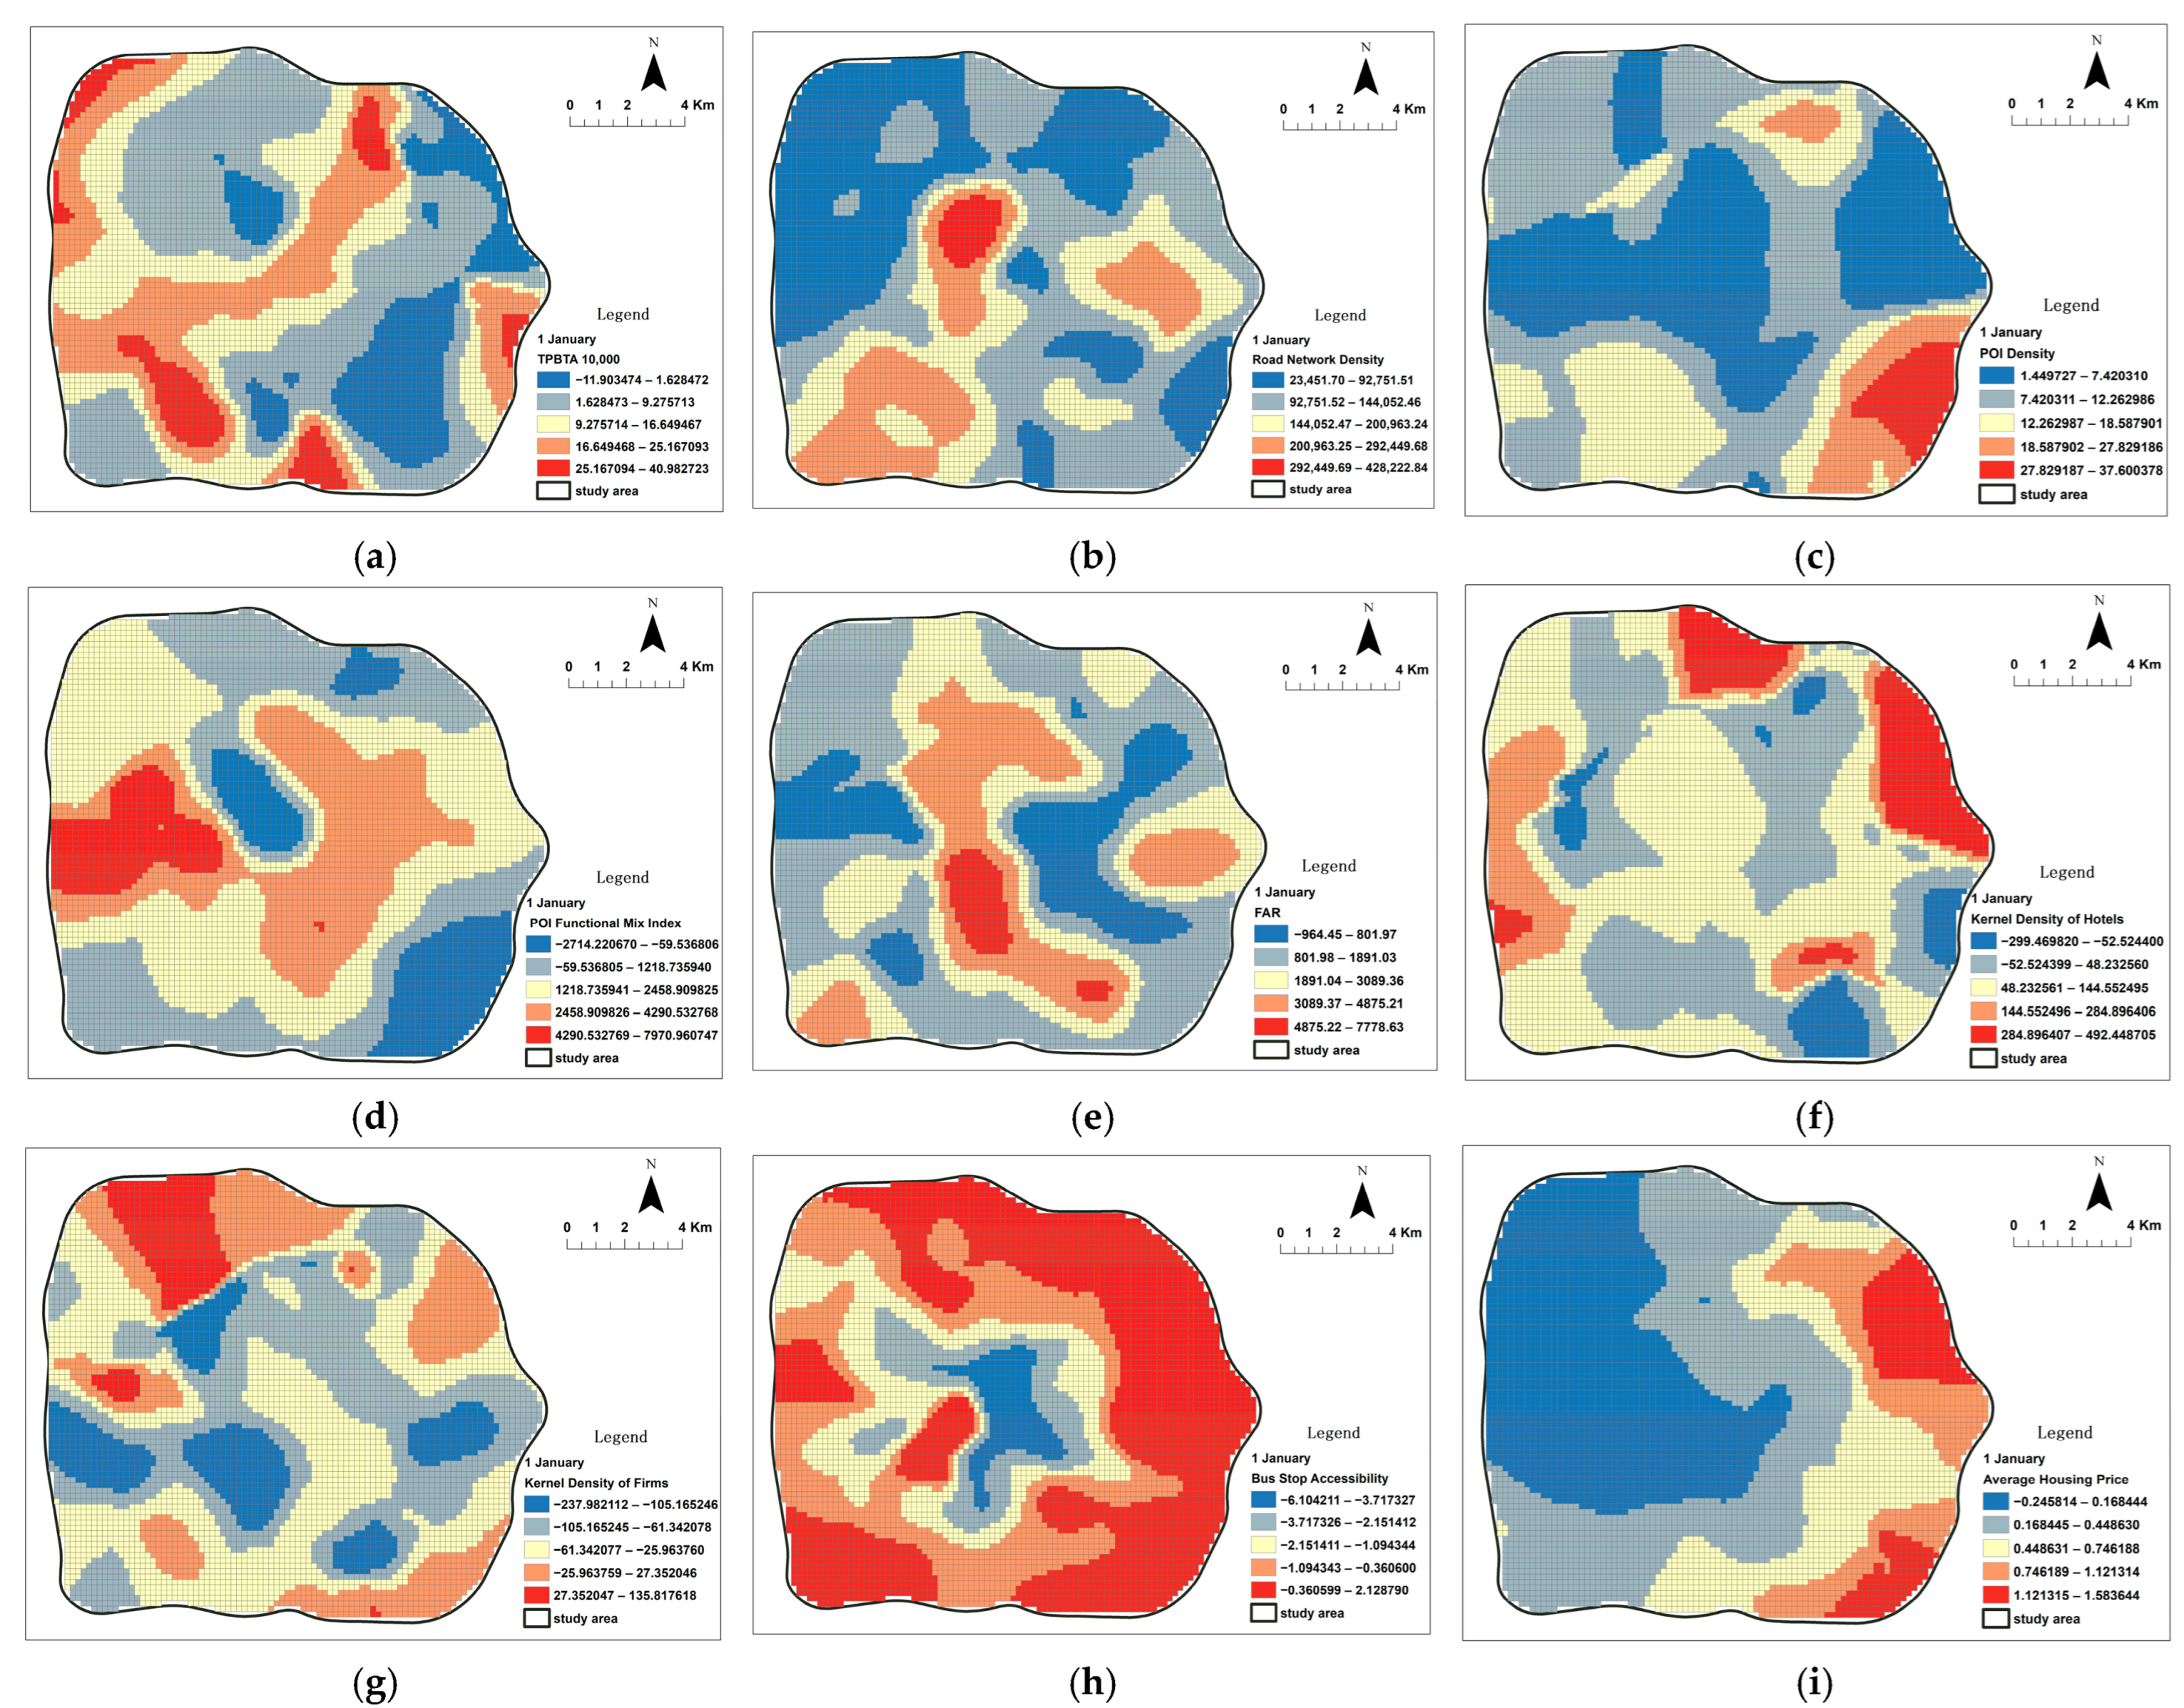
Building on this, the study further utilized the visualization of GWR local coefficients (Figure 15) to conduct an in-depth analysis of the spatially heterogeneous mechanisms of various driving factors. The results clearly demonstrate significant spatial non-stationarity in the influence of built environment factors on population aggregation/dispersion intensity, rather than the global average effects revealed by traditional OLS models.
The analysis indicates that the influence of the nine explanatory variables on the peak-season population aggregation/dispersion intensity exhibits significant spatial heterogeneity, and their actual effects in local areas require comprehensive judgment. The following conclusions are drawn from a comprehensive analysis:
(1)
Efficient and dense road network conditions form the foundation for population movement aggregation and dispersion, but their specific effect depends on the synergistic function of the overall area. As shown in Figure 15a,b,h, in functionally composite areas such as the surroundings of Harbin West Railway Station and the Qunli New Area, the road network effectively leverages the advantages of commercial complexes and public spaces. Conversely, in single-function areas like Ashi River Wetland Park and Zhaolin Park, the advantage of the road network is difficult to translate into population vitality.
(2)
The effectiveness of POIs relies not only on their quantity but also on their functional types and mix. Figure 15c,d (POI density and functional mix index) show that around Zhongyang Street, although the number of POIs is high, severe homogenization and a lack of facilities like cultural and leisure venues lead to a negative correlation between the POI mix index and population vitality. In contrast, emerging areas such as those around Haxi Wanda and Qunli have room for development, where new commercial developments better align with modern demands, resulting in increased population vitality.
(3)
The relationship between service facilities (e.g., hotels, corporate enterprises) and population vitality depends on their alignment with the area’s dominant function. As shown in Figure 15f,g, for instance, in areas aggregating universities and science parks, the density of corporate enterprises shows a negative correlation with population vitality. Similarly, hotel density correlates negatively with population vitality in the Qunli Business Core Area, the old city zone, and industrial clusters, but shows a positive correlation in commercial districts near universities and residential complexes.
(4)
The promoting effect of the Floor Area Ratio (FAR) on population movement is not absolute and exhibits significant spatial heterogeneity. This variability is closely related to the FAR’s own notably clustered spatial distribution pattern (Moran’s I = 0.752, p < 0.01; Appendix A Table A1). The specific mechanism is shown in Figure 15e: a strong positive correlation is observed in central business districts, Zhongyang Street, and exhibition and business zones, whereas a suppressive effect occurs in single-function areas or ecologically constrained zones. This indicates that spatial capacity must be matched with business formats and functions to effectively stimulate vitality.
(5)
The impact of housing prices on population aggregation/dispersion, shown in Figure 15i, does not follow a simple linear pattern but rather depends on the area’s functional positioning and the alignment with tourism resources. In areas dominated by residential or specific industries, such as the Qunli New Area and high-end residential zones in Jiangbei, high housing prices suppress population flow, necessitating enhanced public service facilities. Conversely, in peripheral areas like the urban-rural fringe surrounding Zhiqing Park, lower housing prices combined with good natural landscapes promote population movement.
3.
Robustness Test and Spatial Dependence Diagnosis for the Peak-Season Model
To verify the robustness of the aforementioned GWR model conclusions, a spatial autocorrelation analysis was performed on the residuals of both the OLS and GWR models, with the results shown in Table 5. The residuals of the OLS model exhibited highly significant positive spatial autocorrelation, confirming the presence of a serious spatial specification error in the standard regression model [29]. In contrast, the spatial autocorrelation of the GWR model residuals was significantly weakened, with its value decreasing by approximately 47.6%. This indicates that the GWR model, through local fitting, successfully absorbed most of the spatial structure within the data, making the residuals more random and optimizing the model specification. Consequently, the robustness of the spatial heterogeneity conclusions drawn from the GWR coefficients is ensured [30].
To further reveal the spatial regularity of the influence intensity of various driving factors, this study conducted a spatial autocorrelation analysis on their GWR coefficients. The results are presented in Appendix A Table A10. The data indicate that the coefficients of all variables exhibit highly significant spatial clustering. Among them, the coefficients for accessibility to bus stops and floor area ratio (FAR) demonstrate the strongest spatial clustering. Furthermore, the coefficients for commercial service elements, such as the POI functional mix index and road network density, show particularly prominent spatial stability. This suggests that population activity during the peak season depends more heavily on the distribution of commercial facilities and the accessibility of consumption spaces, with the influence pattern displaying a distinct “commercial circle-oriented” model.

3.3.3. GWR Analysis for the Off-Season

1.
Variable Screening and GWR Model Specification
The processing method for 15 March was consistent with that of the peak season. Initially, a global Ordinary Least Squares (OLS) regression (Appendix A Table A6 and Table A7) was conducted to identify the initial set of significant variables. Subsequently, to eliminate potential interference from multicollinearity among the variables, screening was performed based on the criterion of Variance Inflation Factor (VIF) < 5. This process resulted in an optimized variable set where all VIF values were below 5 (Appendix A Table A8), ensuring the independence of model inputs. Following this optimization procedure, the baseline OLS model achieved an Adjusted R2 of 0.683 and was highly significant overall (Appendix A Table A9), establishing a reliable foundation for subsequent local modeling.
Building upon this robust set of variables, an off-season GWR model was constructed. The model parameter settings, including the kernel function type and bandwidth selection criterion, were fully consistent with those described in the peak-season GWR analysis.
2.
Off-season Model Performance Comparison and Analysis of Spatial Heterogeneity in Driving Mechanisms
The performance comparison results (Table 6) indicate that the GWR model not only achieved a higher goodness-of-fit, with R2 and Adjusted R2 reaching 0.741 and 0.726, respectively, outperforming the OLS model’s values of 0.684 and 0.683, but also its AICc value of 127,708 was substantially lower than the OLS model’s AICc of 128,460. This fully demonstrates that after accounting for spatial heterogeneity, the model’s explanatory power for off-season population activity was substantially improved.
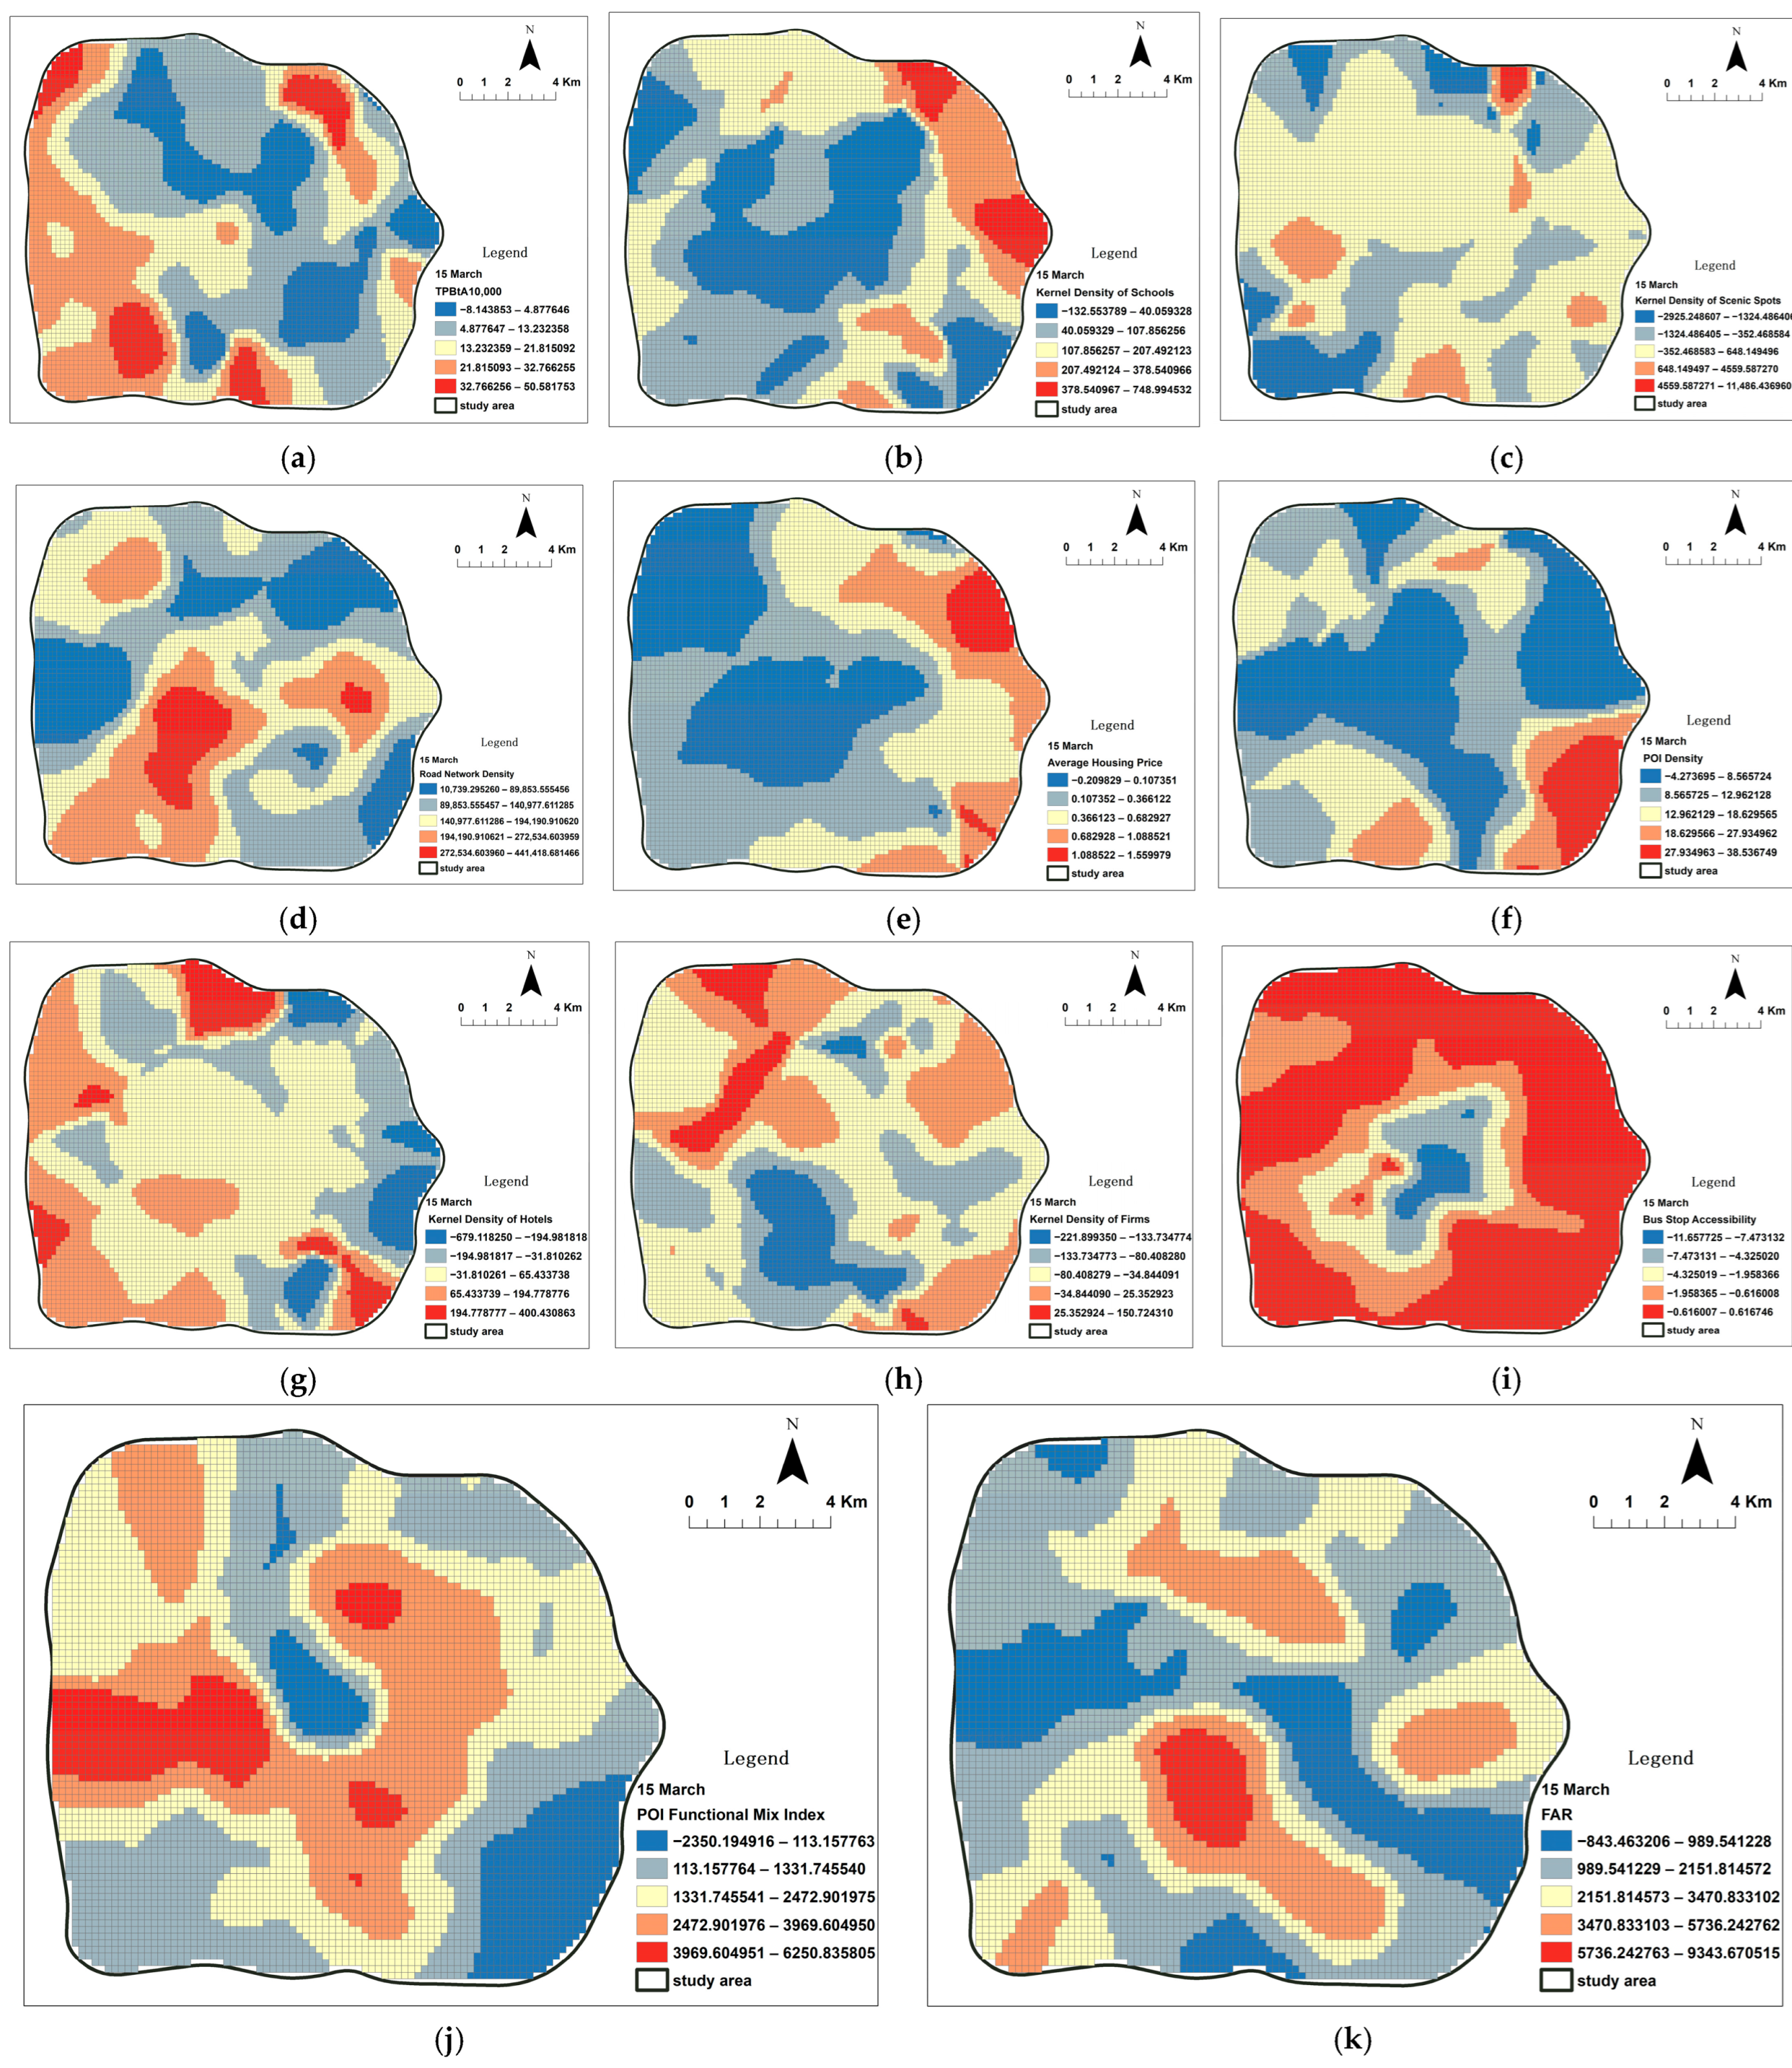
The coefficients of each explanatory variable in the GWR model were visualized, resulting in Figure 16, which displays the coefficients of all explanatory variables meeting the experimental criteria during the off-season. This visualization clearly reveals their spatially heterogeneous effects on population aggregation and dispersion. The detailed analysis is as follows.
(1)
Regarding transportation facilities, road network density remains the foundation for population aggregation and dispersion. As shown in Figure 16a,d, its effect is significant in mixed residential-commercial areas and the Hexing Road multifunctional area, where high-density road networks combined with rigid demands for residence, education, and commerce show a strong positive correlation. However, in some urban-rural fringe zones, due to single functionality and low population density, it shows a negative correlation. Figure 16i indicates that distance to bus stops exhibits a negative correlation with population aggregation/dispersion in areas where stops are already densely distributed. For a fixed passenger flow, without new travel demand, the effectiveness of improving aggregation/dispersion diminishes.
(2)
POIs in the off-season require updates or additions to align with the activity preferences of the local resident population. As shown in Figure 16f,j, in some core commercial areas such as around Zhuozhan Shopping Center and Xuefu Kaide, as well as around Zhongyang Street and Haxi Wanda, although POI distribution is dense, the homogeneity of business formats and slow updates result in lower attractiveness for local residents. Conversely, in emerging cultural, tourism, and business districts like the Qunli New Area and Harbin Grand Theatre, the integration of various supporting facilities, culture, and ecology attracts population movement.
(3)
The impact of hotel accommodation service facilities on population vitality during the off-season depends on their ability to synergize with the area’s inherent functions. The specific mechanism is shown in Figure 16g: hotels show a positive correlation in commercial-residential areas and around universities, but a negative correlation in industrial functional areas. Similarly, as shown in Figure 16b,h, the presence of corporate enterprises shows a positive correlation with population aggregation/dispersion when integrated with university areas and provincial government core business districts, but a negative correlation in industrial clusters due to their single function.
(4)
The heterogeneity of development intensity is shown in Figure 16k. A high floor area ratio (FAR) positively correlates with population aggregation/dispersion in business districts like Jianguo Park Commercial Circle and Convention & Exhibition City Plaza, but shows a negative correlation in traditional industrial zones and ecological protection zones.
(5)
As shown in Figure 16c, landscape and scenic spots located in areas where they are deeply integrated with commercial, cultural, and residential functions—such as the modern business district of the Qunli New Area and the transportation hub area of Harbin West Railway Station—can maintain stable population aggregation even during the off-season, showing a positive correlation. This indicates that scenic spots need to be integrated into the daily urban functional network to remain effective during the off-season.
3.
Off-season Model Robustness Test and Spatial Dependence Diagnosis
To verify the robustness of the aforementioned off-season GWR model conclusions, a global spatial autocorrelation analysis was performed on the residuals of both the OLS and GWR models. The results are shown in Table 7. The residuals of the OLS model exhibited highly significant spatial clustering, whereas the spatial autocorrelation of the GWR model residuals was substantially reduced. This result provides cross-validation for the effectiveness of the GWR model in analyzing off-season data, demonstrating that the GWR model is equally efficient in characterizing spatial processes during the off-season and that the model specification is robust and reliable.
This study also conducted a global spatial autocorrelation analysis on the regression coefficients of each driving factor in the off-season GWR model. The results are presented in Appendix A Table A11. The results indicated that the coefficients of all variables exhibited a highly significant positive spatial correlation, suggesting that their influence intensity forms stable clusters in space. The coefficients for bus stop accessibility, road network density, and floor area ratio showed the strongest spatial clustering, indicating that the core driving mechanism during the off-season revolves around basic accessibility and circulation capacity. The spatial heterogeneity of the coefficients displayed a highly structured pattern, confirming the non-random spatial nature of the driving forces.

3.3.4. GWR Analysis as Methodological Practice of Metamodernism

The superior performance of the GWR model over the OLS model (Table 4 and Table 6) is significant. Its advantage lies not only in the improvement of goodness-of-fit but also, at a methodological level, in confirming the core concept of metamodernism: the situational and localized nature of truth and mechanisms [5,6]. The spatial non-stationarity of the regression coefficients of various driving factors revealed by the model is precisely the concrete manifestation of the ‘oscillation’ emphasized by metamodernism in the spatial dimension. For instance, the significant spatial non-stationarity of the regression coefficients of various driving factors revealed by GWR (Figure 15 and Figure 16) exemplifies this ‘oscillation’ spatially. This means that the same influencing factor, such as POI density, can exhibit sustained oscillations in its effect intensity and even direction in different urban areas, like Zhongyang Street and the Qunli New Area. This spatial heterogeneity negates the modernist pursuit of universal laws and transcends the postmodernist deconstruction of grand narratives, steering towards a post-paradigmatic cognitive framework: one must accept and deeply investigate spatial heterogeneity, recognizing it as an indispensable component of urban ontology [5,6].
Furthermore, the GWR coefficient maps visualize how different driving factors anchor distinct ‘local realities’ in space. For example, Figure 15e shows that the Floor Area Ratio (FAR) strongly promotes population aggregation in high-density built-up areas like Zhongyang Street, but exhibits a suppressive effect in ecological areas such as the Ashi River Wetland Park. This vividly illustrates Storm’s metarealist viewpoint: whether an element is a ‘real’ promoting or inhibiting factor depends on the contrast class to which it belongs. This anchoring process is not static; it oscillates with the seasons. The subtle changes in the influence of FAR during the off-season, as shown in Figure 16f, reveal the fluidity of urban spatial meaning along the temporal dimension.

3.4. Influence Factor Detection Based on Geographical Detector

Following the completion of the GWR model, which revealed the spatially non-stationary influences of various factors, this study subsequently employed the Geographical Detector to conduct factor detection and interaction detection analyses. The aim was to further identify, from a global perspective, the key driving factors affecting the intensity of population aggregation and dispersion in Harbin and their interactive effects. The set of independent variables used in this analysis is consistent with those used in the aforementioned GWR model, meaning they have already passed significance testing in the global OLS regression and screening for multicollinearity. This preprocessing step ensures that the variables incorporated into the Geographical Detector analysis not only have a significant impact on the dependent variable but are also relatively independent of each other, thereby guaranteeing the reliability of the detection results.
To maintain consistency with the analytical framework of the Geographically Weighted Regression in this study, all continuous explanatory variables were discretized using the Natural Breaks method. The specific procedure was as follows: first, the classification tools in ArcMap were used to apply the Natural Breaks method to each continuous explanatory variable, categorizing them into five classes [31]. The specific classification breakpoints for each variable were recorded. Then, in the Geographical Detector analysis, based on these predefined breakpoints, the original continuous variable data were converted into categorical data. Subsequently, factor detection and interaction detection analyses were performed.

3.4.1. Factor Detection for the Peak Season

The results of the factor detection for the peak season are presented in Table 8. In the table, the variables are denoted as follows: A for road density, B for distance to bus stops, C for floor area ratio (FAR), D for housing price, E for POI density, F for POI mix index, G for kernel density of hotels, H for kernel density of corporate enterprises, and I for road betweenness for vehicular movement. The q-statistic represents the extent to which each factor independently explains the spatial heterogeneity of population aggregation/dispersion intensity, and the p-value is used to determine the statistical significance of this explanatory power, with a value less than 0.05 typically considered significant.
According to the table, the POI density (variable E) has a remarkably high q-value of 0.531, with a p-value less than 0.001. This indicates that it alone explains 53.1% of the spatial heterogeneity, identifying the distribution of commercial facilities as the dominant factor influencing the spatial pattern of population activity during the peak season. The floor area ratio (variable C), with a q-value of 0.439, is another key factor. Shops, attractions, and restaurants are fundamental for attracting crowds, while a high FAR signifies high-intensity urban development that can accommodate larger tourist flows and host more commercial facilities and activities. This is followed by the kernel density of hotels and the POI mix index in terms of importance.
In contrast, factors such as road density, distance to bus stops, and road betweenness have relatively lower q-values, indicating weaker independent explanatory power. This suggests that transportation infrastructure is a necessary condition but not a sufficient one; if the attractiveness of the destination is insufficient, it cannot independently generate peaks in human flow.
The results of the factor interaction detection (Table 9) reveal more complex synergistic mechanisms. An interaction q-value greater than the q-value of any single factor indicates a two-factor enhancement effect. The most significant synergistic effect is observed between POI density and the functional mix index (POI Mix), with a q-value reaching 0.622. This suggests that for an area, it is not only important to have a high density of shops but also a diverse mix of functions to prolong visitor dwell time. This is followed by the interaction between POI density and hotel density. The concentration of hotels spurts the development of surrounding commercial services, while these commercial services, in turn, enhance the attractiveness of the hotels, forming a positive feedback loop.
Although the influence of transportation factors alone on visitor volume is relatively minor, their combination with POI density leads to a significant leap in explanatory power [32]. This indicates that good transportation infrastructure can expand the service radius and enhance the influence of areas rich in urban functions. Conversely, enhancing the road connectivity and permeability of an area already abundant in urban functions will further amplify its attractiveness.
Based on the above analysis, tourist activities activate a tourism system centered around hotels and POIs. These functions highly rely on intensively developed urban central areas and enhance their attractiveness through functional mixing. Therefore, in urban planning, priority should be given to encouraging the construction of functionally mixed blocks, ensuring road accessibility in core functional areas, and implementing traffic optimization and management. Additionally, public service facilities should be arranged in areas with high pedestrian density to cope with instantaneous passenger flow.

3.4.2. Detection of Influencing Factors During the Off-Season

The off-season factor detection results are shown in Table 10. The selected independent variables, having passed OLS regression, VIF diagnostics, and GWR local sensitivity analysis, are confirmed to significantly influence population aggregation/dispersion intensity with notable spatial heterogeneity. The factors are denoted as follows: (a) road betweenness, (b) distance to bus stops, (c) housing price, (d) POI density, (e) POI functional mix index, (f) kernel density of landscapes, (g) kernel density of hotels, (h) kernel density of corporate enterprises, (i) kernel density of scientific, educational, and cultural facilities, (j) road density, and (k) floor area ratio (FAR).
Factor detection reveals that the Floor Area Ratio (FAR) (q = 0.575, p < 0.001) and the Functional Mix Index (q = 0.544, p < 0.001) possess the strongest explanatory power, indicating that the fundamental carrying capacity of the built environment and the diversity of functions are key to sustaining urban vitality during the off-season. Although POI Density (q = 0.510) remains a significant explanatory factor, its relative influence diminishes. This reflects Harbin’s shift during the off-season from an outward-looking, consumption-driven tourism model towards an endogenous, daily life and learning-oriented localized pattern. Furthermore, the density of Scientific, Educational, and Cultural Facilities (q = 0.532) also demonstrates a significant driving role, with universities, libraries, etc., becoming key nodes for population aggregation in the off-season. This factor structure empirically corroborates that seasonal tourism cities undergo a “structural oscillation” during the off-season, where the vitality mechanism transitions from a “consumption space” serving tourists to a “living space” serving residents.
The interaction detection analysis (Table 11) indicates that the independent explanatory power of scenic spot density is relatively weak. However, when interacting with high POI density and scientific/educational/cultural facilities, the interaction q-value rises to 0.606, representing a substantial increase in explanatory power. This suggests that during the off-season, scenic spots rely on the surrounding mature commercial atmosphere or cultural ambiance rather than existing in isolation. For instance, some universities have integrated scenic spots within their campuses for public visitation, which contributes to urban vitality. The interaction between road network density and the functional mix index is also notable, with a q-value of 0.587 (p < 0.001), highlighting the synergistic effect produced by combining transportation accessibility with functional diversity. These interactions demonstrate that the independent effect of any single factor is limited, and the coupling effect between multiple factors is key to supporting urban vitality.
Therefore, during the off-season, efforts should focus on improving the construction of local living circles, increasing commercial support and enhancing the functional mix around science, education, and cultural facilities. Attractions should operate in conjunction with surrounding commercial and cultural facilities during the off-season; otherwise, they will have insufficient appeal to both local residents and tourists. Transportation and road network conditions are equally important in the off-season.

3.4.3. Metamodernist Interpretation of Geographical Detector Results

The quantitative results of the geographical detector reveal the dynamic mechanisms of urban spatial oscillation from a global perspective. Factor detector analysis indicates that the explanatory power (q-statistic) of different driving factors exhibits significant seasonal alternation. During the peak season, POI density and hotel density dominate, jointly anchoring the “tourism-consumption reality,” which essentially activates a consumption-oriented social kind centered on tourists. In the off-season, the driving forces shift to POI functional mix and the density of scientific, educational, and cultural facilities, marking a systemic switch to the “local daily life and culture-education reality”—that is, a transition to a life-oriented social kind centered on residents’ everyday activities. This periodic alternation of dominant factors constitutes the most direct evidence of the oscillation of the city’s core social kinds between two states [33].
When the q-value increases significantly after the interaction of two factors, it indicates that the ‘reality’ of urban space is constructed nonlinearly and synergistically by multiple forces, producing an emergent phenomenon. For instance, the enhanced interaction between POI density and hotel density during the peak season is an empirical manifestation of the dynamic anchoring of the consumption-oriented social kind. This is achieved through the coupling of multiple anchoring mechanisms: nominal anchoring via city branding, functional anchoring through commercial facilities and accommodation networks, and mimetic anchoring via the replication of landscapes. These mechanisms work together to stabilize and reinforce the seasonal persistence of this social kind. This finding not only confirms the synergy and integration emphasized by metamodernism but also reveals the multi-dimensional coupling mechanism in the anchoring process of social kinds.
The results of the geographical detector collectively point towards an oscillatory epistemology of metamodernism. No single, global truth can explain the population activities across the entire city; the meaning and driving mechanisms of urban space are constantly rewritten with the seasons. In the peak season, POI density interacts with hotel density to anchor the “tourism-consumption reality,” whereas in the off-season, floor area ratio and POI functional mix interact with scientific, educational, and cultural facilities to switch to the “local daily life reality.” The seasonal shift in driving factors and their interaction networks is precisely the external manifestation of the activation, anchoring, and switching of different social kinds. This discovery necessitates a shift in the cognitive mode from a static functional zoning perspective to a dynamic, localized, post-paradigmatic perspective, in order to understand the essence of the complex urban system oscillating between the global and local poles.

3.5. Sensitivity Test Analysis

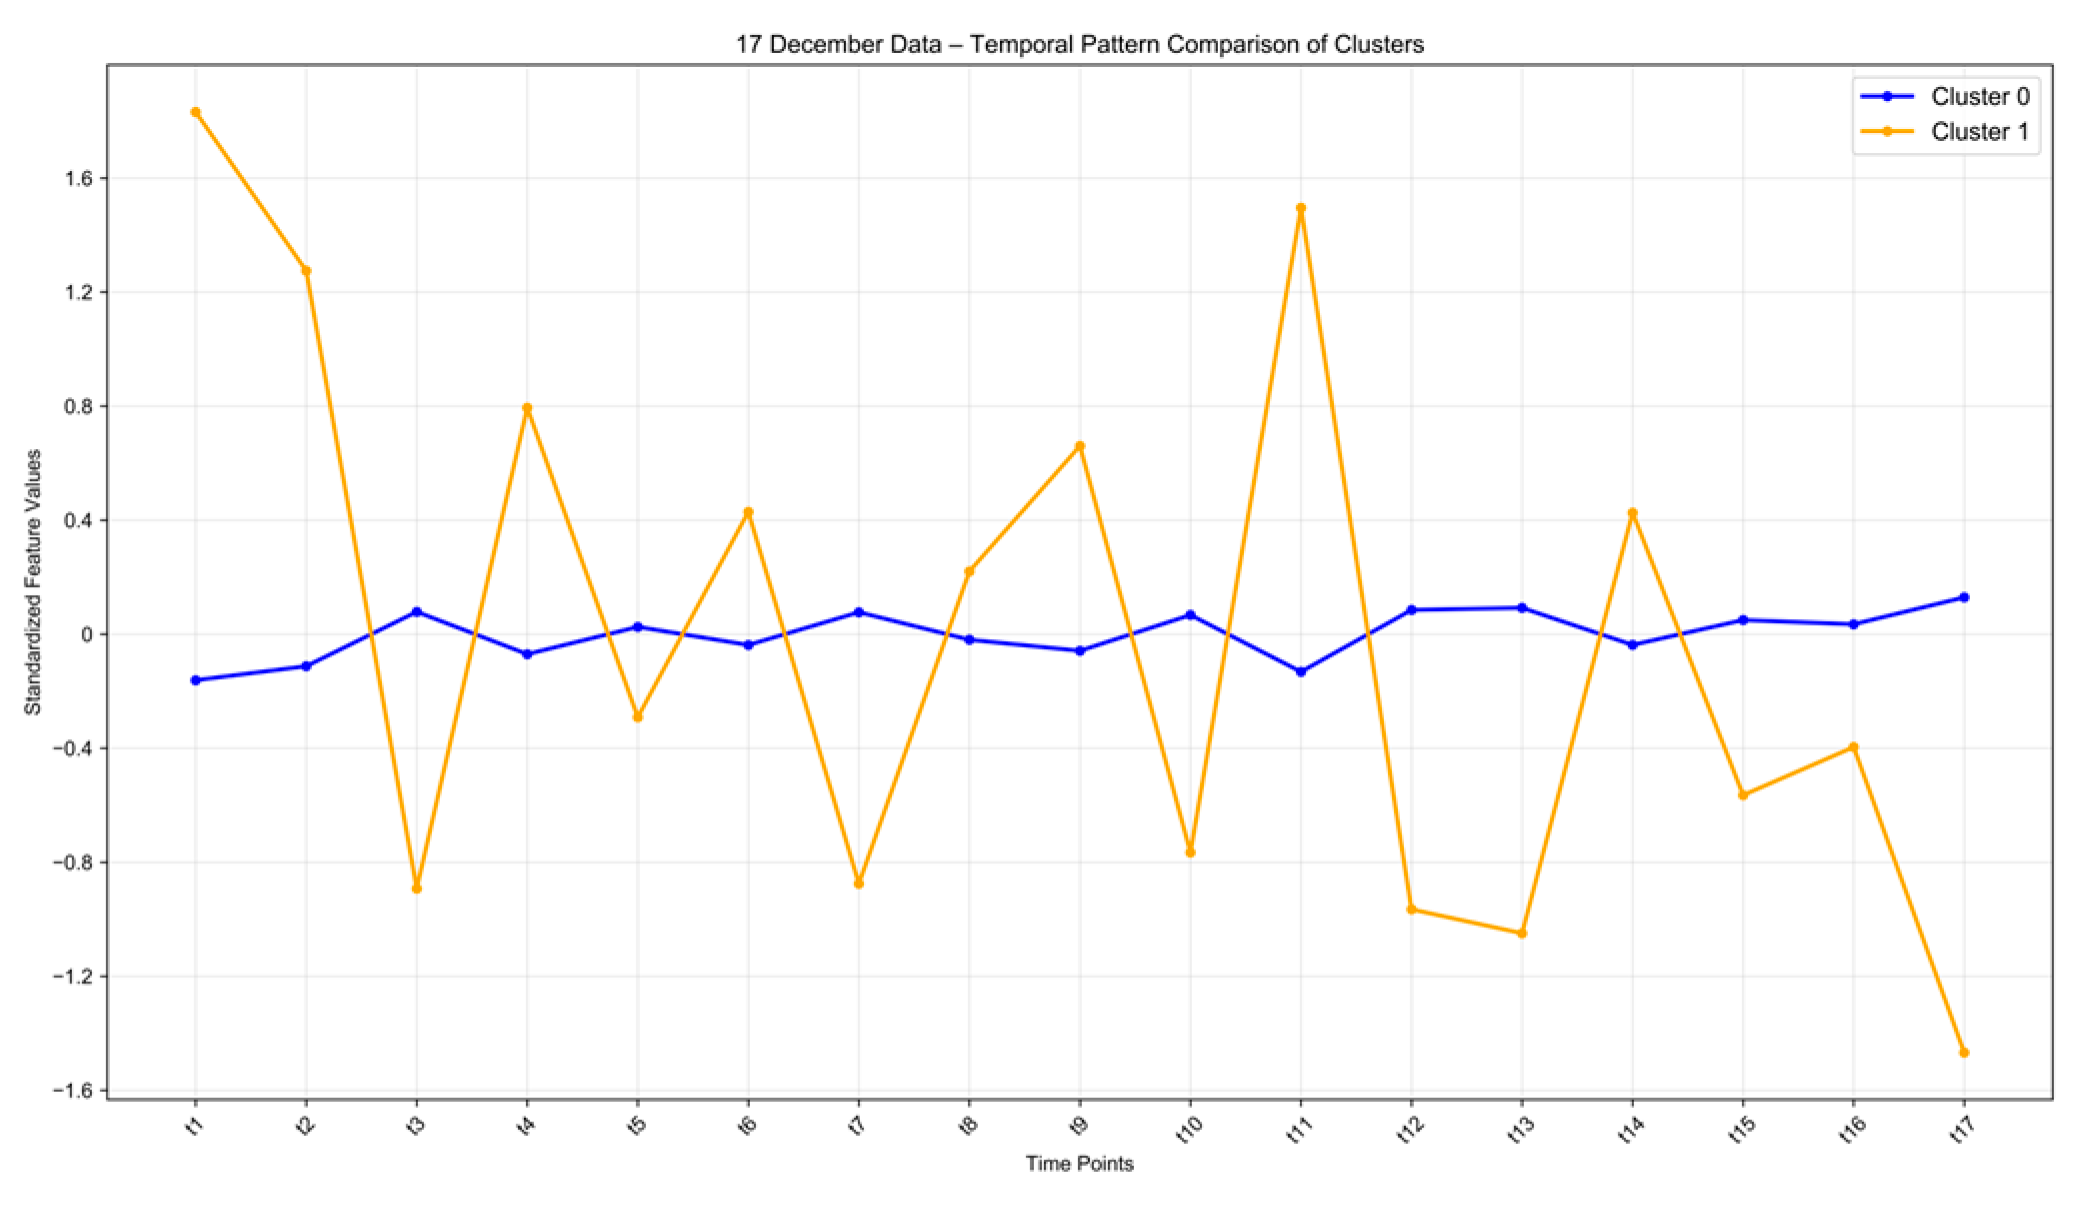
To verify the robustness of the research conclusions against date variations, this study designed a systematic sensitivity test. The test adhered to the principle of seasonal consistency, evaluating the stability of spatiotemporal differentiation patterns by comparing population activity patterns on different types of dates within the same season. The specific scheme was as follows: for the peak season, the holiday of 1 January 2025 was compared with the workday of 17 December 2024; for the off-season, two consecutive Saturdays, 15 March and 22 March 2025, were compared. All selected dates were verified to be free from abnormal weather or event interference, ensuring data reliability.
The analysis employed a coherent three-step workflow: first, spatial clustering algorithms were used to identify typical patterns of population aggregation; second, OLS regression and collinearity diagnostics were applied to screen independent variables; finally, the Geographical Detector was utilized to quantify the explanatory power and interaction effects of the built environment factors.

3.5.1. Peak Season Comparison

Spatial clustering algorithm analysis was performed on the peak-season workday data, with the results shown in Figure 17 and Figure 18. The analysis indicates that the types of population activity revealed on the peak-season holiday and the workday are highly similar, both centrally revolving around two primary patterns: “transit-oriented areas” and “commercial-consumption areas.” Specifically, Cluster 1 from the peak-season holiday and Cluster 0 from the workday both exhibit stable, low-fluctuation characteristics, demonstrating the robustness of baseline patterns like major transportation arteries. The peak-season Clusters 2 and 3 collectively correspond to Cluster 1 from the workday, both showing high-frequency pulsating fluctuations and functional dependency.
The results of the Geographical Detector are shown in Table 12 and Table 13. The results indicate that, regardless of whether it is a holiday or a workday, urban vitality is predominantly governed by the core framework of “function-density–space-capacity.” The main driving factors are highly consistent, with key factors demonstrating strong explanatory power including POI density, POI functional mix index, floor area ratio, and hotel density. These factors maintain significant influence across both date types. This shows that the scale and diversity of commercial facilities are the fundamental engines for activating urban space, unaffected by the type of date. Furthermore, the demand for tourist accommodation continues to play a role during peak-season workdays, not being limited solely to holidays.
The difference lies in the fact that holidays place greater emphasis on scale-driven consumption propelled by POI density, while workdays rely more on comprehensive services driven by the POI functional mix index. This reflects the subtle adjustments in consumption patterns between workdays and holidays.

3.5.2. Off-Season Comparison

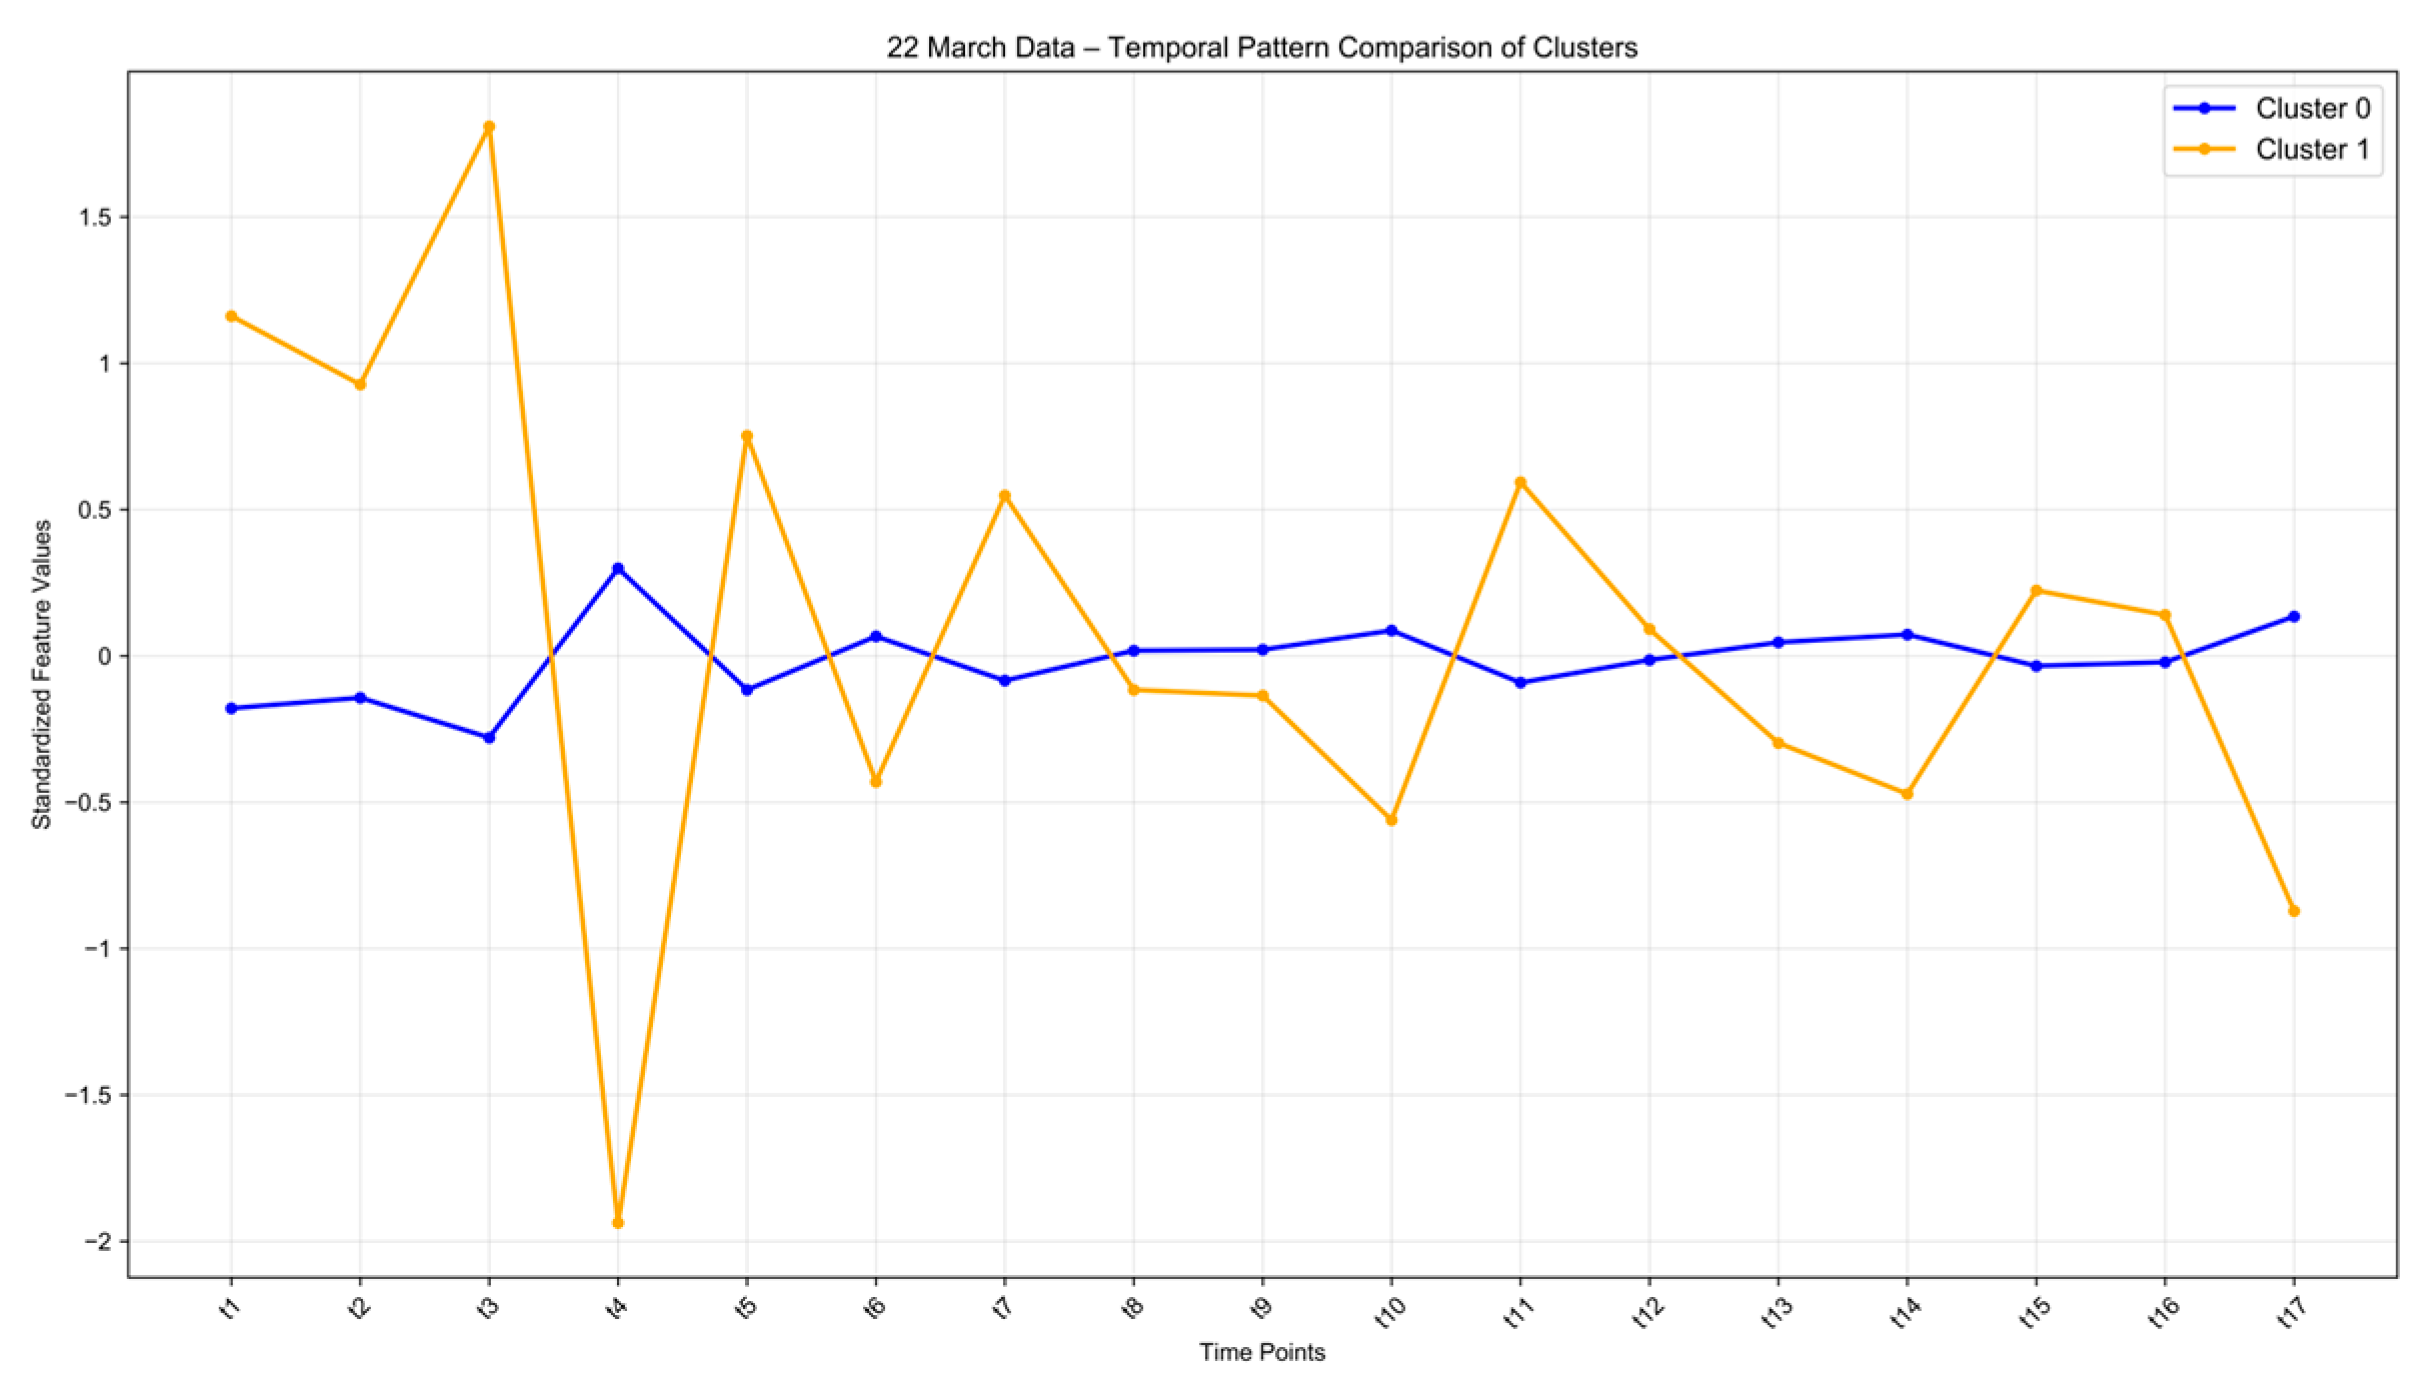
A sensitivity test analysis was conducted on Saturdays within the same month during the off-season, with the population clustering results shown in Figure 19 and Figure 20. The clustering analysis reveals that both dates exhibit typical characteristics of coexisting stable baseline activity and localized consumption pulses. One pattern is relatively stable, such as Cluster 0 on 22 March and Clusters 1 and 3 on 15 March; another pattern shows intense fluctuations, such as Cluster 1 on 22 March and Clusters 2 and 3 on 15 March. In terms of pattern characteristics, both time points display a commuting-dominated stable baseline accompanied by short-term peaks triggered by midday consumption, reflecting the tidal-like fluctuations unique to the off-season. This indicates that the patterns observed on off-season Saturdays are reproducible, with consistent category classification.
The Geographical Detector analysis results for 22 March are presented in Table 14. The analysis for both days consistently demonstrates that the driving mechanisms behind population activity during the off-season exhibit strong stability. The POI functional mix index and the Floor Area Ratio (FAR) consistently emerge as core dominant factors, forming the stable foundation for urban vitality during the off-season. Hotel density and POI density, serving as the basic service layer, were also repeatedly validated as important driving factors across both analytical rounds, further supporting the reliability of the identified mechanisms. This indicates that off-season urban vitality relies on regional functional diversity and spatial carrying capacity, rather than seasonal or date-specific factors.
The interaction detection results (Table 15) show that the interaction between the POI functional mix index and the FAR produces the strongest synergistic effect (q-value between 0.60 and 0.62), indicating that a “high-capacity + high-mix” combination is a key pathway for enhancing spatial attractiveness. Although transportation-related factors (e.g., road network density, accessibility) have limited independent explanatory power, their combination with the functional mix index significantly enhances the overall explanatory power. This suggests that transportation facilities primarily function by supporting the accessibility of functional areas.
The sensitivity test in this study systematically compared the population aggregation/dispersion patterns and their driving mechanisms during a peak-season holiday versus a workday, and during two consecutive off-season Saturdays. The results confirm the robustness of the core findings against date variations. The analysis indicates that the spatiotemporal differentiation patterns of population activity and the underlying driving mechanisms remain consistent across these different date types. However, although the pattern similarity between the two selected dates enhances the reliability of the conclusions, longer-term time-series data might reveal more subtle fluctuation characteristics. Furthermore, despite the consistent patterns observed across the different date types, this consistency might be specific to the current limited internal sample of selected dates. There is a risk that the results are overfitted to these four specific days. Consequently, their representativeness needs further validation across broader spatiotemporal scales, requiring in-depth exploration through the inclusion of more seasonal date types.

4. Discussion

This study, framed through a metamodernist theoretical lens, reinterprets the spatiotemporal patterns of population activity in tourist cities, achieving breakthroughs at the methodological, theoretical, and practical application levels compared to existing research [34]. Its innovation lies not only in the application of multi-source data and composite models but, more importantly, in proposing and validating a new paradigm for understanding urban complexity: the oscillatory paradigm.
Existing research on urban population activity often relies on static global models or stops at descriptive clustering of spatiotemporal patterns. While these approaches can reveal macro-level regularities, they struggle to capture the spatial heterogeneity of driving mechanisms and their seasonal oscillations [35]. This study integrates X-means clustering, Geographical Detector, and Geographically Weighted Regression (GWR) models to construct a multi-scale analytical chain of “pattern recognition → factor detection → local modeling.” This methodological combination not only effectively identifies three types of functional areas related to population aggregation and dispersion in Harbin but also reveals the spatial non-stationarity and seasonal reversal in the influence and direction of built environment factors [36].
The current literature’s understanding of seasonality in tourist cities is often confined to engineering perspectives like “pressure management” or “facility capacity,” lacking theoretical refinement of its deeper socio-spatial implications. Inspired by Storm’s metamodernism, this study redefines seasonal fluctuations as a structural oscillation of the city between the poles of “global tourist consumption” and “local resident life”. The seasonal alternation of driving factors revealed by the Geographical Detector, coupled with the heterogeneous effects of the same factor in different locations revealed by GWR, jointly confirm that urban reality is a result of multiple layers alternately manifesting and dynamically anchoring. This “oscillatory ontology” transcends both the modernist pursuit of universal laws and the postmodernist deconstruction of grand narratives, pushing urban geography towards a post-paradigmatic theoretical construction focused on processes and relations.
Traditional planning paradigms, which tend to seek static equilibrium through functional zoning, struggle to cope with the intense seasonal pulses of tourist cities. This study argues that the key to urban resilience lies in the ability to oscillate smoothly between different states, rather than eliminating fluctuations. Therefore, planning should aim to create “oscillation-friendly spaces”: enhancing buffering capacity through functional mixing in core commercial areas; supporting multi-phase vitality through the integration of transportation and commerce in new towns; and improving basic resilience by supplementing public services in peripheral areas. This approach transcends traditional “carrying capacity” planning, shifting towards a dynamic, adaptive governance model, providing an actionable path for the sustainable development of cold-region tourist cities facing climate change and tourism pressure.
While this study makes progress in theoretical construction and methodological integration, limitations remain. First, the spatial autocorrelation in the GWR model residuals suggests potential unaccounted-for proximity effects. Second, different driving factors may operate at different spatial scales, and the current model’s single bandwidth cannot fully decouple these multi-scale processes. Future research could introduce Multi-scale Geographically Weighted Regression (MGWR) or spatial lag models to more finely parse the scale dependency and spatial spillover effects of the driving mechanisms. Simultaneously, integrating data like social media text and consumption records could expand the analysis from the “technical manifestation layer” to the “symbolic narrative layer” and “socioeconomic layer,” enabling a more comprehensive semiotic interpretation of social reality.
This study represents not merely methodological innovation but an attempt at a paradigm shift. By operationalizing the metamodernist concept of “oscillation” into analyzable geographical concepts, it provides new theoretical tools and a practical framework for understanding urban complexity, dynamism, and resilience. Future research, building upon this framework, can further explore the rhythms, thresholds of these oscillations, and their impacts on social equity and ecological sustainability, promoting deeper theoretical construction and practical innovation for urban geography on the path of metamodernism.

5. Conclusions

Based on the spatiotemporal differentiation of population activities in tourist cities, this study adopts metamodernist geography as its theoretical framework. Employing a post-paradigmatic analytical pathway that integrates multiple methods such as X-means clustering, geographical detector, and geographically weighted regression (GWR), it establishes a complete technical route ranging from global factor detection to local heterogeneity analysis. Cluster analysis identifies the dominant types of functional zones in different seasons, the GWR model further delineates the spatial heterogeneity of driving factors, and the geographical detector clarifies the explanatory power and interactive enhancement effects of core factors, such as POI functional mix index and floor area ratio. This systematically reveals that the spatiotemporal differentiation of population activity in Harbin is a profound structural oscillation.
The findings are as follows. First, regarding the spatiotemporal differentiation pattern, population activity in Harbin during the peak season exhibits a “monocentric polarization” pattern, highly concentrated in traditional core commercial districts with strong spatial aggregation. In contrast, the off-season shifts to a “polycentric weak agglomeration” pattern, with overall weakened activity intensity and a more dispersed spatial distribution. Second, regarding the response mechanism of functional zones, X-means clustering identifies three types of areas: transit-oriented areas in the urban periphery, supporting service zones around commercial districts, and core commercial districts. These three types of areas exhibit asynchronous, high-intensity mixed flows during the peak season, while tending towards a single-peak, gentle pattern dominated by the daily activities of permanent residents during the off-season [34]. Third, the factor detection and interaction detection results of the geographical detector show that POI density, functional mix index, and floor area ratio are key factors affecting population aggregation. Furthermore, the explanatory power and interactions of these factors change with the seasons. Fourth, regarding the driving mechanisms, the GWR model confirms the significant spatial non-stationarity and seasonal differences in the influences of the built environment [35]. Urban vitality during the peak season is primarily driven by consumption-oriented and transportation-oriented built environment elements, with diminishing marginal effects observed in core commercial areas. In contrast, the maintenance of vitality during the off-season relies more on basic service functions that meet the daily commuting, living, and cultural/educational needs of local residents, whose influence intensity and direction exhibit complex variations across different areas.
Based on the findings, managing seasonal population pulses in cities requires differentiated strategies to address the core question of “how to maintain daily resilience while managing seasonal crowd pulses.” Firstly, during the peak season, it is crucial to enhance the carrying capacity and evacuation efficiency of core areas, prioritizing the optimization of transportation and facilities in commercial and scenic spots to cope with peak tourist pressure. During the off-season, resilience should be maintained by activating peripheral nodes and strengthening infrastructure services. Based on spatial heterogeneity, enhancing functional mixing in commercial districts can help buffer seasonal fluctuations. Optimizing the mix of business formats and leveraging the dynamic role of built environment elements, such as the seasonal changes in the POI functional mix index, can help balance short-term peaks and long-term operation.
However, the study has several limitations. (1) The regular fishnet grid (300 m × 300 m) used is an artificial spatial division framework that may not fully align with the natural aggregation boundaries of population activity, potentially causing some deviation in estimating local effects at the micro-scale [36]. Future research could attempt to integrate multi-scale grids or schemes based on natural boundaries to further verify the robustness of the conclusions. (2) Although the selection of built environment independent variables covers multiple dimensions, it may still fail to fully capture all subtle factors affecting population activity, such as building facade morphology and environmental quality. (3) The methodological pathway of this study essentially follows an abductive logic, inferring the best explanation from observed empirical patterns. Starting from the significant spatial oscillation patterns of population activity in Harbin during peak and off-seasons, an explanatory framework based on multi-scale built environment variables was constructed [37]. However, this framework still has limitations, as it does not fully consider key dimensions such as affective and experiential mobility, behavioral differences between tourists and residents, and policy interventions [5,6,38]. Future research will quantify these three types of indicators and attempt to integrate multi-source data, such as mobile phone signaling [39], social media check-ins, and questionnaire surveys, to effectively identify the behavioral logic of different groups like tourists and residents [40]. Furthermore, it will explore the rhythms and thresholds of these oscillations and their impacts on social equity and ecological sustainability, thereby promoting deeper theoretical construction and practical application of geographical thought within the metamodernist paradigm.

Author Contributions

Conceptualization, X.X., M.S. and Q.R.; methodology, X.X., M.S. and Q.R.; software, X.X. and Q.R.; validation, X.X. and M.S.; formal analysis, X.X. and Q.R.; investigation, X.X.; resources, M.S.; data curation, X.X. and M.S.; writing—original draft preparation, X.X.; writing—review and editing, M.S. and Q.R.; visualization, X.X. and Q.R.; supervision, M.S. and Q.R.; project administration, M.S.; funding acquisition, M.S. All authors have read and agreed to the published version of the manuscript.

Funding

This work was supported by China Association of Higher Education “2023 Annual Higher Education Scientific Research Planning Project” (Grant No. 23DF0405), Heilongjiang Provincial Association of Higher Education 2023 Higher Education Research Project (Grant No. 23GYBJ006), and the Fundamental Research Funds for the Central Universities (Grant No. 2572024DZ31).

Institutional Review Board Statement

Not applicable.

Informed Consent Statement

Not applicable.

Data Availability Statement

The original contributions presented in this study are included in the article. Further inquiries can be directed to the corresponding author.

Acknowledgments

The authors acknowledge the financial support from the China Association of Higher Education “2023 Annual Higher Education Scientific Research Planning Project” (Grant No. 23DF0405), the Heilongjiang Provincial Association of Higher Education 2023 Higher Education Research Project (Grant No. 23GYBJ006), and the Fundamental Research Funds for the Central Universities (Grant No. 2572024DZ31).

Conflicts of Interest

The authors declare no conflicts of interest.

Appendix A

Table A1. Spatial Autocorrelation Analysis of All Explanatory Variables.
Moran’s IR2Z Scorep Value
TPBTA10000.7460930.00008083.5743240.000000
TPBTA100000.5024610.00007956.4110840.000000
NQPDA10000.9189940.000080102.9238650.000000
NQPDA100000.8672690.00008097.1070820.000000
Bus Stop0.9911400.000080110.9886370.000000
Metro Station0.9942950.000080111.3272390.000000
Building Density0.669580.00008074.9811120.000000
Floor Area Ratio0.7561980.00008084.6856420.000000
Road Density0.6271650.00008070.2412390.000000
Average Housing Price0.4791790.00008053.7012690.000000
POI Density0.7120690.00008079.8954800.000000
POI Mix Index0.7275430.00008081.4626620.000000
Shopping & Retail0.8618870.00007996.8082610.000000
Landscape0.9465780.000079106.3821420.000000
Catering0.8970020.000079100.7437110.000000
Leisure & Entertainment0.9588890.000080107.4673710.000000
Hotel & Accommodation0.9338130.000079104.9091350.000000
Healthcare0.9385350.000080105.1983270.000000
Life Service0.9304760.000080104.3038400.000000
Commercial & Residential0.9716760.000080108.9642310.000000
Science & Education0.9553930.000080107.0398290.000000
Corporate & Enterprise0.9567270.000080107.1871810.000000
This table presents the global spatial autocorrelation analysis results for each explanatory variable. The Moran’s I values for all variables are positive with p-values less than 0.01, indicating statistically significant spatial clustering. The Moran’s I ranges from 0.479 (average housing price) to 0.994 (subway stations), demonstrating moderate to very strong spatial autocorrelation.
Table A2. OLS Analysis of All Influencing Factors on the Peak Season (1 January).
VariableCoefficient [a]StdErrorProbability [b]VIF [c]
Intercept680.617936234.4657810.003718 *--------
NQPDA1000−1640.452700679.5807880.015796 *8.898169
TPBTA100068.79079347.8856700.150906 5.323968
NQPDA1000073.05580916.2667240.000010 *7.800938
TPBTA100007.8404571.5859120.000001 *1.602675
Road Network Density134,744.5081615,002.6132080.000000 *3.566915
Distance to Bus Depot/Terminal−0.1645310.0689070.016967 *3.072622
Distance to Metro Station0.0320660.0551210.560770 3.418771
Floor Area Ratio2055.902227198.5258170.000000 *3.346409
Building Density−765.478870579.8586280.000000 *1.002461
Average Housing Price0.1666030.0209040.000000 *1.789764
POI Density7.5687370.3980090.000000 *7.329613
POI Mix3052.703164166.3209780.000000 *3.372136
Shopping & Retail−1.1543250.9388060.218908 6.016032
Landscape & Attractions−46.59655529.3452760.112379 1.886030
Catering23.5615684.1813770.000000 *5.843977
Leisure & Entertainment83.48173527.5405550.002458 *6.227914
Hotel & Accommodation61.8557245.0358080.000000 *3.890451
Medical & Insurance14.3398055.5703460.010058 *6.510724
Life Services−20.2210382.7332360.000000 *10.065604
Commercial & Residential1.35512012.0701520.910596 5.473145
Science, Education & Culture7.1423776.5376030.274645 5.086368
Corporations & Enterprises−60.9681054.6323310.000000 *4.009531
This table presents the global OLS model regression results for all explanatory variables during the peak season. The asterisk (*) next to the probability values (Probability [b]) indicates statistical significance (p < 0.05). The “Coefficient” indicates the direction and strength of the influence of the independent variables on the dependent variable. Variables marked with [b] are statistically significant at the 0.05 level, such as road network density, floor area ratio, and POI density, which exhibit significant positive effects on peak-season demand. The notation [c] indicates the presence of evident multicollinearity issues in the model, which will be addressed in subsequent steps by removing collinear explanatory variables for optimization.
Table A3. Data of the OLS Model Pertaining to the Peak Season (1 January).
AICAICcR2R2 AdjustedF-StatF-Prob
127,151.71328200000127,151.951093000000.686551421780.68531931259557.216378806000.00000000000
The OLS regression results demonstrate that the model exhibits good explanatory power on the peak-season data. The adjusted R2 of 0.685 indicates that the independent variables explain 68.5% of the variance in the dependent variable. The F-statistic is highly significant at the 0.01 level (p < 0.01), confirming the overall validity of the model.
Table A4. OLS Model Results After Multicollinearity Remediation for the Peak Season (1 January).
VariableCoefficient [a]StdErrorProbability [b]VIF [c]
Intercept449.822781189.7053400.017746 *--------
NQPDA1000045.42838711.6747070.000110 *3.937862
TPBTA100008.3918971.5573650.000000 *1.514572
Road Network Density122,145.8094611,436.9775460.000000 *2.031436
Distance to Bus Depot/Terminal−0.1674840.0519280.001281 *1.710024
Floor Area Ratio1999.814212199.0365400.000000 *3.296343
Average Housing Price0.1759880.0206800.000000 *1.716579
POI Density7.2159320.2532130.000000 *2.907294
POI Mix3105.111577162.7398850.000000 *3.163886
Hotel & Accommodation72.5419933.9228420.000000 *2.313583
Corporations & Enterprises−66.0630483.9547900.000000 *2.863935
After variable screening, the VIF values of all retained variables were below 5, indicating that multicollinearity issues had been mitigated. The asterisk (*) next to the probability values (Probability [b]) indicates statistical significance (p < 0.05). For building density, although its VIF value was acceptable, it was ultimately excluded from the final modeling due to the following considerations: its coefficient sign was inconsistent with theoretical expectations, and its inclusion might interfere with the local parameter estimation of other variables with greater spatial stability. Except for the intercept term, all variables had a significant effect on the dependent variable at the 0.05 level (p < 0.05). The model was subsequently used for GWR analysis, with specific results presented in Figure 15 in the main text.
Table A5. OLS Model Data after Removing Multicollinearity (1 January).
AICAICcR2Adj. R2F-StatF-Prob
127,151.71328200000127,151.951093000000.686551421780.68531931259557.216378806000.00000000000
The diagnostic metrics of the OLS model indicate that the model is overall significant and demonstrates a good fit (Adj. R2 = 0.685, F-test p-value < 0.01). These results provide a reliable baseline model for the subsequent Geographically Weighted Regression (GWR) analysis. The AICc value (127,151.713) will be used for comparing the goodness-of-fit with the GWR model.
Table A6. OLS Analysis of All Influencing Factors for the off-Season (15 March).
VariableCoefficient [a]StdErrorProbability [b]VIF [c]
Intercept716.223813258.3447580.005583 *--------
NQPDA1000−2155.505639748.7921430.004014 *8.898169
TPBTA100096.50587052.7625470.067439 5.323968
NQPDA1000070.86759817.9233960.000086 *7.800938
TPBTA100009.0927601.7474280.000000 *1.602675
Road Network Density166,614.9254916,530.5421930.000000 *3.566915
Distance to Bus Depot/Terminal−0.1832590.0759250.015805 *3.072622
Distance to Metro Station0.0327470.0607350.589794 3.418771
Floor Area Ratio2307.161466218.7445170.000000 *3.346409
Building Density−226.718486638.9138610.722728 1.002461
Average Housing Price0.1228580.0230330.000000 *1.789764
POI Density8.9501450.4385440.000000 *7.329613
POI Mix3357.537913183.2598030.000000 *3.372136
Shopping & Retail0.5399751.0344180.601694 6.016032
Landscape & Attractions−237.81905932.3339220.000000 *1.886030
Catering16.5847604.6072260.000335 *5.843977
Leisure & Entertainment52.52434030.3454010.083529 6.227914
Hotel & Accommodation32.1899135.5486760.000000 *3.890451
Medical & Insurance23.8442336.1376530.000113 *6.510724
Life Services−23.6572813.0116000.000000 *10.065604
Commercial & Residential17.51949513.2994270.187791 5.473145
Science, Education & Culture50.9701127.2034200.000000 *5.086368
Corporations & Enterprises−62.0659385.1041070.000000 *4.009531
This table presents the global OLS model regression results for all explanatory variables during the off-season (15 March). The asterisk next to the probability values indicates statistical significance (p < 0.05). The “Coefficient” indicates the direction and strength of the influence of the independent variables on the dependent variable. Variables with statistically significant probability values have a significant impact on off-season demand. The VIF value is used to diagnose multicollinearity; the high VIF values of some variables indicate evident multicollinearity issues in the model, which will be addressed in subsequent steps by removing collinear explanatory variables for optimization.
Table A7. Data of the OLS Model Pertaining to the off-Season (15 March).
Diag_NameDiag_Value
AIC128,388.79792700000
AICc128,389.01871700000
R20.68859973334
AdjR20.68742482273
F-Stat586.08691299500
F-Prob0.00000000000
The OLS regression results indicate that the model demonstrates good explanatory power on the off-season data. The adjusted R2 value of 0.687 shows that the independent variables explain 68.7% of the variance in the dependent variable. The F-statistic is highly significant at the 0.01 level (p < 0.01), confirming the overall validity of the model.
Table A8. OLS Model Results After Multicollinearity Remediation for the off-Season (15 March).
VariableCoefficient [a]StdErrorProbability [b]VIF [c]
Intercept797.729379191.3253930.000036 *--------
TPBTA1000011.6726681.5706380.000000 *1.277782
Road Network Density164,122.6404511,842.1193050.000000 *1.806488
Average Housing Price−0.2285920.0542140.000030 *1.546067
Distance to Bus Depot/Terminal2300.754568215.8774680.000000 *3.216451
Floor Area Ratio0.1244200.0229180.000000 *1.748728
POI Density8.6320110.2808300.000000 *2.966205
POI Mix3330.238611180.1430740.000000 *3.215611
Landscape & Attractions−193.73392229.6811370.000000 *1.568378
Hotel & Accommodation35.3593824.8273630.000000 *2.906022
Science, Education & Culture65.3822435.6324030.000000 *3.068849
Corporations & Enterprises−67.4692804.4838350.000000 *3.053592
This table presents the final set of variables selected for the Geographically Weighted Regression analysis. After the screening process, all retained variables exhibit acceptable Variance Inflation Factor values (<5) and statistically significant p-values (p < 0.01). These results confirm the overall robustness of the model and indicate that multicollinearity issues have been effectively resolved, thereby satisfying the prerequisite conditions for conducting GWR analysis.
Table A9. OLS Model Data after Removing Multicollinearity (15 March).
Diag_NameDiag_Value
AIC128,460.27214200000
AICc128,460.32926700000
R20.68381014151
AdjR20.68326447341
F-Stat1253.16130191000
F-Prob0.00000000000
The model diagnostic metrics indicate that, after controlling for multicollinearity, the independent variables explain approximately 68.3% of the variance in the dependent variable (Adjusted R2 = 0.683), and the model is highly significant overall (p < 0.001). The AIC and AICc values will serve as benchmarks for subsequent comparisons of goodness-of-fit with local models such as GWR.
Table A10. Spatial Autocorrelation Analysis (Global Moran’s I) of GWR Model Coefficients for the Peak Season (1 January).
Variable DescriptionMoran’s Iz-Scorep-ValueSpatial Pattern Judgment
POI Functional Mix Index0.993324111.533<0.001Highly Significant Clustering
POI Density0.985401110.666<0.001Highly Significant Clustering
Road Betweenness (Vehicular)0.980215110.054<0.001Highly Significant Clustering
Road Network Density0.994259111.643<0.001Highly Significant Clustering
Housing Price0.988510110.990<0.001Highly Significant Clustering
Accessibility to Bus Stops0.997275111.999<0.001Highly Significant Clustering
Corporate Density0.986078110.722<0.001Highly Significant Clustering
Hotel Density0.972212109.167<0.001Highly Significant Clustering
Floor Area Ratio (FAR)0.997287111.981<0.001Highly Significant Clustering
This table presents the Global Moran’s I analysis results of the regression coefficients for each driving factor in the peak-season GWR model. All coefficients exhibit a highly significant positive spatial correlation at the level of p < 0.001, indicating that their influence intensity demonstrates high spatial clustering and regularity, rather than a random distribution.
Table A11. Spatial Autocorrelation Analysis (Global Moran’s I) of GWR Model Coefficients for the Off-Season (15 March).
Variable DescriptionMoran’s IZ-Scorep-ValueSpatial Pattern Judgment
Bus Stop Accessibility1.001507112.501<0.001Highly Significant Clustering
Road Network Density0.999001112.170<0.001Highly Significant Clustering
Floor Area Ratio0.998528112.133<0.001Highly Significant Clustering
Road Betweenness0.985473110.643<0.001Highly Significant Clustering
Housing Price0.985821110.693<0.001Highly Significant Clustering
POI Density0.982313110.315<0.001Highly Significant Clustering
Sci-Edu Density0.974207109.417<0.001Highly Significant Clustering
Hotel Density0.961187107.942<0.001Highly Significant Clustering
Scenic Spot Distribution0.952843107.278<0.001Highly Significant Clustering
Corporate Density0.991270111.302<0.001Highly Significant Clustering
POI Functional Mix Index0.992730111.460<0.001Highly Significant Clustering
This table presents the spatial autocorrelation analysis results of the regression coefficients for each variable in the off-season GWR model after controlling for multicollinearity. Similarly to the peak season, all coefficients exhibit highly significant spatial clustering, revealing that the off-season driving mechanisms also possess strong spatial dependence characteristics.

References

  1. Shaw, G.; Williams, A.M. Tourism and Tourism Spaces; SAGE Publications: London, UK, 2004. [Google Scholar] [CrossRef]
  2. Liu, S.; Guo, Q. Image Perception of Ice and Snow Tourism in China and the Impact of the Winter Olympics. PLoS ONE 2023, 18, e0287530. [Google Scholar] [CrossRef]
  3. Farstad, E.; Mehmetoglu, M.; Higham, J.; Landa-Mata, I.; Hopkins, D.; Jacobsen, J.K.S. Back to the Future: Advancing More Sustainable Tourism through Domestic Summer Holidaying after the COVID-19 Pandemic. Nor. J. Geogr. 2024, 78, 197–209. [Google Scholar] [CrossRef]
  4. Naydenov, A.; Naumov, N.; Varadzhakova, D. Camping Tourism in Bulgaria: A Time-Series Analysis of Tourist Demand. Geogr. Pol. 2023, 96, 361–380. [Google Scholar] [CrossRef]
  5. Matlovič, R.; Matlovičová, K. The Metamodern Shift in Geographical Thought: Oscillatory Ontology and Epistemology, Post-Disciplinary and Post-Paradigmatic Perspectives. Folia Geogr. 2025, 67, 22–69. [Google Scholar]
  6. Storm, J.A.J. Metamodernism: The Future of Theory; The University of Chicago Press: Chicago, IL, USA, 2021; 359p, ISBN 978-0-226-78665-0. [Google Scholar]
  7. Kaiser, M.S.; Lwin, K.T.; Mahmud, M.; Hajializadeh, D.; Chaipimonplin, T.; Sarhan, A.; Hossain, M.A. Advances in Crowd Analysis for Urban Applications through Urban Event Detection. IEEE Trans. Intell. Transp. Syst. 2017, 19, 3092–3112. [Google Scholar] [CrossRef]
  8. Tang, J.; Zhao, Y.; Yang, X.; Deng, M.; Liu, H.; Ding, C.; Mei, X. Statistical and Density-Based Clustering of Geographical Flows for Crowd Movement Patterns Recognition. Appl. Soft Comput. 2024, 163, 111912. [Google Scholar] [CrossRef]
  9. Lin, W.; Mi, Y.; Wang, W.; Wu, J.; Wang, J.; Mei, T. A Diffusion and Clustering-Based Approach for Finding Coherent Motions and Understanding Crowd Scenes. IEEE Trans. Image Process. 2016, 25, 1674–1687. [Google Scholar] [CrossRef]
  10. Xu, M.; Li, C.; Lv, P.; Lin, N.; Hou, R.; Zhou, B. An Efficient Method of Crowd Aggregation Computation in Public Areas. IEEE Trans. Circuits Syst. Video Technol. 2017, 28, 2814–2825. [Google Scholar] [CrossRef]
  11. Han, J.; Gao, M.; Sun, Y. Research on the Measurement and Path of Urban Agglomeration Growth Effect. Sustainability 2019, 11, 5179. [Google Scholar] [CrossRef]
  12. Fu, X.; Zhang, Y.; Ortúzar, J.D.D.; Lü, G. Activity-Travel Pattern Inference Based on Multi-Source Big Data. Transp. Rev. 2025, 45, 26–48. [Google Scholar] [CrossRef]
  13. Gan, C.; Voda, M.; Wang, K.; Chen, L.; Ye, J. Spatial Network Structure of the Tourism Economy in Urban Agglomeration: A Social Network Analysis. J. Hosp. Tour. Manag. 2021, 47, 124–133. [Google Scholar] [CrossRef]
  14. Saqr, M.; Fors, U.; Nouri, J. Using Social Network Analysis to Understand Online Problem-Based Learning and Predict Performance. PLoS ONE 2018, 13, e0203590. [Google Scholar] [CrossRef]
  15. Liu, C.; Chen, L.; Yuan, Q.; Wu, H.; Huang, W. Revealing Dynamic Spatial Structures of Urban Mobility Networks and the Underlying Evolutionary Patterns. ISPRS Int. J. Geo-Inf. 2022, 11, 237. [Google Scholar] [CrossRef]
  16. Qin, K.; Xu, Y.; Kang, C.; Sobolevsky, S.; Kwan, M.P. Modeling Spatio-Temporal Evolution of Urban Crowd Flows. ISPRS Int. J. Geo-Inf. 2019, 8, 570. [Google Scholar] [CrossRef]
  17. Chen, W.; Liang, Y.; Zhu, Y.; Chang, Y.; Luo, K.; Wen, H.; Zheng, Y. Deep Learning for Trajectory Data Management and Mining: A Survey and Beyond. arXiv 2024, arXiv:2403.14151. [Google Scholar] [CrossRef]
  18. Li, Y.; Liu, C.; Li, Y. Identification of Urban Functional Areas and Their Mixing Degree Using Point of Interest Analyses. Land 2022, 11, 996. [Google Scholar] [CrossRef]
  19. Coffee, N.T.; Lockwood, T.; Hugo, G.; Paquet, C.; Howard, N.J.; Daniel, M. Relative Residential Property Value as a Socio-Economic Status Indicator for Health Research. Int. J. Health Geogr. 2013, 12, 22. [Google Scholar] [CrossRef] [PubMed]
  20. Yao, T.; Xu, Y.; Sun, L.; Liao, P.; Wang, J. Application of Machine Learning and Multi-Dimensional Perception in Urban Spatial Quality Evaluation: A Case Study of Shanghai Underground Pedestrian Street. Land 2024, 13, 1354. [Google Scholar] [CrossRef]
  21. Huang, C.; Xiao, C.; Rong, L. Integrating Point-of-Interest Density and Spatial Heterogeneity to Identify Urban Functional Areas. Remote Sens. 2022, 14, 4201. [Google Scholar] [CrossRef]
  22. Ma, F. Spatial Equity Analysis of Urban Green Space Based on Spatial Design Network Analysis (sDNA): A Case Study of Central Xi’an, China. Sustain. Cities Soc. 2020, 60, 102256. [Google Scholar] [CrossRef]
  23. Tzortzi, J.N.; Saxena, I. Bridging Matera’s Fragmented Identity: Unifying Disconnected Urban Spaces. Land 2024, 13, 1935. [Google Scholar] [CrossRef]
  24. Yu, W.; Zhang, Y.; Zhou, W.; Wang, W.; Tang, R. Urban Expansion in Shenzhen since 1970s: A Retrospect of Change from a Village to a Megacity from the Space. Phys. Chem. Earth Parts A/B/C 2019, 110, 21–30. [Google Scholar] [CrossRef]
  25. Dark, S.J.; Bram, D. The Modifiable Areal Unit Problem (MAUP) in Physical Geography. Prog. Phys. Geogr. 2007, 31, 471–479. [Google Scholar] [CrossRef]
  26. Wang, J.-F.; Li, X.-H.; Christakos, G.; Liao, Y.-L.; Zhang, T.; Gu, X.; Zheng, X.-Y. Geographical Detectors-Based Health Risk Assessment and Its Application in the Neural Tube Defects Study of the Heshun Region, China. Int. J. Geogr. Inf. Sci. 2010, 24, 107–127. [Google Scholar] [CrossRef]
  27. Sulekan, A.; Jamaludin, S.S.S. Review on Geographically Weighted Regression (GWR) Approach in Spatial Analysis. Malays. J. Fundam. Appl. Sci. 2020, 16, 173–177. [Google Scholar] [CrossRef]
  28. Kondo, K. Hot and Cold Spot Analysis Using Stata. Stata J. 2016, 16, 613–631. [Google Scholar] [CrossRef]
  29. Kashki, A.; Karami, M.; Zandi, R.; Roki, Z. Evaluation of the Effect of Geographical Parameters on the Formation of the Land Surface Temperature by Applying OLS and GWR, A Case Study Shiraz City, Iran. Urban Clim. 2021, 37, 100832. [Google Scholar] [CrossRef]
  30. Zhang, L.; Ma, Z.; Guo, L. An Evaluation of Spatial Autocorrelation and Heterogeneity in the Residuals of Six Regression Models. For. Sci. 2009, 55, 533–548. [Google Scholar] [CrossRef]
  31. Tao, H.; Zhou, J. Study on the Geographic Distribution and Influencing Factors of Dai Settlements in Yunnan Based on Geodetector. Sci. Rep. 2024, 14, 8948. [Google Scholar] [CrossRef]
  32. Liang, W.; Ahmad, Y.; Mohidin, H.H.B. Spatial Pattern and Influencing Factors of Tourism Based on POI Data in Chengdu, China. Environ. Dev. Sustain. 2024, 26, 10127–10143. [Google Scholar] [CrossRef]
  33. Pipere, A.; Mārtinsone, K. Metamodernism and Social Sciences: Scoping the Future. Soc. Sci. 2022, 11, 457. [Google Scholar] [CrossRef]
  34. Zhang, J.; Yu, Z.; Miao, C.; Li, Y.; Qiao, S. Cultural Tourism Weakens Seasonality: Empirical Analysis of Chinese Tourism Cities. Land 2022, 11, 308. [Google Scholar] [CrossRef]
  35. Hussain, S.; Ullah, A.; Khan, N.U.; Syed, A.A.; Han, H. Tourism, Transport Energy Consumption, and the Carbon Dioxide Emission Nexus for the USA: Evidence from Wavelet Coherence and Spectral Causality Approaches. Int. J. Sustain. Transp. 2024, 18, 168–183. [Google Scholar] [CrossRef]
  36. Niu, H.; Silva, E.A. Crowdsourced Data Mining for Urban Activity: Review of Data Sources, Applications, and Methods. J. Urban Plan. Dev. 2020, 146, 04020007. [Google Scholar] [CrossRef]
  37. Liu, J.; Pei, X.; Liao, B.; Zhang, H.; Liu, W.; Jiao, J. Scale Effects and Spatial Heterogeneity of Driving Factors in Ecosystem Services Value Interactions within the Tibet Autonomous Region. J. Environ. Manag. 2024, 351, 119871. [Google Scholar] [CrossRef] [PubMed]
  38. Higham, J.; Cohen, S.A.; Peeters, P.; Gössling, S. Psychological and Behavioural Approaches to Understanding and Governing Sustainable Mobility. J. Sustain. Tour. 2013, 21, 949–967. [Google Scholar] [CrossRef]
  39. Zhou, Y.; Yi, P.; Li, W.; Gong, C. Assessment of City Sustainability from the Perspective of Multi-Source Data-Driven. Sustain. Cities Soc. 2021, 70, 102918. [Google Scholar] [CrossRef]
  40. Feng, Y.; Hu, J.; Duan, R.; Chen, Z. Credibility Assessment Method of Sensor Data Based on Multi-Source Heterogeneous Information Fusion. Sensors 2021, 21, 2542. [Google Scholar] [CrossRef]
Figure 1. Article Framework Diagram. This figure illustrates the technical framework for analyzing crowd aggregation and dispersion. In this chart, solid arrows indicate the main analytical procedure or strong direct relationships; dashed arrows represent supportive data flows, interpretive relationships, and model inputs.
Sustainability 17 10514 g001
Figure 2. The figure depicts the study area located within the Fourth Ring Road of Harbin City, Heilongjiang Province, China.
Sustainability 17 10514 g002
Figure 3. This figure presents the initial heatmap data for the time period 12:00–13:00 on 1 January 2025. The color intensity at each point corresponds to the magnitude of the heatmap value.
Sustainability 17 10514 g003
Figure 4. Spatial distribution of the four key types of built environment and socioeconomic data used in this study: (a) Points of Interest (POI), (b) public transport stops, (c) building footprints, and (d) residential property prices.
Sustainability 17 10514 g004
Figure 5. Total Intensity of Population Aggregation and Dispersion: (a) Peak Season vs. (b) Off-Season.
Sustainability 17 10514 g005
Figure 6. This figure shows the hot spot and cold spot analysis of population aggregation/dispersion intensity for both seasons, with the primary difference located near Taiyang Island. (a) peak season. (b) off-season.
Sustainability 17 10514 g006
Figure 7. Cluster Characteristics and Spatial Distribution of Peak-season Population Aggregation/Dispersion Category 1 Based on Clustering Analysis. The green lines depict the temporal variation in standardized aggregation values across all regions. (a) Spatio-temporal fluctuation characteristics of Cluster 1. (b) Spatial distribution pattern of Cluster 1.
Sustainability 17 10514 g007
Figure 8. This is a figure, illustrates the cluster characteristics and spatial distribution of population aggregation/dispersion Category 2 during the peak season, which functions as a passenger flow distribution hub for tourist attractions and commercial districts. The green lines depict the temporal variation in standardized aggregation values across all regions. (a) Spatio-temporal fluctuation characteristics of Cluster 2. (b) Spatial distribution pattern of Cluster 2.
Sustainability 17 10514 g008
Figure 9. Cluster characteristics and spatial distribution of population aggregation/dispersion Category 3 during the peak season, exhibiting a typical consumption-destination pattern. The green lines depict the temporal variation in standardized aggregation values across all regions. (a) Spatio-temporal fluctuation characteristics of Cluster 3. (b) Spatial distribution pattern of Cluster 3.
Sustainability 17 10514 g009
Figure 10. Cluster characteristics and spatial distribution of population aggregation/dispersion Category 1 during the off-season, exhibiting a pattern dominated by local commuting with both stability and pulsating characteristics. The green lines depict the temporal variation in standardized aggregation values across all regions. (a) Spatio-temporal fluctuation characteristics of Cluster 1. (b) Spatial distribution pattern of Cluster 1.
Sustainability 17 10514 g010
Figure 11. Cluster characteristics and spatial distribution of population aggregation/dispersion Category 2 during the off-season, exhibiting a short-term pulse pattern. The green lines depict the temporal variation in standardized aggregation values across all regions. (a) Spatio-temporal fluctuation characteristics of Cluster 2. (b) Spatial distribution pattern of Cluster 2.
Sustainability 17 10514 g011
Figure 12. Cluster characteristics and spatial distribution of population aggregation/dispersion Category 3 during the off-season, exhibiting a resilient spatial pattern supported by the integration of commercial and residential functions. The green lines depict the temporal variation in standardized aggregation values across all regions. (a) Spatio-temporal fluctuation characteristics of Cluster 3. (b) Spatial distribution pattern of Cluster 3.
Sustainability 17 10514 g012
Figure 13. Comparison of cluster characteristics for population activity during peak and off-seasons. The peak season exhibits an “area-wide fluctuation” pattern with dispersed and highly heterogeneous population activity, while the off-season shows concentration around midday fluctuations, presenting a more predictable urban operational rhythm. (a) Peak season. (b) Off-season.
Sustainability 17 10514 g013
Figure 14. Spatial distribution of all key explanatory variables selected for this study. (a) Bus Stop Accessibility. (b) Building Density. (c) FAR. (d) Subway Station Accessibility. (e) Average Housing Price. (f) POI Density. (g) POI Functional Mix Index. (h) NPQDA Distribution at 1000 m Scale. (i) NPQDA Distribution at 10,000 m Scale. (j) TPBTA Distribution at 1000 m Scale. (k) TPBTA Distribution at 10,000m Scale. (l) Road Network Density.
Sustainability 17 10514 g014
Figure 15. Spatial distribution of the local estimated coefficients for influencing factors of population aggregation/dispersion intensity during the peak season in Harbin. (a) TPBTA Distribution at 10,000 m Scale. (b) Road Network Density. (c) POI Density. (d) POI Functional Mix Index. (e) FAR. (f) Kernel Density of Hotels. (g) Kernel Density of Firms. (h) Bus Stop Accessibility. (i) Average Housing Price.
Sustainability 17 10514 g015
Figure 16. Presents the coefficient maps of explanatory variables from the off-season GWR model for Harbin. The operational mechanisms revealed in these maps contrast with those observed during the peak season, demonstrating the urban system’s off-season resilience—achieved through functional transformation and demand rebalancing—during periods of low demand. (a) TPBTA Distribution at 10,000 m Scale. (b) Kernel Density of Schools. (c) Kernel Density of Scenic Spots. (d) Road Network Density. (e) Average Housing Price. (f) POI Density. (g) Kernel Density of Hotels. (h) Kernel Density of Firms. (i) Bus Stop Accessibility. (j) POI Functional Mix Index. (k) FAR.
Sustainability 17 10514 g016
Figure 17. Spatial Clustering Analysis Results of Population Activity on Peak-Season Workdays.The green lines depict the temporal variation in standardized aggregation values across all regions. (a) Cluster 0. (b) Cluster 1.
Sustainability 17 10514 g017
Figure 18. Temporal Pattern Comparison of Clusters on the Peak Season Weekday.
Sustainability 17 10514 g018
Figure 19. Spatial Clustering Analysis Results of Population Activity on an Off-Season Weekend (22 March). The green lines depict the temporal variation in standardized aggregation values across all regions. (a) Cluster 0. (b) Cluster 1.
Sustainability 17 10514 g019
Figure 20. Temporal Pattern Comparison of Clusters on Off-Season Weekend (22 March).
Sustainability 17 10514 g020
Table 1. Data Sources and Preprocessing Description.
Specific Data NameData Content DescriptionData Format/SourceBrief Description of Processing
Basic Geographic DataAdministrative Boundary DataAdministrative boundaries at various levelsGADM Global Administrative Areas DatabaseUsed to define the study area, serving as the base for spatial analysis
Road Traffic DataRoad type, location, length, name, etc.openstreetmapUsed to calculate road network density, build network datasets, and perform sDNA analysis
Building Footprint DataBuilding footprint, heightCrawled from Tianditu PlatformUsed for calculating building density and floor area ratio within the fishnet grid.
POICentral City POI DataAddress, administrative district, typeCrawled via Baidu Maps APIClassified by type, used to calculate facility density, function mix index, and other metrics
Bus and metro Stop DataStation names, latitude, and longitudeCrawled from Baidu MapsUsed for public transport accessibility analysis
Socioeconomic DataResidential Property Price DataAverage property price within unit gridNumericalUsed to analyze the spatial differentiation of housing prices and its influencing factors
Table 2. Explanation Data and Sources.
Built EnvironmentData SourcesIndicatorExplanation
Construction IntensityBuilding Footprint DataBuilding DensityTotal Base Area/Site Area
FARTotal Floor Area/Site Area
Land UseInfrastructure POI DataLand Use MixShannon Entropy
Kernel Density of InfrastructureKernel Density
POI DensityNumber of Facilities/Grid Cell Area
Transportation AccessibilityRoad network dataRoad Network DensityRoad Length within the Grid Cell/Grid Cell Area
Road AccessibilityCloseness Metric Calculated based on the sDNA Model
Road BetweennessBetweenness Metric Calculated based on the sDNA Model
Public transport POIDistance to the Nearest Public Transport StopDistance from the Grid Cell Centroid to the Nearest Metro/Bus Station
Socioeconomic FactorsResidential Unit Pricehouse priceAverage housing price within the grid cell
Table 3. General G statistics of population flow (Peak vs. Off-season).
Statistical MetricObserved General G:Expected General G:Variance:z-Score:p-Value:
PEAK0.0000060.0000020.00000074.1087320.000000
LOW0.0000050.0000020.00000072.7958890.000000
Table 4. Comparison of Model Performance between OLS and GWR during the Peak Season.
R2R2 AdjustedAICc
OLS0.679427924480.67892506632127,265.26724200
GWR0.7360560.723182126,465.488768
Table 5. Spatial Autocorrelation Analysis Results of Residuals from the OLS and GWR Models during the Peak Season.
ModelAnalysis ObjectMoran’s Iz-Scorep-ValueSpatial Pattern Judgment
OLSResiduals0.16818.97<0.001Highly Significant Clustering (Non-Random)
GWRResiduals0.0889.90<0.001Significant Clustering (But Weakened)
Table 6. Comparison of Model Performance between OLS and GWR during the Off-Season.
R2R2 AdjustedAICc
OLS0.683810141510.68326447341128,460.32926700000
GWR0.7405310.726046127,708.172418
Table 7. Spatial Autocorrelation Analysis Results of Residuals from the Off-season OLS and GWR Models.
ModelAnalysis ObjectMoran’s Iz-Scorep-ValueSpatial Pattern Judgment
OLSResiduals0.15617.56<0.001Highly Significant Clustering (Non-Random)
GWRResiduals0.0758.43<0.001Significant Clustering (But Weakened)
Table 8. Factor detector results for population gathering–dispersal intensity in the peak season.
ABCDEFGHI
q statistic0.2930.2930.4390.4390.5310.4910.48210.3600.191
p value000000000
Table 9. Interaction detector results for factors influencing population gathering–dispersal intensity in the peak season.
ABCDEFGHI
A10.293
B10.405 0.293
C10.531 0.500 0.439
D10.474 0.452 0.509 0.385
E10.599 0.581 0.588 0.602 0.531
F10.538 0.523 0.544 0.526 0.622 0.491
G10.538 0.521 0.569 0.561 0.595 0.610 0.482
H10.450 0.432 0.476 0.473 0.567 0.522 0.526 0.360
I10.330 0.356 0.490 0.442 0.561 0.512 0.521 0.407 0.191
Table 10. Factor detector results for population gathering–dispersal intensity in the off-season.
abcdefghijk
q statistic0.2000.2990.3810.5440.5100.1210.4640.3750.5130.3040.456
p value00000000000
Table 11. Table Interaction detector results for factors in the off-season.
abcdefghijk
a10.200
b10.3650.299
c10.4410.4530.381
d10.5750.5910.5960.544
e10.5320.5420.5380.6370.510
f10.2740.3520.4190.5570.5390.121
g10.5060.5030.5410.5940.5930.4790.464
h10.4260.4470.4870.5810.5410.4000.5130.375
i10.5440.5320.5590.6300.5960.5250.5610.5360.513
j10.3440.4170.4800.6060.5580.3380.5250.4650.5490.304
k10.5110.5190.5150.6050.5640.4900.5640.4920.5780.5520.456
Table 12. Factor detector results for Influencing Population Gathering–Dispersal Intensity in the Peak Season Weekday.
a1b1c1d1e1f1g1h1i1j1
q statistic0.1790.3000.3400.0010.4590.1240.4290.3640.2880.417
p value0.0000.0000.0000.15420.0000.0000.0000.0000.0000.000
Table 13. Interaction Detector Results for Factors Influencing Population Gathering–Dispersal Intensity in the Peak Season Weekday.
a1b1c1d1e1f1g1h1i1j1
a10.179000000000
b10.350.300000000
c10.3950.4240.340000000
d10.1820.3030.3440.001000000
e10.4810.4960.4850.4650.45900000
f10.2560.350.3790.1320.4870.1240000
g10.4630.4730.4940.4330.5310.4460.429000
h10.4040.4350.4480.3670.4940.390.4840.36400
i10.3210.4040.4370.2910.5020.3270.4940.4430.2880
j10.4630.4840.4680.420.5050.4540.5190.4590.5050.417
Table 14. Factor detector results for Influencing Population Gathering–Dispersal Intensity on Off-Season Weekend (22 March).
a1b1c1d1e1f1g1h1i1j1
q statistic0.210.3170.4050.0010.5510.1170.4830.3950.3140.484
p value0.0000.0000.0000.5427240.0000.0000.0000.0000.0000.000
Table 15. Interaction Detector Results for Factors Influencing Population Gathering–Dispersal Intensity on Off-Season Weekend (22 March).
a1b1c1d1e1f1g1h1i1j1
a10.21
b10.3850.3170
c10.4680.480.405
d10.2140.3180.4070.001
e10.5710.5810.5780.5550.551
f10.2770.3610.4330.1210.5690.117
g10.5240.5250.5670.4870.6220.4960.483
h10.4470.470.5140.3970.5750.4150.5390.395
i10.3570.4360.5050.3160.5920.3440.5470.4840.314
j10.540.5480.5470.4860.60.5110.5910.520.5780.484
Disclaimer/Publisher’s Note: The statements, opinions and data contained in all publications are solely those of the individual author(s) and contributor(s) and not of MDPI and/or the editor(s). MDPI and/or the editor(s) disclaim responsibility for any injury to people or property resulting from any ideas, methods, instructions or products referred to in the content.