1. Introduction
Mediterranean agricultural systems are facing an urgent water scarcity problem due to climate change, highly irregular rainfall, and increasing competition for water resources. In the Algarve region, annual precipitation averages around 560 mm, primarily occurring during the wet half-year. However, the hottest months often result in severe water deficits that compromise crop productivity, rendering rainfed agriculture increasingly unsustainable [
1,
2]. Severe drought episodes in 1993, 2005, 2012, and 2019, confirmed by the Palmer Drought Severity Index (PDSI) published by the Portuguese Institute for Sea and Atmosphere, illustrate the vulnerability of these systems, with a worsening trend observed in the monthly bulletins for 2023. Efficient water management, including reservoir planning and irrigation optimisation, is therefore essential to maintain agricultural sustainability and resilience [
3].
Anthropogenic activities, particularly the combustion of fossil fuels, intensify global warming and amplify the effects of climate change, which now constitute the foremost threat to sustainable development in the twenty-first century, impacting all three pillars, namely, environmental, economic, and social [
4]. These impacts manifest as extreme meteorological events, droughts, and floods that compromise the resilience of agricultural systems; in Mediterranean-type regions, characterised by highly irregular rainfall, such uncertainty becomes especially critical [
1]. Societal sustainability, therefore, hinges on the judicious management of natural resources, particularly water, the basis of life and every productive chain [
5]. Agriculture offers the most significant scope for improving water-use efficiency among economic sectors, whether through refinements infield practice or internalising water use’s environmental cost [
6].
Remote Sensing (RS) and Geographic Information Systems (GISs) are fundamental in fostering a more modern and sustainable agriculture, characterised by markedly more efficient water management. These tools enable precise crop mapping, reliable estimation of water requirements, and informed irrigation scheduling, thereby optimising water resources and reducing wastage [
7]. Numerous studies based on Sentinel-2 imagery demonstrate that Convolutional Neural Networks and machine-learning time series analyses can accurately identify irrigated areas and monitor land use, soil moisture, and water stress [
8,
9,
10].
Digital Elevation Models (DEMs) and GISs provide critical support for hydrological analysis by modelling flow direction and accumulation, delineating catchment boundaries, and identifying optimum sites for water retention [
11,
12]. More recent literature incorporates specialised agro-hydrological tools, such as the MHYDAS-Small-Reservoirs module, which integrates hydro-sedimentary dynamics in a chain of reservoirs typical of Mediterranean basins [
13]. Refined evaporative-balance models for small dams quantify losses exceeding 25% of the annual volume under a regional warming of +2 °C [
14]. Participatory approaches have demonstrated the socio-economic viability of cascaded reservoir systems in Tuscany and Andalusia, integrating local governance, water-use efficiency, and ecosystem conservation [
15].
The São Brás de Alportel case study analysed here exemplifies these synergies. The municipality occupies an area between the Barrocal and Serra zones. In the northern Serra, higher elevations, steep slopes, and shallow, schistose soils limit agricultural activity. In contrast, the southern Barrocal is flatter, underlain by calcareous soils, and is more suitable for agriculture, particularly rainfed crops and orchards. The municipality lies across two drainage basins: the Algarve Coastal Streams basin and the Guadiana River basin. These basins are crucial for water supply, climate regulation, and environmental sustainability, directly impacting local livelihoods and the regional economy. The municipality is also served by a road network that ensures access to rural areas and potential reservoir sites, including National Road EN-2 and Municipal Road EM-270.
Using 25 cm-resolution orthophotos, cadastral data, and Sentinel-2 imagery, 2854 ha of agricultural land were mapped, of which only 112 ha are irrigated, identified via the Normalised Difference Vegetation Index (NDVI) with a Kappa coefficient of 0.88. Hydrological modelling based on the DEM and interpolated rainfall data delineated 38 micro-catchments and selected three sites with suitable geomorphological conditions for small dams with 8 m to 12 m high. At one of these sites, two reservoirs arranged in a cascade were selected as an alternative to a single structure exceeding 12 m in height, thereby reducing environmental and landscape impact. The water-balance assessment indicated complete reservoir recharge between October and November in an average year and between October and January in a dry year, meeting agricultural demand during the summer. It also suggested the construction of additional downstream reservoirs to harness surplus discharges. This cascaded solution reconciles risk mitigation, reduces landscape impact, and provides gravity-fed water distribution, eliminating the need for pumping energy to supply the agricultural plots.
In light of the above, this study addresses the need to enhance water resilience in the region by identifying the most suitable locations for agricultural water reservoirs. The approach relies on the integration of three scientific domains central to the sustainable management of water resources: (i) high-resolution multispectral remote sensing for monitoring land use and efficiency; (ii) Geographic Information Systems (GISs) combined with a criteria-based spatial evaluation framework for decision support; and (iii) hydrological modelling capable of simulating catchment behaviour under different scenarios of hydrological variability. Within this integrated framework, the specific objectives are as follows: (i) to identify locations most suitable for constructing agricultural reservoirs in a Mediterranean context by combining biophysical and territorial criteria using GISs and remote sensing; (ii) to calculate the water balance of each contributing catchment to inform storage capacity estimates; and (iii) to propose a structured, transferable methodology that can be applied in other territories facing increasing water stress.
2. Materials and Methods
2.1. Study Area
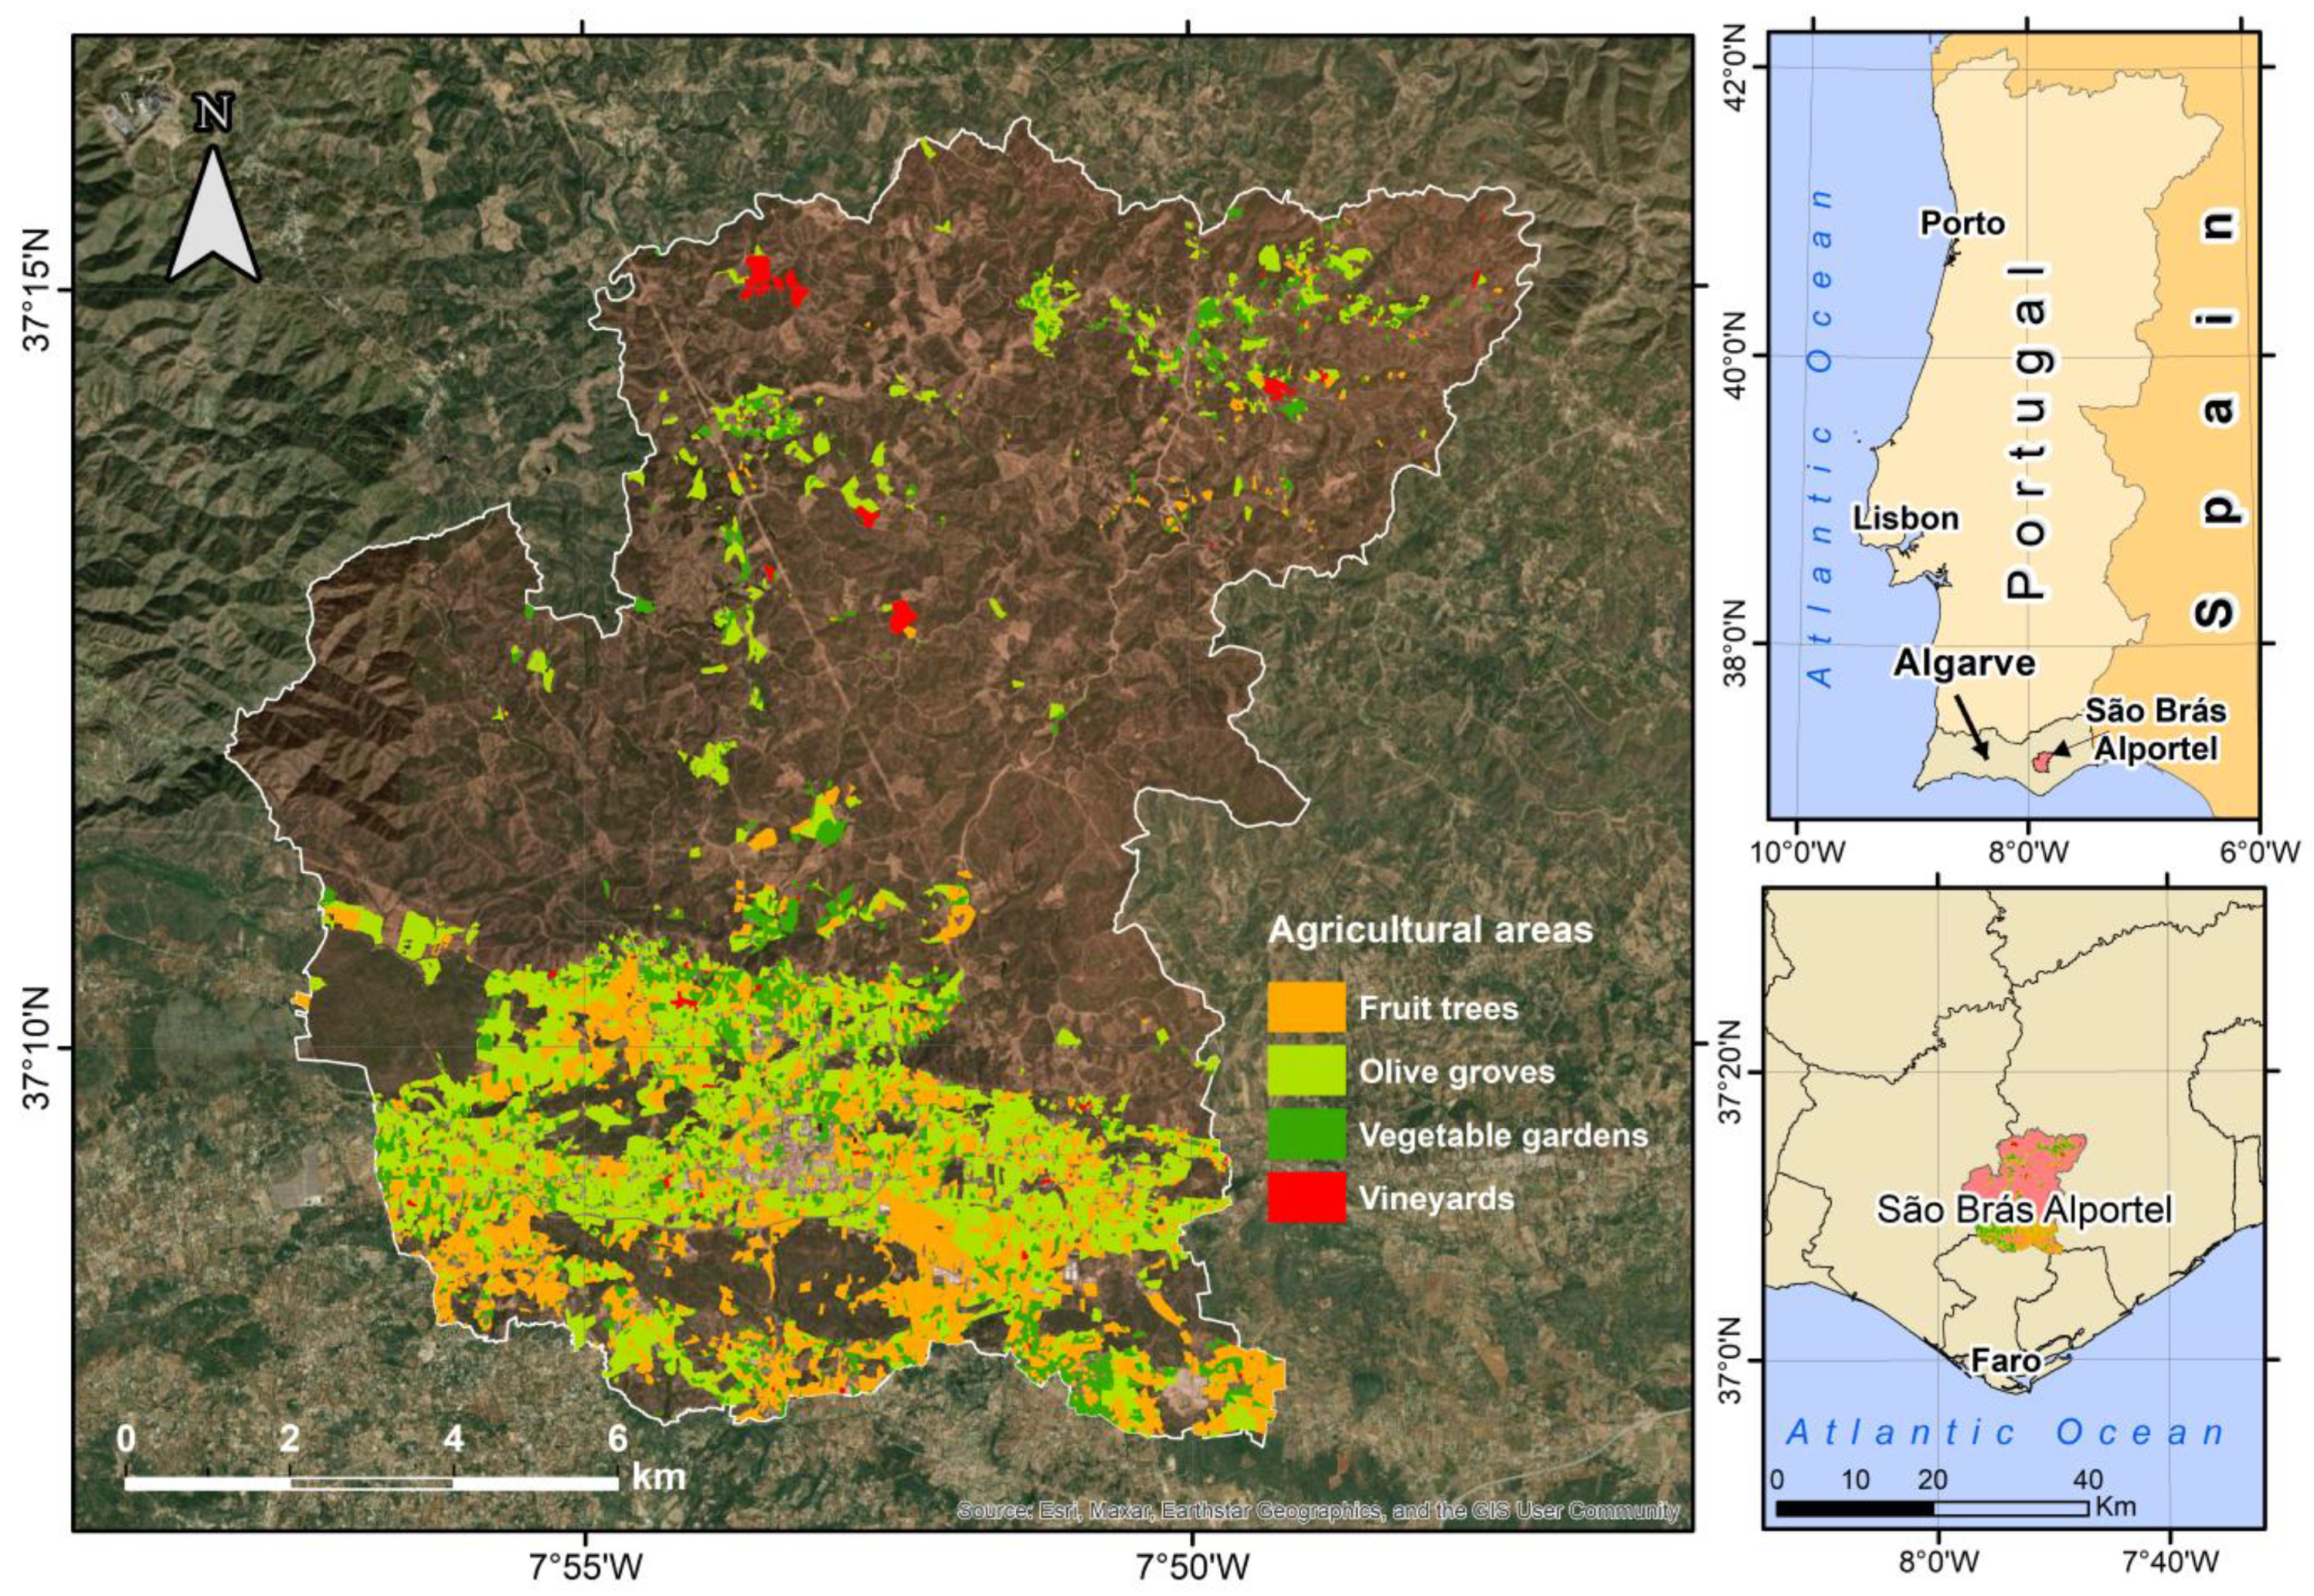
The municipality of São Brás de Alportel (
Figure 1) occupies 153.4 km
2 and lies between the Barrocal and the Serra zones (37°16′–37°07′ N, 7°47′–7°58′ W;
Figure 1). In the north of the municipality, the Serra is characterised by higher elevations, steeper slopes, and predominantly schistose, shallow, sometimes skeletal soils. The land cover is primarily forested, with the cork oak (
Quercus suber) as the dominant species.
In contrast, the southern Barrocal is generally flatter, underlain by calcareous soils. It is typified by stands of carob (Ceratonia siliqua), which, although classified as a forest species, is commonly associated with rainfed orchard systems of fig (Ficus carica), almond (Prunus dulcis), and olive (Olea europaea).
For this study, agricultural areas were delineated using the Portuguese Land Use and Land Cover Map (COS 2018, scale 1:25,000), the 2019 Cadastral Survey (scale 1:10,000), both produced by Direção Geral do Território (DGT), Portugal, and the 2020 Topographic Base Map (scale 1:10,000) produced by São Brás de Alportel Municipal Council (SBAMC). Approximately 27.3 km2 of the municipality is occupied by rainfed systems, whereas 1.6 km2 supports irrigated crops. Areas under fruit trees, vineyards, olive groves, and vegetable plots cover 9.6 km2, 0.6 km2, 14.4 km2, and 42.8 km2, respectively.
The climate is Mediterranean with Atlantic influence. According to the Köppen–Geiger classification, it is warm temperate with dry, hot summers (Csa) [
16]. Mean annual precipitation is about 560 mm, falling chiefly in the cooler months, while the mean annual temperature is 16.1 °C.
Soils in the Serra are skeletal, agriculturally unsuitable, predominantly schistose, and associated with an irregular relief. By contrast, the Barrocal is underlain by calcareous soils with gentler, less rugged topography, where limestone hills support Mediterranean vegetation [
17]. Agricultural activity is therefore viable only within the Barrocal zone.
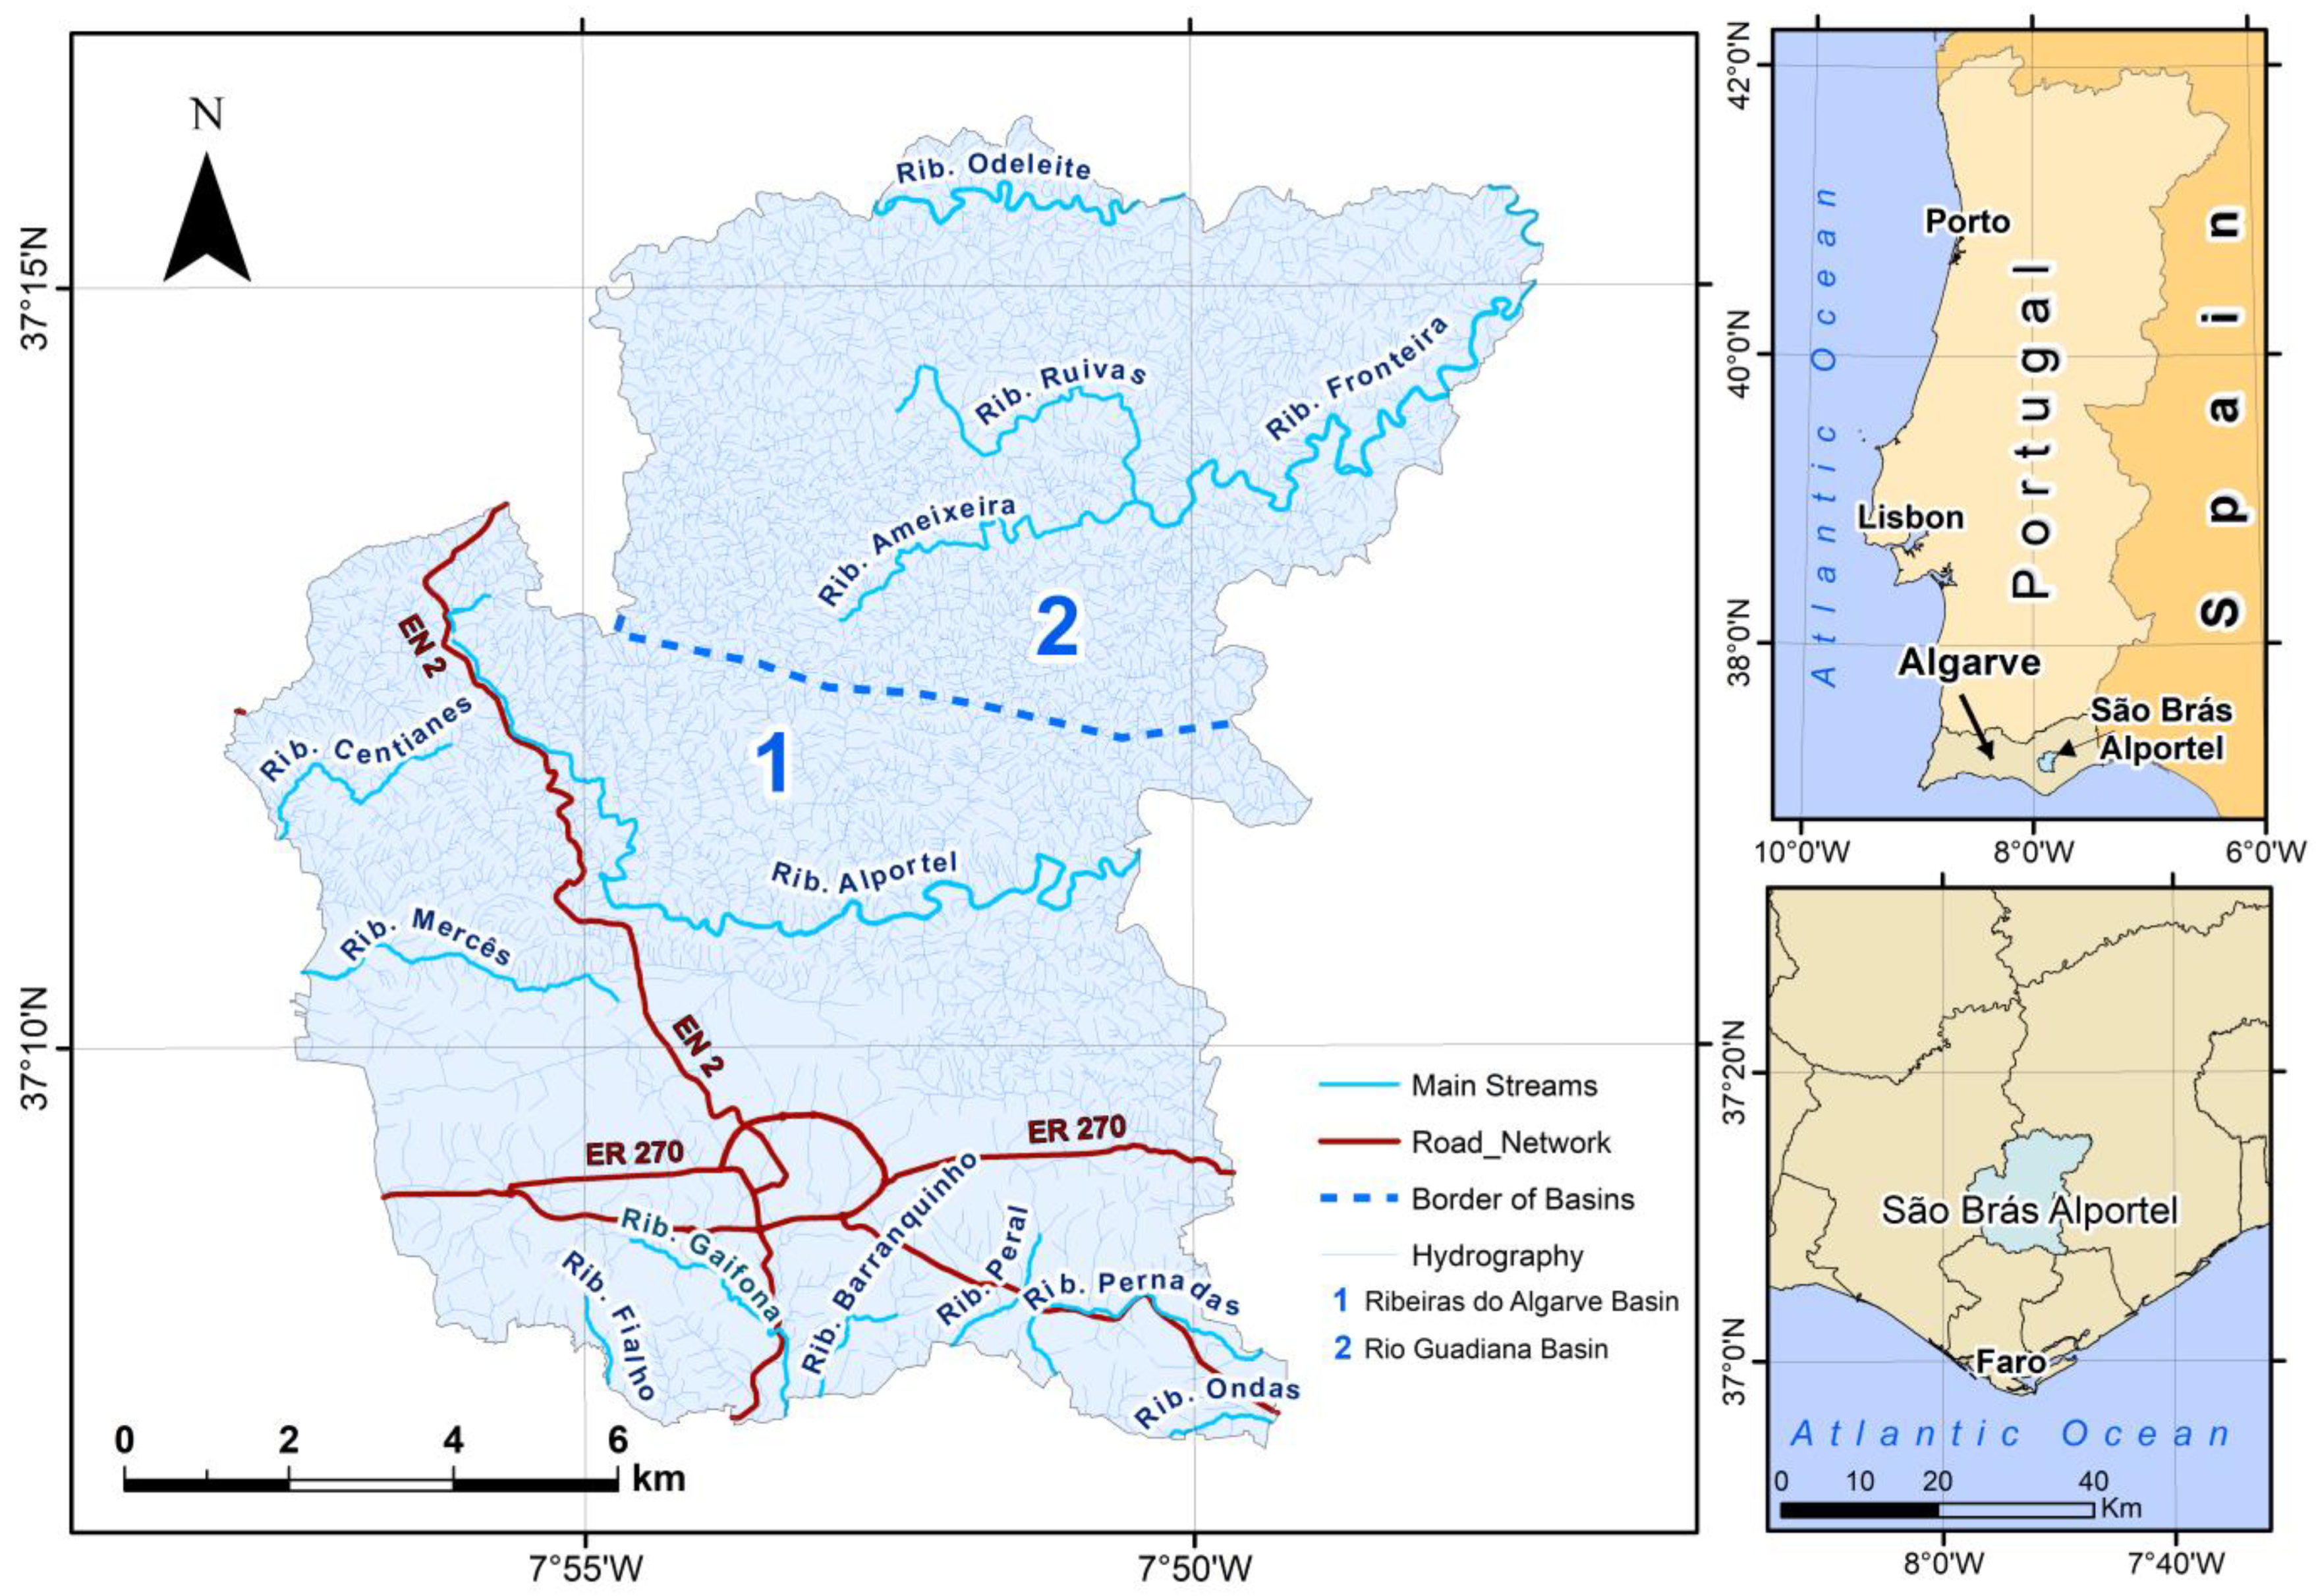
The municipality of São Brás de Alportel is situated between two drainage basins: the Algarve Coastal Streams basin (61.5% of the municipal area) and the Guadiana River basin (38.5%). The territory is also drained by several minor watercourses, notably the Ribeira de Alportel (the most important), Ribeira de Fronteira, Ribeira de Odeleite, Ribeira das Ruivas, Ribeira das Mercês, Ribeira da Ameixeira, Ribeira das Pernadas, Ribeira da Gaifona, Ribeira do Centianes, Ribeira do Peral, Ribeira do Barranquinho, Ribeira das Ondas, and Ribeira do Fialho. Also overlies two groundwater bodies: the São Brás de Alportel Aquifer System and the Peral–Moncarapacho Aquifer System.
Given the hydrological constraints and the need to manage water resources effectively, accessibility throughout the municipality is essential to support this management. The network of principal roads ensures connectivity: the National Road EN-2 links São Brás de Alportel to other parts of the country, while the Municipal Road EM-270 interconnects urban and rural areas and neighbouring localities, facilitating access for agricultural activities, reservoir construction, and maintenance.
Figure 2 presents the hydrological and road networks of the municipality.
2.2. GIS Methodology
It was first necessary to delineate the municipality’s agricultural land to identify potential sites for constructing water reservoirs. Polygons representing agricultural areas were extracted from the base topographic map. These polygons were subsequently refined using 29 RGB orthophotos from July 2021 with a spatial resolution of 25 cm, also provided SBAMC, and through field visits, to remove non-agricultural features such as dwellings, swimming pools, and other structures. The refined polygons were then intersected with the agricultural subclasses of COS 2018, which distinguish between temporary rainfed and irrigated crops, permanent crops (such as orchards and olive groves), and heterogeneous agricultural areas. COS 2018 had previously been corrected to exclude buildings and road networks.
Irrigated agricultural areas were identified using a multi-temporal
NDVI analysis derived from Sentinel-2 imagery (Equation (1)) [
18].
where
R represents the Red band (665 nm) and
NIR the Near-Infrared band (842 nm).
Satellite images from June, July, August, and September 2021 were retrieved from Google Earth Engine (GEE), with a cloud cover threshold of less than 10%. These summer months were selected because rainfall is minimal in the Algarve, allowing elevated NDVI values to be confidently attributed to irrigation activity.
The analysis was restricted to agricultural parcels only, and the mean NDVI was calculated across the four months. This NDVI layer was subsequently reclassified into five classes (0–0.1, 0.1–0.2, 0.2–0.4, 0.4–0.7, 0.7–1.0) to reflect vegetation vigour and irrigation intensity.
Some irrigated parcels were known a priori, while other areas with uncertain irrigation status were verified through four field visits. These field-verified parcels corresponded to NDVI values in the range 0.40–0.71, which were then used to classify irrigated areas across the study region.
By Portuguese regulation no. 202/70 Article 57 [
19], the minimum unit of area qualifying as irrigated horticultural land in the district of Faro is 0.5 ha. A parcel was considered irrigated if it contained at least 0.5 ha of pixels with
NDVI values within the 0.40–0.71 range.
A confusion matrix was constructed to validate the irrigation/non-irrigation classification by comparing classified pixels with reference pixels. A total of 100 samples were randomly selected within agricultural parcels and validated in the field using a Leica Zeno FLX100 Plus antenna in RTK mode. Subsequently, omission and commission errors and Cohen’s Kappa (κ) coefficient were computed. Classification accuracy categories are based on k, as follows [
20], and are presented in
Table 1.
For clarity,
Table 2 summarises all datasets used in this study, including their type, spatial resolution, temporal coverage, and source.
2.2.1. Most Suitable Sites for Agricultural Reservoirs
The most suitable sites for agricultural water-supply reservoirs were identified based on five criteria:
- (i)
Proximity to the drainage network (up to 10 m) and setback from infrastructure (more than 100 m from roads and high-voltage power lines);
- (ii)
Location on preferentially impermeable soils;
- (iii)
Location outside existing agricultural parcels and outside designated construction zones;
- (iv)
The reservoir site should be situated in a narrow valley with steep slopes, where the upstream section widens, allowing the formation of a sufficiently large water body for storage, while keeping the water depths between 8 m and 12 m and maintaining the inundated area as small as possible, thus minimising impacts on protected habitats and species;
- (v)
The reservoir crest should be located as close as possible to the first agricultural area to be served.
2.2.2. Digital Elevation Model and Drainage Derivation
The DEM was created based on elevation points, contour lines, and hydrography obtained from a 1:10,000 scale topographic map. The model was generated with a spatial resolution of 10 m using the Triangulated Irregular Network (TIN) method with linear interpolation. This interpolation approach was considered appropriate given that, in most of the study area, slopes are relatively smooth and linear in cross-section, particularly in the southern sector where terrain variability is low. The DEM was corrected for sinks, and flow direction and accumulation models were calculated.
A drainage line was created for flow-accumulation values greater than 160 cells. This ArcGIS 10.8 (Esri, Redlands, CA, USA) hydrological parameter indicates the number of upstream raster cells draining to each location, thereby indicating where water tends to concentrate. The threshold was validated in the field by identifying a minor watercourse that the model confirmed at that accumulation value. Stream orders were assigned using the Strahler method, and the associated micro-catchments were delineated.
To preserve network connectivity for subsequent flow analyses, drainage elements were converted to a vector Geometric Network with downstream flow directions explicitly defined, an essential framework for locating reservoirs.
2.2.3. Micro-Catchment Delineation and Site Criteria
Micro-catchments were defined for all streams in the study area. For each candidate reservoir, the downstream drainage area and its flowline were delineated.
Additional siting criteria stipulated a 100 m buffer from roads and power lines, avoidance of land currently under cultivation, and preference for mountainous terrain with low permeability and adequate storage potential. Potential sites were limited to locations suitable for embankments up to 12 m high that would fill between January and February, maintain a positive annual water balance and permit gravity-fed irrigation of downstream parcels situated within 10 m of the channel.
2.3. Water Balance
2.3.1. Water-Balance Equations for a Cascade of Reservoirs
The water balance of a reservoir is defined by the relationship between the volume of water entering, the volume leaving and the change in stored water over a given period. Calculating this balance requires quantifying the hydrological processes involved—namely precipitation, evapotranspiration, evaporation and surface runoff. The hydrological balance of a reservoir [
21] for a specified time interval is expressed by Equation (2).
where Δ
V is the change in stored volume (m
3),
Vin is the inflow volume (m
3), and
Vout is the outflow volume (m
3). The inflow volume was calculated with Equation (3).
where
R is the monthly surface-runoff depth (m);
Abasin the upstream catchment area, less the area contributing to the reservoir immediately upstream on the same watercourse, where applicable (m
2); and
Vm the volume discharged by that upstream reservoir (where applicable).
The outflow volume was calculated with Equation (4).
where
ET is the evapotranspiration (m),
Ar is the irrigated agricultural area (m
2),
D is the emergency spill discharge released when the reservoir reaches its maximum capacity, and
E is the direct evaporation from the reservoir surface.
2.3.2. Water Productivity of the Catchments
In the upstream catchment, water productivity is primarily governed by three hydrological processes: precipitation, soil water retention, and surface runoff. For the present study, runoff data were obtained from the River Basin Management Plan for the Algarve Region, provided by the Portuguese Environmental Agency (APA) [
22].
According to APA [
22], for Water Region 8 (Algarve Coastal Streams), surface water availability under natural conditions was assessed through hydrological modelling, producing monthly runoff series derived from precipitation and potential evapotranspiration data. A distributed grid-based model with 1 km spatial resolution and monthly time steps, implementing the Temez water balance method, was employed. Monthly precipitation and mean temperature datasets were used to generate spatially distributed estimates of potential and actual evapotranspiration, aquifer recharge, and total runoff. Model outputs were stored by sub-catchment and were driven by topographic, soil, meteorological and land use data, calibrated for the period 1930–2015 in part 2—volume B—Characterisation and Assessment [
22].
Monthly runoff data for the Arade catchment (the adjacent area extending from São Bartolomeu de Messines to Alte;
Table 3) were used. This choice was justified because the precipitation regimes and geology/soils of the two regions are identical, and they do not provide runoff data explicitly for the catchments examined in this study [
22]. The APA Environmental Atlas [
23] likewise shows that the annual runoff value is the same for both the Arade Basin and the study area (
Figure 3).
According to APA [
22], a dry year is characterised by a systematic reduction in monthly precipitation compared to the average year, with this reduction ranging from approximately −97% in August to −61% in March. This classification was derived from the analysis of long-term rainfall and runoff series, corresponding roughly to the lower quartile (P25) of the hydrological reference period. The average and dry years are used in hydrological and water-balance modelling to simulate scenarios of regular and reduced water availability for surface reservoirs, groundwater recharge, and agricultural water demand.
2.3.3. Water Losses from the Reservoirs
Water losses from reservoirs occur through direct evaporation and infiltration. In the present study, infiltration losses were assumed to be negligible. However, evaporation losses were estimated from monthly pan-evaporation data recorded at the São Brás de Alportel meteorological station of the National Water Resources Information System (SNIRH) [
24] and multiplied by a pan coefficient of 0.7 [
25]. Mean monthly pan-evaporation values for the period 1978–2018 are given in
Table 4.
2.3.4. Irrigation Water Requirements
Irrigation water requirements are determined by the irrigated area and crop evapotranspiration, as expressed by Equation (5) [
25].
where
ETo is the reference evapotranspiration,
Kc is the crop coefficient, and
Ks is the water-stress coefficient; irrigation is assumed to occur under non-stress conditions, so
Ks = 1.
The potential evapotranspiration (
ETo) data were obtained from APA [
22], where
ETo was estimated based on air temperature using the Hargreaves method, selected due to the wider availability and reliability of temperature records (
Table 5).
The crop coefficients (
Kc) used in this study are those published by [
2]. In line with the agricultural systems present, four
Kc categories were defined: orchard (citrus), olive grove, table-grape vineyard (
Table 6), and small vegetable crops.
For kitchen-garden plots, the crop coefficient value of 1.05 recommended by [
25] for small vegetables was adopted.
The Kc value used in calculating ETc corresponded to the area-weighted mean of the Kc values for those crop areas that intersect the watercourse downstream of the reservoir.
2.3.5. Criteria for Determining Reservoir Volume
The minimum usable volume of the reservoirs is determined by the upstream catchment area at the dam site, the irrigated area supplied by the reservoir, and local data on runoff and evapotranspiration. Thus, neglecting direct reservoir losses through infiltration and evaporation, we obtain the following:
where
gives
where
R is the runoff (m);
Ab is the upstream catchment area at the dam site (m
2);
ETc is the crop evapotranspiration (m), calculated as =
ETo ×
Kc;
ETo is the reference evapotranspiration (m);
Kc is the crop coefficient;
Ar is the irrigated area supplied by the reservoir (m
2); Δ
V is the monthly change in volume (m
3);
Vol. is the minimum usable volume of the reservoir, defined as modulus of the sum of the negative monthly variations, typically occurring in the summer months (m
3).
The monthly water balance begins in October, when stored water volumes are at their lowest, and ends in September, coinciding with the onset of the wet semester and the start of the hydrological year.
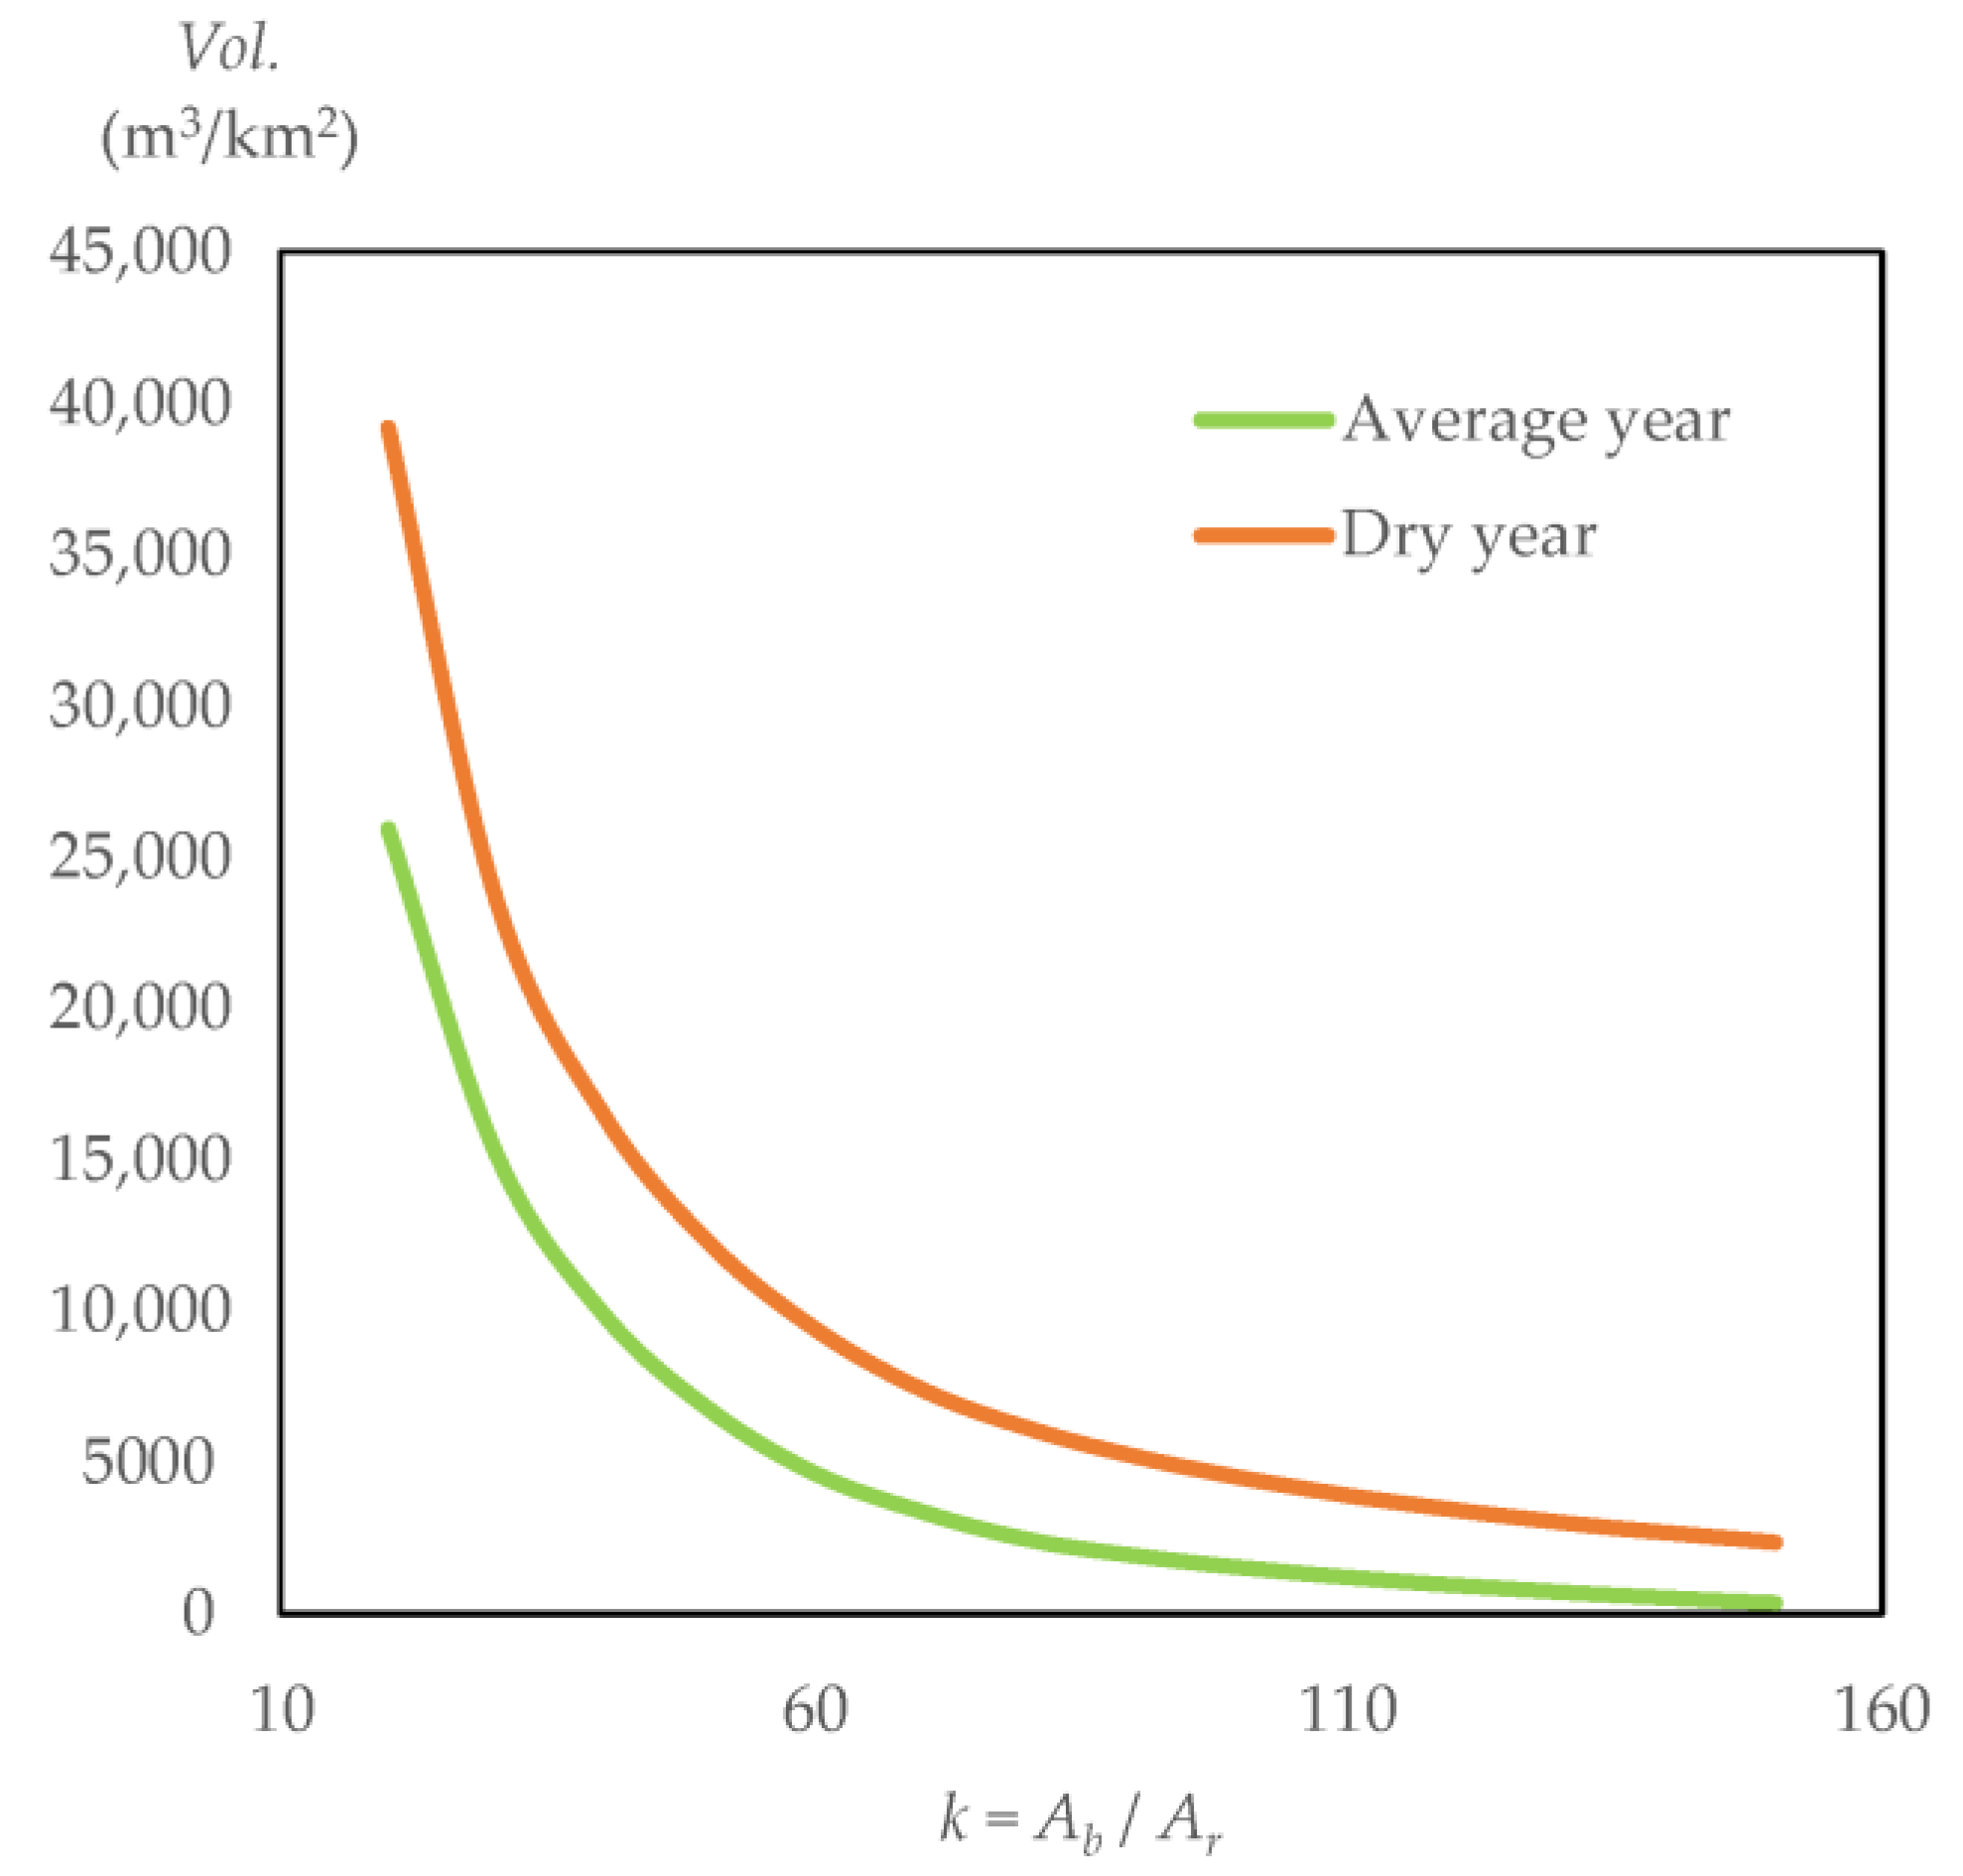
From Equation (9), it is therefore possible to plot curves of the minimum usable reservoir volume per square kilometre of upstream catchment area, for the average year and dry year, as shown in
Figure 4, as a function of
k, with
Kc = 1.
2.3.6. Reservoir Location Criteria
The selection of suitable sites for agricultural water reservoirs was supported by the automated computation of the water balance in a GIS environment for multiple points distributed along the watercourses, without identified buffer constraints. For each point, both the upstream catchment area contributing to surface runoff and the downstream irrigated area to be supplied were delineated.
Using Equations (6)–(9) and
Figure 4, the minimum adequate storage volume of each potential reservoir was determined in GIS, corresponding to the minimum capacity required to allow complete filling and to meet irrigation demands during the summer months when the monthly hydrological balance becomes negative.
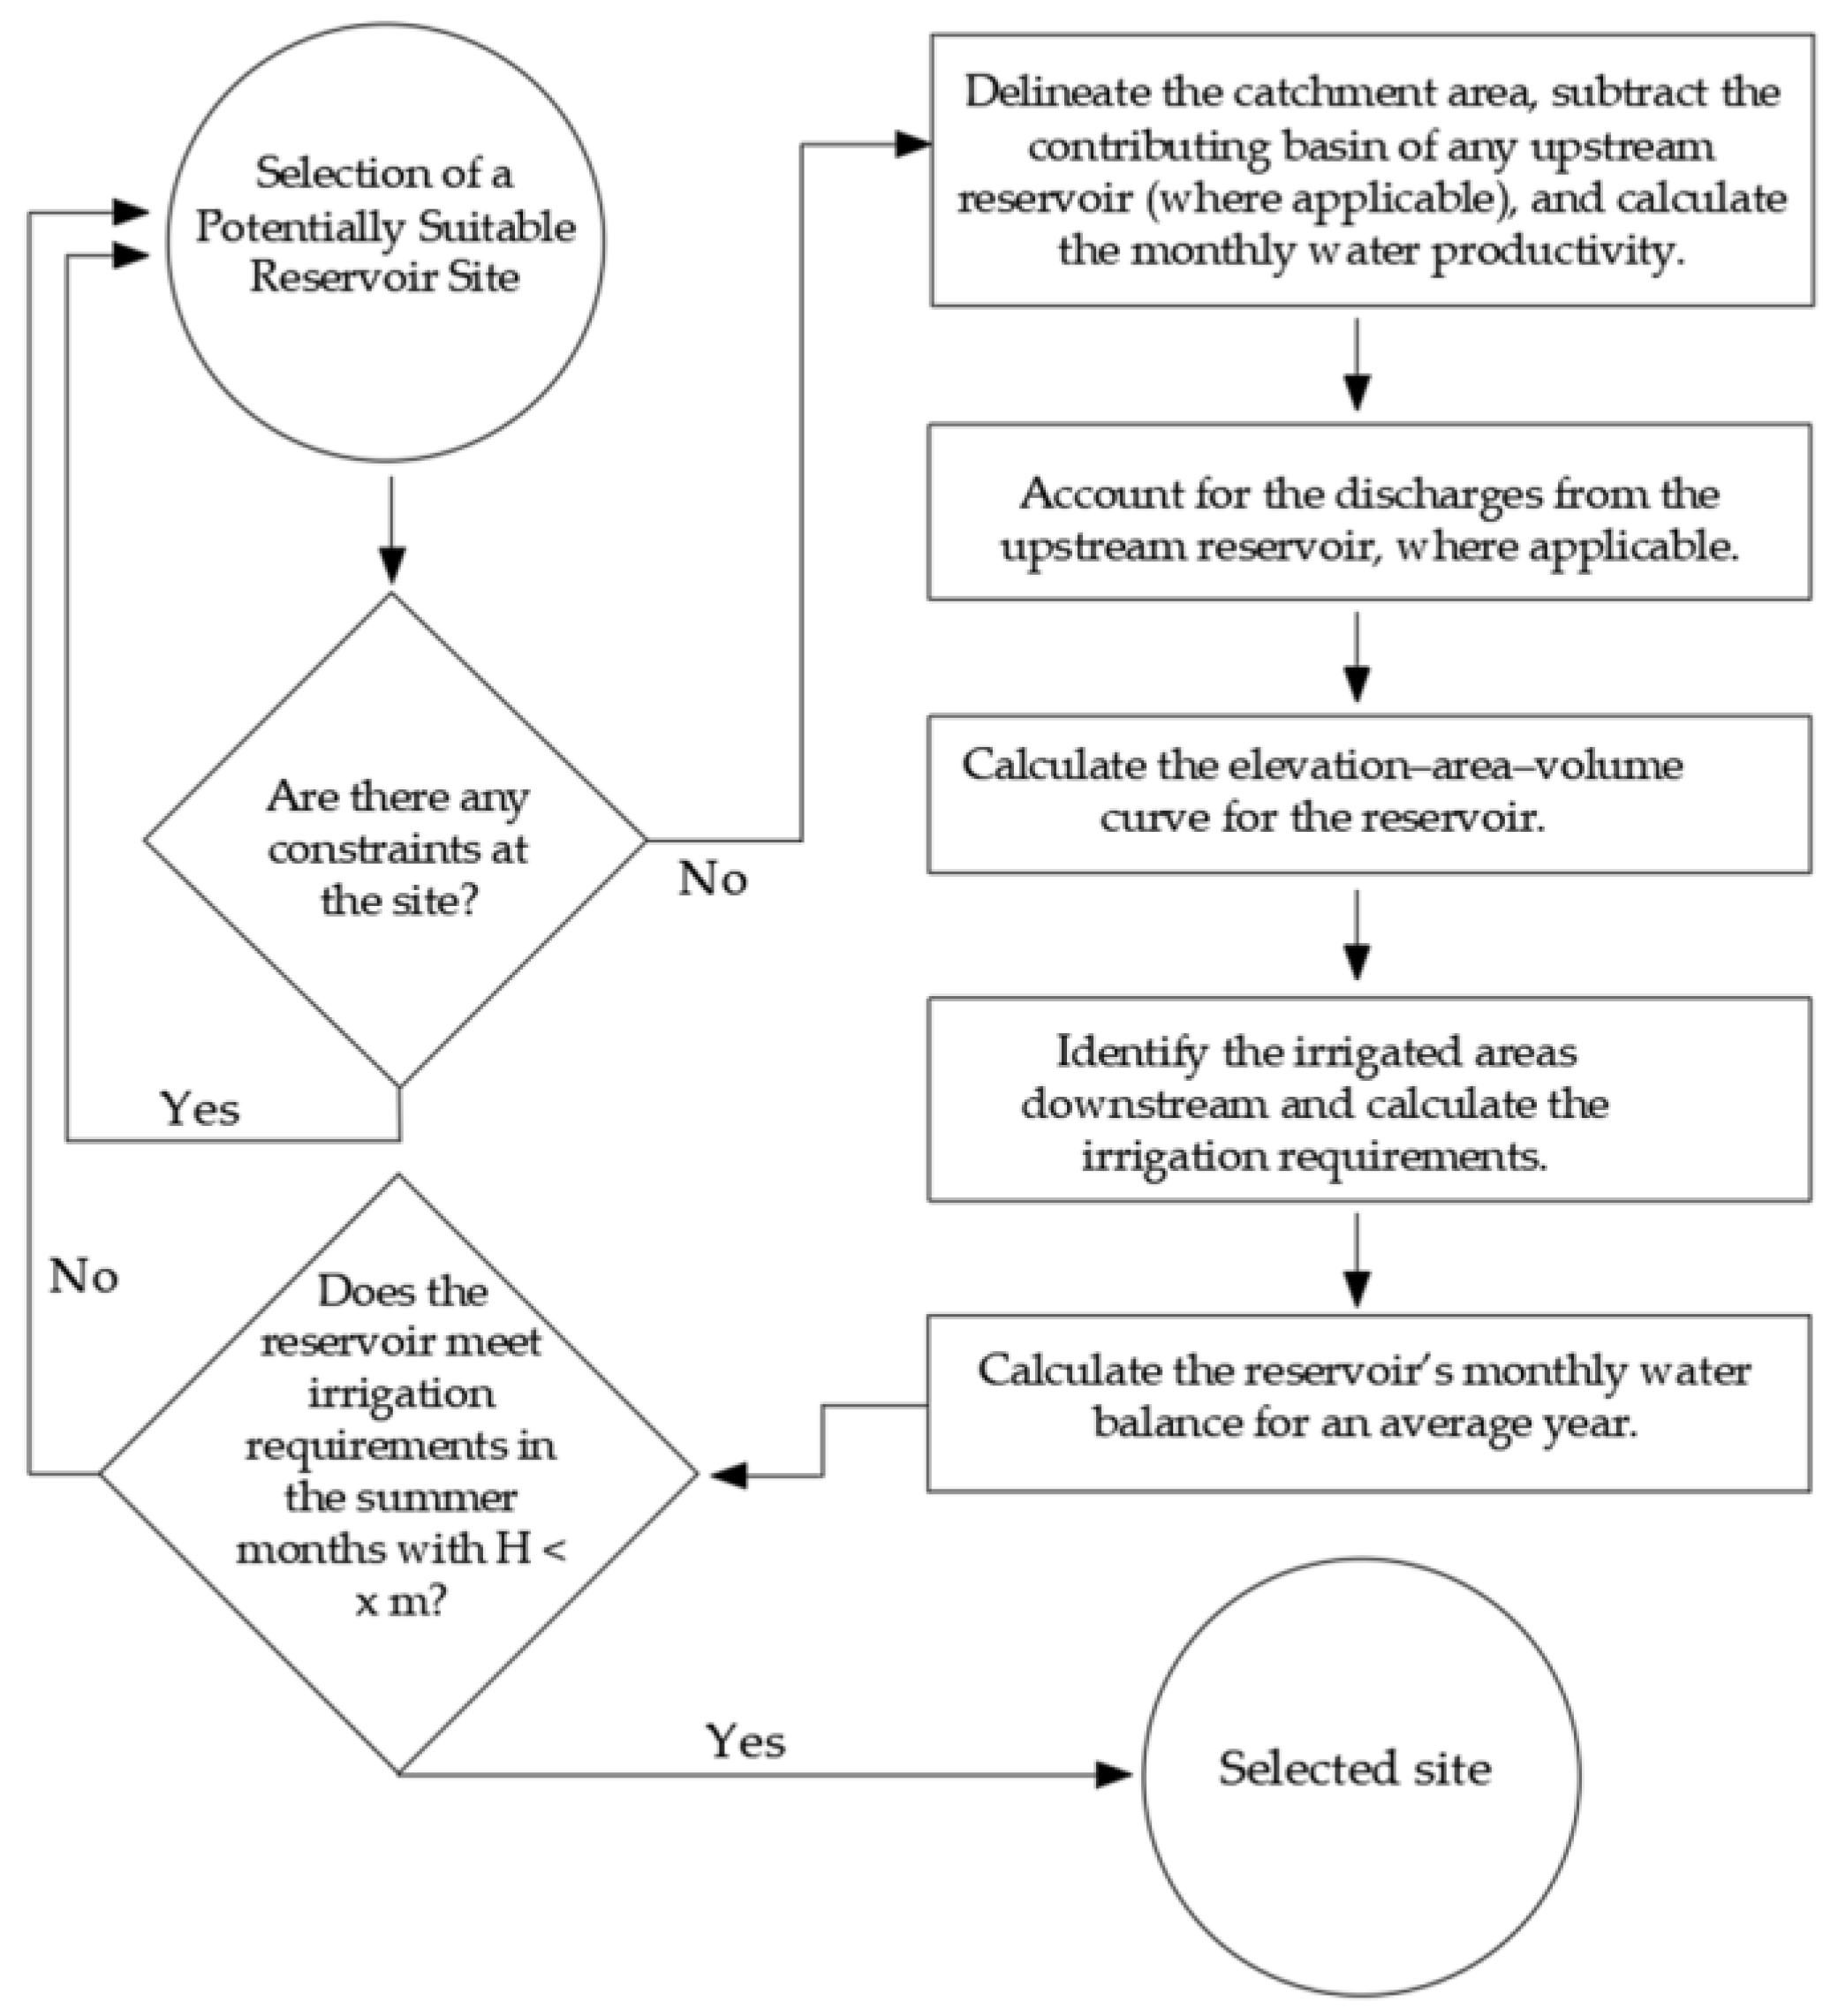
Among the stream segments presenting a positive hydrological balance, preference was given to locations situated closest and upstream to the agricultural polygons to be supplied, prioritising sites in natural recesses with steep slopes where the upstream section widens. These locations enable the formation of a sufficiently large water body for storage while minimising the embankment height. Field visits were subsequently conducted at the sites selected through this methodology to validate the locations that meet the proposed criteria (
Figure 5).
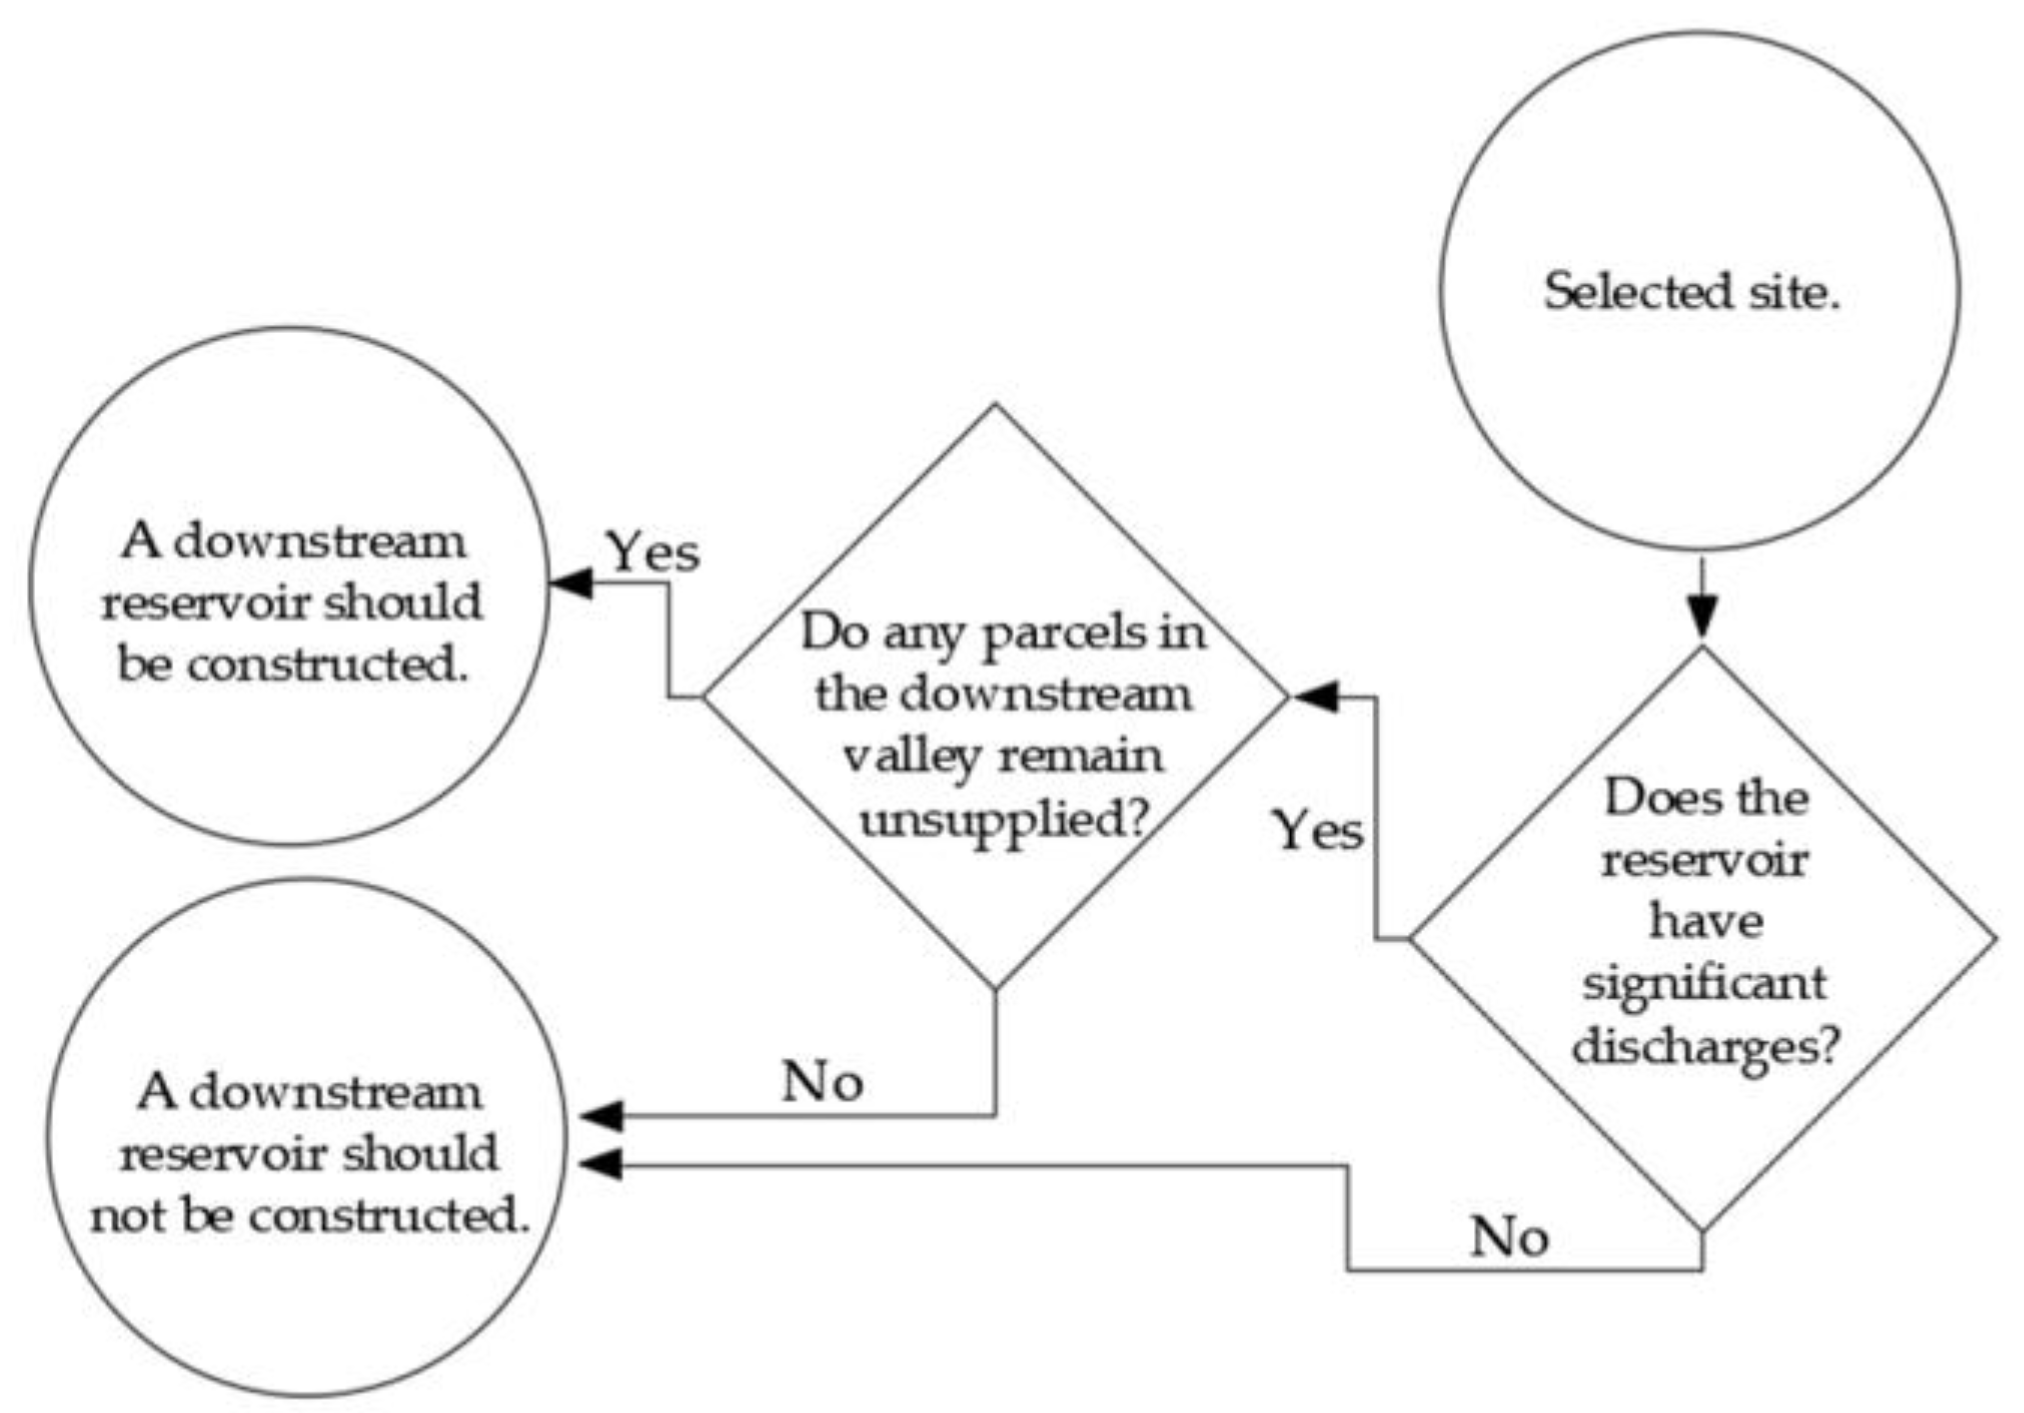
Once an initial site has been selected, it may be appropriate to construct a second reservoir on the same watercourse downstream of the first to accommodate the discharges from the upstream reservoir and supply additional agricultural parcels. The decision criterion is shown in
Figure 6.
To ensure the environmental and regulatory feasibility of the proposed reservoir sites, a spatial verification of constraints was conducted, focusing on Natura 2000 areas and land use regulations defined by the Municipal Master Plan (Plano Diretor Municipal) [
26]. Official datasets from ICNF [
27] were used to identify the boundaries of Natura 2000 sites. The analysis procedure confirmed which sites fall within, at the boundary of, or outside the protected area, providing the basis for subsequent site evaluation and decision making.
3. Results
3.1. Identification of Irrigated Areas Based on NDVI
The mean NDVI across the four months was calculated for the municipality’s agricultural zones and shown in
Figure 7. The lowest values (<0.1) are the most frequent and presumably correspond to rainfed parcels. Conversely, the highest values (>0.4) are less common and represent areas of healthy, vigorous vegetation that may or may not be irrigated. Healthy trees and shrubs, even under rainfed conditions, strongly absorb red light and reflect strongly in the near-infrared region.
3.2. Map of Irrigated and Rainfed Areas
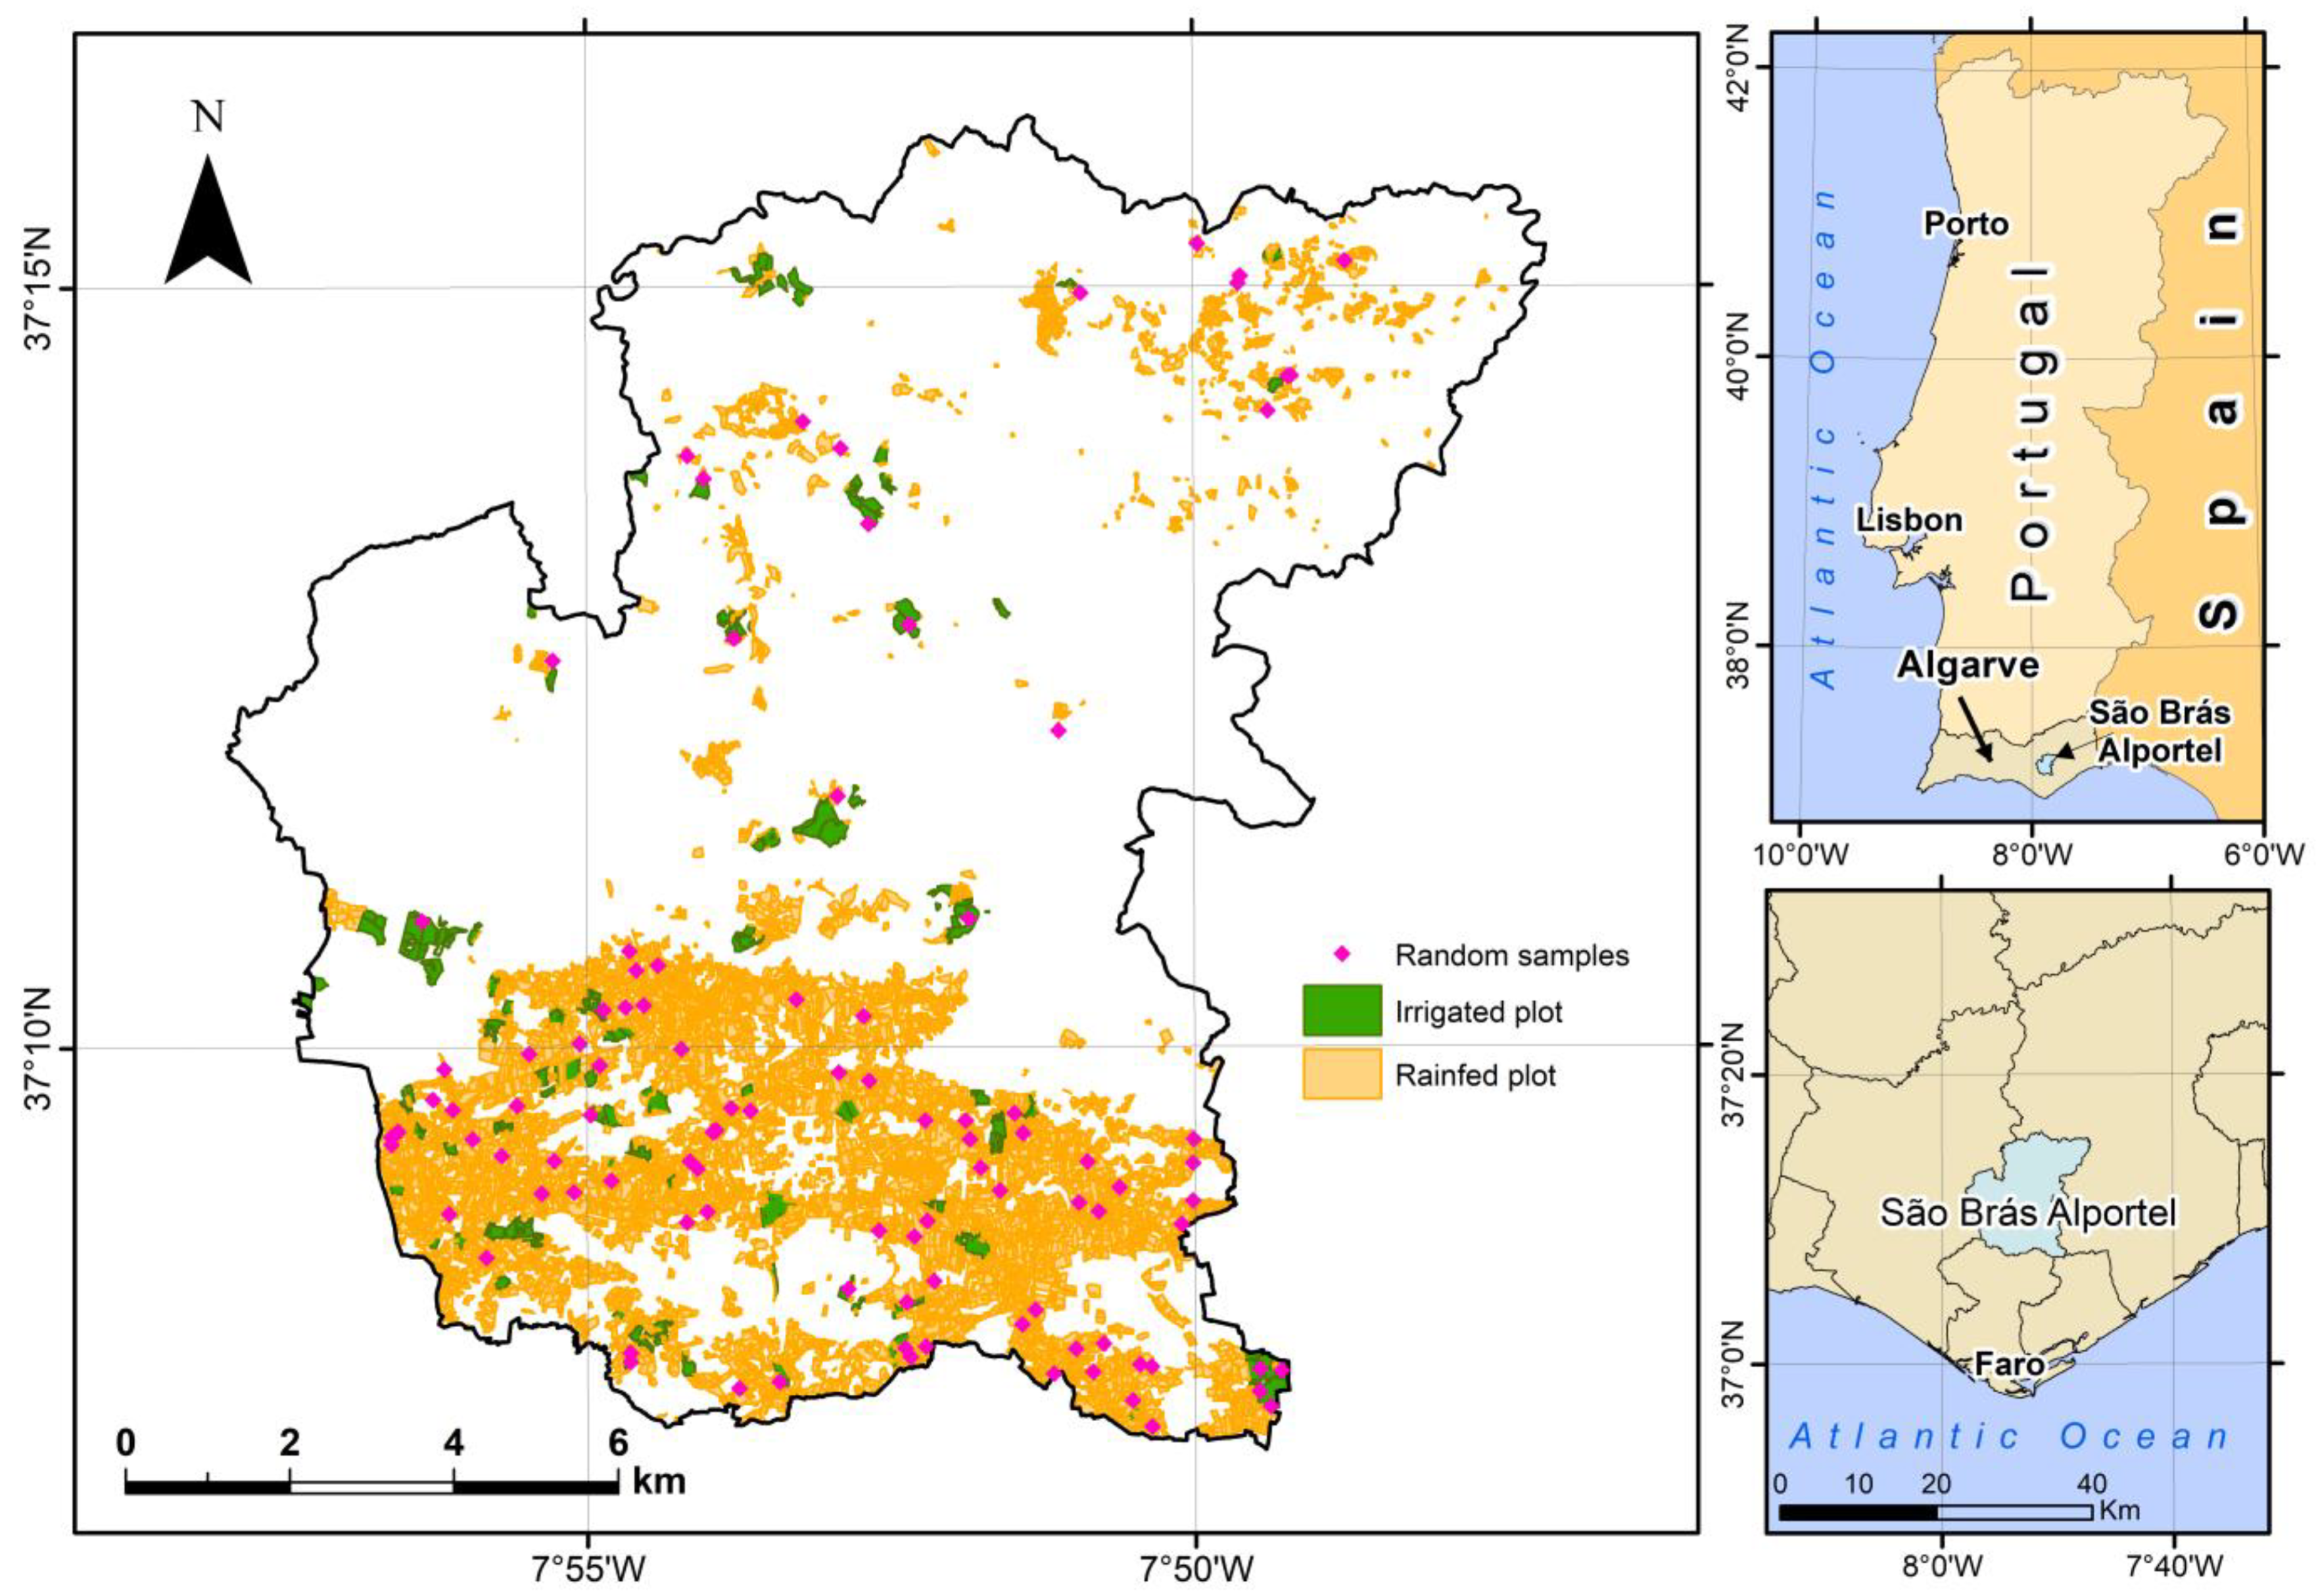
Figure 8 delineates the irrigated and rainfed areas, considering parcels as irrigated if they contained at least 0.5 ha of pixels with NDVI values in the range of 0.40–0.71. The total irrigated area identified using this criterion was 3 km
2, almost twice the area reported in official agricultural mapping, representing approximately 10% of the municipality’s agricultural land.
The same map also plots the 100 randomly selected validation points to create the confusion matrix.
The confusion matrix employed to validate the delineation of irrigated and rainfed areas, shown in
Figure 8, is presented in
Table 7.
As shown in
Table 7, omission and commission errors were calculated for each class, corresponding to points that were not correctly identified and to false positives in the classification, respectively. For the irrigated class, the omission error was 0.0%, while the commission error reached 20.0%. Conversely, the omission error was 2.2% for the rainfed class, and the commission error was 0.0%. User’s accuracy was 80.0% for the irrigated class and 100% for the rainfed class, reflecting the reliability of the classification for each category. Producer’s accuracy reached 100% for irrigated areas and 97.8% for rainfed areas, indicating the method’s ability to identify each class correctly. Cohen’s Kappa index was 0.88, which, on the Landis and Koch scale, represents almost perfect agreement [
20]. Overall accuracy was 98%, with 98 of the 100 sampled points correctly classified, demonstrating the robustness of the agricultural area detection method.
The commission errors observed in the irrigated class are primarily associated with the presence of perennial rainfed crops and natural vegetation, which maintain relatively high photosynthetic activity during summer, resulting in NDVI values similar to those of irrigated areas. In São Brás de Alportel, these include olive groves (Olea europaea), almond trees (Prunus dulcis), fig trees (Ficus carica), and perennial shrub species such as Cistus spp., Pistacia lentiscus, Quercus coccifera, and Rosmarinus officinalis. Although these are rainfed systems, their structural and physiological adaptations to drought allow them to retain green biomass and relatively high vigour throughout the dry season, which explains the false positives and the resulting commission error observed for the irrigated class.
3.3. Creation of the Drainage Network from Digital Elevation Models
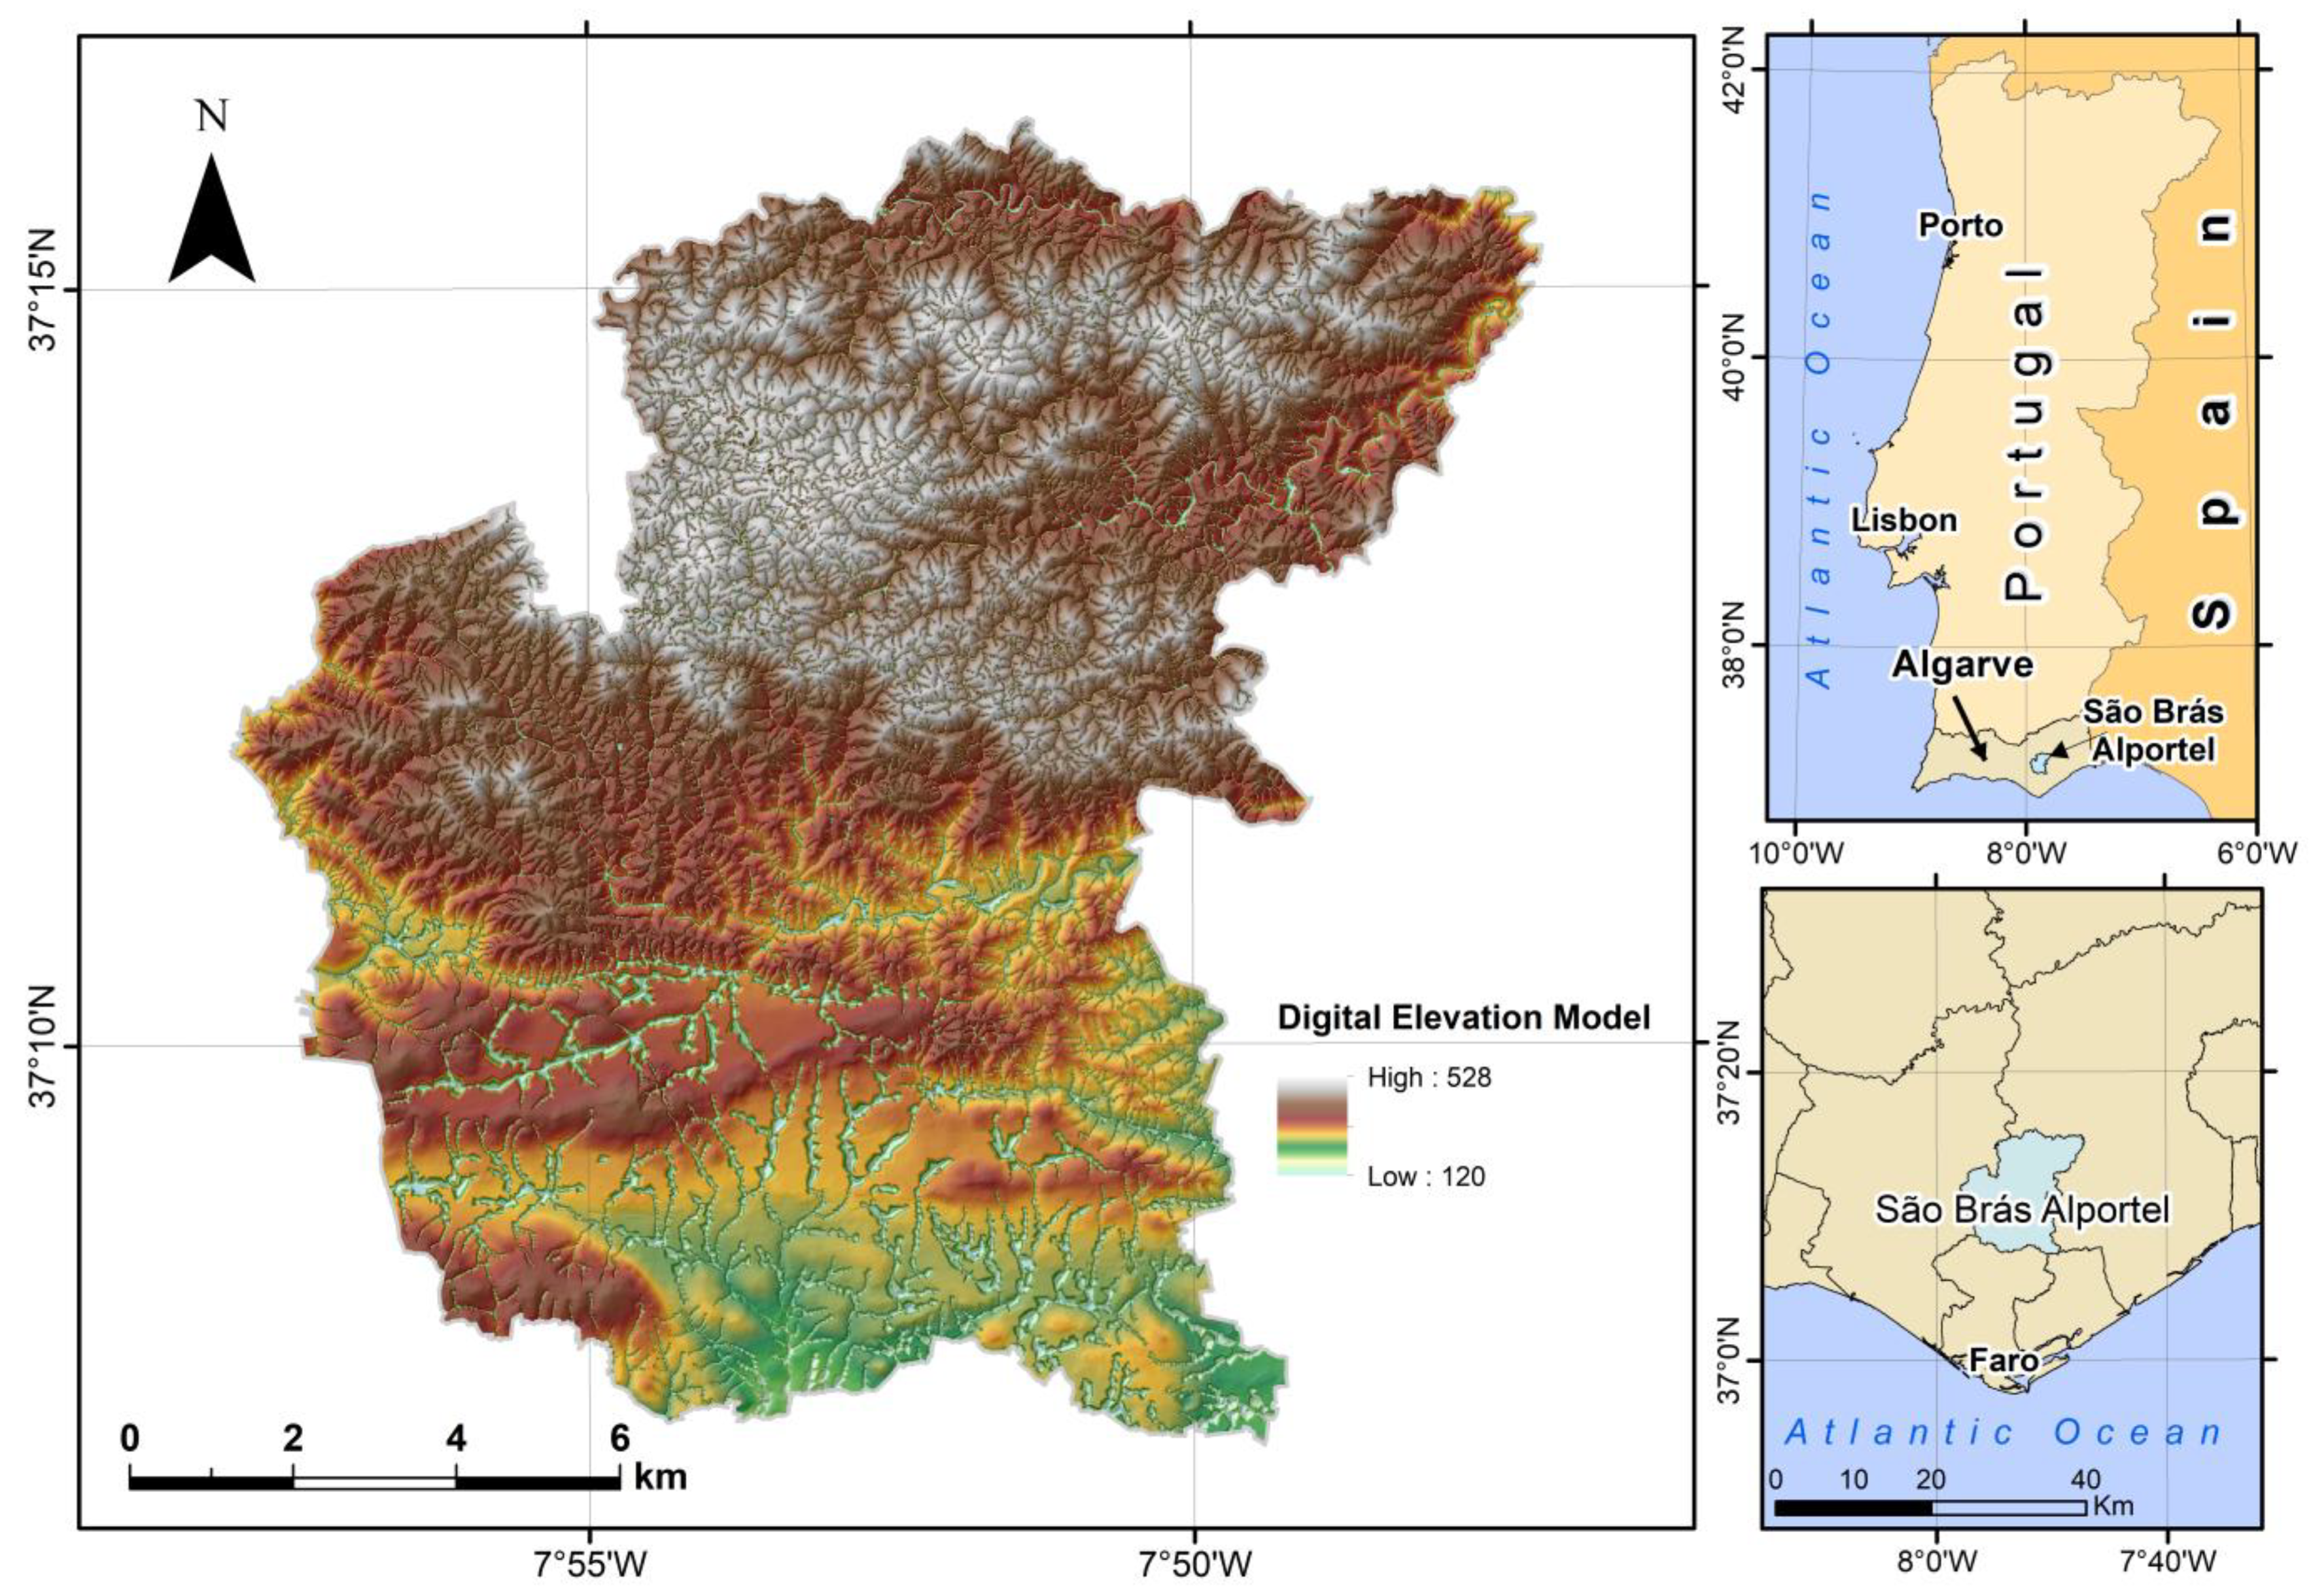
The resulting DEM, after sink correction, is shown in
Figure 9. In the northern part of the study area, corresponding to the Serra do Caldeirão, elevations exceed 400 m, reaching a maximum of 528 m. By contrast, the southern sector is generally flatter, with broader valleys and elevations ranging from 120 to 350 m, making it more conducive to agricultural activity.
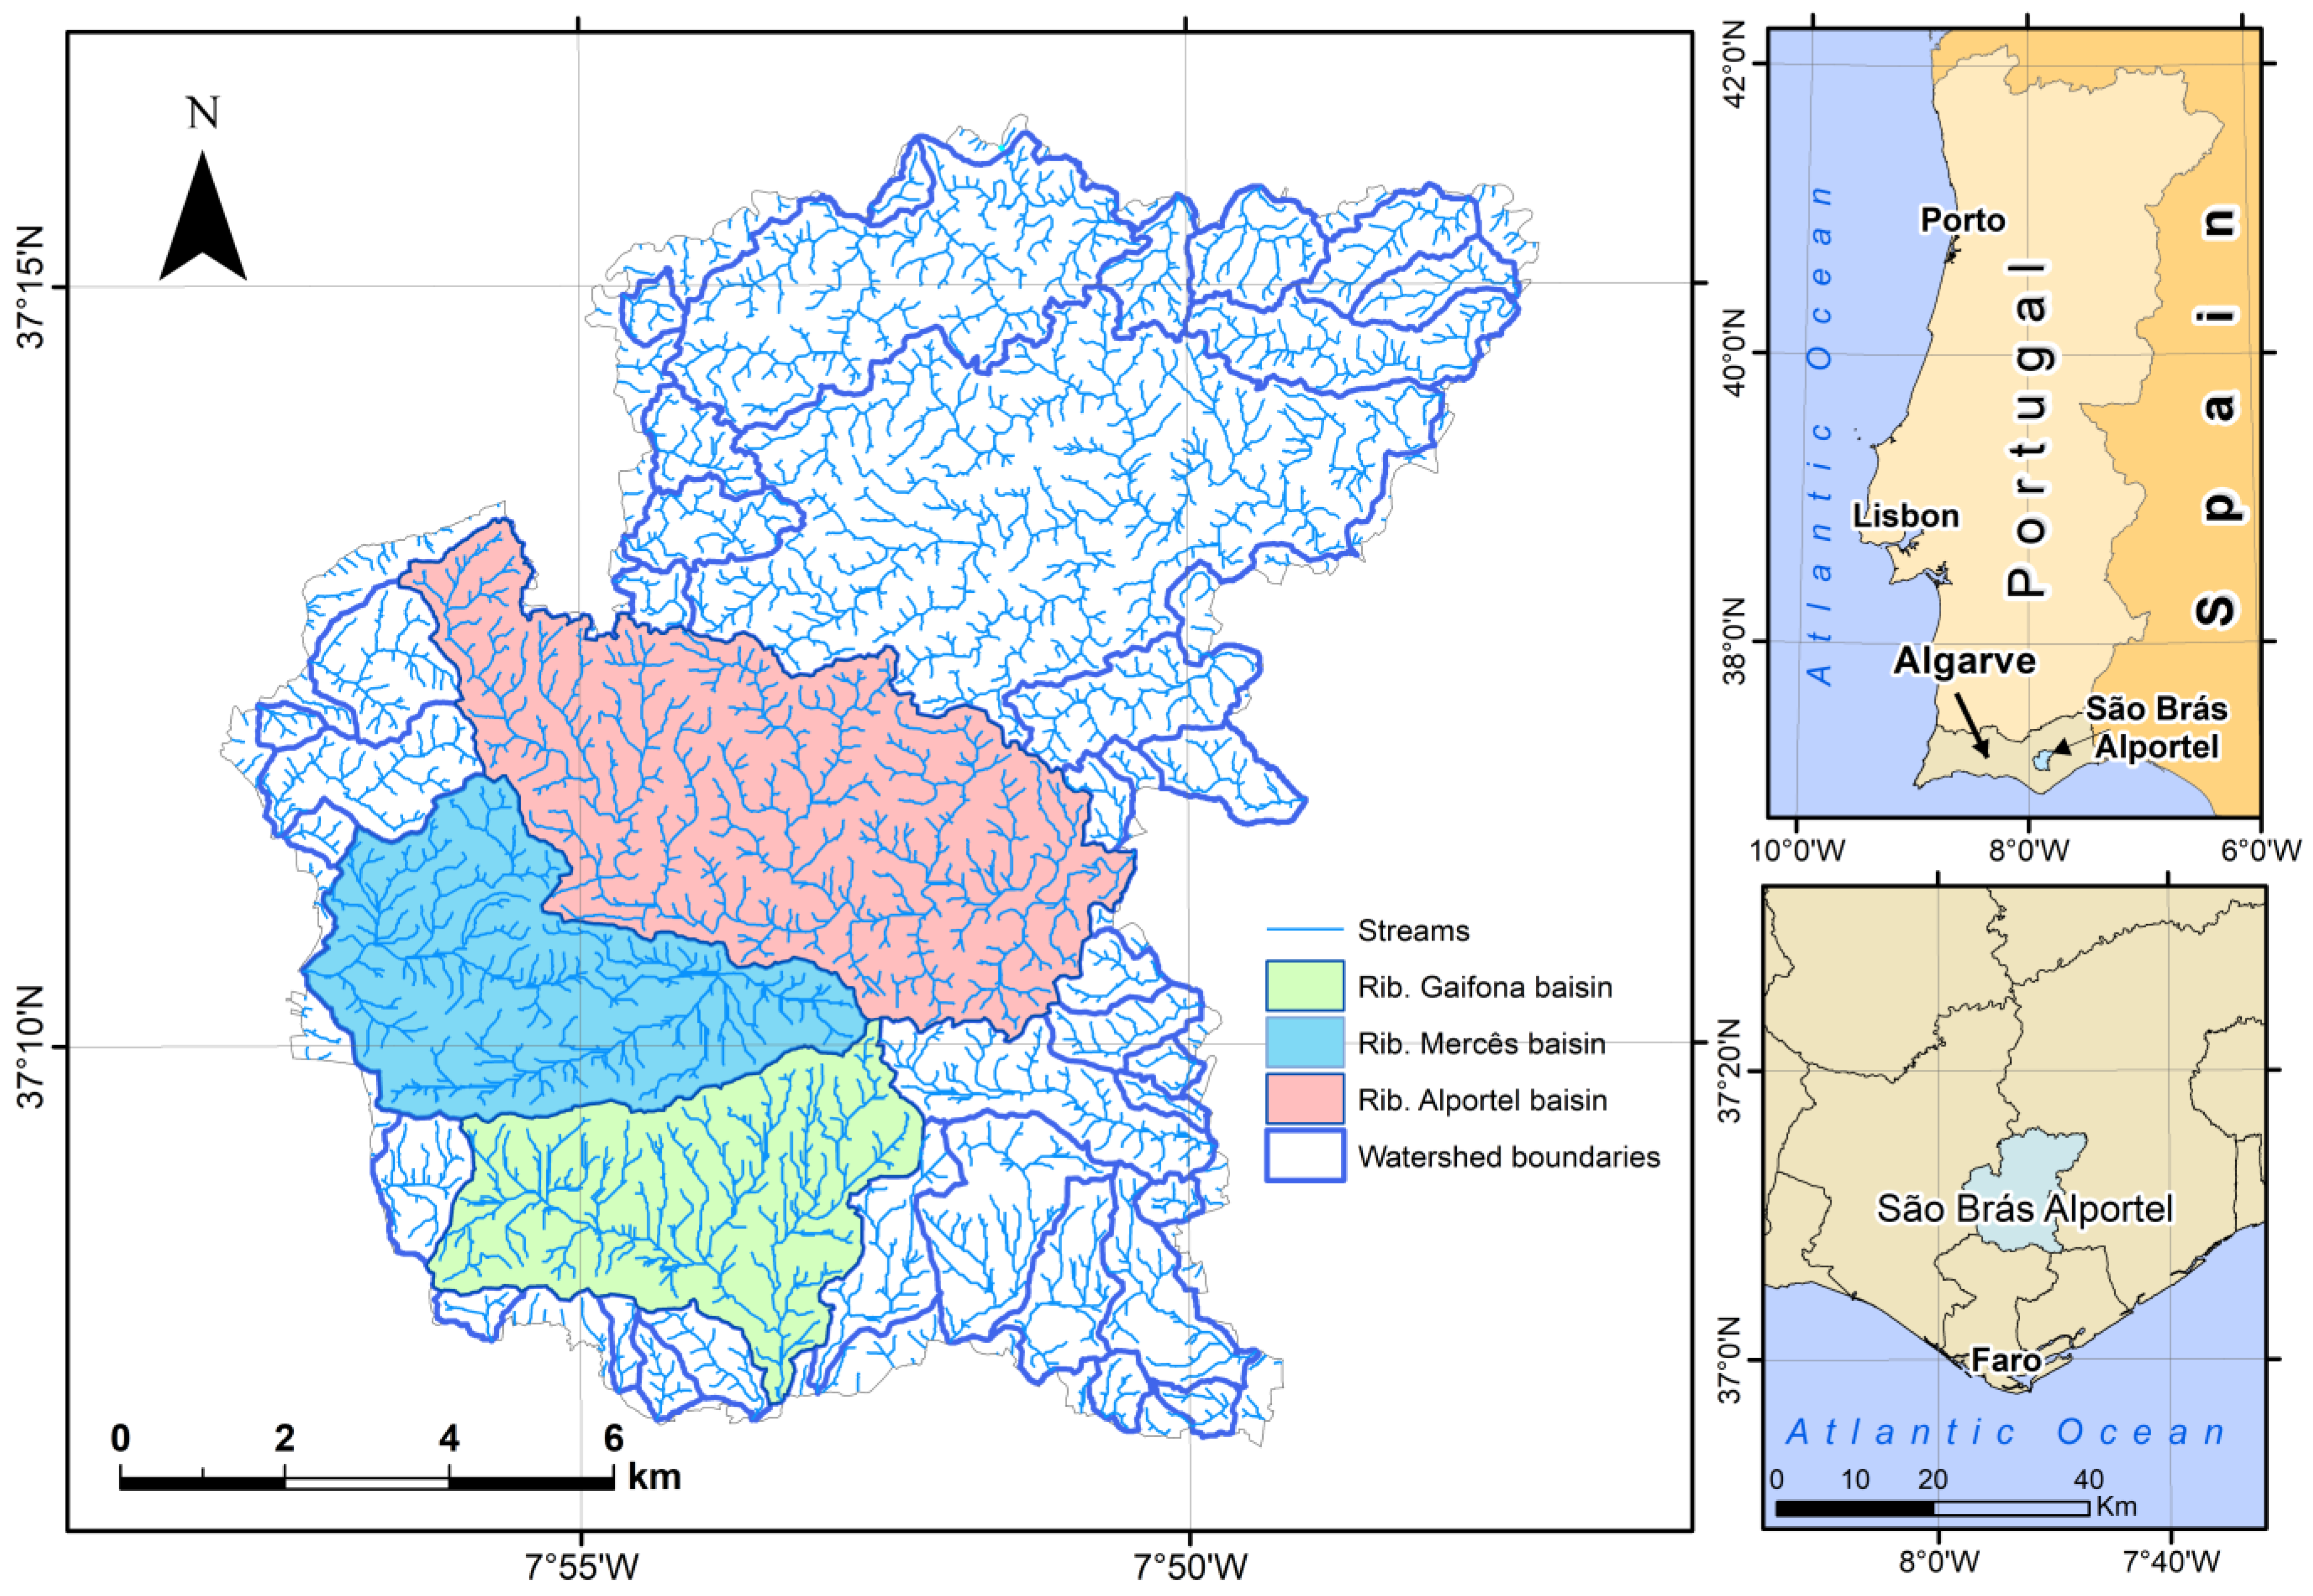
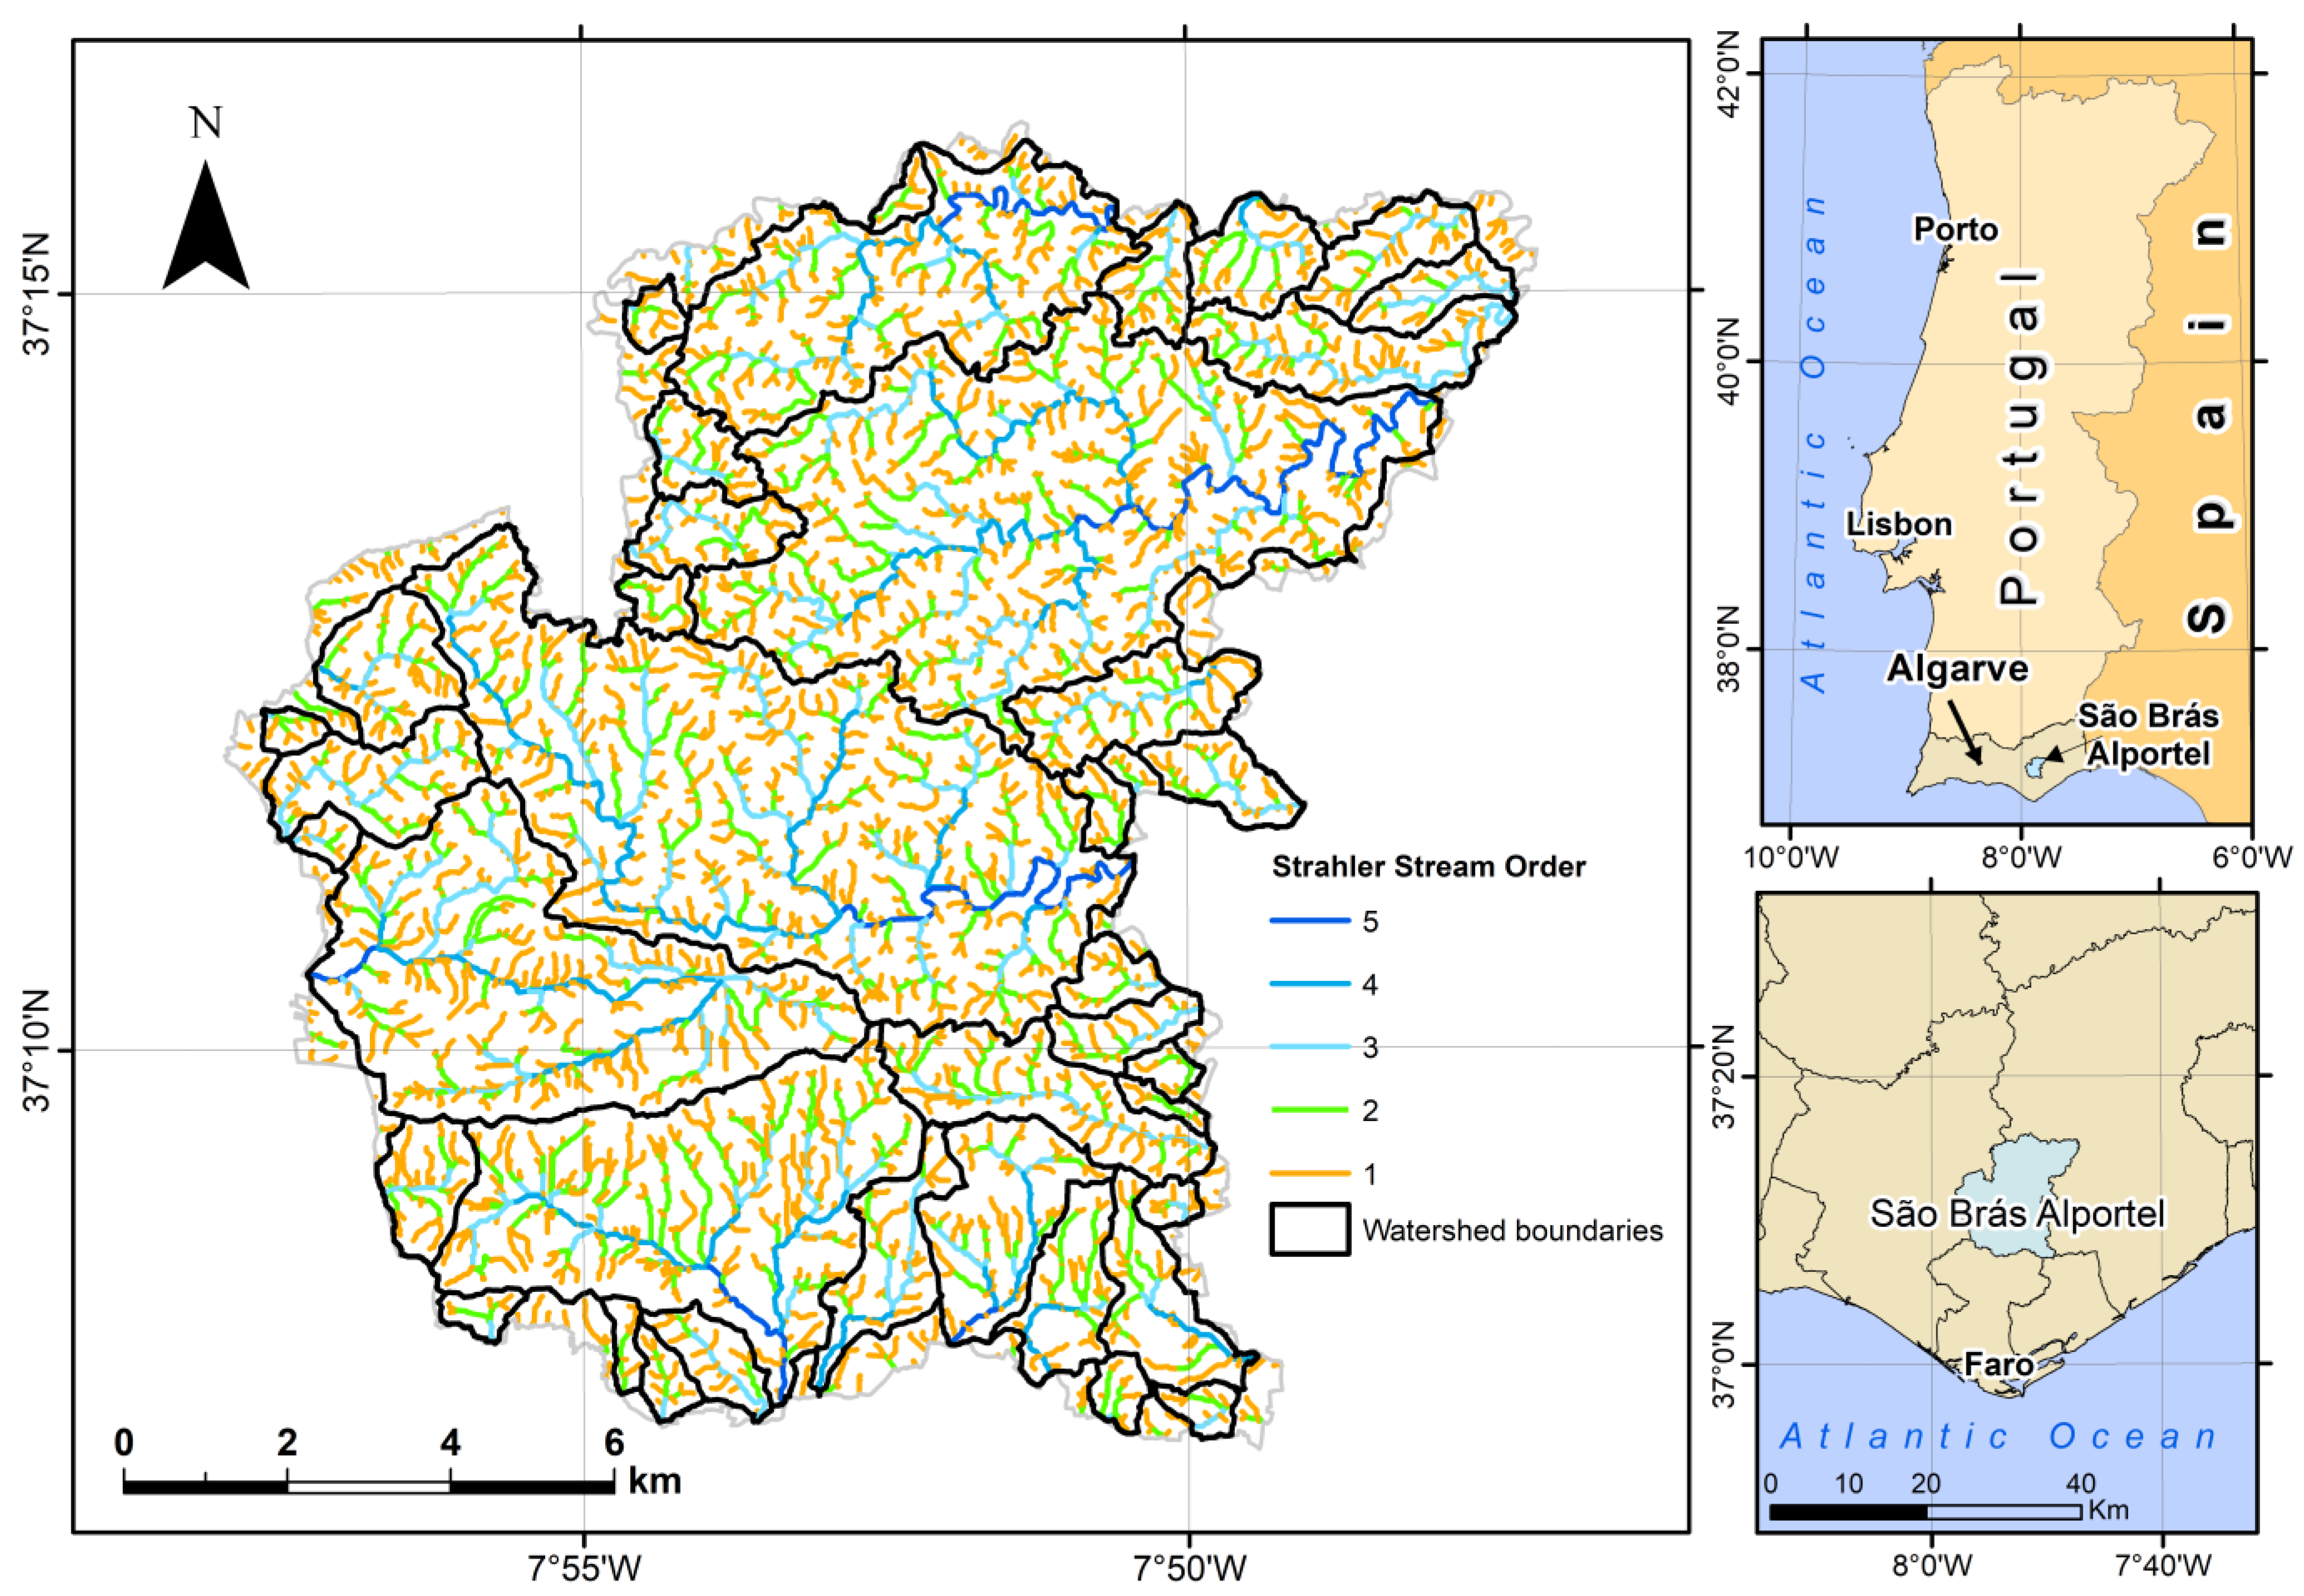
Figure 10 illustrates the drainage network derived from flow-accumulation values exceeding 160 cells, with a total length of approximately 758 km. The associated micro-catchments are also indicated. In all, 38 micro-catchments were identified: in the upland zone, the Ribeira de Alportel and Ribeira das Mercês predominate, while in the Barrocal, the Ribeira de Gaifona is the principal stream.
Figure 11 shows the watercourses classified according to the Strahler method, in which order 1 represents the least significant streams and order 5 the most significant.
Figure 12 displays the geometric network with downstream flow directions. This network represents the spatial and functional structure of the drainage system, enabling the identification of preferential surface runoff paths and facilitating the selection of the most suitable locations for reservoir construction.
3.4. Selection of Sites for Reservoir Construction
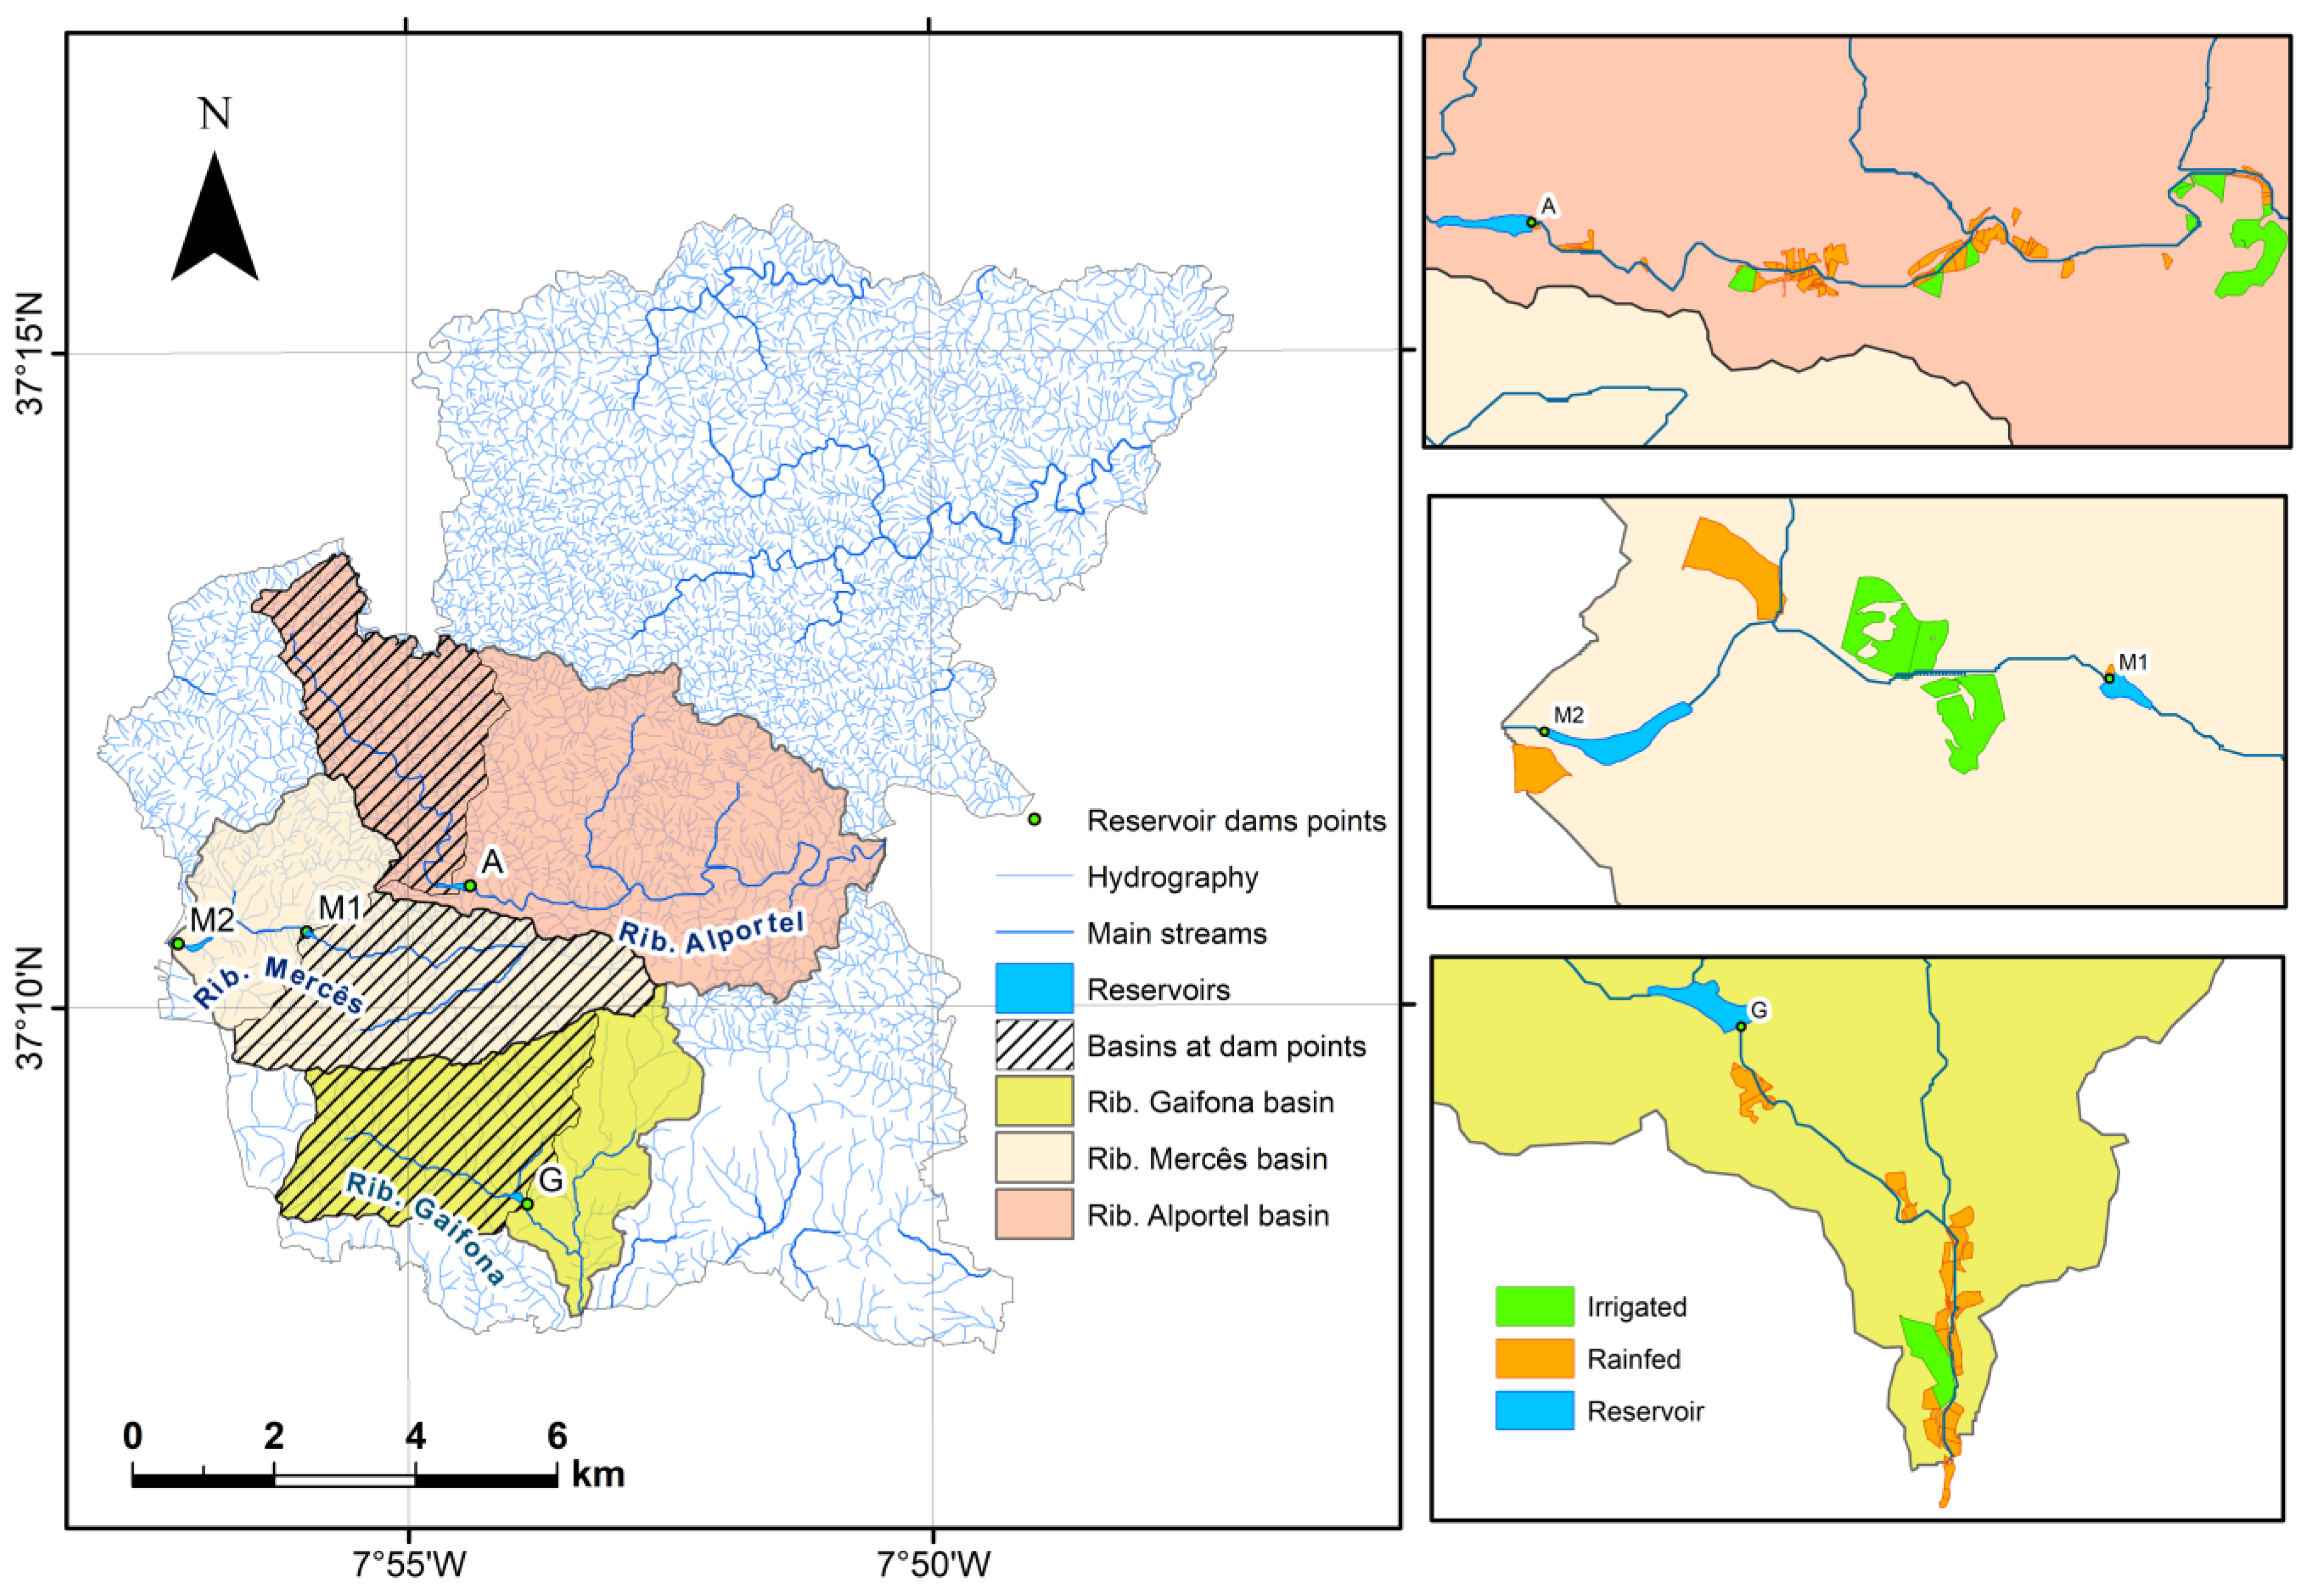
Three strategic sites were selected, i.e., one on the Ribeira da Gaifona in the Barrocal zone, and two on the Ribeira das Mercês and the Ribeira de Alportel in the Serra.
A Barrocal location was chosen because most agricultural activity in the municipality is concentrated there; moreover, the municipal authority has undertaken to provide an impermeable reservoir floor at that site. The Serra sites were selected because their catchments are larger and lie closer to the Barrocal, where the municipality’s main agricultural area is situated.
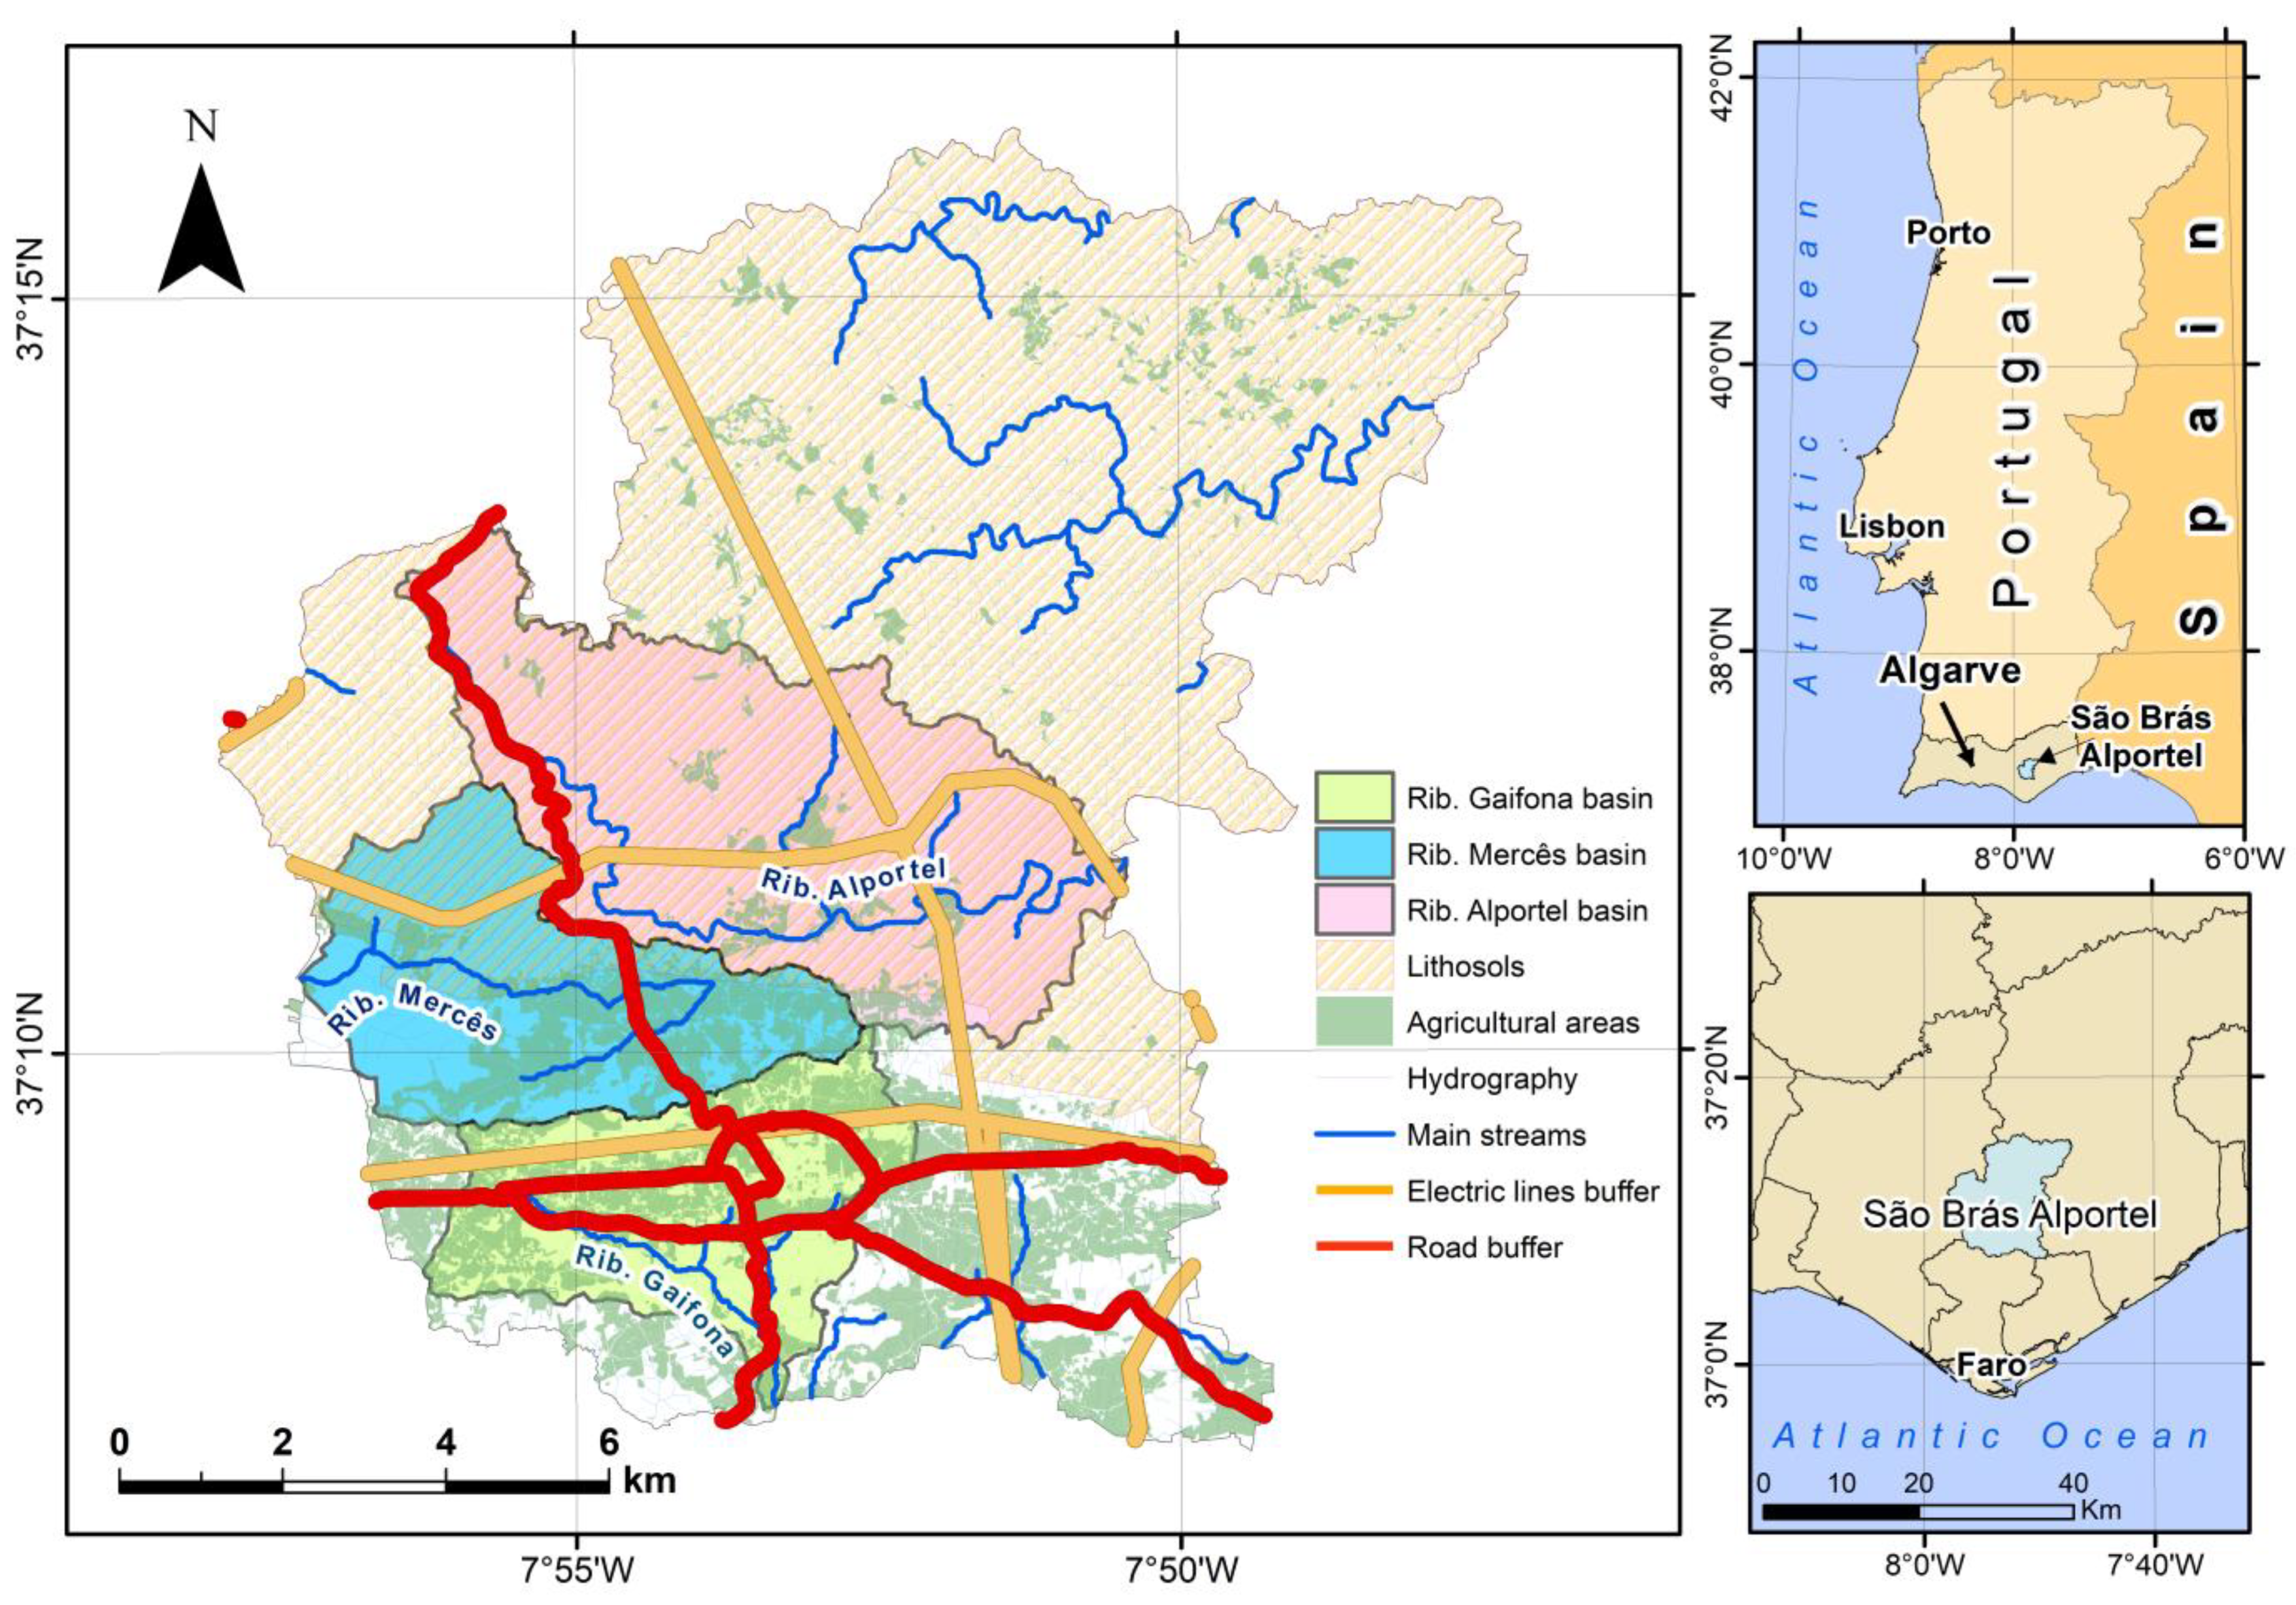
Specific dam sites were then pinpointed along each watercourse. The map of points that satisfy the reservoir-siting criteria is shown in
Figure 13. Once the reservoir points had been fixed, the upstream catchments were delineated. The raster data were converted to vector format, and the drainage-basin area at each site was calculated. The outcome is depicted in the reservoir-catchment map in
Figure 13.
The subsequent stage involved the systematic computation of the water balance in the GIS environment for multiple points along the watercourse.
For each point, both the upstream catchment area contributing to surface runoff and the downstream irrigated area to be supplied were determined.
Based on Equations (6) and (9) and
Figure 6 presented in the methodological section, the minimum adequate storage volume of each reservoir was calculated, corresponding to the minimum volume required to ensure reservoir filling and to meet irrigation demands during the summer months, when the monthly water balance becomes negative.
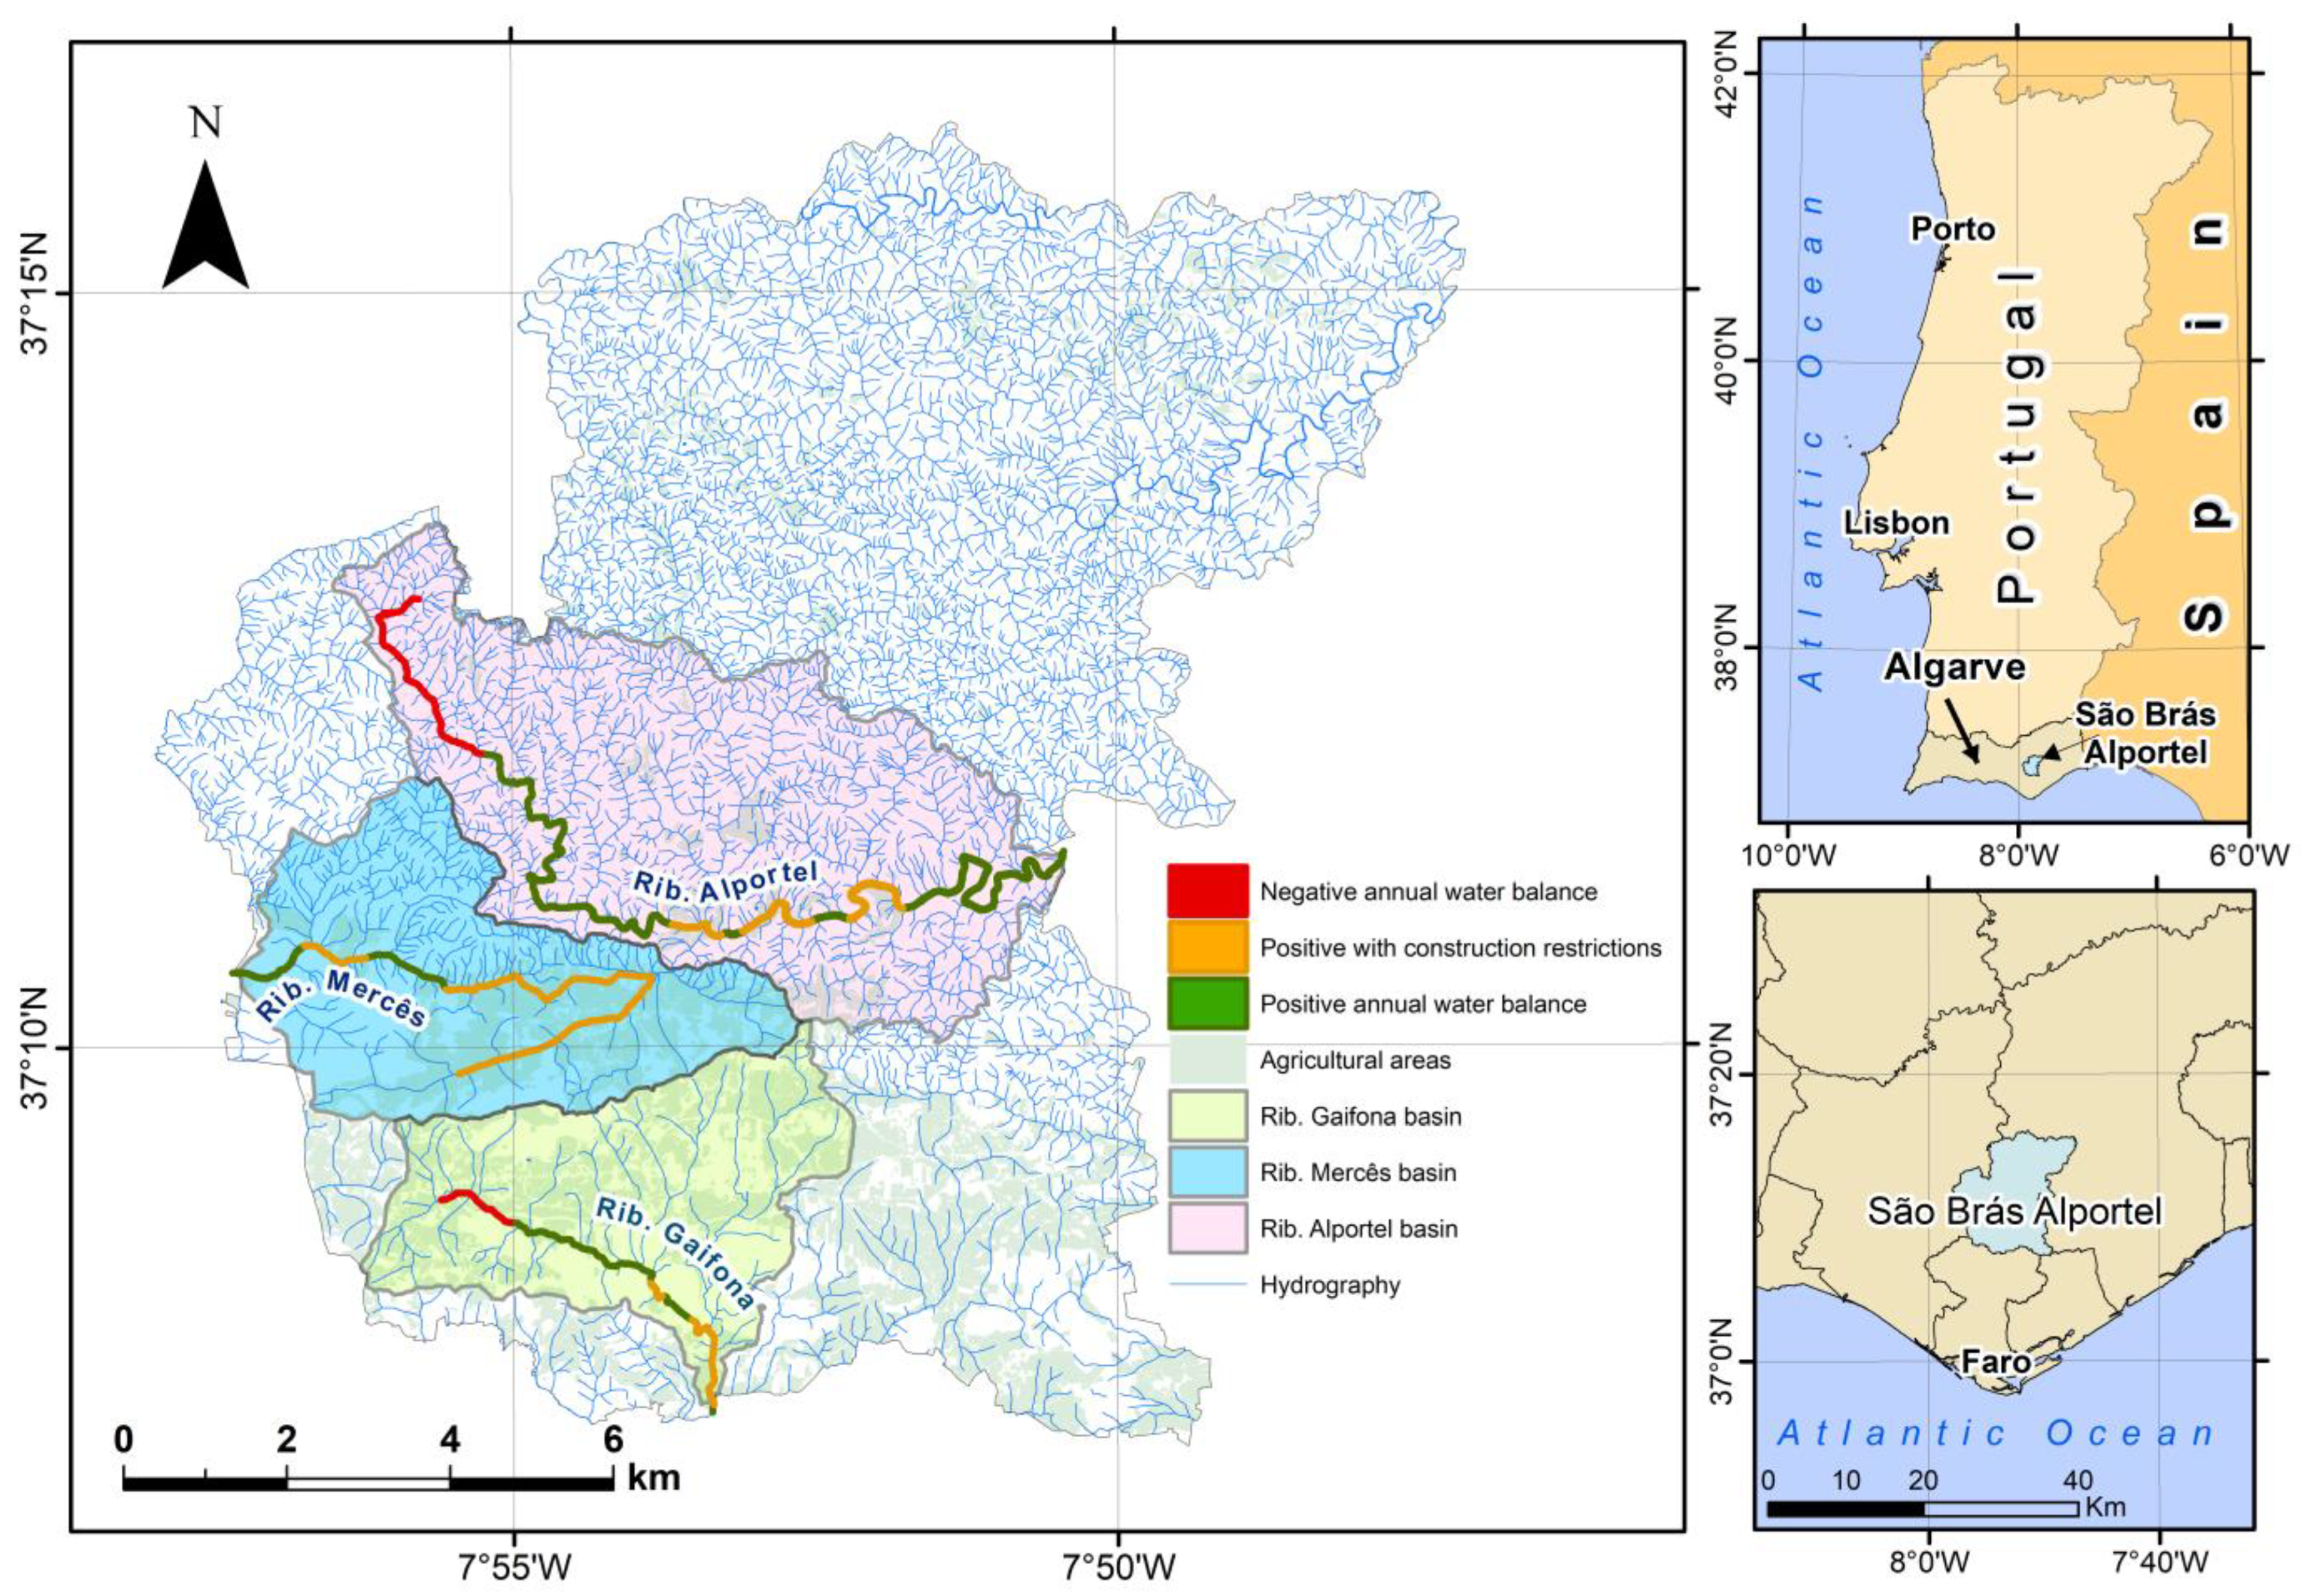
The systematic application of this procedure to the three streams under study resulted in the map shown in
Figure 14.
The red segments represent areas where the annual water balance is negative, meaning that the hydrological productivity of the upstream catchment is insufficient to meet the irrigation water demand of the downstream agricultural areas.
Conversely, the green segments identify locations where the annual water balance is positive, suggesting that it is possible to retain all or part of the runoff generated during the wetter months and to meet irrigation requirements throughout the dry season. Similarly, the orange zones denote areas of positive water balance; however, these areas are subject to construction restrictions.
The proposed reservoir sites on the Ribeira de Alportel and Ribeira das Mercês (corresponding to the green segments) are located in areas that overlap and partially coincide with the boundaries of two different Natura 2000 sites: Caldeirão (PTCON0057) and Barrocal (PTCON0049), respectively. Consequently, a detailed Appropriate Assessment will be required to ensure that no significant adverse effects occur on the protected habitats and species. Meanwhile, the proposed reservoir site on the Ribeira da Gaifona is located outside any Natura 2000 site or other legally protected area. However, part of the proposed site lies within a zone designated for natural protection and enhancement, according to information obtained from the São Brás de Alportel Municipal Master Plan (PDM), which should be duly considered in the environmental assessment.
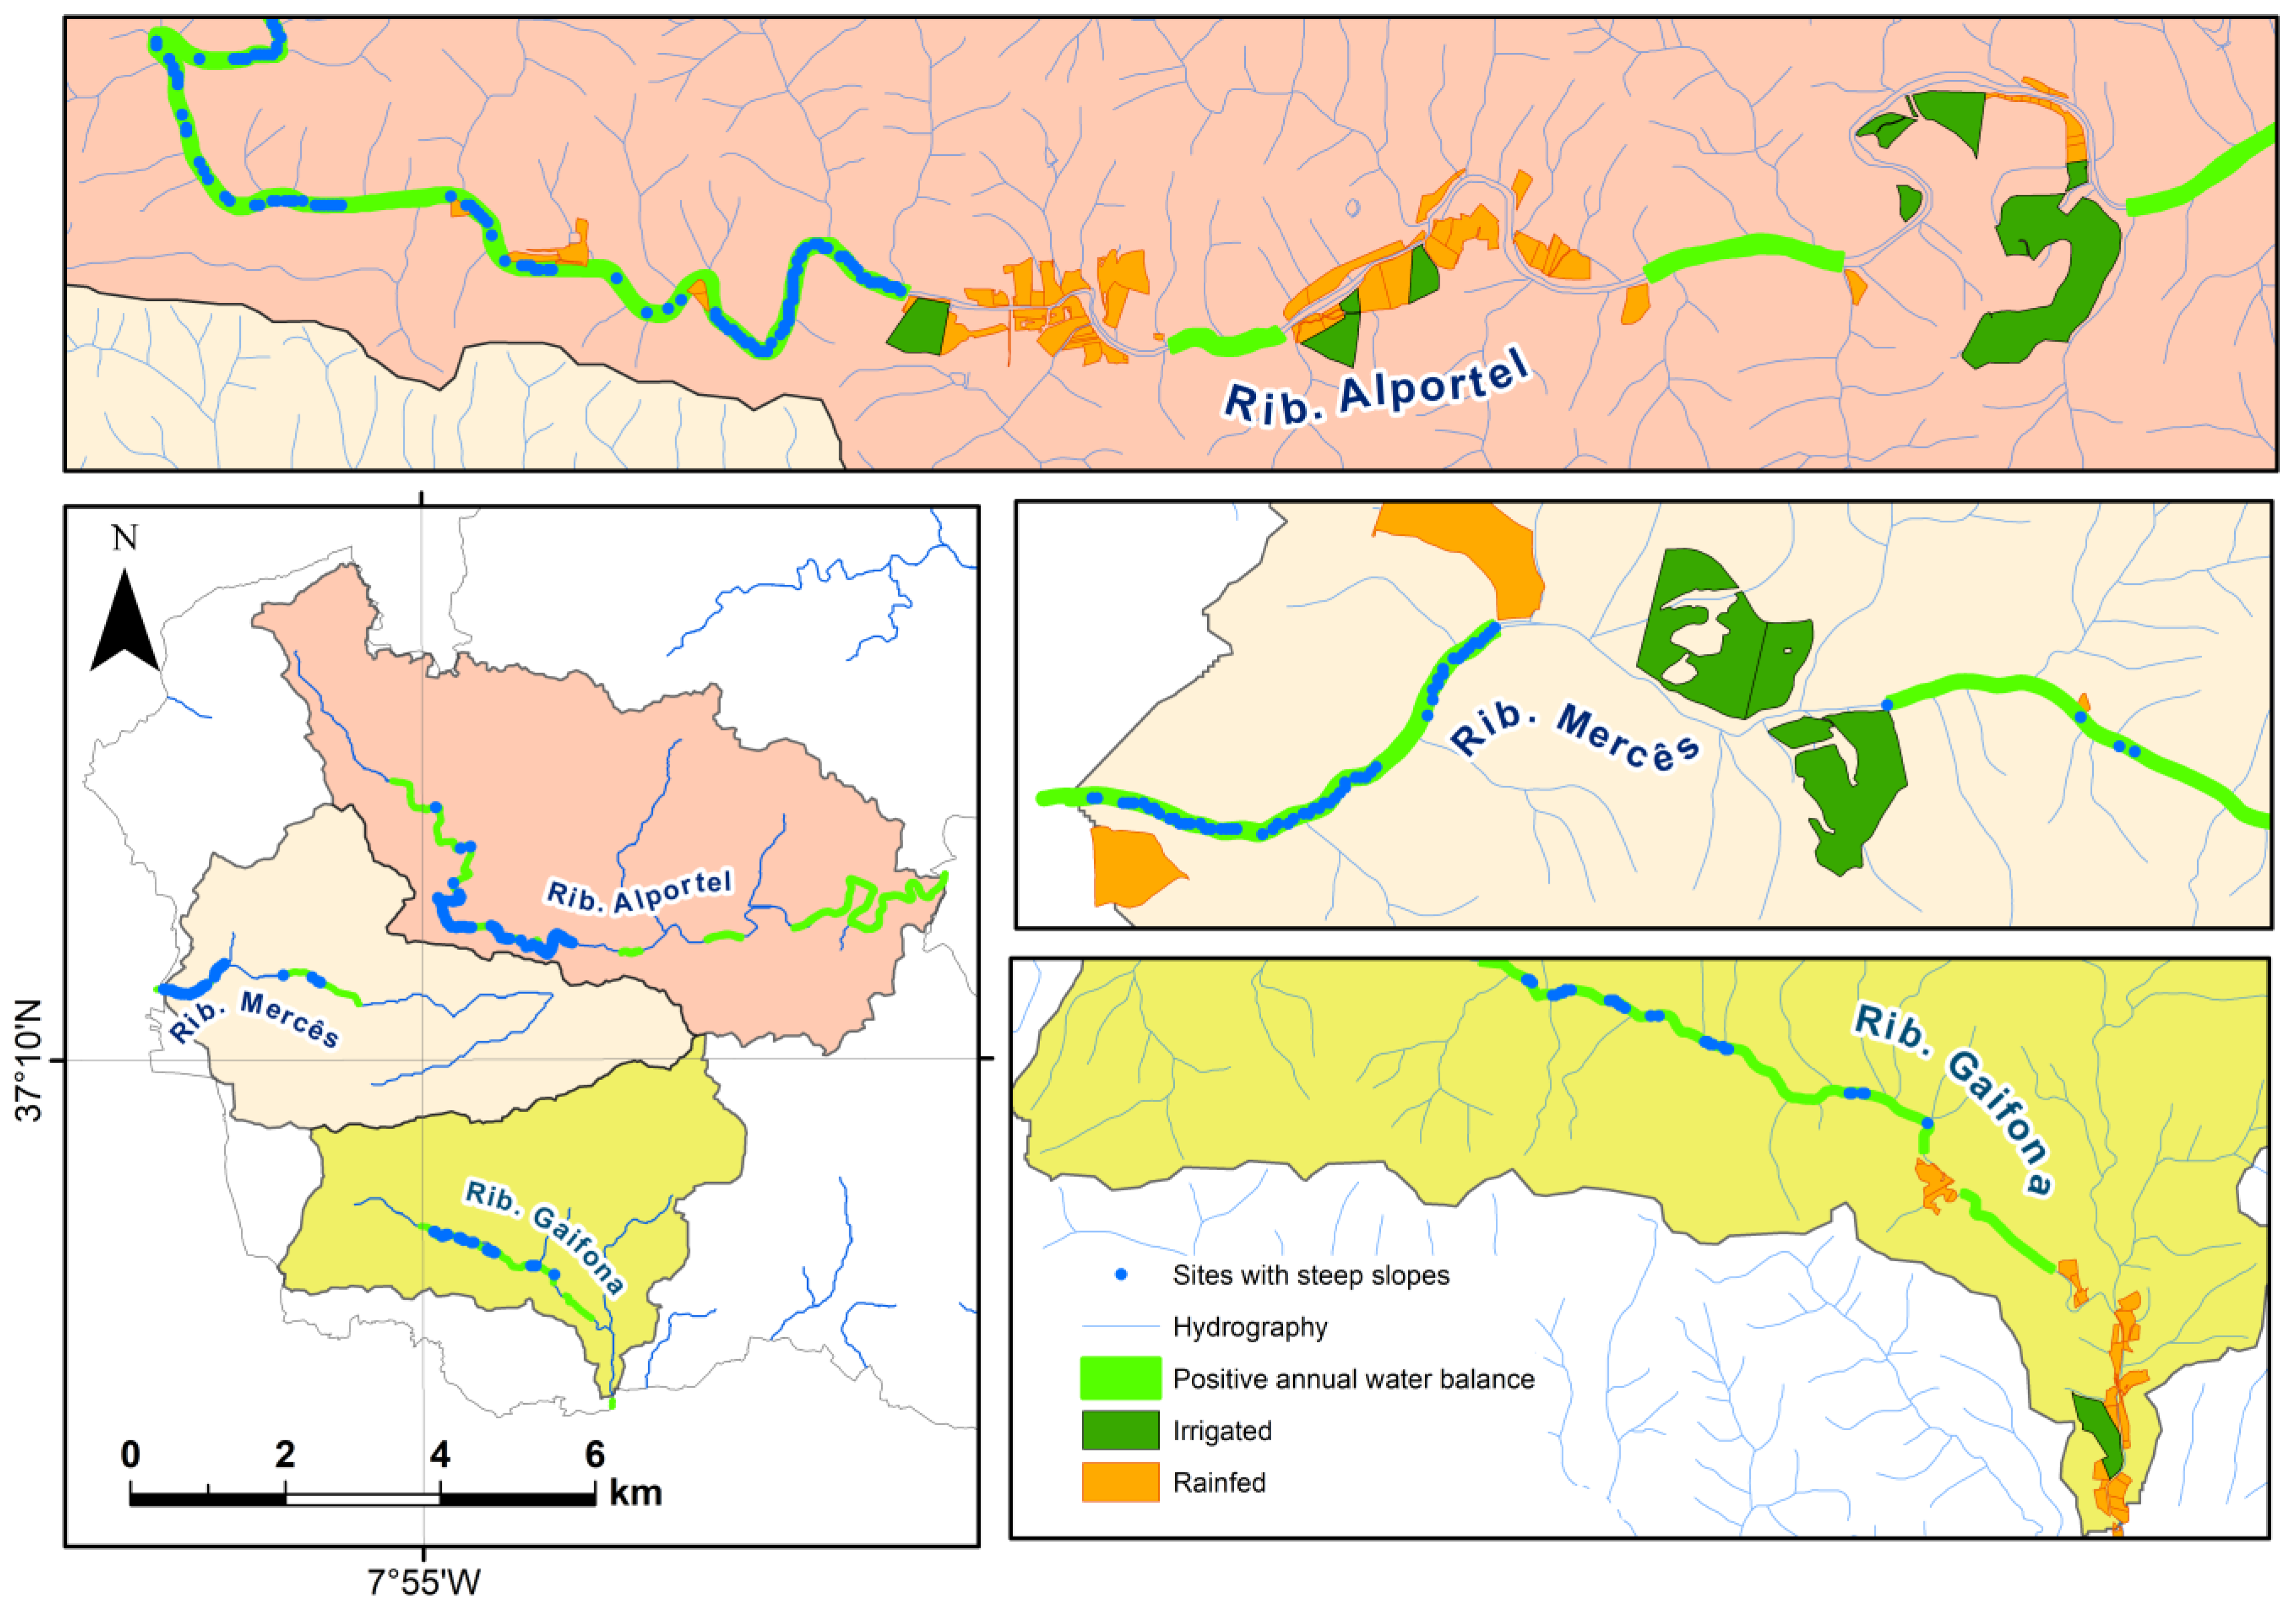
Figure 15 shows the preferred locations along the Alportel, Mercês, and Gaifona streams for the construction of dam embankments. These sites are situated in narrow valleys with steep slopes, where the upstream section widens to accommodate the required storage volume while maintaining water depths between 8 m and 12 m. All selected reaches correspond to stream sections exhibiting a positive hydrological balance.
After applying the described methodology and conducting field visits, the suitable reservoir sites are presented in
Figure 16. The figure shows the overlay of the study area with the points selected for the reservoirs, including the upstream catchments and the rainfed and irrigated parcels downstream, providing a clear visualisation of the spatial distribution of the reservoirs in relation to the agricultural areas and the hydrological network.
The catchment areas and the upstream catchment areas at the reservoir dam sites are presented in
Table 8.
3.5. Reservoir Water-Balance Analysis
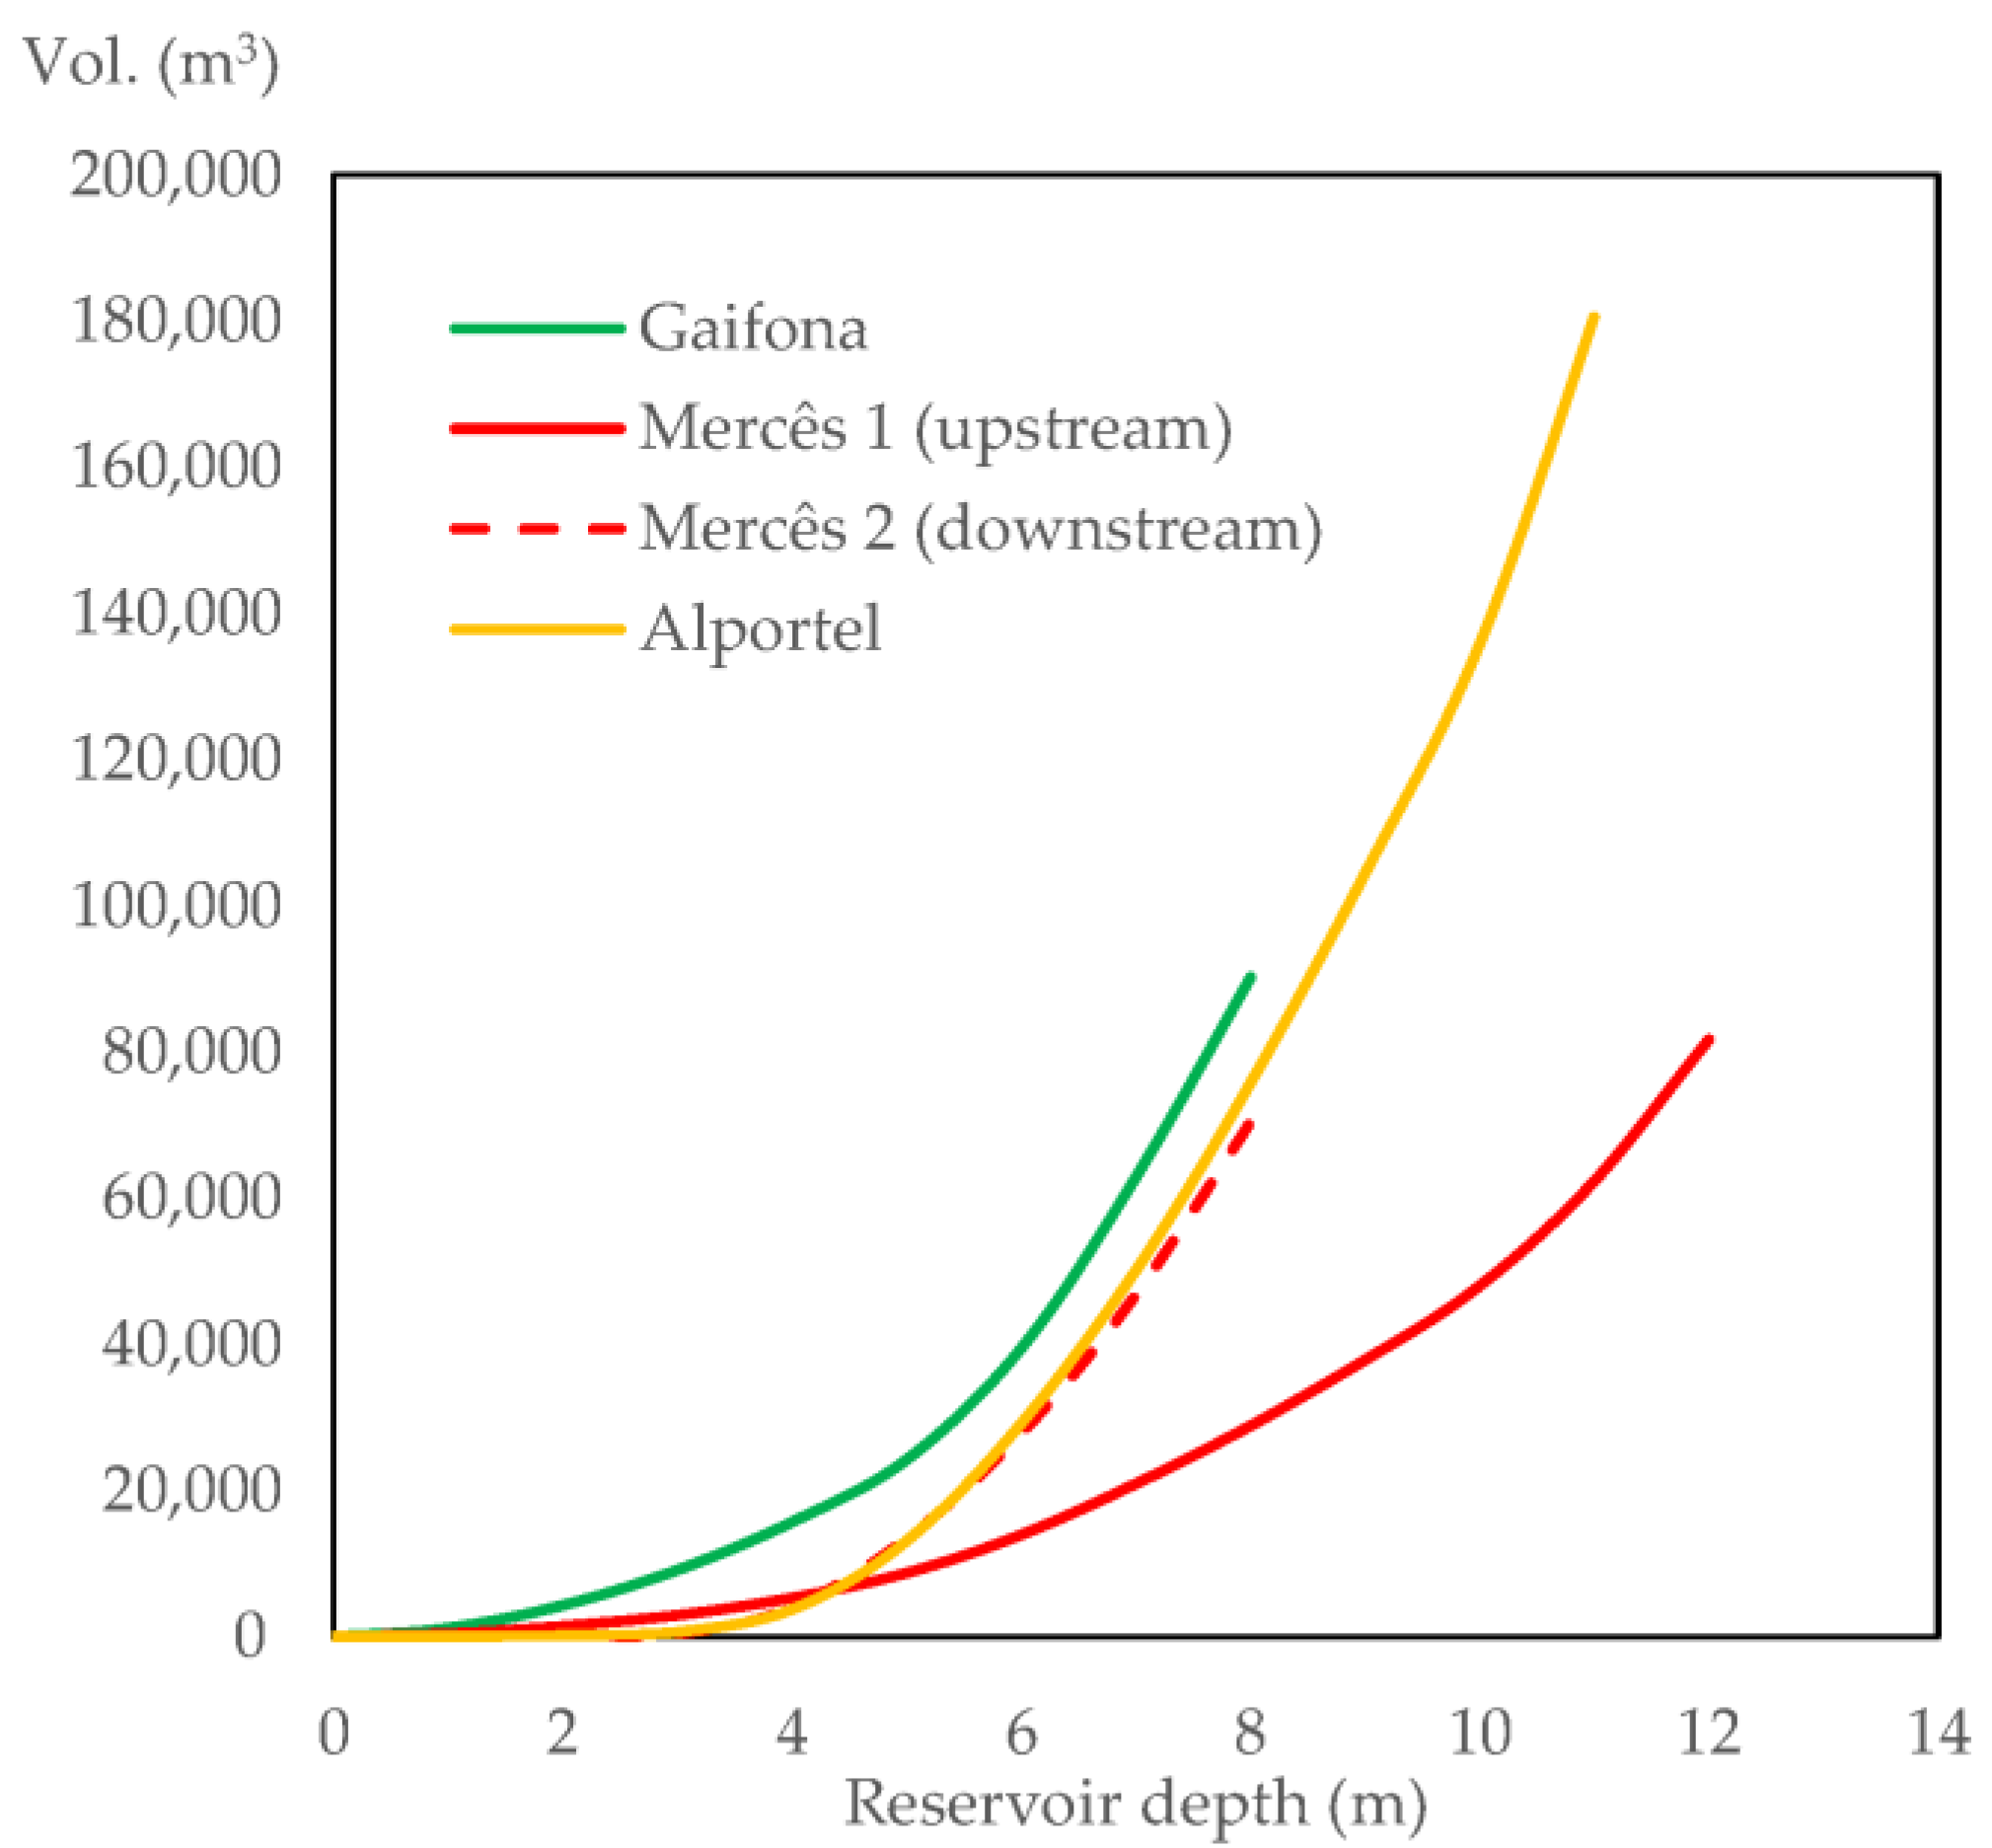
After the dam sites had been fixed, stage volume curves were produced for each reservoir. In this case study, embankments are to be limited to a maximum height of 12 m, with priority given to constructing several small reservoirs rather than one large structure.
The stage volume curves for the proposed reservoirs are presented in
Figure 17.
At the current study stage, a maximum depth of 12 m, and less wherever feasible, has been assumed for all reservoirs, based on the existing topographic and geological conditions for water storage.
3.6. Characterisation of the Agricultural Areas Served by the Reservoirs
For the four dam sites identified, the irrigated crop areas are listed in
Table 9. The same table also specifies the minimum usable volumes and the total storage volumes adopted for the reservoirs.
Olive groves and orchards are the predominant crops in the study area. Introducing irrigation increases productivity and makes agricultural activity economically viable.
3.7. Water Balance of the Reservoirs for the Average Year
Applying the methodology described above,
Table 10,
Table 11,
Table 12 and
Table 13 present the water balance results in the average year for the Ribeiras da Gaifona, das Mercês, and de Alportel. The upstream catchment’s water productivity in an average year enables the reservoir to fill rapidly. The monthly water balance begins in October, when stored water volumes are at their lowest, and ends in September, coinciding with the onset of the wet semester and the start of the hydrological year. Only in June, July, August, and September does the balance become negative. Although stored volume falls during these months, it remains sufficient to meet irrigation demand throughout the summer.
For the Ribeira das Mercês, due to downstream irrigation needs, discharges through the spillway of the first reservoir, and valley conditions, a water balance analysis was conducted for secondary reservoirs located downstream, with the results presented in
Table 13. In the downstream reservoir, as it receives discharges from the upstream reservoir, the monthly water balance is only negative in July and August.
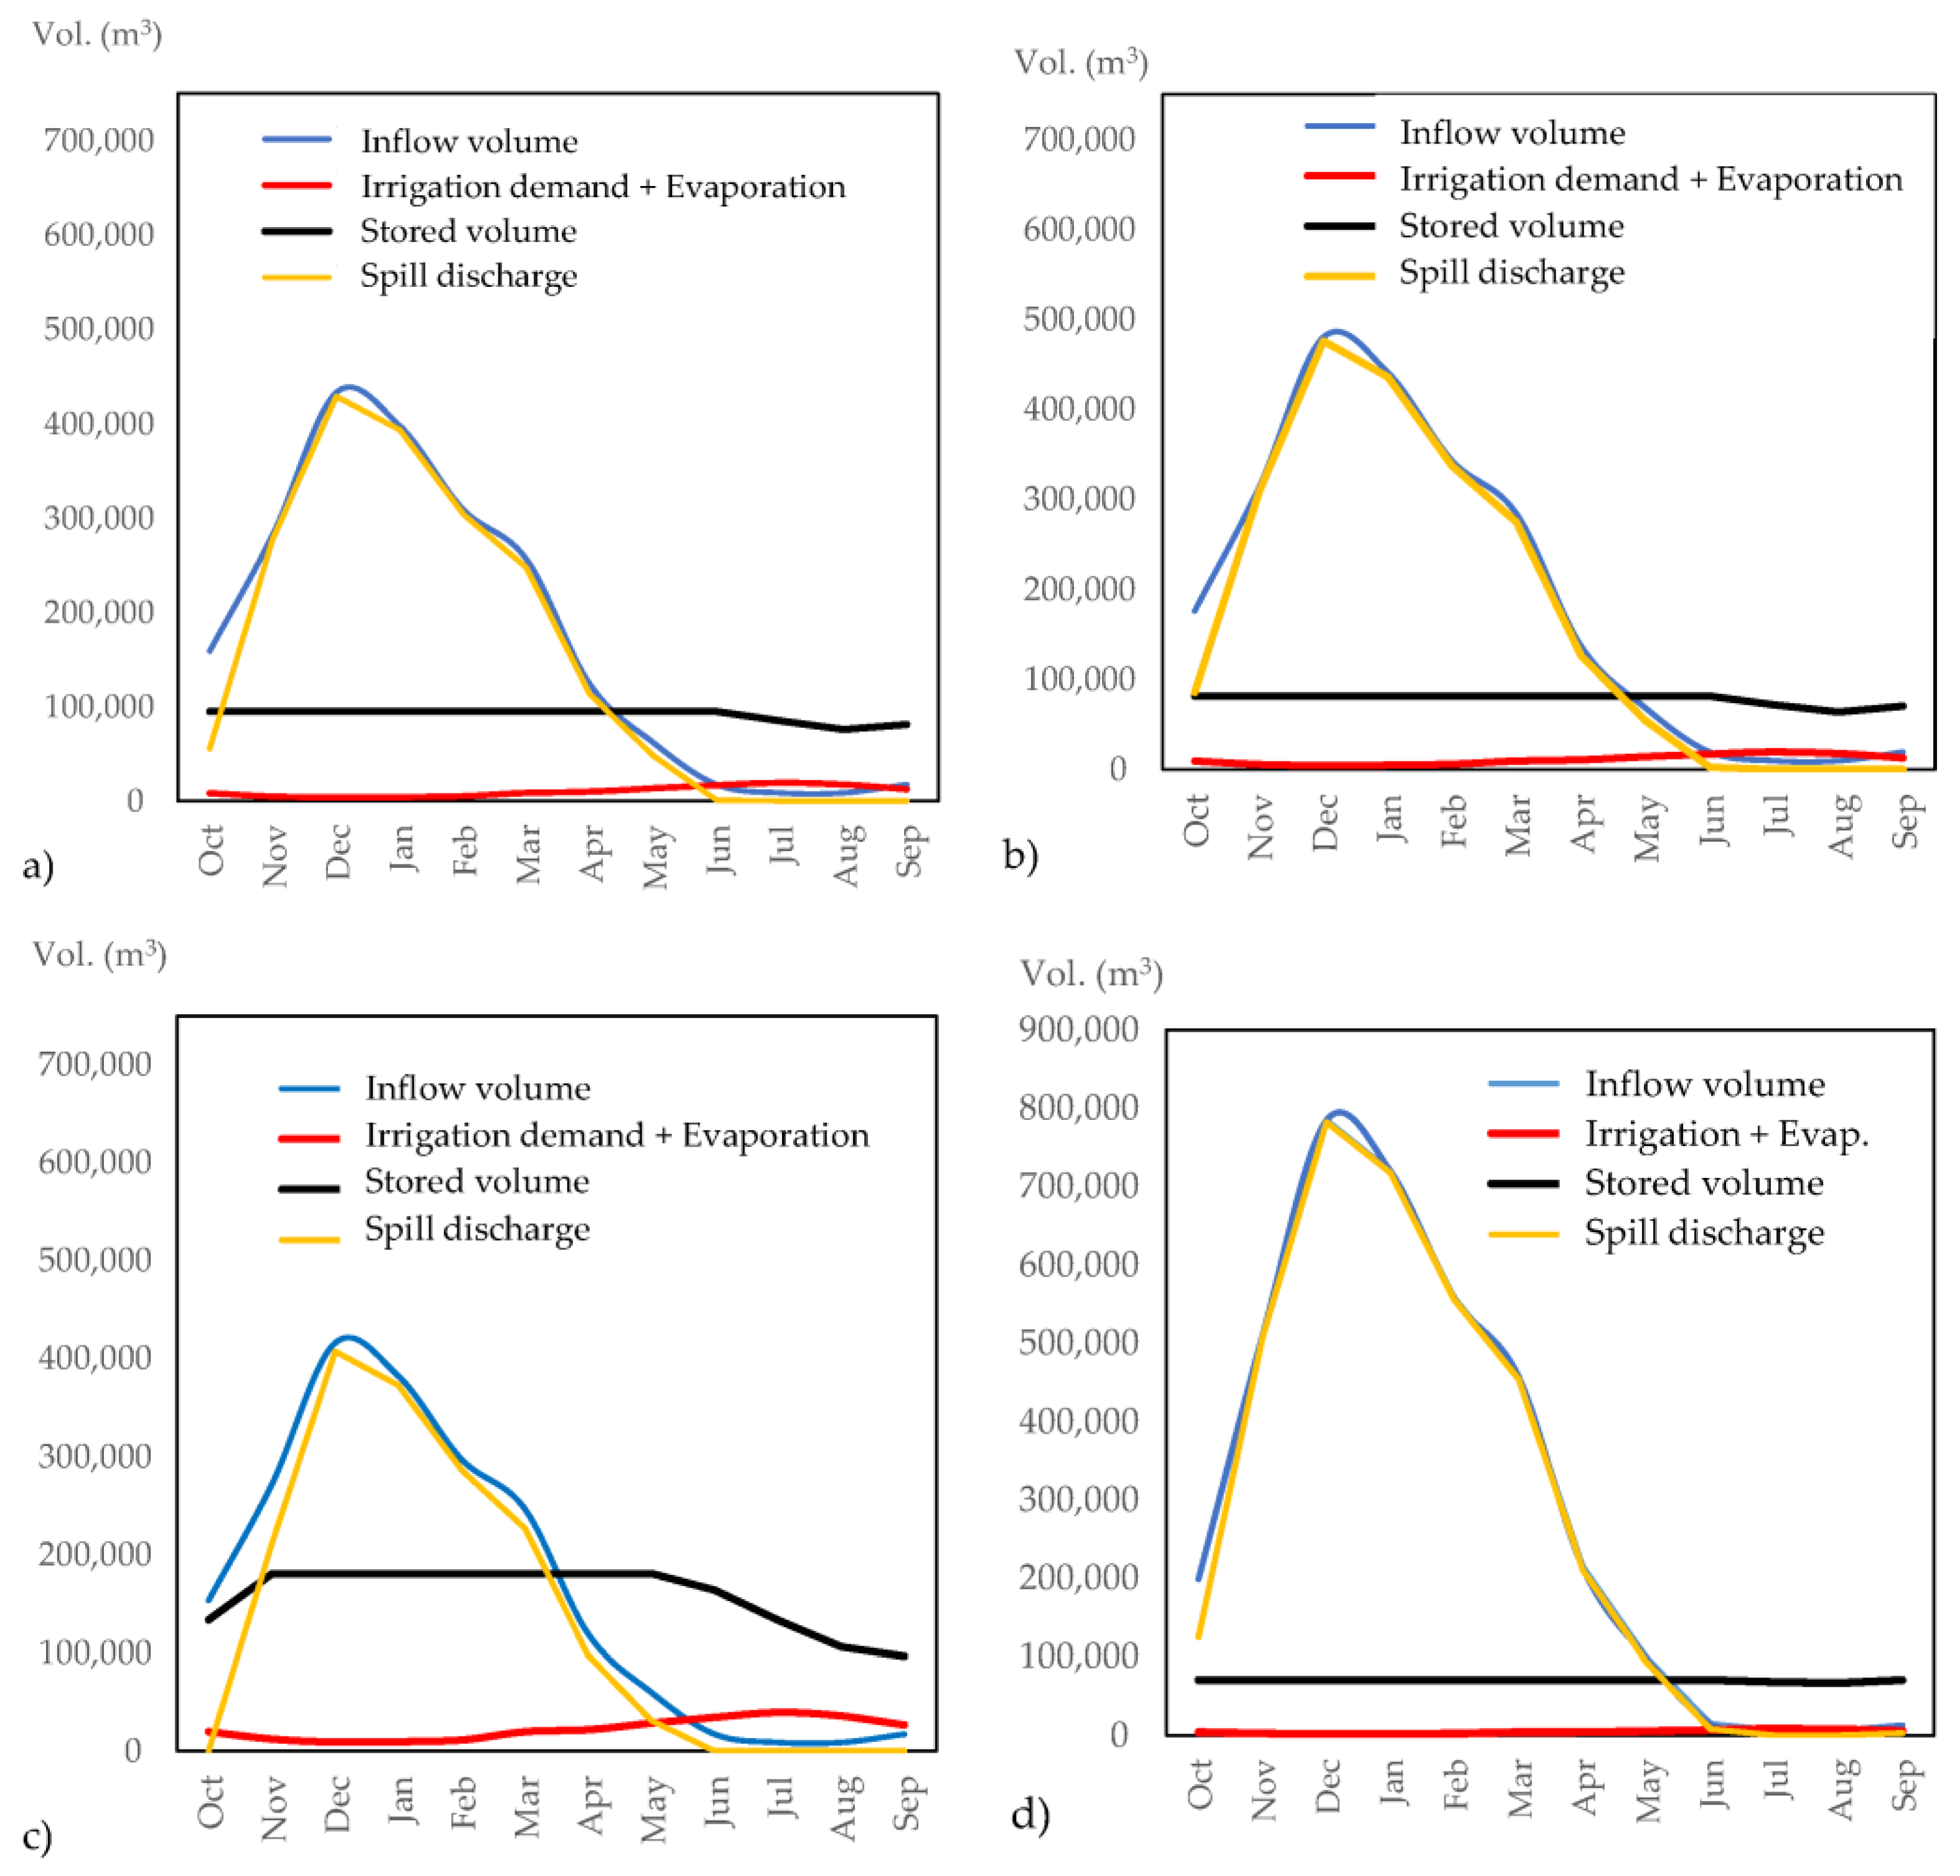
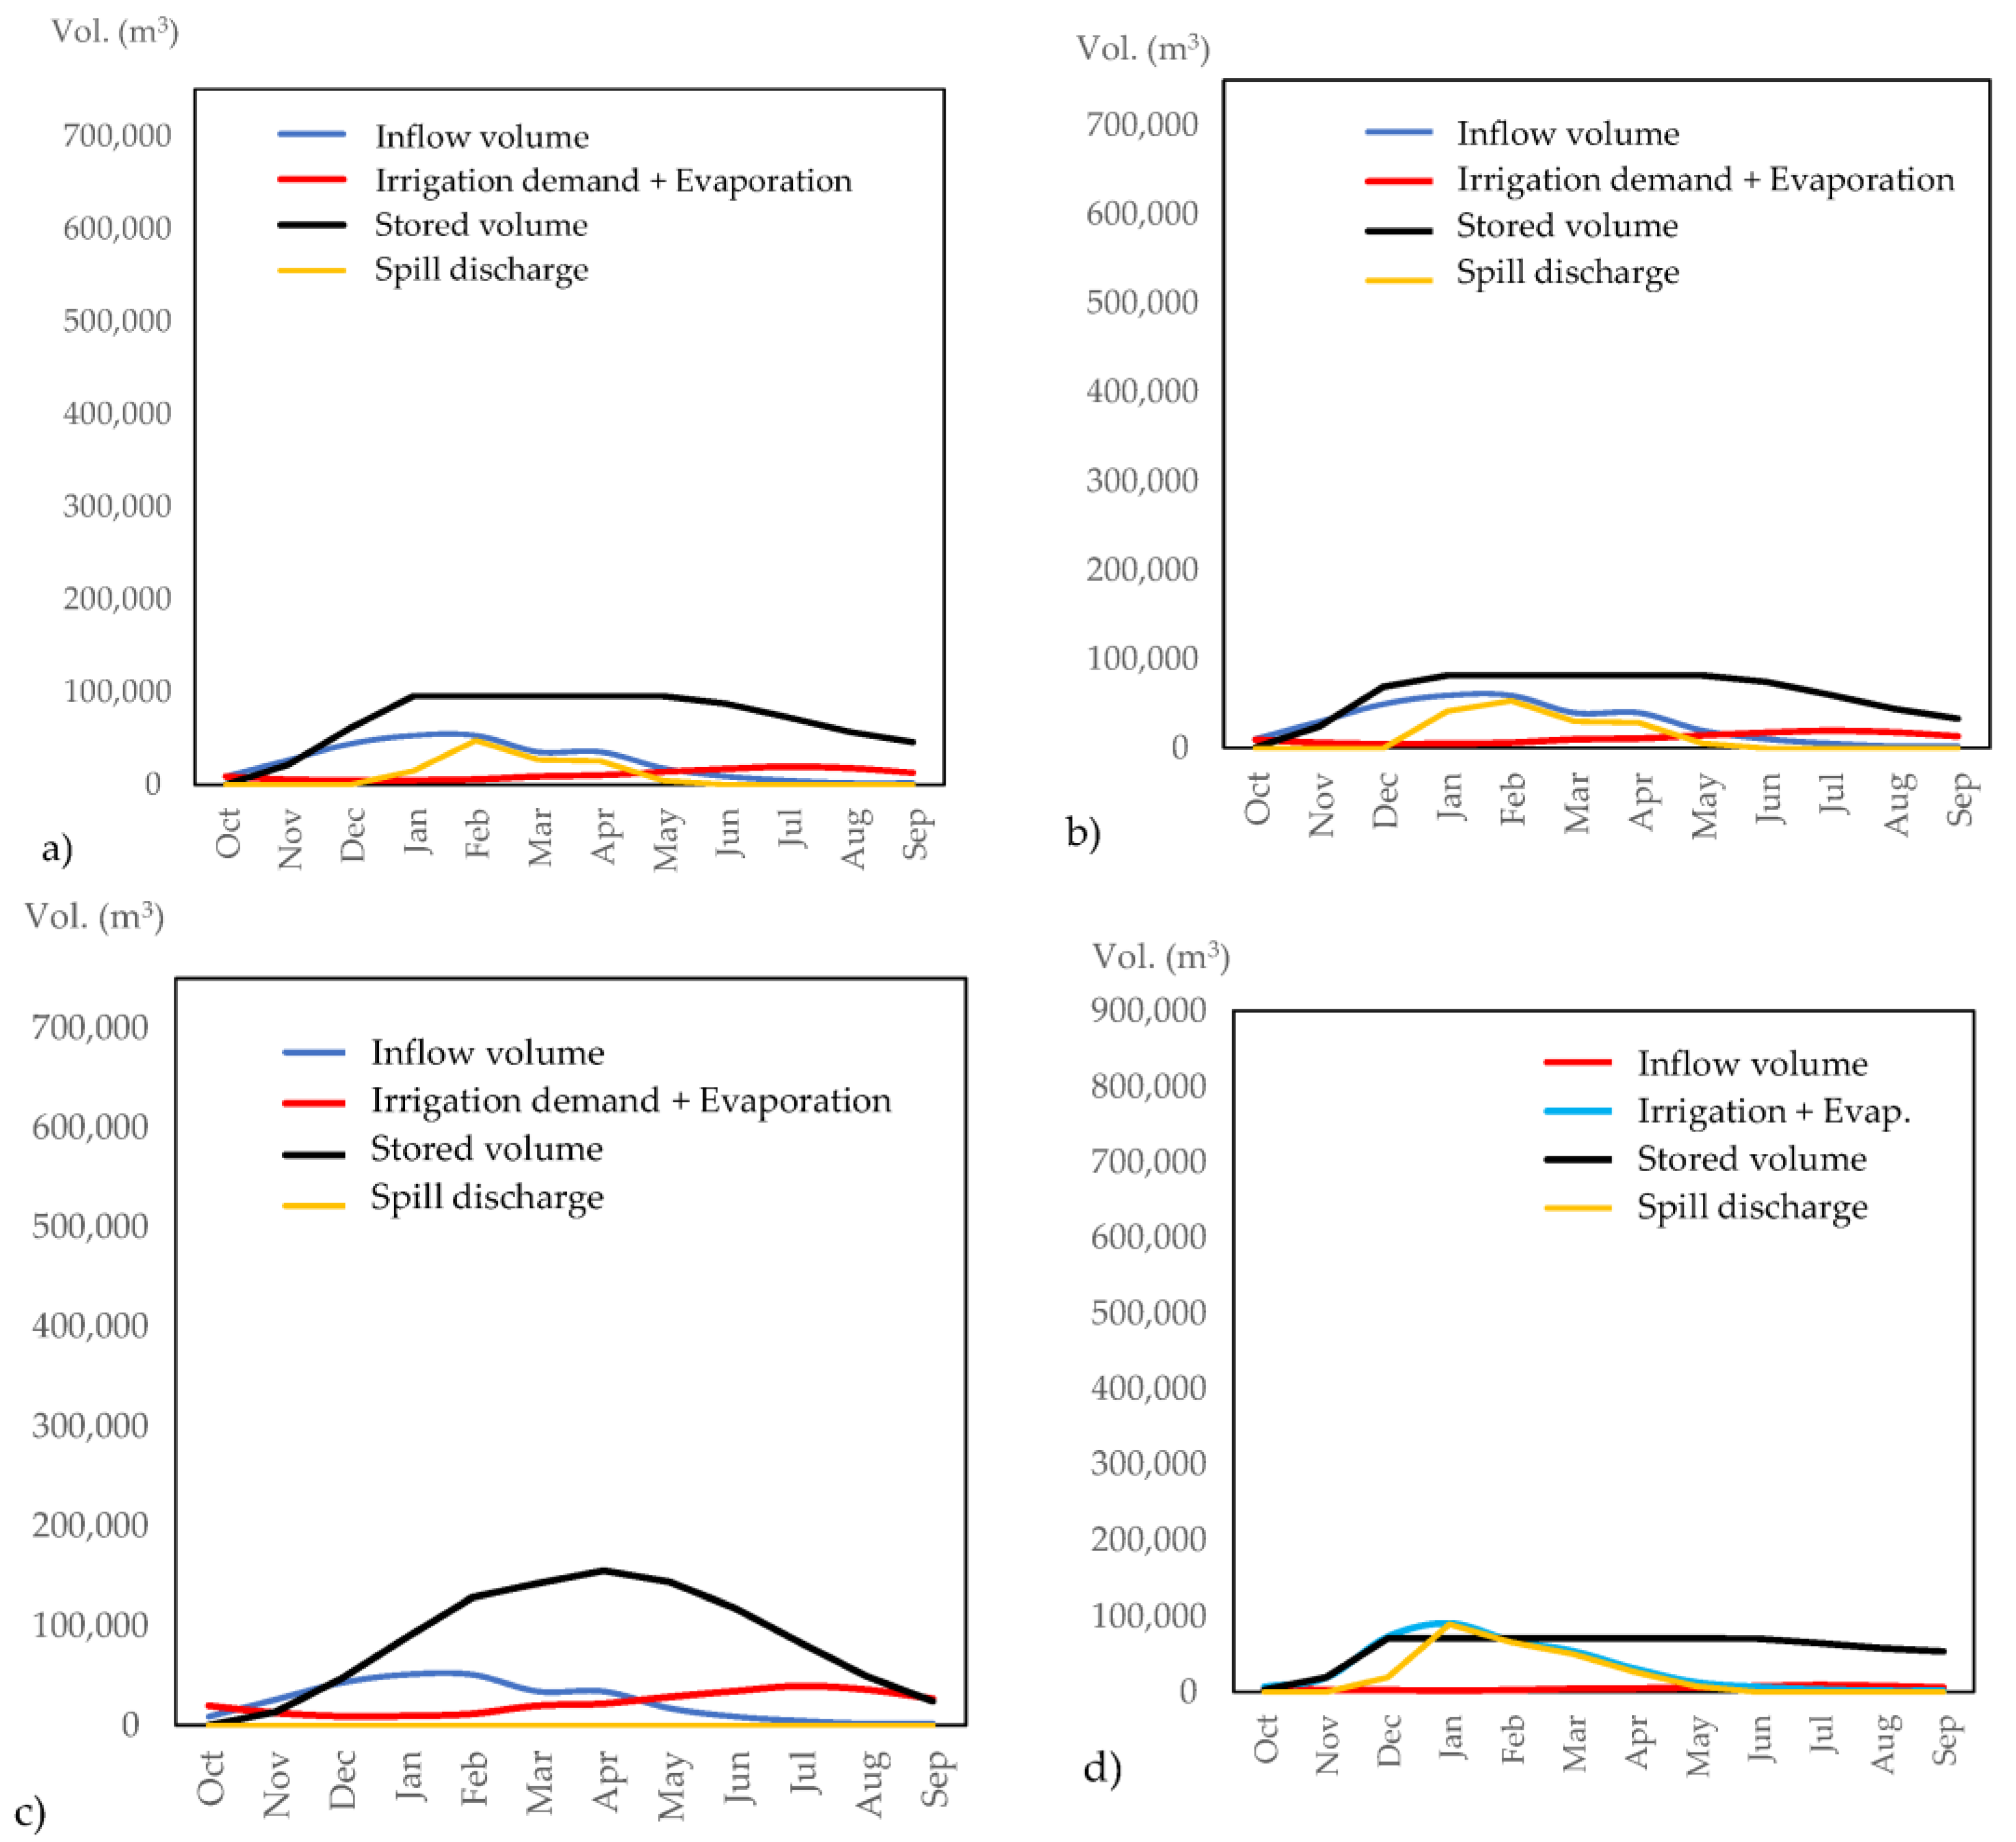
The key water balance values in the average year for the four reservoirs are shown in
Figure 18.
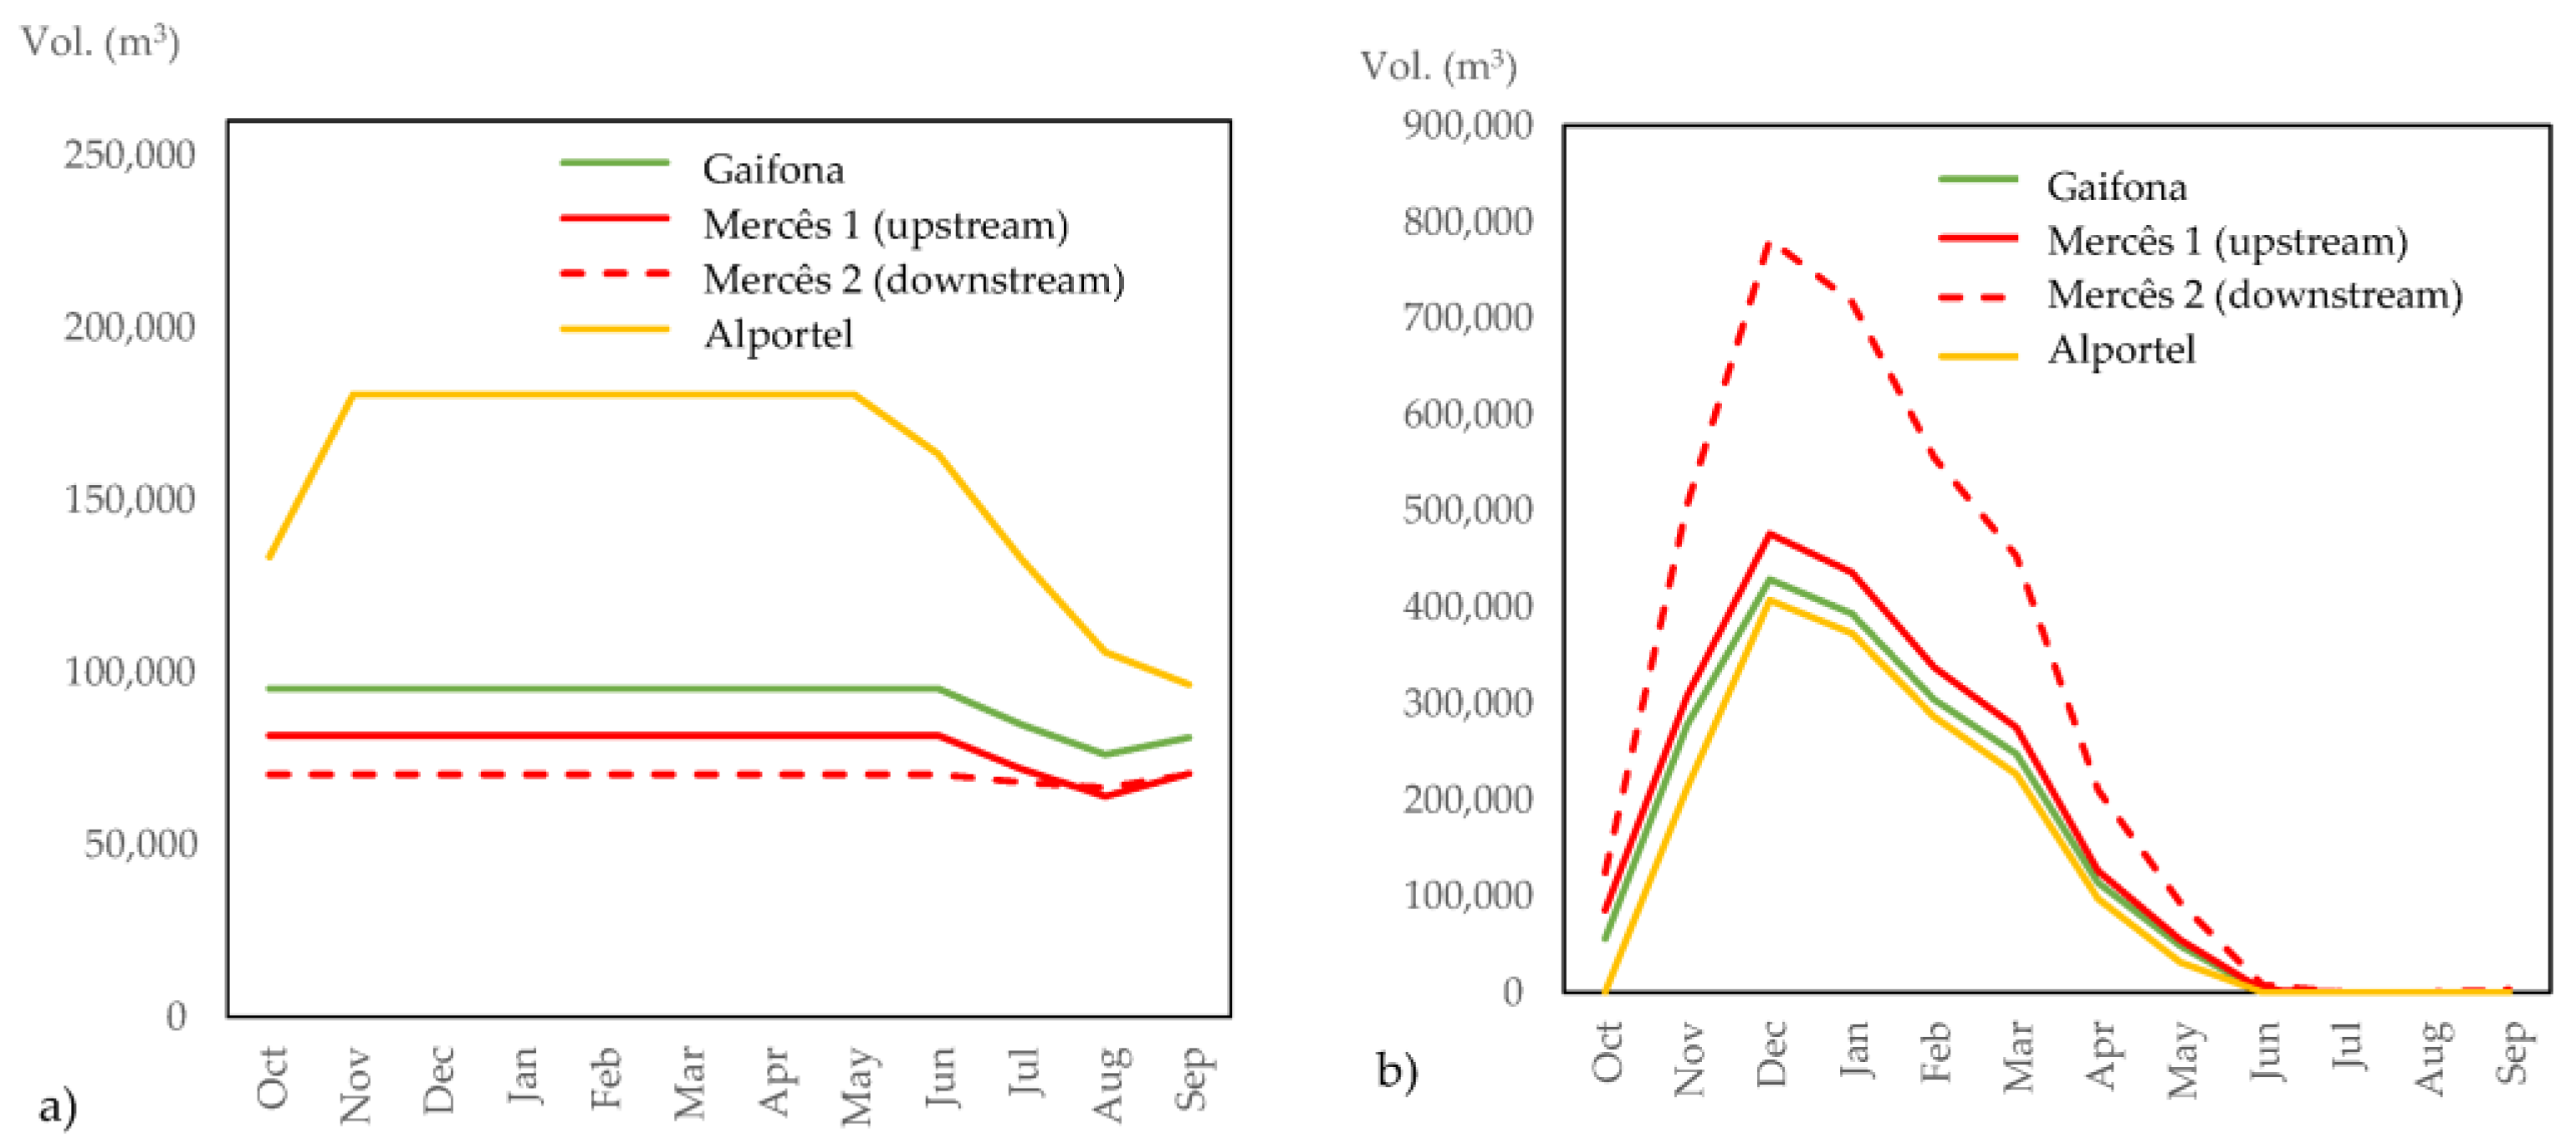
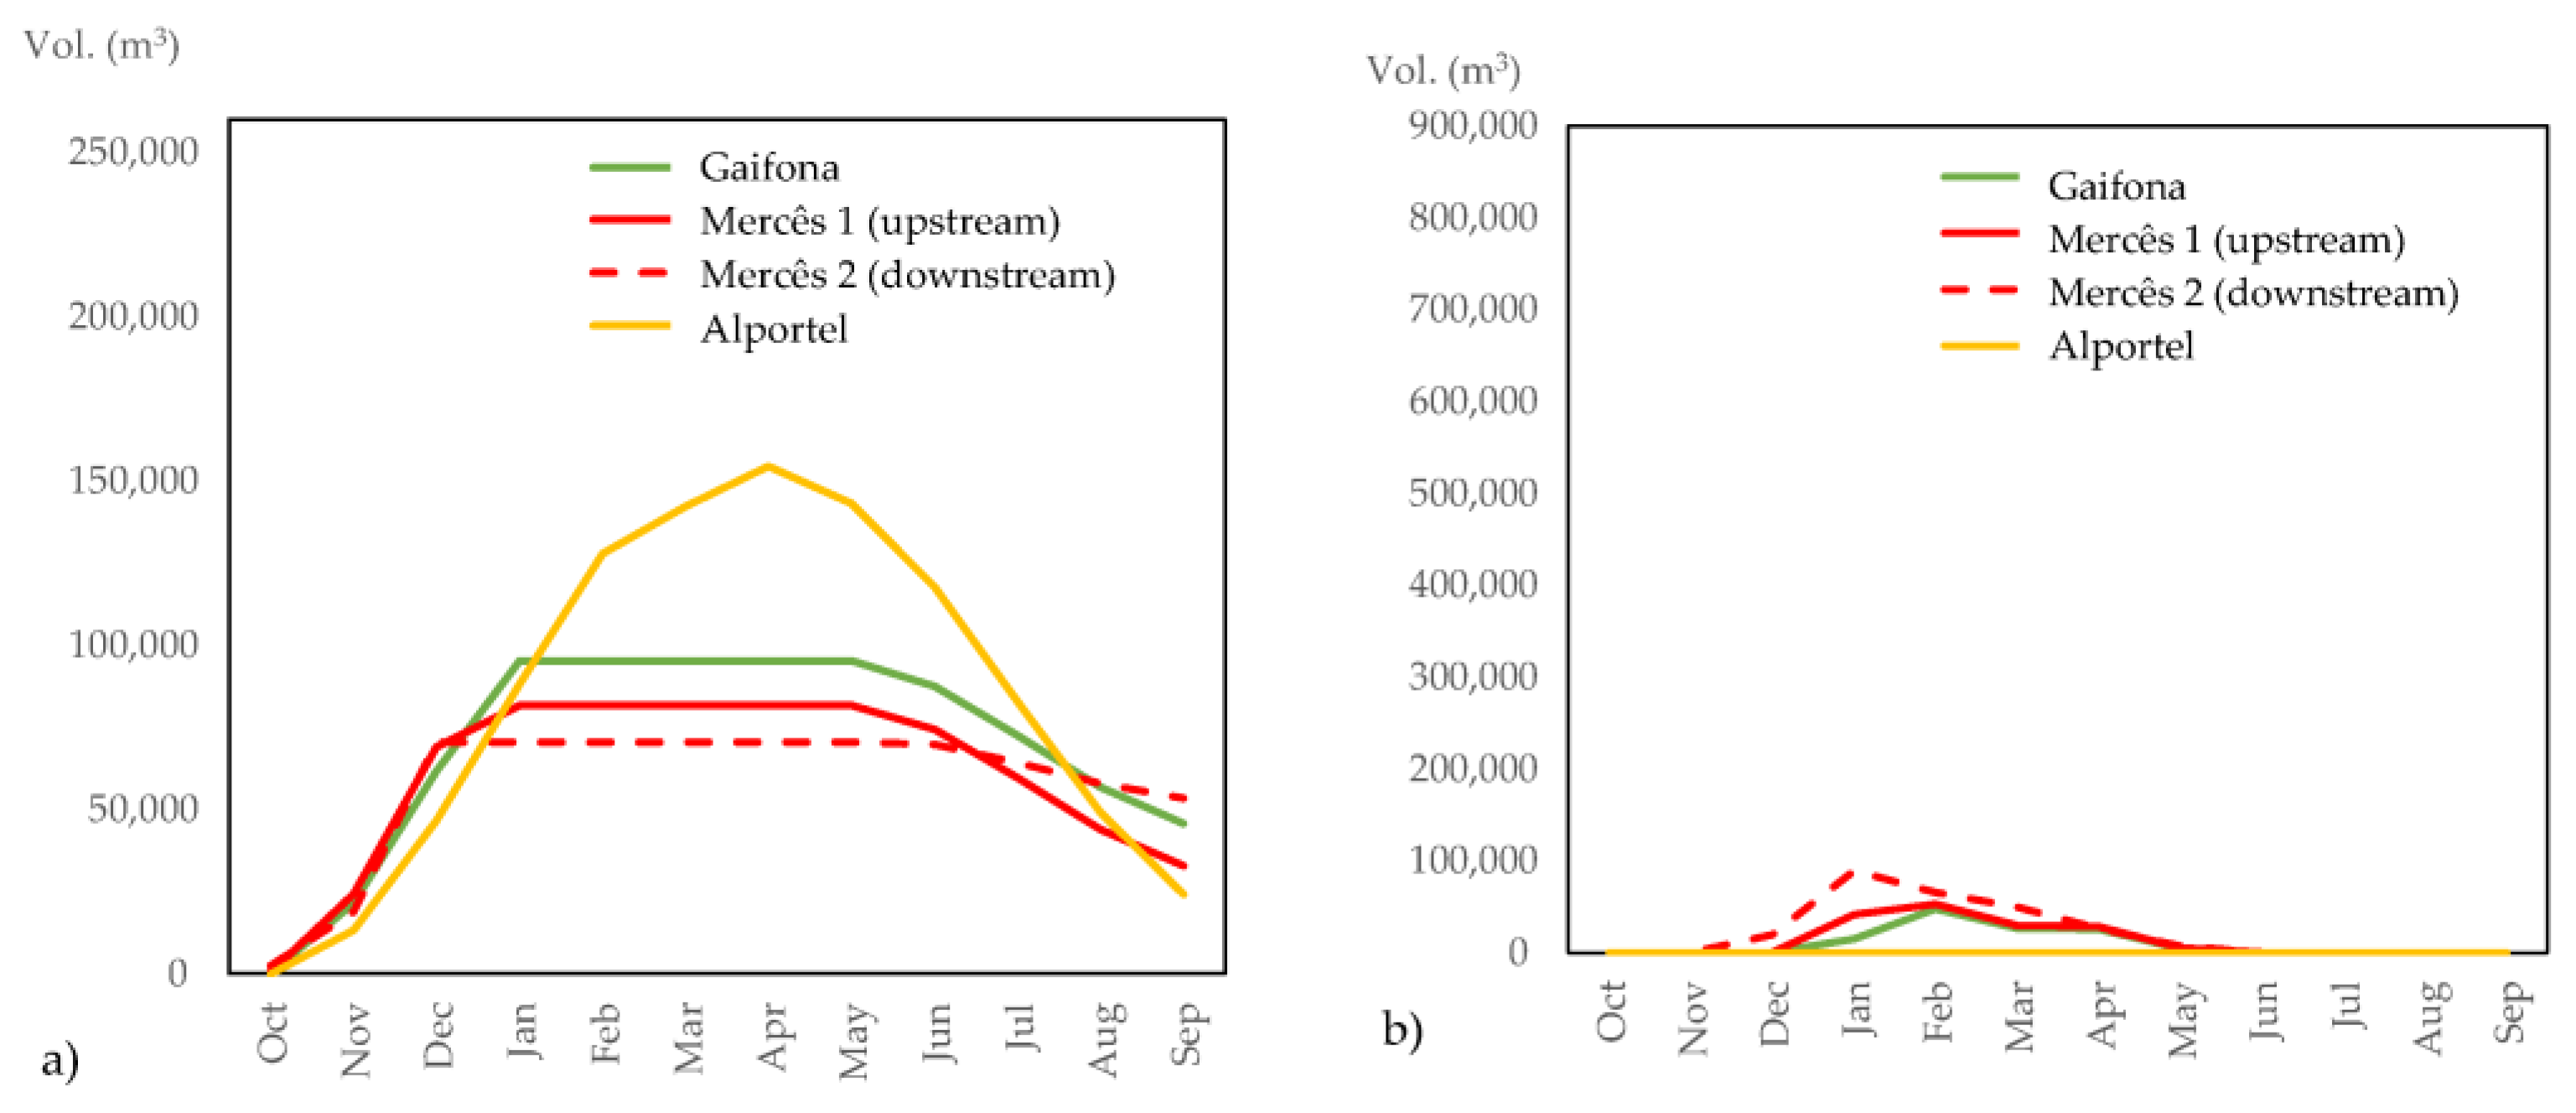
The stored volume and spill discharge curves for the four reservoirs are shown in
Figure 19.
The monthly hydrological balance in the average year indicates that the reservoirs fill readily, with a positive balance for almost the entire year, except in June, July, August, and, in some cases, September. During these summer months, the balance turns negative; yet, the stored volume still suffices to maintain irrigation demand and compensate for direct evaporation. The analysis further reveals that runoff in the first two months of the hydrological year (October and November) is adequate to refill all the reservoirs; whenever the cumulative monthly inflow exceeds capacity, surplus water is discharged to the stream and continues along its natural course to the sea.
Runoff from the upstream catchments is thus high in an average year, and the reservoirs spill from October to May. Even under these conditions, the irrigated area remains relatively small compared with the region’s water potential: the total capacities of the reservoirs considered are two to three times greater than the minimum usable volumes required to meet irrigation demand in summer.
Constructing two reservoirs in series on the same watercourse, a cascade, offers the advantage of replacing a single, larger structure with several smaller reservoirs distributed along the watercourse. Besides being the most obvious solution, this arrangement stores more water for agriculture and other uses closer to the points of demand, reducing both landscape and environmental impact.
3.8. Water Balance of the Reservoirs for the Dry Year
Applying the same methodology described above,
Table 14,
Table 15 and
Table 16 present the water balance results in the dry year for the Ribeiras da Gaifona, das Mercês, and de Alportel. The monthly water balance begins in October, when stored water volumes are at their lowest, and ends in September, coinciding with the onset of the wet season and the start of the hydrological year. The upstream catchment’s water productivity in a dry year still enables the reservoir to fill from October, when the rainy season starts, to January. Only in June, July, August, and September does the balance become negative. Although stored volume falls during these months, it remains sufficient to meet irrigation demand and compensate for the evaporation throughout the summer.
In the dry year, Ribeira Mercês upstream reservoir continues to have discharges through the spillway from January to May, justifying the existence of a second downstream reservoir. In the downstream reservoir, as it receives discharges from the upstream reservoir, the monthly water balance becomes negative in June, July, August, and September during dry years (
Table 17).
The key water balance values for the four reservoirs during the dry year are shown in
Figure 20.
The stored volume and spill discharge curves for the four reservoirs in the dry year are shown in
Figure 21.
During the dry year, the monthly hydrological balance indicates that all reservoirs continue to fill, showing a positive balance for most of the year, except during June, July, August, September, and October, when the balance becomes negative. However, while most reservoirs reach full capacity, the Alportel reservoir does not; yet it still provides sufficient storage to meet water demand throughout the year. Despite the seasonal deficit, the stored volume in the system remains adequate to sustain irrigation needs and compensate for direct evaporation. The analysis further reveals that, in dry years, spill discharges decrease substantially and become residual compared to the average year.
4. Discussion of the Results
The discussion centres on three principal axes: spatial characterisation of irrigation, annual water availability and structural constraints. The high reliability of the irrigation map produced from NDVI (overall accuracy = 98%; K = 88%) confirms the potential of the low-complexity remote sensing approach adopted here. Comparable results (88–92% accuracy) were reported by [
29] when identifying irrigated orchards on the Spanish Meseta using combined Sentinel-1 and Sentinel-2 time series, which reinforces the robustness of this type of classification in highly heterogeneous Mediterranean settings.
In an average-rainfall year, the São Brás reservoirs fill between the first two months of the rainy season, October and November. The monthly water balance turns negative only from July to September; yet, stored volumes remain sufficient for irrigation, keeping the annual cumulative balance positive.
In a dry year, the reservoirs take four months to fill, from October when the rainy season starts to January. Only in June, July, August, and September does the balance become negative. Although stored volume falls during these months, it also remains sufficient to meet irrigation demand and compensate for evaporation throughout the summer. Evaporation losses, estimated from SNIRH records (45.8–257.6 mm month
−1), lie within the range reported for large Mediterranean reservoirs [
30]. Recent literature, however, warns that a +2 °C thermal increase could raise these losses by 15–20% [
31], a reduction that should be taken into account in future sizing. These findings indicate refill ratios of more than 80% in the first two hydrological months, consistent with other Mediterranean studies, which describe 70–80% of annual runoff occurring in the wet half-year [
32].
Najran’s modelling shows a similar seasonal concentration, with the nine proposed ponds storing a combined 3.45 Mm
3 from catchments ranging from 40 to 212 km
2 and releasing environmental flows after May. The choice of small reservoirs in series halves the impounded surface compared with an equivalent single dam, a strategy also recommended by [
33] to reduce evaporative losses and sediment spread.
Adopting cascaded reservoirs, two structures up to 12 m high, linked in series, proved advantageous in terms of risk reduction, landscape integration, and proximity to agricultural blocks. This configuration is supported by regional analyses that demonstrate higher hydrological efficiency and lower evaporative losses per storage unit in networks of interconnected small reservoirs [
34]. Only three sites (one with a downstream reservoir forming a cascade) met the hydraulic, geomorphological, and buffer-distance criteria in São Brás. The selection applied all buffer zones simultaneously, considering distances from drainage networks, infrastructure, agricultural parcels, and protected areas. This approach ensured water availability and proximity to agricultural plots while minimising environmental impacts. These three sites collectively service 112 ha of agricultural plots by gravity and require embankments of ≤12 m. By contrast, the Dewana study identified 11 viable dams within the same watershed, allocating 5.55% of the basin to the “highly suitable” class and ranking alternatives with a weighted-product model (WPM), [
35]. The larger portfolio in Dewana reflects the semi-arid topography (wider valleys, clayey lithology) and the inclusion of socio-economic layers such as distance to construction materials and archaeological sites, which our protocol purposefully excluded to retain hydrological parsimony.
In the study by Ullah et al. [
36], site selection in Quetta combined a rule-based approach with a weighted multi-criteria evaluation, resulting in only 6.36 % of the area classified as “very high” and 25.35 % as “high.” In São Brás de Alportel, where site selection was based exclusively on hydrological, geomorphological, and suitability criteria, only a small fraction of the territory was deemed suitable, further underscoring the scarcity of favourable locations.
In the present study, a monthly water balance was conducted to assess the water availability in the reservoirs of São Brás de Alportel. However, sedimentation was not considered, which will limit the reservoirs’ efficiency over time. Studies, such as those by Bufalini et al. [
37], indicate that some Italian reservoirs can lose more than 40% of their capacity within 50 years. This highlights the need to incorporate bathymetric monitoring and sediment management into future maintenance plans.
Drawing on the experience gained during this study, future work should (i) incorporate PlanetScope or drone imagery to refine intra-parcel mapping and calibrate crop coefficients; (ii) couple SWAT+ with hydrodynamic models that represent water-level variations in subbasins, exploiting synergies with radar-altimetry data; (iii) investigate floating covers or shading aerogenerators to reduce evaporation; and (iv) assess ecological-discharge regimes that minimise the loss of fine sediments. These actions could enhance water resilience in the face of the intensifying Mediterranean warming and rainfall variability scenario.
5. Conclusions
This study led to the following main findings:
Adequate water productivity: Catchment water productivity is sufficient to meet irrigation requirements in both average-rainfall year and dry year. Constructing small reservoirs, with a maximum water depth of 12 m behind simple embankments, secures supply during the summer months while enhancing the agricultural landscape.
Current extent of agricultural activity: The agricultural activity layer delineates 2854 ha (18.65% of the municipality), of which 112 ha (4%) are irrigated. The summer NDVI classification achieved a κ coefficient of 0.88, indicating an almost-excellent ability to identify irrigated parcels.
Hydrological baseline from the DEM: The DEM provided flow-direction and flow-accumulation models, from which a 758 km drainage network and 38 micro-catchments were delineated, forming the basis for site selection.
Reservoir location: Suitable dam points were identified on three streams that satisfied all technical criteria; for each, the contributing catchment area and the gravity-fed irrigated area (requiring no pumping) were calculated. It should be noted that site selection followed a rule-based approach, utilising exclusion buffers and suitability criteria, rather than a weighted multi-criteria evaluation, to ensure methodological simplicity and transparency.
Positive water balance in the average-rainfall year and in the dry year: The cumulative hydrologic balance is positive in an average year and in a dry year, assuming a maximum water depth of 12 m in the Mercês upstream reservoir, 10 m in the Alportel reservoir and 8 m in the Gaifona and Mercês downstream reservoir. The surplus justifies installing additional downstream reservoirs on the same watercourse, a viable option on the Ribeiras das Mercês.
Benefits of cascaded reservoirs: Cascades of small reservoirs, rather than a single large impoundment, minimise environmental and landscape impacts, distribute resources more evenly, and reduce hydrological risk.
Definition of the supply area: The supply area was limited to parcels intersecting the downstream watercourse, avoiding wastage. Introducing pumping could extend this area and diversify water use.
In summary, the GIS and remote sensing-based methodology proved effective for locating small-scale agricultural reservoirs, linking catchment areas, usable volumes, and irrigated areas. The approach is objective, replicable, and adaptable to other regions with comparable hydrological settings.
Author Contributions
Conceptualization, O.D. and C.C.; methodology, F.M.G.-M. and H.M.F.; software, O.D.; validation, C.O.S., R.L. and H.M.F.; formal analysis, R.L.; investigation, O.D.; resources, C.C.; data curation, O.D. and C.C.; writing—original draft preparation, O.D.; writing—review and editing, R.L. and H.M.F.; visualisation, F.M.G.-M.; supervision, R.L. and H.M.F. All authors have read and agreed to the published version of the manuscript.
Funding
This paper is financed by national funds provided by the FCT-Foundation for Science and Technology through project UIDB/04020/2020.
Institutional Review Board Statement
Not applicable.
Informed Consent Statement
Not applicable.
Data Availability Statement
Raw data is available upon request.
Conflicts of Interest
Author Olga Dziuba is employed by the company GeoPole. The remaining authors declare that the research was conducted in the absence of any commercial or financial relationships that could be construed as a potential conflict of interest.
References
- Trnka, M.; Olesen, J.E.; Kersebaum, K.C.; Skjelvåg, A.O.; Eitzinger, J.; Seguin, B.; Peltonen-Sainio, P.; Rötter, R.; Iglesias, A.; Orlandini, S.; et al. Agroclimatic conditions in Europe under climate change. Glob. Change Biol. 2011, 17, 2298–2318. [Google Scholar] [CrossRef]
- Rosa, A. Rega das Culturas/Uso Eficiente da Água; Direção Regional de Agricultura e Pescas do Algarve: Faro, Portugal, 2019. [Google Scholar]
- Sutcliffe, J.V. Hydrology: A Question of Balance; International Association of Hydrological Sciences: Wallingford, UK, 2004; ISBN 978-1-901502-770. [Google Scholar]
- Marengo, J.A. Água e mudanças climáticas. Estud. Av. 2008, 22, 83–96. [Google Scholar] [CrossRef]
- Pedroso, A.V.A. Uso Eficiente da Água Num Edifício de Habitação. Master’s Thesis, Instituto Superior de Engenharia de Lisboa, Lisboa, Portugal, 2014. [Google Scholar]
- Rijo, M. A escassez da água e a sustentabilidade do regadio. In Proceedings of the 10º SILUSBA—Simpósio de Hidráulica e Recursos Hídricos dos Países de Língua Oficial Portuguesa, Porto de Galinhas, Brasil, 25–29 September 2011; Available online: http://hdl.handle.net/10174/3431 (accessed on 1 May 2025).
- Gebeyehu, M.N. Remote sensing and GIS application in agriculture and natural resource management. Int. J. Environ. Sci. Nat. Resour. 2019, 19, 556009. [Google Scholar] [CrossRef]
- Simón Sánchez, A.M.; González-Piqueras, J.; de la Ossa, L.; Calera, A. Convolutional neural networks for agricultural land use classification from Sentinel-2 image time series. Remote Sens. 2022, 14, 5373. [Google Scholar] [CrossRef]
- Radulović, M.; Brdar, S.; Pejak, B.; Lugonja, P.; Athanasiadis, I.; Pajević, N.; Crnojević, V. Machine learning-based detection of irrigation in Vojvodina (Serbia) using Sentinel-2 data. GISci. Remote Sens. 2023, 60, 2262010. [Google Scholar] [CrossRef]
- Yu, L.; Xie, H.; Xu, Y.; Li, Q.; Jiang, Y.; Tao, H.; Aihemaiti, M. Identification and monitoring of irrigated areas in arid areas based on Sentinel-2 time-series data and a machine learning algorithm. Agriculture 2024, 14, 1693. [Google Scholar] [CrossRef]
- Melo e Silva, D. Integração de Ferramentas de SIG na Modelação Hidrológica de Pequenas Bacias Hidrográficas. Master’s Thesis, Faculdade de Engenharia da Universidade do Porto, Porto, Portugal, 2008. [Google Scholar]
- Machado, K.J.; Calijuri, M.L.; Ribeiro, C.A.A.S.; Santos, R.S.; Franco, G.B. Determinação automática da capacidade de armazenamento de um reservatório. Rev. Bras. Cartogr. 2010, 62, 43704. [Google Scholar] [CrossRef]
- Lebon, N.; Dagès, C.; Burger-Leenhardt, D.; Molénat, J. A new agro-hydrological catchment model to assess the cumulative impact of small reservoirs. Environ. Model. Softw. 2022, 153, 105409. [Google Scholar] [CrossRef]
- Aminzadeh, M.; Friedrich, N.; Narayanaswamy, S.; Madani, K.; Shokri, N. Evaporation loss from small agricultural reservoirs in a warming climate: An overlooked component of water accounting. Earth’s Future 2024, 12, e2023EF004050. [Google Scholar] [CrossRef]
- Villani, L. Participatory modeling of small reservoirs in the Orcia watershed, Italy. In Proceedings of the European Geosciences Union General Assembly 2024 (EGU24), Vienna, Austria, 14–19 April 2024. EGUsphere, EGU24-1011. [Google Scholar] [CrossRef]
- Kottek, M.; Grieser, J.; Beck, C.; Rudolf, B.; Rubel, F. World map of the Köppen–Geiger climate classification updated. Meteorol. Z. 2006, 15, 259–263. [Google Scholar] [CrossRef] [PubMed]
- Kopp, E.; Sobral, M.; Soares, T.; Woerner, M. Os Solos do Algarve e as suas Características. Vista Geral; DGEA-DRAA-GTZ: Faro, Portugal, 1989; 173p. [Google Scholar]
- Rouse, J.W., Jr.; Haas, R.H.; Schell, J.A.; Deering, D.W. Monitoring the Vernal Advancement and Retrogradation (Green Wave Effect) of Natural Vegetation (No. NASA-CR-132982); NASA: Houston, TX, USA, 1973. [Google Scholar]
- Portugal Diário do Governo. Decreto-Lei N.º 44 647, de 26 de Outubro de 1962; I Série Ed; Imprensa Nacional: Lisboa, Portugal, 1962. [Google Scholar]
- Landis, J.R.; Koch, G.G. The measurement of observer agreement for categorical data. Biometrics 1977, 33, 159–174. [Google Scholar] [CrossRef] [PubMed]
- Lencastre, A.C.; Franco, F.M. Lições de Hidrologia, 3rd ed.; Fundação da Faculdade de Ciências e Tecnologia da Universidade Nova de Lisboa: Caparica, Portugal, 2010; ISBN 9789728152590. [Google Scholar]
- Agência Portuguesa do Ambiente (APA). River Basin Management Plan for the Algarve Region (RH8)—3rd Planning Cycle 2022–2027; Portuguese Environment Agency: Lisbon, Portugal, 2023; Available online: https://apambiente.pt/agua/3o-ciclo-de-planeamento-2022-2027 (accessed on 1 May 2025).
- Agência Portuguesa do Ambiente (APA). Atlas do Ambiente. Available online: https://sniambgeoogc.apambiente.pt/getogc/rest/services/Atlas/Atlas_Ambiente/MapServer (accessed on 30 July 2025).
- Sistema Nacional de Informação de Recursos Hídricos (SNIRH). Available online: https://snirh.apambiente.pt/index.php?idMain=2&idItem=1 (accessed on 30 July 2023).
- Allen, R.G.; Perei7ra, L.S.; Raes, D.; Smith, M. Crop Evapotranspiration—Guidelines for Computing Crop Water Requirements; FAO Irrigation and Drainage Paper 56; Food and Agriculture Organization of the United Nations: Rome, Italy, 1998; pp. 63–74. [Google Scholar]
- Município de São Brás de Alportel. Plano Diretor Municipal (PDM)—Áreas Urbanizáveis (Urbanizaveis_DGT_V2.jpg). Available online: https://cms.cm-sbras.pt//upload_files/client_id_1/website_id_1/servicos_mun/urbanismo/PDM/urbanizaveis_DGT_V2.jpg (accessed on 25 October 2025).
- Instituto da Conservação da Natureza e das Florestas (ICNF). Zonas Especiais de Conservação (ZEC)—Serviço WFS. Available online: https://sig.icnf.pt/portal/home/item.html?id=a158877a57eb4f5fbad767d36e261fab (accessed on 25 October 2025).
- Direção Regional de Agricultura e Pescas do Algarve (DRAPALG). Rede de Estações Meteorológicas Automáticas (EMA). Available online: https://www.drapalgarve.gov.pt/ema/ (accessed on 30 July 2023).
- Hernández-López, D.; Aznar-Sánchez, J.A.; Gallego-Elvira, B.; Maroto-Morales, A. Mapping irrigated orchards in semi-arid Spain using multi-temporal Sentinel-1/2 imagery and random forests. Remote Sens. Environ. 2024, 295, 113592. [Google Scholar] [CrossRef]
- Miranda Rodrigues, S.; Pereira, L.S.; Gonçalves, J.M. Evaporative losses from large reservoirs in Southern Europe: Current magnitude and future trends. J. Hydrol. 2020, 588, 125074. [Google Scholar] [CrossRef]
- Rodrigues, L.; Miranda, R.I.; Pereira, S.L. Climate-change impact on evaporative losses from small Mediterranean reservoirs under CMIP6 scenarios. J. Hydrol. 2024, 630, 129024. [Google Scholar]
- Montaldo, N.; Sarigu, A. Potential Links between the North Atlantic Oscillation and Decreasing Precipitation and Runoff on a Mediterranean Area. J. Hydrol. 2017, 553, 419–437. [Google Scholar] [CrossRef]
- Alyami, S.H.; Jamil, R.; Ghanim, A.A. Feasibility Assessment and Environmental Benefits of Developing Rainwater Retention Ponds Across Najran Valley. Arab. J. Sci. Eng. 2024, 49, 14055–14069. [Google Scholar] [CrossRef]
- Zhang, Y.; Gao, J.; Wang, X. Hydrological benefits of small-reservoir cascades in semi-arid regions. Water Resour. Manag. 2022, 36, 1321–1337. [Google Scholar]
- Ahmad, B.A.; Salar, S.G.; Shareef, A.J. An Integrated New Approach for Optimizing Rainwater Harvesting System with Dams Site Selection in the Dewana Watershed, Kurdistan Region, Iraq. Heliyon 2024, 10, e27273. [Google Scholar] [CrossRef] [PubMed]
- Ullah, S.; Iqbal, M.; Waseem, M.; Abbas, A.; Masood, M.; Nabi, G.; Tariq, M.A.U.R.; Sadam, M. Potential Sites for Rainwater Harvesting Focusing on the Sustainable Development Goals Using Remote Sensing and Geographical Information System. Sustainability 2024, 16, 9266. [Google Scholar] [CrossRef]
- Bufalini, M.; Caruso, B.; Rinaldi, M. Bathymetric assessment of sedimentation rates in Italian small reservoirs. Catena 2022, 213, 106114. [Google Scholar] [CrossRef]
Figure 1.
Boundary of the Municipality of São Brás de Alportel showing agricultural land use.
Figure 1.
Boundary of the Municipality of São Brás de Alportel showing agricultural land use.
Figure 2.
Hydrographic and Road Networks of the Municipality of São Brás de Alportel.
Figure 2.
Hydrographic and Road Networks of the Municipality of São Brás de Alportel.
Figure 3.
Mean annual runoff derived from [
23].
Figure 3.
Mean annual runoff derived from [
23].
Figure 4.
Curves of minimum usable reservoir volume per km2 of upstream catchment area at the reservoir location for the average and dry years.
Figure 4.
Curves of minimum usable reservoir volume per km2 of upstream catchment area at the reservoir location for the average and dry years.
Figure 5.
Methodology for Selecting Sites for the Construction of a New Reservoir.
Figure 5.
Methodology for Selecting Sites for the Construction of a New Reservoir.
Figure 6.
Decision criterion for constructing a second downstream reservoir.
Figure 6.
Decision criterion for constructing a second downstream reservoir.
Figure 8.
Map of Irrigated and Rainfed Areas.
Figure 8.
Map of Irrigated and Rainfed Areas.
Figure 9.
DEM of the Study Area.
Figure 9.
DEM of the Study Area.
Figure 10.
Drainage network and corresponding catchments for a flow-accumulation threshold of 160 cells.
Figure 10.
Drainage network and corresponding catchments for a flow-accumulation threshold of 160 cells.
Figure 11.
Stream network and corresponding catchments for a flow-accumulation threshold of 160 cells, classified according to the Strahler method.
Figure 11.
Stream network and corresponding catchments for a flow-accumulation threshold of 160 cells, classified according to the Strahler method.
Figure 12.
Map of downstream water-flow directions.
Figure 12.
Map of downstream water-flow directions.
Figure 13.
Overlay map showing catchment basins and watercourses together with roads and high-voltage power lines.
Figure 13.
Overlay map showing catchment basins and watercourses together with roads and high-voltage power lines.
Figure 14.
Overlay map showing watercourses and possible reservoir locations with positive (green), negative (red) annual water balance and positive (orange) with construction restrictions.
Figure 14.
Overlay map showing watercourses and possible reservoir locations with positive (green), negative (red) annual water balance and positive (orange) with construction restrictions.
Figure 15.
Preferred locations along the Alportel, Mercês, and Gaifona streams for the construction of dam embankments.
Figure 15.
Preferred locations along the Alportel, Mercês, and Gaifona streams for the construction of dam embankments.
Figure 16.
Location of the reservoirs in the Ribeiras of Alportel, Mercês, and Gaifona, and downstream the irrigated agricultural parcels (in green) and rainfed parcels (in orange).
Figure 16.
Location of the reservoirs in the Ribeiras of Alportel, Mercês, and Gaifona, and downstream the irrigated agricultural parcels (in green) and rainfed parcels (in orange).
Figure 17.
Stage–volume curves for the reservoirs.
Figure 17.
Stage–volume curves for the reservoirs.
Figure 18.
Monthly water balance values for the four reservoirs in the average year: (a) Gaifona; (b) Mercês 1 (upstream reservoir); (c) Alportel; (d) Mercês 2 (downstream reservoir).
Figure 18.
Monthly water balance values for the four reservoirs in the average year: (a) Gaifona; (b) Mercês 1 (upstream reservoir); (c) Alportel; (d) Mercês 2 (downstream reservoir).
Figure 19.
Key results from the monthly hydrological balance for the four reservoirs in the average year: (a) Stored volume curves for the reservoirs and (b) Reservoir spill discharges.
Figure 19.
Key results from the monthly hydrological balance for the four reservoirs in the average year: (a) Stored volume curves for the reservoirs and (b) Reservoir spill discharges.
Figure 20.
Monthly water balance values for the four reservoirs in the dry year: (a) Gaifona; (b) Mercês 1 (upstream reservoir); (c) Alportel; (d) Mercês 2 (downstream reservoir).
Figure 20.
Monthly water balance values for the four reservoirs in the dry year: (a) Gaifona; (b) Mercês 1 (upstream reservoir); (c) Alportel; (d) Mercês 2 (downstream reservoir).
Figure 21.
Key results from the monthly hydrological balance for the four reservoirs in the dry year: (a) Stored volume curves for the reservoirs and (b) Reservoir spill discharges.
Figure 21.
Key results from the monthly hydrological balance for the four reservoirs in the dry year: (a) Stored volume curves for the reservoirs and (b) Reservoir spill discharges.
Table 1.
Cohen’s Kappa classification Accuracy.
Table 1.
Cohen’s Kappa classification Accuracy.
| k (%) | Classification Accuracy |
|---|
| <0 | Poor |
| [0; 20[ | Slight |
| [20; 40[ | Fair |
| [40; 60[ | Moderate |
| [60; 80[ | Substantial |
| [80; 100] | Almost perfect |
Table 2.
Summary of datasets used in this study.
Table 2.
Summary of datasets used in this study.
| Dataset/Source | Data Type | Spatial Resolution | Temporal Coverage/Year | Notes |
|---|
| COS 2018-DGT | Vector | 1:25,000 (~5 m) | 2018 | Delineation of agricultural areas |
| Cadastral Survey 2019-DGT | Vector | 1:10,000 (~2 m) | 2019 | Parcels and property boundaries |
| Topographic Base Map 2020-SBAMC | Vector | 1:10,000 (~2 m) | 2020 | Municipal boundaries, roads, rivers |
| RGB Ortophotos July 2021-SBAMC | Raster | 25 cm | July 2021 | Refinement of polygons, removal of dwellings, swimming pools, and other structures |
| Sentinel 2-GEE | Raster | 10 m (Red and NIR bands) | June-September 2021 | Multi-temporal imagery used for NDVI calculation, cloud cover <10% |
| Field Validation Points | Vector | GNSS-RTK (Multifrecuencia): <2 cm + 1 ppm | September | 100 points for the confusion matrix |
Table 3.
Monthly natural runoff (R) values for the Arade subbasin in mm for the average year and dry year [
22].
Table 3.
Monthly natural runoff (R) values for the Arade subbasin in mm for the average year and dry year [
22].
| | Oct | Nov | Dec | Jan | Feb | Mar | Apr | May | Jun | Jul | Aug | Sep |
|---|
| Average | 18.4 | 32.7 | 50.1 | 46.0 | 35.8 | 29.6 | 14.3 | 7.2 | 2.0 | 1.0 | 1.0 | 2.0 |
| Dry | 1.0 | 3.1 | 5.1 | 6.1 | 6.1 | 4.1 | 4.1 | 2.0 | 1.0 | 0.5 | 0.2 | 0.2 |
Table 4.
Mean monthly pan evaporation in mm [
24].
Table 4.
Mean monthly pan evaporation in mm [
24].
| Oct | Nov | Dec | Jan | Feb | Mar | Apr | May | Jun | Jul | Aug | Sep |
|---|
| 106.0 | 61.6 | 58.1 | 45.8 | 57.3 | 102.5 | 113.3 | 149.1 | 202.4 | 257.5 | 232.6 | 163.4 |
Table 5.
Monthly reference-evapotranspiration data expressed as the mean of monthly records from APA [
22] for the period 1930–2015, in mm.
Table 5.
Monthly reference-evapotranspiration data expressed as the mean of monthly records from APA [
22] for the period 1930–2015, in mm.
| Oct | Nov | Dec | Jan | Feb | Mar | Apr | May | Jun | Jul | Aug | Sep |
|---|
| 83.0 | 49.0 | 39.0 | 43.0 | 52.0 | 87.0 | 100.0 | 137.0 | 163.0 | 185.0 | 168.0 | 123.0 |
Table 6.
Crop coefficients [
2].
Table 6.
Crop coefficients [
2].
| | Oct | Nov | Dec | Jan | Feb | Mar | Apr | May | Jun | Jul | Aug | Sep |
|---|
| Citr. | 0.67 | 0.67 | 0.76 | 0.72 | 0.72 | 0.66 | 0.67 | 0.66 | 0.67 | 0.66 | 0.66 | 0.66 |
| Oliv. | 0.68 | 0.78 | 0.64 | 0.62 | 0.62 | 0.65 | 0.61 | 0.56 | 0.55 | 0.54 | 0.54 | 0.57 |
| Vin. | 0.45 | 0 | 0 | 0 | 0 | 0.25 | 0.45 | 0.6 | 0.7 | 0.7 | 0.85 | 0.55 |
Table 7.
Confusion Matrix.
Table 7.
Confusion Matrix.
| Classified Areas | Reference Areas |
|---|
| Irrigated | Rainfed | Total |
|---|
| Irrigated | 8 | 2 | 10 |
| Rainfed | 0 | 90 | 90 |
| Total | 8 | 92 | 100 |
| Omission error, % | 0.0 | 2.2 | |
| Commission error, % | 20.0 | 0.0 |
| User’s accuracy, % | 80.0 | 100.0 |
| Producer’s accuracy, % | 100 | 97.8 |
| Overall accuracy, % | 98.0 |
| Kappa index, % | 88.0 |
Table 8.
Catchment-area values and upstream catchment areas at the reservoir dam sites.
Table 8.
Catchment-area values and upstream catchment areas at the reservoir dam sites.
| Catchment | Catchment Area (m2) | Dam-Site Name | Catchment Area at the Dam Site (m2) |
|---|
| Ribeira da Gaifona | 14,115,200 | G | 8,656,758 |
| Ribeira das Mercês | 15,790,500 | M1 | 9,598,495 |
| Ribeira de Alportel | 27,734,200 | A | 8,317,464 |
Table 9.
Crop areas supplied by the reservoirs, minimum usable volumes and total adopted volumes.
Table 9.
Crop areas supplied by the reservoirs, minimum usable volumes and total adopted volumes.
| Crop | Reservoir |
|---|
| Gaifona | Mercês 1 | Mercês 2 | Alportel |
|---|
| Vineyard (m2) | 0 | 0 | 0 | 0 |
| Vegetable garden (m2) | 107,140 | 0 | 0 | 605,800 |
| Olive grove (m2) | 67,600 | 43,481 | 19,514 | 1,734,260 |
| Orchard (m2) | 931,080 | 105,991 | 0 | 91,710 |
| Ar (m2) | 1,105,820 | 149,472 | 19,514 | 2,431,770 |
| Parameter | Reservoir |
| Gaifona | Mercês 1 | Mercês 2 | Alportel |
| Ab (km2) | 8.657 | 9.598 | 6.151 | 8.317 |
| Ar (km2) | 0.1106 | 0.1495 | 0.1951 | 0.2560 |
| Kc | 0.71 | 0.66 | 0.61 | 0.72 |
| k = Ab/Ar | 78 | 64 | 315 | 32 |
| Vol./km2 | 2753 | 4238 | 1200 | 14,600 |
| Reserv. Min. Vol. (m3) | 23,832 | 40,678 | 7381 | 121,435 |
| Reserv. Vol. (m3) | 95,288 | 81,703 | 70,510 | 180,504 |
Table 10.
Water balance of the Ribeira da Gaifona for the average year.
Table 10.
Water balance of the Ribeira da Gaifona for the average year.
| (1) | (2) | (3) | (4) | (5) | (6) | (7) | (8) | (9) | (10) | (11) | (12) | (13) | (14) |
|---|
| | | | | | | | | | | 0 | 0 | 0 | 0 |
| Oct | 18.4 | 83 | 0.71 | 59 | 106.0 | 2144 | 6493 | 159,164 | 8637 | 150,527 | 150,527 | 95,288 | 55,238 |
| Nov | 32.7 | 49 | 0.71 | 35 | 61.6 | 1247 | 3866 | 282,958 | 5114 | 277,845 | 373,133 | 95,288 | 277,845 |
| Dec | 50.1 | 39 | 0.70 | 27 | 58.1 | 1176 | 3040 | 433,280 | 4216 | 429,064 | 524,352 | 95,288 | 429,064 |
| Jan | 46 | 43 | 0.75 | 32 | 45.8 | 927 | 3547 | 397,910 | 4473 | 393,437 | 488,725 | 95,288 | 393,437 |
| Feb | 35.8 | 52 | 0.75 | 39 | 57.3 | 1160 | 4289 | 309,486 | 5449 | 304,037 | 399,325 | 95,288 | 304,037 |
| Mar | 29.6 | 87 | 0.70 | 61 | 102.5 | 2075 | 6707 | 256,431 | 8782 | 247,649 | 342,937 | 95,288 | 247,649 |
| Apr | 14.3 | 100 | 0.70 | 70 | 113.3 | 2293 | 7776 | 123,794 | 10,069 | 113,725 | 209,014 | 95,288 | 113,725 |
| May | 7.15 | 137 | 0.69 | 95 | 149.1 | 3017 | 10,479 | 61,897 | 13,495 | 48,402 | 143,690 | 95,288 | 48,402 |
| Jun | 2.04 | 163 | 0.70 | 114 | 202.4 | 4097 | 12,608 | 17,685 | 16,705 | 980 | 96,268 | 95,288 | 980 |
| Jul | 1.02 | 185 | 0.69 | 128 | 257.5 | 5211 | 14,125 | 8842 | 19,336 | −10,494 | 84,795 | 84,795 | 0 |
| Aug | 1.02 | 168 | 0.69 | 116 | 232.6 | 4707 | 12,827 | 8842 | 17,534 | −8692 | 76,103 | 76,103 | 0 |
| Sep | 2.04 | 123 | 0.69 | 85 | 163.4 | 3306 | 9416 | 17,685 | 12,722 | 4963 | 81,066 | 81,066 | 0 |
Table 11.
Water balance of the Ribeira das Mercês (upstream reservoir) for the average year.
Table 11.
Water balance of the Ribeira das Mercês (upstream reservoir) for the average year.
| (1) | (2) | (3) | (4) | (5) | (6) | (7) | (8) | (9) | (10) | (11) | (12) | (13) | (14) |
|---|
| | | | | | | | | | | 0 | 0 | 0 | 0 |
| Oct | 1.0 | 83 | 0.67 | 56 | 106 | 912 | 8348 | 9804 | 9261 | 544 | 544 | 544 | 0 |
| Nov | 3.1 | 49 | 0.70 | 34 | 62 | 531 | 5142 | 29,413 | 5672 | 23,741 | 24,285 | 24,285 | 0 |
| Dec | 5.1 | 39 | 0.66 | 26 | 58 | 500 | 3855 | 49,022 | 4355 | 44,667 | 68,951 | 68,951 | 0 |
| Jan | 6.1 | 43 | 0.69 | 30 | 46 | 394 | 4441 | 58,826 | 4835 | 53,991 | 122,943 | 81,703 | 41,239 |
| Feb | 6.1 | 52 | 0.69 | 36 | 57 | 494 | 5370 | 58,826 | 5864 | 52,963 | 134,666 | 81,703 | 52,963 |
| Mar | 4.1 | 87 | 0.66 | 57 | 103 | 883 | 8545 | 39,218 | 9428 | 29,790 | 111,493 | 81,703 | 29,790 |
| Apr | 4.1 | 100 | 0.65 | 65 | 113 | 976 | 9754 | 39,218 | 10,729 | 28,488 | 110,192 | 81,703 | 28,488 |
| May | 2.0 | 137 | 0.63 | 86 | 149 | 1284 | 12,920 | 19,609 | 14,203 | 5406 | 87,109 | 81,703 | 5406 |
| Jun | 1.0 | 163 | 0.64 | 104 | 202 | 1743 | 15,473 | 9804 | 17,216 | −7412 | 74,291 | 74,291 | 0 |
| Jul | 0.5 | 185 | 0.63 | 116 | 258 | 2217 | 17,285 | 4902 | 19,502 | −14,600 | 59,691 | 59,691 | 0 |
| Aug | 0.2 | 168 | 0.63 | 105 | 233 | 2003 | 15,697 | 1961 | 17,700 | −15,739 | 43,952 | 43,952 | 0 |
| Sep | 0.2 | 123 | 0.63 | 78 | 163 | 1407 | 11,653 | 1920 | 13,059 | −11,140 | 32,813 | 32,813 | 0 |
Table 12.
Water balance of the Ribeira do Alportel for the average year.
Table 12.
Water balance of the Ribeira do Alportel for the average year.
| (1) | (2) | (3) | (4) | (5) | (6) | (7) | (8) | (9) | (10) | (11) | (12) | (13) | (14) |
|---|
| | | | | | | | | | | 0 | 0 | 0 | 0 |
| Oct | 18.4 | 83 | 0.77 | 64 | 106 | 3002 | 16,400 | 152,926 | 19,402 | 133,524 | 133,524 | 133,524 | 0 |
| Nov | 32.7 | 49 | 0.84 | 41 | 62 | 1746 | 10,577 | 271,868 | 12,323 | 259,545 | 393,069 | 180,504 | 212,565 |
| Dec | 50.1 | 39 | 0.74 | 29 | 58 | 1646 | 7421 | 416,298 | 9067 | 407,231 | 587,735 | 180,504 | 407,231 |
| Jan | 46.0 | 43 | 0.73 | 31 | 46 | 1297 | 8046 | 382,314 | 9343 | 372,971 | 553,475 | 180,504 | 372,971 |
| Feb | 35.8 | 52 | 0.73 | 38 | 57 | 1624 | 9730 | 297,356 | 11,354 | 286,002 | 466,506 | 180,504 | 286,002 |
| Mar | 29.6 | 87 | 0.75 | 65 | 103 | 2905 | 16,705 | 246,380 | 19,610 | 226,770 | 407,274 | 180,504 | 226,770 |
| Apr | 14.3 | 100 | 0.72 | 72 | 113 | 3210 | 18,481 | 118,942 | 21,691 | 97,251 | 277,755 | 180,504 | 97,251 |
| May | 7.2 | 137 | 0.69 | 94 | 149 | 4223 | 24,055 | 59,471 | 28,278 | 31,193 | 211,697 | 180,504 | 31,193 |
| Jun | 2.0 | 163 | 0.68 | 111 | 202 | 5735 | 28,338 | 16,992 | 34,073 | −17,081 | 163,423 | 163,423 | 0 |
| Jul | 1.0 | 185 | 0.67 | 124 | 258 | 7294 | 31,808 | 8496 | 39,102 | −30,606 | 132,817 | 132,817 | 0 |
| Aug | 1.0 | 168 | 0.67 | 113 | 233 | 6589 | 28,885 | 8496 | 35,474 | −26,978 | 105,839 | 105,839 | 0 |
| Sep | 2.0 | 123 | 0.69 | 85 | 163 | 4628 | 21,821 | 16,992 | 26,449 | −9457 | 96,381 | 96,381 | 0 |
Table 13.
Water balance of the Ribeira das Mercês (downstream reservoir) for the average year.
Table 13.
Water balance of the Ribeira das Mercês (downstream reservoir) for the average year.
| (1) | (2) | (3) | (4) | (5) | (6) | (7) | (8) | (9) | (10) | (11) | (12) | (13) | (14) | (15) |
|---|
| | | | | | | | | | | | 0 | 0 | 0 | 0 |
| Oct | 18.4 | 83 | 0.68 | 56 | 85,515 | 106.0 | 2749 | 1101 | 198,606 | 3850 | 194,755 | 194,755 | 70,510 | 124,245 |
| Nov | 32.7 | 49 | 0.78 | 38 | 308,068 | 61.6 | 1599 | 746 | 509,119 | 2345 | 506,774 | 577,284 | 70,510 | 506,774 |
| Dec | 50.1 | 39 | 0.64 | 25 | 476,060 | 58.1 | 1508 | 487 | 783,918 | 1995 | 781,924 | 852,434 | 70,510 | 781,924 |
| Jan | 46 | 43 | 0.62 | 27 | 436,362 | 45.8 | 1188 | 520 | 719,089 | 1708 | 717,381 | 787,891 | 70,510 | 717,381 |
| Feb | 35.8 | 52 | 0.62 | 32 | 337,290 | 57.3 | 1487 | 629 | 557,189 | 2116 | 555,073 | 625,583 | 70,510 | 555,073 |
| Mar | 29.6 | 87 | 0.65 | 57 | 274,899 | 102.5 | 2660 | 1104 | 457,101 | 3764 | 453,338 | 523,848 | 70,510 | 453,338 |
| Apr | 14.3 | 100 | 0.61 | 61 | 126,532 | 113.3 | 2940 | 1190 | 214,491 | 4130 | 210,361 | 280,871 | 70,510 | 210,361 |
| May | 7.15 | 137 | 0.56 | 77 | 54,428 | 149.1 | 3867 | 1497 | 98,407 | 5365 | 93,043 | 163,553 | 70,510 | 93,043 |
| Jun | 2.04 | 163 | 0.55 | 90 | 2392 | 202.4 | 5252 | 1749 | 14,958 | 7001 | 7957 | 78,467 | 70,510 | 7957 |
| Jul | 1.02 | 185 | 0.54 | 100 | 0 | 257.5 | 6680 | 1949 | 6283 | 8630 | −2347 | 68,163 | 68,163 | 0 |
| Aug | 1.02 | 168 | 0.54 | 91 | 0 | 232.6 | 6035 | 1770 | 6283 | 7805 | −1522 | 66,641 | 66,641 | 0 |
| Sep | 2.04 | 123 | 0.57 | 70 | 0 | 163.4 | 4238 | 1368 | 12,566 | 5606 | 6959 | 73,600 | 70,510 | 3090 |
Table 14.
Water balance of the Ribeira da Gaifona reservoir for the dry year.
Table 14.
Water balance of the Ribeira da Gaifona reservoir for the dry year.
| (1) | (2) | (3) | (4) | (5) | (6) | (7) | (8) | (9) | (10) | (11) | (12) | (13) | (14) |
|---|
| | | | | | | | | | | 0 | 0 | 0 | 0 |
| Oct | 1.0 | 83 | 0.71 | 59 | 106.0 | 2144 | 6493 | 8842 | 8637 | 205 | 205 | 205 | 0 |
| Nov | 3.1 | 49 | 0.71 | 35 | 61.6 | 1247 | 3866 | 26,527 | 5114 | 21,414 | 21,619 | 21,619 | 0 |
| Dec | 5.1 | 39 | 0.70 | 27 | 58.1 | 1176 | 3040 | 44,212 | 4216 | 39,996 | 61,615 | 61,615 | 0 |
| Jan | 6.1 | 43 | 0.75 | 32 | 45.8 | 927 | 3547 | 53,055 | 4473 | 48,581 | 110,196 | 95,288 | 14,908 |
| Feb | 6.1 | 52 | 0.75 | 39 | 57.3 | 1160 | 4289 | 53,055 | 5449 | 47,606 | 142,894 | 95,288 | 47,606 |
| Mar | 4.1 | 87 | 0.70 | 61 | 102.5 | 2075 | 6707 | 35,370 | 8782 | 26,587 | 121,876 | 95,288 | 26,587 |
| Apr | 4.1 | 100 | 0.70 | 70 | 113.3 | 2293 | 7776 | 35,370 | 10,069 | 25,301 | 120,589 | 95,288 | 25,301 |
| May | 2.0 | 137 | 0.69 | 95 | 149.1 | 3017 | 10,479 | 17,685 | 13,495 | 4189 | 99,478 | 95,288 | 4189 |
| Jun | 1.0 | 163 | 0.70 | 114 | 202.4 | 4097 | 12,608 | 8842 | 16,705 | −7862 | 87,426 | 87,426 | 0 |
| Jul | 0.5 | 185 | 0.69 | 128 | 257.5 | 5211 | 14,125 | 4421 | 19,336 | −14,915 | 72,511 | 72,511 | 0 |
| Aug | 0.2 | 168 | 0.69 | 116 | 232.6 | 4707 | 12,827 | 1768 | 17,534 | −15,766 | 56,745 | 56,745 | 0 |
| Sep | 0.2 | 123 | 0.69 | 85 | 163.4 | 3306 | 9416 | 1731 | 12,722 | −10,991 | 45,755 | 45,755 | 0 |
Table 15.
Water balance of the Ribeira das Mercês upstream reservoir for the dry year.
Table 15.
Water balance of the Ribeira das Mercês upstream reservoir for the dry year.
| (1) | (2) | (3) | (4) | (5) | (6) | (7) | (8) | (9) | (10) | (11) | (12) | (13) | (14) |
|---|
| | | | | | | | | | | 0 | 0 | 0 | 0 |
| Oct | 1.0 | 83 | 0.67 | 56 | 106 | 912 | 8348 | 9804 | 9261 | 544 | 544 | 544 | 0 |
| Nov | 3.1 | 49 | 0.70 | 34 | 62 | 531 | 5142 | 29,413 | 5672 | 23,741 | 24,285 | 24,285 | 0 |
| Dec | 5.1 | 39 | 0.66 | 26 | 58 | 500 | 3855 | 49,022 | 4355 | 44,667 | 68,951 | 68,951 | 0 |
| Jan | 6.1 | 43 | 0.69 | 30 | 46 | 394 | 4441 | 58,826 | 4835 | 53,991 | 122,943 | 81,703 | 41,239 |
| Feb | 6.1 | 52 | 0.69 | 36 | 57 | 494 | 5370 | 58,826 | 5864 | 52,963 | 134,666 | 81,703 | 52,963 |
| Mar | 4.1 | 87 | 0.66 | 57 | 103 | 883 | 8545 | 39,218 | 9428 | 29,790 | 111,493 | 81,703 | 29,790 |
| Apr | 4.1 | 100 | 0.65 | 65 | 113 | 976 | 9754 | 39,218 | 10,729 | 28,488 | 110,192 | 81,703 | 28,488 |
| May | 2.0 | 137 | 0.63 | 86 | 149 | 1284 | 12,920 | 19,609 | 14,203 | 5406 | 87,109 | 81,703 | 5406 |
| Jun | 1.0 | 163 | 0.64 | 104 | 202 | 1743 | 15,473 | 9804 | 17,216 | −7412 | 74,291 | 74,291 | 0 |
| Jul | 0.5 | 185 | 0.63 | 116 | 258 | 2217 | 17,285 | 4902 | 19,502 | −14,600 | 59,691 | 59,691 | 0 |
| Aug | 0.2 | 168 | 0.63 | 105 | 233 | 2003 | 15,697 | 1961 | 17,700 | −15,739 | 43,952 | 43,952 | 0 |
| Sep | 0.2 | 123 | 0.63 | 78 | 163 | 1407 | 11,653 | 1920 | 13,059 | −11,140 | 32,813 | 32,813 | 0 |
Table 16.
Water balance of the Ribeira do Alportel reservoir for the dry year.
Table 16.
Water balance of the Ribeira do Alportel reservoir for the dry year.
| (1) | (2) | (3) | (4) | (5) | (6) | (7) | (8) | (9) | (10) | (11) | (12) | (13) | (14) |
|---|
| | | | | | | | | | | 0 | 0 | 0 | 0 |
| Oct | 1.0 | 83 | 0.77 | 64 | 106 | 3002 | 16,400 | 8496 | 19,402 | −10,906 | −10,906 | 0 | 0 |
| Nov | 3.1 | 49 | 0.84 | 41 | 62 | 1746 | 10,577 | 25,488 | 12,323 | 13,165 | 13,165 | 13,165 | 0 |
| Dec | 5.1 | 39 | 0.74 | 29 | 58 | 1646 | 7421 | 42,479 | 9067 | 33,412 | 46,577 | 46,577 | 0 |
| Jan | 6.1 | 43 | 0.73 | 31 | 46 | 1297 | 8046 | 50,975 | 9343 | 41,632 | 88,209 | 88,209 | 0 |
| Feb | 6.1 | 52 | 0.73 | 38 | 57 | 1624 | 9730 | 50,975 | 11,354 | 39,621 | 127,830 | 127,830 | 0 |
| Mar | 4.1 | 87 | 0.75 | 65 | 103 | 2905 | 16,705 | 33,984 | 19,610 | 14,373 | 142,203 | 142,203 | 0 |
| Apr | 4.1 | 100 | 0.72 | 72 | 113 | 3210 | 18,481 | 33,984 | 21,691 | 12,292 | 154,496 | 154,496 | 0 |
| May | 2.0 | 137 | 0.69 | 94 | 149 | 4223 | 24,055 | 16,992 | 28,278 | −11,286 | 143,209 | 143,209 | 0 |
| Jun | 1.0 | 163 | 0.68 | 111 | 202 | 5735 | 28,338 | 8496 | 34,073 | −25,577 | 117,632 | 117,632 | 0 |
| Jul | 0.5 | 185 | 0.67 | 124 | 258 | 7294 | 31,808 | 4248 | 39,102 | −34,854 | 82,778 | 82,778 | 0 |
| Aug | 0.2 | 168 | 0.67 | 113 | 233 | 6589 | 28,885 | 1699 | 35,474 | −33,775 | 49,003 | 49,003 | 0 |
| Sep | 0.2 | 123 | 0.69 | 85 | 163 | 4628 | 21,821 | 1663 | 26,449 | −24,786 | 24,217 | 24,217 | 0 |
Table 17.
Water balance of the Ribeira das Mercês downstream reservoir for the dry year.
Table 17.
Water balance of the Ribeira das Mercês downstream reservoir for the dry year.
| (1) | (2) | (3) | (4) | (5) | (6) | (7) | (8) | (9) | (10) | (11) | (12) | (13) | (14) | (15) |
|---|
| | | | | | | | | | | | 0 | 0 | 0 | 0 |
| Oct | 1.02 | 83 | 0.68 | 56 | 0 | 106.0 | 2749 | 1101 | 6283 | 3850 | 2432 | 2432 | 2432 | 0 |
| Nov | 3.06 | 49 | 0.78 | 38 | 0 | 61.6 | 1599 | 746 | 18,848 | 2345 | 16,504 | 18,936 | 18,936 | 0 |
| Dec | 5.11 | 39 | 0.64 | 25 | 41,239 | 58.1 | 1508 | 487 | 72,653 | 1995 | 70,659 | 89,595 | 70,510 | 19,085 |
| Jan | 6.13 | 43 | 0.62 | 27 | 52,963 | 45.8 | 1188 | 520 | 90,660 | 1708 | 88,951 | 159,461 | 70,510 | 88,951 |
| Feb | 6.13 | 52 | 0.62 | 32 | 29,790 | 57.3 | 1487 | 629 | 67,487 | 2116 | 65,371 | 135,881 | 70,510 | 65,371 |
| Mar | 4.09 | 87 | 0.65 | 57 | 28,488 | 102.5 | 2660 | 1104 | 53,619 | 3764 | 49,856 | 120,366 | 70,510 | 49,856 |
| Apr | 4.09 | 100 | 0.61 | 61 | 5406 | 113.3 | 2940 | 1190 | 30,537 | 4130 | 26,407 | 96,917 | 70,510 | 26,407 |
| May | 2.04 | 137 | 0.56 | 77 | 0 | 149.1 | 3867 | 1497 | 12,566 | 5365 | 7201 | 77,711 | 70,510 | 7201 |
| Jun | 1.02 | 163 | 0.55 | 90 | 0 | 202.4 | 5252 | 1749 | 6283 | 7001 | −718 | 69,792 | 69,792 | 0 |
| Jul | 0.51 | 185 | 0.54 | 100 | 0 | 257.5 | 6680 | 1949 | 3141 | 8630 | −5488 | 64,303 | 64,303 | 0 |
| Aug | 0.2 | 168 | 0.54 | 91 | 0 | 232.6 | 6035 | 1770 | 1257 | 7805 | −6548 | 57,755 | 57,755 | 0 |
| Sep | 0.2 | 123 | 0.57 | 70 | 0 | 163.4 | 4238 | 1368 | 1230 | 5606 | −4376 | 53,379 | 53,379 | 0 |
| Disclaimer/Publisher’s Note: The statements, opinions and data contained in all publications are solely those of the individual author(s) and contributor(s) and not of MDPI and/or the editor(s). MDPI and/or the editor(s) disclaim responsibility for any injury to people or property resulting from any ideas, methods, instructions or products referred to in the content. |
© 2025 by the authors. Licensee MDPI, Basel, Switzerland. This article is an open access article distributed under the terms and conditions of the Creative Commons Attribution (CC BY) license (https://creativecommons.org/licenses/by/4.0/).
