Article

Collaborative Low-Carbon Scheduling Strategy for Microgrid Groups Based on Green Certificate Incentives and Energy Demand Response

1
School of Automation and Electrical Engineering, Zhongyuan University of Technology, Zhengzhou 450007, China
2
School of Electrical Engineering, Yanshan University, Qinhuangdao 066004, China
3
School of Mechatronic Engineering and Automation, Shanghai University, Shanghai 200072, China
*
Author to whom correspondence should be addressed.
Sustainability 2025, 17(22), 10274; https://doi.org/10.3390/su172210274
Submission received: 22 September 2025 / Revised: 6 November 2025 / Accepted: 7 November 2025 / Published: 17 November 2025

Abstract

The multi-microgrid integrated energy system (MM-IES) plays a vital role in enhancing energy utilization efficiency and promoting the coordinated consumption of renewable energy. However, the realization of low-carbon dispatch in MM-IES is hindered by multi-energy coupling and the need for distributed coordination under increasingly stringent carbon emission constraints. To address these issues, a distributed scheduling strategy that integrates demand response and green certificate trading mechanisms is proposed. Firstly, a low-carbon integrated energy microgrid (IEM) model integrating carbon capture and storage (CCS) and power-to-gas (P2G) technologies is proposed to improve the system’s low-carbon regulation capability and mitigate the impact of multi-energy coupling in MM-IES. This integration enhances the system’s low-carbon regulation capability. Secondly, to incentivize user participation in system optimization, a demand response mechanism and a tiered green certificate trading model are introduced. On this basis, an MM-IES low-carbon economic dispatch model is established with the goal of minimizing total operating costs, carbon trading costs, and green certificate trading costs. To further protect the privacy of each microgrid and achieve efficient coordination, distributed algorithms are used to solve the model. This method only requires exchanging boundary information to achieve collaborative optimization between microgrids. Finally, the simulation results indicate that the proposed strategy can effectively reduce system operating costs and carbon emissions. Furthermore, the effectiveness of demand response and green certificate trading in promoting low-carbon economic operation of multi microgrid systems is verified.

1. Introduction

In the context of carbon neutrality and frequent energy supply changes, the integrated energy system (IES) enhances energy efficiency by coupling electricity, natural gas, and heat networks, thereby facilitating the achievement of net zero emissions and ensuring the economical of energy systems [1,2]. With the rapid development of IES, the integrated energy microgrid (IEM), particularly the combined heat and power (CHP) microgrid, has also been rapidly developed and widely adopted. A method for the energy optimized operation and management of CHP systems is proposed to reduce both carbon emissions and operational costs [3].
To achieve the carbon peak and carbon neutrality goals, the low-carbon transformation of the IEM is imminent. Currently, extensive research on the low-carbon dispatching and operation of power systems has been conducted by both domestic and international scholars. The application of carbon capture and storage (CCS) and power-to-gas (P2G) in the power industry can not only more effectively reduce the system’s carbon emissions, but also improve energy utilization efficiency. Therefore, installing carbon capture devices in conventional units will become a future development trend. A low-carbon optimal model of the CCS is proposed to reduce carbon emissions [4]. A low-carbon planning framework for multi-energy systems and CCS is proposed to improve energy utilization efficiency [5]. Moreover, carbon trading and green certificate trading mechanisms offer novel approaches to enhance renewable energy generation and consumption while reducing carbon emissions [6]. A low-carbon economic dispatch model is proposed to address the challenge of optimizing power generation [7]. The model analyzes CCS and demand response mechanisms and incorporates carbon trading costs into the objective function, aiming to minimize emissions and operating costs. A step-by-step carbon trading mechanism is proposed to carbon price set according to emission ranges, thereby further restricting the system carbon emissions [8,9]. Moreover, a multi-objective dynamic economic emission dispatch model based on a tradable green certificate trading mechanism for wind-solar-hydro power is proposed to promote renewable energy development and consumption [10]. A peer-to-peer joint power and renewable energy certificate trading method is proposed to enhance renewable energy generation and reduce carbon emissions [11]. Therefore, it is necessary to introduce carbon trading and green certificate trading mechanisms into the IEM system. User-side demand response, as a flexible adjustment method participating in system optimization and dispatch, can achieve peak load shaving, improve renewable energy consumption capacity, and reduce system operating costs [12]. A virtual power plant optimization dispatch model is proposed to incorporate demand response resources and participates in carbon emission rights trading, thereby enhancing the system’s power supply reliability and carbon emission reduction [13]. The conventional power energy demand response will gradually evolve into integrated demand response under the network architecture of the IES. By adjusting different energy demands, the demands between multiple loads can be realized on the user side [14]. An incentive-based integrated demand response model is proposed to improve energy utilization [15]. A linearized ID optimization model is proposed to address the integration of electricity and natural gas demand response [16]. The results indicate that integrated demand response provides distinct advantages over single power demand response in terms of cost efficiency, environmental impact, and energy utilization.
However, with the growing demand for electricity and advances in distributed energy technologies, single microgrids now face shortcomings, such as insufficient anti-interference ability, energy shortages, and is unable to meet complex system dispatch goals. To address these challenges, the adjacent microgrids are established into a multi-microgrid system to achieve energy complementarity and sharing, thereby improving the reliability and stability of the overall power supply [17]. Moreover, a hierarchical market structure is proposed to enable multiple microgrids to participate in the real-time balancing market at the transmission level and provide auxiliary services to the power grid [18]. At the distribution level, local microgrids with distributed sustainable resources are economically dispatched by the distribution system operator. A particle swarm optimization algorithm is proposed to solve a multi-microgrid system, which aims to minimize the total operating cost [19].
Although the centralized optimization method discussed in the aforementioned references has yielded notable results in the energy management and dispatch of multi-microgrids, it also presents several challenges that cannot be overlooked. Centralized optimization requires extensive communication infrastructure to support information collection and instruction issuance, which may also cause information security and privacy protection issues. Moreover, centralized optimization algorithms require accurate modeling of the entire system. So the uncertainty and volatility of wind and solar power generation will increase the complexity and difficulty of solving the model. In contrast, distributed optimization algorithms are more flexible, efficient, and convenient. A distributed dynamic event-triggered optimization algorithm is proposed to reduce the consumption of communication resources [20]. A analytical target cascade method is proposed to provide a fully distributed framework for power dispatch in multi-microgrid systems [21]. A stakeholder parallel distributed scheme of the analytical target cascade method is proposed for dispatching hybrid AC/DC multi-microgrids [22]. In recent years, the Alternating Direction Method of Multipliers (ADMM) has gained widespread attention for its application in power system energy management. A model, which uses ADMM to promote information interaction between distribution network operators and microgrids is proposed to address the challenges of distributed energy management in multi-microgrid systems with renewable energy uncertainties [23]. A distributed robust opportunity-constrained power flow optimization model based on the alternating multiplier method is proposed to for manage distributed wind power uncertainty [24]. The proposed distributed method obtains the optimal solution faster and has lower operating costs than the conventional centralized method. A distributed state estimation ADMM algorithm is proposed to improve the state estimation of multi-microgrid systems [25]. A distributed algorithm based on ADMM is proposed to manage multi-microgrid systems with a high penetration of distributed energy resources [26].
Based on the aforementioned summary of existing researches. This paper presents a low-carbon dispatch model for integrated energy multi-microgrids containing CCS-P2G, which enhances system efficiency by integrating CCS and P2G technologies, promoting energy sharing, and minimizing operating costs and emissions through a distributed energy management strategy based on the ADMM.

2. Integrated Energy Multi-Microgrid Architecture with CCS-P2G

The IEM operation framework is shown in Figure 1. This framework presents a multi-energy microgrid system that couples electric, gas, and heat energy, incorporating CHP units, gas boilers (GB), energy storage devices, renewable energy generation systems, and other key components. During the operation of the entire system, the CHP unit is the primary source of carbon dioxide emissions, while the CCS device efficiently uses electricity to capture the carbon dioxide emitted by the CHP unit. Moreover, the P2G device uses carbon dioxide as a raw material to produce natural gas, effectively reducing carbon emissions, minimizing energy waste, and enhancing system flexibility. In this study, we extend the conventional microgrid by incorporating P2G and CCS, while establishing a carbon trading and green certificate trading market.This framework effectively balances economic objectives with environmental sustainability. Each microgrid in the system can either purchase electricity from or sell electricity to other microgrids. To promote energy consumption within the microgrids, it is assumed that the purchase price between microgrids is lower than that from the main grid. Therefore, microgrids prioritize purchasing electricity from adjacent microgrids. If the purchased electricity is insufficient to meet the system’s load demand, the microgrid will source the remainder from the main grid.
Moreover, each microgrid is equipped with a microgrid energy management system (MGEMS) that leverages information and communication technologies to enable energy exchanges and data interactions between adjacent microgrids. This system enhances energy efficiency and improves the economic and environmental performance of interconnected microgrids. Based on this, a low-carbon operation model for the multi-energy microgrid system is developed, as shown in Figure 1.

2.1. System Model Establishment

2.1.1. Gas Turbine Model

The gas turbine is the core equipment for coupling multiple energy forms such as electricity and heat. It generates electricity by burning natural gas. The gas consumption is proportional to the power generation. The CHP unit model is expressed [27].
P CHP , t = V CHP , t η CHP Q CH 4
where P CHP , t denotes the power generation of the gas unit at time t, η CHP is the power generation efficiency of the gas unit, Q C H 4 is the combustion value of natural gas, and V CHP , t is the gas consumption of the gas unit at time t.
As a highly efficient heat supply device, the GB generates high-temperature hot water or steam by burning natural gas and other fuels, providing heat energy for users in microgrids. It also facilitates energy complementarity with other power generation equipment in the microgrids. In the case of insufficient or excessive power supply, GB can adjust the energy structure by adjusting the heat supply to ensure the stable operation of microgrids. The GB unit model is expressed [27]
H GB , t = V GB , t η GB Q C H 4
where H GB , t denotes the heat generation power of the gas boiler at time t, V GB , t is the gas consumption of the gas unit at time t, and η GB is the heat generation efficiency of the gas boiler. Due to the combined heat and power of the gas unit is subject to the “heat determines electricity” constraint, its electric and thermal outputs are interdependent and coupled. The electric and thermal characteristic equation is shown in Equation (3).
max { P CHP , min h 1 H CHP , t , h m ( H CHP , t H CHP 0 ) } P CHP , t P CHP , max h 2 H CHP , t
where P CHP , min and P CHP , max denote the lower and upper limits of the CHP unit power generation, H CHP 0 is the heating power corresponding to the minimum power generation of the CHP unit, P CHP , t is the power generation of the CHP unit at time t, H CHP , t is the heating power of the CHP unit at time t, h 1 and h 2 are the electric-to-heat conversion coefficients of the CHP unit corresponding to the minimum and maximum output powers, and h m is the linear supply slope of the CHP power generation and heating power. The power generation constraint of the CHP unit can be given by
P CHP , min P CHP , t P CHP , max
where P CHP , min and P CHP , max denote the lower and upper limits of the CHP unit power generation capacity, respectively. The heating power constraint of the CHP unit can be given by
H CHP , min H CHP , t H CHP , max
where H CHP , min and H CHP , max denote the lower and upper limits of the heating power of the CHP unit, respectively.

2.1.2. CCS-P2G-CHP Coupling Model

The CHP system enhances energy utilization efficiency by simultaneously supplying both electricity and heat. Moreover, it also provides electricity to support the operation of CCS and P2G equipment. The carbon capture system captures the carbon dioxide generated by the CHP unit through a carbon dioxide absorption tower, thereby reducing the overall carbon footprint. The captured carbon dioxide is released from the regeneration tower to supply the P2G equipment. Using electricity from the CHP system, the P2G unit electrolyzes water in an electrolyzer to produce hydrogen and oxygen, and subsequently uses the captured carbon dioxide to synthesize methane. This integrated system not only balances the power grid load and efficiently utilizes electricity from intermittent renewable energy sources but also transforms the produced gas into a storage medium or clean energy to supply the CHP system, thus forming a circular economy operation model. The combination of these three technologies improves the power regulation capacity of the CHP system while reducing the electric-thermal coupling characteristics of the CHP unit. In the CCS-P2G-CHP coupling model, the electricity generated by CHP is divided into three parts, represented as [28]
P CHP , t = P E , t + P P 2 G , t + P CCS , t
where P E , t denotes the electric power supplied to the microgrid by the CHP unit at time t, P P 2 G , t is the electric power consumed by P2G at time t, and P CCS , t is the electric power consumed by CCS at time t. The relationship between the natural gas power generated by P2G and the electric power consumed by CHP supply is shown as [28]
V P 2 G , t = α P 2 G P P 2 G , t
where V P 2 G , t denotes the P2G production power at time t, α P 2 G is the conversion efficiency of P2G electrical energy to gas energy. The relationship between the carbon dioxide required by P2G as a raw material to produce natural gas is expressed as
M C O 2 , t = β C O 2 P P 2 G , t
where M C O 2 , t denotes the amount of carbon dioxide required corresponding to the electricity consumed by P2G at time t, β C O 2 is the coefficient of converting carbon dioxide emissions into electricity consumption. The relationship between the electric power consumption and the carbon dioxide captured by CCS for P2G conversion is expressed as [29]
P CCS , t = β CCS M C O 2 , t
where β CCS denotes the conversion factor of CCS electricity consumption for capturing carbon dioxide. The corresponding upper and lower limits of the electric power of CCS and P2G are expressed as [29]
P CCS , min P CCS , t P CCS , max P P 2 G , min P P 2 G , t P P 2 G , max
where P CCS , min and P CCS , max denote the lower and upper limits of the electric power consumption of CCS, P P 2 G , min and P P 2 G , min are the lower and upper limits of the electric power consumption of P2G.
By substituting Equation (6) into Equation (3), the thermoelectric coupling characteristic equation for the combined heat and power system, which includes P2G and CCS equipment can be derived as follows
max { P CHP , min h 1 H CHP , t P P 2 G , t P CCS , t , h m ( H CHP , t H CHP 0 ) P P 2 G , t P CCS , t } P E , t P CHP , max h 2 H CHP , t P P 2 G , t P CCS , t
The power range consumed jointly by P2G and CCS is shown as
P P 2 G , min + P CCS , min P P 2 G , t + P CCS , t P P 2 G , max + P CCS , max
By substituting Equation (11) into Equation (12), the new thermal-electric coupling characteristics of the CHP system, P2G and CCS can be derived as [30]
max { P E , min h 1 H CHP , t , h m ( H CHP , t H CHP 0 ) P P 2 G , max P CCS , max P P 2 G , t P CCS , t }   P E , t P E , max h 2 H CHP , t P P 2 G , min P CCS , min
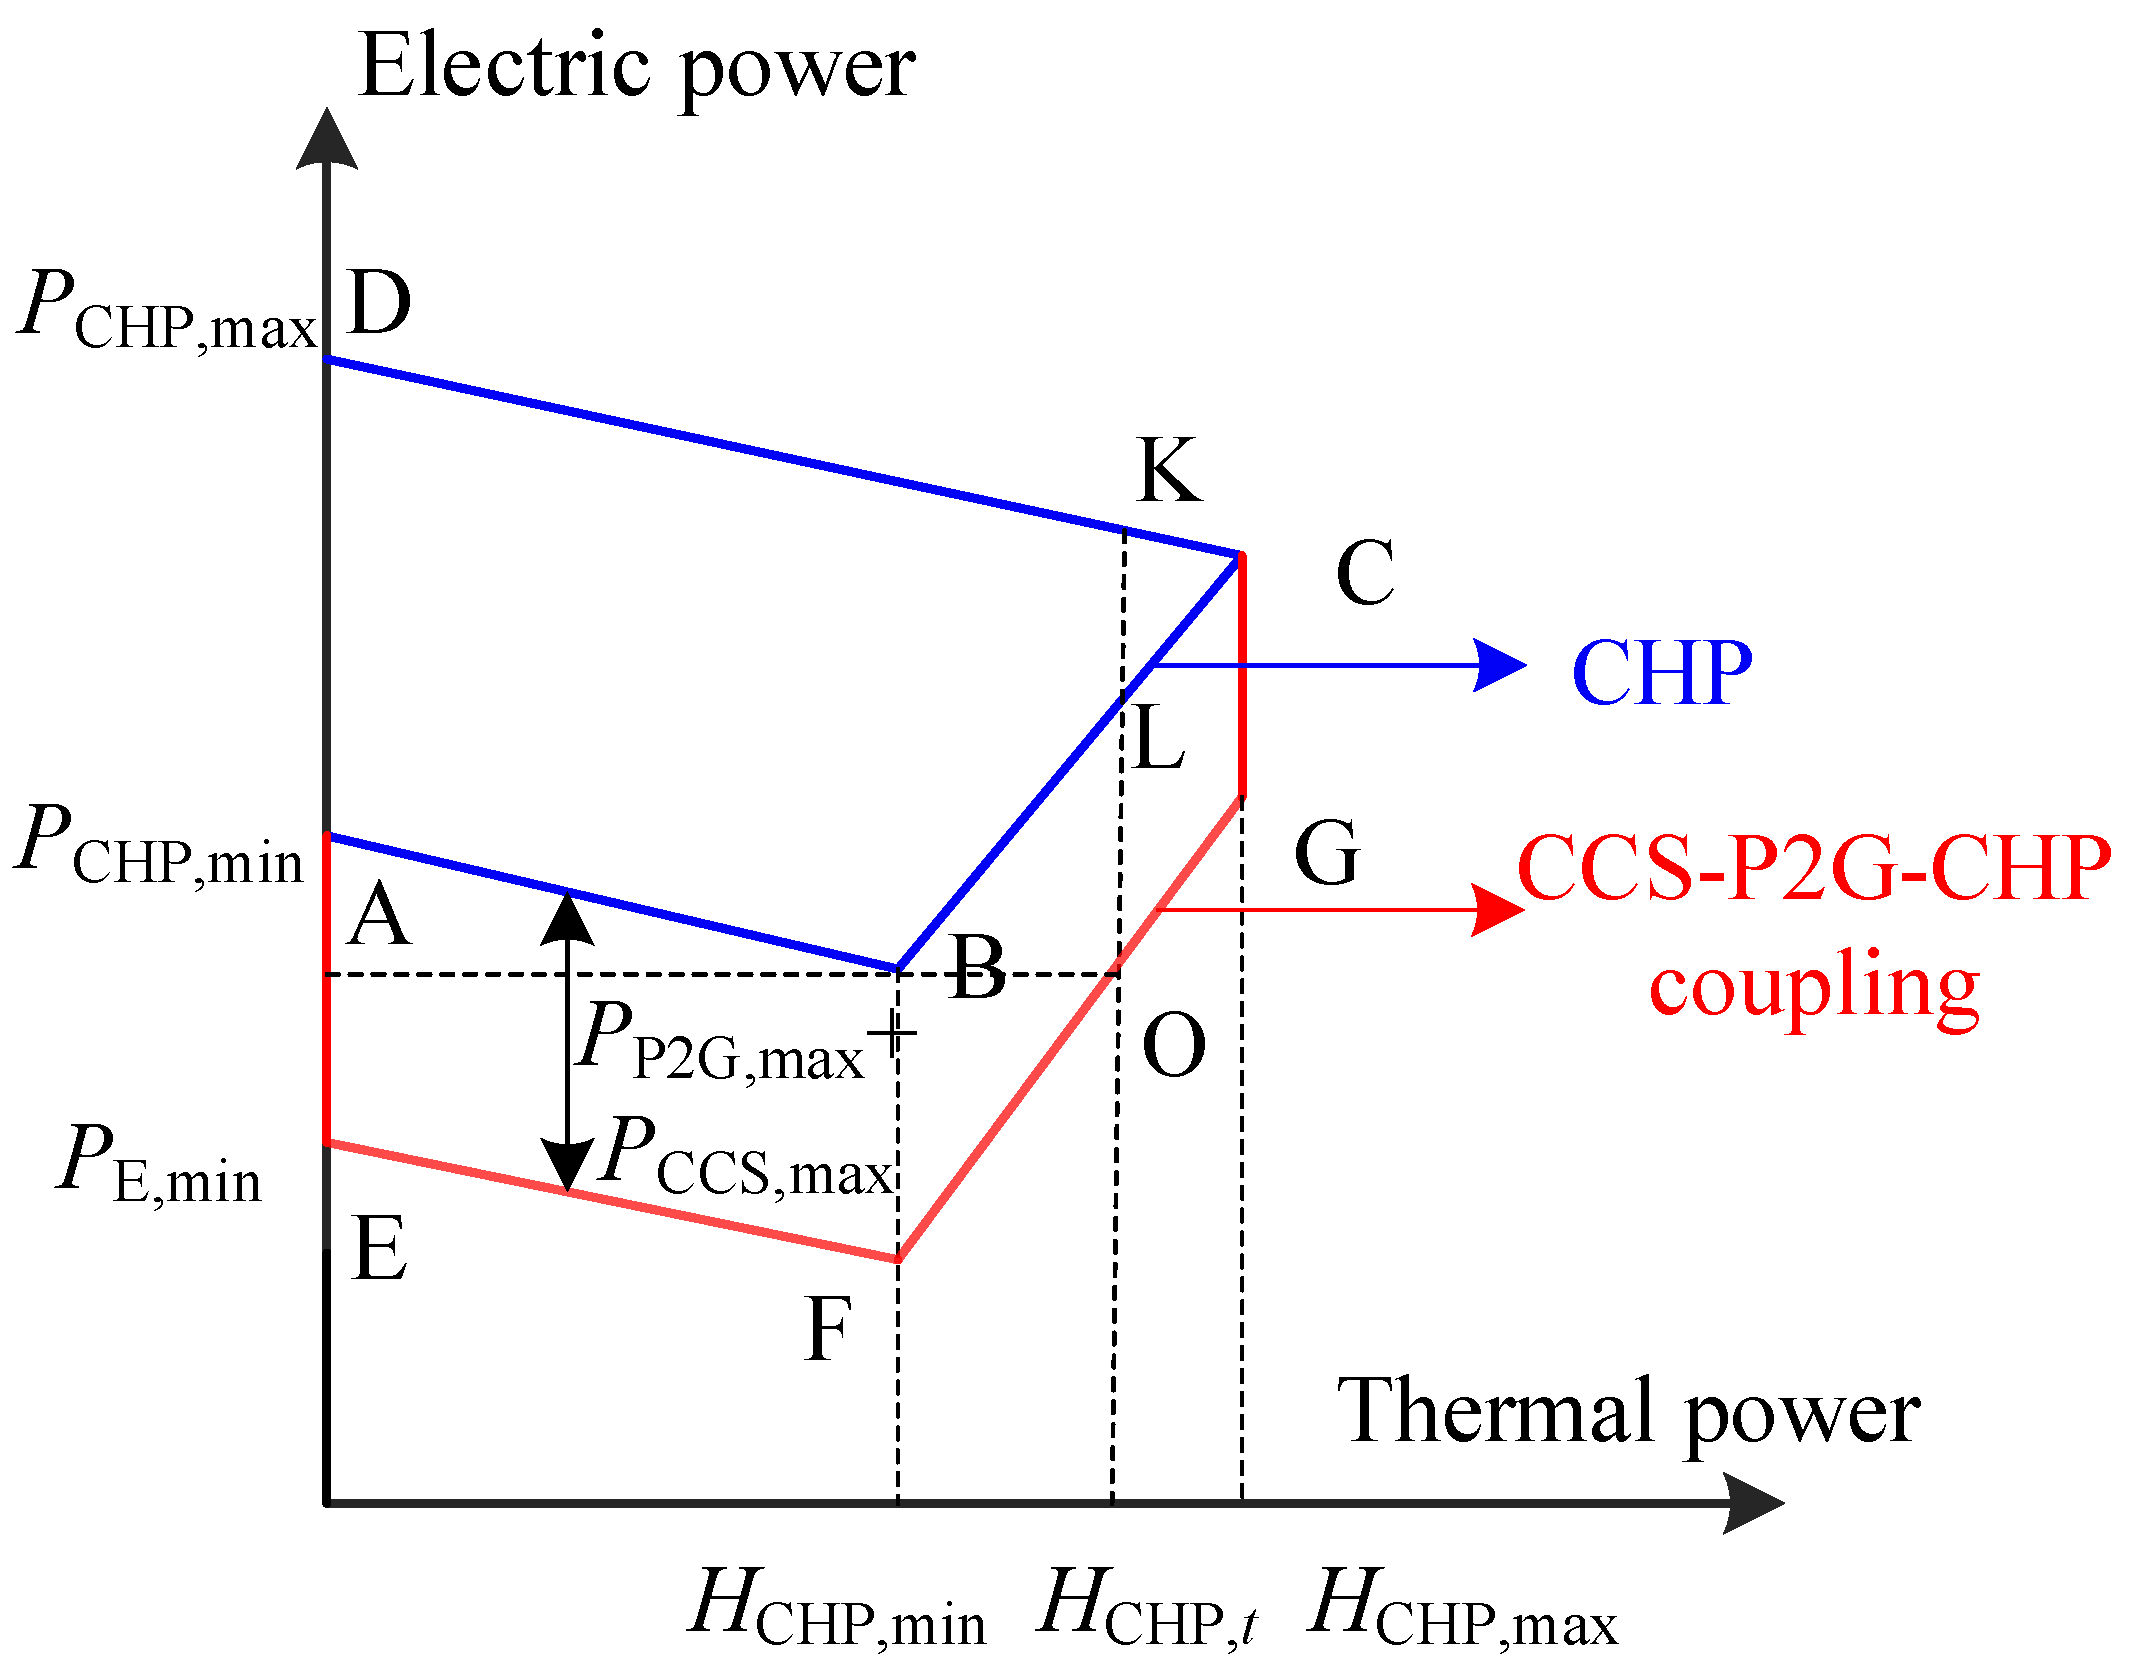
According to Equations (3), (11) and (12), it can be deduced that the feasible range of electric and thermal power of the CHP unit before and after adding CCS and P2G is represented by ABCD and EFGCD in Figure 2, respectively.
As illustrated in Figure 2, the addition of CCS and P2G equipment shifts the minimum power generation of the CHP unit from point A to point D, thereby expanding the output range of CHP power generation. When the heating power of the CCS and P2G integrated system remains constant, the power generation adjustment range of the CHP unit extends from the KL segment to the KO segment. This expansion enhances the CHP unit’s power generation flexibility and mitigates its strong electric–thermal coupling characteristics. By substituting Equation (7) into Equation (10), the upper and lower limits of P2G production power can be given by [30]
V P 2 G , min = P P 2 G , min α P 2 G V P 2 G , t P P 2 G , max α P 2 G = V P 2 G , max
By substituting Equations (7)–(9) into Equation (12), we can derive the relationship between the power supply, gas production, and heating power in the CCS-P2G-CHP joint operation model is expressed as follows
max { α P 2 G 1 + β CCS β C O 2 P CHP , min h 1 H CHP , t P E , t , h m ( H CHP , t H CHP 0 ) P E , t } V P 2 G , t α P 2 G 1 + β CCS β C O 2 P CHP , max h 2 H CHP , t P E , t

2.2. Integrated Demand Response Mechanism

Integrated demand response has emerged as an alternative to the conventional energy-system paradigm, in which user-side loads were conventional regarded as rigid. Prior to the concept of load response, energy supply is adjusted primarily by changing the output from the energy generation side to meet the user demand. However, this operational mode can disrupt the energy balance of the network and compromise the safe, stable operation of the system. Data indicates that during typical peak load periods for urban residents in China, demand-side available load resources account for approximately 15% to 20% of the total load. This highlights the necessity of altering resident energy consumption patterns and encouraging their active participation in energy system dispatch. By leveraging the flexible load resources on the demand side, it becomes possible to implement a well-coordinated supply-demand strategy that ensures safe, efficient, and stable operation of the system.
This paper fully considers the characteristics of the electric-thermal multi-energy system, modeling and analyzing the demand response of both electric and thermal loads. These responses are integrated into the optimization dispatch model. The demand response model, based on load classification, includes primarily shiftable and reducible loads, enabling horizontal time-shifting and vertical mutual substitution across multiple loads. A comprehensive demand response model is then established based on the load response periods.

2.2.1. Load Classification and Modeling Basis

To accurately quantify the potential and cost of demand response, this study classifies electrical and thermal loads into two categories based on their physical characteristics and impact on user comfort. The first category, shiftable loads, refers to loads whose consumption periods (either electrical or thermal) can be flexibly adjusted, while ensuring that the total demand is met. These loads typically correspond to user devices with energy storage characteristics or those that can be interrupted. The core of demand response for shiftable loads lies in shifting their consumption over time, without reducing total energy consumption. Therefore, the compensation cost is primarily related to the total amount of energy shifted, whether electrical or thermal [31].
The second category, curtailable load, refers to loads that can temporarily reduce their power consumption or be completely interrupted when needed by the system, resulting in a reduction in the user’s total energy consumption. These loads typically correspond to devices that have a minor, acceptable impact on user comfort or production efficiency. The core of demand response for curtailable loads lies in reducing their consumption, with the compensation cost directly linked to the amount of energy curtailed, whether electrical or thermal [32].

2.2.2. Shiftable Load Model

The shiftable load refers to a load that can be adjusted according to a predetermined plan, with the condition that the overall load shifting is maintained. It is not confined to a specific dispatch period, with the unit dispatch period set to one hour. Based on the shiftable load R tran k , the power distribution vector before the dispatch can be expressed as:
R tran k = ( 0 , , S tran k , t s , S tran k , t s + 1 , , S tran k , t d , , 0 )
where k denotes the electrical or thermal load, when k is e, it is expressed as electrical load. When k is h, it is expressed as thermal load. S tran k is the shiftable electrical load or thermal load. t s is the start time, and t d is the duration.
Assuming that the shiftable time interval is t s h , t s h + . To account for the overall load shift constraint, the start time and duration of R tran k need to be considered. The 0–1 variable δ t r a n is used to represent the shift state of R tran k in a certain period τ . When δ tran = 1 , it means that R tran k starts from the τ period, when δ tran = 0 , it means that R tran k load does not shift, then the set of starting time periods is t s h , t s h + t d + 1 . If τ = t s , it means that the load has not changed, if τ t s h , t s h + t d + 1 and τ = t s , it means that the power distribution vector of R tran k shifted from the starting time t s to R tran k with the starting time τ is expressed as follows
R tran k = ( 0 , , S tran k , τ , S tran k , τ + 1 , , S tran k , τ + t d t s , , 0 )
The compensation cost incurred by the user following the migration can be expressed as
C tran k = λ tran k S sum , tran k
where C tran k denotes the cost of compensation for movable loads, λ tran k denotes the unit price of compensation for movable loads, and S sum , tran k denotes the sum of movable loads.

2.2.3. Load Reduction Model

Unlike shiftable loads, which do not change the user’s load characteristics, reducible loads reduce the user’s load. The 0–1 variable δ cut is used to represent the reduction status of the reducible load R cut k in a certain period τ . When δ cut = 0 , it means that R cut k has not been reduced, when δ cut = 1 , it means that R cut k has been reduced from the period τ . Then the power of the period τ after participating in the dispatch can be expressed as
S cut k , τ = ( 1 φ τ δ cut τ ) S cut k , τ
where φ τ denotes the load reduction coefficient in the τ period, φ τ 0 , 1 ; S cut , τ k is the power in the τ period before the load can be reduced and participate in the dispatch. The compensation to users after the reduction can be shown
C cut k = t = 1 T λ cut k ( S cut , t k S cut , t k )
where C cut k denotes the cost of compensation for reducible load, λ cut k denotes the unit price of compensation for reducible load.

2.3. Cost Model

The economic dispatch objective of the IEM is to minimize total system operating costs by formulating an optimal output plan for each device, while ensuring the stable operation of CHP units, distributed power sources, and other equipment. To achieve this goal and fully utilize controllable resources, the dispatch objective function for the i-th microgrid is expressed as follows
min F i ( P i ) = min ( C i ( P i ) + h i ( P i , exc ) )
C i ( P i ) = C i , CHP + C i , es + C i , ext + C i , C O 2 + C i , DR + C i , green
h i ( P i , e x c ) = λ P i , e x c 2
where C i ( P i ) denotes the controllable power generation cost of the i-th microgrid system, the operating cost of the energy storage device, the external interaction cost, the carbon trading and green certificate trading costs, and the demand response cost. h i ( P i , exc ) represents the network transmission cost incurred by the interaction power between the i-th microgrid and other microgrids. λ is the network transmission parameter, and P i , exc is the interaction power between the i-th microgrid and other microgrids, where positive values represent output power and negative values represent input power.
The multiple interconnected microgrids studied in this paper form a MM-IES, where adjacent microgrids exchange both information and power. The system develops an optimal power dispatch plan to minimize operating costs and enhance energy utilization efficiency. The objective function for the optimal dispatch of the MM-IES, consisting of N microgrids, is expressed as follows
min i = 1 N ( C i ( P i ) + h i ( P i , exc ) )
(1)
Operating costs of CHP units
The operating cost C i , CHP of a CHP unit containing CCS and P2G equipment is given by
C i , CHP = t = 1 T a 1 P i , CHP , t + b 1 ( P i , CHP , t ) 2 + a 2 P i , CCS , t + a 3 P i , P 2 G , t + c 1
where a 1 , b 1 and c 1 denote the operating cost coefficients and constants of the CHP unit, a 2 and a 3 are the operating cost coefficients of the CCS and P2G equipment, and T denotes the total dispatch period.
(2)
Operation and maintenance costs of energy storage devices
C i , es = i = 1 T φ es ( P batc , t + P batd , t )
where C i , es denotes the operation and maintenance cost of the i-th microgrid energy storage device, P batc , t and P batd , t are the charge and discharge power of the i-th microgrid energy storage device, and φ es is the operation and maintenance cost coefficient of the energy storage device.
(3)
External Interaction Costs
The external interaction cost of IEM C i , ext includes the costs associated with purchasing and selling electricity from the power grid, as well as the cost of purchasing natural gas can be expressed as
C i , ext = i = 1 T ( λ buy , t P i , buy , t λ sell , t P i , sell , t ) + ( λ C H 4 V i , buy , t )
where λ buy , t and λ sell , t denote the electricity purchase and sale prices in the t period respectively, λ C H 4 is the natural gas purchase price, P i , buy , t and P i , sell , t are the electricity purchase and sale powers, and V i , buy , t is the gas purchase volume of the i-th microgrid CHP system in the t period.
(4)
Carbon Trading Costs
The carbon emission quota of IEM E i , L can be expressed as
E i , L = t = 1 T ( δ 1 ( P i , CHP , t + P i , RES , t ) + δ 2 P i , buy , t )
where P i , RES , t denotes the renewable energy power generation of the i-th microgrid in the t period, δ 1 and δ 2 are the carbon emission quotas per unit of electricity produced and purchased by the microgrid, respectively.
The actual carbon emissions of the IEM E i , C is given by
E i , C = t = 1 T ( a C O 2 ( P i , CHP , t + h 1 H i , CHP . t ) + b C O 2 H i , GB , t + c C O 2 + a C O 2 buy P i , buy , t E cc , t )
where a C O 2 and c C O 2 denote the carbon emission coefficients of the CHP unit, b C O 2 is the carbon emission coefficient of the gas boiler, a C O 2 buy is the carbon dioxide emission coefficient of purchased electricity, and E cc , t is the amount of carbon dioxide reduced in the system after the introduction of CCS and P2G equipment. The carbon trading calculation costs, reflecting the advantages of tiered carbon trading, can be expressed as follows
C i , CO 2 = c ( 1 + 2 μ ) ( E i , L d E i , C ) E C < E L d c ( 1 + 2 μ ) d c ( 1 + μ ) ( E L E C ) E i , L d < E i , C < E i , L c ( E i , C E i , L ) E i , L < E i , C < E i , L + d c d + c ( 1 + α ) ( E i , C E i , L d ) E i , L + d < E i , C < E i , L + 2 d c d ( 2 + α ) + c ( 1 + 2 α ) ( E i , C E i , L 2 d ) E L + 2 d < E C < E L + 3 d
where c denote the carbon trading price in the market; d is the length of the carbon emission interval, μ and α are the penalty coefficient and reward coefficient, respectively.
(5)
Demand response cost
C i , DR = C tran e + C cut e + C cut h
where C tran e and C cut e denote the compensation costs for the shiftable and reducible electrical loads, and C cut h is the compensation cost for the reducible thermal load.
(6)
Green certificate trading costs
C i , green = c gre P i , total s c f ( ξ s η ) P i , total η < ξ s c gre ( ξ P i , total P i , RES ) ξ s η < ξ c gre ( P i , RES ξ P i , total ) η ξ
η = P i , RES P i , total
P i , total = P i , E + P i , P 2 G + P i , CCS + P i , RES
where C i , green denotes the green certificate trading cost of the i-th microgrid, c gre is the green certificate trading price; c f is the penalty price, ξ is the renewable energy power generation quota ratio, s is the penalty coefficient, η is the proportion of actual renewable energy in the grid-connected electricity, P total is the total grid-connected electricity of the power generation enterprise. The green certificate trading mechanism is designed to stimulate the generation and consumption of renewable energy. Its formulation is based on the national renewable energy quota policy, where ξ denotes the renewable generation quota ratio, and s represents the penalty coefficient, which regulates the economic penalty intensity imposed on entities that fail to meet the renewable energy quota requirements.

2.4. Synergistic Relationship Between Green Certificate Trading and Carbon Trading Mechanisms

In this study, we integrate green certificate trading and carbon emissions trading as two core policy instruments for driving the low-carbon transition of the energy system. Although they differ in regulated entities, operating logic, and policy objectives, the two mechanisms are complementary rather than a simple additive overlay.
The central objective of the carbon emissions trading mechanism is to control the absolute level of carbon emissions. It directly imposes allowance-based control and pricing on emitters (e.g., CHP units and gas-fired boilers), assigning a cost to carbon under the “polluter pays” principle and thereby incentivizing all abatement options, including efficiency improvements, fuel switching, and carbon capture technologies. Its price signal reflects the environmental (marginal) cost of reducing one unit of carbon emissions.
By contrast, the central objective of the green certificate trading mechanism is to increase the share of renewable electricity. It indirectly applies quota obligations and pricing to the green attributes of clean generation (e.g., wind and photovoltaic power), recognizing their environmental value and creating an additional revenue stream that directly stimulates investment and capacity expansion. Its price signal reflects the environmental value of producing one unit of green electricity.
Taking the European Union Emissions Trading System (EU ETS)—the world’s most mature carbon market—as an example, it is a canonical cap-and-trade system that pursues climate targets by setting an EU-wide emissions cap and lowering it annually. However, while the EU ETS primarily internalizes the cost of fossil-energy consumption on the demand side, its incentives for renewable energy deployment are indirect. In contrast, green certificate trading directly addresses the supply-side competitiveness and bankability of renewable energy.

2.5. Constraints

2.5.1. Electric Power Balance Constraint

This constraint ensures the real-time balance between electric power generation, exchange, and load demand within each microgrid.
P i , E , t + P i , RES , t + P i , CCS , t + P i , P 2 G , t + P i , buy , t + P i , exc , t = P i , load , t + P i , sell , t + P batc , t + P batd , t P i , load , t = P i , base , t + S i , tran , t e + S i , cut , t e

2.5.2. Thermal Power Balance Constraint

This constraint maintains the equilibrium between thermal energy supply from CHP and GB units and the total thermal load demand.
H i , CHP , t + H i , GB , t = H i , load , t H i , load , t = H i , base , t + S i , cut , t h

2.5.3. Gas Power Balance Constraints

This constraint guarantees that gas consumption and production within each microgrid remain balanced during operation.
V i , buy , t = V i , CHP , t + V i , GB , t V i , P 2 G , t

2.5.4. CCS-P2G-CHP Power Upper and Lower Limit Constraints

These constraints define the feasible operating ranges of the CCS, P2G, and CHP units to ensure safe and stable operation.
P CHP , min P CHP , t P CHP , max P CCS , min P CCS , t P CCS , max P P 2 G , min P P 2 G , t P P 2 G , max

2.5.5. Renewable Energy Power Constraints

This constraint limits renewable energy output within its predicted range to account for generation uncertainty.
0 P i , RES , t P i , pre , t
where P i , pre , t denotes the predicted power of renewable energy of the i-th microgrid in the t period.

2.5.6. Energy Storage Device Constraints

The charging and discharging behavior of the energy storage devices is not predefined by fixed time rules but rather serves as a decision variable within the optimization model. Its operating strategy is entirely driven by the system’s economic objective, aiming to minimize total operational costs by exploiting the spatiotemporal variations in electricity prices.
0 P batc , t t P batc , max 0 P batd , t ( 1 t ) P batd , max S O C es , min S O C es ( t ) S O C es , max

2.5.7. Green Certificate Quota Constraints

These constraints ensure that the total amount of green certificates corresponds to the renewable energy generation within the system, thereby promoting low-carbon operation.
t = 1 T k h P D , t = t = 1 T h ( P w , t + P v , t ) + G b , t G s , t

2.5.8. Demand Response Constraints

These constraints define the upper limits of load transfer and curtailment to guarantee user comfort while achieving flexible demand-side management.
t = 1 T S i , tran , t k Δ t k tran S i , base , t k 0 S i , cut , t k S i , cut , max k

2.5.9. Power Interaction Constraints Between Microgrid and Main Grid

These constraints regulate the bidirectional power exchange between each microgrid and the main grid, ensuring stable operation and preventing excessive power flow.
0 P i , buy , t ω P i , buy , max ( 1 ω ) P i , sell , max P i , sell , t 0

2.6. Applicability Analysis of the Model Construction

To ensure a balance between model complexity and accuracy, while highlighting the core contributions of this study, the model is constructed based on the following reasonable considerations.
First, regarding the natural gas network, the study focuses on day-ahead scheduling with a one-hour temporal resolution. Since the dynamic behavior and pressure fluctuations of natural gas networks primarily occur over seconds to minutes, it is reasonable to neglect transmission delays and treat the network as a steady-state system. This assumption is commonly used in similar multi-microgrid scheduling studies, significantly reducing model nonlinearity and computational complexity, with minimal impact on day-ahead scheduling plans. Second, at the day-ahead scheduling timescale, the energy efficiency parameters of the CCS-P2G integrated system are mainly determined by equipment design and stable operating conditions. The primary goal of this study is to analyze the structural impact of CCS-P2G cooperative operation on the system’s low-carbon economy, rather than internal dynamic processes of equipment. Therefore, the constant efficiency values at this timescale effectively reflects the system’s scheduling characteristics and economic performance under stable conditions.
Taken together, these assumptions define the applicability of the model, which is suitable for day-ahead steady-state optimization scheduling at the multi-microgrid level.

3. Solution of Distributed Dispatch of Integrated Energy Multi-Microgrid Based on Alternating Direction Method of Multipliers (ADMM)

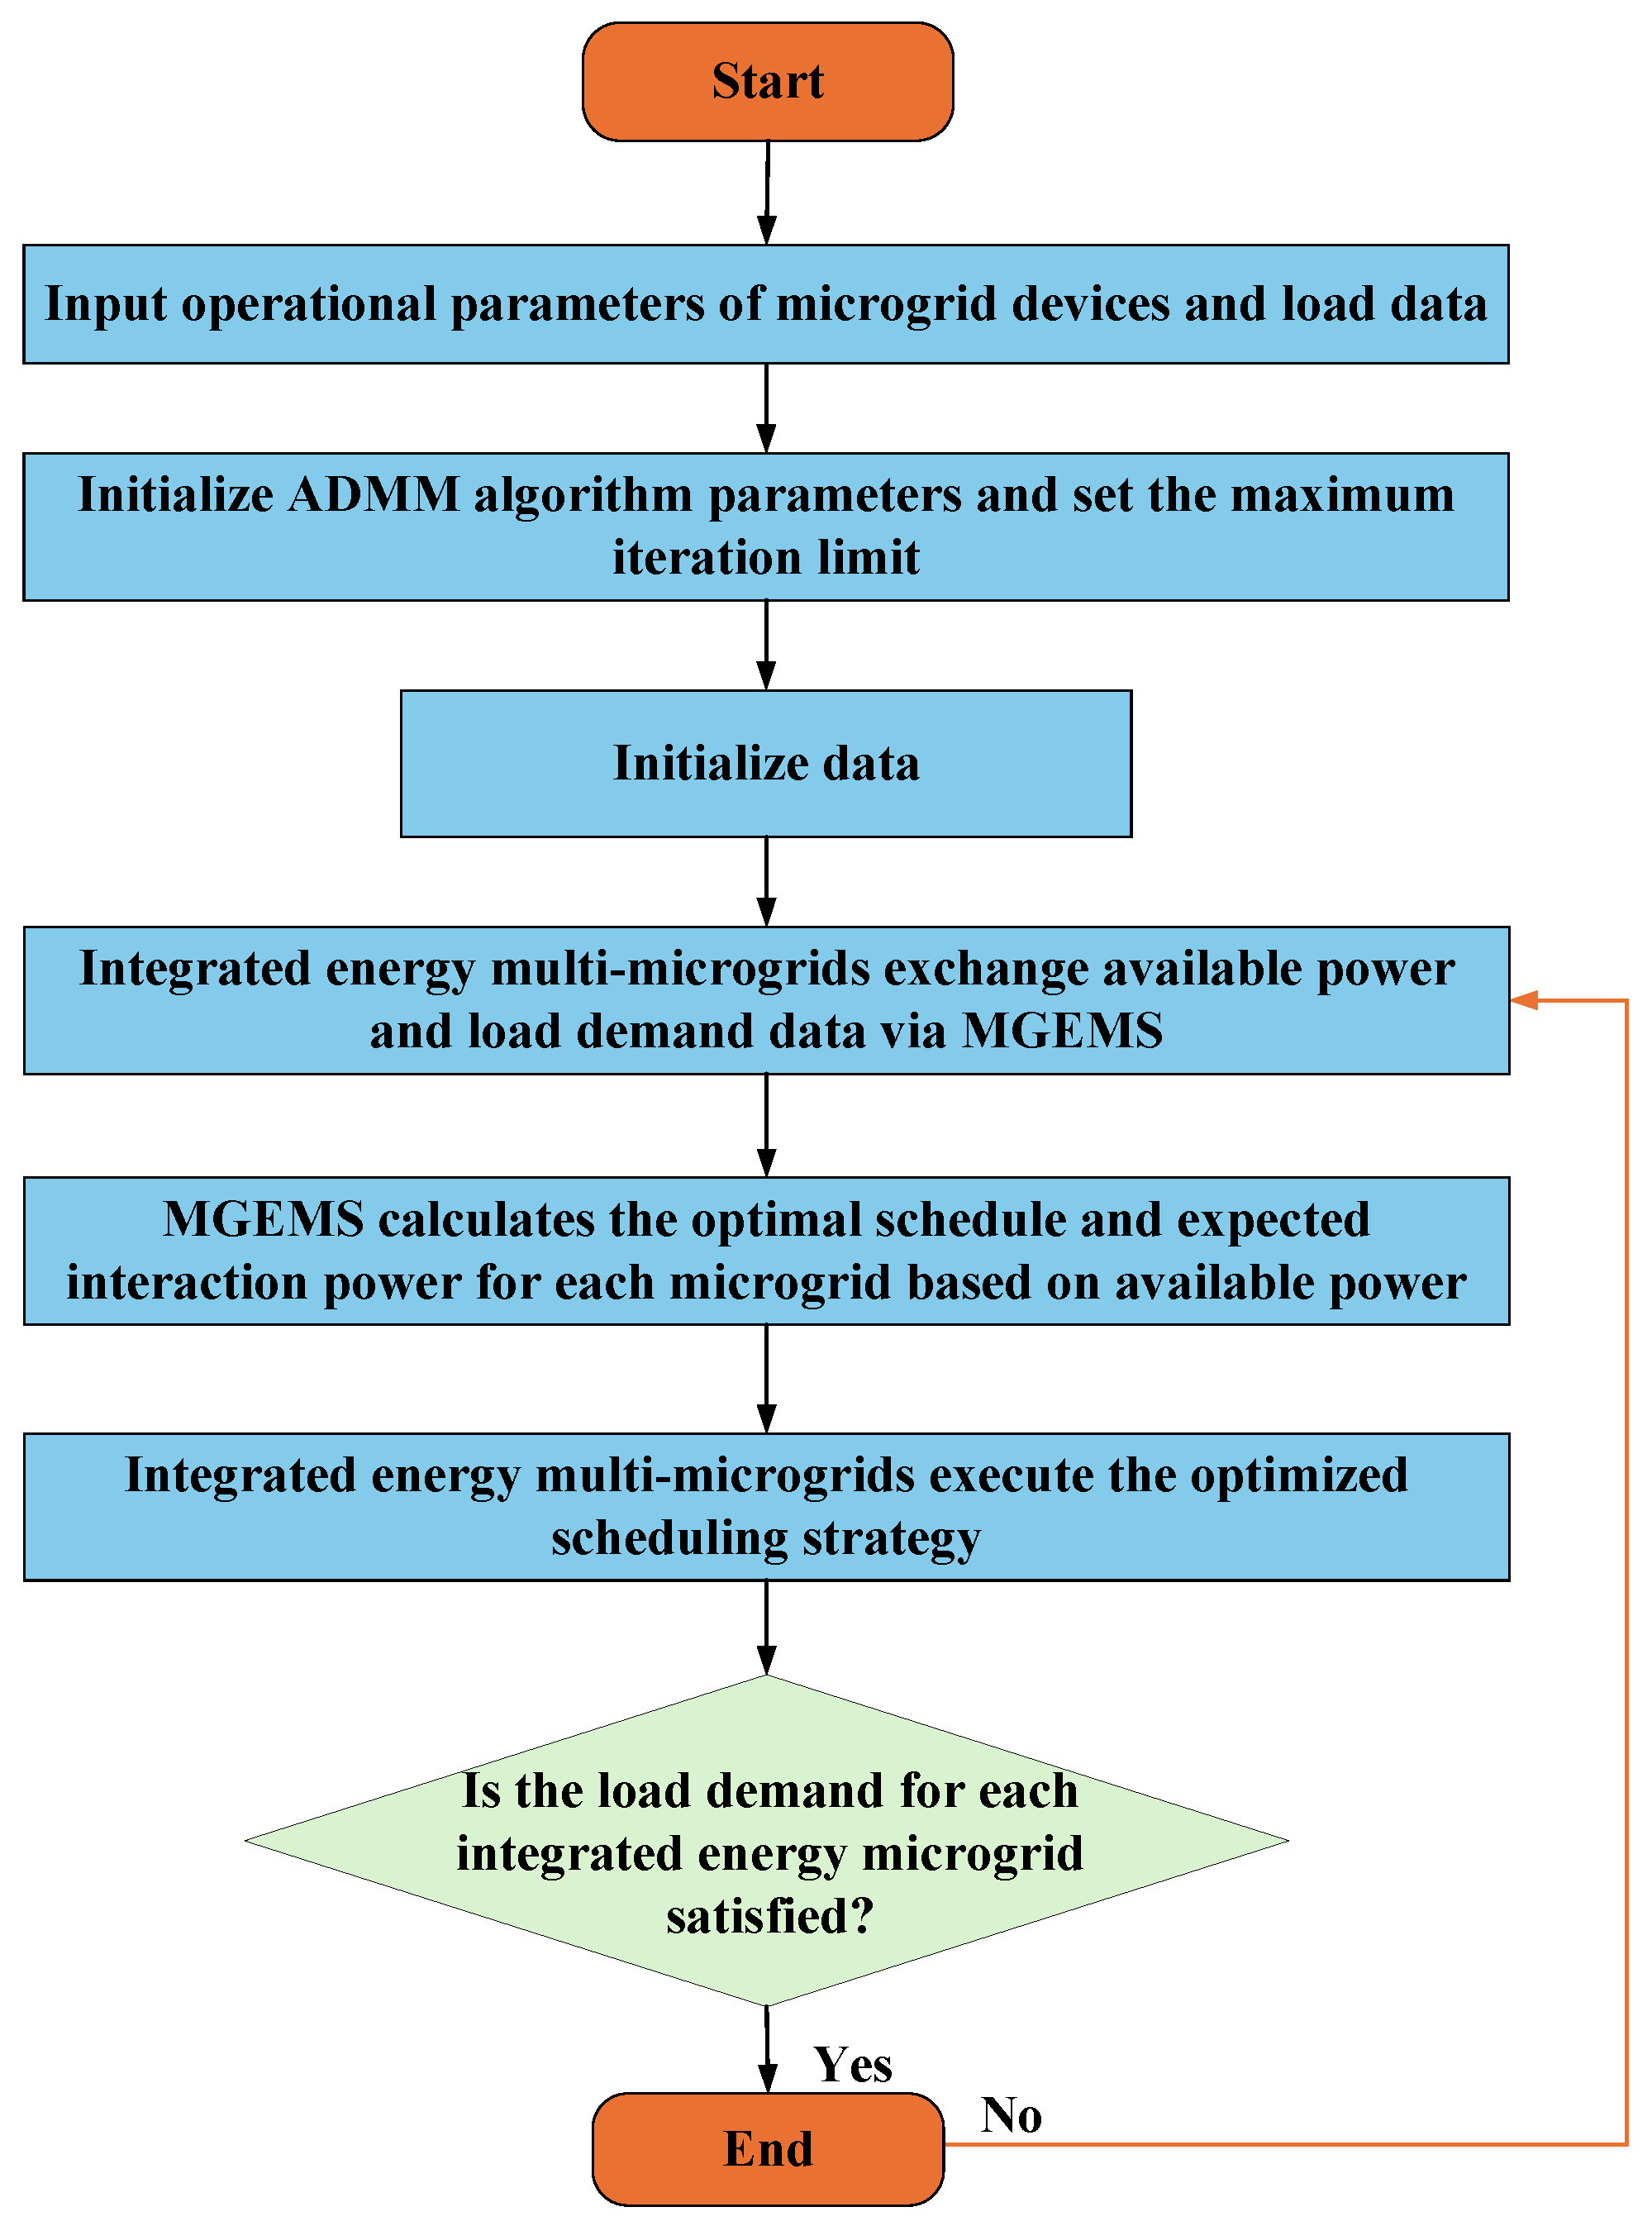
The ADMM is employed in this study to solve the multi-microgrid scheduling problem. ADMM is particularly suitable for convex optimization problems with separable structures, enabling efficient handling of distributed constraints in interconnected microgrids. Compared with other distributed optimization algorithms, it offers faster convergence and greater numerical stability. In addition, ADMM requires only the exchange of boundary information among microgrids without involving internal operational data, thereby ensuring data privacy and maintaining the autonomy of each microgrid during the optimization process. The solution process for the optimal scheduling of multiple microgrids is illustrated in Figure 3. The standard form of ADMM can be expressed as follows
min f ( x ) + g ( z ) s . t . Ax + Bz = c
where x R m , z R n , A R p × m , B R p × n , and c R p . The objective function is decomposed into two parts: f ( x ) and g ( z ) , both of which are convex functions with respect to x and z . Specifically, function f is defined as f is R m R + , and function g is defined as g is R n R + . The algorithm is guaranteed to converge and yield the optimal solution when these functions are convex.
In the ADMM framework, the functions f and g are designed not only to represent the optimization objectives but also to enforce constraints by assigning a value of + when the constraints are violated. This mechanism can be analogized to the energy management objective in this study, which aims to minimize total cost. When the constraints are satisfied (e.g., the power exchange P i , e x c of the microgrid does not exceed the line capacity), the corresponding function value is 0, indicating no penalty and an acceptable cost solution. When the constraints are violated (e.g., the power exchange P i , e x c exceeds the safety limits), the function value becomes + , imposing an infinitely large penalty in the objective function. From an optimization perspective, this effectively eliminates any unsafe scheduling solutions, ensuring that the final solution always operates within safe boundaries. Therefore, this “0 or + ” function design guarantees that the algorithm finds the most cost-effective scheduling solution while strictly adhering to all physical and safety constraints.
The iterative process of the ADMM algorithm alternates between solving the sub-problems sequentially. At each iteration, the solution from the previous sub-problem is substituted into the next one for optimization, and the Lagrange multiplier is updated after all sub-problems have been iterated. Based on the Equation (24) and the fundamental principles of ADMM, the iterative process for distributed optimization is described by the Equations (45) and (46).
x i k + 1 = arg min x ( f i ( x i ) + ψ 2 P i , exc P i , ext + ( B z k ) i ( B z k ) i + N + λ i k λ i + N k 2 2 )
z i k + 1 = arg min z ( g i ( z i ) + i = 1 N ψ 2 P i , exc k + 1 P i , ext k + 1 + ( Y ν k ) i ( Y ν k ) i + N + λ i k λ i + N k 2 2 )
λ k + 1 = λ k + P 1 , e x c k + 1 P N , e x c k + 1 P 1 , e x t k + 1 P N , e x t k + 1 T + Bz k + 1
where ψ denotes the penalty coefficient, λ k is the kth Lagrange multiplier, k denotes the number of iterations, and P i , ext is the interaction power between the ith microgrid and the grid.
The interaction power between each power generation unit, energy storage device, microgrid, and the grid is given by Equation (45). Based on these results, the MGEMS updates the transmission power between adjacent microgrids and the grid according to Equation (46), and iteratively adjusts the expected interaction power. The expected interaction power is updated iteratively using the Lagrange multiplier, as defined in Equation (47), to ensure optimal coordination between the system components. This solution process does not require global information exchange, and no information needs to be reported between microgrids, which significantly reduces communication costs and ensures the privacy of each microgrid operations. According to the ADMM algorithm, the convergence is based on the original residual r k and the dual residual s k , with the convergence criteria expressed as follows
r k 2 = P 1 , exc k + 1 P N , exc k + 1 P 1 , ext k + 1 P N , ext k + 1 T + Bz k + 1 2 ε p
s k 2 = ψ B ( z k z k + 1 ) 2 ε d
where ε p and ε d denote the convergence errors that are expected for the parameters at the termination of the iteration.
The specific process of the multi-microgrid distributed dispatch algorithm based on ADMM, as proposed in this paper, is outlined as follows
(1)
Input the operating parameters of equipment, including CHP units, CCS systems, power-to-gas units, and energy storage devices, along with the output data from the distributed power sources of each microgrid and the corresponding load data. Additionally, include the original data, such as Lagrange multipliers and penalty coefficients.
(2)
The microgrid MGEMS system analyzes the previous data of each microgrid and formulates an initial dispatch plan for the microgrid.
(3)
Each microgrid communicates its available power and load demand information through the MGEMS. The MGEMS then derives the optimal dispatch strategy and expected interactive power for each microgrid through distributed solution iteration. Since the microgrids only exchange information related to power purchase and sales plans, without sharing power generation outputs, the internal privacy of each microgrid is preserved.
(4)
The MGEMS of each microgrid collectively forms an integrated energy management system for the multi-microgrid network, designed to meet the load demand of each microgrid while minimizing the operating cost and ensuring the efficient utilization of energy across the system.

4. Case Analysis

4.1. Case Parameters

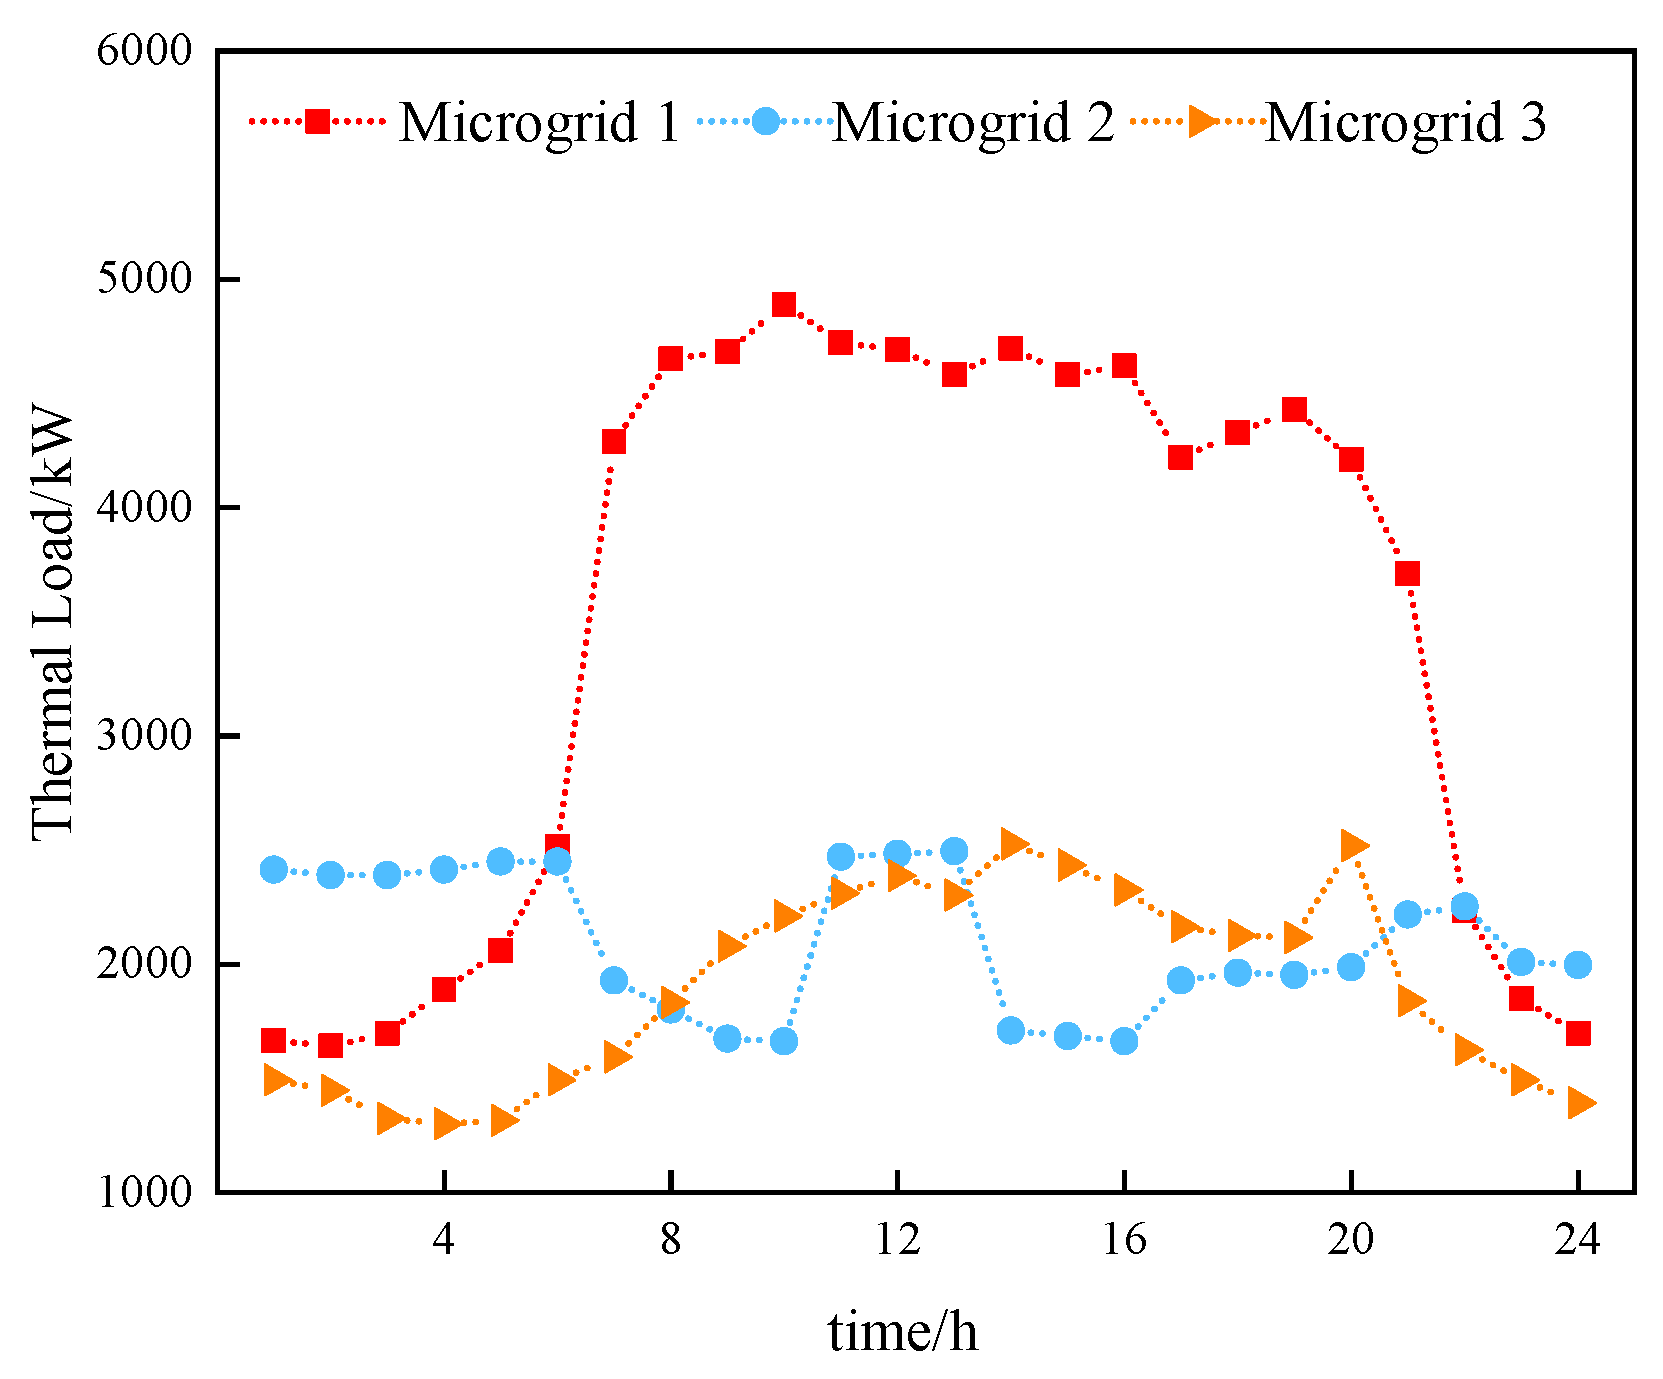
This paper addresses the low-carbon dispatch problem for a network of three IEM. Microgrid 1 and Microgrid 3 consist of conventional CHP units, while Microgrid 2 incorporates a CHP unit model with CCS and P2G technologies. The system parameters for the IEM are provided in Table 1, while the electricity purchase and sale prices between the microgrid and the power grid, as well as the natural gas purchase price, are shown in Table 2. The predicted renewable energy power generation for the microgrid is illustrated in Figure 4, with the electricity and heat load data presented in Figure 5 and Figure 6.
To verify the generalizability of the proposed strategy under different technical conditions, this study constructs a test system consisting of three heterogeneous microgrids, aiming to simulate typical scenarios arising from variations in resources and technological pathways in the real world. Microgrid 1 is configured with a conventional CHP unit and wind generation, representing a fossil-reliant yet renewable-embracing baseline microgrid. Microgrid 2 serves as the core locus of technological innovation, building upon Microgrid 1 by integrating a CCS–P2G coupled system and thus exemplifying an advanced microgrid incorporating state-of-the-art low-carbon technologies. Microgrid 3 combines a conventional CHP unit with photovoltaic generation, yielding a renewable penetration and mix complementary to those in Microgrids 1 and 2. This heterogeneous architecture emulates the diversity arising from differing resource endowments and technological pathways in real microgrid clusters, enabling a robust assessment of the generalizability of cooperative scheduling strategies.

4.2. Scenario Configuration

To systematically evaluate the contribution of each key module in the proposed strategy, we designed four comparative scenarios.
Scenario 1 simulates microgrids operating completely independently, without any coordination mechanisms, serving as the benchmark for performance evaluation. Scenario 2 builds upon Scenario 1 by introducing carbon trading and green certificate trading market mechanisms, yet inter-microgrid energy sharing remains disabled. Scenario 3 further extends Scenario 2 by allowing inter-microgrid energy sharing, while not incorporating an integrated demand response mechanism. Scenario 4, the proposed strategy, integrates energy sharing, comprehensive demand response, and market mechanisms into a complete framework.
This stepwise comparison clearly isolates the incremental contribution of each key measure market incentives, energy sharing, and demand response to overall system performance.

4.3. Convergence Analysis

This paper uses the ADMM algorithm to solve the distributed integrated energy multi-microgrid, and the multi-microgrid cost iteration convergence is shown in Figure 7.
Figure 7 illustrates the convergence results of the cost optimization for the MM-IES. The proposed algorithm achieves convergence after 69 iterations, with a total computational time of 390 s. During the iterative process, the IEM system aims to minimize operational costs by continuously updating the multiplier parameters, gradually increasing the penalty terms to explore new optimal solutions. The iterative process, combined with coordinated calculations, ensures convergence. These results demonstrate that the alternating multiplier method-based distributed optimization algorithm presented in this study offers both excellent convergence performance and computational efficiency, while effectively maintaining data privacy and meeting the requirements for day-ahead optimization dispatch.
The centralized optimization methods require the construction of a global model of the entire system, and their computational complexity grows exponentially or as a high-order polynomial with the number of microgrids N making it difficult to meet the real-time requirements of day-ahead scheduling. In contrast, the ADMM-based distributed algorithm adopted in this study decomposes the computational tasks across individual microgrids for parallel execution, resulting in a complexity that scales approximately linearly with N as illustrated in Figure 7. Even in the three-microgrid system considered in this work, the algorithm demonstrates rapid convergence (390 s), and its computational efficiency advantage is expected to be even more significant in larger-scale systems.

4.4. Analysis of Optimization Dispatch Results of Each Energy Microgrid

The optimization dispatch results for the output, electrical power, and thermal power balance of each IEM are presented in Figure 8 and Figure 9. As shown in Figure 8, throughout the entire day-ahead dispatch period, the CHP units of all three microgrids operate continuously. In Figure 8a, the wind power output in microgrid 1 is notably high, and the system compensates for the power demand by exchanging electricity with the other microgrids. Specifically, during the 01:00–08:00 and 21:00–24:00 periods, microgrid 1 operates in a multi-source mode, transmitting power to the other two microgrids to generate profit. Conversely, from 10:00 to 15:00, the power generation from microgrid 1’s resources falls short of its demand, requiring power exchanges with the other microgrids to fulfill the load during this period.
As shown in Figure 8b, the photovoltaic generation of microgrid 2 is concentrated between 07:00 and 17:00, though the power output is relatively low. Due to the integration of CCS and P2G systems, the CHP unit produces more electricity during 01:00–09:00 and 18:00–24:00. During these periods, microgrid 2 faces a power shortage, prompting electricity transfers from microgrid 1 and purchases from the external grid. In the high electricity price period of 20:00–22:00, the energy storage system discharges, reducing the external electricity purchase and lowering the operating cost. During other dispatch periods, microgrid 2 exchanges a small amount of electricity with microgrid 1. The power load in microgrid 2 is balanced and coordinated through the interaction of photovoltaic power generation, CHP units, CCS and P2G consumption, energy storage charging and discharging, and electricity purchases from the external grid. As shown in Figure 8c, microgrid 3 has the same photovoltaic generation period as microgrid 2 but generates a larger amount of power. The system maintains a balanced power load and there is no phenomenon of abandonment of light. Microgrid 2, using conventional CHP units, has a lower power demand than microgrid 3, which results in microgrid 3 purchasing a small amount of electricity from the external grid, while microgrid 1 also supplies a small amount of power to microgrid 3. During the 19:00–21:00 period, the energy storage system discharges. Additionally, during periods of excess photovoltaic generation, renewable energy is absorbed, and electricity is exchanged with microgrid 1.
The optimization dispatch results for the thermal load balance and equipment output of each IEM are illustrated in Figure 9. As shown in Figure 9a, in microgrid 1, the gas boiler and gas turbine jointly supply the thermal demand. The thermal load varies significantly throughout the day, peaking during 08:00–18:00. The CHP unit operates continuously, and its heat output, together with that of the gas boiler, effectively tracks the optimized thermal load curve, ensuring stable internal thermal balance.
As shown in Figure 9b, the thermal load of microgrid 2 exhibits moderate fluctuations, with higher demand observed between 07:00 and 20:00. The CHP unit serves as the main heat source, while the gas boiler supplements during peak-load periods. The coordinated operation between the CHP and boiler ensures the optimized thermal load closely matches the actual demand, achieving efficient thermal utilization and system stability. As shown in Figure 9c, microgrid 3 demonstrates similar thermal behavior to microgrid 2 but with slightly lower load magnitude. The CHP and gas boiler outputs are dynamically adjusted to follow the optimized thermal load profile, maintaining thermal balance within the system. Throughout the dispatch period, the optimization effectively eliminates excess heat production and minimizes operating costs by coordinating the output of thermal generation equipment.
In the IEM system, the heat load is supplied by both the CHP unit and the gas boiler. When the CHP unit’s heat output is insufficient to meet the system’s heat demand, the gas boiler supplements the heat generation. However, the heating capacity of the gas boiler is constrained by the output of the gas turbine and the variations in the system’s heat load.

4.5. Analysis of the Results of Power Interaction Between Multiple Microgrids

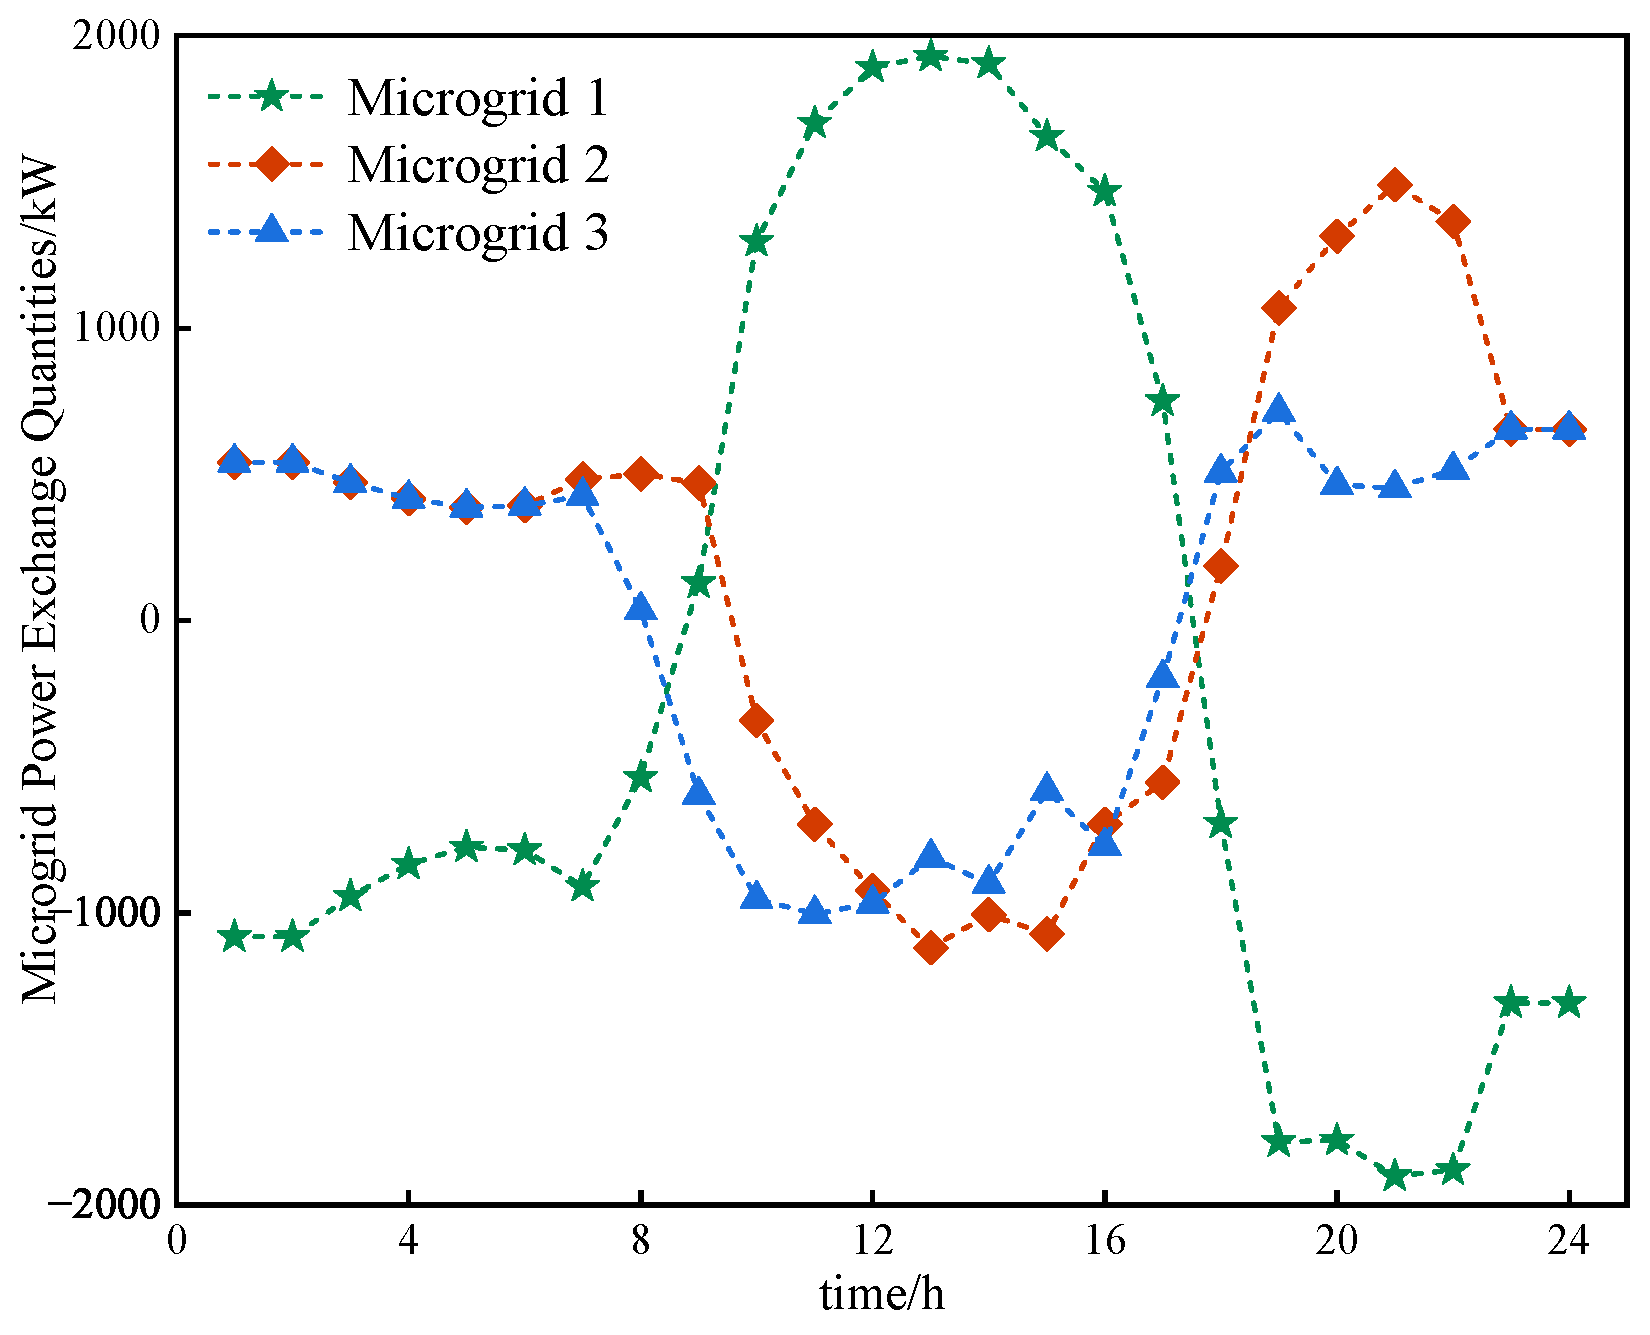
The results of power interaction between microgrids in the day-ahead optimization stage are shown in Figure 10.
As shown in Figure 10, the load demand of microgrid 1 is low during the periods of 01:00–08:00 and 18:00–24:00, while wind power generation is surplus. Consequently, the system transfers the excess power to microgrid 2 and microgrid 3. From 09:00 to 17:00, the load demand of microgrid 1 increases, leading to a power shortage. Since the overall load demand of microgrid 2 and microgrid 3 remains low, they supply the surplus power to microgrid 1 to meet its demand. This demonstrates that the proposed distributed energy management strategy enhances system adaptability and responsiveness to fluctuations in energy demand by promoting energy complementarity and sharing among microgrids. It also significantly improves the overall operational efficiency and economic performance of the microgrid system.

4.6. Analysis of Multi-Microgrid Dispatch Results Under Different Schemes

This paper presents four different schemes and evaluates the rationality of the proposed model by analyzing the discrepancies in the microgrid dispatch results across these schemes. The dispatch strategy proposed in this paper. The operational results of the IEM for each of these four schemes are summarized in Table 3.
As shown in Table 3, taking microgrid 1 as an example, Scheme 1 results in a 54.2% reduction in operating costs, a 40.9% decrease in carbon emissions, and a 45% reduction in the share of renewable energy generation compared to Scheme 4. The IEM further enhances the energy dispatch outcomes through comprehensive demand response and energy-sharing strategies. These measures reduce the electricity purchased from the external grid, increase the consumption of renewable energy, and lower carbon dioxide emissions, thereby yielding carbon benefits for the system, cutting operating costs, and improving both the economic and environmental performance of the microgrid system. The details of Scheme 4 are shown in Table 4.
Comparing Scheme 2 with Scheme 4, it is evident that operating costs are reduced by 16.7%, carbon emissions decrease by 7.6%, and the proportion of renewable energy generation is reduced by 1.2%. After the microgrid system joins energy sharing, the IEM realize energy efficient utilization and energy regulation through energy sharing, increase the output of renewable energy, reduce energy procurement costs and carbon emissions, and further increase carbon income from the carbon market.
Comparing Scheme 3 with Scheme 4, operating costs are reduced by 42%, carbon emissions decrease by 27.4%, and the share of renewable energy generation is reduced by 6.5%. With the introduction of a comprehensive demand response mechanism for microgrid loads, the demand side can adjust its load in real-time based on system needs, optimizing the system’s operational potential. This effectively promotes energy supply-demand balance, avoids energy waste, and significantly alleviates the operational and dispatch burden on the system. Consequently, the stability and reliability of the entire energy system are enhanced, ensuring the continuity and efficiency of energy supply.
Finally, the calculation and solution show that the carbon dioxide emissions of microgrid 2, before and after the addition of CCS and P2G devices, are 37,718.2 kg and 32,398.9 kg, respectively, prior to participating in energy sharing. After participating in energy sharing, these values decrease to 24,027.7 kg and 23,351.2 kg, respectively. This demonstrates that CCS and P2G technologies significantly reduce carbon emissions, promote the system’s low-carbon operation, and assist the power industry in achieving dual carbon goals.
In summary, the effectiveness of the dispatching strategy proposed in this paper is proved.Each microgrid in the integrated multi-microgrid energy system significantly reduces carbon dioxide emissions and enhances renewable energy consumption. This leads to reduced operating costs and improves both the economic efficiency and environmental sustainability of the system.

5. Conclusions

To achieve the carbon peak and carbon neutrality goals, renewable energy development is emphasized, and an IEM based on new energy is proposed. The core innovation of the proposed coordinated dispatch strategy lies in systematically enhancing the intrinsic robustness of multi-microgrid systems through multi-mechanism integration and a distributed architecture. This paper first introduces CCS and P2G technologies, along with their equipment architecture and technical principles, and then analyzes the joint operation mechanism of CCS-P2G-CHP. The coupling application principle of these three technologies is also examined, followed by the establishment of a framework for an integrated energy multi-microgrid that incorporates CCS-P2G. The core innovation of the proposed coordinated dispatch strategy lies in systematically enhancing the intrinsic robustness of multi-microgrid systems through multi-mechanism integration and a distributed architecture. The system utilizes information and communication technology through an energy management system to enable power sharing and information interaction, thereby improving the energy utilization rate across the multi-microgrid network. A low-carbon economic dispatch optimization model is then developed, incorporating both electrical and thermal load demand response mechanisms with incentives such as carbon trading, green certificate trading, and minimized total operating costs. Finally, a distributed dispatch model for the integrated energy multi-microgrid based on the ADMM is proposed, and the model is solved through iterative optimization. The following conclusions can be drawn:
(1)
This paper proposes a low-carbon dispatch model for IEM containing CCS-P2G, which enhances conventional CHP units by integrating CCS and P2G technologies. The coupled operation of CCS-P2G-CHP significantly reduces carbon dioxide emissions during microgrid operation, enhances the energy dispatch management capability, and effectively promotes low-carbon system operation.
(2)
A multi-microgrid distributed energy management strategy is proposed, leveraging the energy sharing framework of the MM-IES. By enabling energy exchange among microgrids, this strategy significantly reduces the operating costs and carbon dioxide emissions of each microgrid compared to independent operation, while enhancing the renewable energy absorption rate and improving the economy of the system.
(3)
A distributed model for the MM-IES based on the ADMM is proposed. The system’s operating cost is optimized iteratively using the alternating multiplier method, requiring only a few iterations to achieve convergence. This approach enables rapid convergence, facilitates distributed dispatch, and ensures the protection of transaction information for each participating microgrid.
In future research, we will investigate the impact of renewable generation uncertainty, such as wind and solar output, on system performance by incorporating stochastic and robust optimization techniques.

Author Contributions

Conceptualization, Y.Z.; formal analysis, K.X.; investigation, Y.Z.; resources, K.X. and Y.Z.; validation, K.X.; writing—original draft preparation, Y.Z.; writing—review and editing, Y.Z., K.X., C.N., J.Y., Z.H. and Z.W.; supervision, Y.Z. and J.Y.; project administration, Y.Z.; funding acquisition, Y.Z. All authors have read and agreed to the published version of the manuscript.

Funding

This work was supported by the National Natural Science Foundation of China (No. 62473391), the Outstanding Youth Science Foundation Project in Henan Province (No. 252300421065), and the Key Research Project of Universities in Henan Province (No. 25A470007, 26A470020).

Data Availability Statement

The original contributions presented in this study are included in the article. Further inquiries can be directed to the corresponding author.

Acknowledgments

The authors have reviewed and edited the output and take full responsibility for the content of this publication.

Conflicts of Interest

The authors declare no conflicts of interest.

References

  1. Liang, H.; Xu, L.; Zhao, Y.; Zhang, S.; Chen, C.; Tang, J.; Yang, L.; Lin, Z. Day-Ahead Joint Scheduling of Multiple Park-Level Integrated Energy Systems Considering Coupling Uncertainty of Electricity-Carbon-Gas Prices. Int. J. Electr. Power Energy Syst. 2024, 158, 109933. [Google Scholar] [CrossRef]
  2. Li, X.; Yang, J.; Du, D.; Bu, S.; Wu, L.; Chung, C.Y.; Li, K. A Review of Optimal Scheduling and Distributed Cooperative control for Smart Grids Integrated with Electric Vehicles. J. Mod. Power Syst. Clean Energy 2025. [Google Scholar] [CrossRef]
  3. Bracco, S.; Dentici, G.; Siri, S. Economic and Environmental Optimization Model for the Design and Operation of a Combined Heat and Power Distributed Generation System in an Urban Area. IEEE Trans. Sustain. Energy 2013, 55, 1014–1024. [Google Scholar] [CrossRef]
  4. Xu, D.; Hu, A.; Lam, C.-S.; Yang, X.; Jin, X. Cooperative Planning of Multi-Energy System and Carbon Capture, Utilization and Storage. IEEE Trans. Sustain. Energy 2024, 15, 2718–2732. [Google Scholar] [CrossRef]
  5. Dong, W.; Lu, Z.; He, L.; Geng, L.; Guo, X.; Zhang, J. Low-Carbon Optimal Planning of an Integrated Energy Station Considering Combined Power-to-Gas and Gas-Fired Units Equipped With Carbon Capture Systems. Int. J. Electr. Power Energy Syst. 2022, 138, 107966. [Google Scholar] [CrossRef]
  6. Zhou, R.; Li, Y.; Sun, J.; Zhang, H.; Liu, D. Low-Carbon Economic Dispatch Considering Carbon Capture Unit and Demand Response Under Carbon Trading. In Proceedings of the Low-Carbon Economic Dispatch Considering Carbon Capture Unit and Demand Response Under Carbon Trading, Xi’an, China, 25–28 October 2016; pp. 1435–1439. [Google Scholar]
  7. Guo, W.; Xu, X. Comprehensive Energy Demand Response Optimization Dispatch Method Based on Carbon Trading. Energies 2022, 15, 3128. [Google Scholar] [CrossRef]
  8. Yang, D.; Wang, M. Optimal Operation of an Integrated Energy System by Considering the Multi-Energy Coupling, AC-DC Topology, and Demand Responses. Int. J. Electr. Power Energy Syst. 2021, 129, 106826. [Google Scholar] [CrossRef]
  9. Li, X.; Wang, W.; Wang, H.; Wu, J.; Fan, X.; Xu, Q. Dynamic Environmental Economic Dispatch of Hybrid Renewable Energy Systems Based on Tradable Green Certificates. IEEE Trans. Smart Grid 2020, 193, 116699. [Google Scholar] [CrossRef]
  10. Yang, D.; Xu, Y.; Liu, X.; Jiang, C.; Nie, F.; Ran, Z. Economic-Emission Dispatch Problem in Integrated Electricity and Heat System Considering Multi-Energy Demand Response and Carbon Capture Technologies. Energy 2022, 253, 124153. [Google Scholar] [CrossRef]
  11. Ma, T.; Pei, W.; Xiao, H.; Yang, Y.; Ma, L. A Joint Power and Renewable Energy Certificate Trading Method in the Peer-to-Peer Market. IEEE Trans. Smart Grid 2025, 16, 1604–1618. [Google Scholar] [CrossRef]
  12. Liu, Z.; Zheng, W.; Qi, F.; Wang, L.; Zou, B.; Wen, F.; Xue, Y. Optimal Dispatch of a Virtual Power Plant Considering Demand Response and Carbon Trading. Energies 2018, 11, 1488. [Google Scholar] [CrossRef]
  13. Huang, W.; Zhang, N.; Kang, C.; Li, M.; Huo, M. From Demand Response to Integrated Demand Response: Review and Prospect of Research and Application. Prot. Control Mod. Power Syst. 2019, 4, 12. [Google Scholar] [CrossRef]
  14. Li, C.; Yan, Z.; Yao, Y.; Deng, Y.; Shao, C.; Zhang, Q. Coordinated Low-Carbon Dispatching on Source-Demand Side for Integrated Electricity-Gas System Based on Integrated Demand Response Exchange. IEEE Trans. Power Syst. 2024, 39, 1287–1303. [Google Scholar] [CrossRef]
  15. Zheng, S.; Sun, Y.; Qi, B.; Li, B. Incentive-Based Integrated Demand Response Considering S&C Effect in Demand Side with Incomplete Information. IEEE Trans. Smart Grid 2022, 13, 4465–4482. [Google Scholar]
  16. Shao, C.; Ding, Y.; Siano, P.; Song, Y. Optimal Scheduling of the Integrated Electricity and Natural Gas Systems Considering the Integrated Demand Response of Energy Hubs. IEEE Syst. J. 2021, 15, 4545–4553. [Google Scholar] [CrossRef]
  17. Zhao, Z.; Wang, X.; Li, Y.; Sun, Q.; Xu, X.; Zhang, Y. Distributed Robust Model Predictive Control-Based Energy Management Strategy for Islanded Multi-Microgrids Considering Uncertainty. IEEE Trans. Smart Grid 2022, 15, 2107–2120. [Google Scholar] [CrossRef]
  18. Du, Y.; Li, F. A Hierarchical Real-Time Balancing Market Considering Multi-Microgrids with Distributed Sustainable Resources. IEEE Trans. Sustain. 2020, 11, 72–83. [Google Scholar] [CrossRef]
  19. Nikmehr, N.; Najafi-Ravadanegh, S. Probabilistic Optimal Power Dispatch in Multi-microgrids Using Heuristic Algorithms. In Proceedings of the 2014 Smart Grid Conference (SGC), Tehran, Iran, 9–10 December 2014; pp. 1–6. [Google Scholar]
  20. Dong, Z.; Mao, S.; Perc, M.; Du, W.; Tang, Y. A Distributed Dynamic Event-Triggered Algorithm with Linear Convergence Rate for the Economic Dispatch Problem. IEEE Trans. Netw. Sci. Eng. 2023, 10, 500–513. [Google Scholar] [CrossRef]
  21. Qiu, H.; You, F. Decentralized-distributed Robust Electric Power Scheduling for Multi-microgrid Systems. CSEE J. Power Energy Syst. 2019, 269, 115146. [Google Scholar] [CrossRef]
  22. Qiu, H.; Gu, W.; Xu, Y.; Wu, Z.; Zhou, S.; Pan, G. Robustly Multi-microgrid Scheduling: Stakeholder-parallelizing Distributed Optimization. IEEE Trans. Sustain. Energy 2020, 11, 988–1001. [Google Scholar] [CrossRef]
  23. Mohiti, M.; Monsef, H.; Anvari-moghaddam, A.; Guerrero, J.; Lesani, H. A Decentralized Robust Model for Optimal Operation of Distribution Companies with Private Microgrids. Int. J. Electr. Power Energy Syst. 2019, 106, 105–123. [Google Scholar] [CrossRef]
  24. Fang, X.; Hodge, B.-M.; Jiang, H.; Zhang, Y. Decentralized Wind Uncertainty Management: Alternating Direction Method of Multipliers based Distributionally-robust Chance Constrained Optimal Power Flow. Appl. Energy 2019, 239, 938–947. [Google Scholar] [CrossRef]
  25. Du, Y.; Zhang, W.; Zhang, T. ADMM-based Distributed State Estimation for Integrated Energy System. CSEE J. Power Energy Syst. 2019, 5, 275–283. [Google Scholar] [CrossRef]
  26. Ma, W.-J.; Wang, J.; Gupta, V.; Chen, C. Distributed Energy Management for Networked Microgrids Using online ADMM with Regret. IEEE Trans. Smart Grid 2018, 9, 847–856. [Google Scholar] [CrossRef]
  27. Wang, S.; Wu, W.; Lin, C.; Chen, B. A Dynamic Equivalent Energy Storage Model of Natural Gas Networks for Joint Optimal Dispatch of Electricity-Gas Systems. IEEE Trans. Sustain. Energy 2024, 15, 621–632. [Google Scholar] [CrossRef]
  28. Zhao, Y. Optimal Dispatch and Pricing of Industrial Parks Considering CHP Mode Switching and Demand Response. CSEE J. Power Energy Syst. 2024, 10, 2174–2185. [Google Scholar] [CrossRef]
  29. Shi, R.; Yan, X.; Fan, Z. Multi-Objective Scheduling Method for Integrated Energy System Containing CCS+ P2G System Using Q-Learning Adaptive Mutation Black-Winged Kite Algorithm. Sustainability 2025, 17, 5709. [Google Scholar] [CrossRef]
  30. Fan, J.; Zhang, J.; Yuan, L. Deep Low-carbon Economic Optimization Using CCUS and Two-Stage P2G with Multiple Hydrogen Utilizations for an Integrated Energy System with a High Penetration Level of Renewables. Sustainability 2024, 16, 5722. [Google Scholar] [CrossRef]
  31. Liu, Y.; Wang, Y.; Li, Y.; Xin, H. Multi-Agent Based Optimal Scheduling and Trading for Multi-Microgrids Integrated with Urban Transportation Networks. IEEE Trans. Power Syst. 2021, 36, 2197–2210. [Google Scholar] [CrossRef]
  32. Liang, S.; Lou, S.; Wu, Y.; Peng, Y. Generation Expansion Planning for Solvent-Storaged Carbon Capture Power Plants Considering the Internalization of the Carbon Emission Effects. IEEE Trans. Power Syst. 2024, 39, 2653–2667. [Google Scholar] [CrossRef]
  33. Li, X.; Zhang, T.; Zhou, Z. A Balanced Partitioning Method and Its Application on Distributed State Estimation in Power Grids. IEEE Trans. Power Syst. 2025. [Google Scholar] [CrossRef]
  34. Wang, X.; Zhu, H.; Luo, X. A Novel Optimal Dispatch Strategy for Hybrid Energy Ship Power System Based on the Improved NSGA-II Algorithm. Electr. Power Syst. Res. 2024, 232, 110385. [Google Scholar] [CrossRef]
  35. Zhang, Y.; Sun, P.; Ji, X.; Wen, F.; Yang, M.; Ye, P. Low-Carbon Economic Dispatch of Integrated Energy Systems Considering Extended Carbon Emission Flow. J. Mod. Power Syst. Clean Energy 2024, 12, 1798–1809. [Google Scholar] [CrossRef]
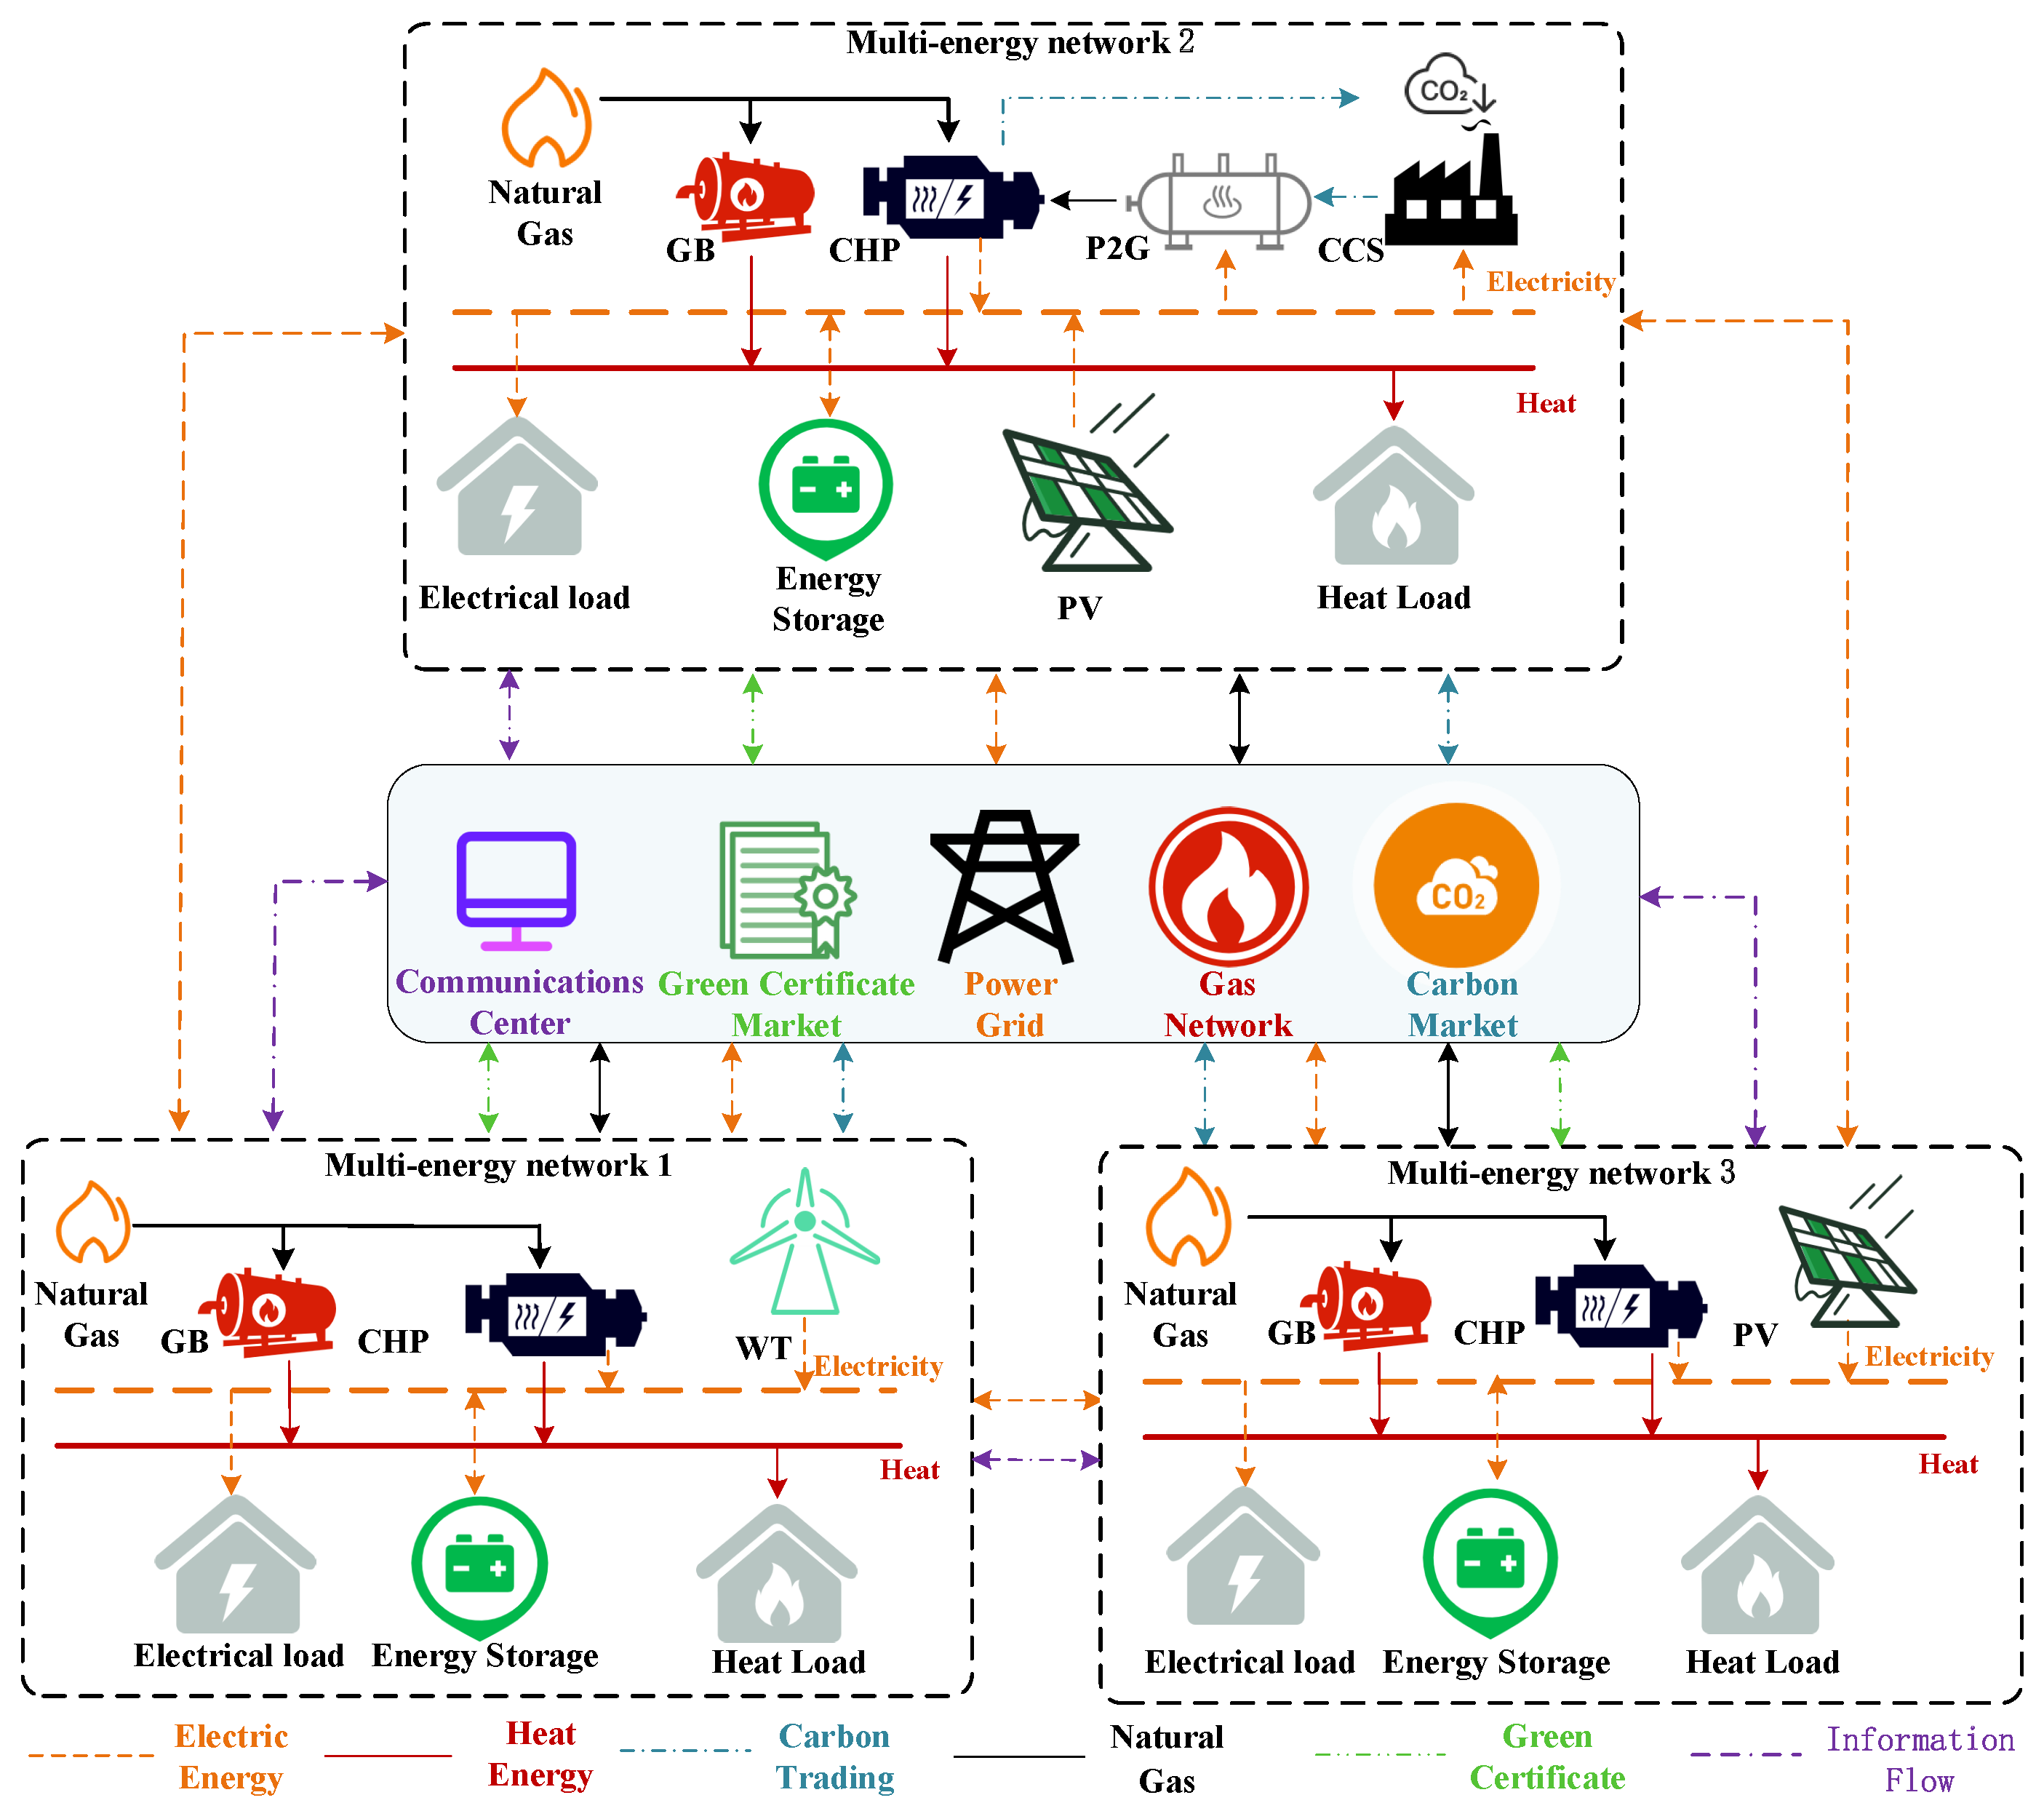
Figure 1. IEM operation framework.
Sustainability 17 10274 g001
Figure 2. Analysis of electric-thermal coupling characteristics of CHP.
Sustainability 17 10274 g002
Figure 3. Multi-microgrid optimal dispatch solution process flow.
Sustainability 17 10274 g003
Figure 4. Renewable energy generation capacity.
Sustainability 17 10274 g004
Figure 5. Electric load data of each microgrid.
Sustainability 17 10274 g005
Figure 6. Heat load data of each microgrid.
Sustainability 17 10274 g006
Figure 7. Cost optimization iteration for MM-IES.
Sustainability 17 10274 g007
Figure 8. Electric load balance and equipment output curve of each microgrid.
Sustainability 17 10274 g008
Figure 9. Thermal load balancing and equipment output curves for each microgrid.
Sustainability 17 10274 g009
Figure 10. Inter-microgrid power exchange.
Sustainability 17 10274 g010
Table 1. Parameters Of The IEM System [33,34].
ParameterValueParameterValueParameterValue
η C H P 0.35 P C C S , m a x /kW600 c C O 2 (kg/kW)18.20
η G B 0.90 α P 2 G 0.5 ρ 0.01
h 1 0.15 β C O 2 0.5 a 1 0.01329
h 2 0.20 β C C S 1.02 a 2 0.031
h m 0.85 φ c 0.95 a 3 0.031
Q C H 4 (MJ/m3)35 φ d 0.95 b 1 4.0 × 10 6
H C H P 0 /kW300 P b a t c , m a x /kW500 c 1 0.3
P C H P , m i n /kW1200 P b a t d , m a x /kW600 ξ 0.15
P C H P , m a x /kW3000 S O C e s , m i n 0.2 φ e s 0.01
P E , m i n /kW300 S O C e s , m a x 0.8 δ 1 0.424
P E , m a x /kW2100 E e s , m a x (kW·h)2000 δ 2 0.798
P P 2 G , m i n /kW0 k t r a n 0.15 a C O 2 b u y 1.08
P P 2 G , m a x /kW300 a C O 2 (kg/kW)0.55c (yuan/kg)0.25
P C C S , m i n /kW0 b C O 2 (kg/kW)0.65 c g r e (yuan/kW·h)100
Table 2. Electricity Purchase And Sales Prices And Natural Gas Prices.
Main BodyTimePrice (Yuan/(kW·h))
Electricity PricesOff-Peak Period0.40
Electricity PricesMid-Peak Period0.75
Electricity PricesPeak Period1.20
Natural gasFull Day3.50 (yuan/m3)
Table 3. Operation Results Of Integrated Energy Multi-microgrid Under Different Schemes [35].
ScenarioMain BodyOperating
Cost/Yuan
Carbon
Emissions
/kg
Carbon
Trading
Amount/Yuan
Renewable
Energy
Generation
Share/%
Scheme 1Microgrid 159,866.5977,887.87702.5826.2
Microgrid 255,749.4841,841.09−14.2830.5
Microgrid 338,197.3443,383.922912.7845.6
Scheme 2Microgrid 132,950.2449,838.68−2296.2770.0
Microgrid 240,533.8632,398.91−48.3535.9
Microgrid 327,020.1532,331.151611.9751.6
Scheme 3Microgrid 147,262.7263,419.44−330.3464.7
Microgrid 250,091.1133,266.62−577.3230.0
Microgrid 333,156.3935,968.202592.2144.6
Scheme 4Microgrid 127,439.5046,049.51−3058.8671.2
Microgrid 232,021.3623,351.22−1322.1839.2
Microgrid 322,942.0027,100.941153.2153.1
Table 4. Operational Results Of Integrated Energy Multi-microgrid Under Scheme 4 [35].
Main BodyOperating Cost of the
Scheduling Stage/Yuan
Carbon Emissions of the
Scheduling Stage/kg
Microgrid 127,439.5046,049.51
Microgrid 232,021.3623,351.22
Microgrid 322,942.0027,100.94
Disclaimer/Publisher’s Note: The statements, opinions and data contained in all publications are solely those of the individual author(s) and contributor(s) and not of MDPI and/or the editor(s). MDPI and/or the editor(s) disclaim responsibility for any injury to people or property resulting from any ideas, methods, instructions or products referred to in the content.