1. Introduction
In the pursuit of sustainable construction practices amid escalating environmental concerns, bio-based materials such as hemp concrete have emerged as promising alternatives to traditional cementitious composites, offering significant advantages, including reduced carbon emissions through renewable hemp fiber sourcing, enhanced thermal insulation for energy-efficient buildings, improved indoor air quality via natural moisture regulation, and overall contributions to circular economy principles by utilizing agricultural by-products [
1,
2]. However, the inherent complexity of these materials—characterized by a heterogeneous porous structure and the incorporation of organic bio-components like hemp shives—introduces challenges in accurately assessing their hygrothermal properties, such as water vapor permeability (WVP), which are critical for ensuring long-term durability and performance in real-world applications. Conventional testing protocols, including the standardized ISO cup method [
3], often assume idealized homogeneous conditions within environmental chambers, yet fail to account for the variability induced by multi-sample interactions, potentially leading to biased results and hindering the widespread adoption of these eco-friendly innovations; thus, there is an urgent need to refine and optimize such methodologies to enhance reliability and support the transition toward greener built environments.
Climatic chambers are widely used for conditioning and testing building materials under controlled environmental conditions. In water vapor permeability (WVP) studies—particularly those following the widely adopted ISO 12572 standard [
3]—samples are exposed to fixed temperature (23 °C) and relative humidity (RH = 50%) conditions over an extended period to stabilize their mass before measurement. General guidelines recommend that the chamber volume should be 3–5 times greater than the volume of the conditioned product [
4]. On the contrary, statistical requirements favor testing larger sample sets. Inhomogeneous structures of composites with bio-additives, such as hempcrete, call for increased thickness of tested samples, and tight laboratory schedules may further incentivize maximizing chamber occupancy. As a result, we believe that the occurrence of spatial arrangements which obstruct airflow and compromise the uniformity of environmental conditions is not rare and deserves more attention.
These concerns become more pronounced during actual WVP measurements. Unlike conditioning, which involves only the samples, the cup method requires each sample to be attached to a vessel that also contains a chemical agent—either a desiccant (dry cup) or a saturated salt solution (wet cup)—actively driving moisture absorption or emission. The combined volume of samples and vessels significantly reduces available circulation space, while active vapor exchange introduces localized humidity gradients. Limited space combined with additional sources and sinks of water vapor led us to the hypothesis of the occurrence of local zones with poor air exchange, exhibiting RH values significantly different from the indication of the chamber’s sensor. This study aims to investigate this issue with the use of CFD simulation, determining the magnitude of potential RH nonuniformities and how they translate to systematic errors in WVP calculations for the tested material, i.e., the hemp–lime concrete.
Accurate water vapor permeability (WVP) testing is essential for evaluating how construction materials manage moisture, directly influencing structural durability, biological stability, indoor air quality, and occupant comfort [
2]. Recent studies show that hemp concrete can replace conventional materials such as drywall, OSB, and EPS [
2,
5] in residential construction while maintaining satisfactory hygrothermal performance. Other investigations highlight that hemp–lime composites effectively buffer moisture, reduce vapor gradients, and contribute to healthier indoor environments [
6]. Porous hemp-based boards also provide excellent sound-dampening properties and can be rendered fire-retardant through suitable treatments [
6].
Approaches to ensuring the biological stability of such materials vary: they can be treated with antifungal agents [
7], or conversely, fungal growth can be intentionally harnessed to improve mechanical integrity [
8]. Research on mycelium-based composites (MBCs) demonstrates that fungal mycelium can be deliberately cultivated on lignocellulosic substrates—including hemp fibers and hurds—to serve as a natural binding phase rather than a contaminant. In these systems, the mycelium colonizes the hemp matrix and forms a cohesive hyphal network that binds the particles into lightweight, mechanically stable panels after drying or heat treatment [
8].
In this broader context, ensuring reliable and reproducible WVP data becomes critical. Underestimating or inconsistently measuring humidity transfer can lead to errors in predicting moisture accumulation, fungal development, or the long-term degradation of breathable bio-based walls and insulation systems.
In our work, this context justifies why we emphasize the variability and potential error sources in WVP measurements—not merely as a laboratory curiosity but as a direct link to sustainable building outcomes. If local relative humidity (RH) above a sample–vessel assembly is higher than the chamber setpoint (as our CFD results show), then the WVP calculation will be systematically biased, leading to biased modeling of the hygrothermal performance of porous building materials.
The ISO 12572 standard [
3] defines strict limits for measurement parameters during WVP testing: temperature variation must remain within ±1 %, RH within ± 5 %, and air velocity above the cup between 0.02 and 0.3 m/s. For highly permeable materials, Annex G [
3] recommends airflow velocities above 2 m/s to avoid surface-layer correction factors. Nevertheless, the exact method of velocity measurement is not specified, and the RH is typically assumed to be in accordance with the indication of the chamber control system.
Recently, many experimental studies were devoted to verify and improve the procedures of water vapor permeability testing in hemp concretes. Seng et al. [
9] examined the effects of airflow velocity, sample thickness, and incorporation of water vapor interface resistances in the calculations, showing that each of these factors caused up to a 10% difference in measured WVPs for tested scenarios, and their cumulative effect may reach even 30%. Colinart and Glouannec [
10,
11] and Pietrak et al. [
2,
12] investigated the effects of various desiccants and cup’s inner relative humidity, emphasizing that it should actually be measured rather than assumed based on tables published in the ISO 12572 standard. Finally, Colinart and Magniont [
13] presented the results of a round-robin study, where the same hemp concrete was tested by six independent laboratories using a unified experimental protocol. Authors [
13] present interesting considerations regarding the influence of air velocity and the type of desiccant on the measurement results and achieved stabilities of water vapor flux through the sample.
Despite the widespread use of climatic chambers, few studies have analyzed the uniformity of internal conditions—particularly relative humidity (RH)—and their influence on test results. As noted by Ramezani et al. [
14], only limited research has examined chamber performance through numerical or experimental methods, with most studies focusing on chamber behavior in isolation, without accounting for internal obstructions or moisture-active components. Some studies, e.g., Vololonirina and Perrin [
15], used CFD to derive velocity fields in chambers loaded with WVP test vessels, without considering moisture transport, emission, or removal.
It may appear that ensuring sufficient airflow velocity above the samples is adequate to maintain proper mass exchange and prevent large local deviations from the target RH of 50%. However, even when average airspeed is acceptable, regions of elevated or reduced RH can still form above the samples—particularly if localized circulation zones develop that exchange moisture with their surroundings to a limited extent. Our study surpasses previous numerical efforts by incorporating moisture transport effects, enabling a more refined and realistic analysis of internal chamber behavior. It verifies three vessel arrangement scenarios, revealing that two configurations led to the formation of stagnation zones and localized RH levels exceeding ISO limits, while only one arrangement maintained compliant conditions throughout the chamber. Although it focuses on a specific chamber model and measurement geometry, the findings highlight the critical influence of the internal layout on test reliability. The simulations not only demonstrate the magnitude of the issue but show that finding a compliant arrangement that functions even under crowded conditions is possible. Our work highlights the value of CFD analysis in optimizing experimental setup, and signals that the problem at hand may require further research and improvement of used standards.
3. Results and Discussion
3.1. Introduction
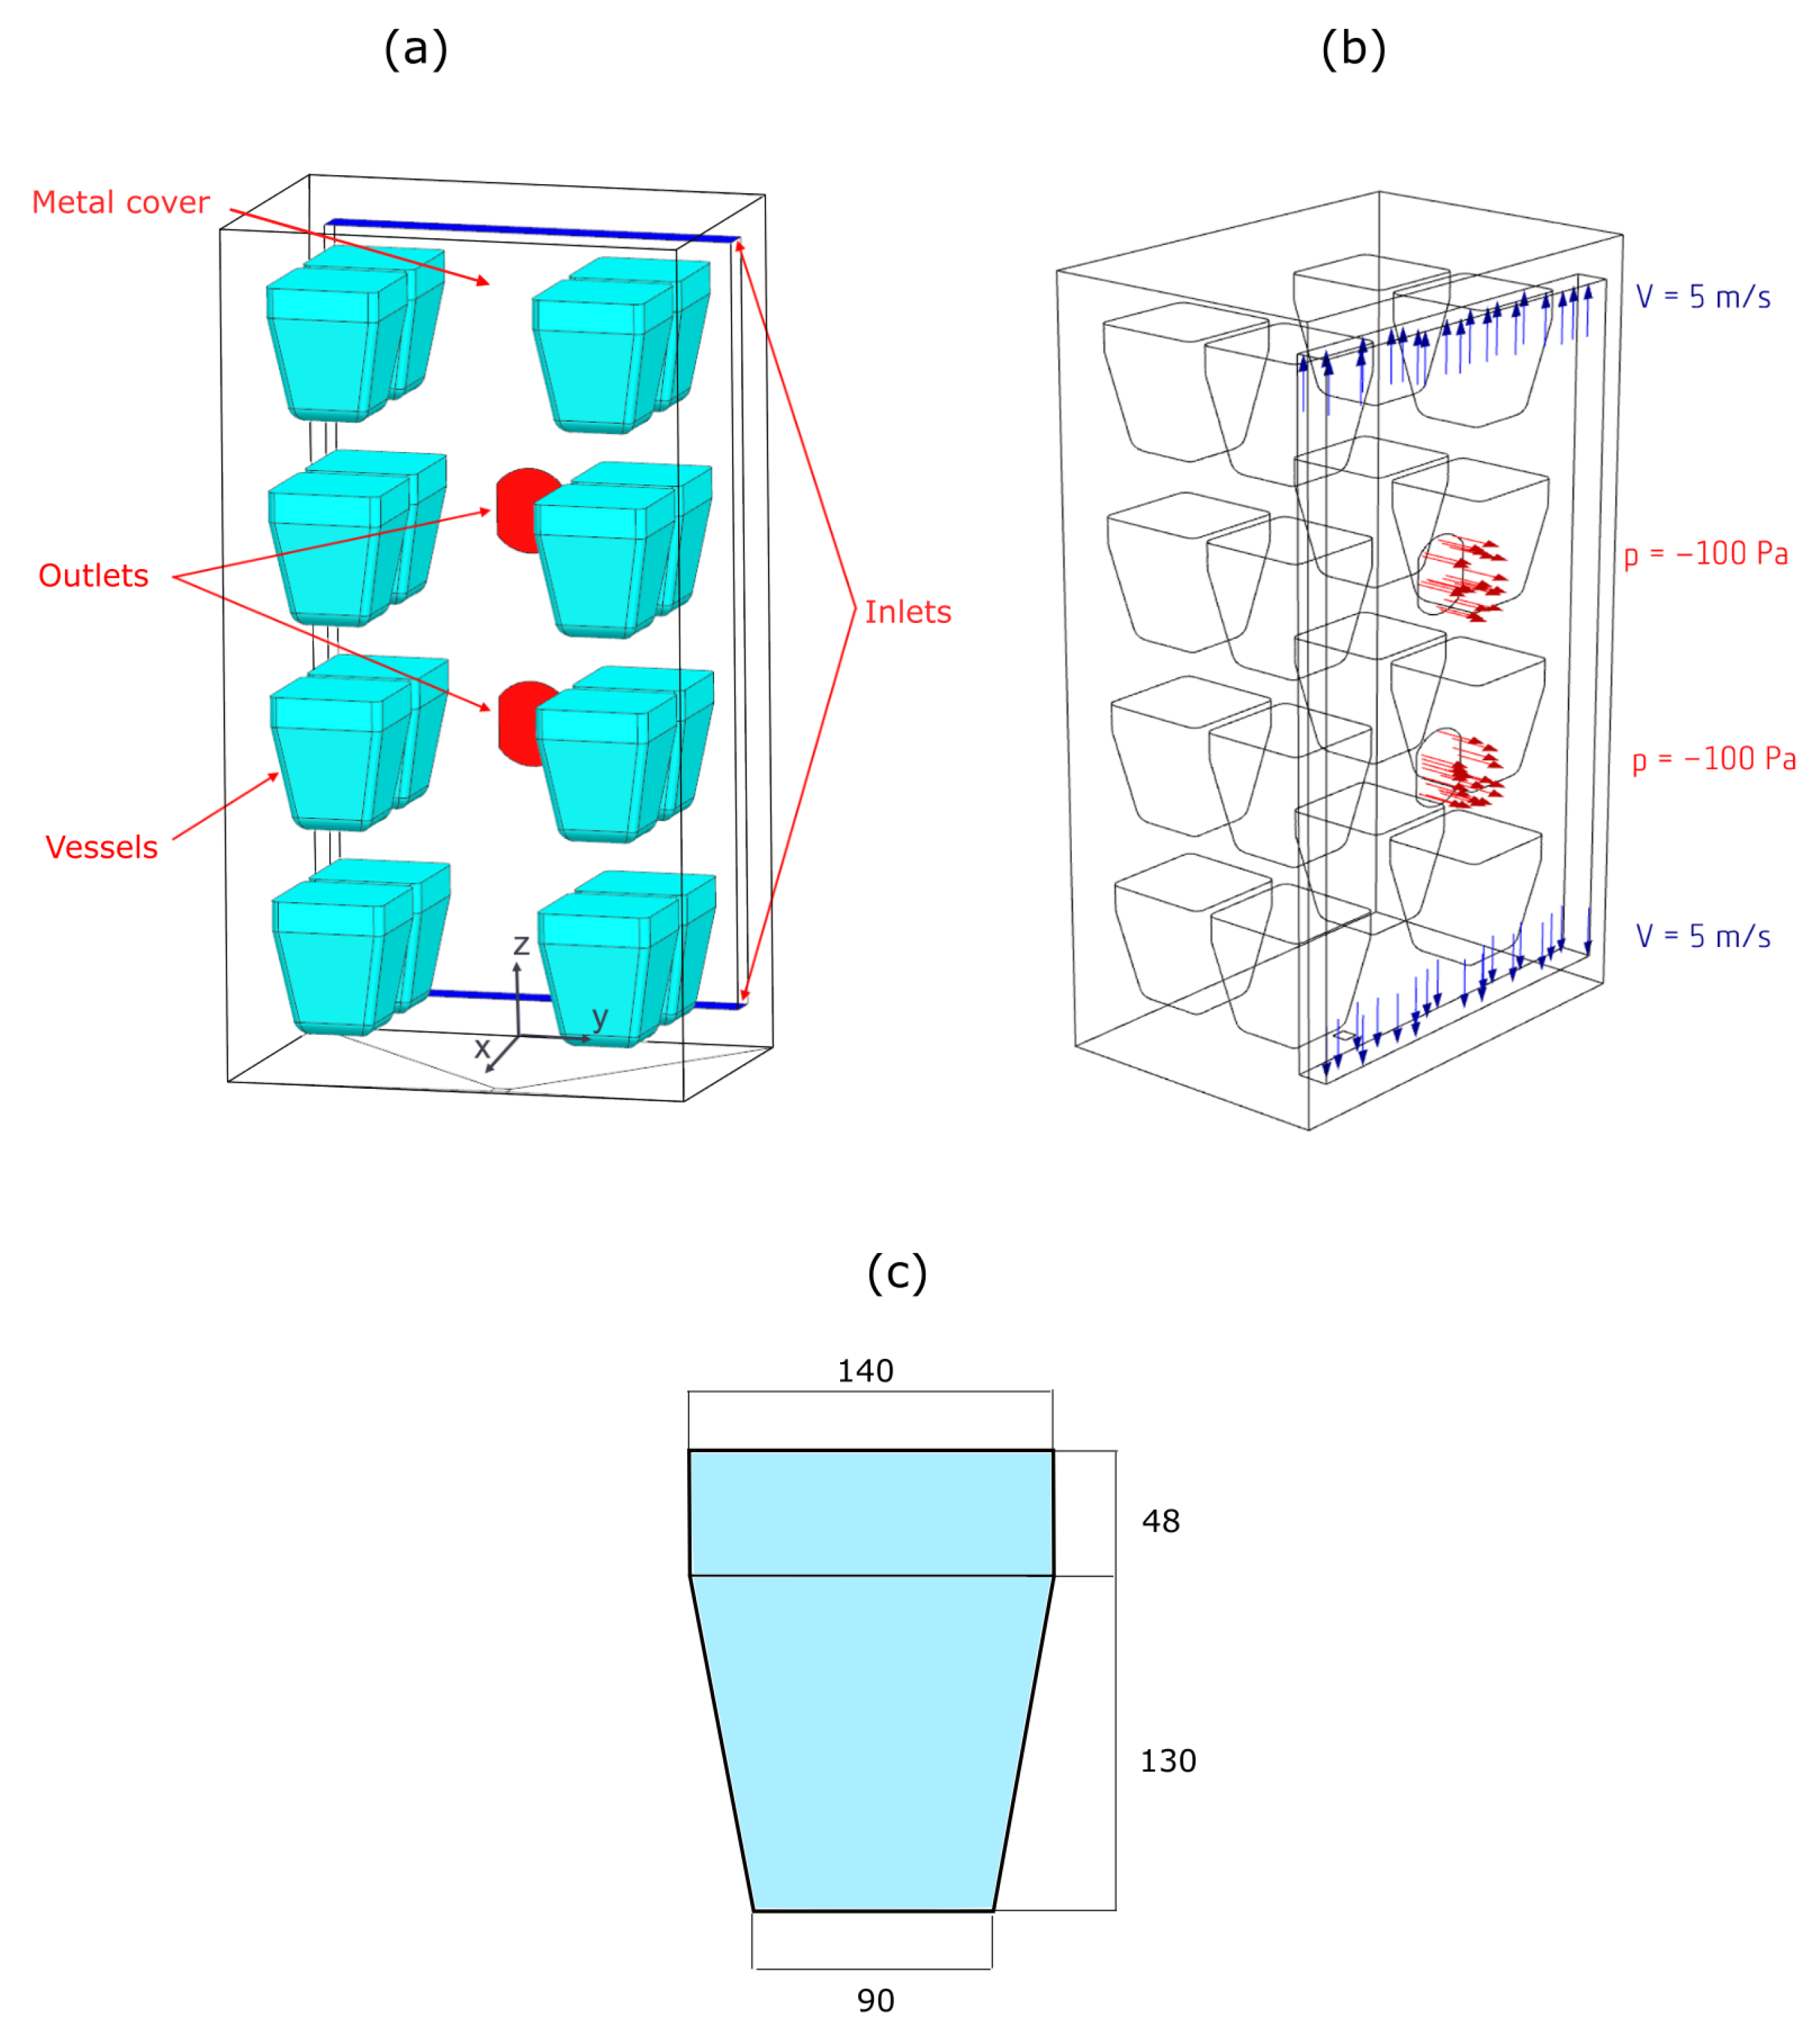
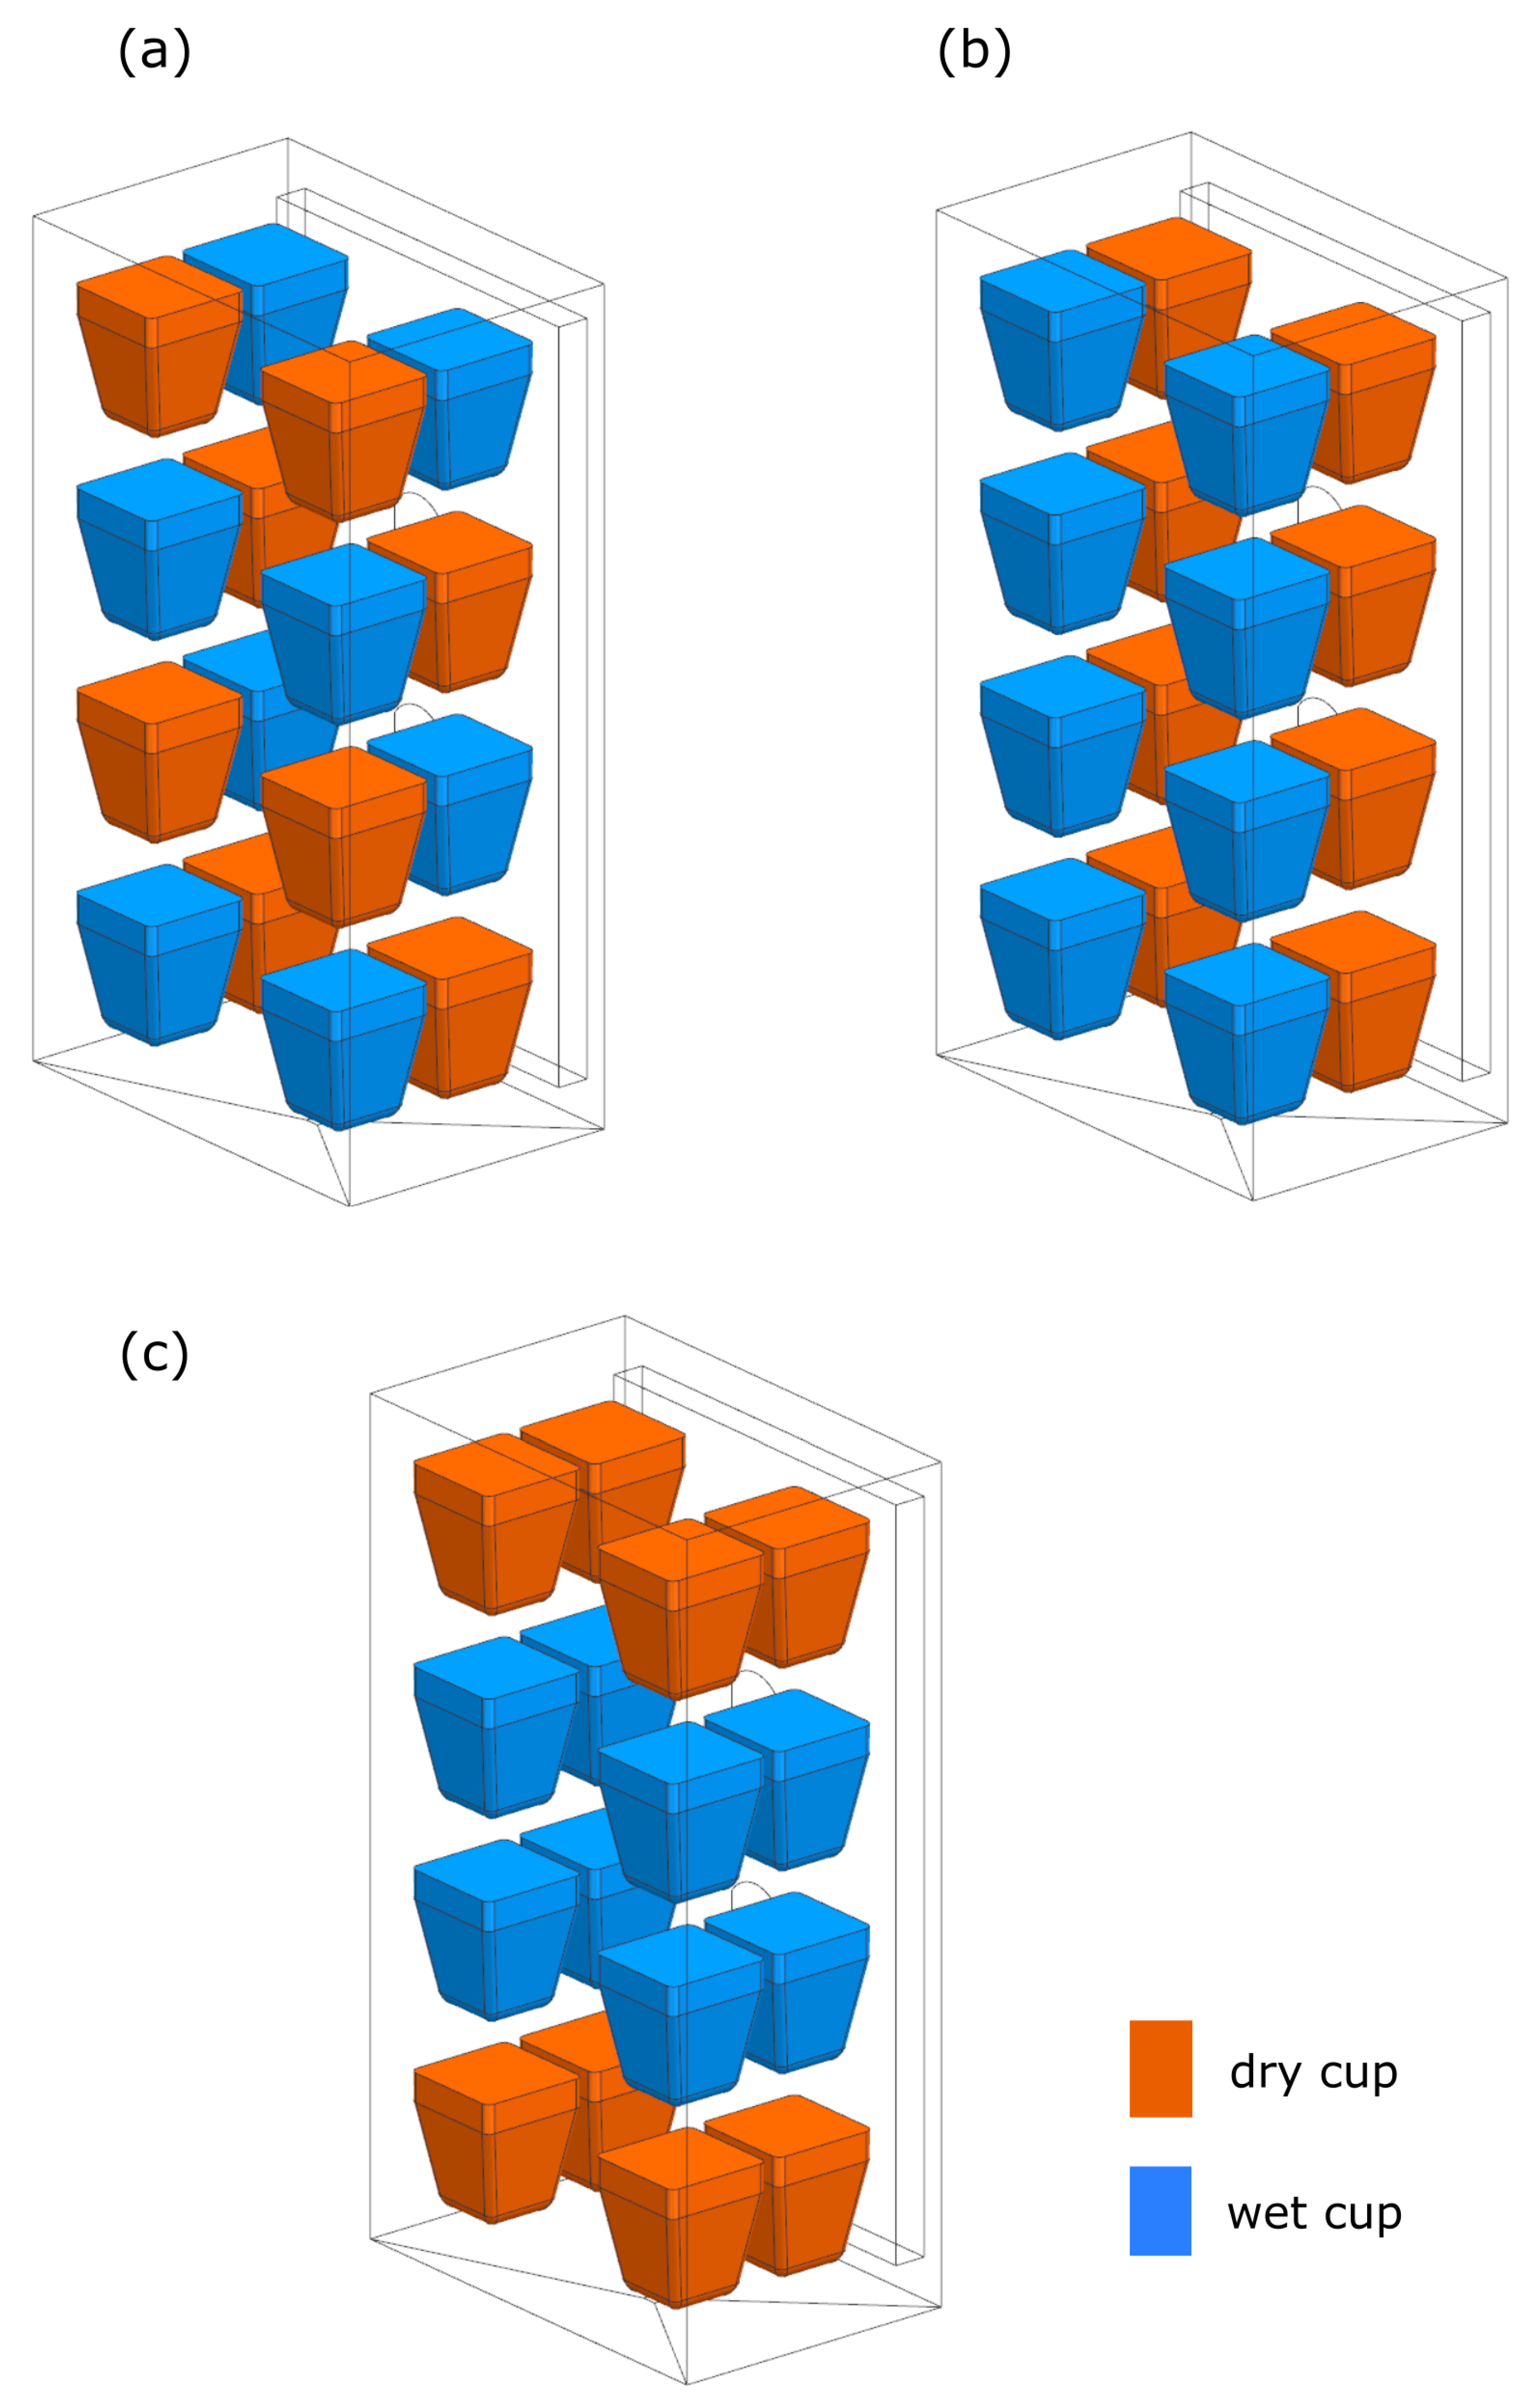
The investigation assumed that the chamber was loaded with 16 sample vessel assemblies, half configured as dry cups and the other half as wet cups, representing a typical testing scenario. Because the assemblies either emit or absorb moisture, their spatial arrangement can significantly influence local relative humidity (RH) despite forced air circulation. Two initial layouts were assumed to maximize internal uniformity by distributing an equal number of wet and dry samples on each shelf (
Figure 4a,b). However, these “common sense” layouts did not bring satisfactory homogenization results. A third layout (
Figure 4c), identified through analysis of the velocity field, yielded the most uniform RH distribution across the domain. Interestingly, this configuration would not appear optimal at first glance.
3.2. Velocity
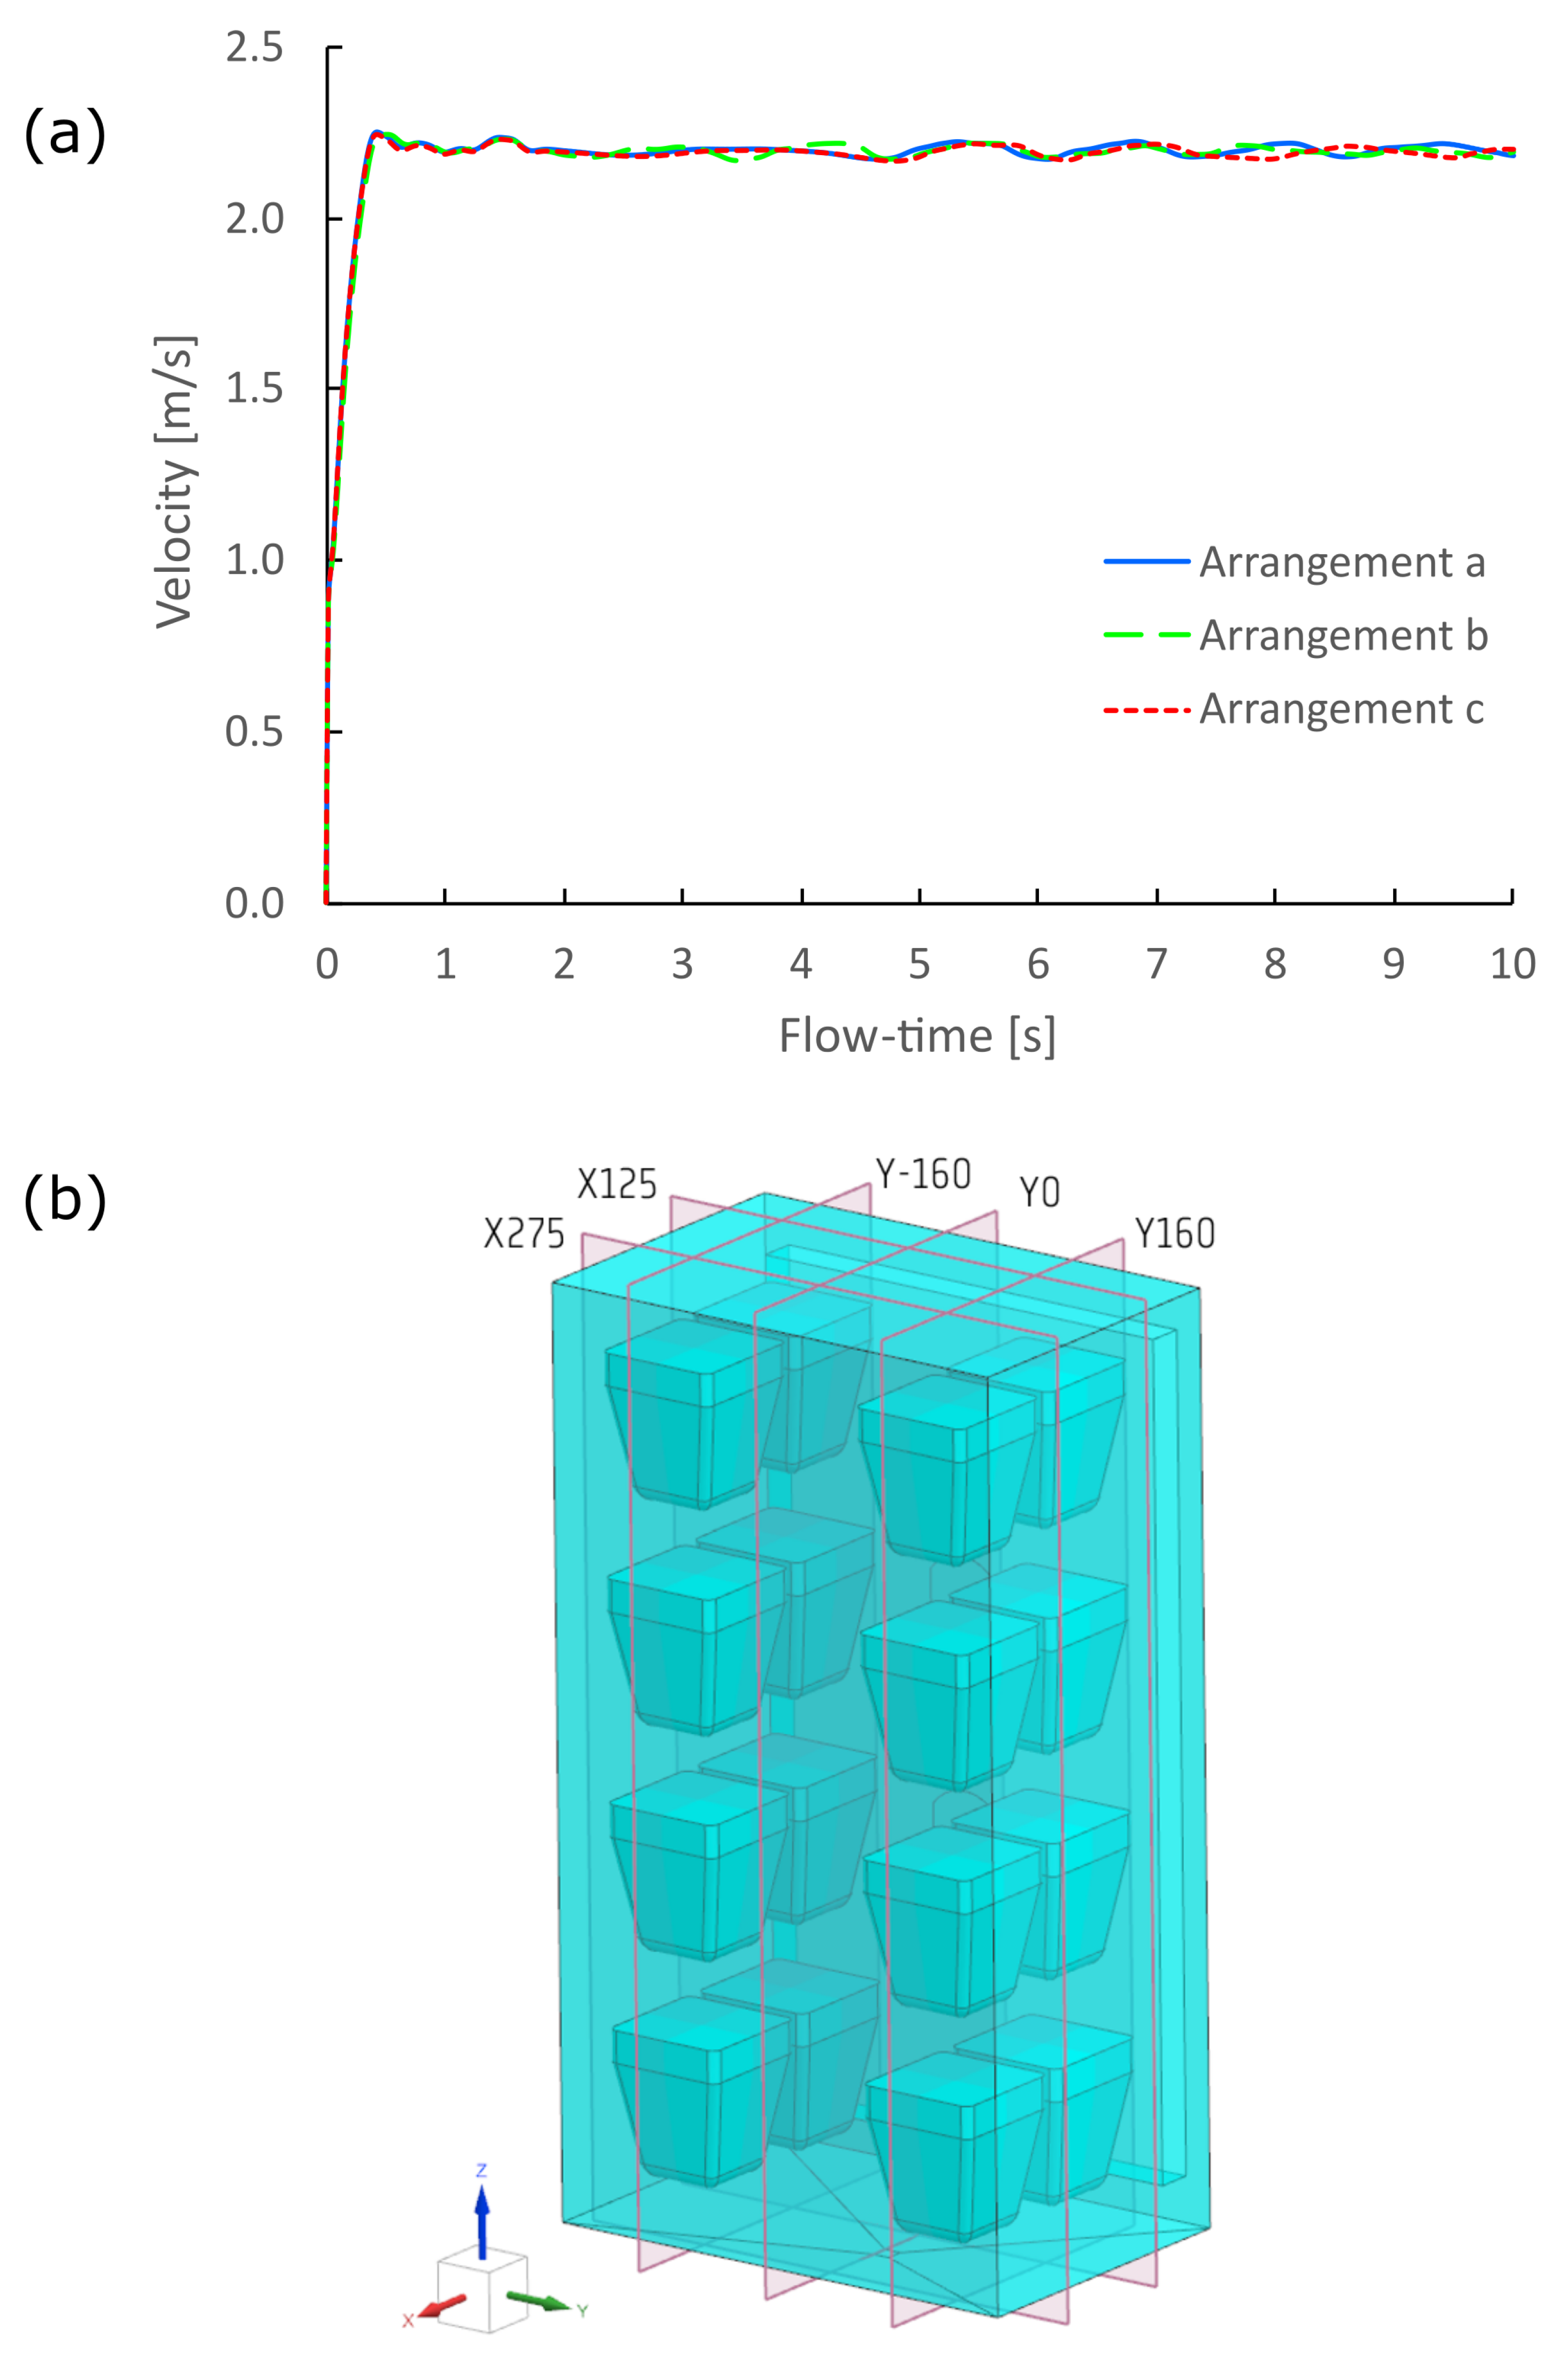
Figure 5a compares the average domain velocities for the three tested configurations. The differences are negligible at all time instants. In each case, the velocity stabilizes after approximately 10 s of flow time at around 2.25 m/s, regardless of the layout. Owing to these minimal differences, and to focus on the most relevant results (in our opinion, the local RH distributions), we chose to present detailed velocity field diagrams only for the baseline case, in which the humidity sources and sinks associated with the testing vessels were disabled. This configuration accurately illustrates the flow pattern determined solely by the chamber geometry and boundary conditions, as the fields change only insignificantly when the sources and sinks on the sample surfaces are enabled.
Figure 5b defines the characteristic planes used to present the detailed results of the velocity field, while
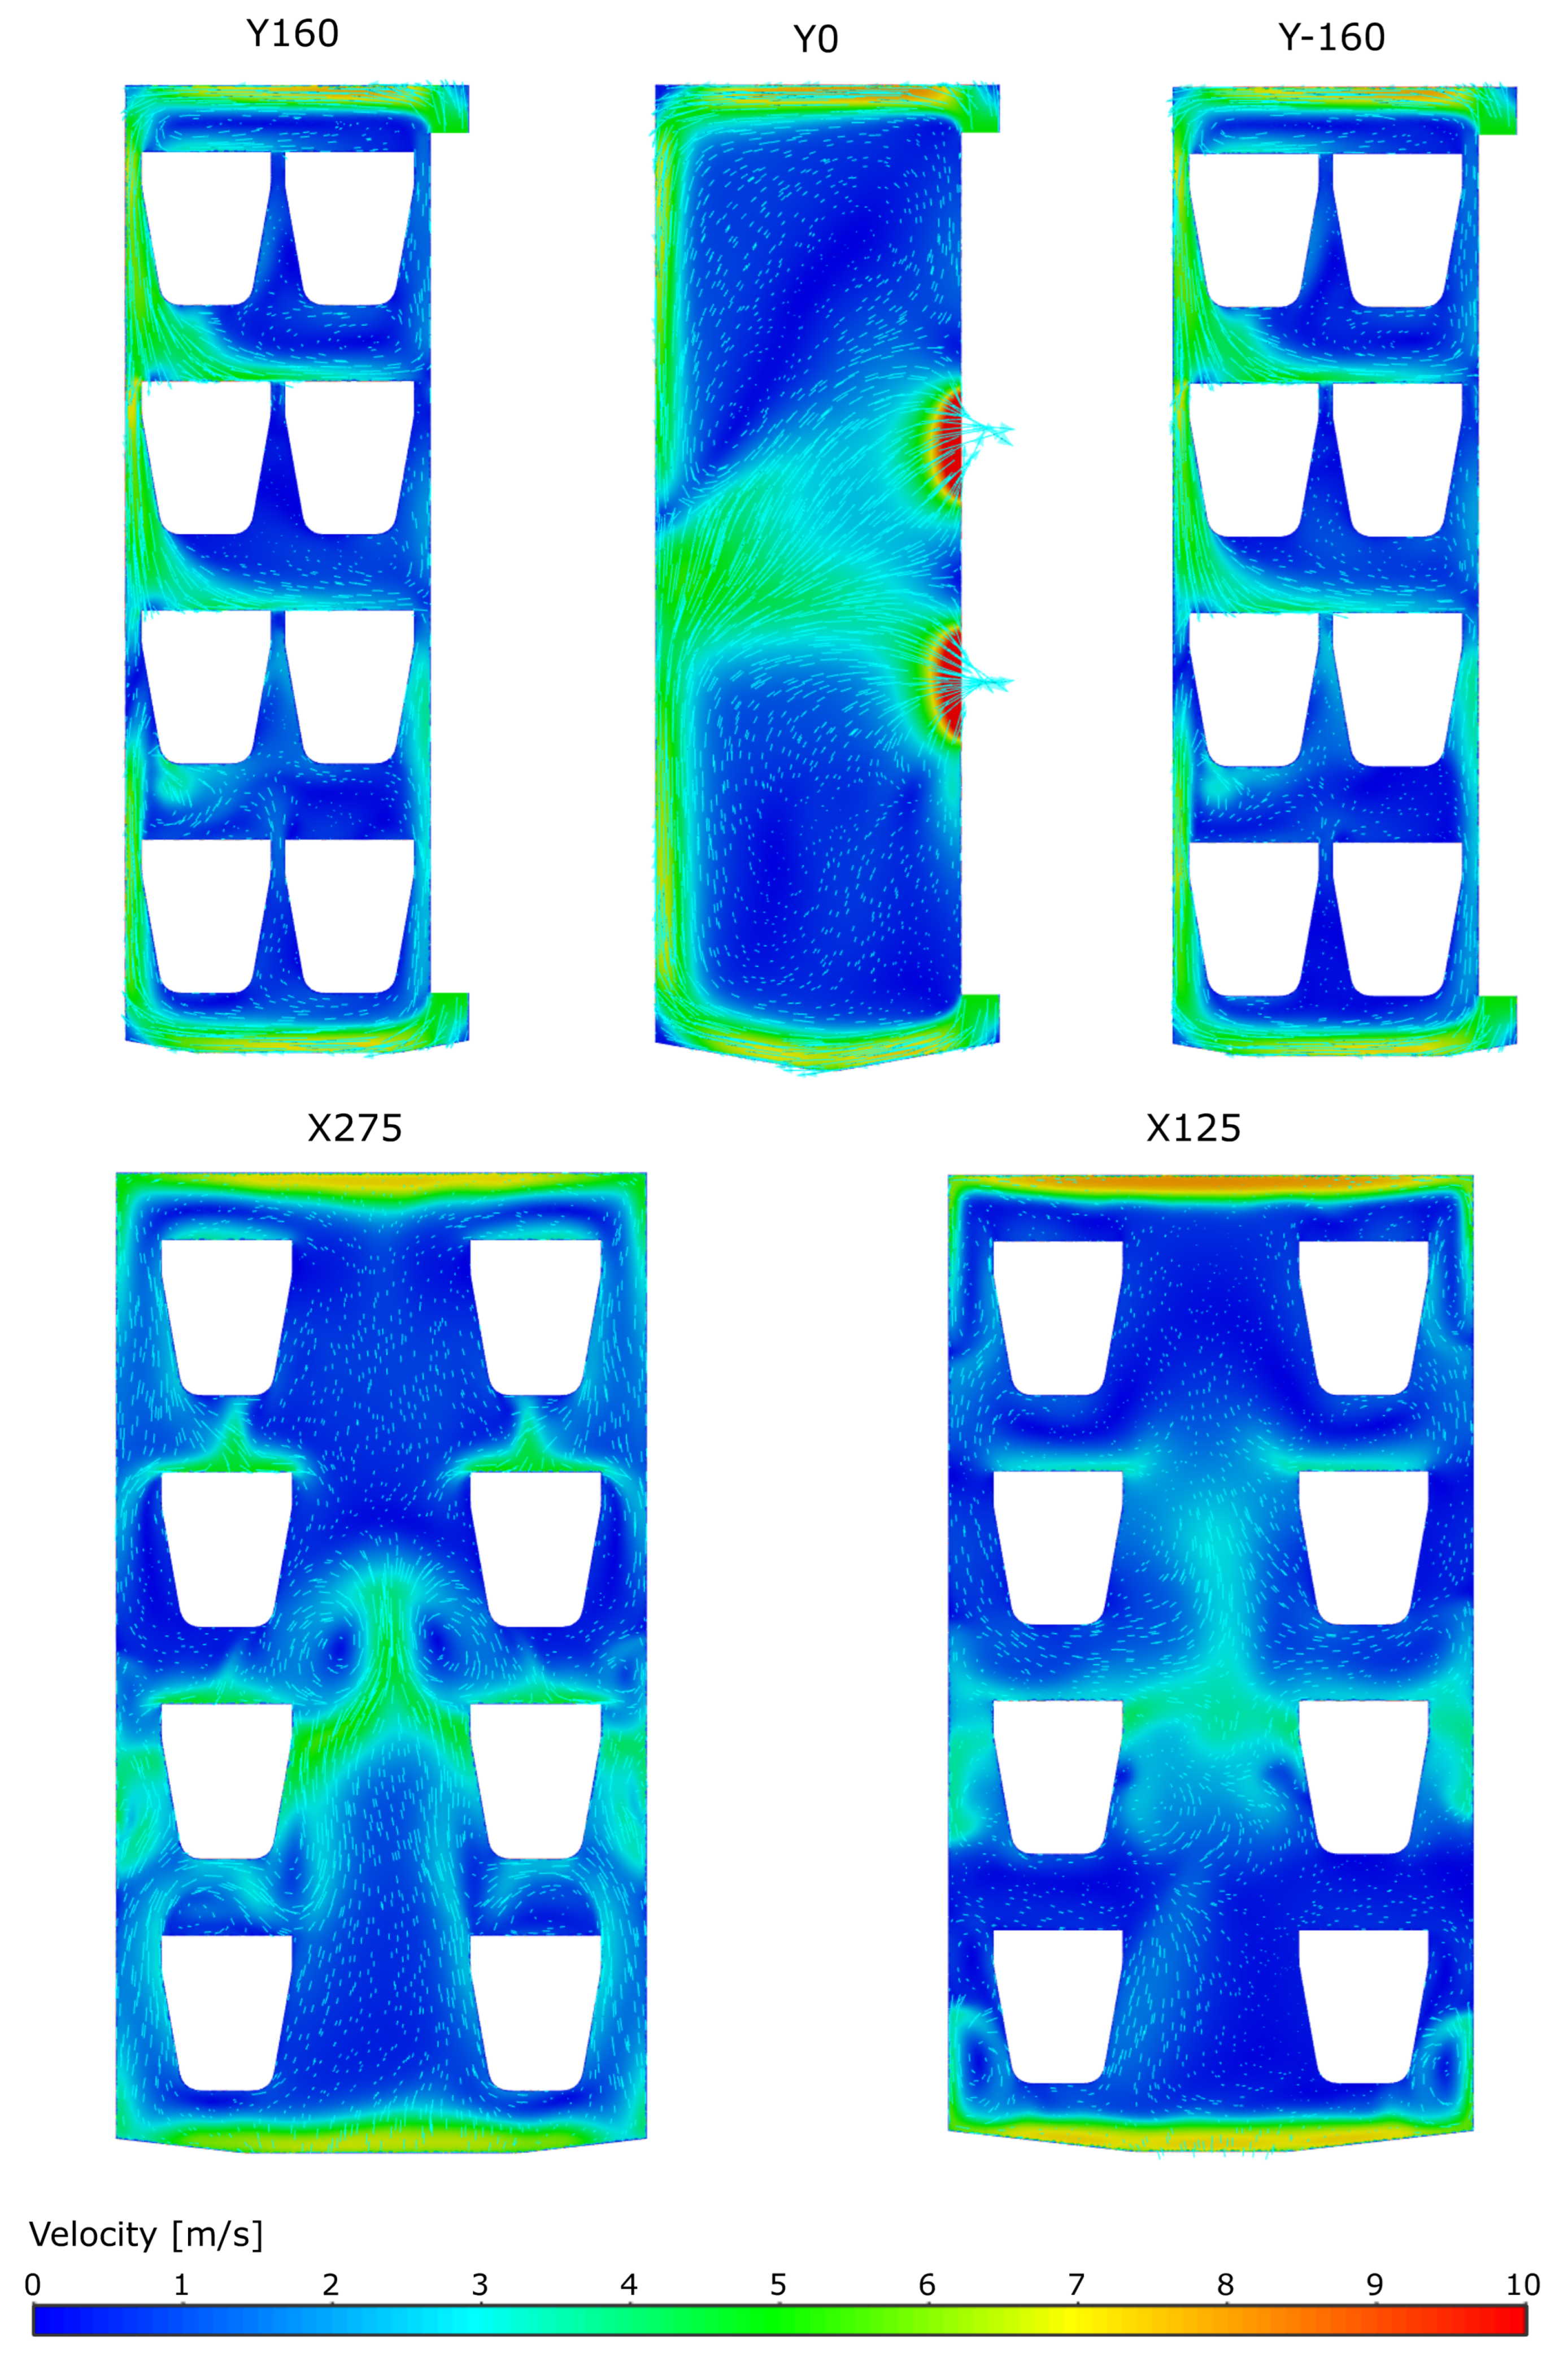
Figure 6 shows the corresponding field distributions. The planes X125, X275, Y160, and Y–160 were selected so that they intersect at representative central points above the sample–cup assemblies, enabling a clear comparison of local flow and RH conditions. The plane Y0 passes vertically through the center of the chamber. The results in
Figure 6 indicate that assemblies placed on the middle shelves satisfy the velocity criterion of exceeding 2 m/s, with air speeds above the specimen reaching 4–5 m/s. On the upper shelf, the front-row assemblies reach approximately 3–4 m/s, while the back row remains relatively stagnant, with velocities above 1 m/s only over limited surface areas. Air circulation over the bottom-shelf assemblies is weakest—mostly below 1 m/s, particularly in the back row.
Although the geometry of the sample compartment, together with the positions of the inlets, outlets, and obstacles formed by the assemblies, exhibits a degree of symmetry with respect to the central horizontal plane, the gravitational force acts downward, which explains the occurrence of the most stagnant conditions in the lower region of the chamber—particularly above the lowermost layer of sample–vessel assemblies.
A detailed examination of the velocity fields reveals that measurements taken above the samples are highly sensitive to the precise placement of the anemometer due to strong local velocity gradients. For instance, nearly stagnant conditions may occur immediately adjacent to the sample surface, while just a few centimeters higher, the flow already exceeds the 2 m/s threshold. The standard [
3] does not specify the distance above the sample at which the anemometer probe should be positioned; it only requires that the indicated velocity be at least 2 m/s. This leaves considerable room for inconsistency. Our analysis suggests that this measurement distance should be standardized to ensure reproducibility and comparability of results. It also highlights the value of CFD simulations as a complementary tool for verifying experimental measurements.
3.3. Relative Humidity
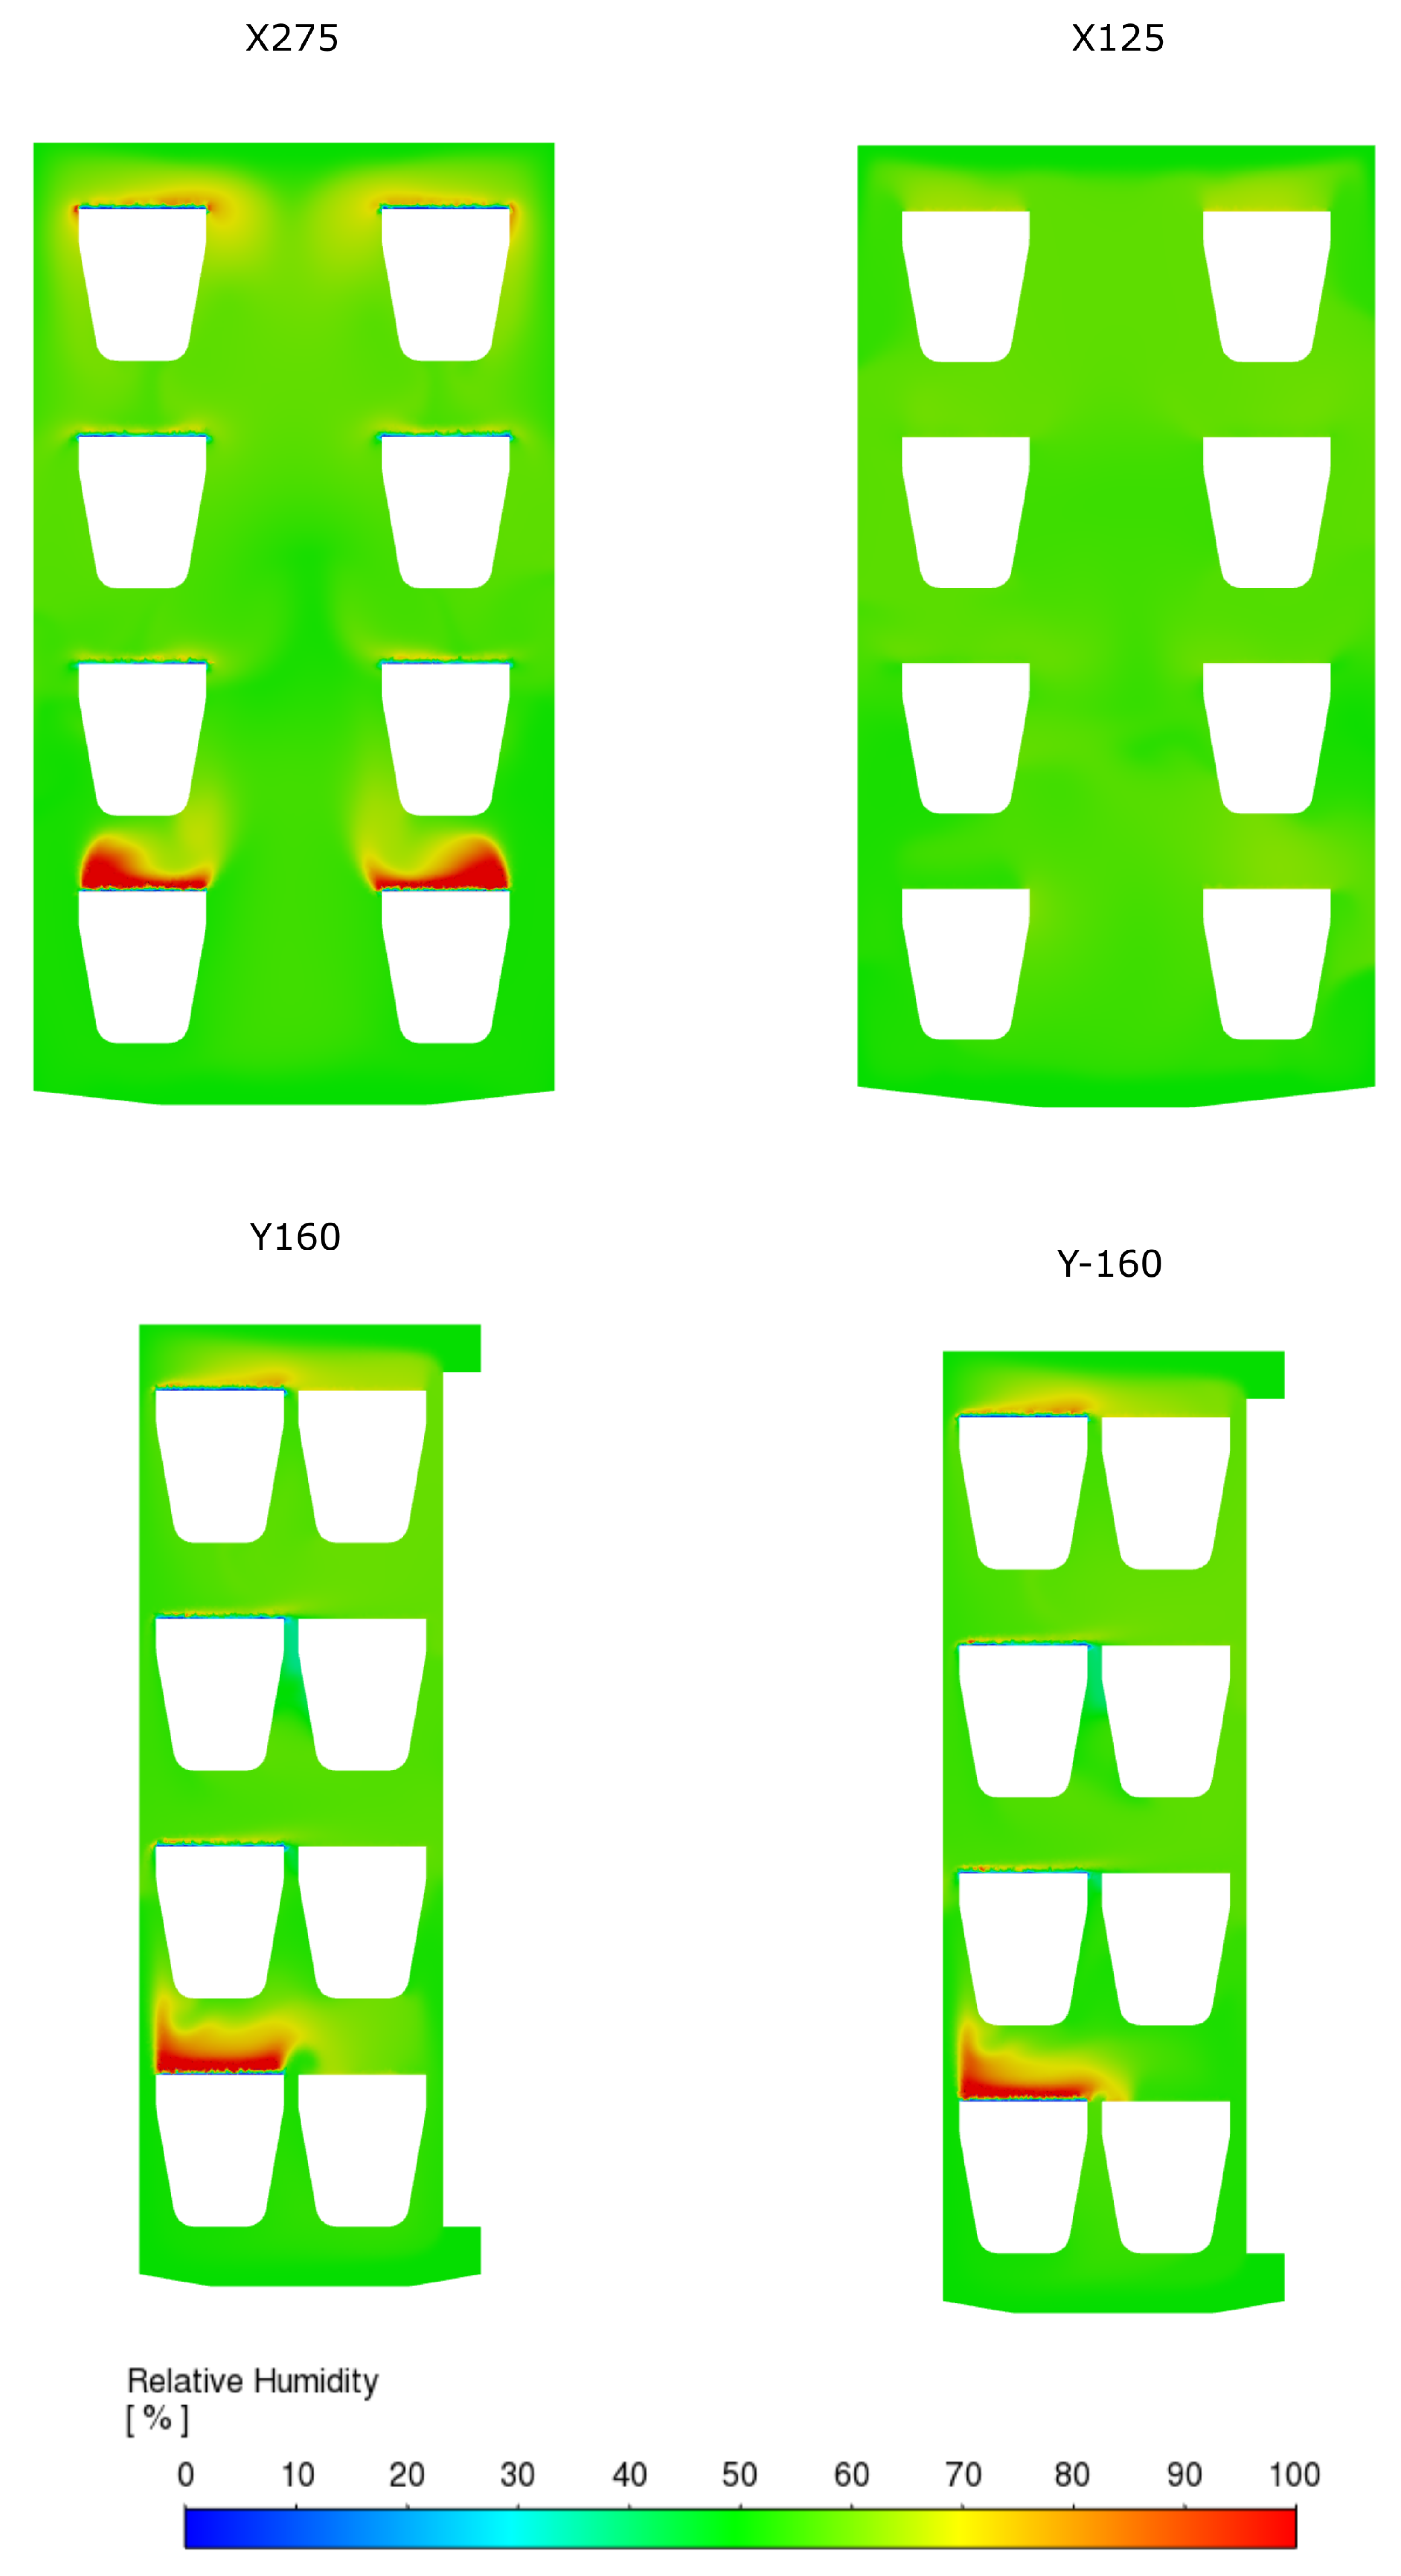
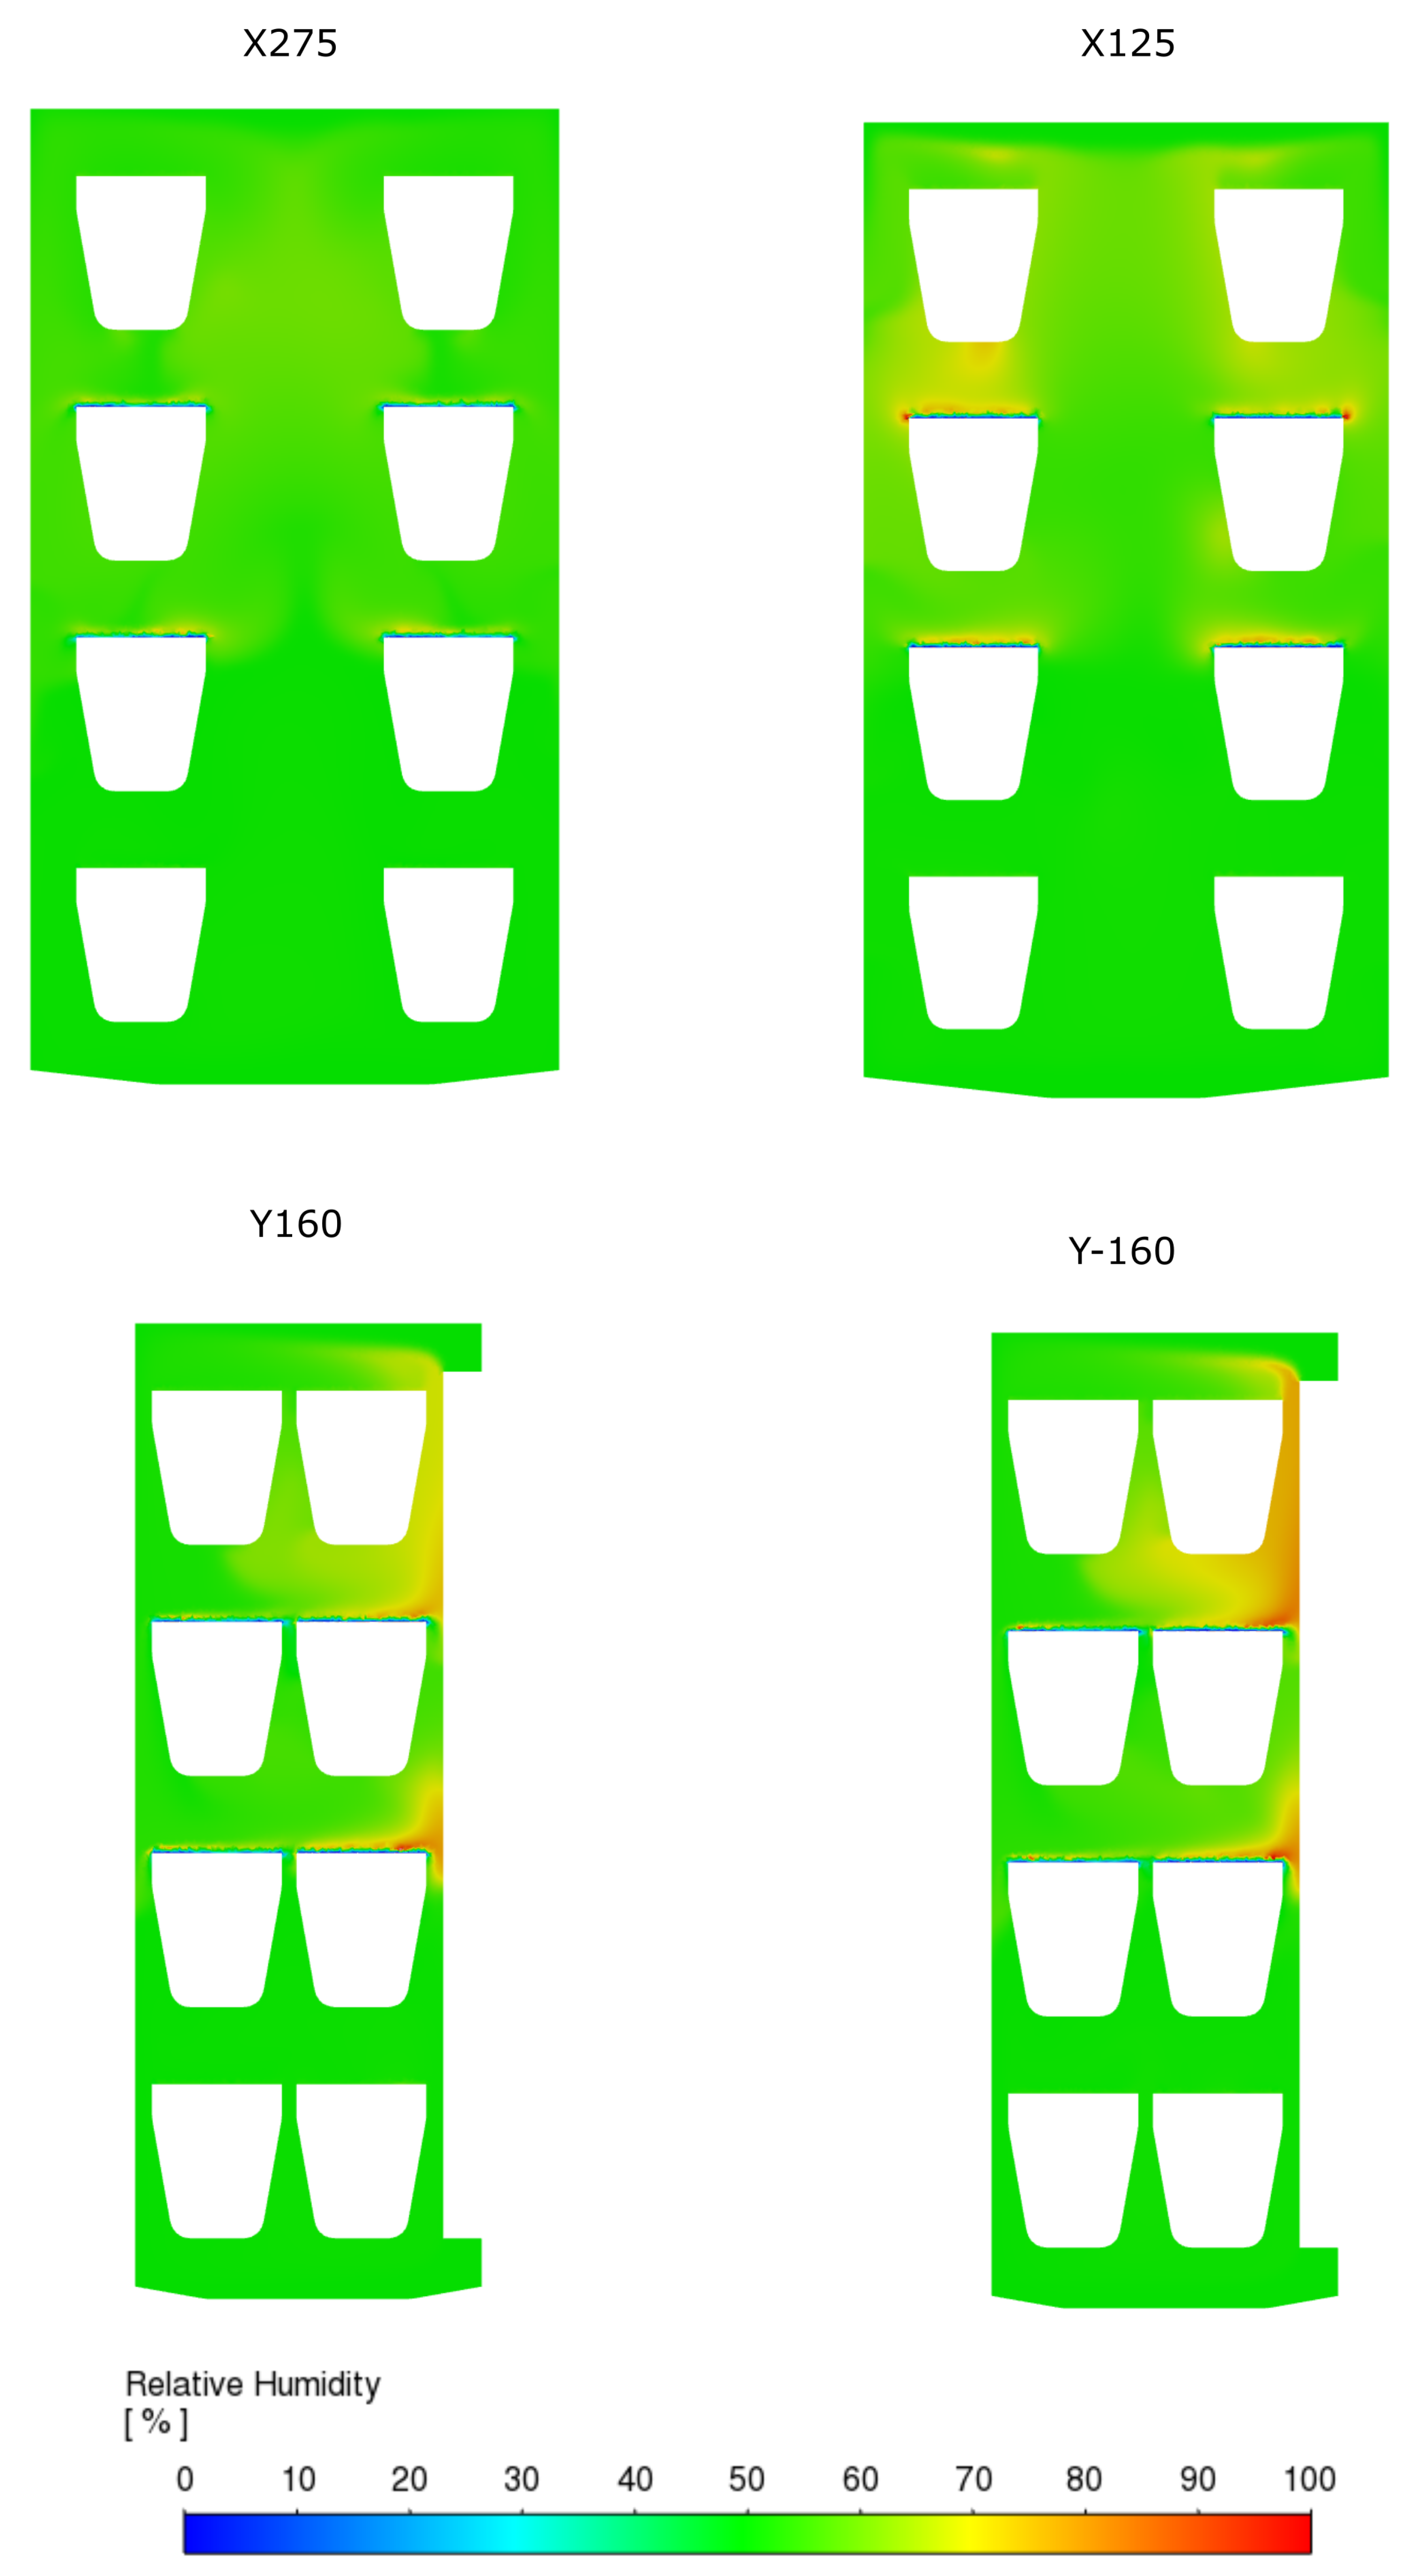
The RH distributions for all test vessel arrangements defined in
Figure 4 are presented in
Figure 7,
Figure 8 and
Figure 9 using characteristic planes indicated in
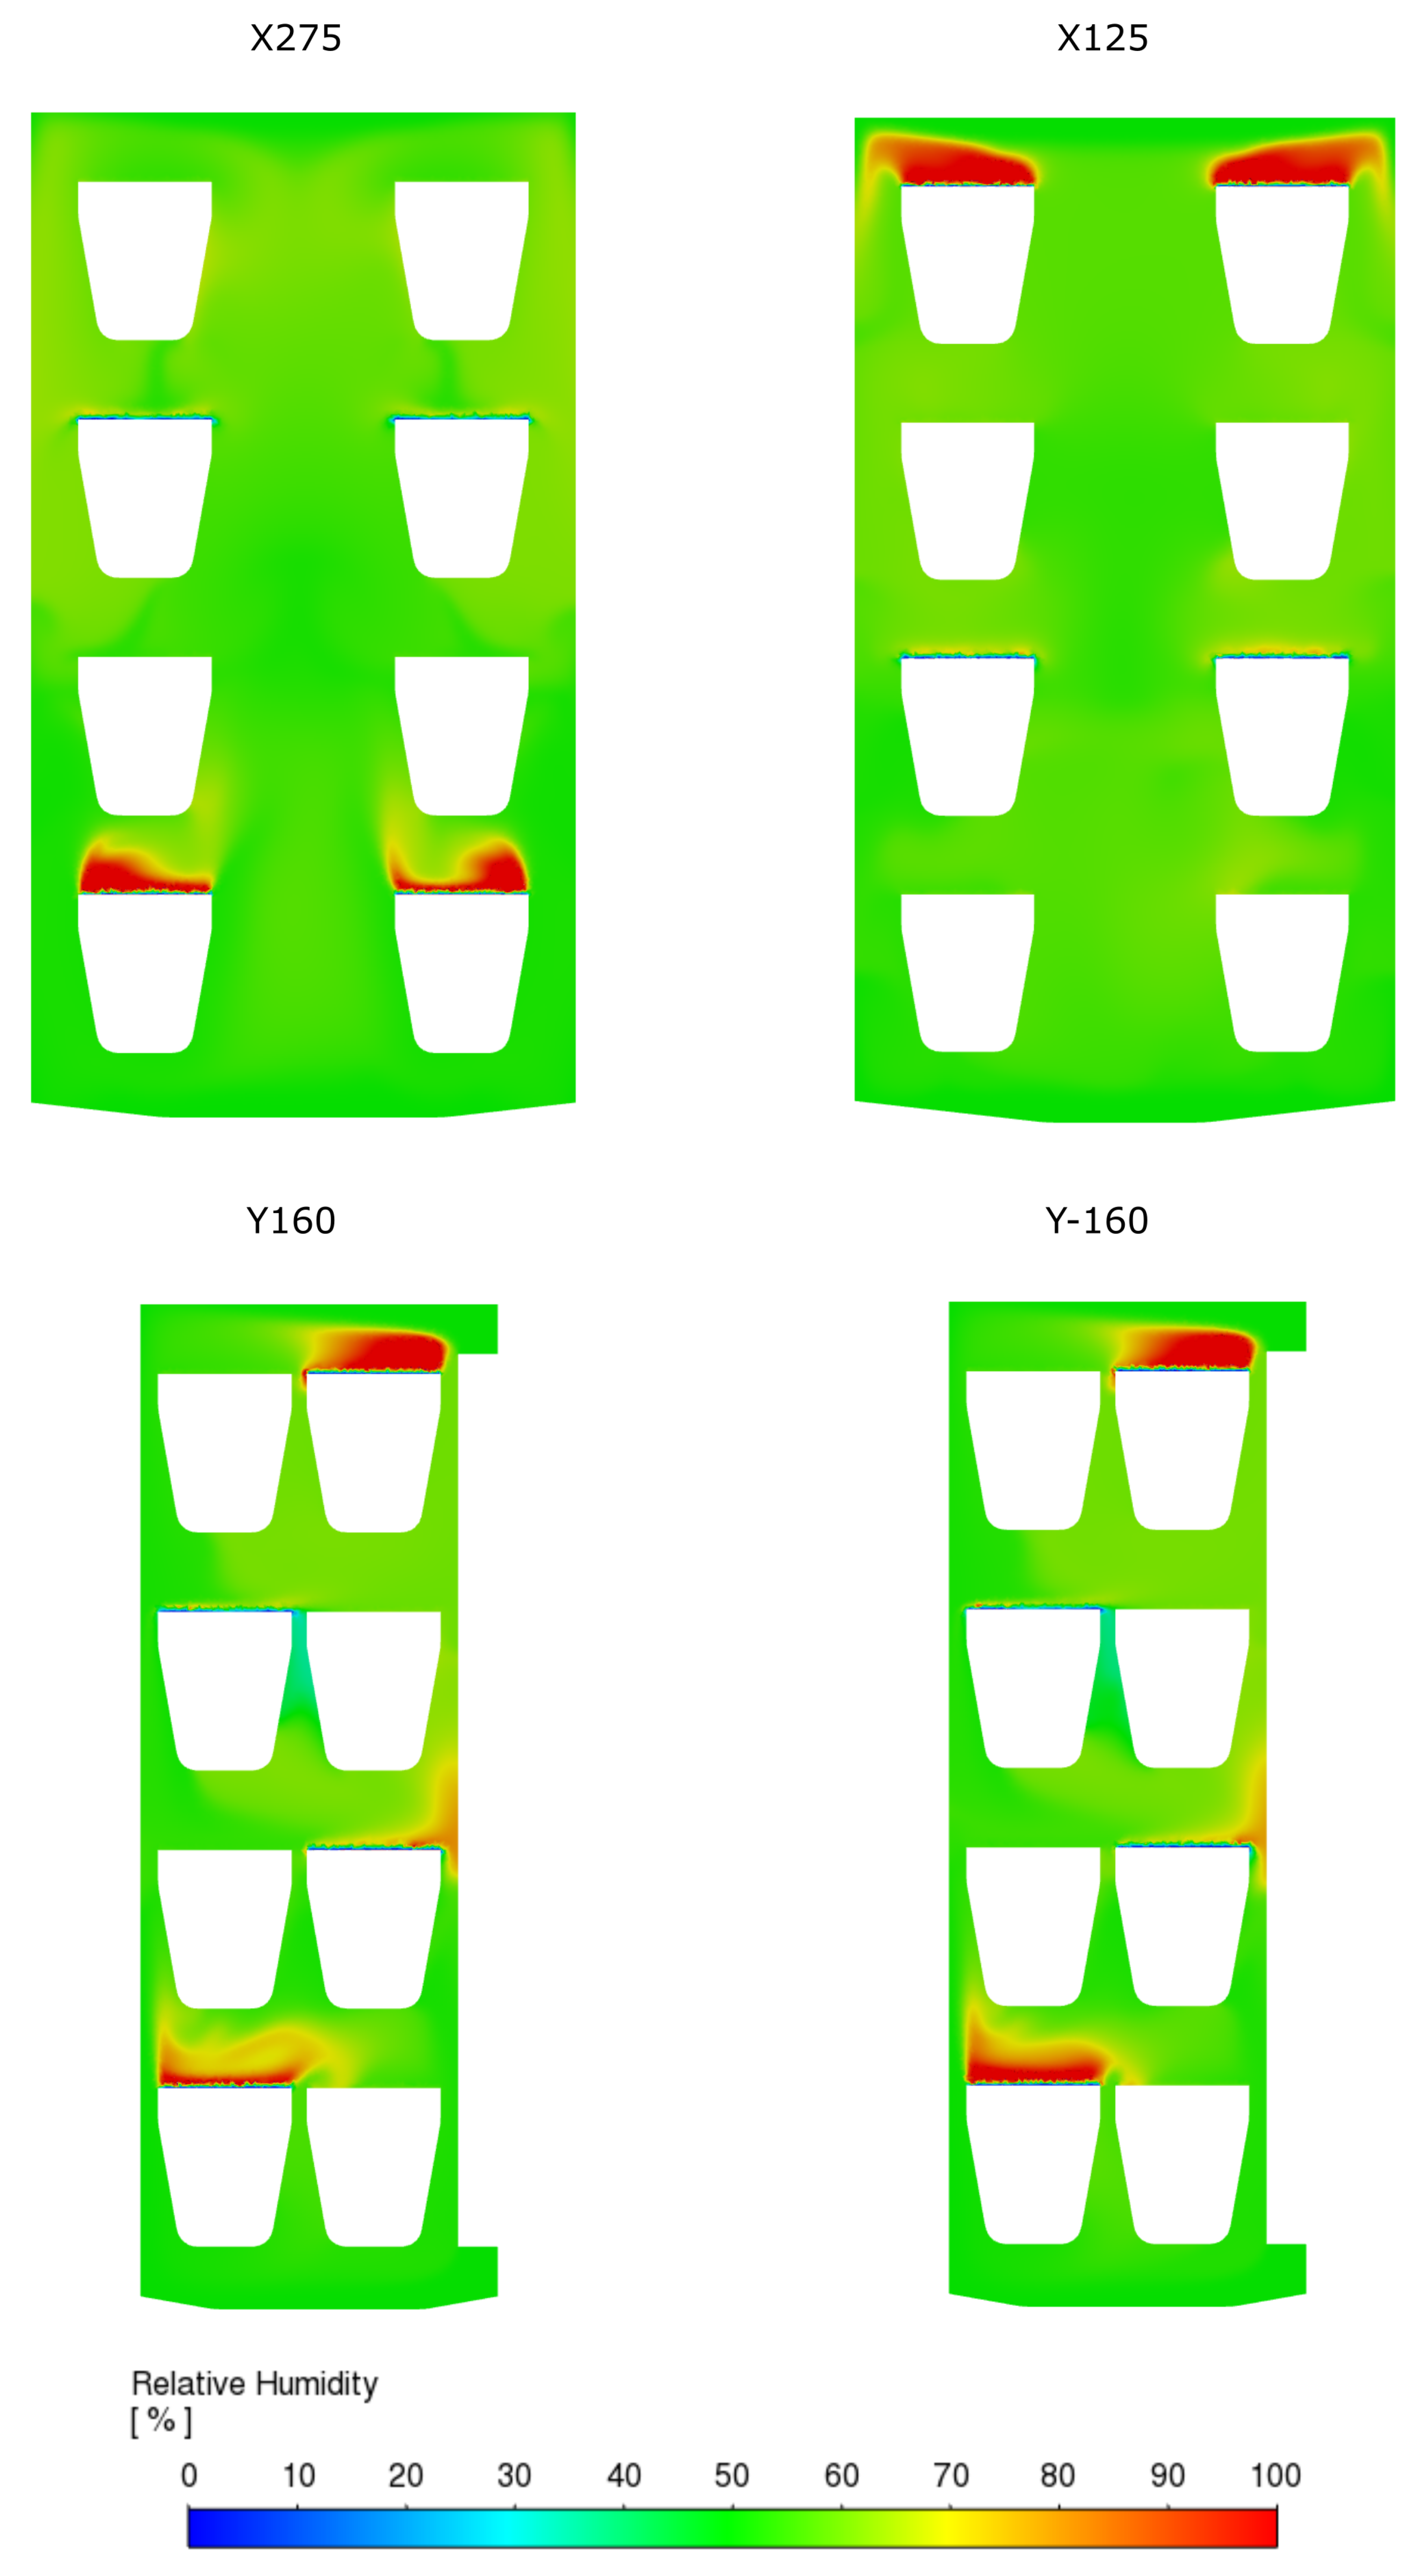
Figure 5b (excluding plane Y0, which does not intersect any assembly and hence is nonessential for the RH analysis). The results show that placing wet cups on either the top or bottom shelf produces localized regions of elevated RH above the samples (
Figure 7 and
Figure 8). As shown in
Figure 6, both the lower and upper shelves were characterized by large stagnant zones, resulting in poor evacuation of water vapor emitted from the surfaces of the wet sample–vessel assemblies. The CFD simulations allowed these effects to be quantified, revealing that local RH values above such assemblies can reach up to 90%, substantially exceeding the ISO tolerance of 5%.
Interestingly, the humidity sinks formed by dry sample/vessel assemblies did not cause significant RH deviations from the target value of 50%, even when located in low-velocity regions. The greater RH-disturbing effect of wet cups compared to dry ones can be attributed to differences in water vapor fluxes. The flux emitted by wet assemblies is approximately 1.7 times higher than that absorbed by dry assemblies (see Equation (
7)).
These observations led us to arrangement c, in which the moisture-emitting vessels were placed on the two middle shelves (characterized by the best air exchange), while the top and bottom shelves were reserved for the moisture-absorbing vessels. In this configuration, zones of elevated RH were substantially smaller, with lower average deviations. Although localized areas above the moist samples still reached 70–80% RH, their spatial extent was clearly reduced compared to cases a and b. As before, the dry samples located in low-velocity zones did not present significant issues, owing to the lower moisture flux at their surfaces.
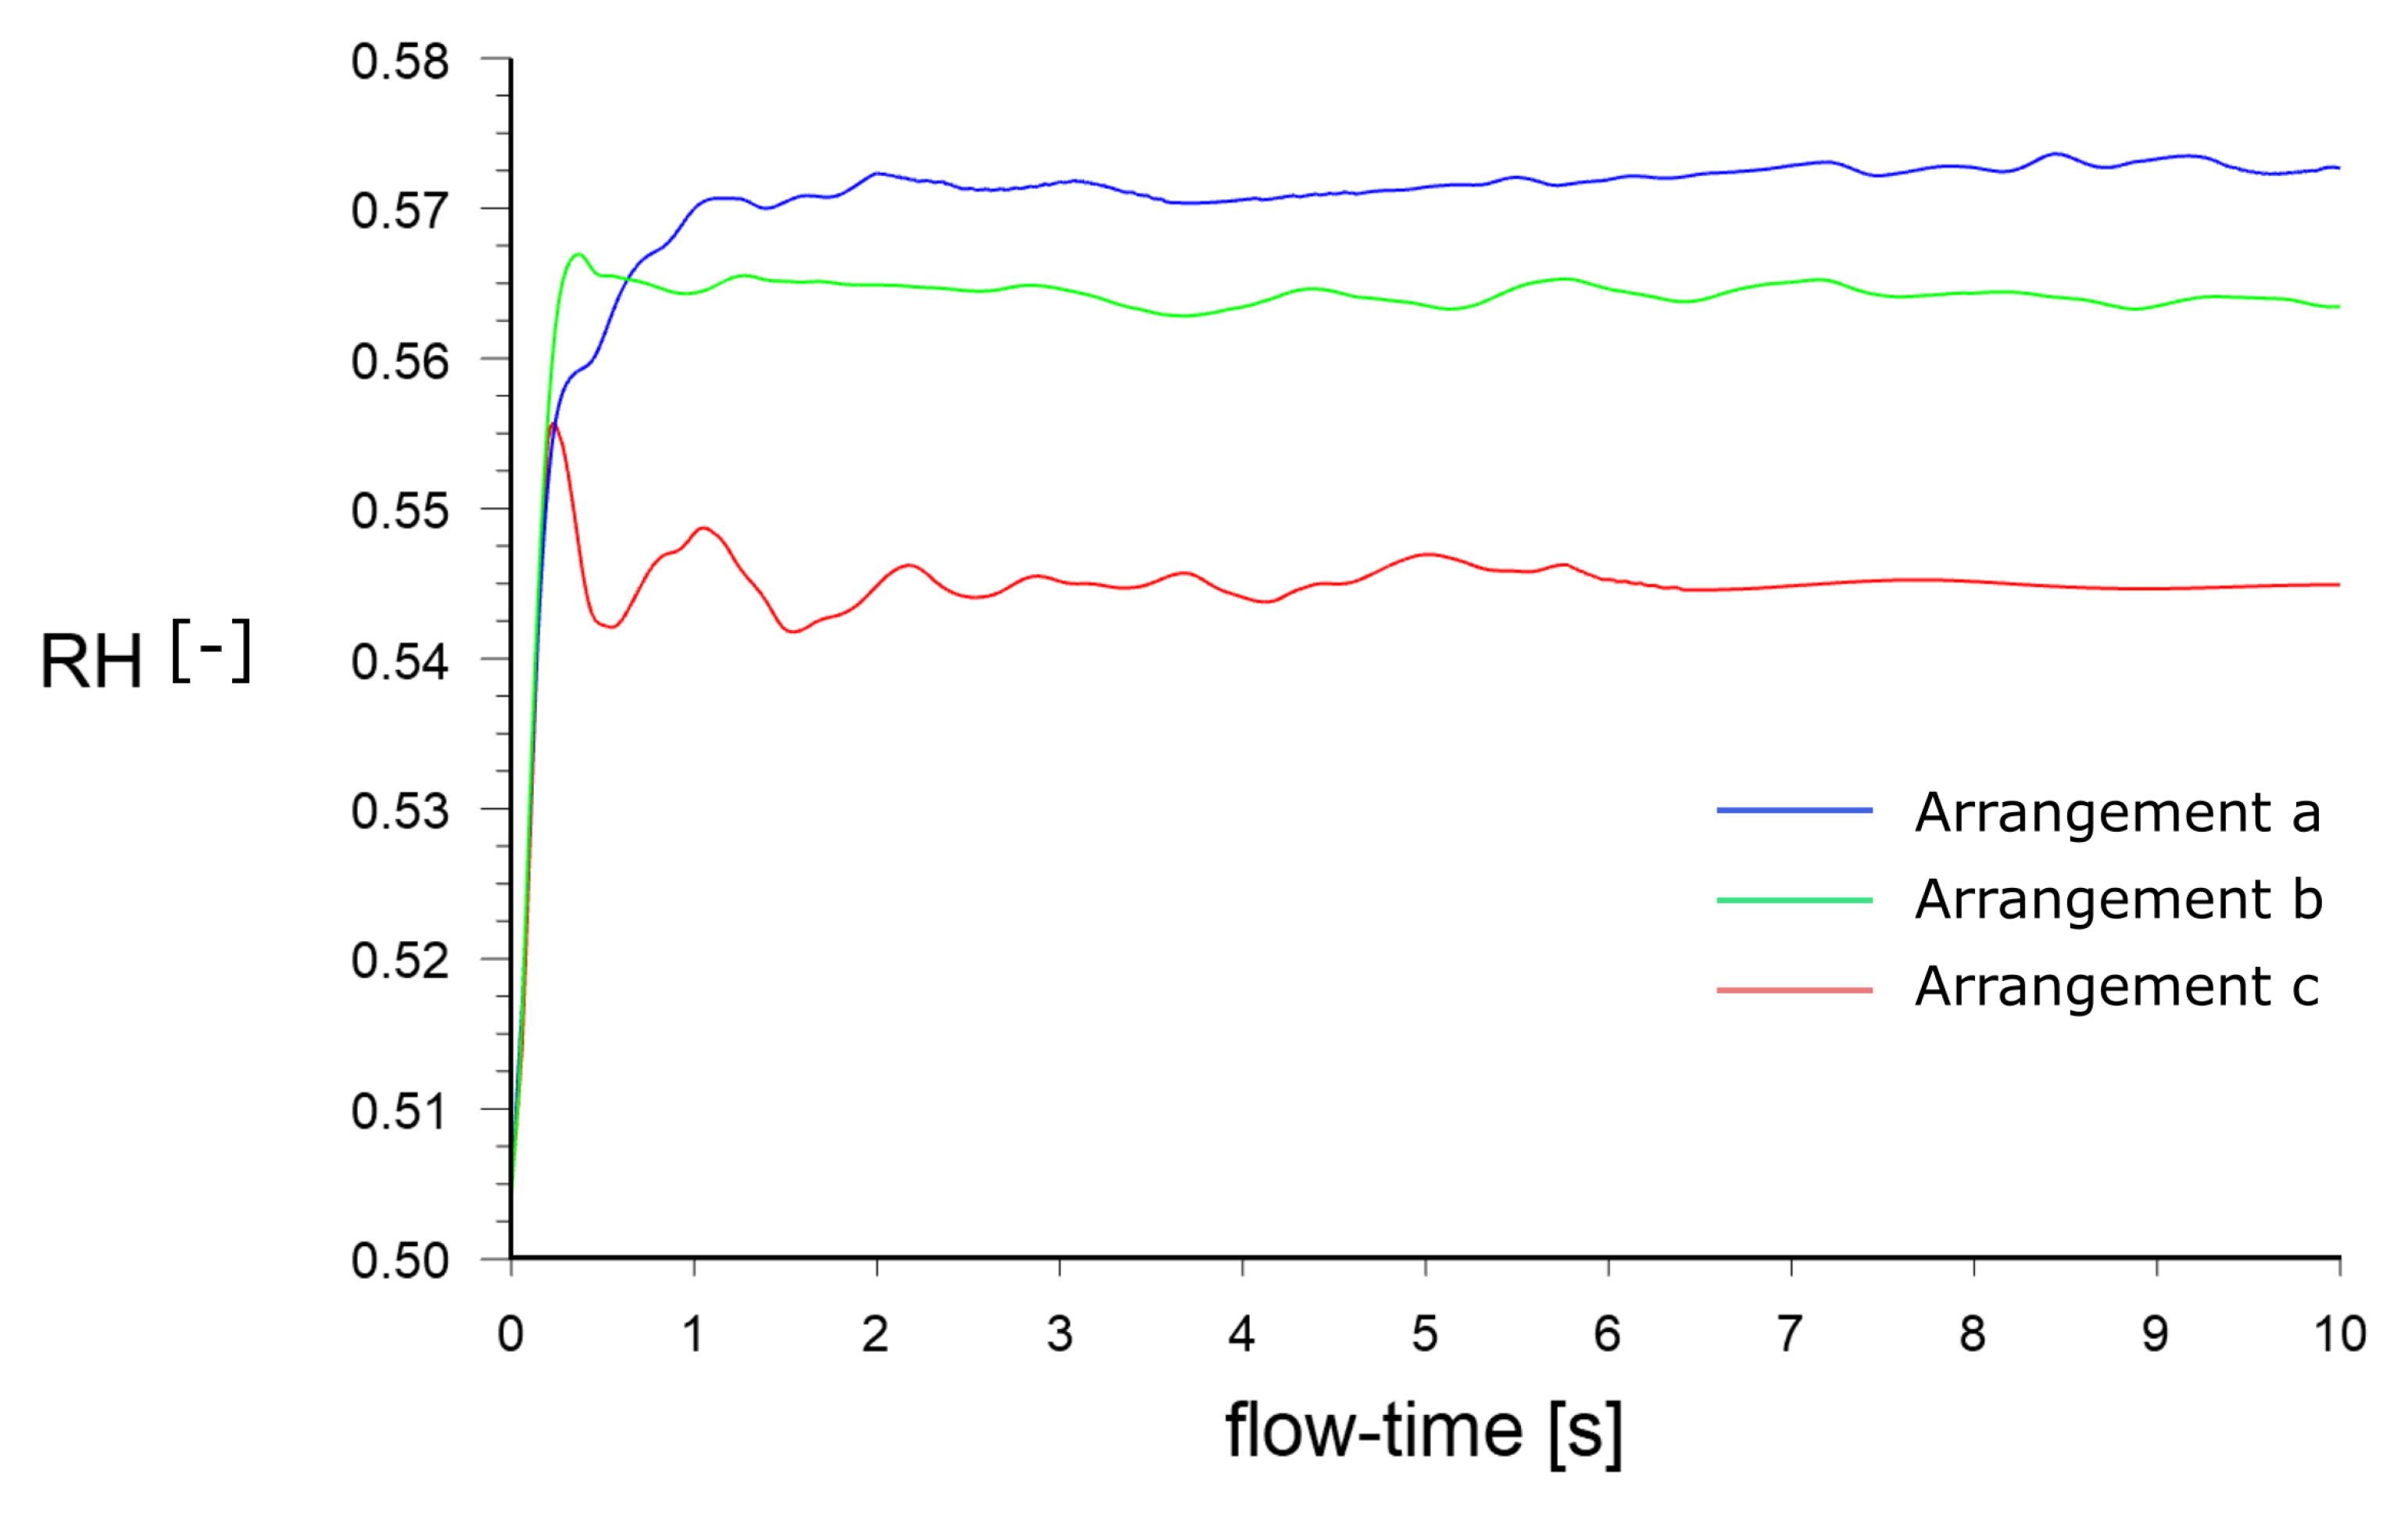
Figure 10, showing the evolution of average RH in the domain, serves as a concise summary of these findings. The average RH for arrangement
c (54.5%) falls within the
ISO tolerance, whereas arrangements
a and
b exceed it, with respective values of 57.3% and 56.4%.
3.4. Discussion
The observed influence of sample arrangement can be interpreted through the interaction between chamber geometry, airflow distribution, and moisture transport. In all configurations, the placement of vessels alters the available cross-section for air passage, thereby shaping local velocity fields and the efficiency of humidity evacuation. Regions directly exposed to the main air stream experience higher flow velocities along the upper surfaces of the samples, which promotes effective removal of moisture from wet-cup specimens and faster drying of adjacent dry-cup samples. Conversely, areas that are shielded by neighboring vessels or located away from the principal circulation paths tend to form recirculation zones or near-stagnant pockets, where moisture accumulates and relative humidity rises above the average chamber value. These patterns are highly dependent on the geometric proportions of the chamber and on the positioning and strength of the air inlet, outlet, and fan. Consequently, both the layout of the test vessels and the internal flow design jointly determine how well the chamber maintains uniform hygric conditions, highlighting the need to consider geometry-induced air-exchange limitations when comparing results between laboratories or chamber designs.
It should be emphasized that undetected local RH elevations above the sample–vessel assemblies can lead to significant systematic errors in the determination of WVP. The standard [
3] assumes that the relative humidity above the sample surface is equal to the nominal setpoint value (typically 50%), which is then used directly in the WVP calculation. In reality, as demonstrated by our simulations, local deviations can be substantial. For instance, using the results reported in [
12], it can be shown that for wet cups, a 4% error in the supplied RH value translates to an average error of approximately 6.5% in the calculated WVP of hemp concrete. Specifically, when the actual RH above the sample is 4% higher than the assumed chamber value, the resulting WVP is on average underestimated by about 6.5%. The same study shows that the calculated WVP decreases by about 60% when the supplied RH difference between the dry cup interior and its exterior is increased by 25%. These estimations fully justify the importance of verifying local humidity conditions during testing and, where possible, applying CFD-supported optimizations to minimize systematic bias.
3.5. Limitations and Recommendations
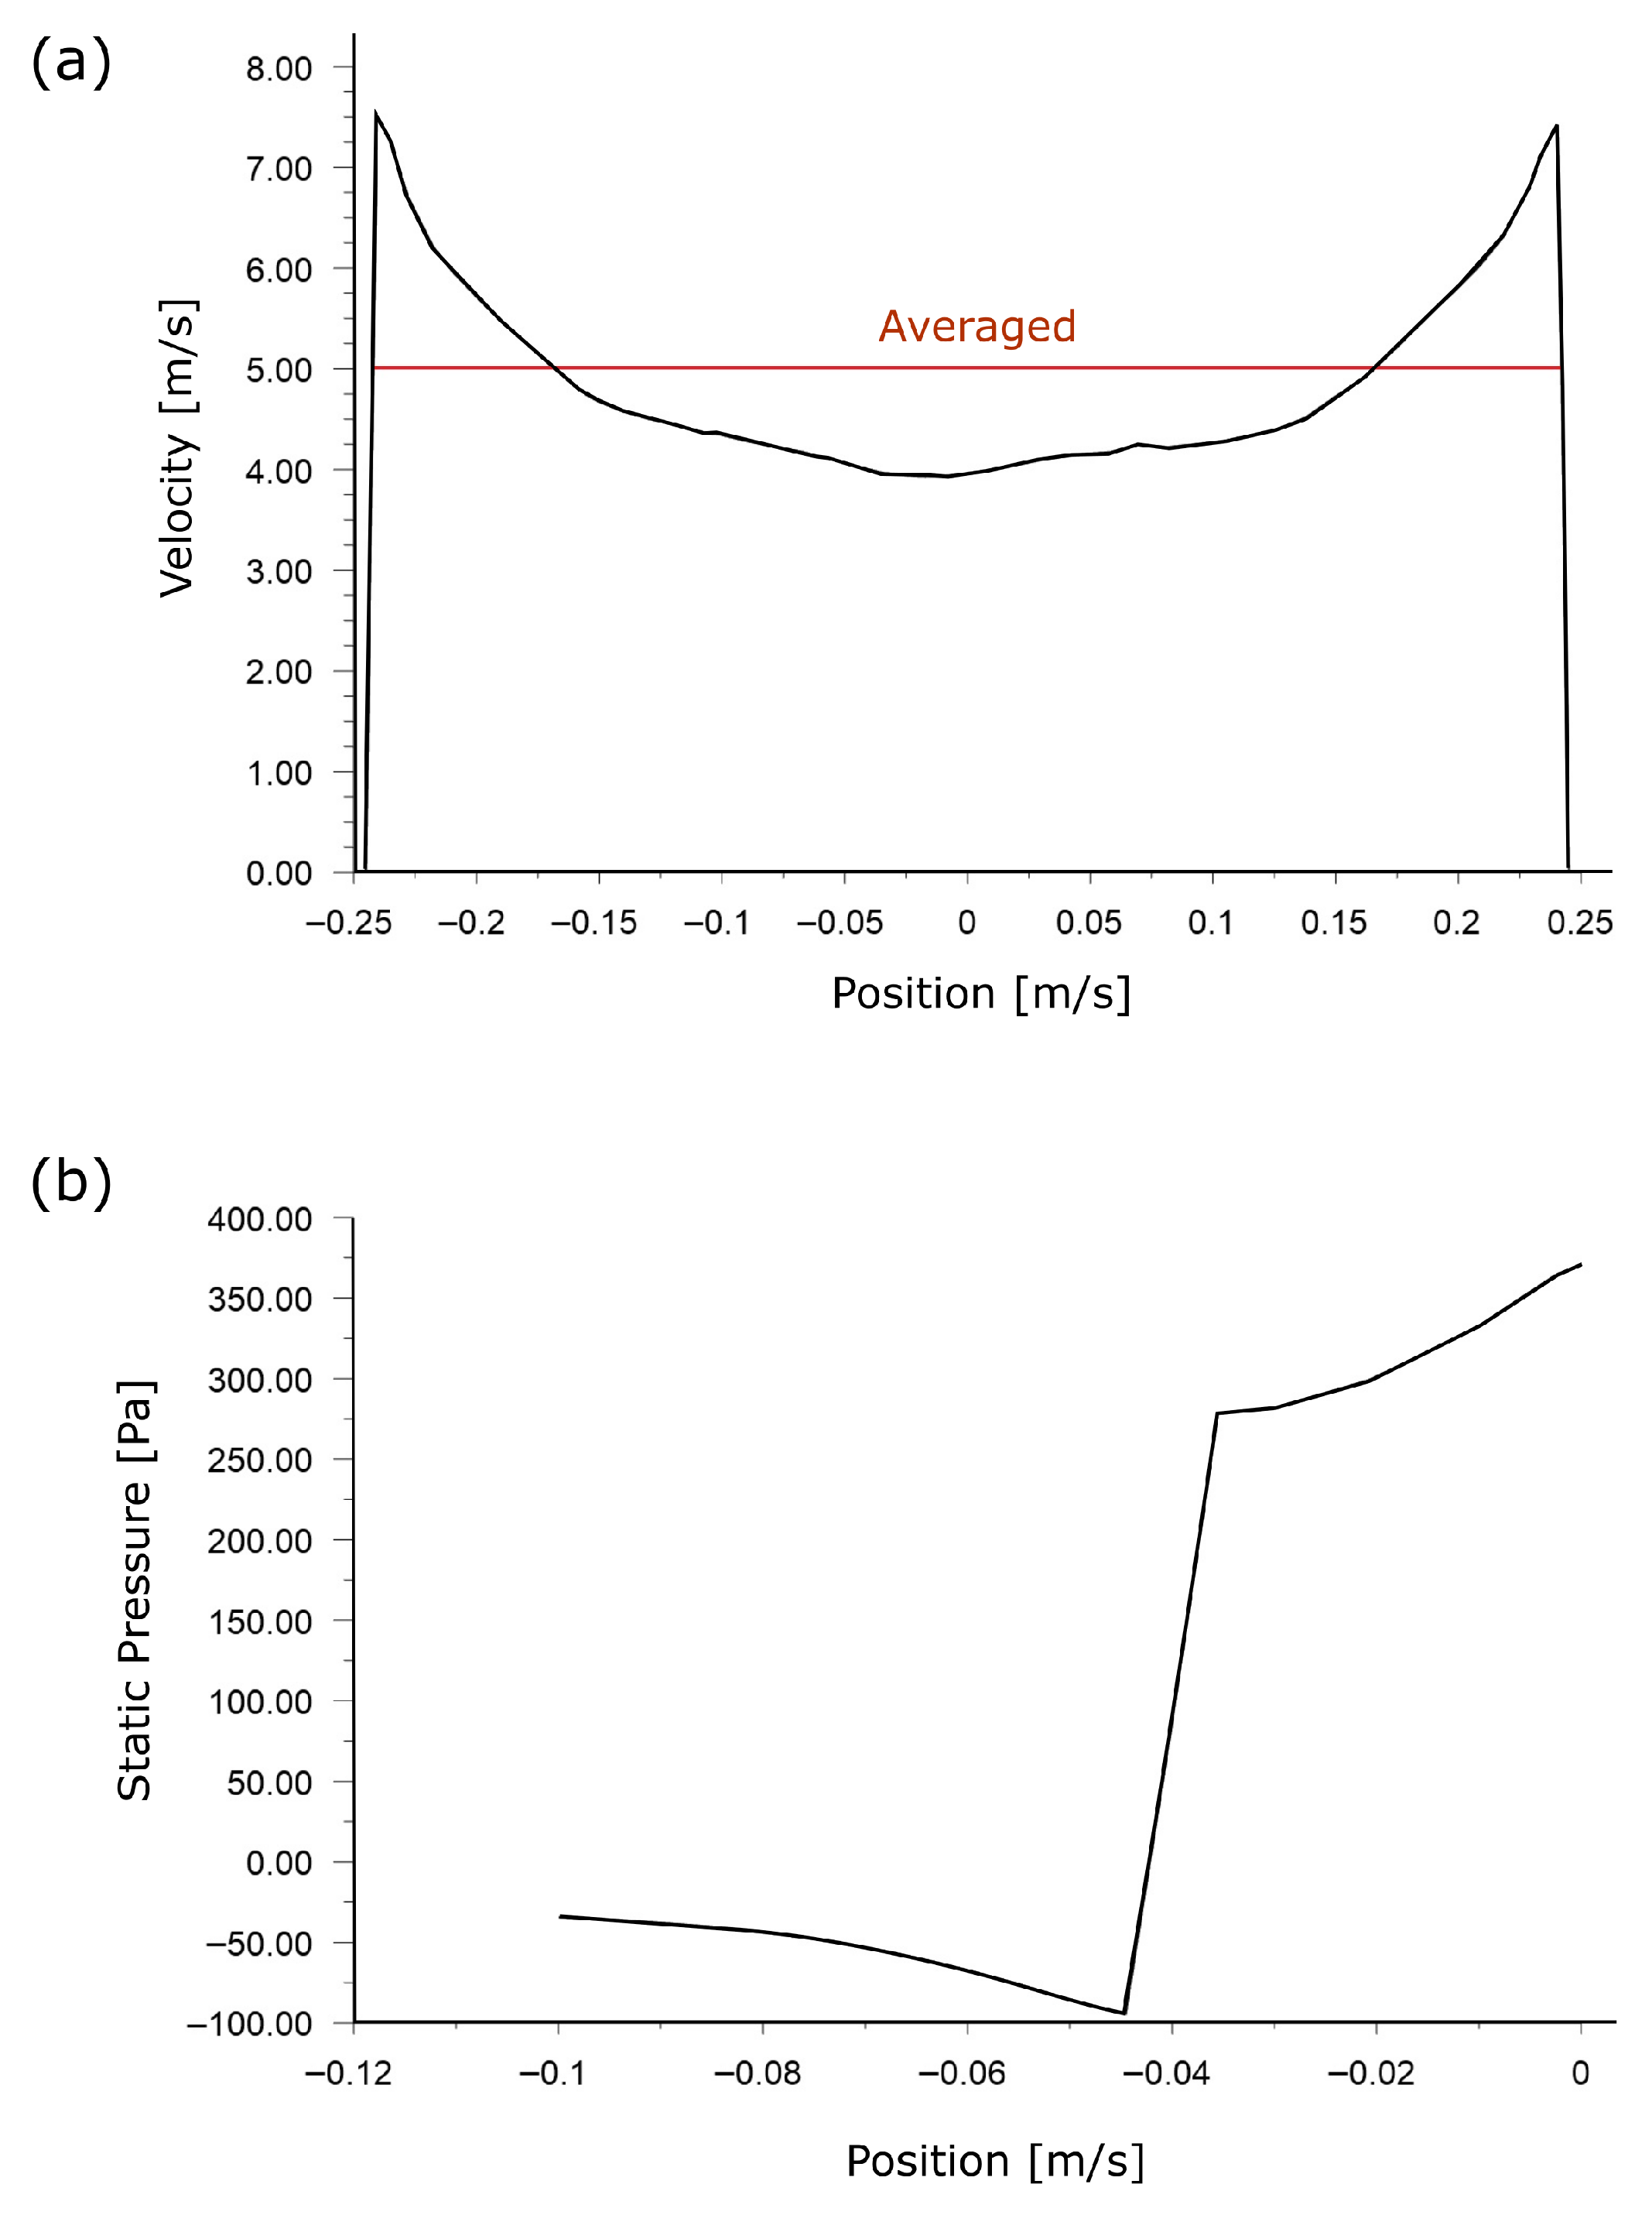
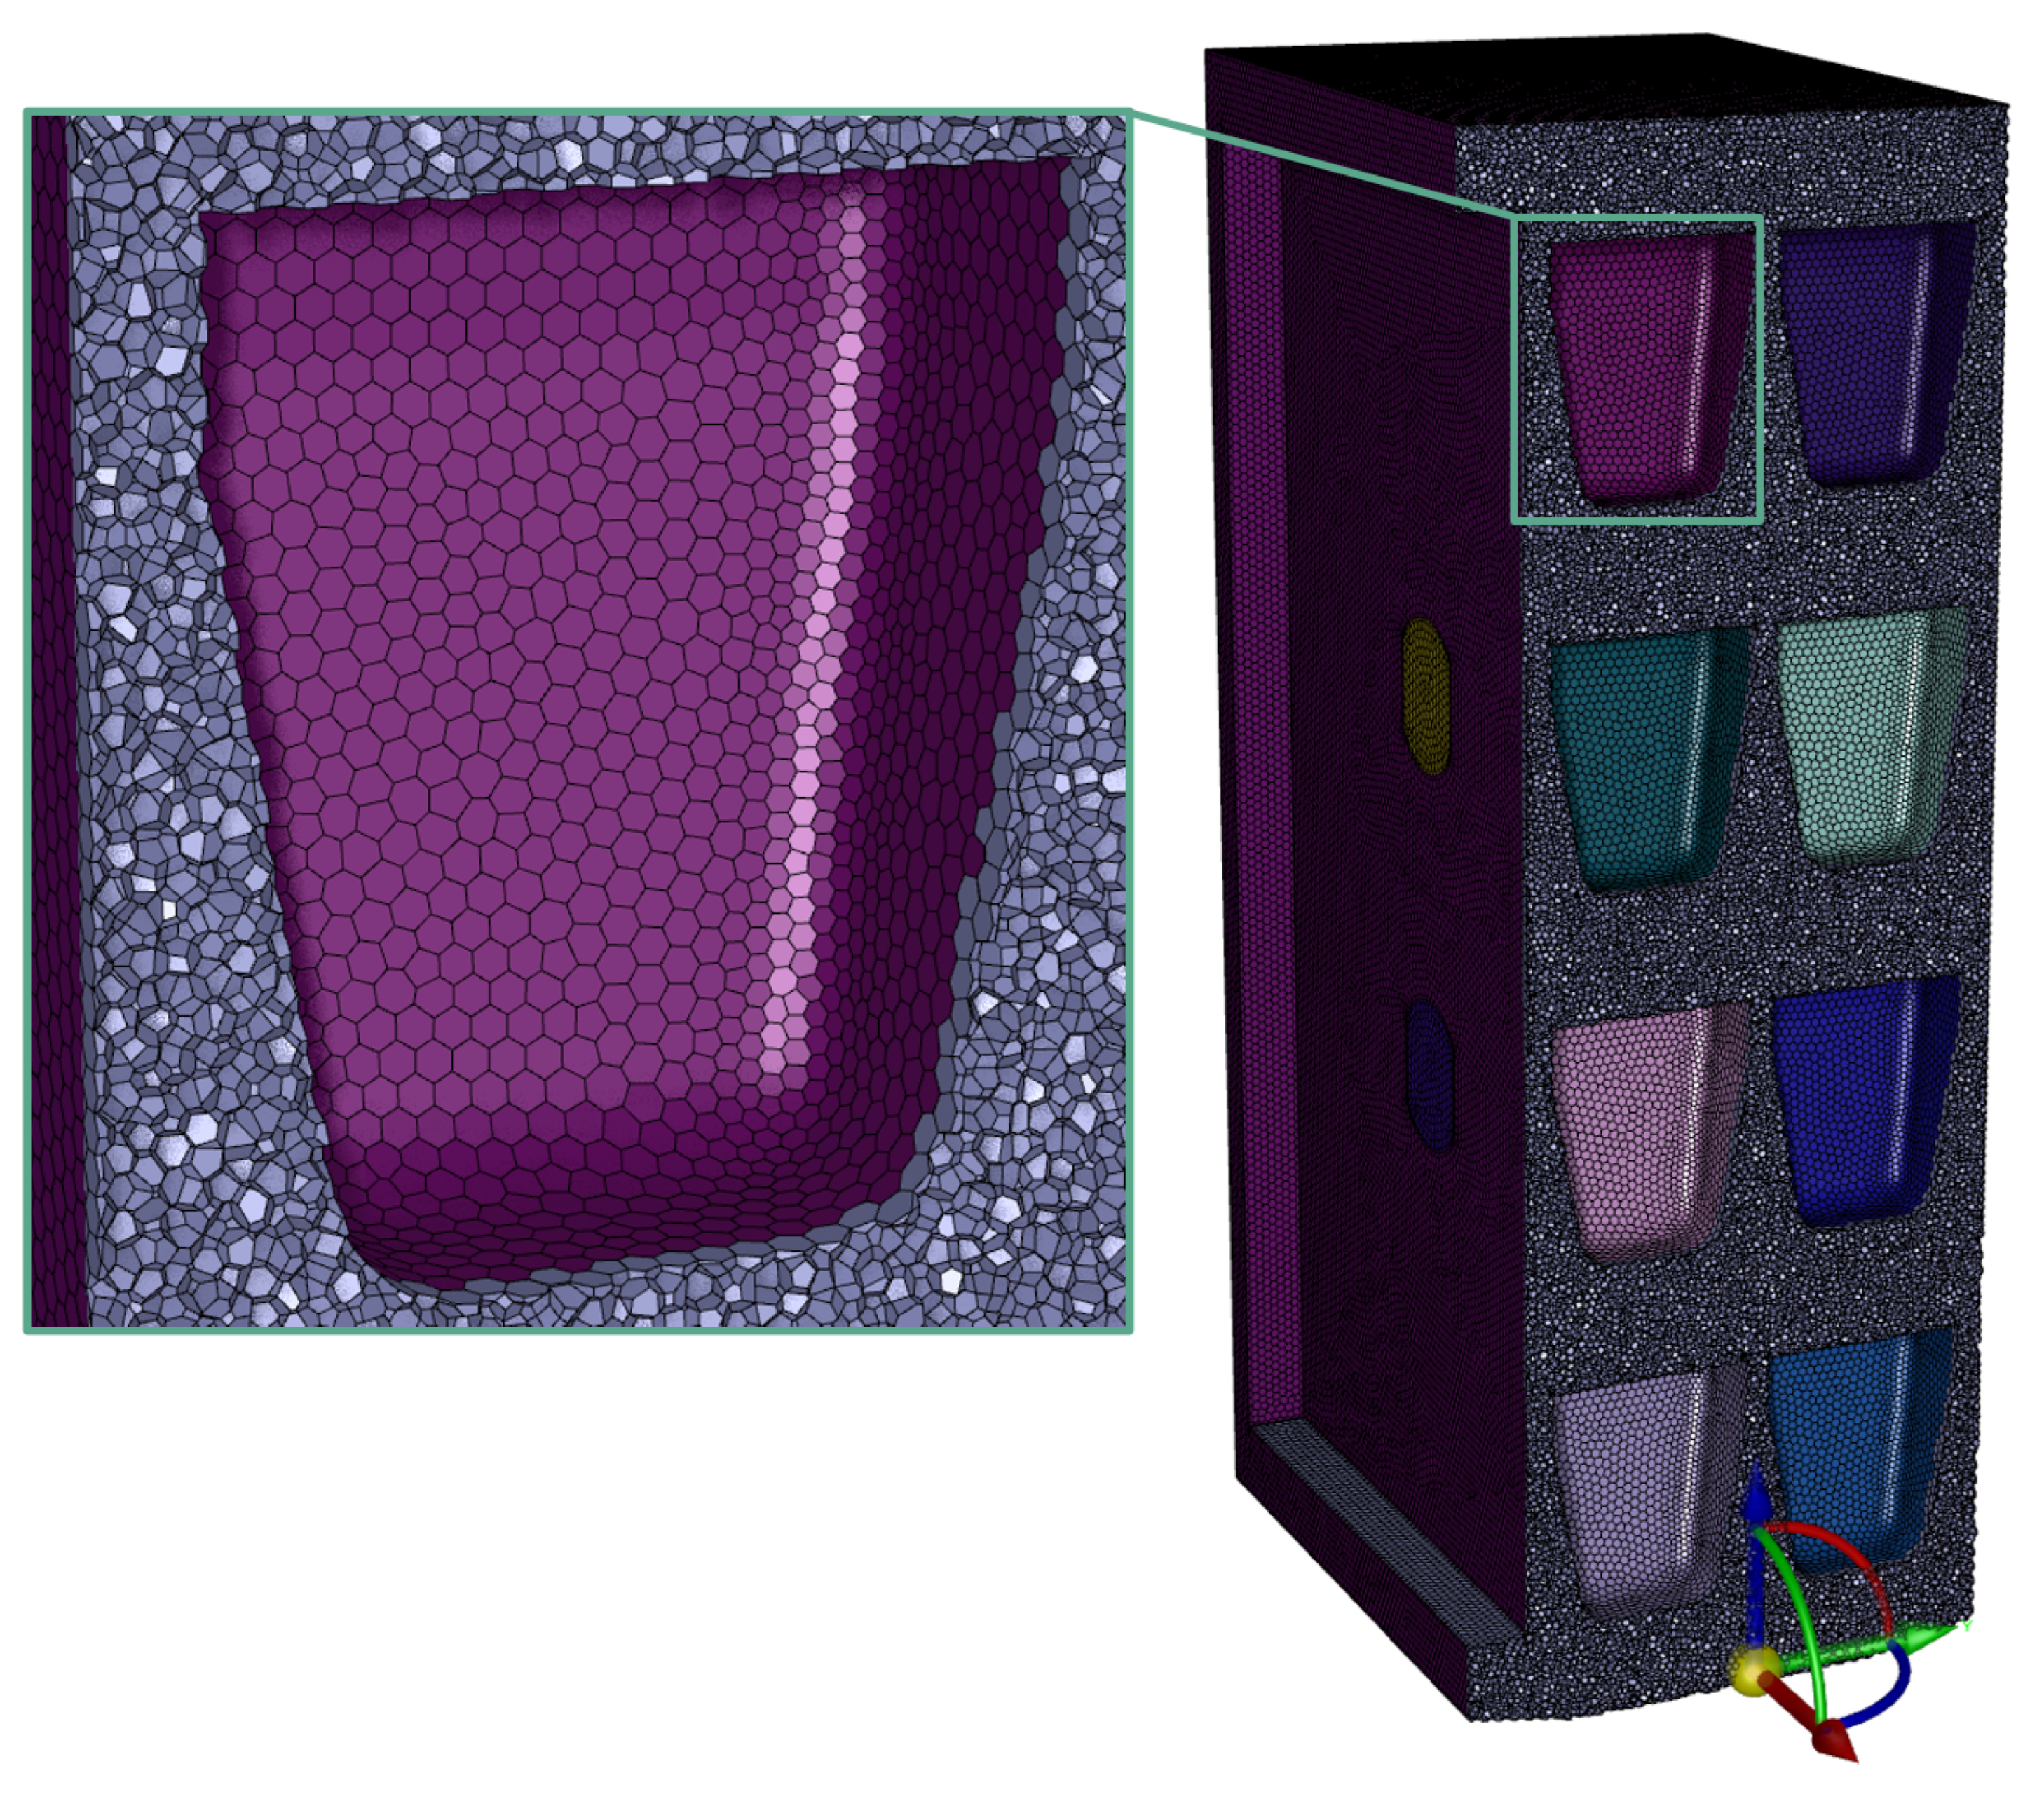
Although the model was verified through grid and time-step independence studies, a full experimental validation was not performed. Nevertheless, several observations support the physical reliability of the obtained results. The simulated mean velocity (approximately 2.25 m/s) agrees with values measured during our previous water vapor permeability tests [
2], while the poor evacuation of humidity in the bottom region of the chamber—confirmed both by local RH checks and the present simulations—further substantiates the model’s credibility. The realizable
k–
turbulence model with
Standard Wall Treatment was employed, which, although known to smooth fine-scale turbulence and near-wall effects, has been successfully applied in similar chamber studies [
14]. The energy equation was disabled, as the chamber was well insulated and temperature gradients between cup interiors and chamber space were negligible, ensuring near-isothermal conditions. Overall, we believe that the simulations accurately signal an overlooked aspect of building material testing. Future work should include targeted experimental validation of local velocity and humidity fields to further consolidate these findings.
Although the present simulations were carried out for a specific environmental chamber geometry and for hemp concrete specimens tested using the ISO cup method, the observed phenomena are expected to be broadly relevant to other hygroscopic materials and testing protocols conducted in high-load chambers. The insights gained here extend beyond hemp concrete testing. Any test configuration involving a mixture of wet and dry samples in a confined, mechanically ventilated space is susceptible to similar deviations from target conditions. In such cases, a deliberate placement strategy—favoring positioning of high-emission sources in regions of good air exchange—can help maintain compliance with standard tolerances and minimize measurement bias. Therefore, the methodology outlined in this work can be readily adapted as a diagnostic tool for optimizing environmental chamber layouts in diverse material testing applications.
Bearing in mind all limitations listed above, the following further limitations should be noted:
Geometric simplification. The modeled geometry did not include the wire shelves supporting the test assemblies. Their presence would likely alter the results by introducing additional flow turbulence.
Assembly shape. The analyzed case involved relatively tall sample/cup assemblies which may be seen as non-representative; however, example designs in the ISO standard [
3] also exhibit comparable height-to-width ratios, and the modeled geometry reflects real designs used by the authors [
2].
Control system assumptions. The simulation assumed a fixed behavior of the humidification system, i.e., the air inlets continuously supplied air at 50% RH. Combined with moisture emissions from the cups exceeding absorption, this resulted in an average RH higher than the 50% target. In reality, a control system would periodically switch off the humidifier or employ the Peltier cooler to condensate water in order to maintain a 50% reading at the sensor location. Although such control logic could be implemented in ANSYS Fluent in a dynamic simulation, we deliberately chose a simpler problem setup to ensure a robust and easily reproducible methodology. This simplification adequately illustrates when excessive humidity is properly evacuated from wet cups, while avoiding the complexities of simulating dynamic control effects.
Sample configuration. The ISO standard [
3] specifies only the required total exposed surface area, allowing fewer samples if each has a larger surface. Such designs, however, may lead to horizontal rather than vertical flow obstructions. In any case, CFD analysis of the type presented here can support the optimal configuration of samples, balancing chamber throughput with methodological rigor.
Future studies should explore a wider range of chamber designs and geometries, as well as the influence of measurement assembly size and shape. This study demonstrated that the sample layout can be manually adjusted to significantly improve the uniformity of RH conditions within the chamber. Nevertheless, it should be noted that modern computational tools offer dedicated optimization modules that could be employed to obtain even more refined configurations. Apart from the numerical modeling, we recommend to use additional humidity sensors within environmental chambers for improved accuracy of sustainable materials testing.
