Article

Assessment of Soil Structural Stability of Coal Mine Roof Using Multidimensional Elliptical Copula and Data Augmentation

1
State Key Laboratory of Mining Response and Disaster Prevention and Control in Deep Coal Mines, Anhui University of Science & Technology, Huainan 232001, China
2
State Key Laboratory of Hydraulic Engineering Intelligent Construction and Operation, Tianjin University, Tianjin 300072, China
3
State Key Laboratory of Intelligent Construction and Healthy Operation & Maintenance of Deep Underground Engineering, School of Mechanics and Civil Engineering, China University of Mining and Technology, Xuzhou 221116, China
*
Author to whom correspondence should be addressed.
Sustainability 2025, 17(22), 10028; https://doi.org/10.3390/su172210028
Submission received: 8 October 2025 / Revised: 6 November 2025 / Accepted: 6 November 2025 / Published: 10 November 2025

Abstract

Roof instability in coal mines is one of the primary causes of mining disasters, casualties, and environmental damage. Accurately assessing its reliability is crucial for achieving safe production and sustainable development in coal mining. Based on 192 small measured samples from multiple domestic coal mines (including Anhui, Shanxi, Shaanxi, and Inner Mongolia), this study constructs multidimensional Gaussian Copula and t Copula models to characterize the complex correlation structure of mechanical parameters. The hybrid adaptive multi-method data augmentation (HAMDA) method with three distinct weighting strategies is proposed. Through Monte Carlo Simulation (MCS), systematic reliability assessments are conducted for different roof locations. The results indicate that multidimensional elliptical Copulas effectively simulate the correlation structure of highly variable multidimensional coal mine roof mechanical parameters. Roof system instability is primarily triggered by failure in the bottom zone, accompanied by sidewall instability in approximately 60% of cases, while the top zone remains relatively secure. This provides crucial insights for optimizing support design. The HAMDA method significantly overcomes the limitations of small sample data, with its expanded statistical characteristics closely matching measured data. Failure probability estimates vary across different HAMDA schemes: conservative programs may underestimate risks, while diverse programs tend toward conservatism in lateral zones. These results provide theoretical support for refined roof support design in coal mines, holding significant theoretical and practical value for advancing safety, environmental sustainability, and sustainable development in the coal industry.

1. Introduction

Roof instability in coal mines is one of the most significant hazard patterns during coal extraction [1,2]. Under mining influence, the original stress field of the roof soil mass is disrupted, causing the surrounding rock to undergo a sequence of unloading, stress concentration, and progressive failure: the roof of the goaf deforms under its own weight and the pressure from overlying strata. As fractures propagate and connect, this ultimately leads to localized or complete instability and failure. This phenomenon significantly impacts the sustainable development of the environment near coal mines and the safety of social production [3,4]. Such instability not only jeopardizes the safety of underground operations but also triggers ground subsidence, groundwater contamination, and ecosystem degradation, exerting profound impacts on the environmental sustainability of mining areas and surrounding regions [5,6,7]. The evolution characteristics of mechanical parameters are crucial in roof instability failure, exhibiting significant spatial heterogeneity and variability [8,9,10,11]. Simultaneously, the complexity of geological sedimentary environments creates intrinsic correlations among mechanical parameters, and the coupling effects of multidimensional parameters further exacerbate the uncertainty in instability mechanisms [12,13]. Traditional deterministic analysis methods struggle to comprehensively reflect the impact of this uncertainty on roof stability. As the global clean energy transition accelerates, the coal mining industry must prioritize sustainable development to ensure the long-term health of ecosystems and communities. Therefore, establishing complete probabilistic distribution characteristics for soil mechanical parameters and their correlation structural models is meaningful for preventing roof instability disasters and promoting the safe, green, and sustainable development of the coal industry [14,15,16,17].
In roof stability analysis, obtaining comprehensive probabilistic information on multidimensional mechanical parameters and establishing a reliability analysis model are critical steps [18,19,20]. However, constrained by field investigation conditions and experimental limitations, it is challenging to obtain extensive measured data in practical engineering projects [21,22,23]. Under small sample conditions, traditional multidimensional joint distribution modeling methods (such as multidimensional normal distributions) struggle to flexibly describe complex correlation structures among parameters and impose strict requirements on marginal distributions [24]. Recently, Copula theory has gained significant attention in geotechnical reliability analysis due to its ability to separate marginal distributions from correlation structures and its flexibility in constructing joint distributions [25,26,27]. Agarwal and Pain [28] employed the Gaussian Copula to model the dependency structure between internal friction angle, unit weight, and tensile strength of reinforcing steel within soil, conducting probabilistic stability analysis for geosynthetic-reinforced slopes. Cui et al. [29] employed Copula functions to construct a bivariate seismic vulnerability function, comprehensively considering both the maximum inter-story drift angle and cumulative hysteretic energy dissipation during structural damage processes at subway stations. Jia and Wu [30] utilized Copula functions to establish a joint distribution function for multiple demand extremes, demonstrating that ignoring parameter correlations is detrimental to reliability analysis.
Furthermore, data augmentation techniques offer viable solutions to parameter uncertainty problems under small sample conditions. By appropriately expanding limited samples, the robustness of reliability analysis results can be enhanced [31,32]. However, a single data augmentation method often lacks the capacity to fully characterize the statistical properties of the original data, leading to excessive data smoothing and failure to comprehensively capture nonlinear relationships in the measured data [33]. This prevents the augmented data samples from fully reflecting the statistical characteristics of measured coal mine roof mechanical parameters under conditions of high variability and uncertainty, thereby compromising the accuracy of reliability analysis. Employing hybrid data augmentation methods, with adaptive weight allocation, enables more comprehensive preservation of the statistical information from the measured samples and more accurate representation of the probability distribution characteristics of mechanical parameters under conditions of uncertainty [34,35,36,37,38].
In this study, 192 sets of data from multiple coal mine roof strata in China were utilized to analyze the statistical characteristics of coal mine roof geotechnical structures. Building upon existing models for analyzing coal mine roof stability, this study assumes that roof stability factors are solely dependent on mechanical parameters, disregarding uncertainties such as human factors and geological activity. First, multidimensional elliptical Copula models were constructed under different correlation coefficient methods to characterize the complex dependency structure of mechanical variables. Second, the failure probability at different roof locations was evaluated and compared using simulated elliptical Copula sample data. Finally, the HAMDA approach with three distinct weighting strategies was proposed to discuss the reliability impact of different structural models on roof locations. The results provide a reliable data foundation and theoretical support for assessing coal mine roof stability under small sample conditions.

2. Stability Analysis Model for Coal Mine Roof Soil Structures

The stability analysis model for the overburden soil parameters in this coal mine study was developed based on the planar roof model established by Cao et al. [39]. The initial conditions established include: (1) planar soil with horizontal isotropy; (2) neglect of in situ stress and excavation height effects; (3) rock and soil forces acting on the roof surface treated as uniformly distributed loads.

2.1. Reliability Function of Coal Mine Roof

Taking the roof of a unit void zone as the analysis object, the simplified stress diagram of the roof is shown in Figure 1 below. The stress diagram for the red dashed-box area in Figure 1a is depicted in Figure 1b. q represents uniformly distributed load, Ft denotes the vertical support force from the mine pillar, and Fn signifies lateral pressure. Based on existing derivation results [39], the reliability function for the roof rock-soil structure can be obtained by solving the roof stress components using the compatibility equation, yielding the following expression.
F S 1 = γ h 0 2 tan φ k 0 + 1 + 3 4 n 2 + a 10 b c + γ h 0 2 f s cos φ + sin φ tan φ k 0 1 + 3 4 n 2 + a 10 b F S 2 = γ h 0 2 tan φ k 0 3 4 n 2 a 10 b c + γ h 0 2 f s cos φ + sin φ tan φ k 0 3 4 n 2 a 10 b F S 3 = γ h 0 2 f s cos φ + sin φ tan φ 1 4 + 3 4 n 2 3 γ h 0 4 tan φ c
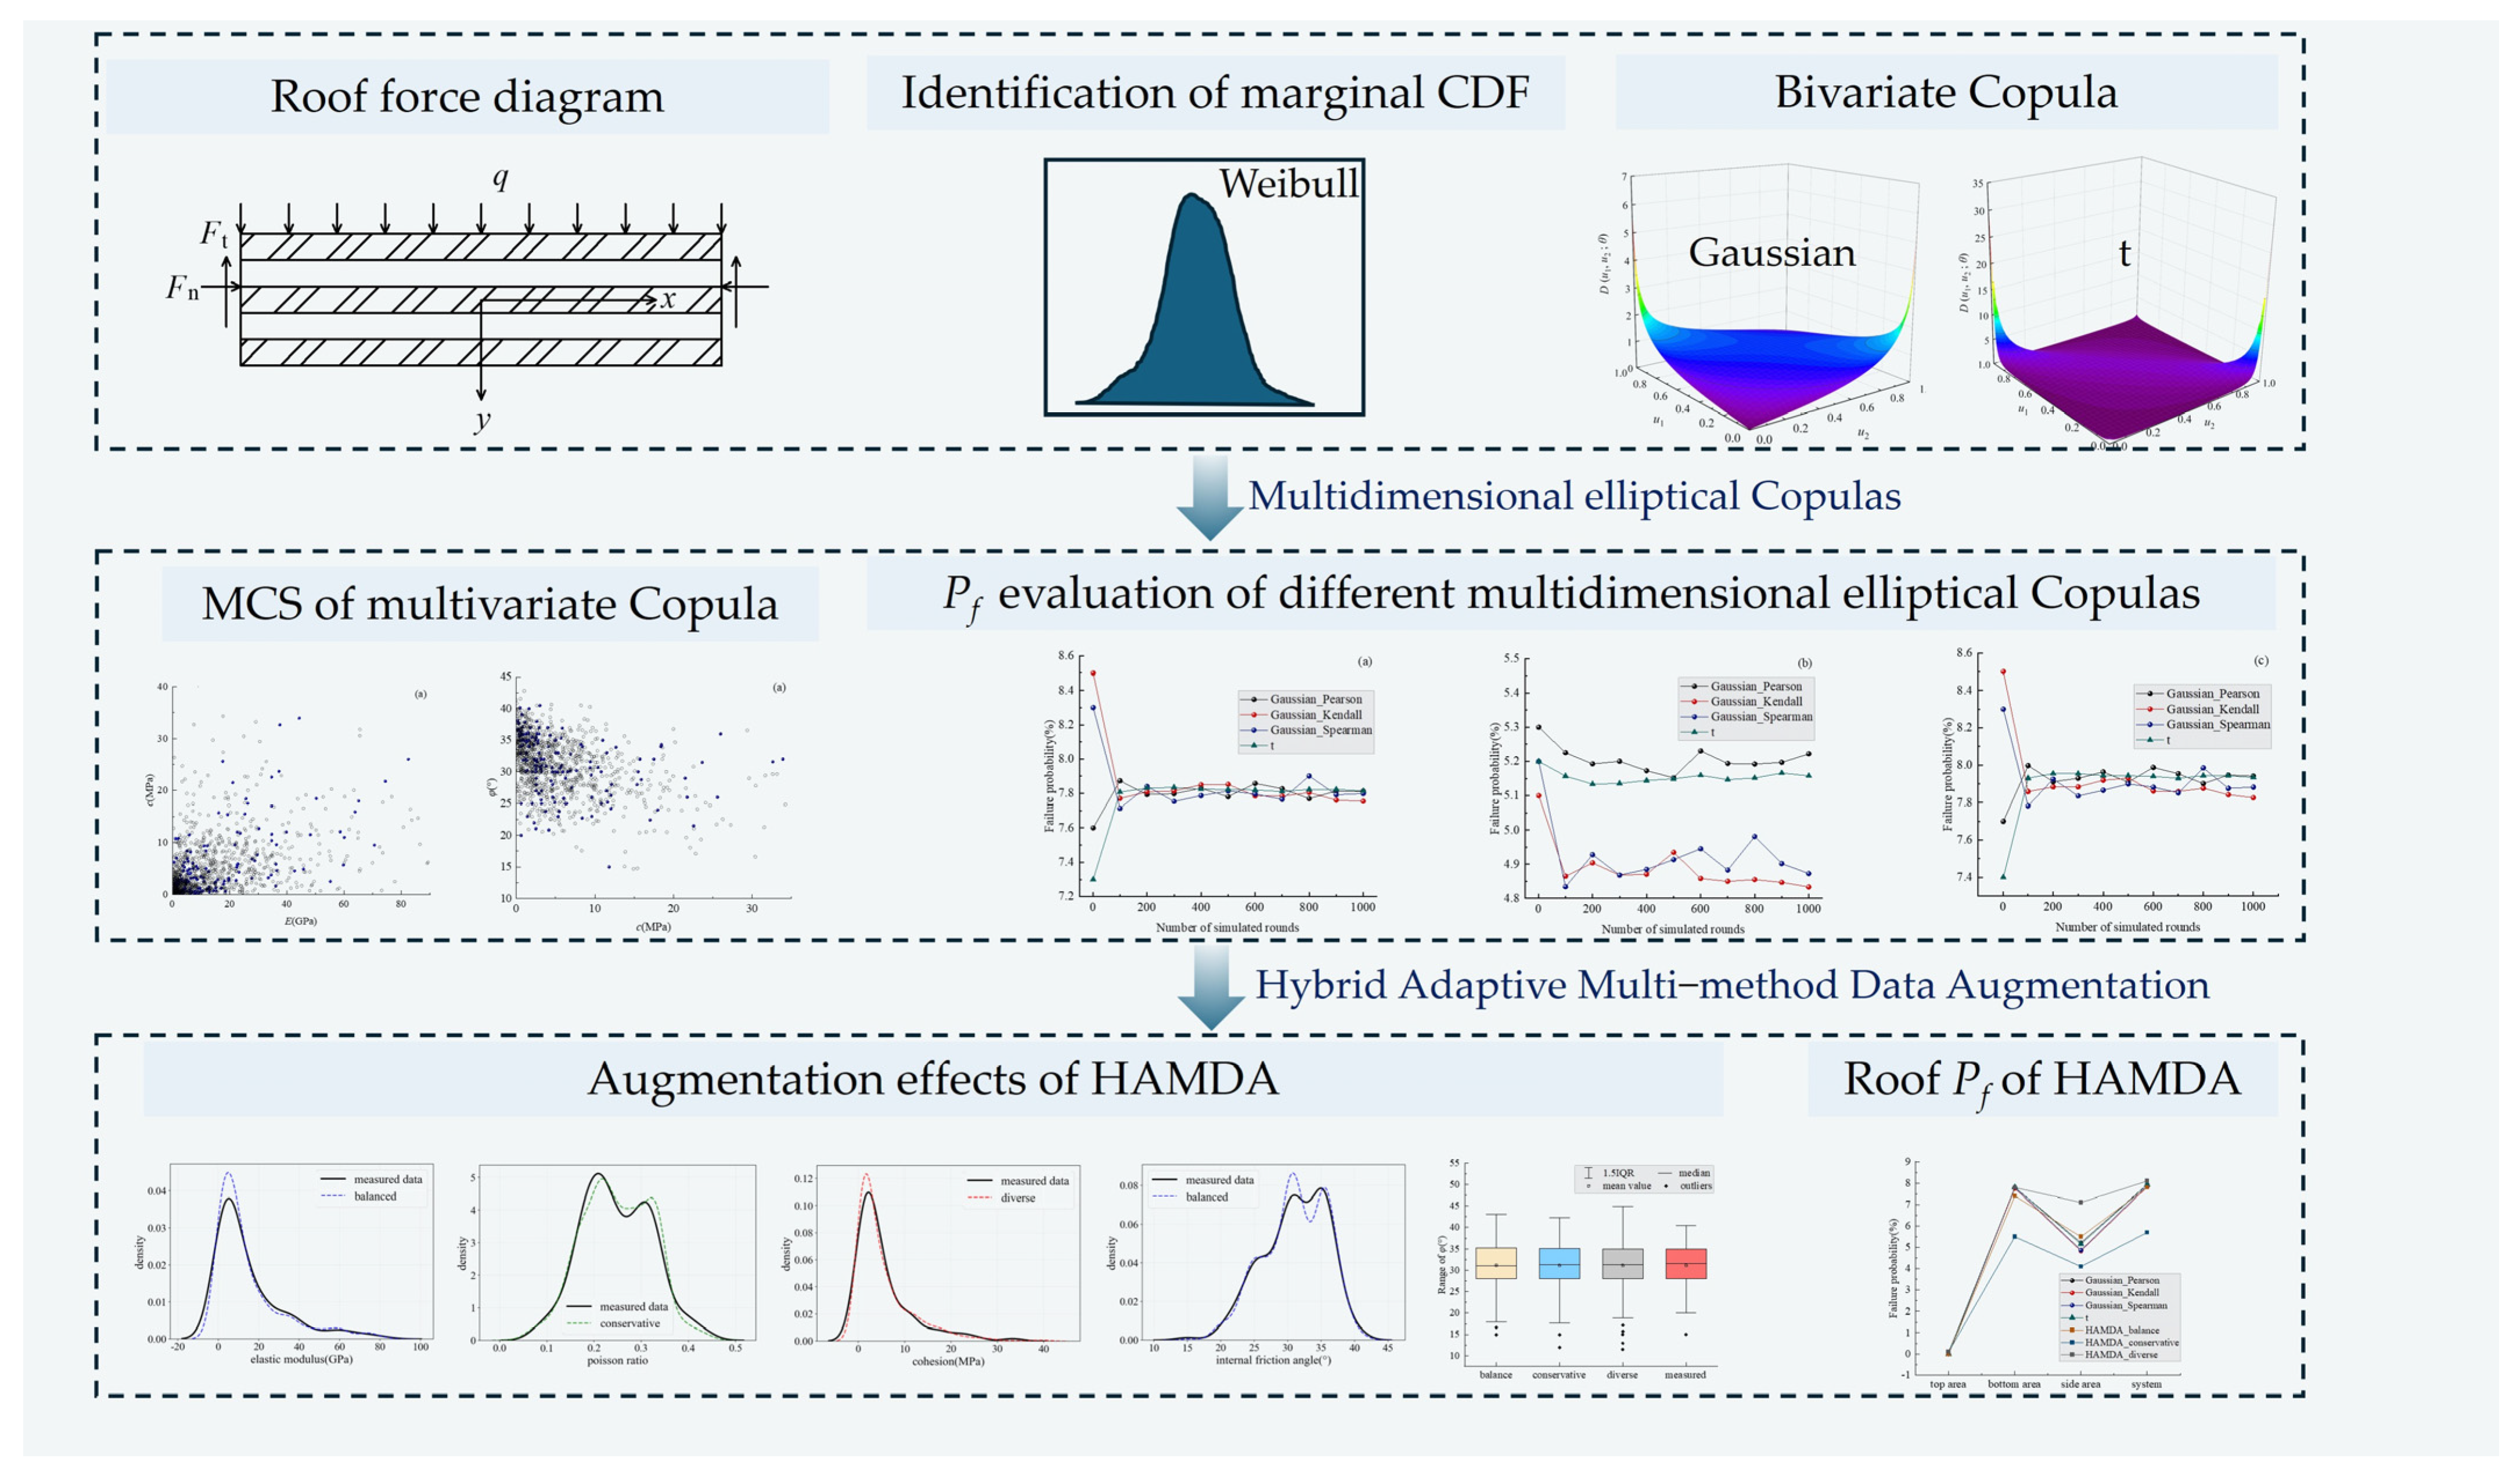
where γ is the average weight of the overburden soil, E is the elastic modulus of the soil (GPa), a = 1/(G − 2ν(1 − ν)/E), b = (1 − ν2)/E, G is the shear modulus, fs is the set safety factor (GPa), c is the cohesion (MPa), φ is the internal friction angle (°), h0 is the roof burial depth (m), n is the roof thickness-to-height ratio, and k0 is the lateral pressure coefficient. FS1, FS2, and FS3 represent the safety factors for the top, bottom, and side regions of the roof, respectively. When FS > 0, it indicates the failure of the soil structure. In Equation (1), due to the uncertainty and variability of parameters within the longitudinal space of the roof, this study selects E, ν, c and φ as uncertain soil parameters for uncertainty characterization. After determining the mechanical research parameters, Figure 2 illustrates the process of expanding the measured sample using multidimensional Copula models and HAMDA under small sample conditions. This aims to generate a large volume of simulated data with the original feature distribution for roof stability analysis.

2.2. Multidimensional Elliptical Copula Model

Due to limitations in the practical survey and testing process, data obtained in engineering projects cannot secure sufficient samples to derive complete probabilistic information about unknown parameters, unlike other fields such as finance. Copula models can be employed to establish quantitative parameter characteristics by constructing the correlation structure of uncertain parameters under small sample conditions. In multidimensional scenarios, multidimensional elliptical Copulas offer the most convenient approach for establishing the multiparameter dependency structures: the bivariate correlation coefficient can be straightforwardly extended to the required parameter matrix. Furthermore, elliptical Copulas exhibit excellent symmetry and positive and negative correlation representativeness, serving all parameter correlation representation needs. Common multidimensional elliptical Copulas include the multidimensional Gaussian and t Copula.

2.2.1. Multidimensional Gaussian Copula

The cumulative distribution function (CDF) and probability density function (PDF) of the multidimensional Gaussian copula are:
C 1 , 2 , , n u 1 , u 2 , , u n ; θ = Φ θ Φ 1 u 1 , Φ 1 u 2 , , Φ 1 u n ; θ
D 1 , 2 , , n u 1 , u 2 , , u n ; θ = θ 1 2 exp 1 2 X T θ 1 I X
where ui = Φ(xi), i = 1, 2, …, n denotes the normal distribution function of xi; Φ−1(ui) represents the inverse of the standard normal distribution function for ui; θ is the correlation parameter matrix, and |θ| denotes its determinant value. X = (x1, x2, …, xn), I is the unit matrix.
The key to constructing a multidimensional Gaussian copula lies in obtaining the copula’s correlation parameter matrix. This study employs the Pearson method, the Kendall method and the Spearman method to estimate the correlation coefficient matrix. The correlation coefficients for these three methods are calculated as follows:
For   Pearson ,   ρ = C o v X 1 , X 2 σ 1 σ 2
For   Kendall ,   τ = P X 1 i X 1 i X 2 i X 2 i > 0 P X 1 i X 1 i X 2 i X 2 i < 0
For   Spearman ,   γ = 3 P X 1 i X 1 i X 2 i X 2 i > 0 P X 1 i X 1 i X 2 i X 2 i < 0
where X1 and X2 represent the measured values of two parameters, σ denotes the standard deviation; Xi, Xi′, and Xi″ are three independent and identically distributed vectors of parameter X. P[(⋯)(⋯) > 0] and P[(⋯)(⋯) < 0] denote the probabilities of consistency and inconsistency between the two sets of vectors, respectively. After obtaining the correlation coefficients for the three construction methods, the correlation parameter θ can be further derived from them.
ρ = x 1 μ 1 σ 1 x 2 μ 2 σ 2 D F 1 x 1 , F 2 x 2 ; θ f 1 x 1 f 2 x 2 d x 1 d x 2
τ = 4 0 1 0 1 C F 1 ( x 1 ) , F 2 ( x 2 ) ; θ d C F 1 ( x 1 ) , F 2 ( x 2 ) ; θ 1
γ = 12 0 1 0 1 C F 1 x 1 , F 2 x 2 ; θ d F 1 x 1 d F 2 x 2 3
where F(x) represents the marginal CDF value of parameter X, and C and D represent the CDF and PDFs of the bivariate copula between parameters.

2.2.2. Multidimensional t Copula

The CDF and PDFs for the multidimensional t Copula are:
C 1 , 2 , , n u 1 , u 2 , , u n ; θ = T θ , d f T d f 1 u 1 , T d f 1 u 2 , , T d f 1 u n
D 1 , 2 , , n u 1 , u 2 , , u n ; θ = θ 1 2 Γ d f + n 2 Γ d f 2 n 1 Γ d f + n 2 n 1 + 1 d f ζ θ 1 ζ i = 1 n 1 + ζ i 2 d f d f + 1 / 2
where Tθ,df(ui) denotes the standard t-distribution function for ui under a correlation coefficient matrix θ and degrees of freedom df, and Tdf−1(ui) is its inverse function. Γ(·) represents the gamma function; ζ′ = (Tdf−1(u1), Tdf−1(u2), ⋯, Tdf−1(ui)). As the degrees of freedom approach infinity, the multidimensional t Copula converges to the multidimensional Gaussian Copula.

2.3. Hybrid Adaptive Multi-Method Data Augmentation (HAMDA) Method

Beyond copula methods capable of modeling the correlation structure among parameters, there are small sample data augmentation techniques in machine learning and statistical analysis. By increasing data diversity and quantity, these methods can overcome issues such as weak model generalization and overfitting caused by insufficient data. However, common data augmentation approaches like flipping and cropping rely on simple transformations and fail to generate meaningful samples. Interpolation methods like SMOTE typically rely solely on local neighborhood information, potentially overlooking global distribution characteristics [40]. Training generative models such as GANs under small sample conditions may be unstable and prone to pattern collapse. Meanwhile, statistical sampling methods like Bootstrap and Kernel Density Estimation (KDE) exhibit limited sample diversity when employed as standalone approaches. [41,42,43] Therefore, this study proposes an optimized hybrid adaptive multi-method data augmentation framework. This framework essentially integrates multiple data augmentation methods, leveraging the strengths of different approaches to configure varying proportions of original data for augmentation. This approach satisfies the need for sample diversity and more closely approximates the true measured sample distribution.
This study integrates six complementary data augmentation techniques. The principles and primary advantages of each method are as follows: (1) SMOTE: Increases the number of minority class samples by synthesizing new samples through linear interpolation between a selected minority sample and its nearest neighbors, rather than simply duplicating minority samples. (2) KDE: Estimates the probability density function of data using a nonparametric method, then samples new instances from the estimated distribution. It demonstrates significant advantages when handling complex distributions and high-dimensional data. (3) Adaptive Gaussian Noise (AGN): Adjusts noise levels based on the local density of data, adding adaptive noise to the original samples. It is easy to tune parameters, effectively learns the model’s generalizable features, and avoids overfitting. (4) Mixup Data Blending (MDB): Generates new samples by linearly interpolating between two existing samples to enhance data diversity. (5) Spline Interpolation Augmentation (SIA): Captures nonlinear trends by fitting smooth curves connecting multiple data points. Compared to linear interpolation, spline interpolation produces smoother, more naturally occurring samples. (6) Conditional Multivariate Normal Sampling (CMNS): Assuming data follows a multivariate normal distribution, it utilizes a covariance matrix to capture linear correlations between variables, sampling new instances from the estimated distribution. This method preserves linear correlations between variables and is suitable for original data approximating a normal distribution. The core principle of HAMDA is the Weighted Ensemble Strategy, which dynamically adjusts different weights to generate distinct data augmentation schemes. Its primary concept is outlined as follows:
D syn = k = 1 K S k D o r i g , ω k , θ k
where Dsyn denotes the synthetic sample set, Dorig denotes the measured sample set, K denotes the total number of augmentation methods (K = 6 in this study), Sk denotes the kth augmentation method, ωk denotes the weight of the kth method satisfying k = 1 K ωk = 1, and θk denotes the hyperparameter of the kth method.

3. Illustrative Example

3.1. Construction of Multidimensional Elliptical Copula Models

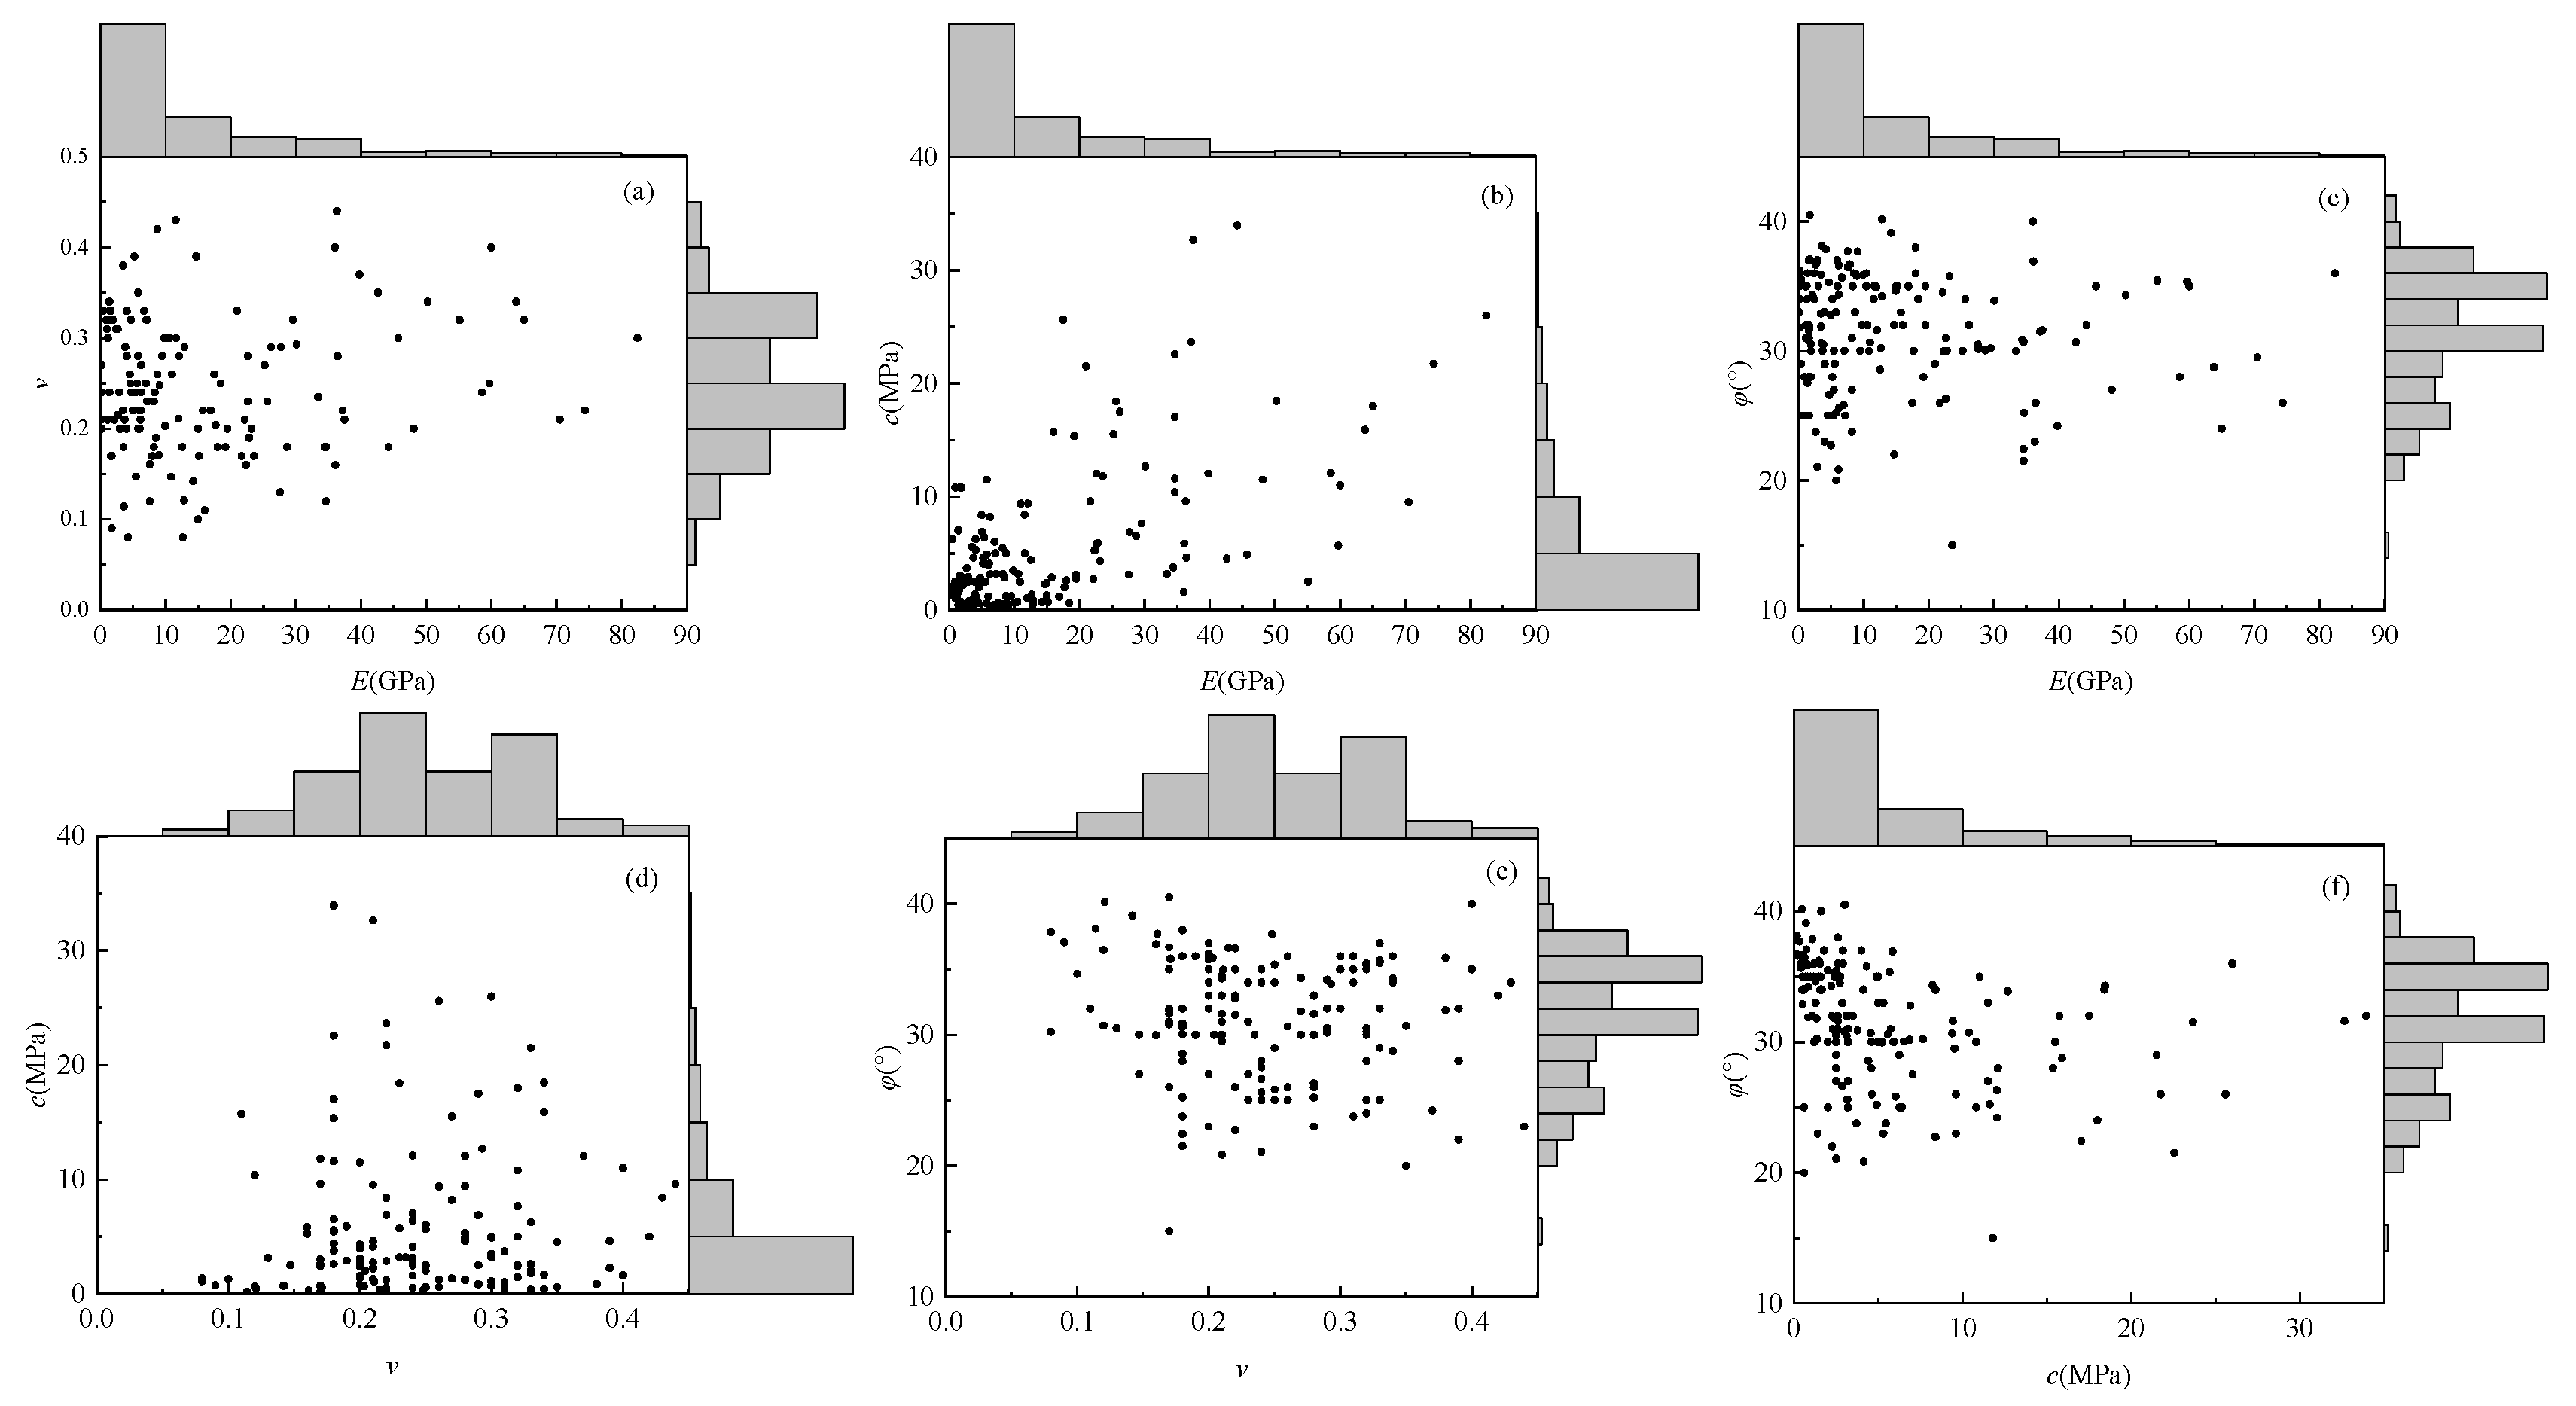
The measured data used in this study comprises 192 sets of mechanical parameters including E, ν, c and φ for roof strata in domestic coal mines, collected by Cao et al. [39]. Specific details of the roof strata are shown in Table 1. Following preliminary statistical analysis of the data, two-dimensional comparison charts incorporating the measured data histogram distribution are drawn, as shown in Figure 3 below.
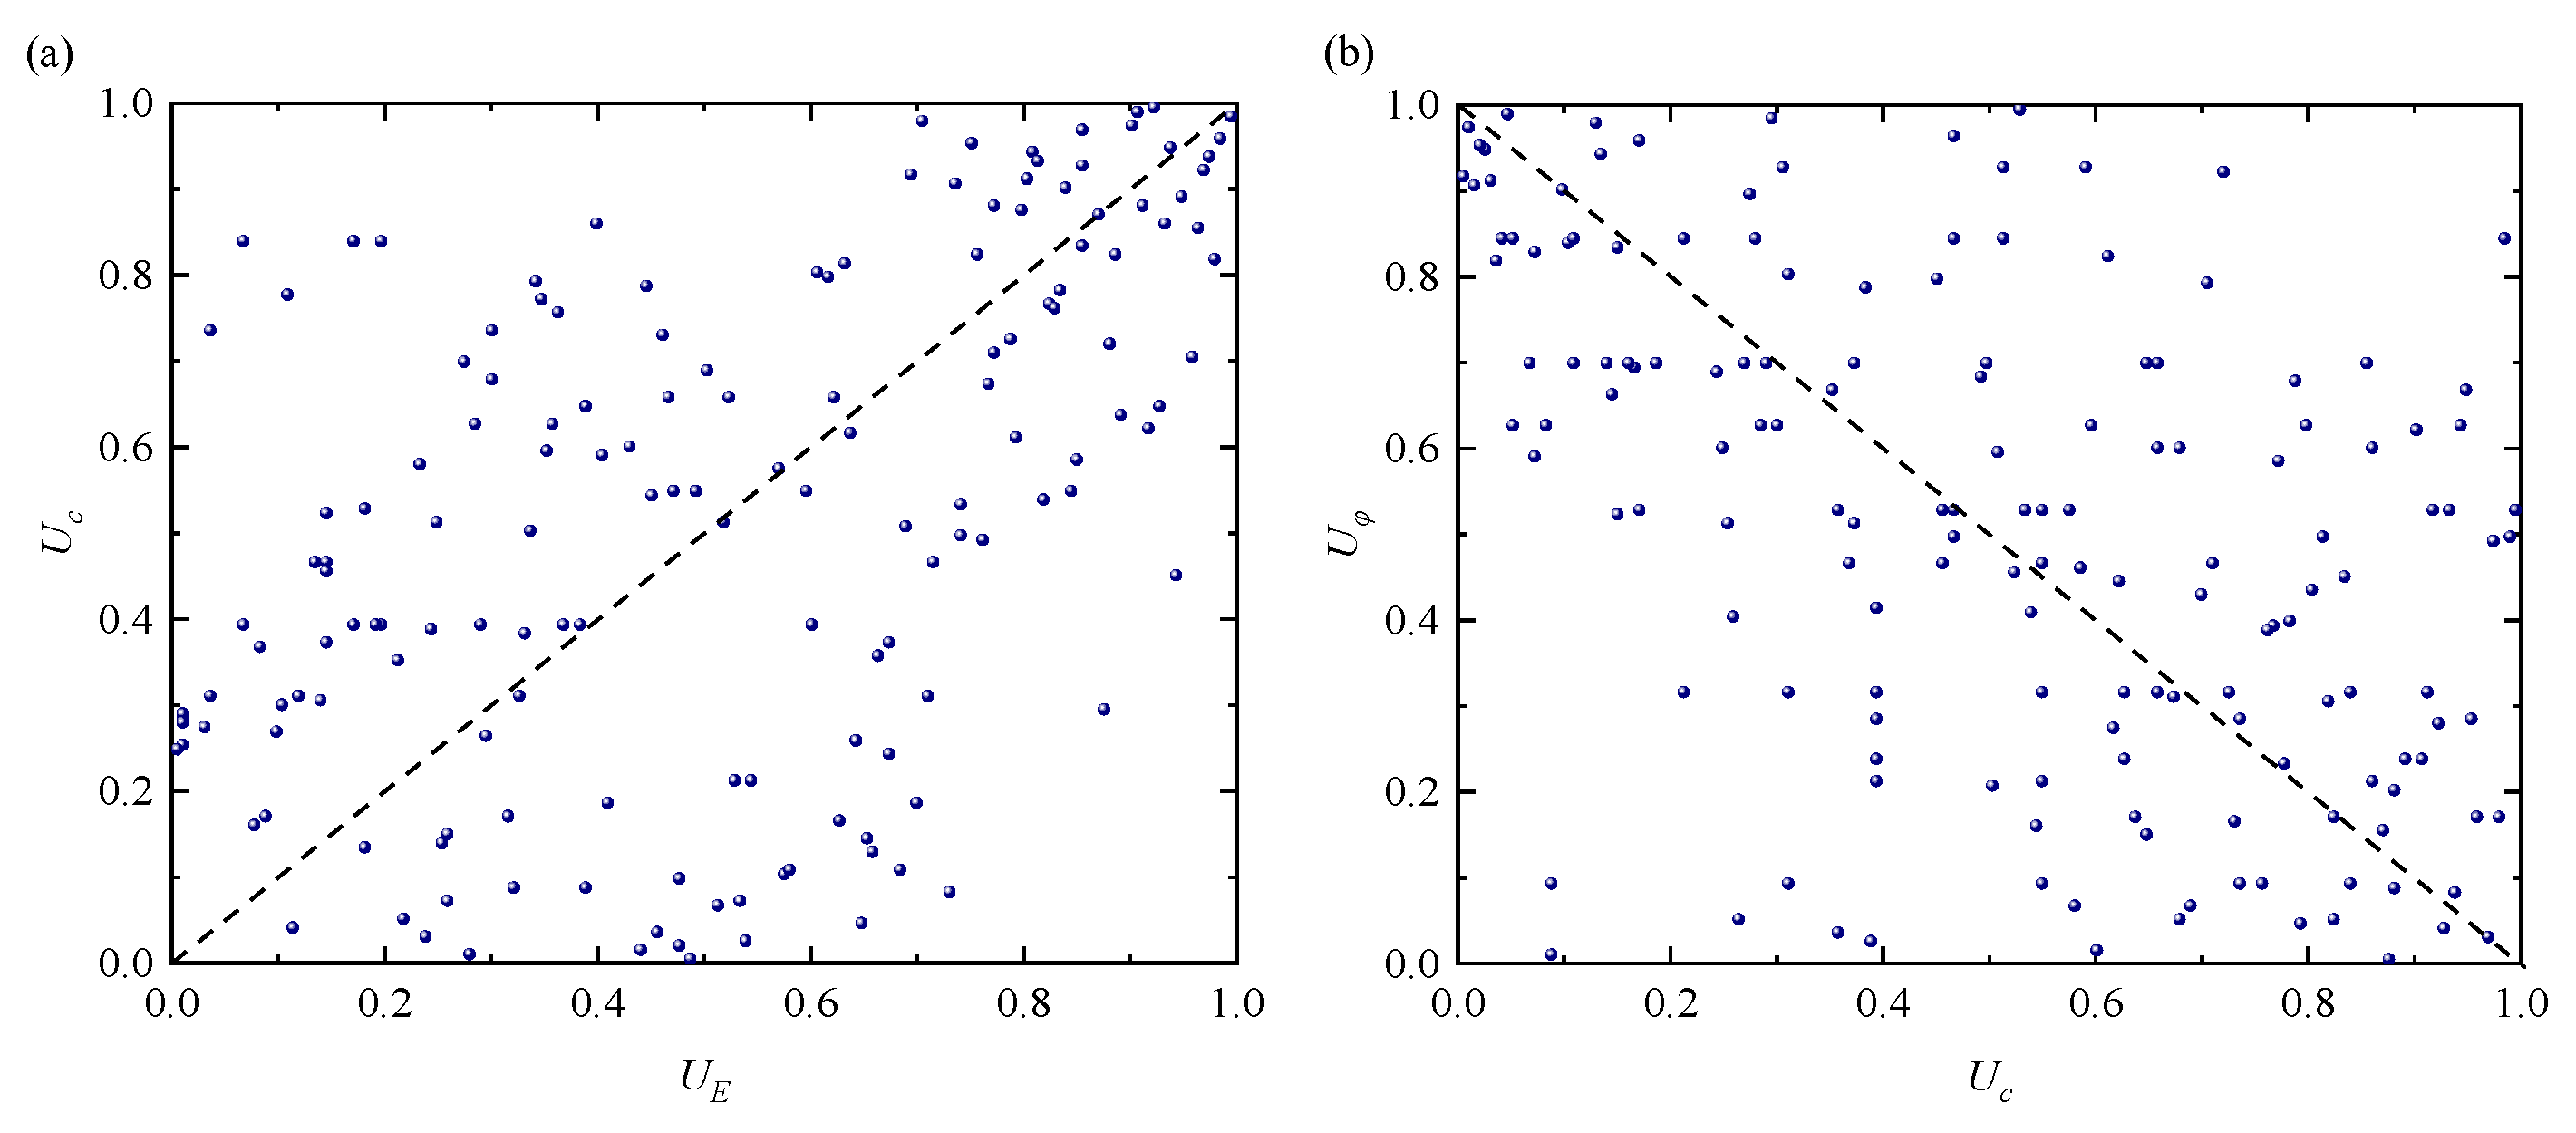
Based on the two-dimensional measured histogram distribution results of coal mine roof data, the distribution of each mechanical parameter exhibits high dispersion and a wide range. This is due to the collected roof mechanical data originating from multiple coal mines with differing geological conditions, resulting in significant variations in parameter values. Nevertheless, distinct correlation patterns emerge among the four mechanical parameters. For instance, a clear positive correlation exists between Ec, while a pronounced negative correlation is observed between cφ. Figure 4 illustrates the comparison of these two correlation patterns under empirical distributions. The empirical distribution results reveal that both correlation patterns are distributed near the 45° and 135° diagonals, exhibiting distinct symmetry characteristics.
To construct the multidimensional Gaussian Copula structure with four mechanical parameters using three different construction methods, the first step is to identify the marginal distribution functions of these four parameters. The AIC criterion can be used to estimate the marginal distribution characteristics of the parameters under the measured data. The AIC test expression for the marginal distribution function is [44]:
AIC = 2 i = 1 N ln f x i ; ε + 2 k
where ε is the vector of distribution parameters, k is the number of parameters in the marginal distribution function (k = 2 in this study), and N is the total number of observed samples. Four alternative marginal distribution functions were selected as candidates for identification, with their AIC calculation results shown in Table 2. The bolded values in the table represent the minimum AIC values, indicating the optimal marginal CDF for each variable. The optimal marginal CDF for all four mechanical parameters in this study is the Weibull function. This is attributed to the Weibull function’s shape parameter, which allows flexible adjustment of skewness, enabling it to adequately fit uncertain mechanical parameters characterized by high variability.
Having obtained the marginal distribution characteristics of the mechanical parameters, the correlation coefficients and correlation parameter matrices are calculated using three construction methods, with the results shown in Table 3. Substituting the correlation parameter matrices into Equation (3) yields the joint distribution results of the multidimensional Gaussian Copula under different construction approaches. Comparing the correlation parameter matrices from the three construction methods, consistent with the results in Figure 4, the correlation parameters between parameters E and c, as well as between c and φ, are relatively large, with absolute values around 0.5. Within these two correlation structures, the Kendall method yields larger correlation parameters than the Spearman method, while the Pearson method produces the smallest correlation parameters. This is due to a certain degree of amplification effect when solving correlation parameters using Kendall’s correlation coefficient, whereas the Spearman method exhibits a weaker amplification effect.
Similarly, the joint parameter matrix of the t Copula model can be calculated using maximum likelihood estimation, with the results shown in the following equation. Substituting these into Equation (11) yields the multidimensional t Copula joint distribution model. It is noted that when performing maximum likelihood estimation for the degrees of freedom of the t Copula, the results were found to be significantly greater than 100. Therefore, it can be concluded that the constructed multidimensional t Copula in this study approximates the multidimensional Gaussian Copula model. Furthermore, the correlation parameter results from Equation (14) reveal values that closely resemble those of the Gaussian Copula correlation parameter matrix under the Pearson method.
1 0.0706 0.4797 0.0769 0.0706 1 0.0742 0.1776 0.4797 0.0742 1 0.4618 0.0769 0.1776 0.4618 1

3.2. Stability Analysis of Coal Mine Roof Based on Multidimensional Elliptical Copula Models

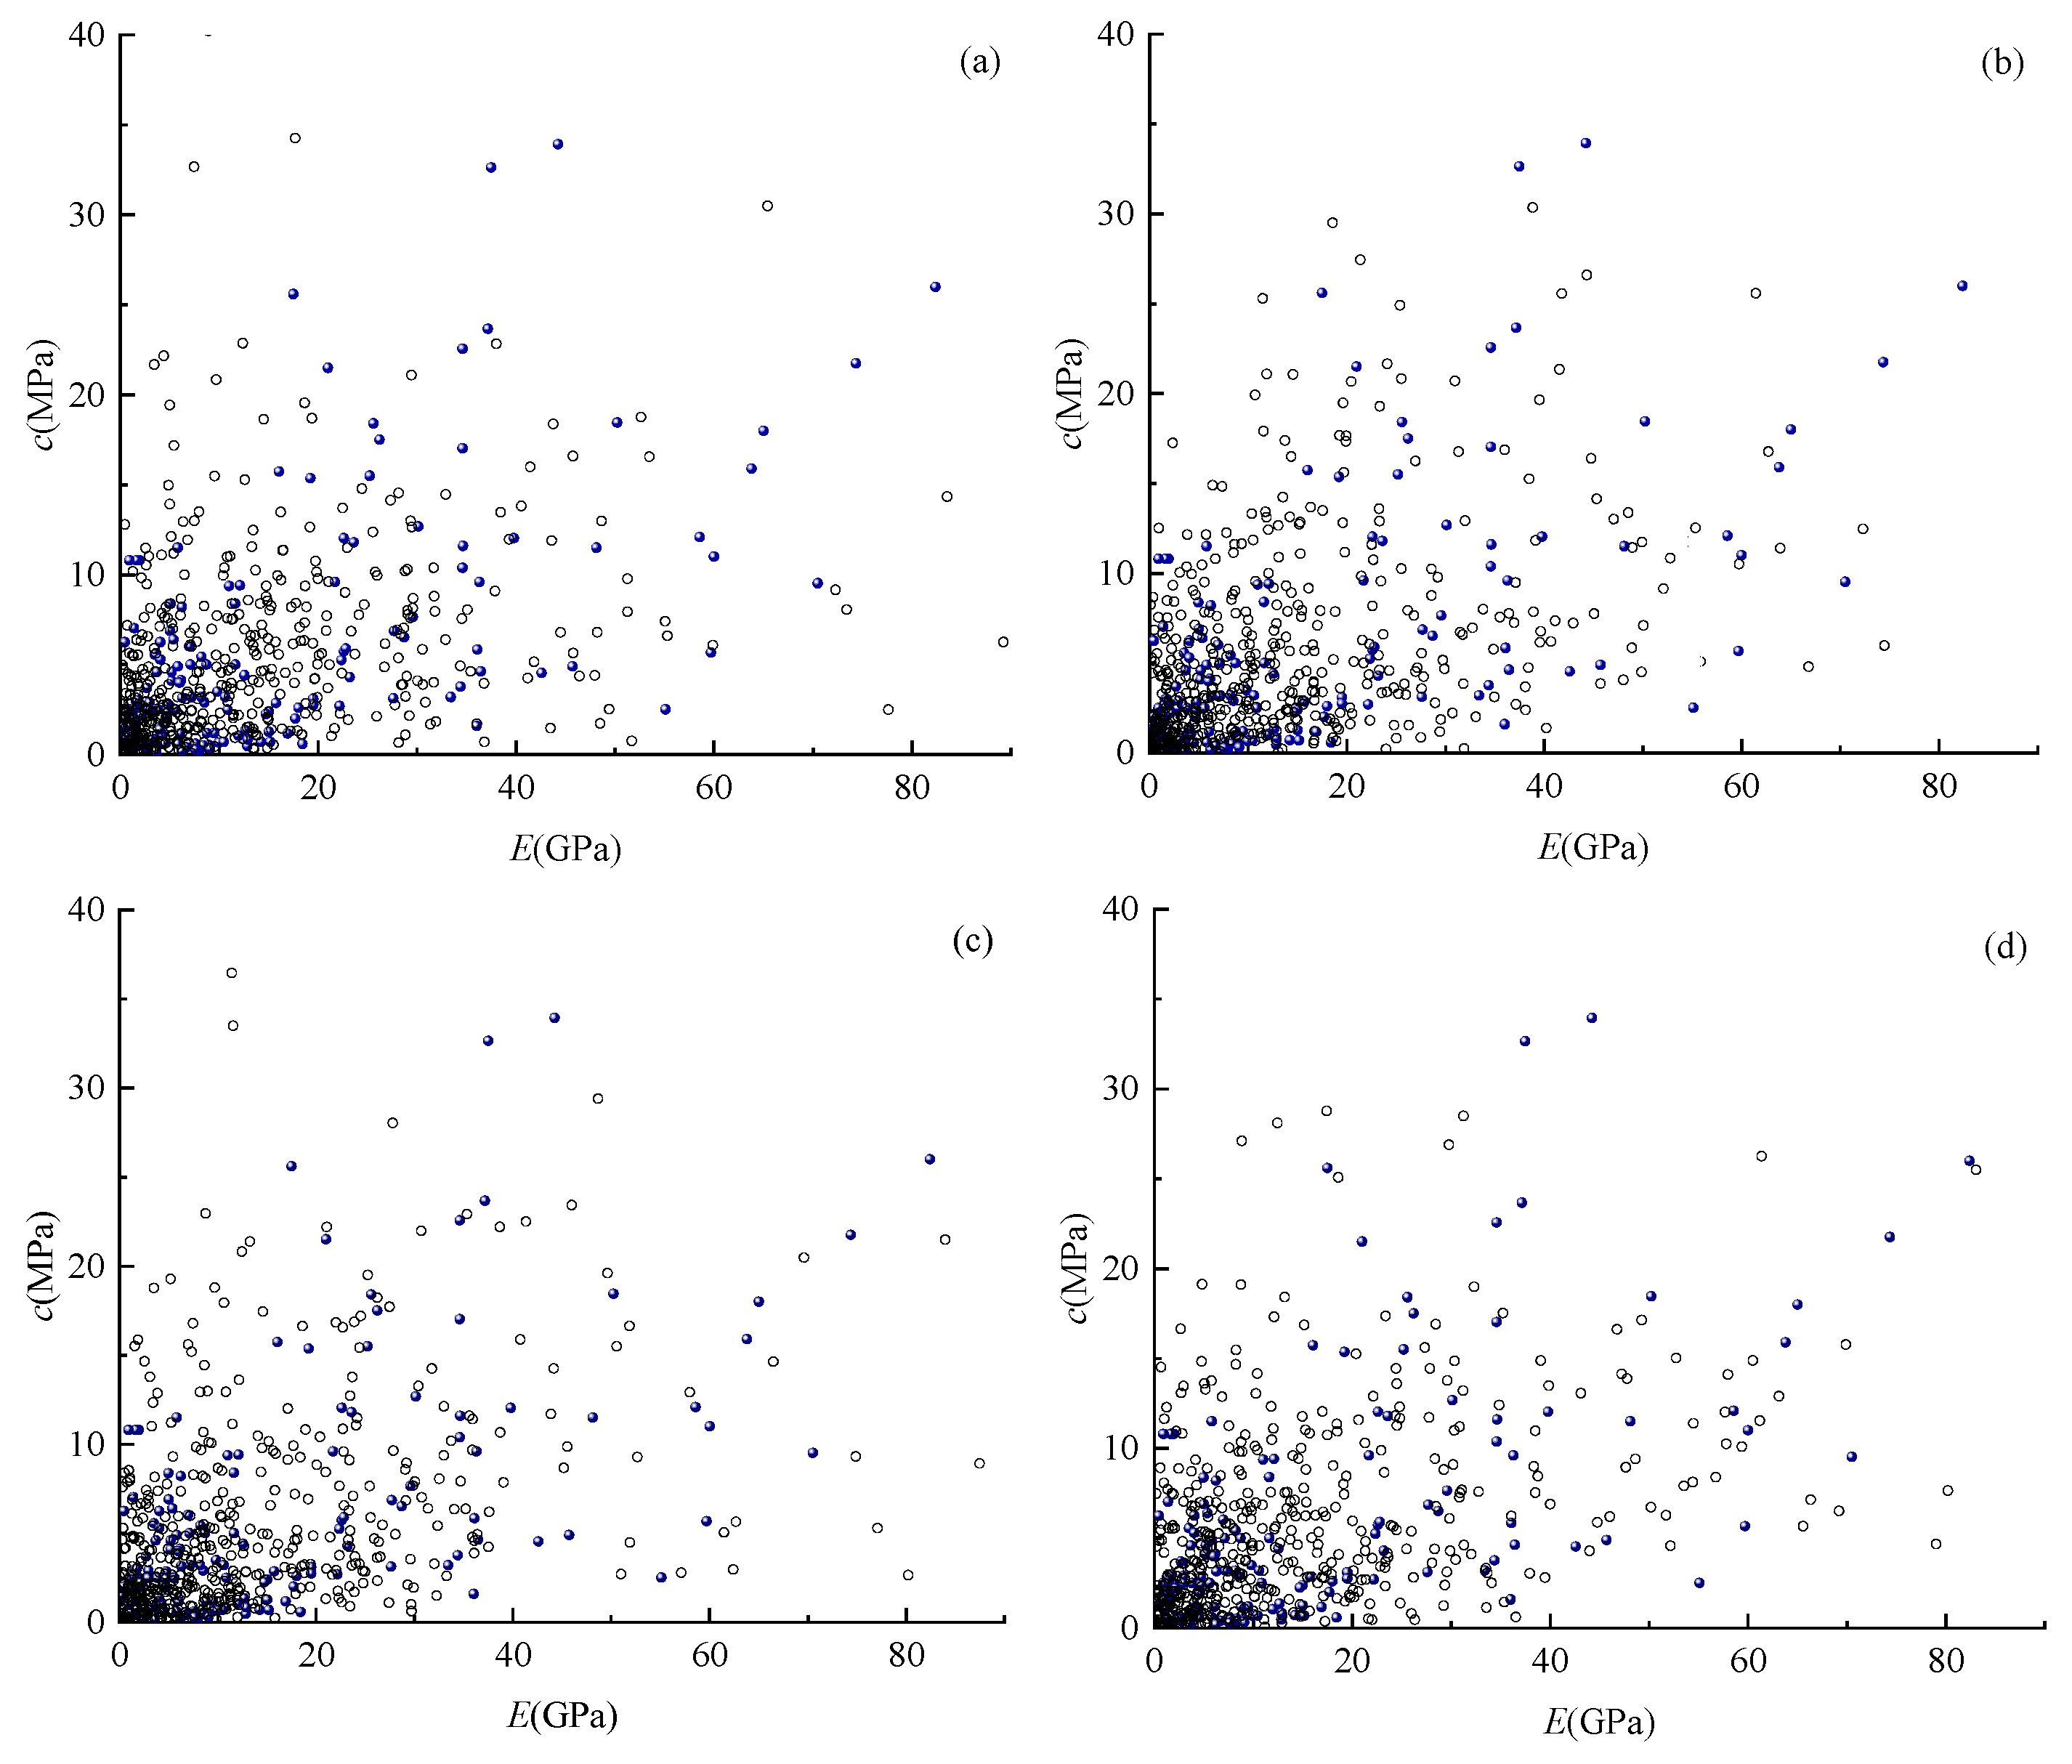
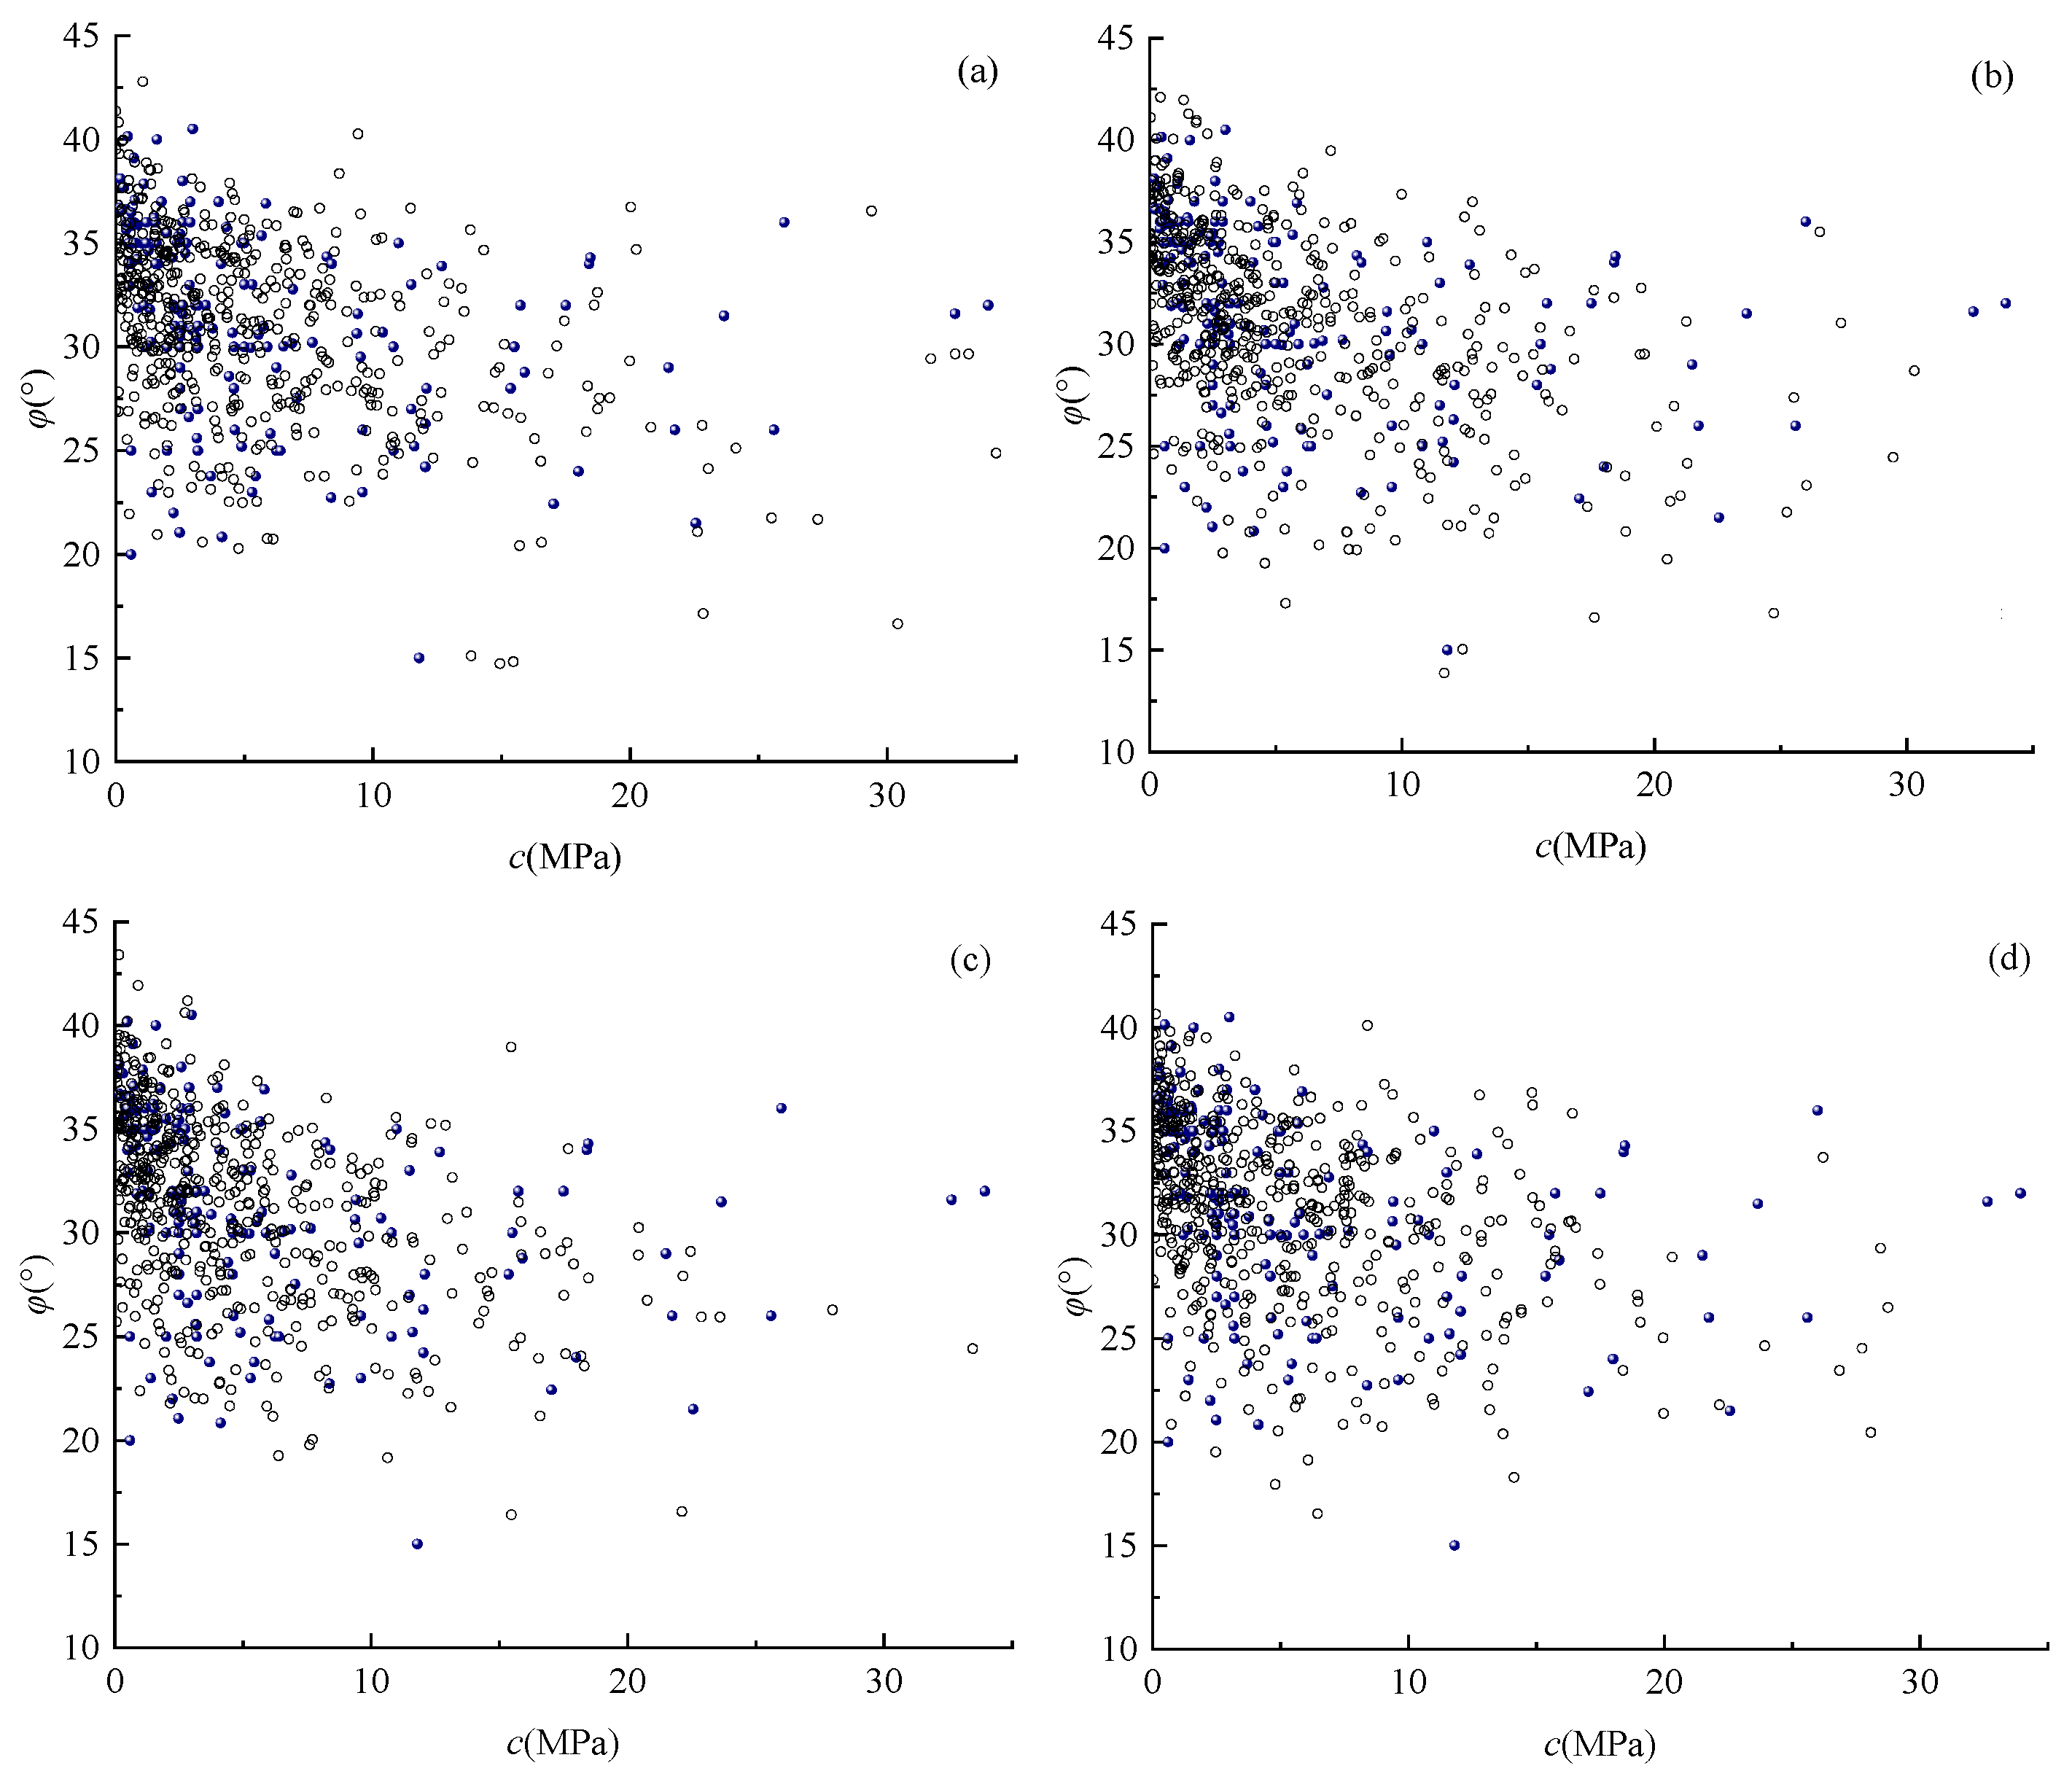
After constructing the multidimensional elliptical copula models, to investigate the stability of roof soil structures under small sample mechanical parameters, 1000 sets of Gaussian Copula under three different construction methods and t copula models were simulated using MCS. Table 4 presents the statistical characteristics of simulated samples under different Copula models. The simulation results indicate that the statistical characteristics of the four roof mechanical parameters simulated by various Copula models are highly consistent with measured values. For elastic modulus, the simulated mean and variance of the Gaussian_Pearson model most closely match the measured values. Regarding Poisson’s ratio, all models deliver excellent simulation results with minimal discrepancies. For cohesion, the simulated mean and variance of the Gaussian_Kendall model most closely matched the measured values. For the internal friction angle, the simulated mean of the Gaussian_Spearman model most closely matched the measured value, while the variance of the t Copula model most closely matched the measured value. It is evident that for the statistical characteristics of different mechanical parameters, each scheme yields optimal simulation results. Therefore, it is necessary to further discuss the correlation structure simulation results of different schemes. To validate the effectiveness of the models in simulating small sample correlation structures, the Ec and cφ correlations with obvious correlation structures are still selected as representative simulation visualization outputs. Figure 5 and Figure 6, respectively, show the comparison between simulated and measured samples for Ec and cφ under different construction methods, where blue solid dots represent measured samples and black hollow dots represent simulated sample points.
From the comparison of simulated results against measured data for the two correlation structures, it is evident that regardless of the modeling approach employed, the simulated samples fully envelop the overall shape of the measured points. This validates the effectiveness and convenience of the multidimensional elliptical copula in characterizing and simulating the multidimensional soil structure of the roof.
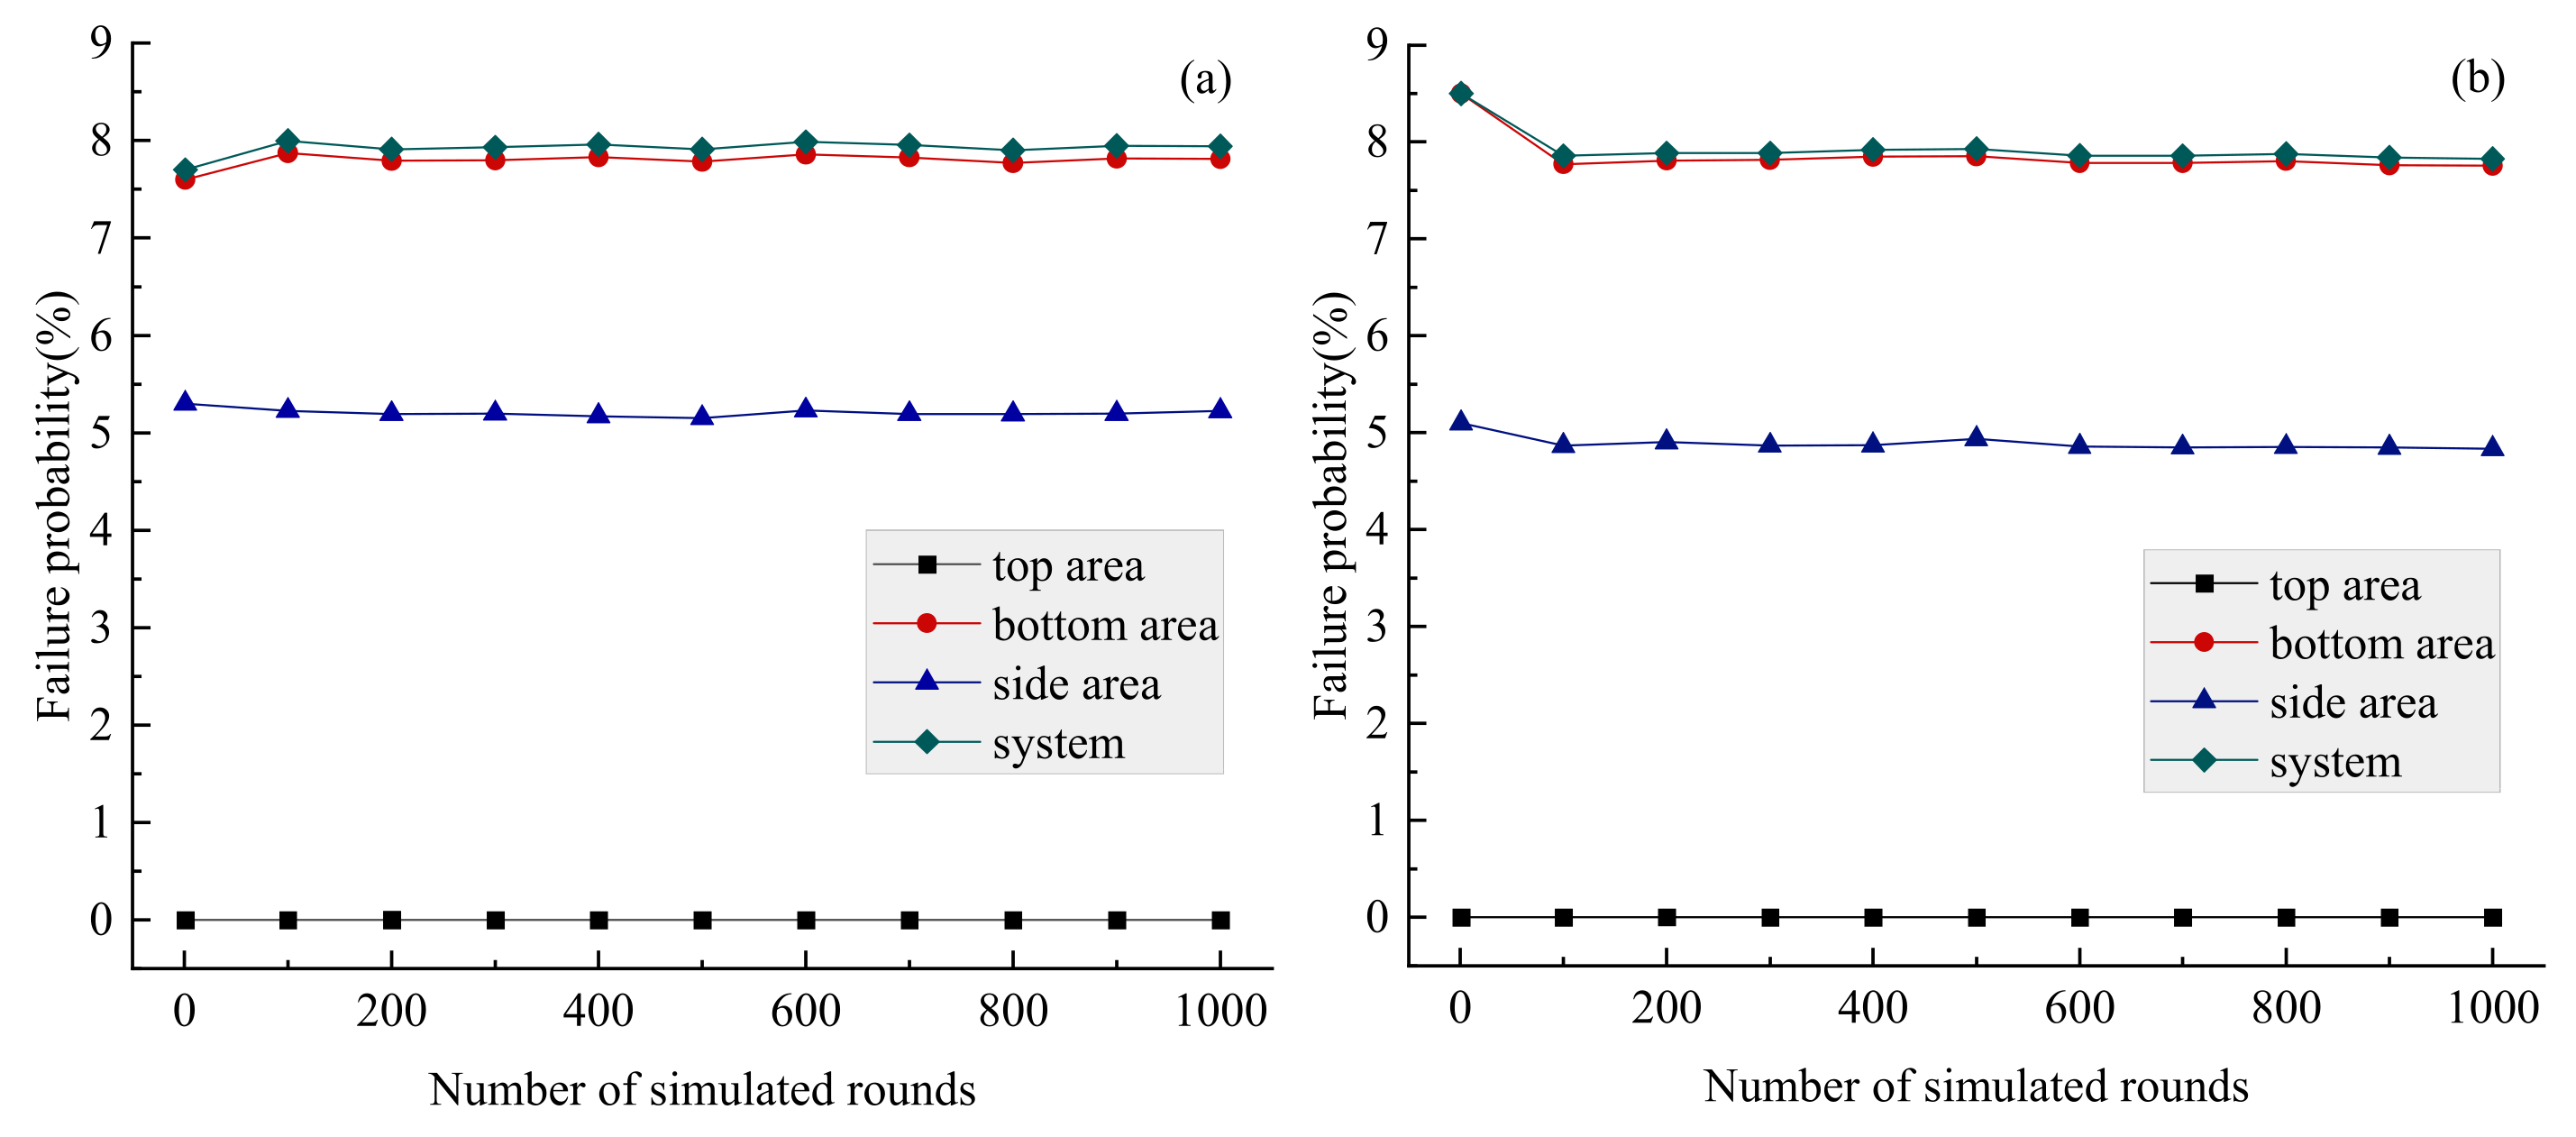
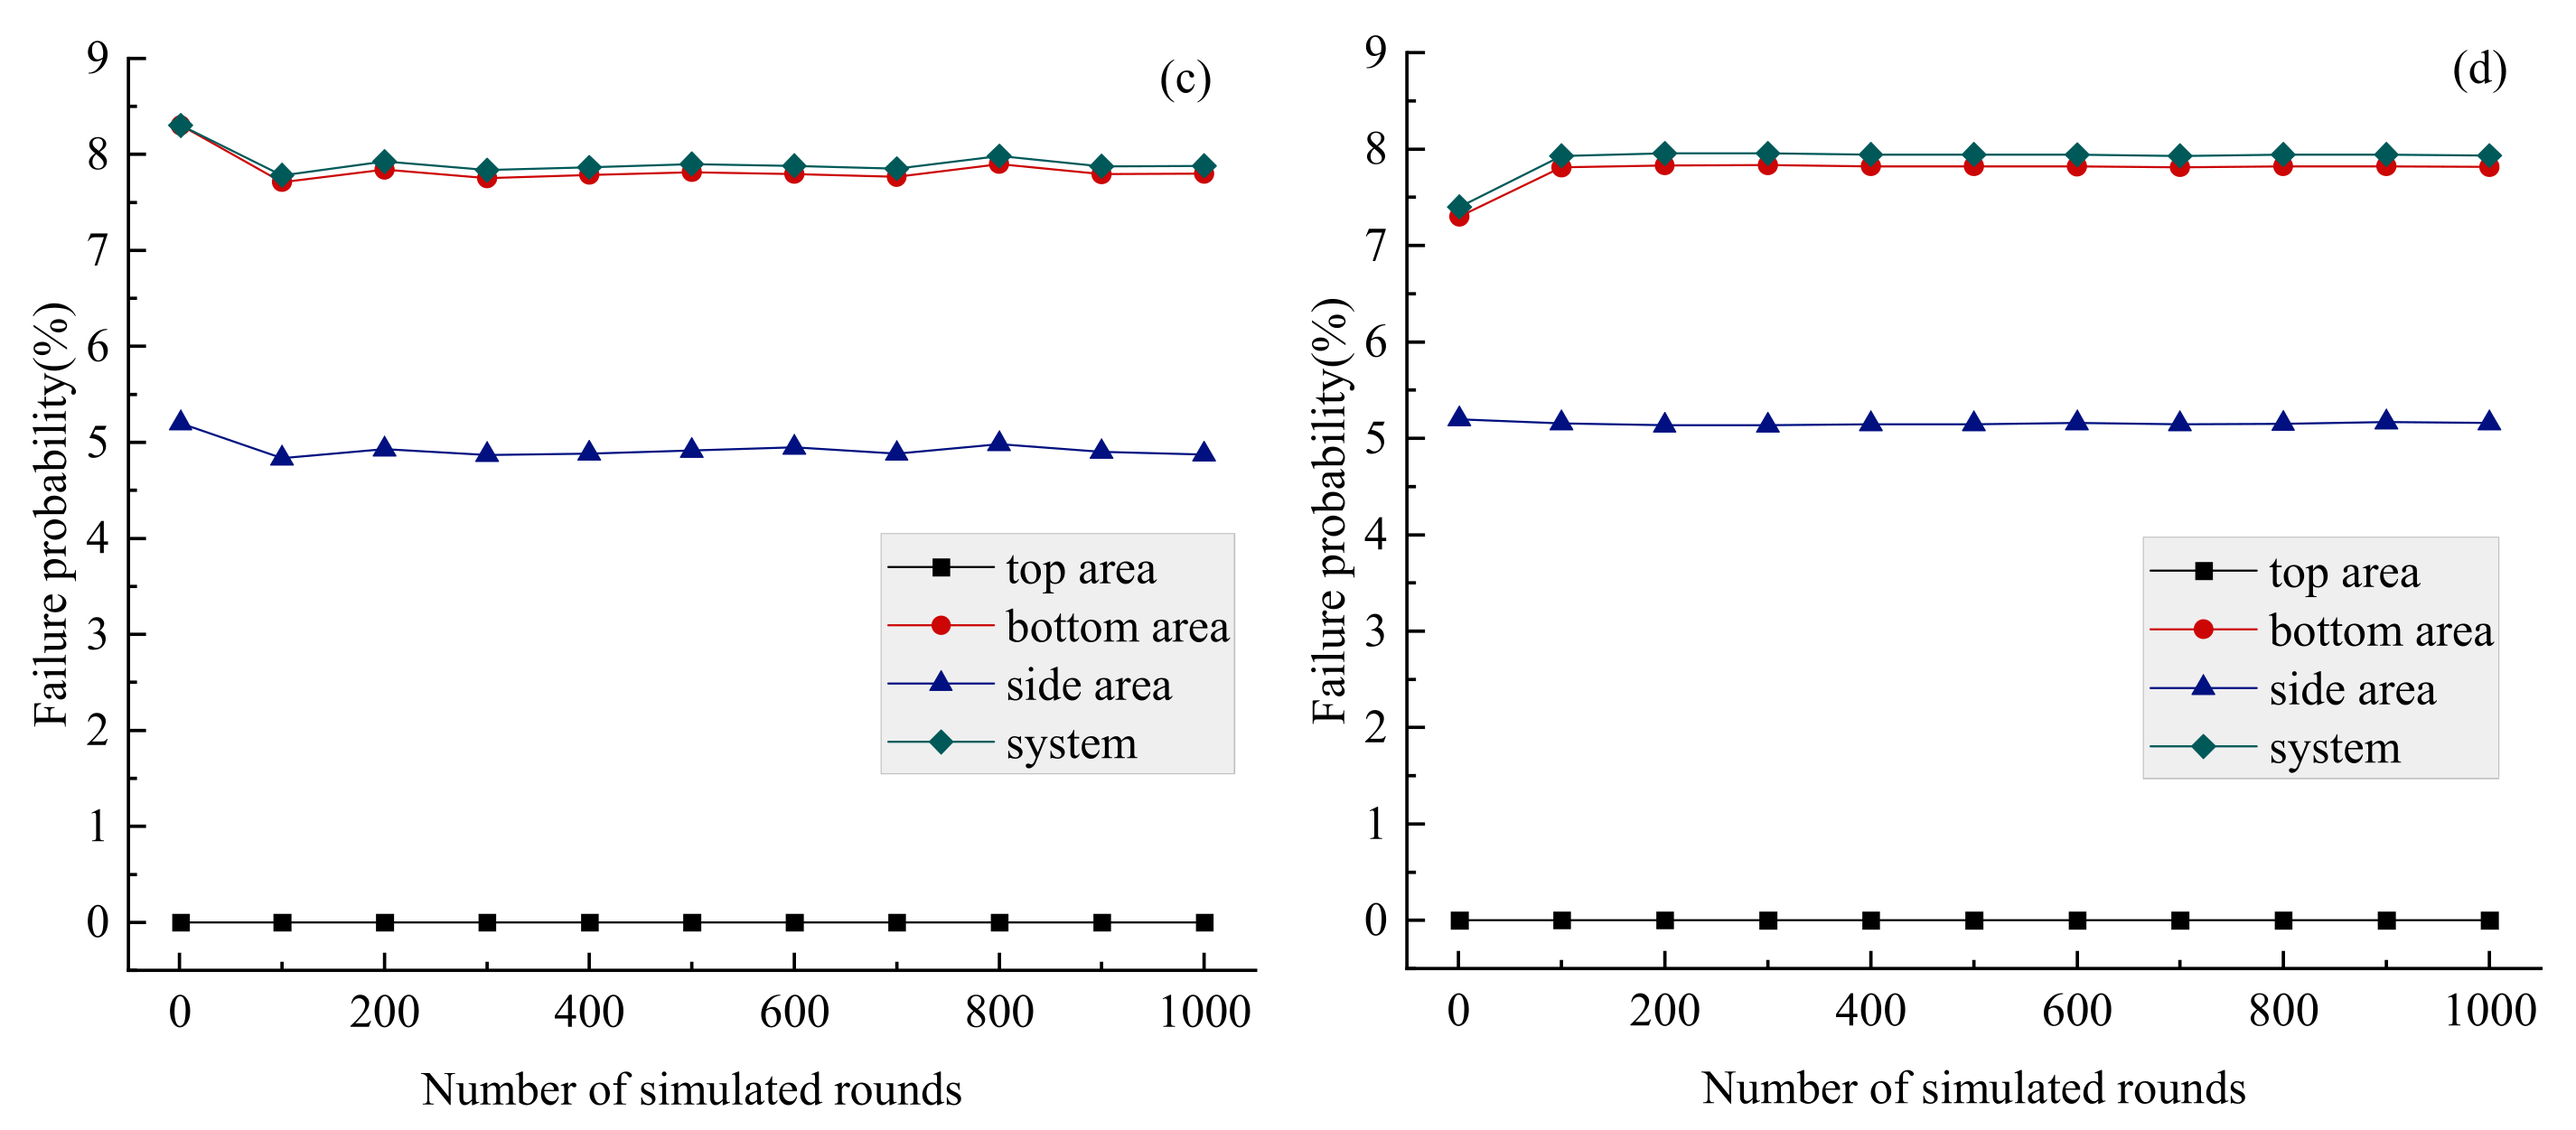
Based on the reliability functional of the coal mine roof soil structure from Section 2.1, constant values for the roof geotechnical parameters are first established, excluding the study variables E, ν, c and φ selected in this research, as shown in Table 5 below. Using the peak expression for the roof classification value region in Equation (1), substituting simulation data from different structural models into the discriminant equation yields the failure probability pf for the roof top, bottom and side positions, as well as the overall failure probability. pf represents the ratio of the sample count of failures to the total sample count. Due to significant uncertainties in the MCS process, the failure probability obtained from each simulation is not always consistent. To reduce errors introduced by MCS, simulations are repeated in rounds of 100, 200, 300, …, 1000 cycles, with each round comprising 1000 MCS iterations. The resulting variations in failure probability at different roof locations for various structural models are shown in Figure 7.
As shown in Figure 7, the failure probability distribution across different locations of the roof stabilizes after 100 simulated rounds. Regarding failure locations, pf at the top area remains consistently near zero, indicating that the top area is relatively safe within the entire roof soil structure. Conversely, pf at the bottom area is nearly equivalent to the system pf of the entire roof soil structure, indicating that most roof system instabilities are accompanied by failure at the bottom. The failure probabilities in the side areas of the roof account for approximately 60% of the overall system failure probability. This occurs because the bottom region of the roof directly bears the full weight of the overlying strata, resulting in peak vertical compressive stress. Furthermore, as illustrated by the stress diagram of the roof in Figure 1a, the roof can be modeled as a cantilever beam with fixed ends at the sides and a free end at the span center, where the bottom experiences maximum tensile stress. When tensile stress exceeds tensile strength, cracks form. These bottom cracks propagate upward, reducing the bearing area and further concentrating stress. In the side region, lateral constraints cause stress to gradually transition inward from the boundary, unlike the abrupt change at the bottom, resulting in relatively lower stress concentration. Therefore, the bottom is the primary failure zone. To address this phenomenon, practical engineering should reinforce support at the bottom of the roof. Measures include using high-strength bolts with reduced spacing in the tensile stress zone and installing additional anchor cables above the bottom area. In the side region, leverage the advantage of natural constraints by appropriately increasing anchor spacing, while densifying arrangements in the transition zone with the bottom. Combine this with dynamic early warning monitoring for real-time intelligent adjustments.
Figure 8 shows the variations in failure probability at different locations on the roof as the number of simulation rounds increases. Since pf at the top area is nearly zero, the figure only displays failure probability distributions for the bottom, side regions and the entire roof structure. Consistent with the conclusions in Figure 7, after 100 simulation rounds, the failure probabilities for the bottom area and the entire roof structure show no significant changes. Furthermore, both methods exhibit similar failure probabilities in both the multidimensional Gaussian and t Copula models. However, in the top and side regions, the multidimensional Gaussian Copula model constructed using the Kendall method and the Spearman method shows lower failure probabilities. Conversely, the multidimensional Gaussian and t Copula models constructed using the Pearson method exhibit higher failure probabilities in the side regions.

3.3. Stability of Coal Mine Roof Based on HAMDA

This section utilizes HAMDA to obtain augmented samples with the characteristics of the original samples and evaluates the stability of coal mine roof soil structures under small sample conditions. Based on the characteristics of different data augmentation methods, the failure probability characteristics of coal mine roof soil structures are explored through three weighting allocation schemes for the augmented samples: HAMDA_balance, HAMDA_conservative and HAMDA_diverse. HAMDA_balance employs SMOTE and KDE as primary methods, allocating 55% weight to ensure statistical fidelity of augmented data. Exploratory methods like AGN and MDB receive 45% weight to enhance sample diversity. By maintaining a roughly 1:1 balance between accuracy and diversity, this approach preserves the original distribution characteristics of augmented data while boosting generalization capabilities through random perturbations and blending strategies. HAMDA_conservative prioritizes robustness by allocating 70% weight to SMOTE and KDE. These well-validated interpolation methods minimize potential extreme values in augmented data. By reducing weights for AGN and MDB as well as completely excluding CMNS, which relies on a multivariate normal assumption, it strictly limits the introduction of additional uncertainty. This ensures the vast majority of synthetic samples are generated via linear interpolation or density estimation. HAMDA_diverse follows a multi-method averaging principle, assigning equal 20% weights to SMOTE, KDE, AGN, and MDB. It adheres to the maximum entropy principle without prior information allocation. This approach balances the strengths of each method while enhancing the diversity of augmented data. Each program comprises 1000 data sets including the measured samples. The specific sample allocation results are shown in Table 6.
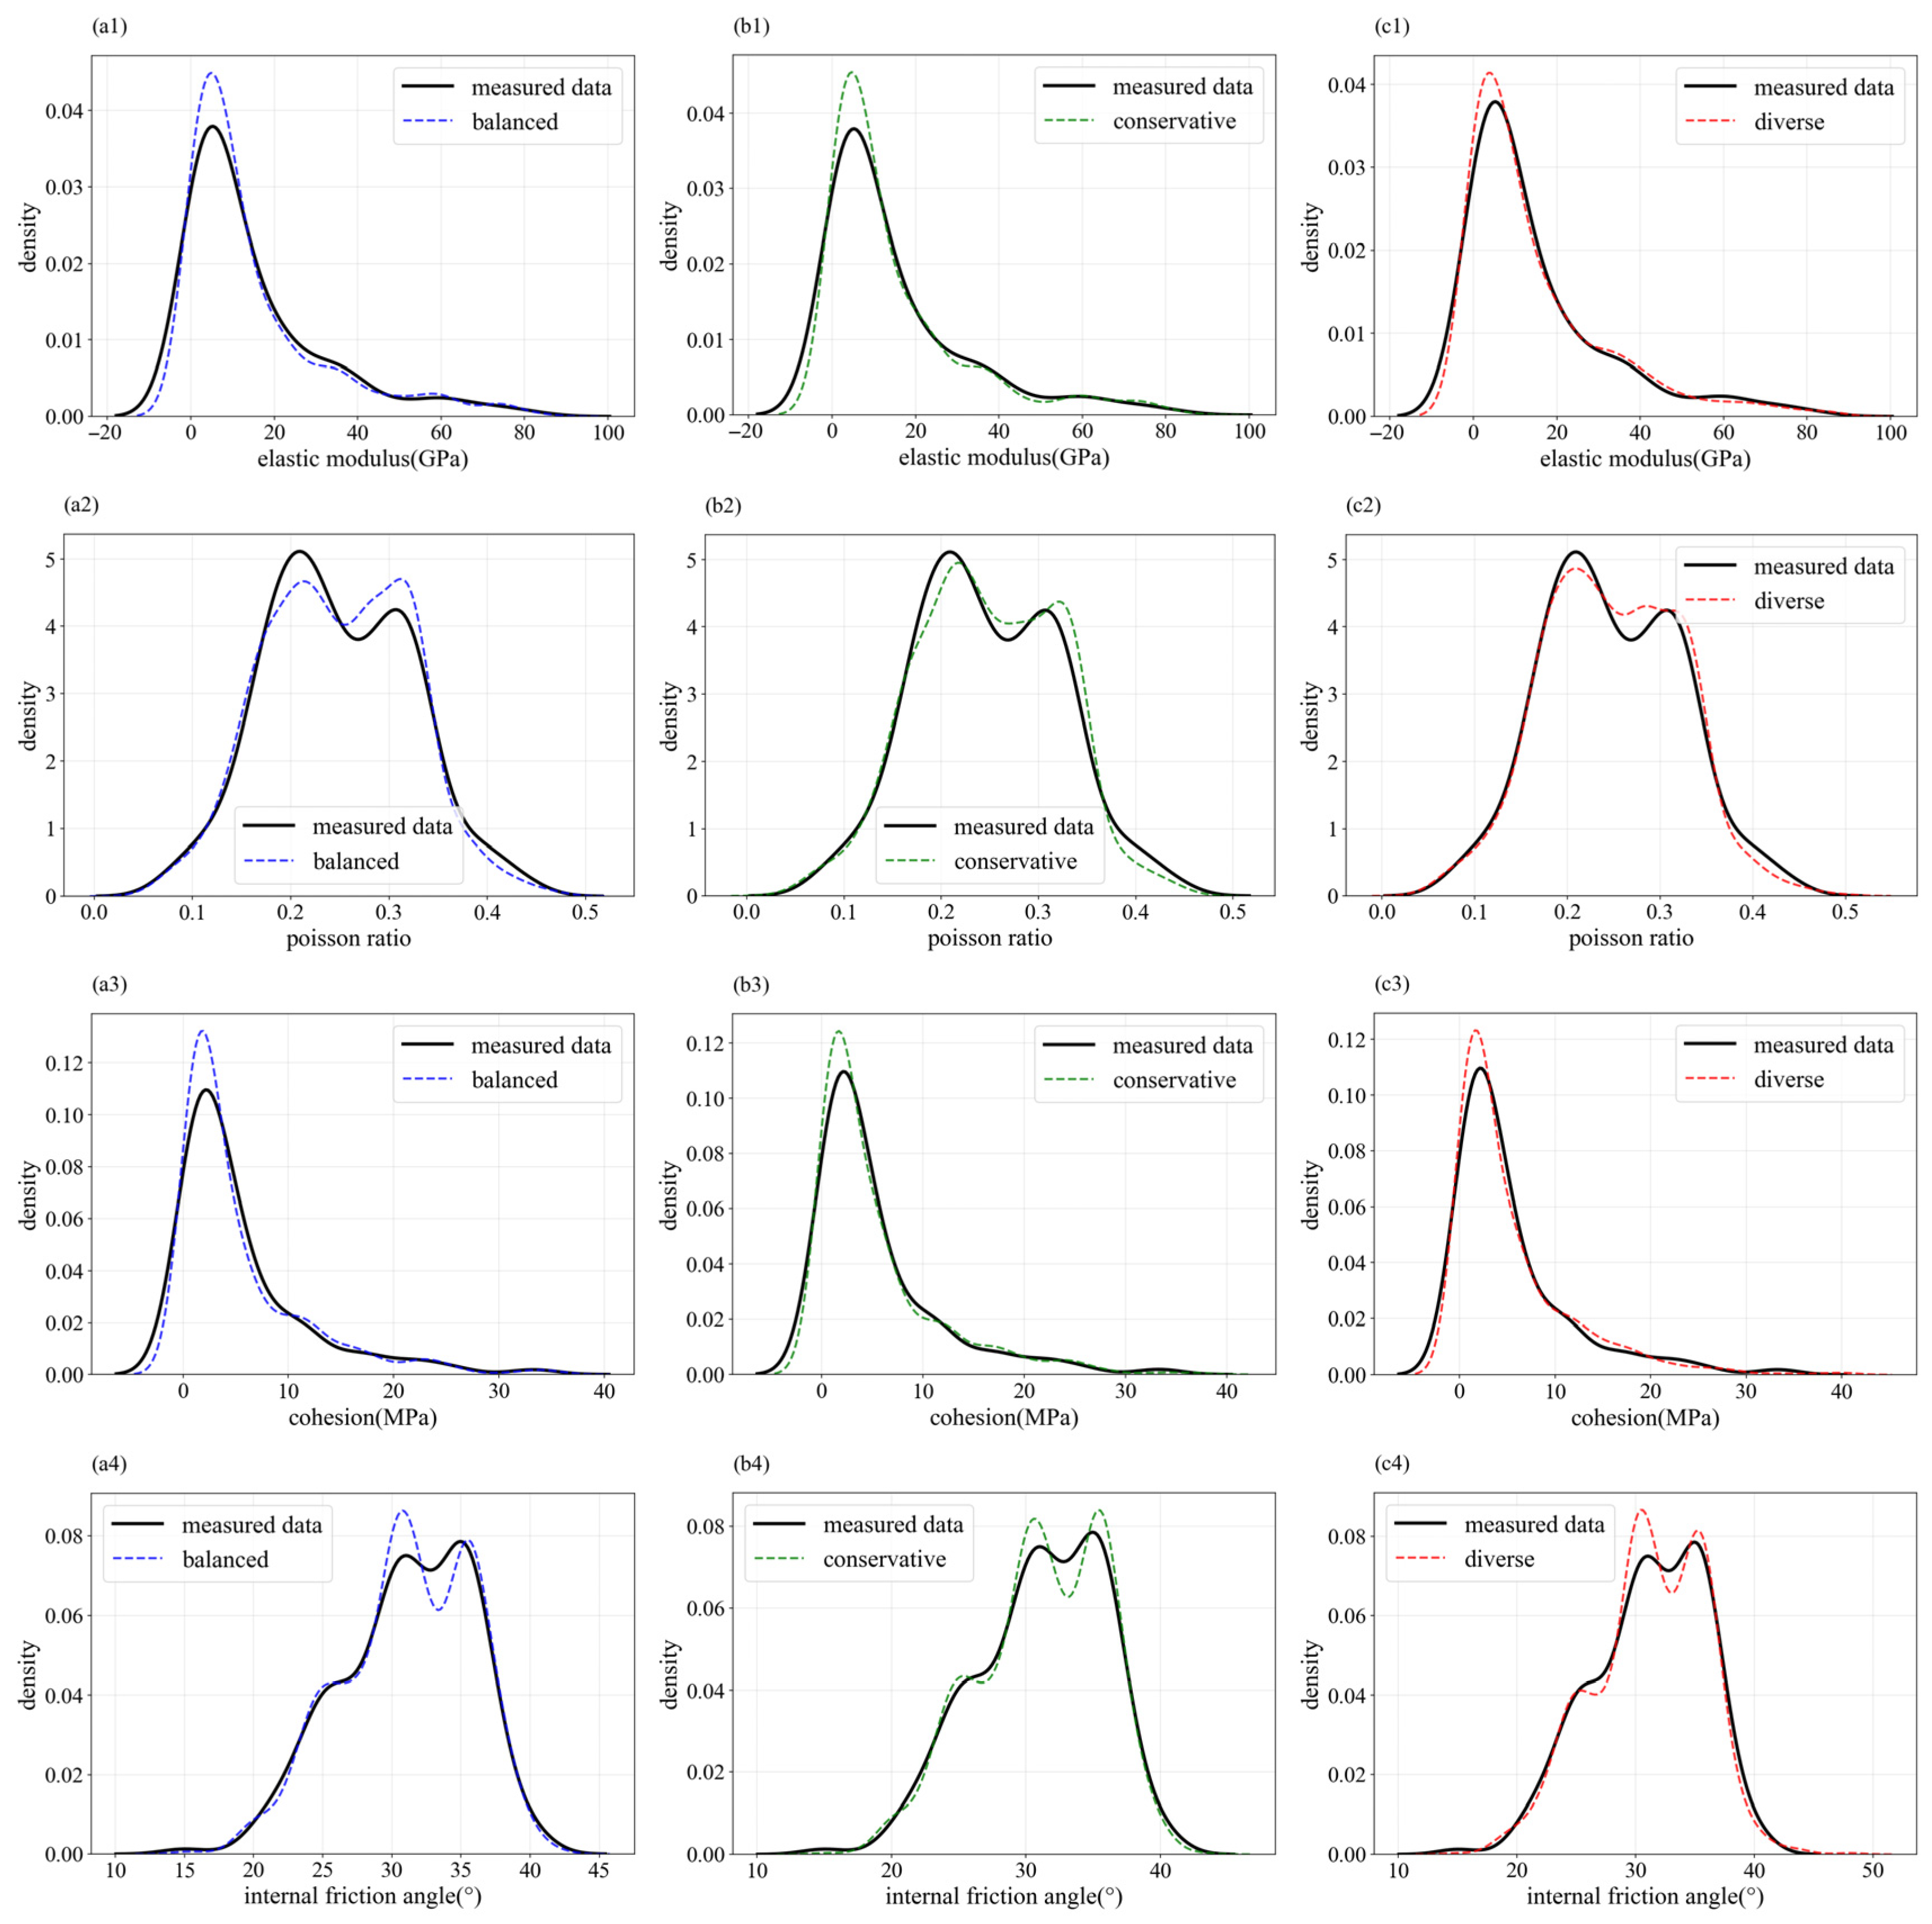
Figure 9 illustrates the fitting results of the three HAMDA programs for the density functions of the four augmented mechanical parameters. Overall, all three programs demonstrate relatively well-fitting results for the elastic modulus density, though some discrepancies exist at the density peaks. Among them, the HAMDA_diverse program exhibits the smallest deviation from the measured density peak, indicating the best enhancement effect. For Poisson’s ratio, similar deviations are observed at the peak. The HAMDA_balance program adopts an intermediate height between the two density peaks of the measured data, while the HAMDA_conservative program achieves the closest fit to the peak height of the density distribution, albeit with a certain peak offset. Although the density peak of the Poisson’s ratio under the HAMDA_diverse program shows no offset, it exhibits a height discrepancy similar to that of the HAMDA_balance program. In the cohesion augmentation samples, the enhancement effects of the three programs are similar to those of the elastic modulus, with all density peaks being relatively large. However, the deviations between the HAMDA_conservative and HAMDA_diverse programs are comparable, both being smaller than that of the HAMDA_balance program. For the internal friction angle augmentation programs, the HAMDA_balance and HAMDA_diverse programs yielded similar density fitting results. However, the difference between the valley values between the two density peaks of the HAMDA_balance program and the measured curve is greater than that of the HAMDA_diverse program. Meanwhile, both the two density peaks and the valley values of the HAMDA_conservative program exhibit certain differences from the measured curve.
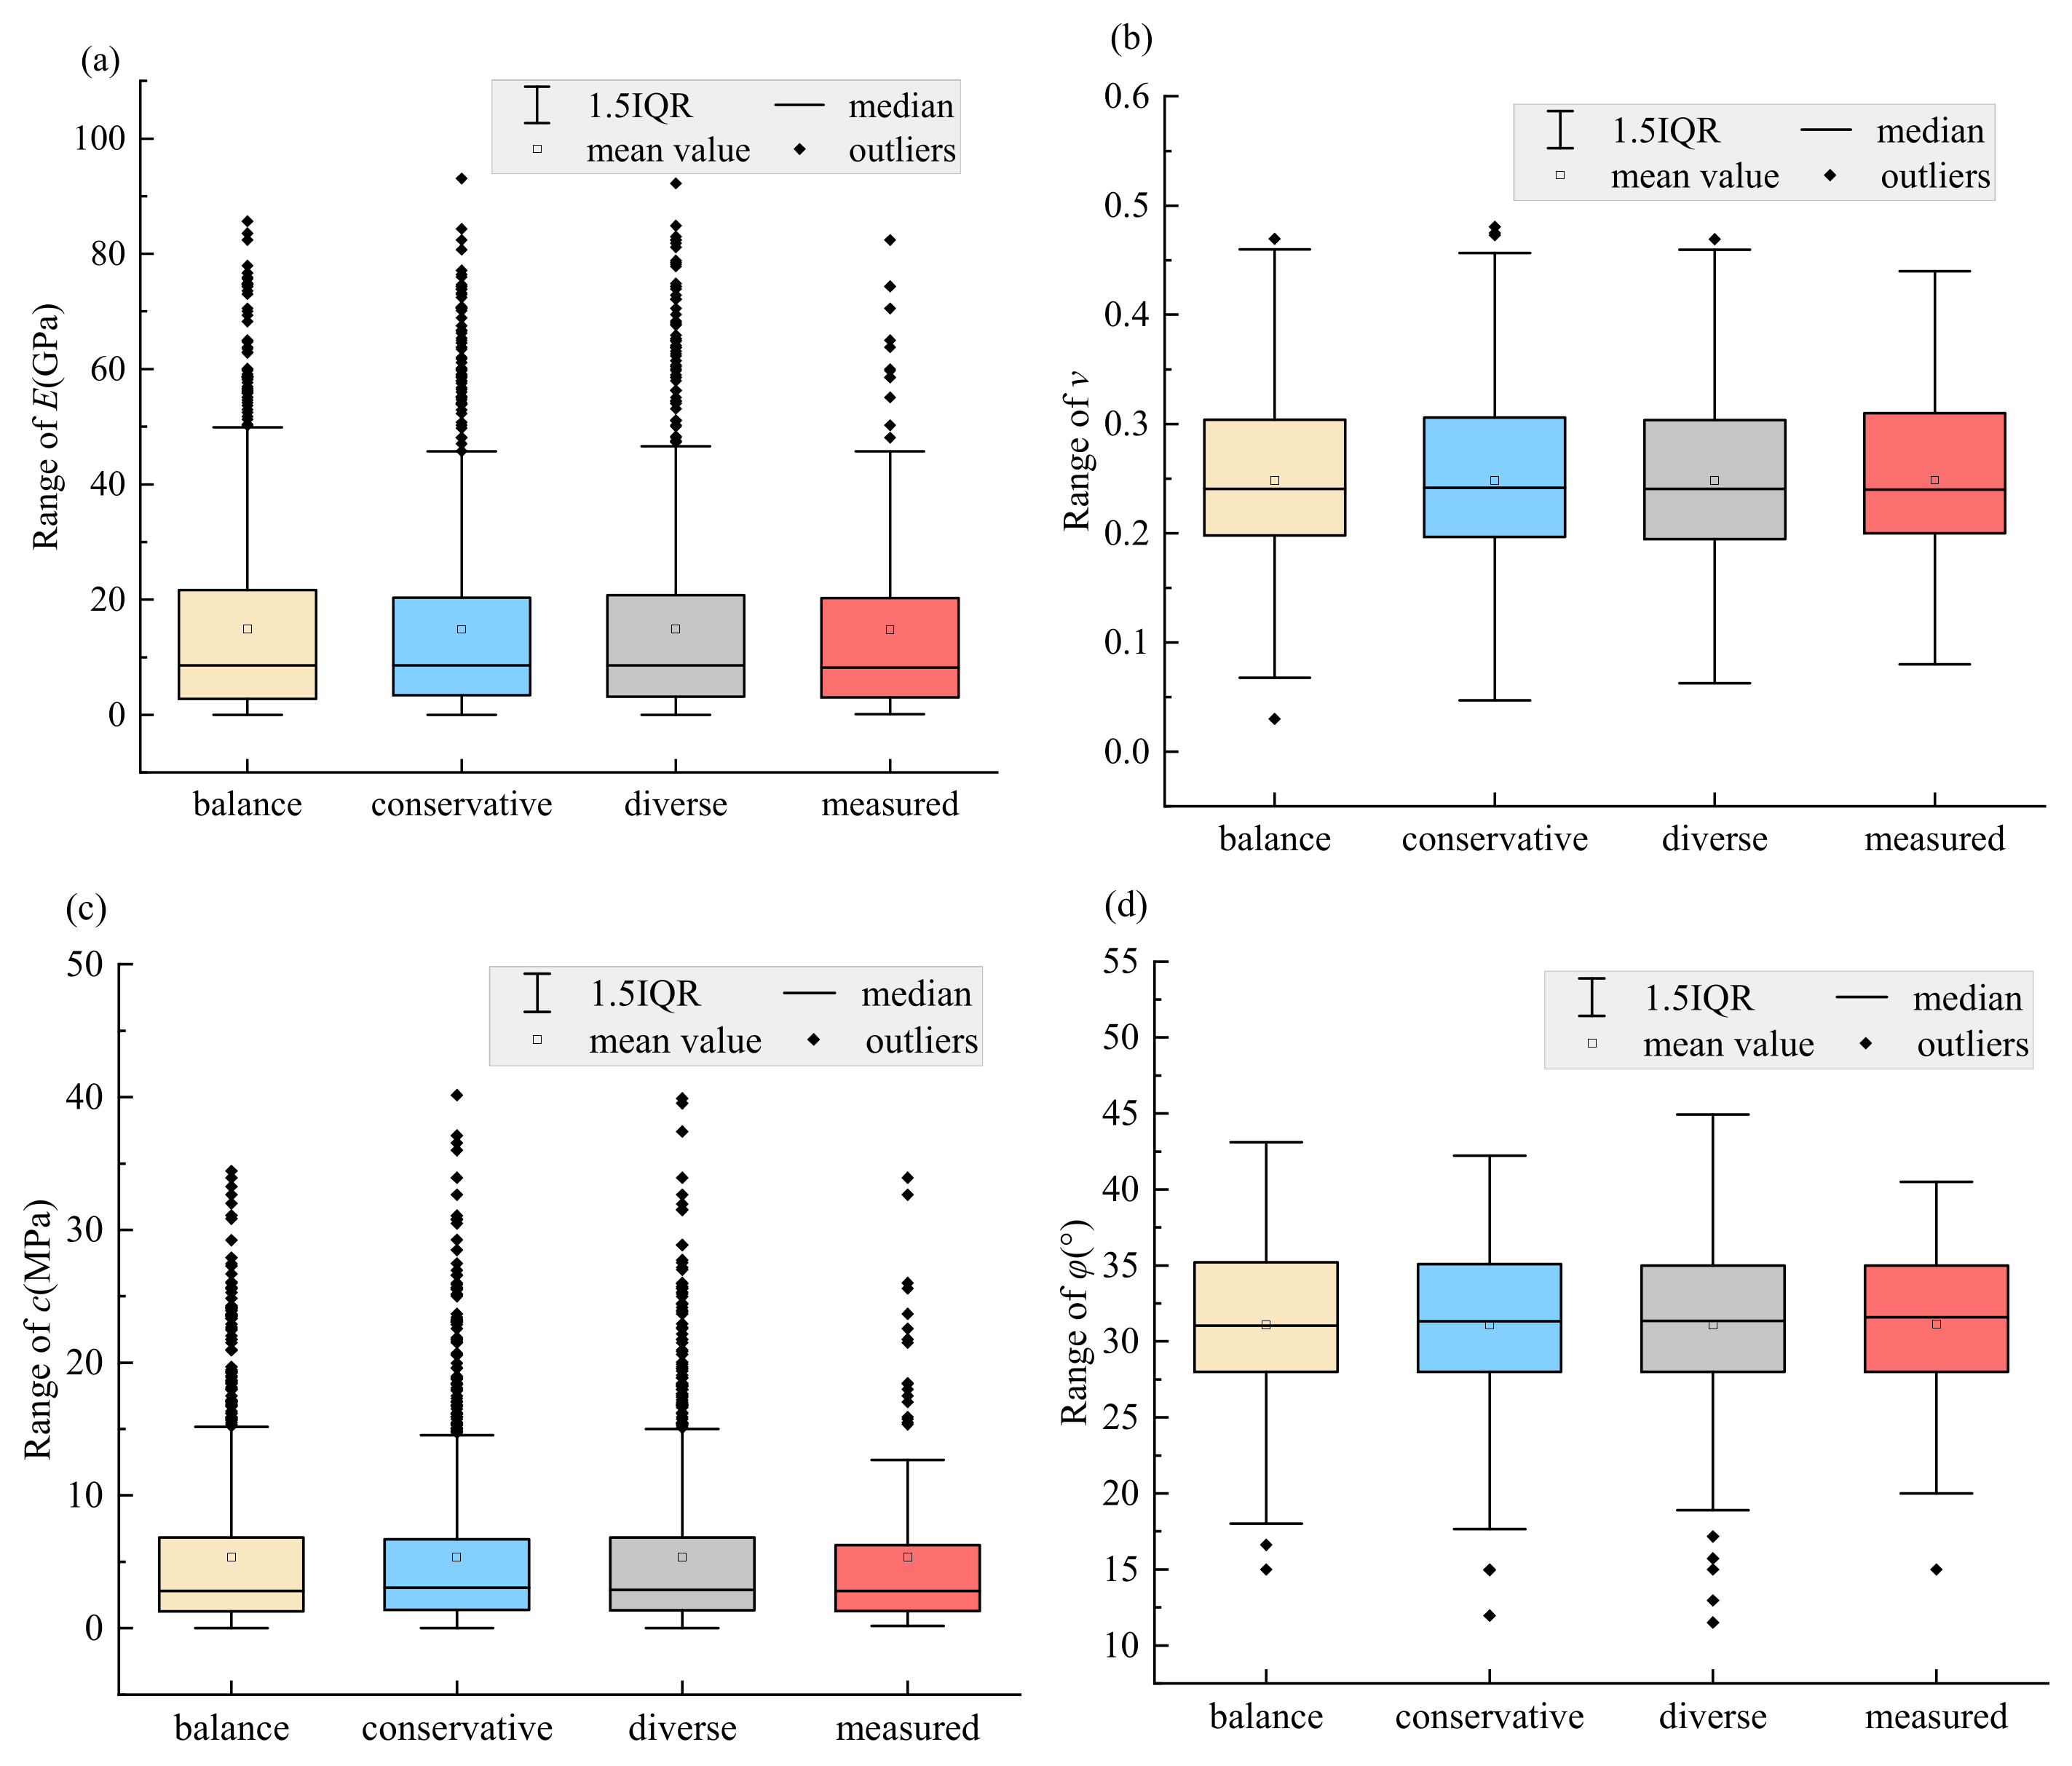
Figure 10 presents box plots of four mechanical parameters under three HAMDA programs for the augmented sample, with the red boxes representing the measured data. The overall box plots of the four mechanical parameters under HAMDA closely resemble those of the measured sample, validating the rationality and effectiveness of the HAMDA program for augmenting small sample data on roof soil structure. Regarding the statistical results for elastic modulus, due to the presence of numerous outliers in the original measured data, the HAMDA-augmented samples also exhibit widespread distribution of outliers. Based on the 1.5IQR results, the statistical outcomes of the HAMDA_conservative and HAMDA_diverse schemes align more closely with the measured samples. Furthermore, the box plot statistics for cohesion closely resemble those for elastic modulus, with both augmented and measured samples exhibiting numerous outliers. This is due to the high variability and dispersion inherent in the mechanical parameters collected in this study. In the boxplot statistical results for Poisson ratios and internal friction angles, the statistical outcomes from HAMDA closely align with the measured boxplots. For Poisson ratios, the 1.5IQR results from the HAMDA_balance and HAMDA_diverse programs are closer to the measured samples, indicating that these two programs provide more reasonable ranges for supplemental data distribution under this mechanical parameter. In the boxplots for the internal friction angle, the 1.5IQR results from the HAMDA_balance and HAMDA_conservative programs are closer to the measured samples. However, the mean distribution results from the HAMDA_conservative program are more accurate.
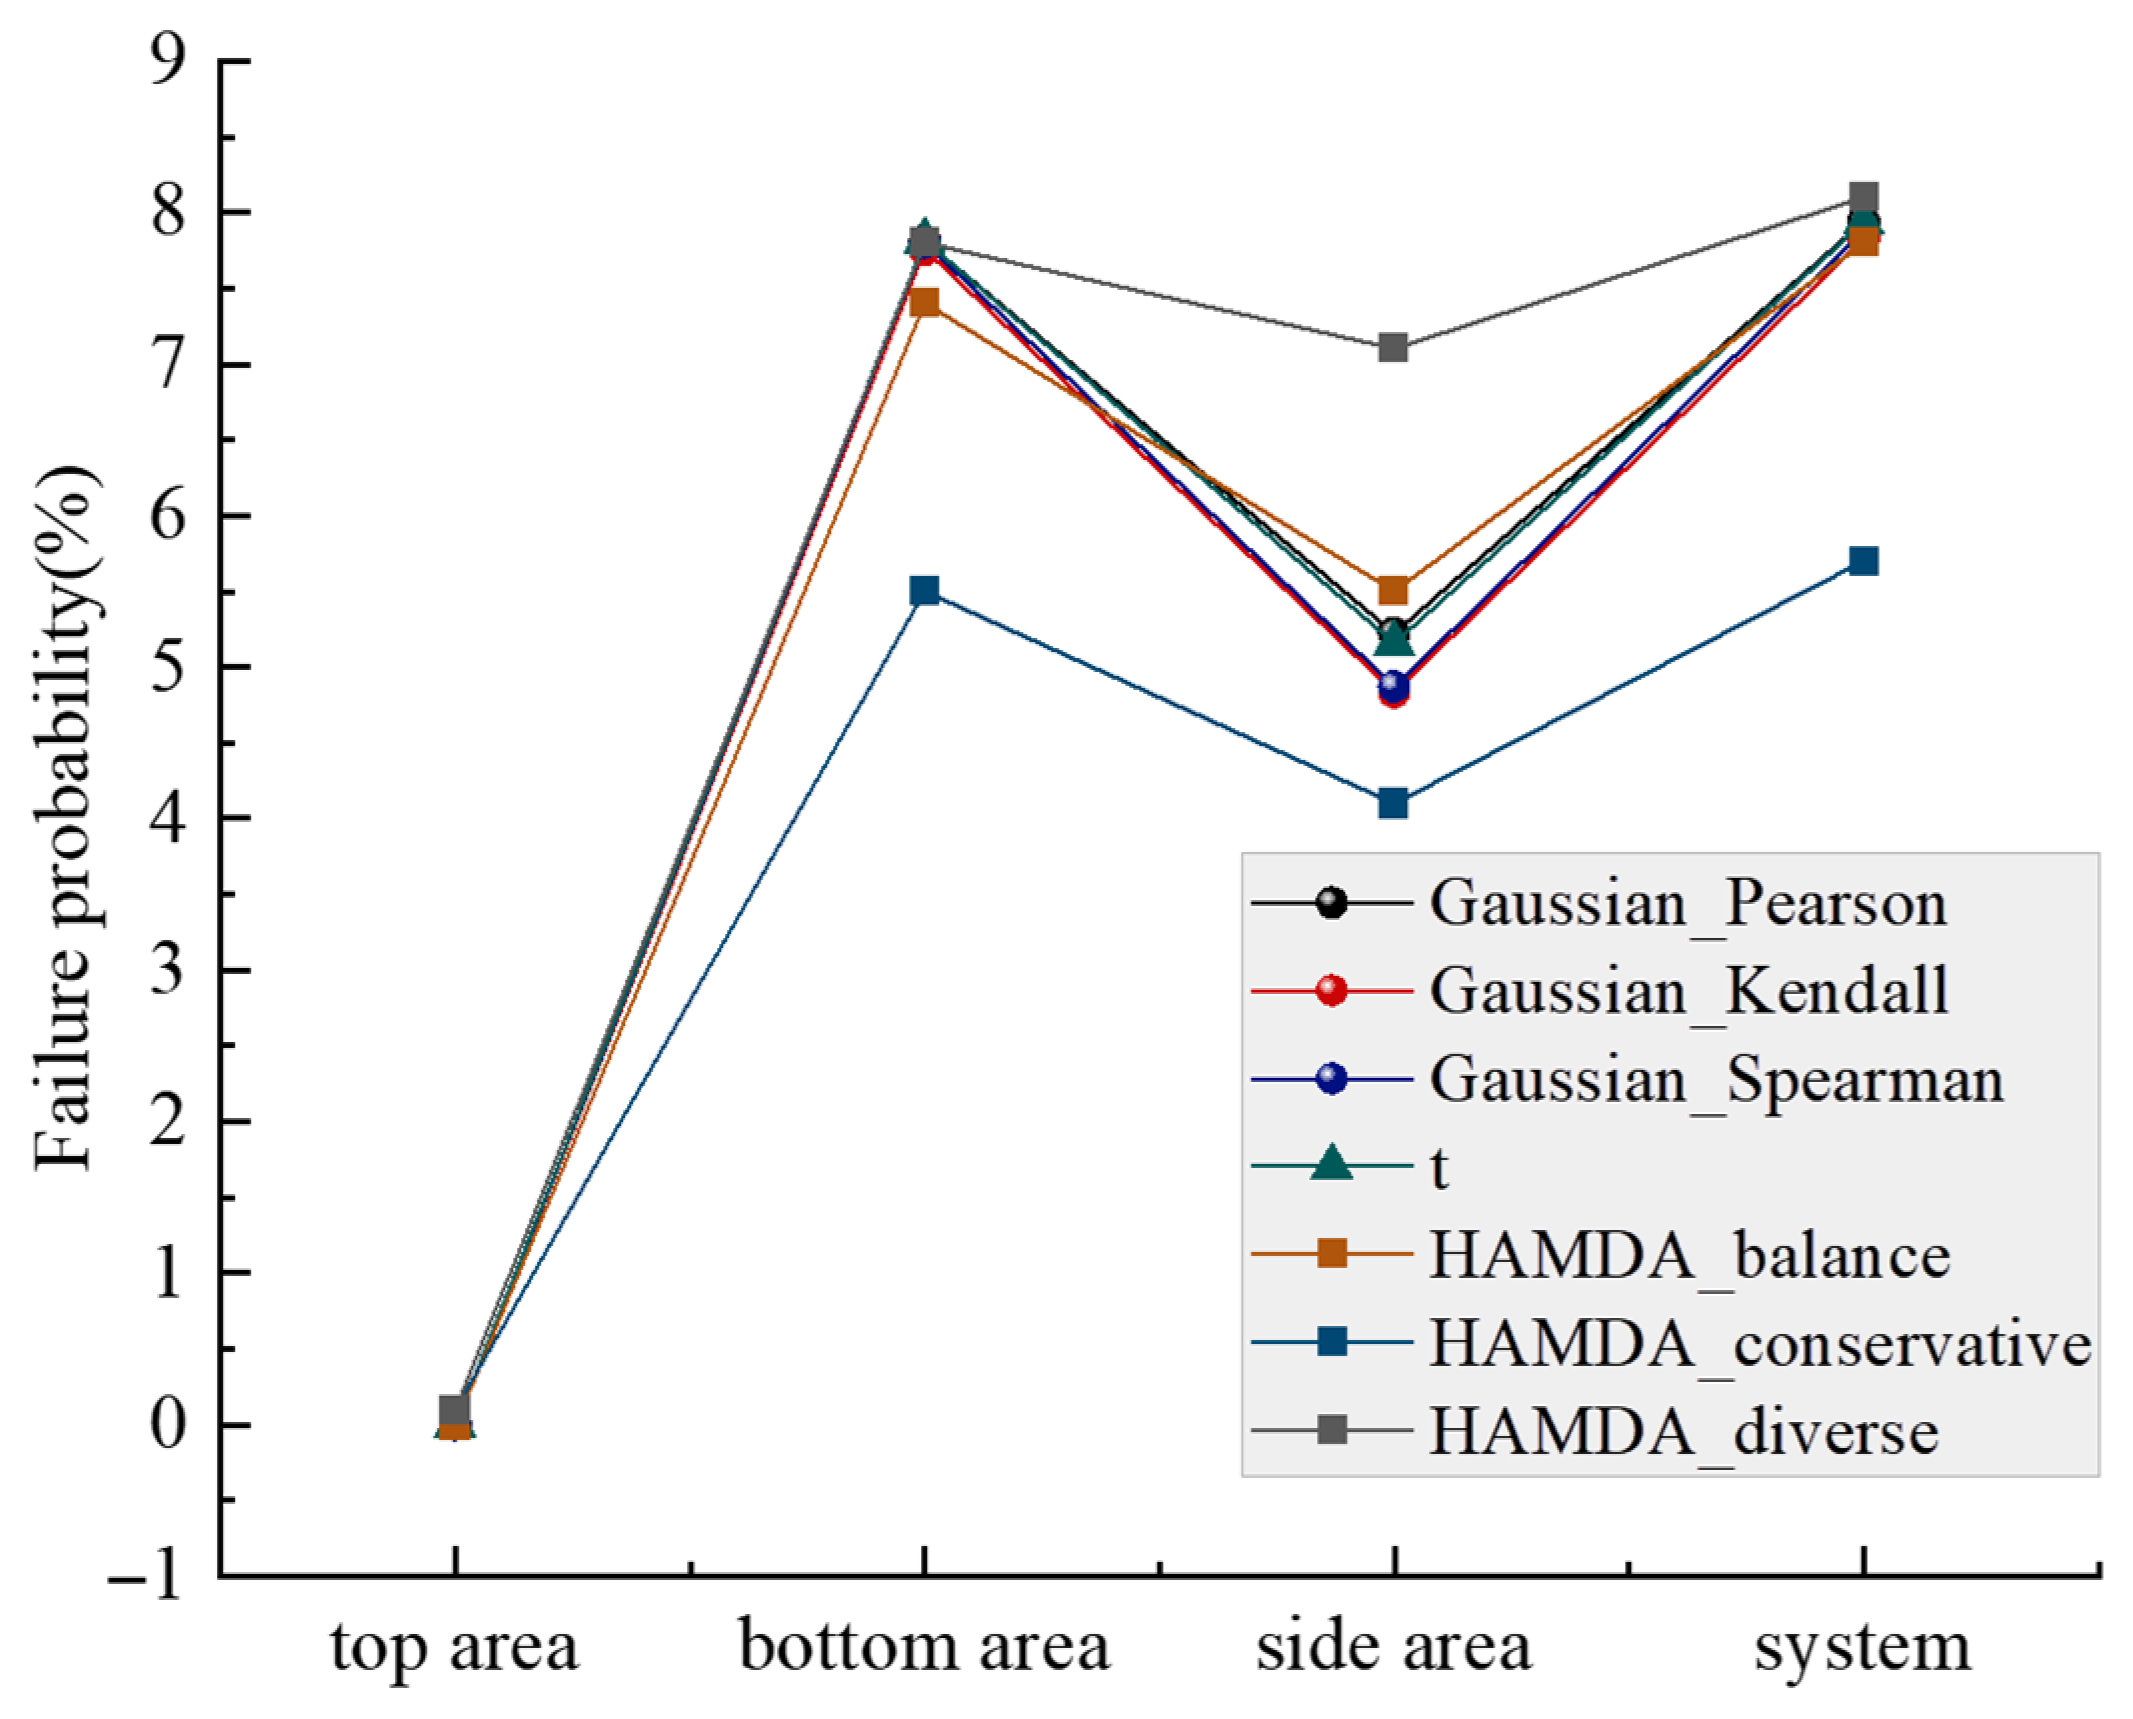
Based on the peak expression for the roof determination value region in Equation (1), substituting the three HAMDA-augmented samples into the discriminant equation yields failure probability results for different locations within the roof soil structure under various HAMDA programs. These results are compared with the failure probability outcomes from the multidimensional Gaussian Copula model in the previous section, as shown in Figure 11. Similar to the multidimensional Gaussian Copula model, pf at the top area under all programs approaches zero, confirming the relative safety of the roof soil structure at this location. However, in the bottom area of the roof, only the HAMDA_diverse program yielded failure probability results comparable to those from the multidimensional elliptical copula model. pf calculated for the bottom area using the HAMDA_conservative program is significantly lower than the results from other programs. This phenomenon is evident in both the side area and the overall failure probability calculations. This indicates that the augmented samples obtained using the HAMDA_conservative program significantly underestimate the failure probability of the roof soil structure, creating potential hazards in the stability design of the roof. In the side area, the failure probability results from the HAMDA_diverse program are markedly higher than those from the multidimensional elliptical Copula model, leading to overly conservative stability designs for the side area. Overall, the HAMDA_balance program and the multidimensional Gaussian Copula model provide more similar representations of the small sample data for the roof soil structure.
In practical engineering, different elliptical copula models and HAMDA methods can be applied to roof stability studies under varying requirements. For instance, the Pearson method under multidimensional Gaussian copulas tends to underestimate failure probabilities, making it suitable for shallow, low-risk zones with favorable rock properties and conducive to cost savings. The Kendall method is more sensitive to variations in failure probabilities in the side areas of the roof, rendering it more appropriate for stability assessments in these side regions. The Spearman method offers high stability and is suitable for environments with highly variable mechanical parameters. The multidimensional t-Copula model balances accuracy with conservatism, making it appropriate for the preliminary stages of roof support design. For detailed risk assessments and support design formulas requiring roof stability analysis, different risk scenarios within HAMDA can be selected based on the practical roof conditions.

4. Discussion

This study established a multidimensional elliptical copula model based on existing domestic coal mine roof small-sample data and proposed three HAMDA approaches with distinct weighting schemes. Systematic reliability assessments were conducted for different roof locations through MCS. Results indicate that multidimensional elliptical Copulas and HAMDA effectively mitigate limitations of small samples while evaluating coal mine roof soil stability. However, the authors acknowledge current limitations. For instance, roof data sources are diverse, with varying geological conditions and mine specifications across coal mines. The obtained roof mechanical parameters exhibit significant variability (as evidenced by COV > 1 for parts of the mechanical parameters in Table 4), resulting in greater uncertainty in the conclusions drawn from this analysis. Furthermore, while the study employs multidimensional elliptical copulas to model the correlation structure of multidimensional geotechnical parameters, it is noted that copula functions are numerous, and the multidimensional elliptical copula is not necessarily the optimal model. Determining how to obtain the optimal multidimensional copula model represents a worthwhile research topic for future work. Third, while the proposed data augmentation scheme can generally simulate data with original feature distributions, its fitting capability for peaks is relatively poor in the results shown in Figure 9. Numerous outliers remain visible in Figure 10. Furthermore, the three HAMDA schemes introduced in this paper still employ relatively fixed weight allocations across different data augmentation methods. Exploring how to achieve adaptive adjustments through dynamic weight allocation remains a worthwhile research direction. Future research could utilize long-term monitoring data, such as roof displacement and stress variations to validate the consistency between failure probabilities and practical stability [45]. Nevertheless, this work effectively simulates the structural characteristics of multidimensional coal mine roof mechanical parameters with high variability, providing a reasonable foundation for stability analysis of coal mine roof geotechnical structures under small sample conditions.

5. Summary and Conclusions

In this study, based on statistically obtained measured data from 192 sets of coal mine roof in China, three multidimensional Gaussian Copula models and multidimensional t Copula models were constructed under different correlation coefficients, building upon the reliability analysis model for coal mine roof soil structures. The correlation structures of multidimensional mechanical parameters under multidimensional elliptical Copulas were simulated, and reliability analyses were conducted for different locations within the coal mine roof soil structure. Three HAMDA programs with different weights were proposed to conduct stability analysis of roof soil structures using augmented data. The main conclusions are as follows:
(1)
Multidimensional elliptical Copulas can effectively simulate the correlation structure of multidimensional coal mine roof mechanical parameters with high variability, offering the advantages of convenience and efficiency. Their simulation results accurately reflect the variation patterns of failure probability across different locations within the coal mine roof soil structure, providing valuable guidance for engineering practice.
(2)
Under the roof soil stability model developed in this study, roof system instability typically occurs with failure at the bottom of the roof. Concurrently, there is a 60% probability of instability in the side area, while the top area of roof remains in a relatively safe position. This requires attention in stability structural design.
(3)
Using the integration of multiple data augmentation methods effectively combines the advantages of each approach. The three proposed HAMDA programs can effectively enhance data limitations arising from small sample conditions in coal mine roof soil structures. The density distributions fitted by the expanded mechanical parameter samples and the box plot statistical results are both very close to the measured samples.
(4)
The failure probability of roof soil structure calculated by the HAMDA_conservative program is significantly lower than results from other programs, indicating potential risks in roof stability design. Conversely, in the side area of roof, the failure probability calculated by the HAMDA_diverse program is markedly higher than that from the multidimensional elliptical copula model, leading to overly conservative stability designs for these side regions.

Author Contributions

Conceptualization, J.C. and T.W.; methodology, J.C. and T.W.; software, J.C., T.W. and C.Z.; validation, J.C. and C.Z.; formal analysis, J.C. and Y.X.; investigation, J.C., T.W. and Y.X.; resources, T.W. and Y.X.; data curation, J.C. and T.W.; writing—original draft preparation, J.C. and T.W.; writing—review and editing, J.C. and T.W.; visualization, J.C. and Y.X.; supervision, J.C. and C.Z.; project administration, T.W. and Y.X.; funding acquisition, T.W. All authors have read and agreed to the published version of the manuscript.

Funding

This research was Supported by the Opening Fund of State Key Laboratory of Mining Response and Disaster Prevention and Control in Deep Coal Mines (Grant No. SKLMRDPC22KF15), the State Key Laboratory of Hydraulic Engineering Intelligent Construction and Operation, Tianjin University (Grant No. HESS-2523), the National Natural Science Foundation of China (Grant No. 42371133). The authors wish to thank four anonymous reviewers and editor for their comments and advice.

Institutional Review Board Statement

Not applicable.

Informed Consent Statement

Not applicable.

Data Availability Statement

The data presented in this study are available on request from the corresponding author.

Conflicts of Interest

The authors declare no conflicts of interest.

References

  1. Xu, G.; Lai, X.; Shan, P.; Liu, J.; Xu, H.; Wang, H. Stability analysis of the false roof made of cemented tailings backfill in deep mine: A case study. ASE Stud. Constr. Mater. 2024, 21, e04046. [Google Scholar] [CrossRef]
  2. Wu, Y.; Tang, Y.; Xie, P.; Hu, B.; Lang, D.; Wang, H. Stability analysis of ‘roof-coal pillar’ structure in longwall multi-section mining of steeply dipping coal seam. Geomat. Nat. Hazards Risk 2024, 15, 2359998. [Google Scholar] [CrossRef]
  3. Cao, Z.; Zhang, S.; Xue, Y.; Wang, Z.; Du, F.; Li, Z.; Huang, C.; Wang, S.; Yu, Y.; Wang, W.; et al. Disaster-Causing Mechanism of Spalling Rock Burst Based on Folding Catastrophe Model in Coal Mine. Rock Mech. Rock Eng. 2025, 58, 7591–7604. [Google Scholar] [CrossRef]
  4. Cao, Z.; Xiong, Y.; Xue, Y.; Du, F.; Li, Z.; Huang, C.; Wang, S.; Yu, Y.; Wang, W.; Zhai, M.; et al. Diffusion Evolution Rules of Grouting Slurry in Mining-induced Cracks in Overlying Strata. Rock Mech. Rock Eng. 2025, 58, 6493–6512. [Google Scholar] [CrossRef]
  5. Li, X.; Huan, H.; Lin, H.; Li, Z.; Du, F.; Cao, Z.; Fan, X.; Ren, H. Determination method of rational position for working face entries in coordinated mining of section coal pillars and lower sub-layer. Sci. Rep. 2025, 15, 29440. [Google Scholar] [CrossRef]
  6. Li, X.; Ren, Z.; Cao, Z.; Ren, H. Study on coal drawing parameters of deeply buried hard coal seams based on PFC. Sci. Rep. 2025, 15, 21934. [Google Scholar] [CrossRef]
  7. Sun, C.; Shi, C.; Zhu, Z.; Lin, Z.; Li, Z.; Du, F.; Cao, Z.; Lu, P.; Liu, L. Overburden failure characteristics and fracture evolution rule under repeated mining with multiple key strata control. Sci. Rep. 2025, 15, 28029. [Google Scholar] [CrossRef] [PubMed]
  8. Wang, T.; Liu, Y.; Wang, J.; Wang, D. Assessment of spatial variability of hydraulic conductivity of seasonally frozen ground in Northeast China. Eng. Geol. 2020, 274, 105741. [Google Scholar] [CrossRef]
  9. Wang, T.; Cao, J.; Liu, J.; Xu, J.; Zhou, G. Characterizing anisotropic spatial variations of uncertain mechanical parameters for clay layer using incomplete probability data. Probabilistic Eng. Mech. 2024, 76, 103623. [Google Scholar] [CrossRef]
  10. Liu, D.; Lyu, M. Capturing the random mechanical behavior of granular materials: A comprehensive stochastic discrete element method study. Géotechnique 2025, 75, 899–912. [Google Scholar] [CrossRef]
  11. Cao, W.; Zhou, A.; Shen, S. Stability of unsaturated soil slope considering stratigraphic uncertainty and rotated anisotropy of soil properties. Int. J. Numer. Anal. Methods Geomech. 2023, 48, 359–376. [Google Scholar] [CrossRef]
  12. Jia, D.; Wu, Z. Seismic risk analysis based on imprecise distribution and failure probability function under multidimensional limit state. Structures 2023, 50, 963–977. [Google Scholar] [CrossRef]
  13. Yin, J.; Xiao, C.; Han, H.; Ding, L.; Cui, X.; Dan, H. Effect of Moisture Content on the Evaluation of Subgrade Compaction Quality using Intelligent Compaction Measurement Values. Transp. Geotech. 2025, 55, 101699. [Google Scholar] [CrossRef]
  14. Tang, X.; Li, D.; Rong, G.; Phoon, K.; Zhou, C. Impact of copula selection on geotechnical reliability under incomplete probability information. Comput. Geotech. 2013, 49, 264–278. [Google Scholar] [CrossRef]
  15. Cao, J.; Wang, T.; Zhou, G.; Feng, X.; Zhu, C. Parameter estimation of grouting pressure and surface subsidence on the reliability of shield tunnel excavation under incomplete probability information. Comput. Geotech. 2024, 173, 106530. [Google Scholar] [CrossRef]
  16. Teng, T.; Chen, Y.; Wang, S.; Jia, W.; Wang, Y.; Liu, K.; Li, Z. Water injection softening modeling of hard roof and application in Buertai coal mine. Environ. Earth Sci. 2025, 84, 54. [Google Scholar] [CrossRef]
  17. Li, H.; Wang, T.; Feng, Y.; Cao, J.; Song, Y.; Zhou, G.; Wan, W. Identification of joint probability distribution for thermal parameters of warm frozen clay with incomplete probability information. Cold Reg. Sci. Technol. 2025, 238, 104543. [Google Scholar] [CrossRef]
  18. Cao, J.; Wang, T.; Fen, Y.; Wu, J.; Wang, Z.; Zhou, G. Correlation Characterization Method for Thermal Parameters of Frozen Soil Under Incomplete Probability Information. Int. J. Numer. Anal. Methods Geomech. 2025, 49, 2003–2024. [Google Scholar] [CrossRef]
  19. Chen, Q.; Zou, B.; Tao, Z.; He, M.; Hu, B. Construction and Application of an Intelligent Roof Stability Evaluation System for the Roof-Cutting Non-Pillar Mining Method. Sustainability 2023, 15, 2670. [Google Scholar] [CrossRef]
  20. Sherizadeh, T.; Pinnaduwa, H.S.W.K. Assessment of roof stability in a room and pillar coal mine in the U.S. using three-dimensional distinct element method. Tunn. Undergr. Space Technol. 2016, 59, 24–37. [Google Scholar] [CrossRef]
  21. Wang, Y.; Wu, G.; Kong, D.; Zhang, Q. Study on the destabilization and deformation breakage characteristics of the mine roof under repetitive mining of close coal seam group. Comput. Part. Mech. 2024, 11, 1503–1516. [Google Scholar] [CrossRef]
  22. Wang, J.; Zhang, Z.; Wang, Y.; Qin, C.; Chen, X.; Zhang, Y.; Hu, Z. How to solve small sample size problems in time-series soil organic carbon mapping: New insights from the Third Law of Geography. Geoderma 2025, 460, 117402. [Google Scholar] [CrossRef]
  23. Diamantopoulou, E.; Pavlides, A.; Steiakakis, E.; Varouchakis, A. Geostatistical Analysis of Groundwater Data in a Mining Area in Greece. Hydrology 2024, 11, 102. [Google Scholar] [CrossRef]
  24. Zhang, L.; Li, D.; Tang, X.; Cao, Z.; Phoon, K. Bayesian model comparison and characterization of bivariate distribution for shear strength parameters of soil. Comput. Geotech. 2018, 95, 110–118. [Google Scholar] [CrossRef]
  25. Nelson, R. An Introduction to Copulas; Springer: New York, NY, USA, 2006. [Google Scholar]
  26. Lü, T.; Tang, X.; Li, D.; Qi, X. Modeling multivariate distribution of multiple soil parameters using vine copula model. Comput. Geotech. 2020, 118, 103340. [Google Scholar] [CrossRef]
  27. Bao, X.; Li, J.; Shen, J.; Chen, X.; Zhang, C.; Cui, H. Comprehensive multivariate joint distribution model for marine soft soil based on the vine copula. Comput. Geotech. 2025, 177, 106814. [Google Scholar] [CrossRef]
  28. Agarwal, E.; Pain, A. Efficient Probabilistic Stability Analysis of Geosynthetic Reinforced Slopes Using Collocation-Based Stochastic Response Surface. Int. J. Geomech. 2021, 21, 04021189. [Google Scholar] [CrossRef]
  29. Cui, C.; Zhao, J.; Xu, M.; Xu, C.; Liu, H.; Wang, K. Multidimensional seismic fragility analysis of subway station structures using the adaptive bandwidth kernel density estimation and Copula function. Undergr. Space 2025, 22, 110–123. [Google Scholar] [CrossRef]
  30. Jia, D.; Wu, Z. Structural reliability analysis under stochastic seismic excitations and multidimensional limit state based on gamma mixture model and copula function. Probabilistic Eng. Mech. 2024, 76, 103621. [Google Scholar] [CrossRef]
  31. Ahmad, H.M.; Morle, D.; Rahimi, A. LayerMix: Enhanced Data Augmentation for Robust Deep Learning. Pattern Recognit. 2026, 172, 112332. [Google Scholar] [CrossRef]
  32. Won, S.; Bae, S.H.; Kin, S.T. Effects of mixed sample data augmentation on interpretability of neural networks. Neural Netw. Off. J. Int. Neural Netw. Soc. 2025, 190, 107611. [Google Scholar] [CrossRef]
  33. Wang, A.; Li, R.; Feng, X.; Li, Z.; Hong, W.; Wu, H.; Wang, D.; Chen, S. The research on enhancing LA estimation accuracy across domains for small sample data based on data augmentation and data transfer integration optimization system. Smart Agric. Technol. 2025, 12, 101148. [Google Scholar] [CrossRef]
  34. Cao, C.; Zhou, F.; Dai, Y.; Wang, J. A survey of mix-based data augmentation: Taxonomy, methods, applications, and explainability. ACM Comput. Surv. 2025, 57, 1–38. [Google Scholar] [CrossRef]
  35. Yang, L.; Li, X.; Zhao, B.; Song, R.; Yang, J. Recursivemix: Mixed learning with history. In Proceedings of the Advances in Neural Information Processing Systems 35 (NeurIPS), New Orleans, LA, USA, 28 November–9 December 2022. [Google Scholar]
  36. Uddin, A.; Monira, M.; Shin, W.; Chung, T.; Bae, S. Saliencymix: A saliency guided data augmentation strategy for better regularization. In Proceedings of the International Conference on Learning Representations, Virtual Event, 3–7 May 2021. [Google Scholar] [CrossRef]
  37. Fang, Y.; Zhang, X.; Cheng, H.; Zang, X.; Li, C.; Zhao, J. An effective framework with hybrid augmentation for visual reinforcement learning generalization. Neurocomputing 2025, 657, 131602. [Google Scholar] [CrossRef]
  38. Quan, Y.; Liu, C.; Yuan, Z.; Yan, B. Hybrid Data Augmentation Combining Screening-Based MCGAN and Manual Transformation for Few-Shot Tool Wear State Recognition. IEEE Sens. J. 2024, 24, 12186–12196. [Google Scholar] [CrossRef]
  39. Cao, J.; Wang, T.; Huang, Y.; Zhu, B.; Li, R.; Zhou, G. Novel evaluation methodology for mechanical behaviour and instability risk of roof structure using limited investigation data. Georisk Assess. Manag. Risk Eng. Syst. Geohazards 2024, 18, 668–686. [Google Scholar] [CrossRef]
  40. Qiu, F.; Yang, F.; Xiong, Y.; Chen, T.; Xiao, P.; Zheng, W.; Chen, X.; Zhou, K. VS-SMOTE: Leveraging high-value spaces to balance noise control and data diversity for class imbalanced learning. Neurocomputing 2025, 654, 131321. [Google Scholar] [CrossRef]
  41. Hu, T.; Zhang, H.; Khodadadi, N.; Taffese, W.Z.; Nanni, A. Enhancing bond strength prediction at UHPC-NC interface: A data-driven approach with augmentation and explainability. Constr. Build. Mater. 2024, 451, 138757. [Google Scholar] [CrossRef]
  42. Aarthi, D.; Panimalar, A.; Santhosh, K.S.; Anitha, K. Development of Adaptive Gaussian Filter Based Denoising as an Image Enhancement Technique. Math. Model. Eng. Probl. 2024, 11, 2715–2725. [Google Scholar] [CrossRef]
  43. Maatouk, K.; Rullière, D.; Bay, X. Sampling large hyperplane-truncated multivariate normal distributions. Comput. Stat. 2023, 39, 1779–1806. [Google Scholar] [CrossRef]
  44. Akaike, H. A new look at the statistic model identification. IEEE Trans. Autom. Control 1974, 19, 716–723. [Google Scholar] [CrossRef]
  45. Piao, C.; Yin, Y.; He, Z.; Du, W.; Wei, G. Research on transparency of coal mine geological conditions based on distributed fiber-optic sensing technology. Deep Undergr. Sci. Eng. 2024, 4, 255–263. [Google Scholar] [CrossRef]
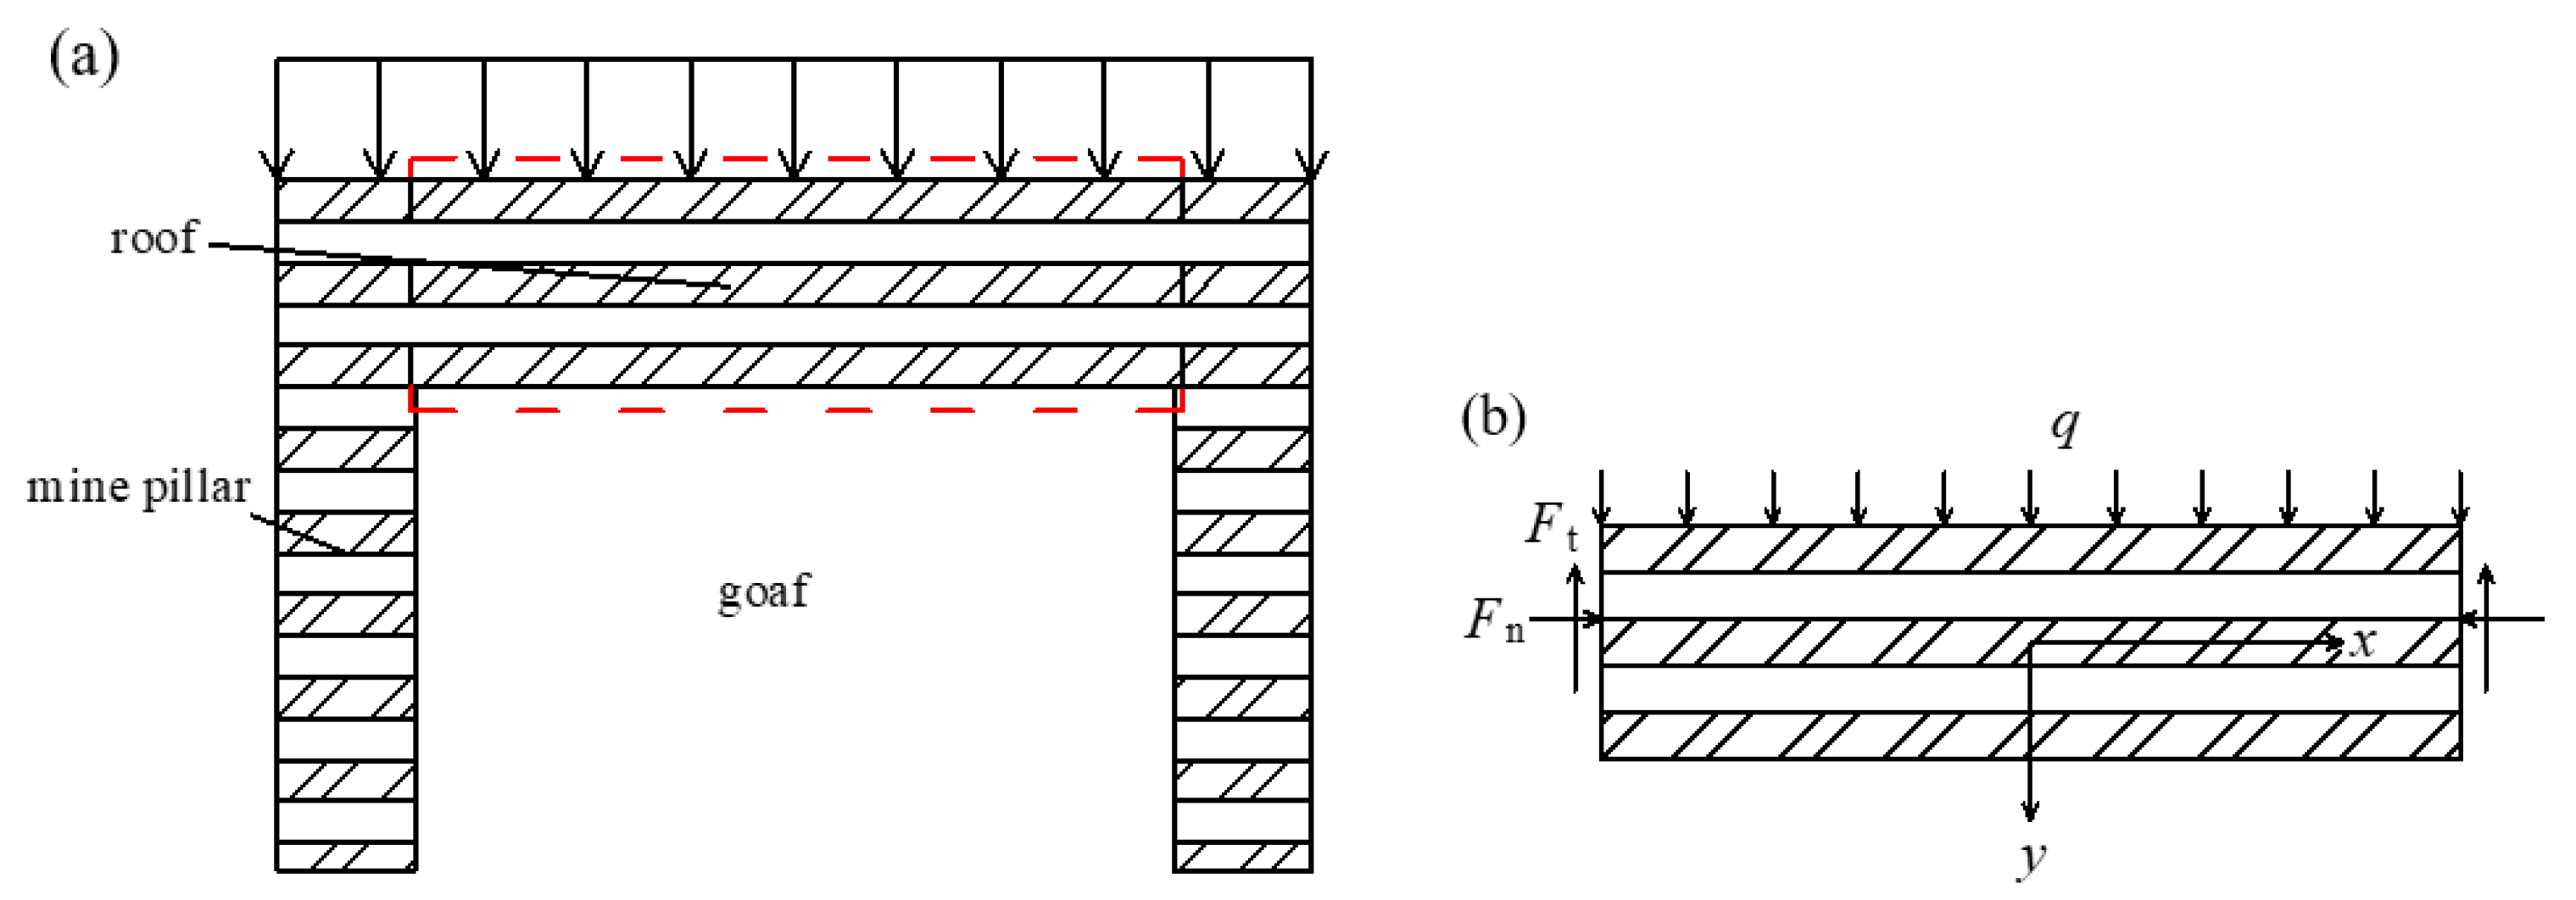
Figure 1. Roof stress diagram. (a) simplified diagram of the roof in the unit goaf; (b) the detailed stress diagram within the red dotted frame in (a).
Sustainability 17 10028 g001
Figure 2. Flowchart for reliability analysis of uncertainty parameters in coal mine roof mechanics.
Sustainability 17 10028 g002
Figure 3. Experimental Two-Dimensional Histogram Distribution of Mechanical Parameters. (a) Eν; (b) Ec; (c) Eφ; (d) νc; (e) νφ; (f) cφ.
Sustainability 17 10028 g003
Figure 4. Empirical Distribution Plot of Positive and Negative Correlation Structures. (a) Ec; (b) cφ.
Sustainability 17 10028 g004
Figure 5. Comparison of simulated and measured Ec values under different construction methods. (a) Pearson method of Gaussian Copula; (b) Kendall method of Gaussian Copula; (c) Spearman method of Gaussian Copula; (d) t Copula.
Sustainability 17 10028 g005
Figure 6. Comparison of simulated and measured cφ values under different construction methods. (a) Pearson method of Gaussian Copula; (b) Kendall method of Gaussian Copula; (c) Spearman method of Gaussian Copula; (d) t Copula.
Sustainability 17 10028 g006
Figure 7. Plots of failure probability at different roof locations under various construction methods with simulated rounds. (a) Pearson method of Gaussian Copula; (b) Kendall method of Gaussian Copula; (c) Spearman method of Gaussian Copula; (d) t Copula.
Sustainability 17 10028 g007aSustainability 17 10028 g007b
Figure 8. Plot of failure probability at different locations on the roof with the simulated rounds. (a) bottom area; (b) side area; (c) overall roof structure.
Sustainability 17 10028 g008
Figure 9. Fitting results of mechanical parameter density functions for different HAMDA programs. (a1) Balance of E; (b1) Conservative of E; (c1) Diverse of E; (a2) Balance of ν; (b2) Conservative of ν; (c2) Diverse of ν; (a3) Balance of c; (b3) Conservative of c; (c3) Diverse of c; (a4) Balance of φ; (b4) Conservative of φ; (c4) Diverse of φ.
Sustainability 17 10028 g009
Figure 10. Boxplots of augmented samples for mechanical parameters under the HAMDA programs. (a) E; (b) ν; (c) c; (d) φ.
Sustainability 17 10028 g010
Figure 11. Failure probability plot for different locations of the roof soil structure under the HAMDA programs and multidimensional copula models.
Sustainability 17 10028 g011
Table 1. Source information table of measured data [39].
Name of Coal MineRoof ConditionsNumber of Measured
Data Sets
Xiadian gold deposits, north Chinainclined thick-large orebody3
Xinpu phosphate deposit, Lianyungang Cityhard rock mass4
Yuanjiacun iron mine, ShanxiOverburden goaf under open pit boundary6
104 regiment coal mine, Xinjiangsteep coal seam mining area13
Heilong coal mine, Shanxiwater-sprinkling roof3
Qingdong coal mine, Anhuihard roof4
Cangshan iron mine, Shandonghard rock stratum roof3
Zhujiaba copper mine, Yunnanslightly inclined orebody5
a coal mine in southwest Chinacompound roof7
Shennanwa coal mine, Shanxicompound roof12
a coal mine in Guizhoucompound roof7
Shilawusu coal mine, Inner Mongolialarge section roadway roof9
Xiaotun coal mine, Guizhoucompound roof7
Panbei coal mine, Anhuiregenerative roof of large dip angle coal seam10
Huangyuchuan coal mine, Inner Mongolialayered roof8
Huainan Panji mining area, Anhuideep coal-bearing rock series17
Linsheng coal mine, Liaoninghard roof of steeply inclined coal seam4
Jingcheng coal mine, Shanxiwater-drenched surrounding rock roof3
Heilong coal mine, Shanxiwater-sprinkling roof3
Datunsong mine, Yunnancomplex orebody of large goaf3
Zhaozhuang mine, Shanxicompound roof6
Dongdong coal mine, Shaanxicompound roof6
Zhujixi coal mine, Anhuicompound roof4
Shenzhou coal mine, Shanxiextra-thick compound roof6
Hengsheng coal mine, Shanxihard roof2
Zhaozhuang mine, Shanxilayered roof4
East Kouzi coal mine, Anhuicomponent roof6
Baode coal mine, Shanxithick coal-seam with hard roof12
Shuangxin coal mine, InnerMongoliasoft roof3
Sanjiaohe coal mine, Shanxiroof near fault7
Ann hill coal mine, Shaanxilayered roof5
Table 2. Calculation Results of Marginal Distribution of Roof Mechanical Parameters.
ParameterEνcφ
normal1638.9−455.661247.71142.4
lognormal1537.9−435.621036.91166.3
Gumbel1662.6−405.051268.41209.8
Weibull1414.2−456.451031.31129.8
Table 3. Correlation coefficients and correlation matrix for different construction methods.
Construction MethodCorrelation Coefficients MatrixCorrelation Parameter Matrix
Pearson 1 0.0153 0.6227 0.0937 0.0153 1 0.0243 0.1249 0.6227 0.0243 1 0.3025 0.0937 0.1249 0.3025 1 1 0.0719 0.4737 0.0708 0.0719 1 0.0684 0.1745 0.4737 0.0684 1 0.4515 0.0708 0.1745 0.4515 1
Kendall 1 0.0981 0.3339 0.0521 0.0981 1 0.0282 0.0973 0.3339 0.0282 1 0.3448 0.0521 0.0973 0.3448 1 1 0.1534 0.5008 0.0817 0.1534 1 0.0444 0.1522 0.5008 0.0444 1 0.5155 0.0817 0.1522 0.5155 1
Spearman 1 0.1420 0.4757 0.0732 0.1420 1 0.0409 0.1399 0.4757 0.0409 1 0.4908 0.0732 0.1399 0.4908 1 1 0.1486 0.4930 0.0766 0.1486 1 0.0428 0.1464 0.4930 0.0428 1 0.5083 0.0766 0.1464 0.5083 1
Table 4. Statistical characteristics comparison between simulation results and measured samples.
MethodParameterMean ValueVarianceCoefficient of Variation
Measured dataE (GPa)14.789293.6951.159
ν0.2490.0050.295
c (MPa)5.35038.2821.156
φ (°)31.12822.1220.151
Gaussian_PearsonE (GPa)14.489294.0821.184
ν0.2520.0060.305
c (MPa)4.99128.3501.067
φ (°)31.21221.0520.147
Gaussian_KendallE (GPa)15.449332.5441.180
ν0.2460.0060.306
c (MPa)5.38033.0461.069
φ (°)31.05819.0700.141
Gaussian_SpearmanE (GPa)14.284269.9771.148
ν0.2470.0050.295
c (MPa)5.68338.0441.085
φ (°)31.12121.3020.148
t CopulaE (GPa)15.588361.1111.221
ν0.2460.0080.367
c (MPa)5.36329.9541.021
φ (°)31.25622.2180.151
Table 5. Constant values for roof soil structure.
Constant Valueγ (kN·m−3)h0 (m)nG (GPa)k0fs
Value26.81001.010.51.31
Table 6. Weight allocation for different HAMDA programs.
Data Augmentation MethodsSMOTEKDEAGNMDBSIACMNS
HAMDA_balance245 (30.3%)202 (25.0%)160 (19.8%)121 (15.0%)40 (4.9%)40 (4.9%)
HAMDA_conservative325 (40.2%)242 (29.9%)121 (15.0%)80 (9.9%)40 (4.9%)0 (0.00%)
HAMDA_diverse165 (20.4%)161 (19.9%)161 (19.9%)161 (19.9%)80 (9.9%)80 (9.9%)
Disclaimer/Publisher’s Note: The statements, opinions and data contained in all publications are solely those of the individual author(s) and contributor(s) and not of MDPI and/or the editor(s). MDPI and/or the editor(s) disclaim responsibility for any injury to people or property resulting from any ideas, methods, instructions or products referred to in the content.