Article

Hidden Greens, Hidden Inequities? Evaluating Accessibility and Spatial Equity of Non-Park Green Spaces in London

1
College of Horticulture and Landscape Architecture, Northeast Agricultural University, Harbin 150006, China
2
College of Mechanical and Electrical Engineering, Harbin Engineering University, Harbin 150001, China
*
Authors to whom correspondence should be addressed.
Sustainability 2025, 17(20), 9284; https://doi.org/10.3390/su17209284 (registering DOI)
Submission received: 14 September 2025 / Revised: 10 October 2025 / Accepted: 17 October 2025 / Published: 19 October 2025

Abstract

Urban green spaces (UGSs) are critical to ecological sustainability and human well-being, but equitable access remains a key challenge, particularly in high-density cities. While existing studies have predominantly focused on parks, the role of non-park green spaces (NPGSs) has received limited attention. This study examines the spatial equity of NPGSs—an overlooked but essential component of urban green infrastructure in Inner London—using a typological classification informed by previous research, along with multi-threshold accessibility assessment and spatial justice evaluation. We apply GIS-based buffer analysis, decomposed Gini coefficients, and Moran’s I clustering to quantify distributional disparities. The main findings are as follows: (1) five NPGS types are defined and mapped in Inner London: Natural and Protected, Community and Household, Purpose-Specific, Linear, and Underutilized; (2) significant accessibility inequities exist among NPGS types, with Community and Household demonstrating high equity (Gini coefficient < 0.25), while Underutilized exhibit severe deprivation (Gini coefficient > 0.74); (3) spatial clustering analysis reveals a core–periphery differentiation, characterized by persistent low–low clusters in central boroughs and emerging high–high hot spots in southeastern/northwestern boroughs. This study underscores the critical role of NPGS in complementing park-based greening strategies and provides a transferable framework to assess green equity, thereby contributing to the achievement of the United Nations Sustainable Development Goals (SDGs).

1. Introduction

UGSs, which play an important role in purifying air, mitigating urban heat island effects, and regulating the microclimate, are recognized for their contribution to human well-being [1,2,3,4,5,6]. Beyond ecological benefits, UGSs positively influence physical and mental health [7,8], also providing suitable spaces for social interaction [9]. For citizens, UGSs function as areas for stress relief, physical exercise, leisure, and entertainment [10,11,12,13]. The association between abundant UGSs and lower crime rates is also well documented [14]. Through direct contact and participation, citizens obtain better physical health and life satisfaction [15,16]. Therefore, the benefits of UGSs are indispensable and fundamental in the process of urbanization [17].
UGSs are often divided into public parks, street greenery, community green spaces, etc. [18]. While numerous studies have primarily focused on large-scale UGSs, such as parks [19], exploring their contributions to residents’ well-being and to urban climate regulation [4,8], some have also examined smaller, formally designed green spaces like pocket parks and urban squares [20,21]. However, these spaces belong to the official park system and are therefore excluded from this study. Instead, we focus on non-park, informally managed green spaces, often referred to as “leftover” places [22], with untapped multi-dimensional potential. These green spaces are defined as NPGSs, including allotment gardens, street greenery, cemeteries, neighborhood green spaces, and private or non-public trees [23]. Empirical studies have shown that NPGSs can mitigate urban heat island effects and support microclimate regulation [24,25]. They also enhance biodiversity and ecological connectivity [26,27], foster community cohesion [28], preserve cultural landscapes [29], and generate economic benefits through agricultural and forestry production [30]. Beyond these ecological and social functions, NPGSs exhibit considerable diversity in form and use. Some, such as community gardens and neighborhood greens, are socially accessible and support daily recreation and interaction [31,32]. Others include street greenery with distinct linear morphology, cemeteries, and ruderal sites that fulfill specific infrastructural or landscape functions [33,34], whereas brownfield areas represent underutilized zones with potential for sustainable redevelopment and restoration [35]. Table 1 summarizes the five NPGS categories frequently identified in the literature. These NPGSs collectively complement park-based UGSs and contribute critically to ecosystem service provision and biodiversity conservation [36,37].
Environmental justice emphasizes equitable access to ecological resources regardless of race, gender, socioeconomic status, or residence [58,59,60]. Despite this principle, inequity in UGS access persists globally, as park expansion in high-density cities fails to address spatial disparities [18]. Unlike parks, NPGSs are typically smaller, more dispersed, and embedded within residential areas, enabling everyday contact with nature for diverse social groups [31,32,33,34,35]. Recent studies highlight the critical role of NPGSs in advancing environmental justice through diverse pathways. Emerging evidence demonstrates that NPGSs can improve urban thermal comfort by mitigating heat island effects [61], enhance accessibility through strategic distribution [62], and expand service availability through functional diversification [36,37]. These synergistic effects collectively mitigate spatial and social inequalities in green resource allocation, thereby fostering more equitable urban ecosystems [63]. The accumulating empirical findings underscore the necessity of systematic investigations into NPGS distribution and characteristics, particularly regarding their underexplored role in achieving environmental justice objectives [36]. Such research provides critical insights for urban planning strategies that move beyond traditional park-centric paradigms towards inclusive and diversified UGS networks.
Accessibility is a key indicator in spatial equity research which reflects the potential opportunities residents have to benefit from UGSs, and is widely regarded as an effective measure of green availability and distributional equity [17]. While the two-step floating catchment area method is often praised for capturing spatial differences between supply and demand [64], its applicability is limited in NPGSs due to their typical small-scale configurations and functional heterogeneity [52]. To overcome this limitation, buffer analysis offers an effective means for assessing NPGS accessibility at varying pedestrian thresholds, quantifying intra-urban disparities with precision. Given the diversity of NPGSs, several critical questions emerge: How do accessibility patterns vary across different NPGS types? What spatial clustering patterns emerge from these disparities? What implications do these patterns hold for advancing spatial justice? These questions form the core investigative framework of this study.
This study proposes a novel framework to evaluate NPGSs in Inner London through three interconnected components: (1) systematic classification and mapping of NPGS typologies based on functional and structural characteristics; (2) multi-threshold pedestrian accessibility analysis using buffer zones to quantify service coverage disparities; and (3) spatial equity analysis combining Gini coefficient decomposition with spatial autocorrelation to detect statistically significant clusters of accessibility deprivation. The framework advances UGS research by integrating typological diversity, distance-sensitive accessibility metrics, and spatial justice assessment, thereby providing actionable insights for equitable and sustainable UGS planning, in line with SDG 11 on universal access to safe, inclusive, and accessible green spaces [65].

2. Methods

2.1. Study Area

This study focuses on Inner London, which comprises 14 boroughs, covers approximately 320 square kilometers, and has a population of 3,505,912 (2025). The area is characterized by high population density, advanced urbanization, and pronounced socioeconomic diversity. Population density varies widely across Inner London, from less than 6000 persons/km2 in peripheral residential areas to more than 16,000 persons/km2 in central boroughs. The area is ethnically diverse, with non-White residents accounting for nearly 47% of the population, and exhibits evident income polarization between affluent and deprived districts.
The region contains approximately 4777 hectares of green spaces, accounting for 15% of London’s total, including parks, street greenery, community gardens, and other types of NPGSs. These diverse green spaces provide a robust context for evaluating NPGS accessibility. Inner London is divided into 1895 Lower Super Output Areas (LSOAs), the smallest statistical units defined by the Office for National Statistics (ONS, https://www.ons.gov.uk/ (accessed on 1 June 2025)), each containing approximately 1500 people or 650 households. This provides a foundation for quantifying accessibility disparities across LSOAs and analyzing distributional equity in NPGS allocation (Figure 1).

2.2. Research Flow

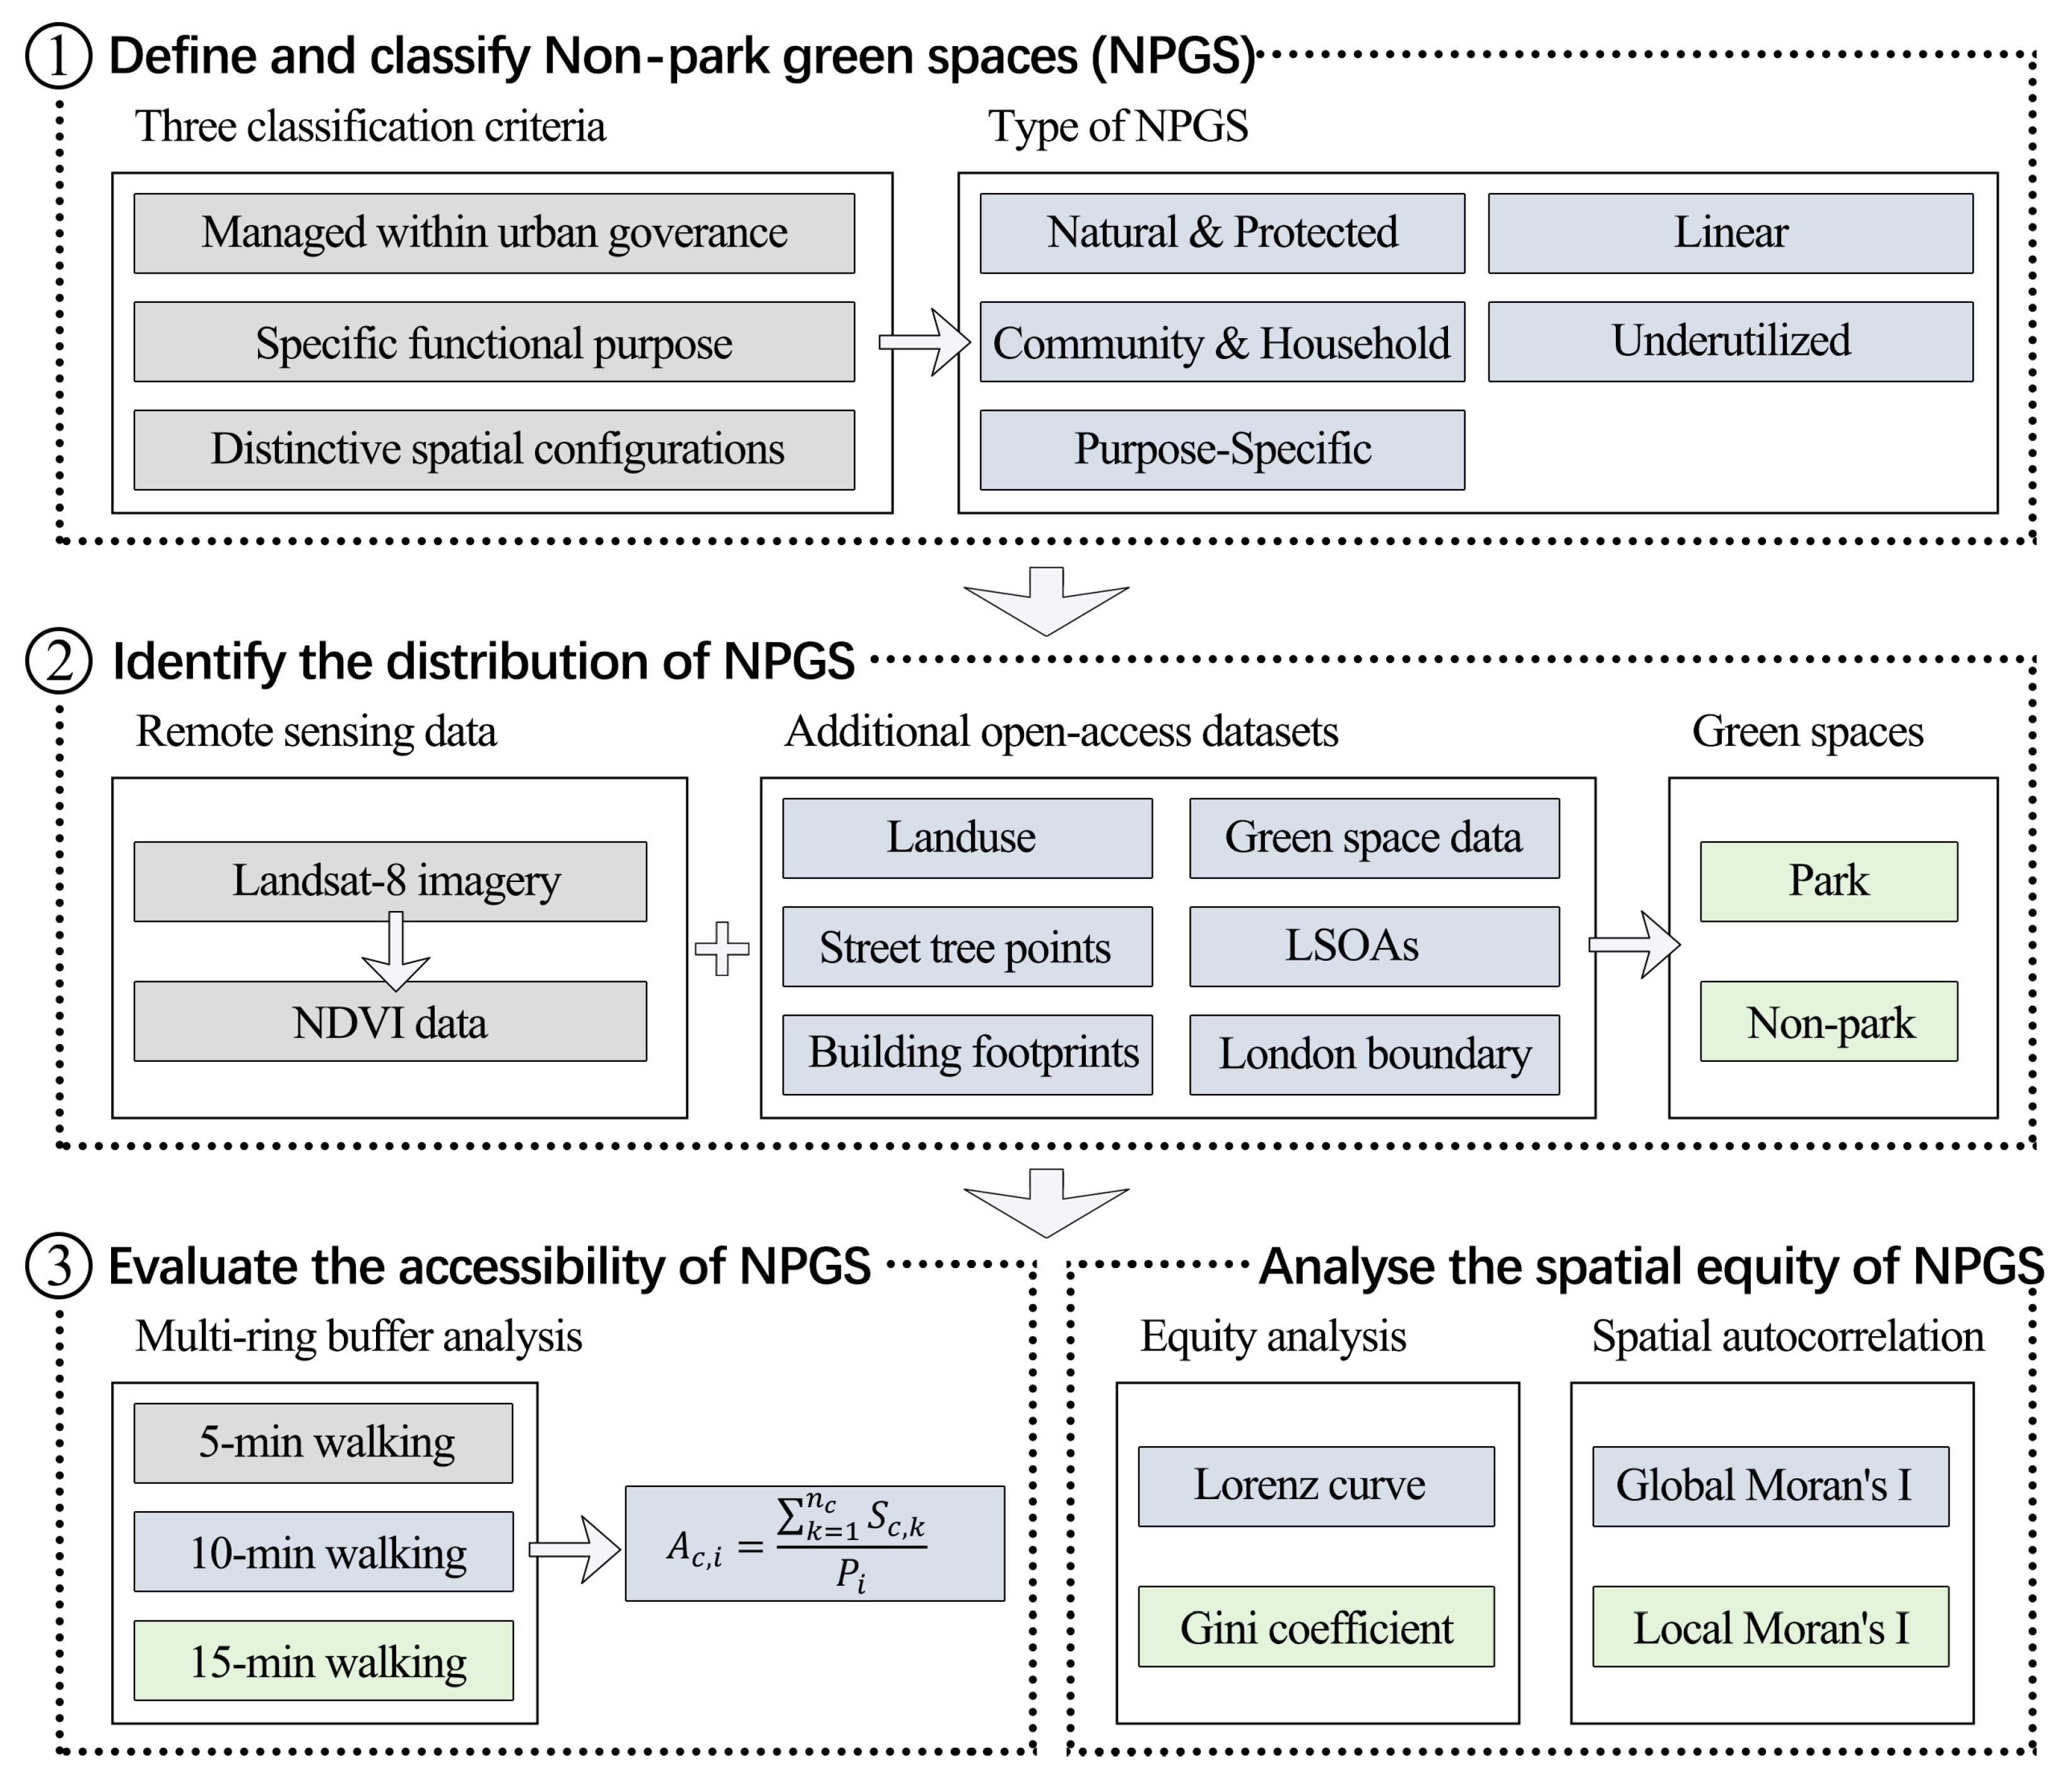
This study employs the systematic workflow illustrated in Figure 2 to evaluate NPGS accessibility and distributional equity. First, based on a literature review, we define an NPGS and classify existing NPGS types documented using three criteria. Second, we utilize Landsat-8 imagery to calculate NDVI, integrating open access datasets to refine green space boundaries, distinguish parks from NPGSs, and identify five distinct NPGS types. Third, considering NPGSs’ limited-service range, we assess pedestrian accessibility through multi-ring buffer analysis to represent spatial proximity, and quantify distribution equity across distances using Lorenz curves and Gini coefficients. Finally, we conduct spatial autocorrelation analysis to reveal geographic disparities, identifying high–high clusters, low–low clusters, and spatial outliers.

2.3. The Types and Distribution of NPGSs

2.3.1. Define and Classify the Five Categories of NPGSs

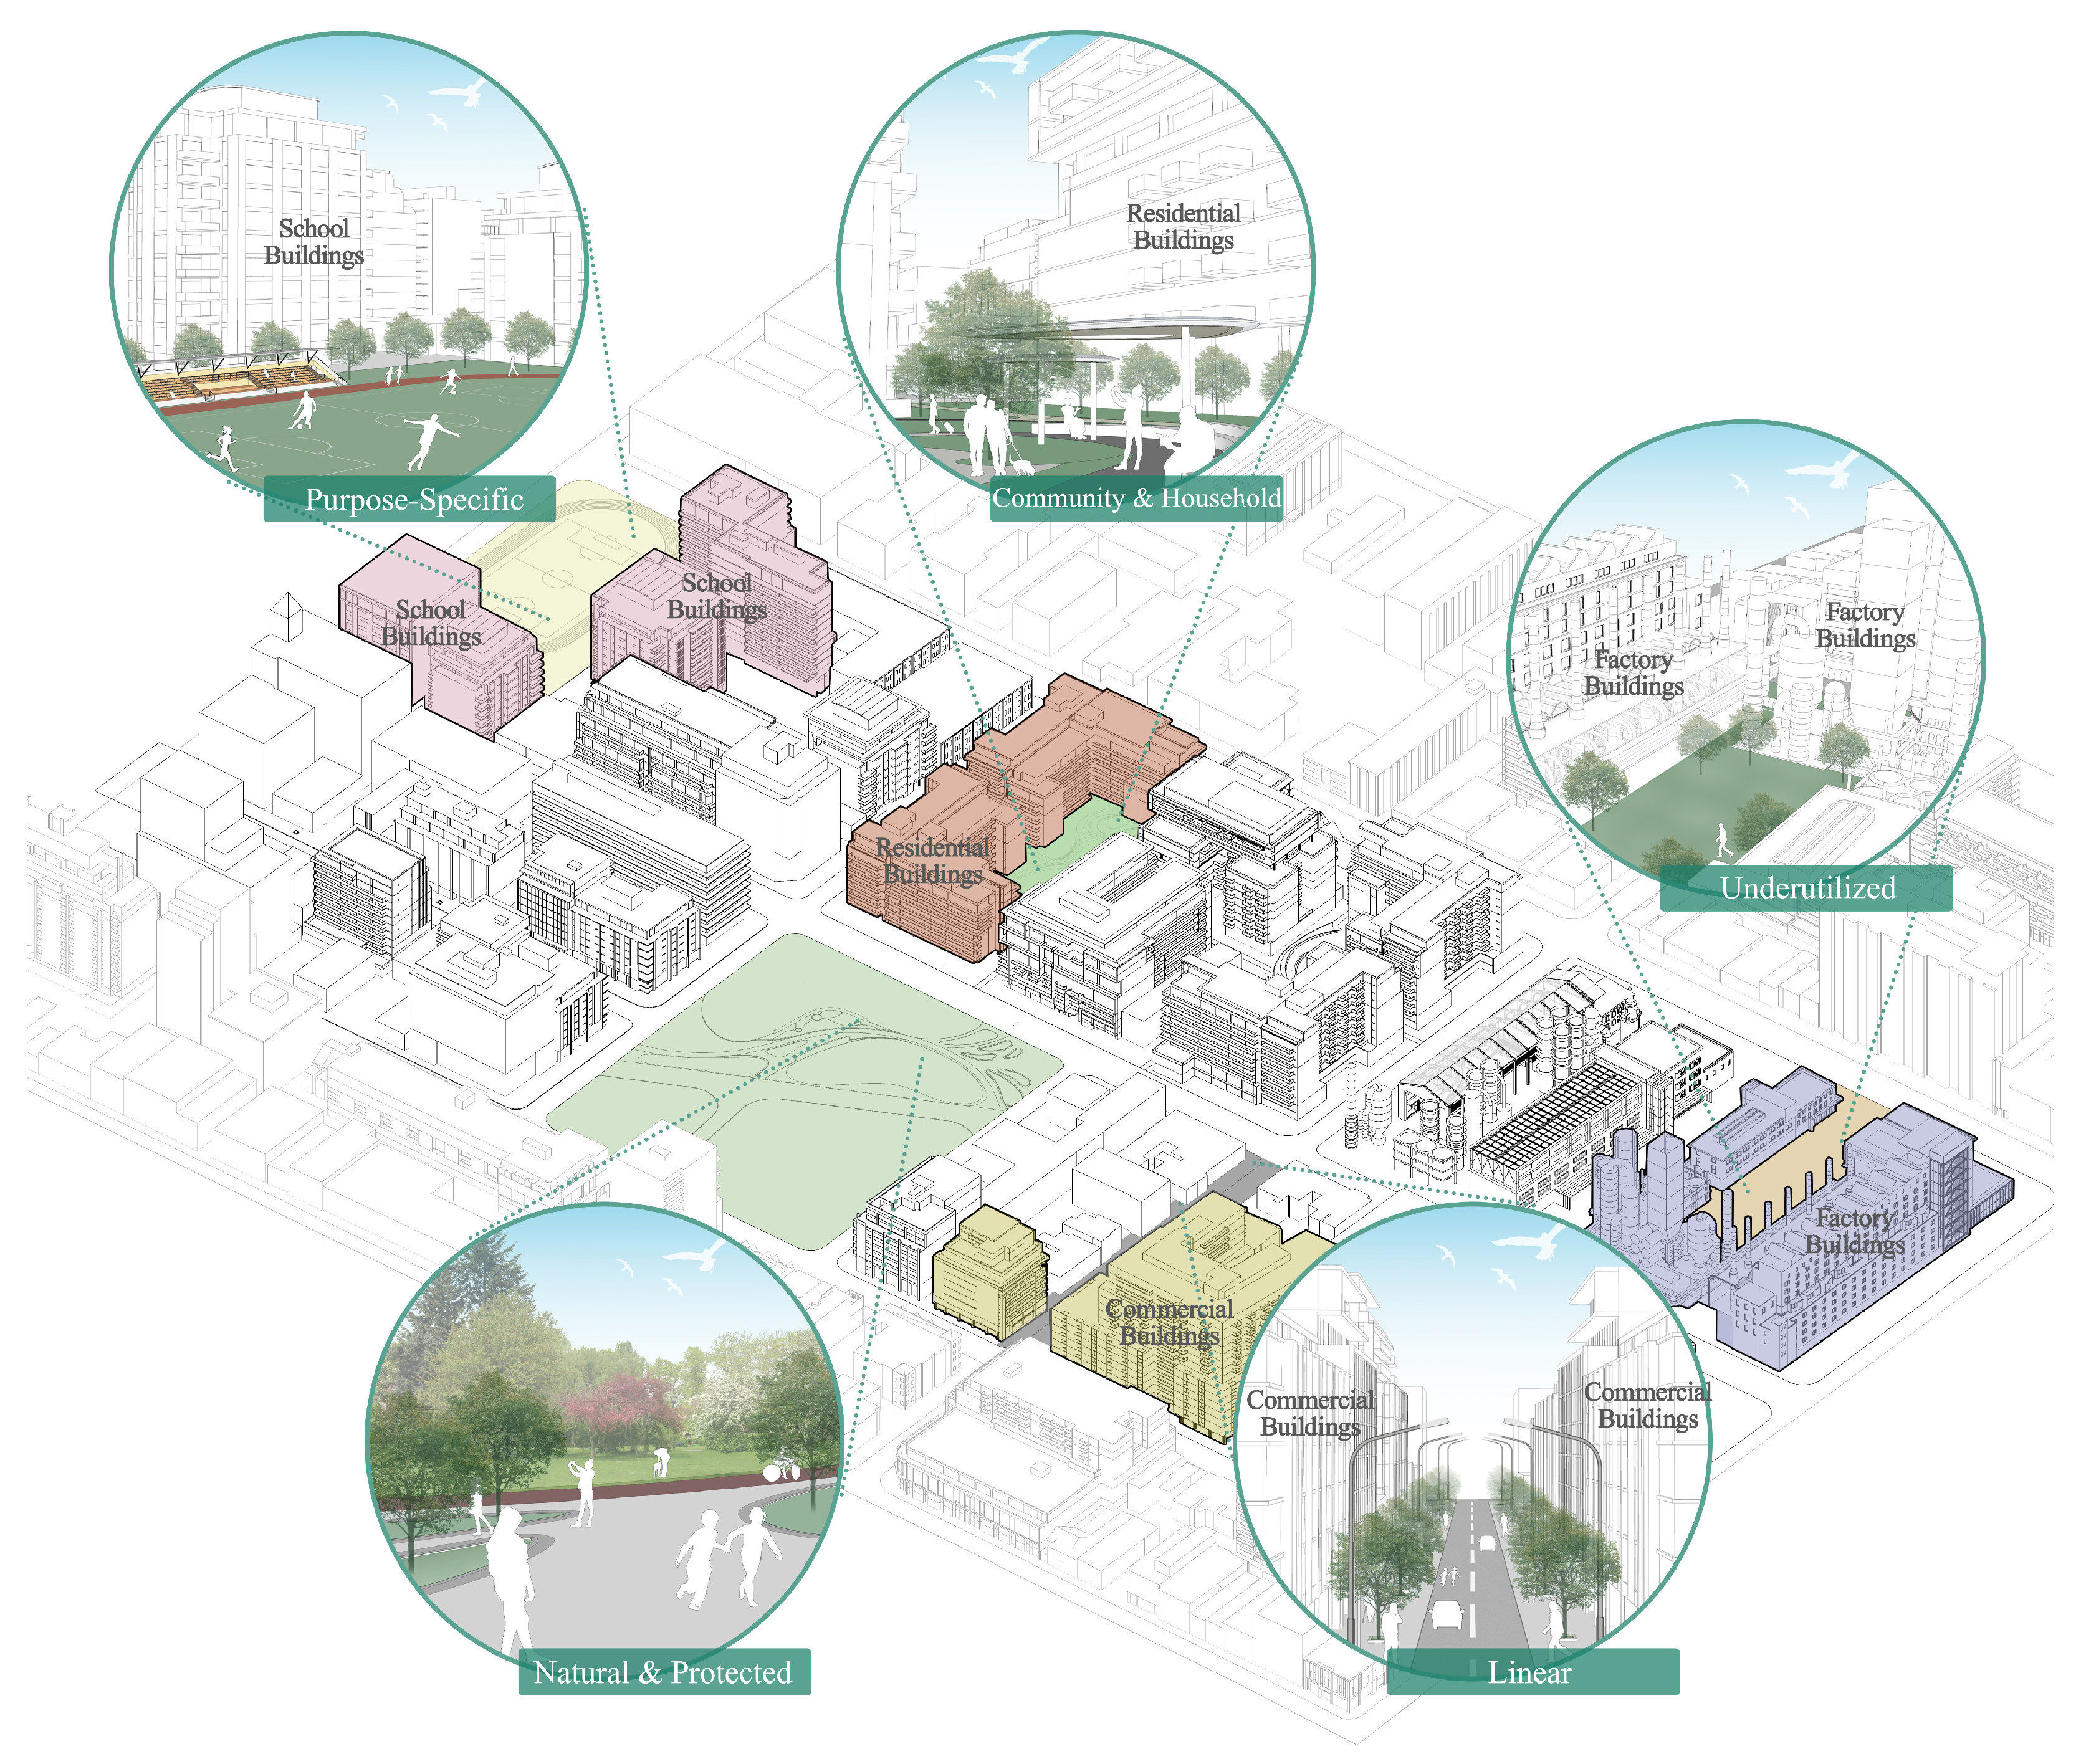
We define NPGSs as all vegetated urban areas excluding parks [62]. NPGSs include both informal green spaces (IGSs) and certain formal green spaces [63], such as cemeteries [50], allotment gardens [42], and community gardens [41], which differ from parks in terms of user groups and function. IGSs are often classified into managed and unmanaged categories based on governance [23], but this classification inadequately addresses the functional and spatial complexity of urban green systems. To resolve this gap, we propose a novel framework classifying NPGSs through three criteria: (1) whether the green spaces are institutionally managed within urban governance systems, (2) whether they serve specific functional objectives (e.g., productive, educational, or therapeutic purposes), and (3) whether they exhibit distinctive spatial configurations (e.g., linear corridors versus patch formations). Systematic application of these criteria reveals five distinct NPGS typologies (Figure 3).
The defined NPGS typologies exhibit distinct functions across urban systems. Natural and Protected—comprising urban forests [31], nature reserves [40], and protected grasslands [38]—are primarily dedicated to biodiversity conservation through formal regulatory frameworks. Community and Household, such as residential gardens [10] and neighborhood green spaces [32], foster localized socioecological engagement through high residential accessibility. Purpose-Specific integrate specialized functional landscapes, including botanical gardens [49], cemeteries [50], and urban agricultural lands [45,46], which fulfill specific urban service roles. Linear, exemplified by street greenery [34] and green verges [18,52], enhance landscape permeability and ecological connectivity within fragmented built environments. Underutilized, such as vacant lots [14] and degraded areas [53,57], retain untapped potential for ecological restoration despite current marginalization in urban planning.

2.3.2. Conduct the Land Use Data and NDVI to Evaluate the Distribution of NPGSs

To analyze the distribution of NPGSs accurately, we integrate remote sensing data, geographic information systems, and open access datasets [66]. Specifically, OpenStreetMap (OSM, https://www.openstreetmap.org/ (accessed on 1 June 2025)), Landsat-8 satellite imagery from the United States Geological Survey (https://earthexplorer.usgs.gov/ (accessed on 2 June 2025)), and data from the London DataStore (https://data.london.gov.uk/ (accessed on 2 June 2025)) are used to obtain NPGS data. We primarily source road, land use, and green space data from OSM, with the Inner London boundary, LSOAs, street tree points, and building footprints acquired from the London DataStore.
Normalized Difference Vegetation Index (NDVI) is a dimensionless indicator widely used to quantify vegetation coverage and condition [67,68]. The resulting NDVI values range from −1 to + 1, where higher values indicate dense, healthy vegetation, and lower values suggest barren land or water bodies [67,69]. To ensure high-quality data, satellite imagery from summer 2024 (June–August) is selected based on two criteria: (1) acquisition during peak vegetation phenology, and (2) cloud coverage below 6% to guarantee optical clarity and minimize atmospheric interference.
The index is mathematically defined as:
N D V I = N I R R E D N I R + R E D
where NIR is the reflectance in the near-infrared band (Band 5) and RED is the reflectance in the red band (Band 4).
Of the five categories of NPGSs, Natural and Protected, Community and Household, and Purpose-Specific are primarily derived from land use data. Community and Household are further enhanced with NDVI to identify NPGSs within residential areas, while Purpose-Specific are refined using NDVI combined with medical and educational areas. Linear include both street greenery and green verges. Street greenery is identified by creating 6.5 m buffers around street tree points, according to the average crown width of the trees documented in the London i-Tree Eco Project (https://www.forestresearch.gov.uk/research/i-tree-eco/ (accessed on 1 June 2025)). Three buffers are established to delineate green verges, 15 m for roads, 25 m for railways, and 150 m for airport runways [70,71,72], and NPGS detection within these buffers is conducted using NDVI. Underutilized are demarcated based on land use classifications, with further identification of NPGSs in these areas carried out using NDVI (Table 2).

2.4. Evaluate the Accessibility of NPGSs

2.4.1. Multi-Ring Buffer Analysis of NPGS Distribution

Considering the functional diversity and limited service range of NPGSs, this study focuses on pedestrian accessibility as an indicator of spatial proximity, reflecting both opportunities for direct use and benefits derived from environmental or visual exposure. Following the Natural England action plan (2024), which calls for equitable access to green infrastructure within a 15 min walking distance for all residents, we quantify NPGS availability using three walking thresholds: 5 min (400 m), 10 min (800 m), and 15 min (1200 m) [73,74].
For each LSOA, buffers corresponding to these distances are generated using GIS tools. Both the total NPGS area and the area of each NPGS category within these buffers are aggregated. The per capita accessible area is then calculated to assess distributional equity, incorporating category-specific and total NPGS metrics. The accessibility of an NPGS category c in LSOA i is defined as:
A c , i = k = 1 n c S c , k P i
where Sc,k is the area of the k-th NPGS patch within category c, nc is the total number of NPGS patches of category c, and Pi is the population of LSOA i.
For the total NPGS accessibility, the formula is extended as:
A t o t a l , i = c = 1 m k = 1 n c S c , k P i
where m represents the total number of NPGS categories.

2.4.2. Lorenz Curve and Gini Coefficient Analysis

The Lorenz curve and Gini coefficient, originally formalized in economics to measure wealth distribution inequality [75,76], have been widely adopted in environmental justice studies to assess spatial equity of public service facilities and green spaces [77,78]. Given their robustness and interpretability, we adopt these indicators to quantify inequality in spatial resource distribution, enabling direct comparison across NPGS types and distance thresholds. For each NPGS category, we construct Lorenz curves based on per capita accessible area within 1895 LSOAs across three buffer distances (400 m, 800 m, and 1200 m). The Lorenz curve is mathematically expressed as follows:
L p = 0 p F 1 t d t μ
where p represents the cumulative population proportion, F−1(t) is the quantile function of resource distribution, and μ is the mean accessible area.
The y = x denotes perfect equality. A closer proximity of the Lorenz curve to this equality line indicates lower inequality [62]. The Gini coefficient quantifies distribution inequality through the ratio of the area between the Lorenz curve and equality line to the total area under the equality line [79,80]. The Gini coefficient is mathematically expressed as follows:
G = 1 2 0 1 L p d p
The World Bank defines a Gini coefficient of 0.4 as the critical threshold for distributional inequality, with values exceeding this benchmark indicating severe inequity [81]. Empirical urban studies demonstrate that surpassing this threshold in green space distribution reveals significant spatial disparities requiring targeted policy interventions [59,82].

2.4.3. Spatial Autocorrelation and Hot Spot Analysis

Spatial autocorrelation of NPGS distribution is analyzed using Moran’s I, a widely adopted method for identifying spatial clustering patterns [83,84]. Moran’s I complements the Gini coefficient by revealing how accessibility inequities are spatially distributed, indicating whether they are clustered or dispersed. The analysis encompasses both global and local Moran’s I. Global Moran’s I quantifies the overall spatial clustering intensity of NPGSs across the study area [85], calculated as follows:
I = n · i = 1 n j = 1 n ω i j x i x ¯ x j x ¯ i = 1 n j = 1 n ω i j · i = 1 n x i x ¯ 2
where n is the number of LSOAs, ωij represents the spatial weight matrix between units i and j, xi and xj denote the per capita accessible NPGS area, and x ¯ is the mean value.
Global Moran’s I ranges from [−1, 1]. Values greater than 0 indicate positive spatial autocorrelation characterized by clustering of similar values, values less than 0 suggest spatial dispersion or negative correlation with dissimilar values distributed adjacently, and a value of 0 corresponds to a random spatial distribution [86,87].
To characterize localized spatial imbalances in NPGS accessibility, local Moran’s I identifies statistically significant hot spots representing areas of high–high clustering or cold spots associated with low–low clustering [88,89]. For each spatial unit i, local Moran’s I is defined as:
I i = x i x ¯ · j = 1 n ω i j x j x ¯ i = 1 n x i x ¯ 2

3. Results

3.1. The Category System and Overall Distribution of NPGSs in London

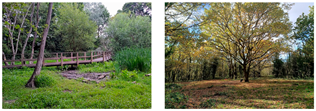
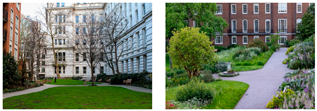
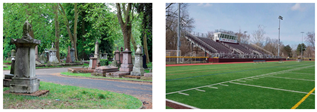
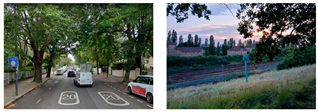
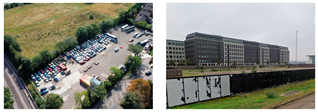
NPGSs in Inner London are classified into five typologies—Natural and Protected, Community and Household, Purpose-Specific, Linear, and Underutilized—based on governance characteristics, functional purpose, and spatial configuration. Table 3 presents the classification of NPGSs in Inner London, accompanied by detailed explanatory descriptions and representative scenes.
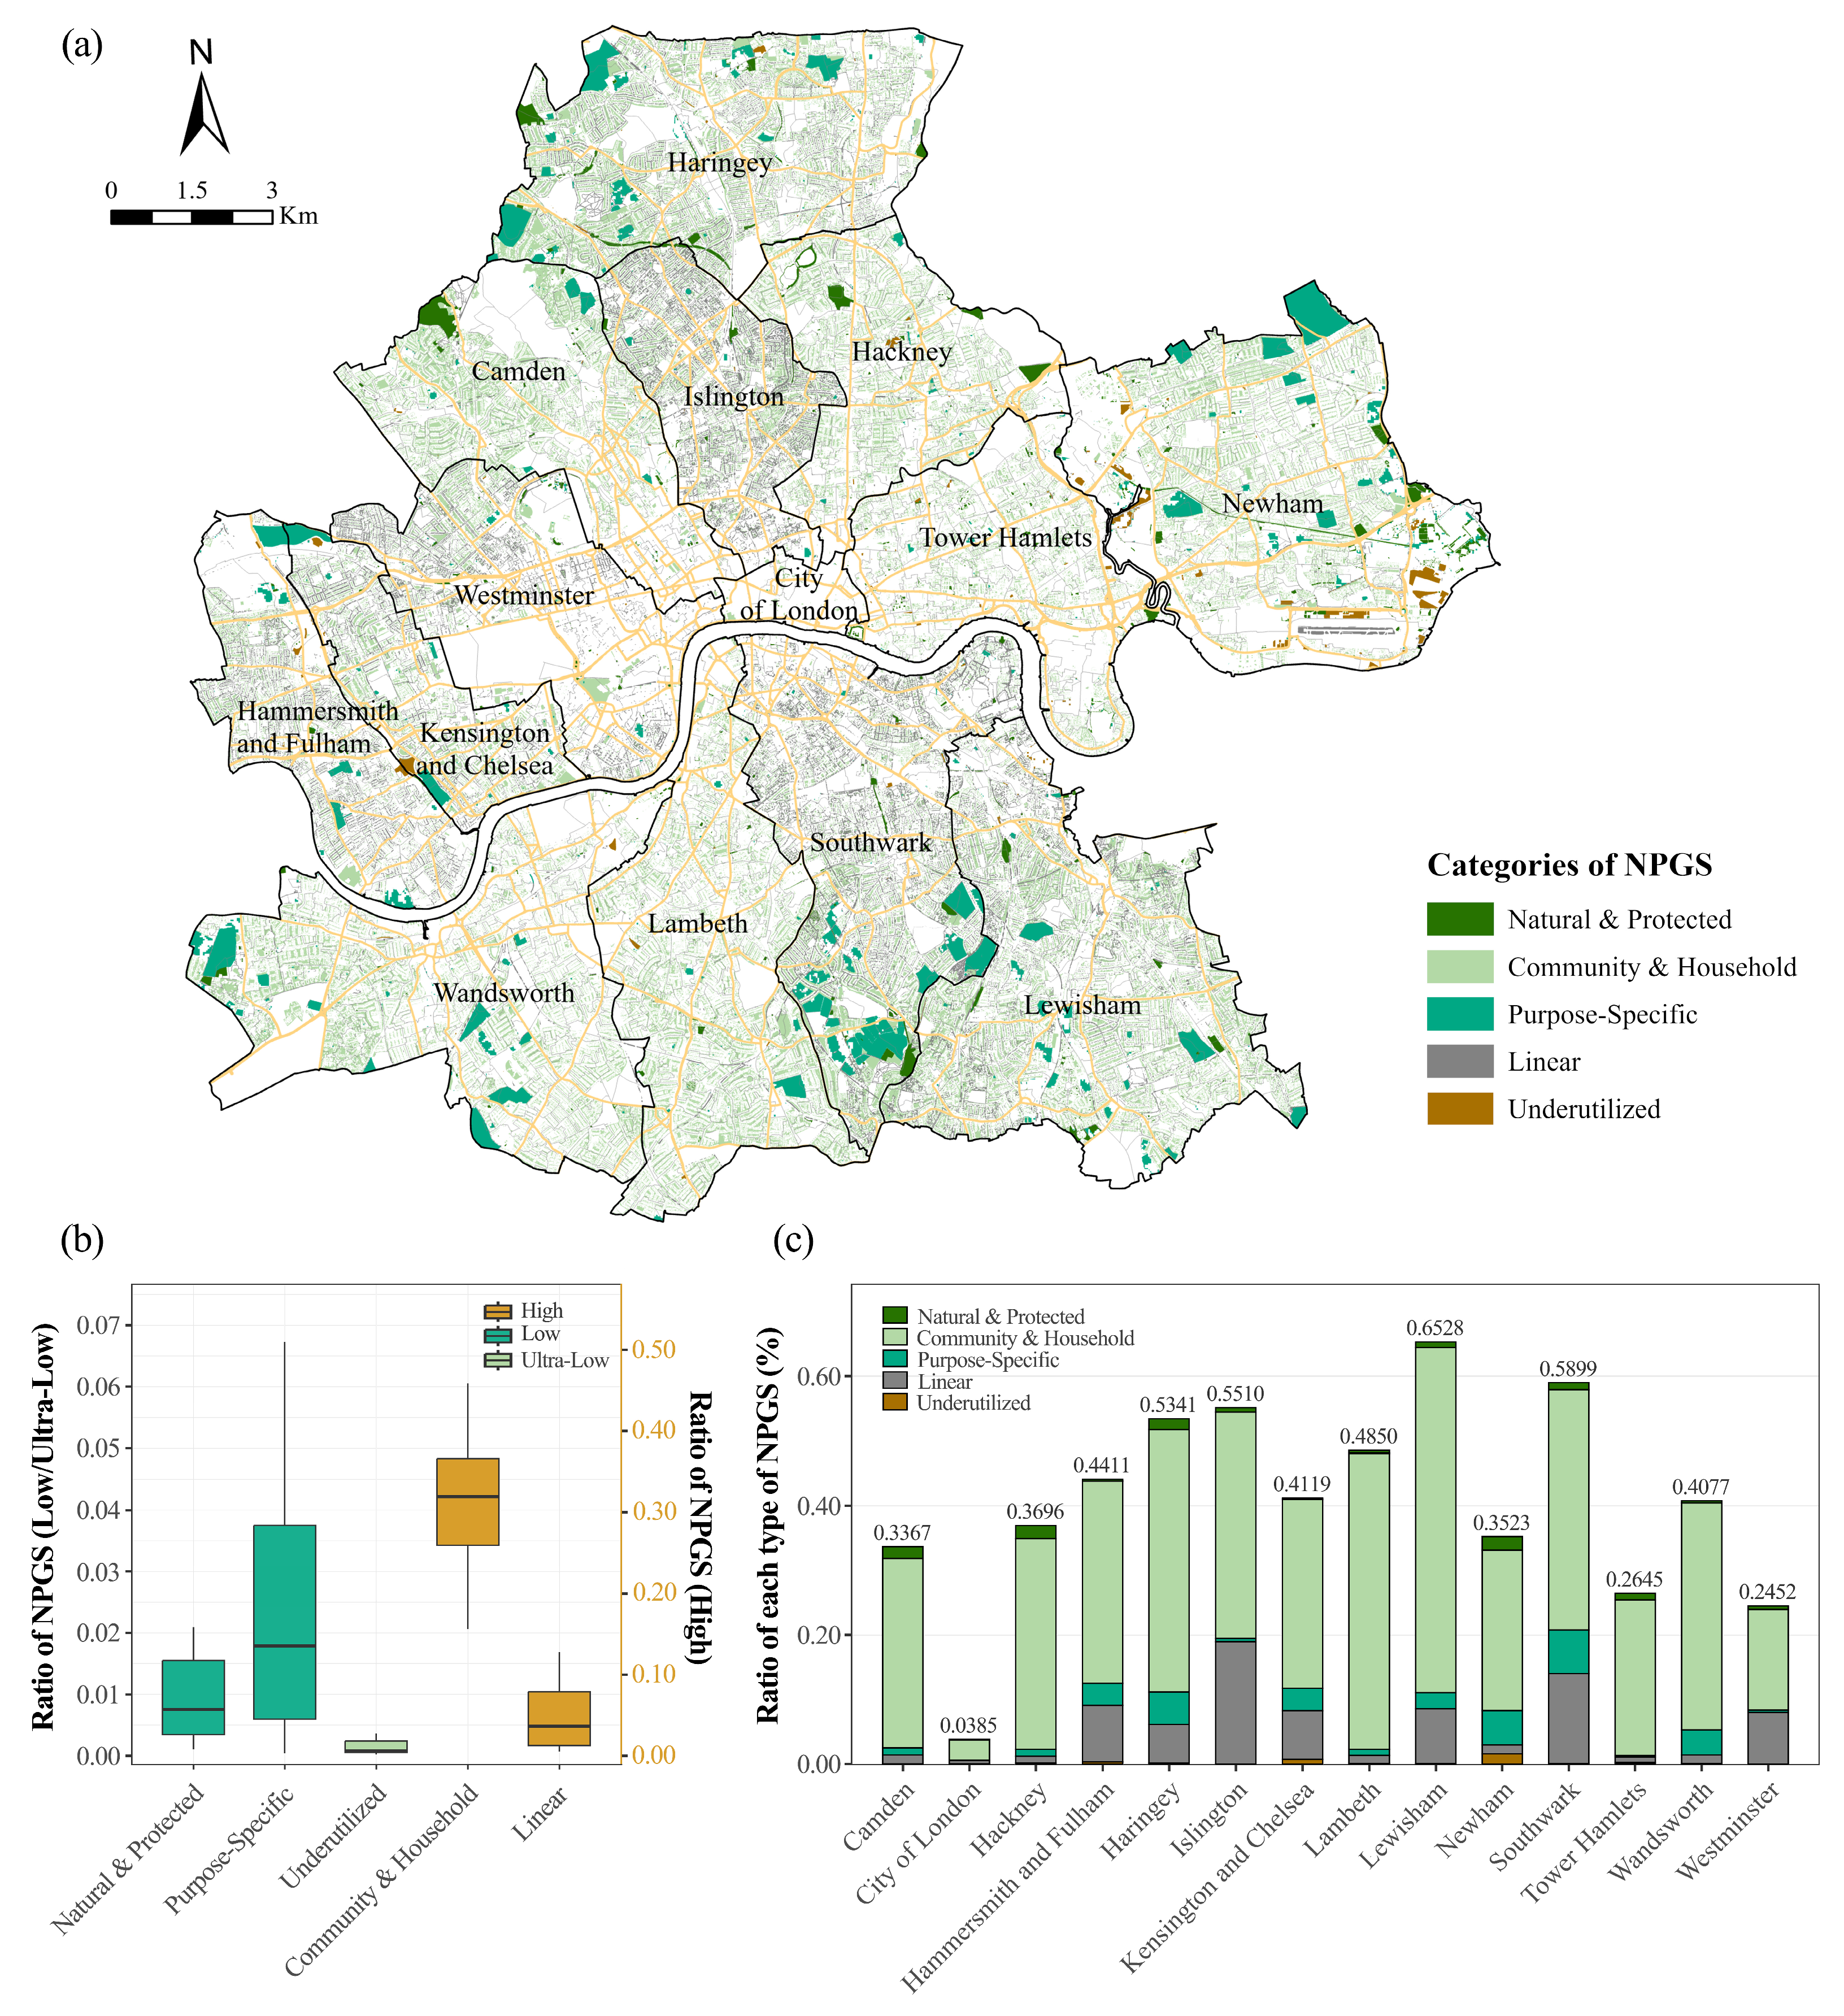
Geospatial analysis illustrates the distinct spatial distribution patterns of NPGSs in Inner London (Figure 4a). NPGSs in Inner London generally exhibit a balanced spatial distribution, although exceptions are observed in certain areas north of the River Thames. Further variations emerge across NPGS types: Community and Household demonstrate widespread uniformity, whereas Purpose-Specific are characterized by fragmented and patchy patterns. Linear display pronounced regional disparities, while both Natural and Protected and Underutilized show limited presence, with the latter being particularly scarce.

3.2. The Disparities Between the Boroughs and Categories

Boxplot analysis further reveals significant variations in NPGS coverage ratios across typologies (Figure 4b). Community and Household and Linear exhibit higher ratios, with Community and Household showing the highest median (0.3196) and largest interquartile range (IQR = 0.1332), suggesting substantial variability. In contrast, Natural and Protected and Purpose-Specific typologies have lower median ratios. Underutilized typology demonstrates the lowest median (0.0008) and smallest IQR (0.0023), indicating uniform distribution and negligible green coverage.
Stacked bar charts reveal distinct spatial patterns of NPGS distribution across Inner London boroughs and typologies (Figure 4c). Overall, NPGS coverage exceeds 20% in most boroughs, peaking at 65.3% in Lewisham, with the City of London being an exception (3.9%). Among the five NPGS categories, Community and Household consistently dominates all boroughs, followed by Linear and Purpose-Specific. Notably, Purpose-Specific surpasses Linear only in Newham and Wandsworth, attributable to Newham’s extensive cemeteries and Wandsworth’s large golf courses. Underutilized maintains minimal coverage across all boroughs.
Regional disparities are further evident in detailed spatial patterns. Natural and Protected, comprising nature reserves, protected zones, forests, and grasslands, predominantly cluster along administrative boundaries. Newham and Hackney exhibit the highest vegetation coverage, exceeding 2.0%, in sharp contrast to the City of London, which has a minimal coverage of 0.1%. Community and Household, the most extensive NPGS category, include private gardens, allotments, community food-growing areas, and residential green spaces. At the borough scale, significant inter-borough disparities exist: all boroughs except the City of London (3.1%) and Westminster (15.6%) surpass 20% coverage, peaking at 53.4% in Lewisham. Purpose-Specific encompass recreational facilities such as golf courses and zoos, productive lands like farmlands and greenhouses, cultural heritage sites including cemeteries, and therapeutic-educational green spaces. These areas show localized concentrations in Southwark (6.7%), Newham (5.3%), and Haringey (5.0%), while the City of London shows negligible coverage (0.04%). Linear, primarily consisting of street tree networks and green verges, exhibit spatial polarization, with Islington (19.0%) and Southwark (14.0%) displaying the highest proportions, compared to minimal presence in Tower Hamlets (0.8%) and the City of London (0.5%). Underutilized, characterized by extreme fragmentation and typified by brownfields and abandoned areas, are exceptionally concentrated in Newham (1.6%), whereas 11 of 14 boroughs register coverage below 0.03%.
Aggregate spatial analysis highlights a core–periphery differentiation in NPGS distribution. High-coverage clusters (>50%) are predominantly localized in peripheral boroughs of Inner London, specifically Lewisham (65.3%), Southwark (59.0%), Islington (55.1%), and Haringey (53.4%), in contrast to central boroughs such as Tower Hamlets (26.5%), Westminster (24.5%), and the City of London (3.9%), which exhibit markedly lower coverage.

3.3. NPGS Accessibility

3.3.1. The Comparison of Accessibility Measurements of the Five NPGS Types

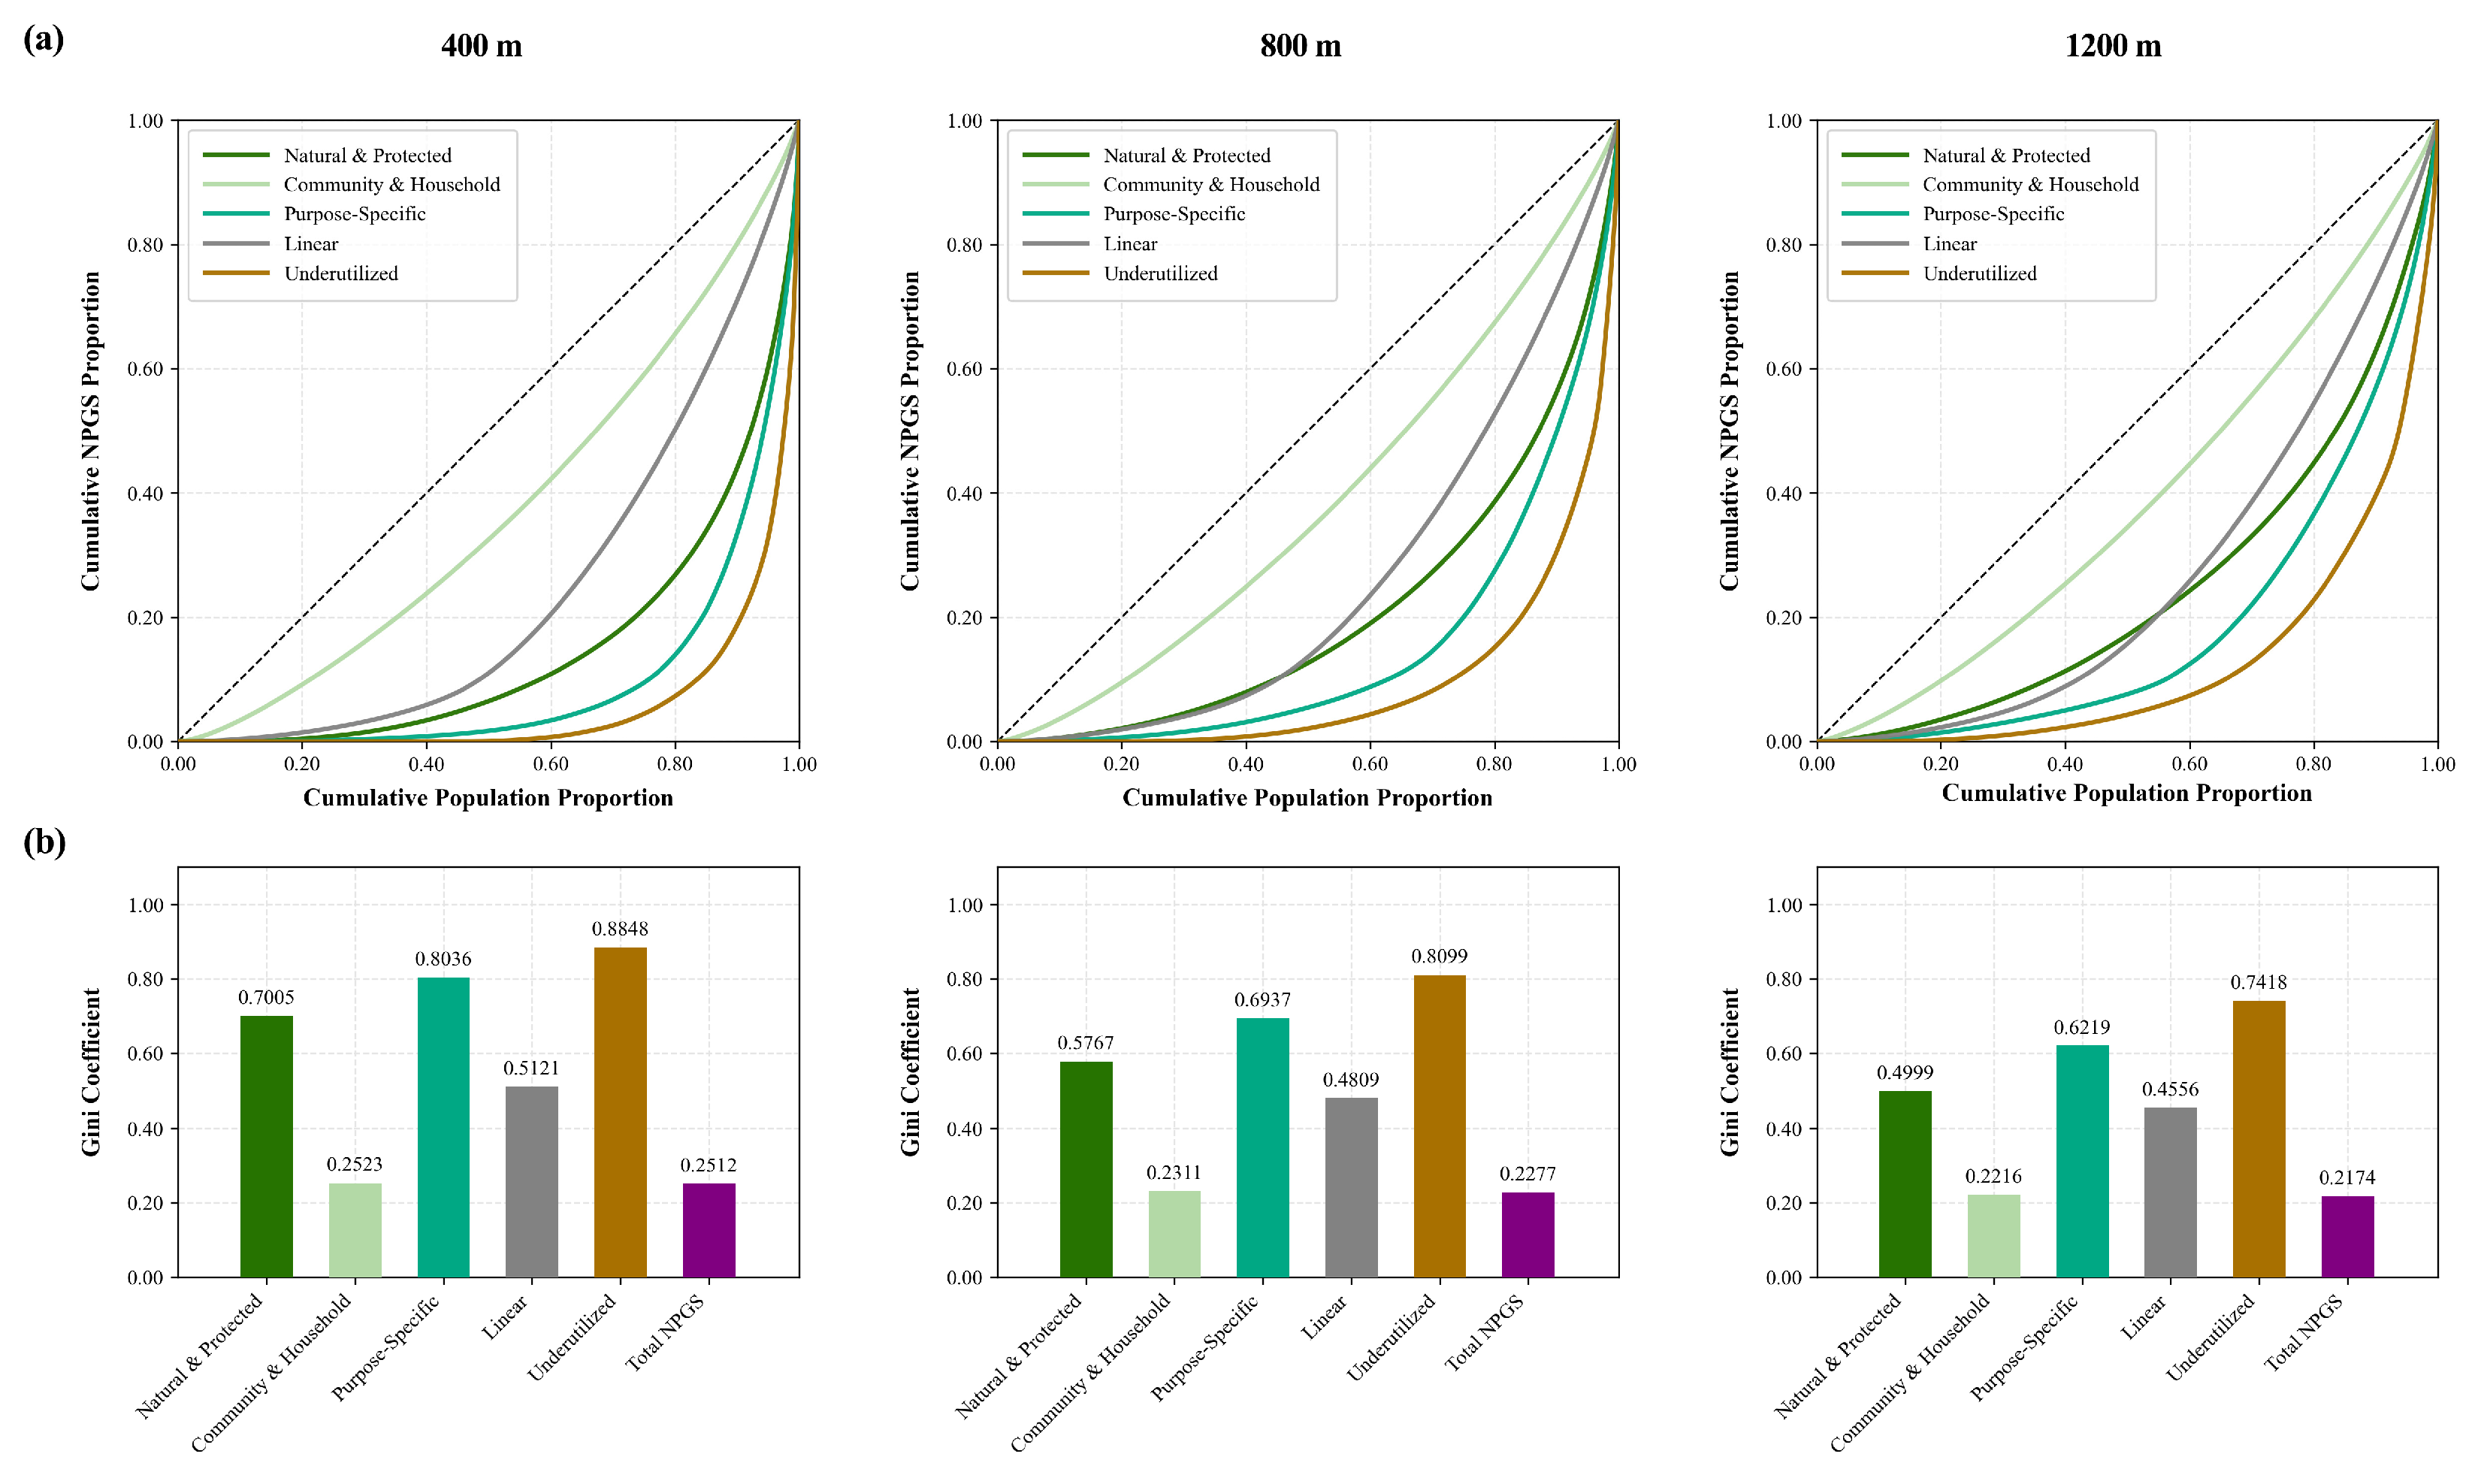
Lorenz curves and Gini coefficients reveal improved accessibility across all NPGS categories with increasing buffer distance, as shown in Figure 5. This pattern manifests through Lorenz curves approaching the absolute equity line and progressively declining Gini coefficients. Total NPGS consistently exhibits the lowest Gini coefficients across all distances, closely aligning with the Community and Household category. Among the five typologies, Community and Household demonstrate the most equitable distribution, as Gini values decrease from 0.2523 at 400 m to 0.2216 at 1200 m. In contrast, Underutilized display the least equitable access, with Gini coefficients ranging from 0.8848 to 0.7418. Moderate equity levels are observed in Linear, Natural and Protected, and Purpose-Specific, ordered by ascending Gini coefficients. Notably, Natural and Protected temporarily surpass Linear in equity metrics at larger buffers. At 800 m, this crossover occurs when cumulative NPGS coverage reaches 10.5% for 45.8% of the population, while at 1200 m, it reaches 20.7% coverage for 55.2% of the population before Linear regain dominance.

3.3.2. The Global and Local Level Spatial Patterns of the Five NPGS Types

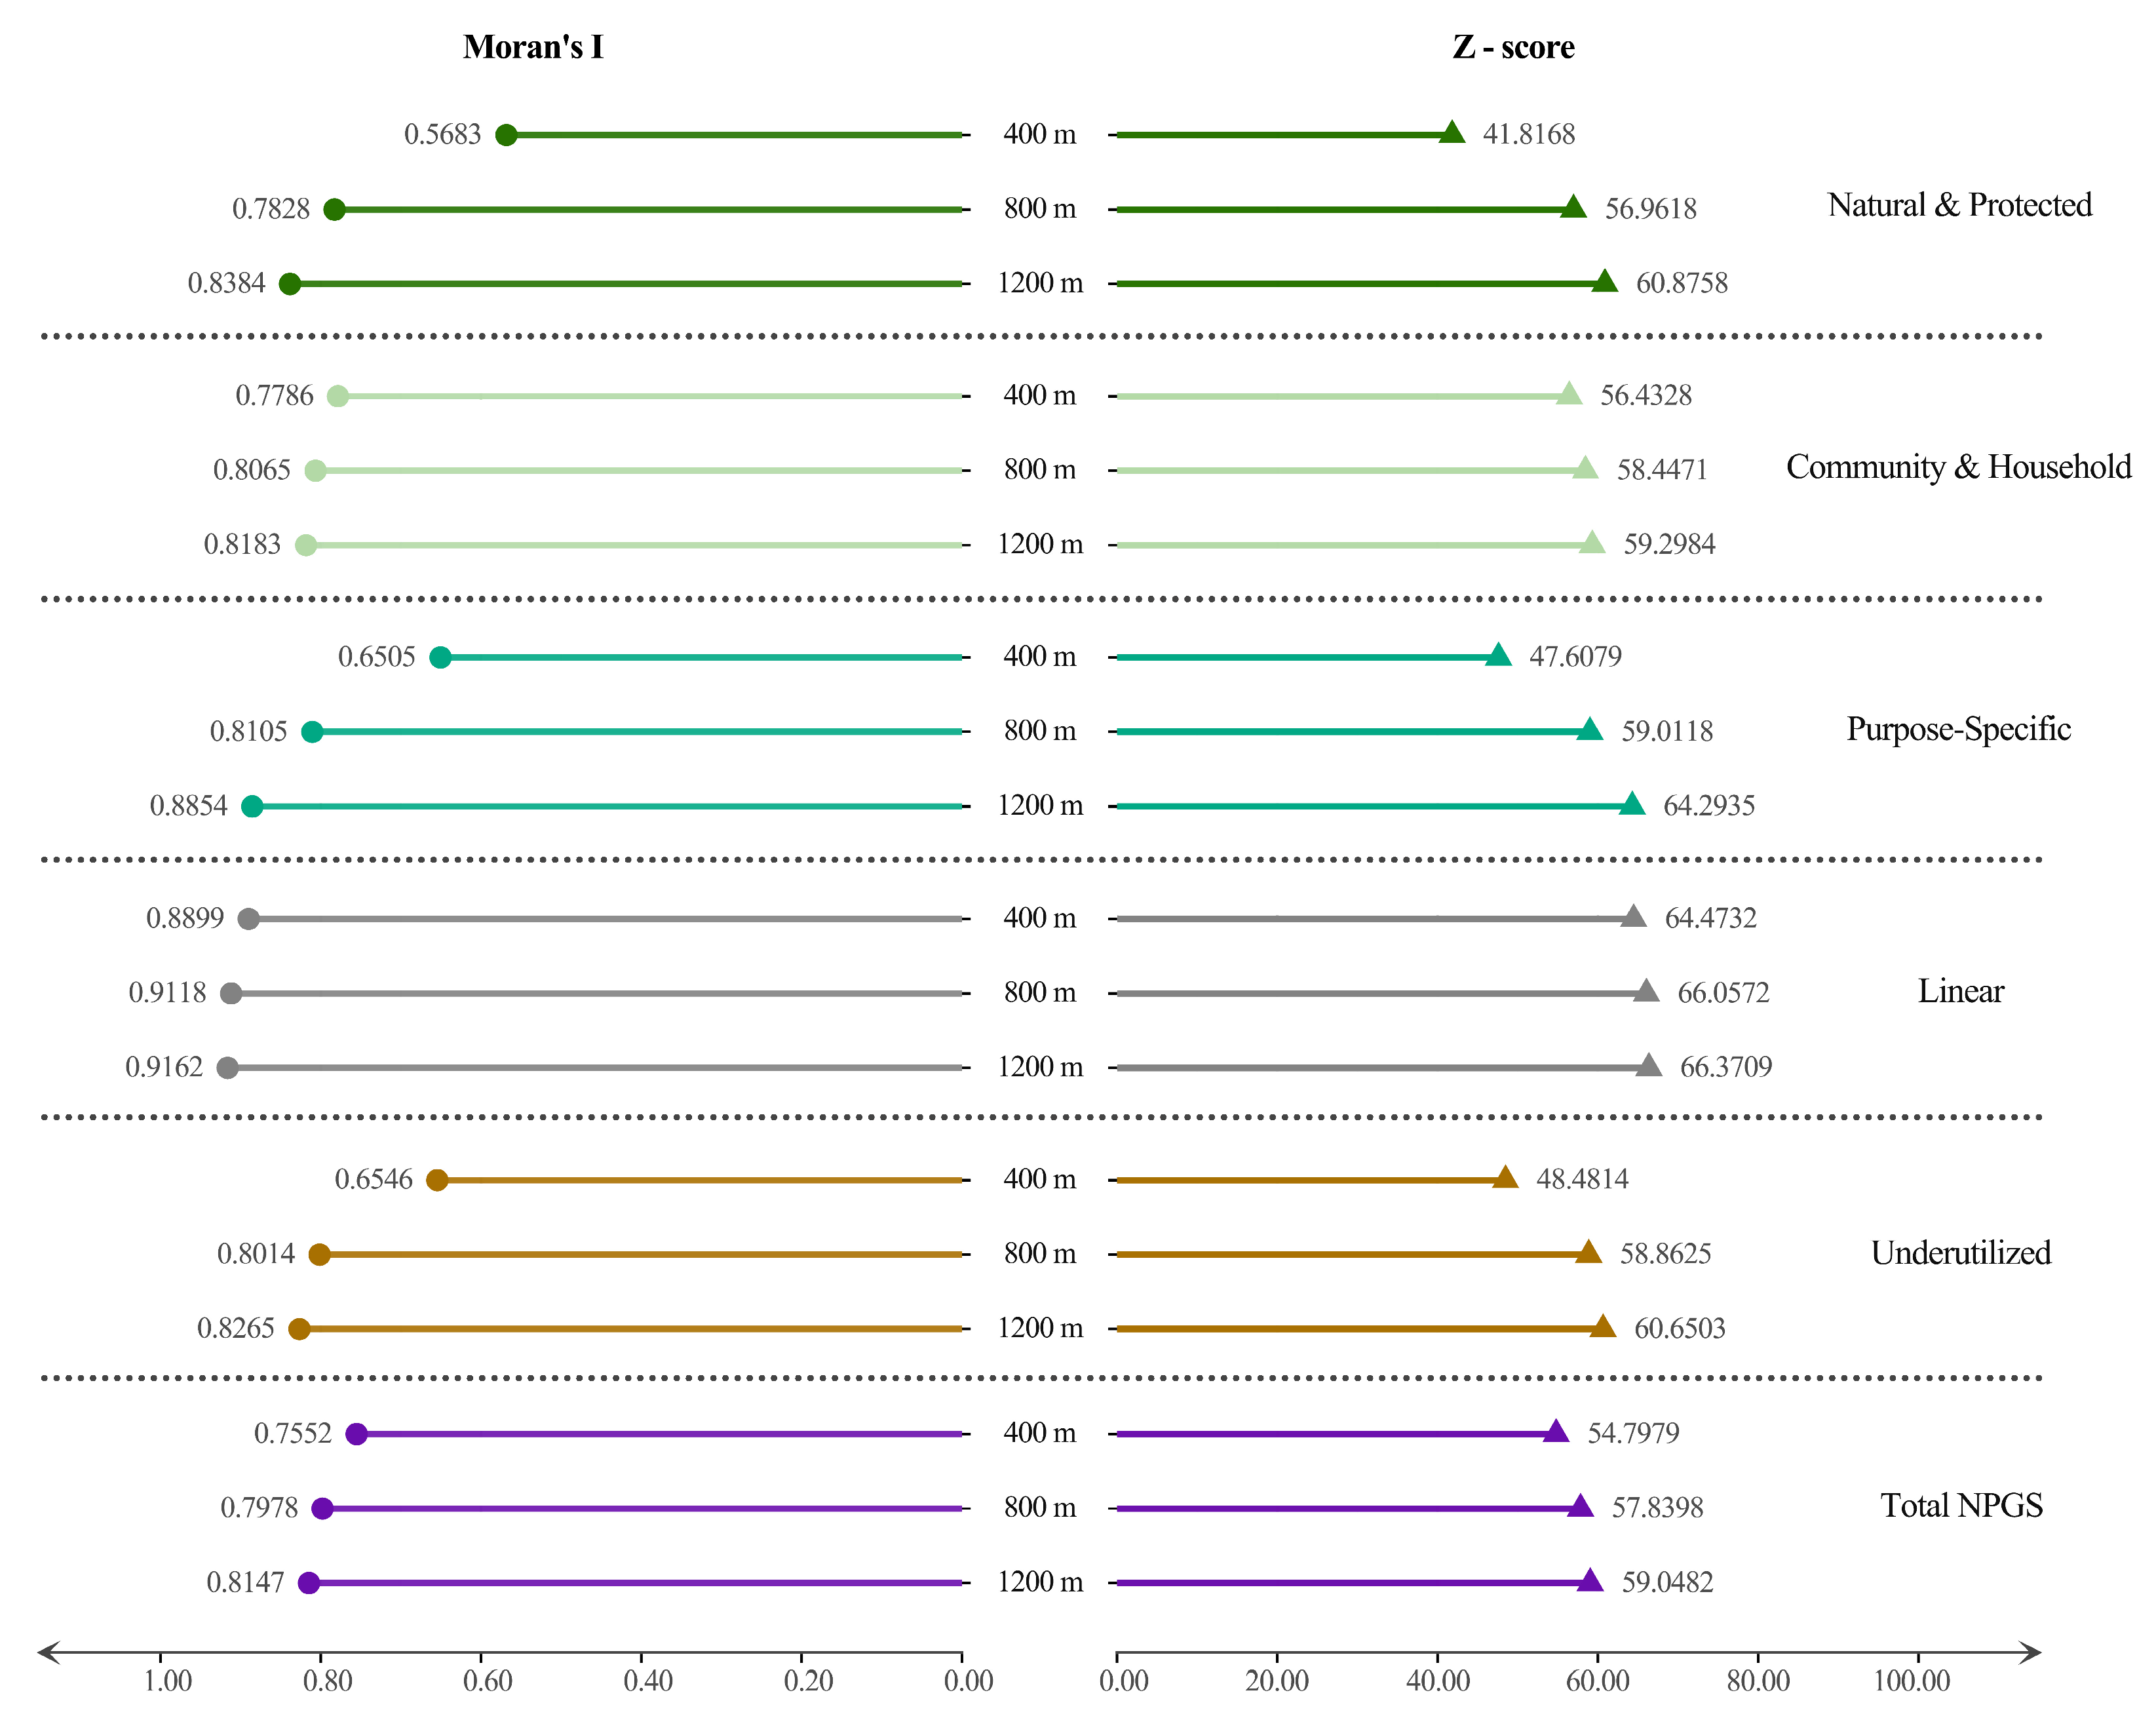
Global Moran’s I analysis demonstrates significant spatial clustering across all NPGS categories in Inner London, with statistically robust Z-scores (41.8168–66.3709) and p-values < 0.001 (Figure 6). Moran’s I values range from 0.5683 to 0.9162, confirming strong positive spatial autocorrelation.
The Linear consistently exhibit the highest spatial clustering intensity, achieving maximum Moran’s I of 0.9162 at 1200 m. Natural and Protected show the weakest clustering at 400 m (Moran’s I = 0.5683) but display progressive strengthening to 0.8384 at 1200 m. Community and Household and total NPGS categories maintain moderate clustering levels, with indices ranging from 0.7786 to 0.8183 across buffer distances.
Purpose-Specific exhibit the most pronounced sensitivity to buffer distance expansion, with Moran’s I increasing by 36% from 400 m (0.6505) to 1200 m (0.8854). Underutilized follow a similar trend, rising from 0.6546 at 400 m to 0.8265 at 1200 m. All categories show intensified spatial clustering as buffer distances extend, with the strongest clustering observed at 1200 m.
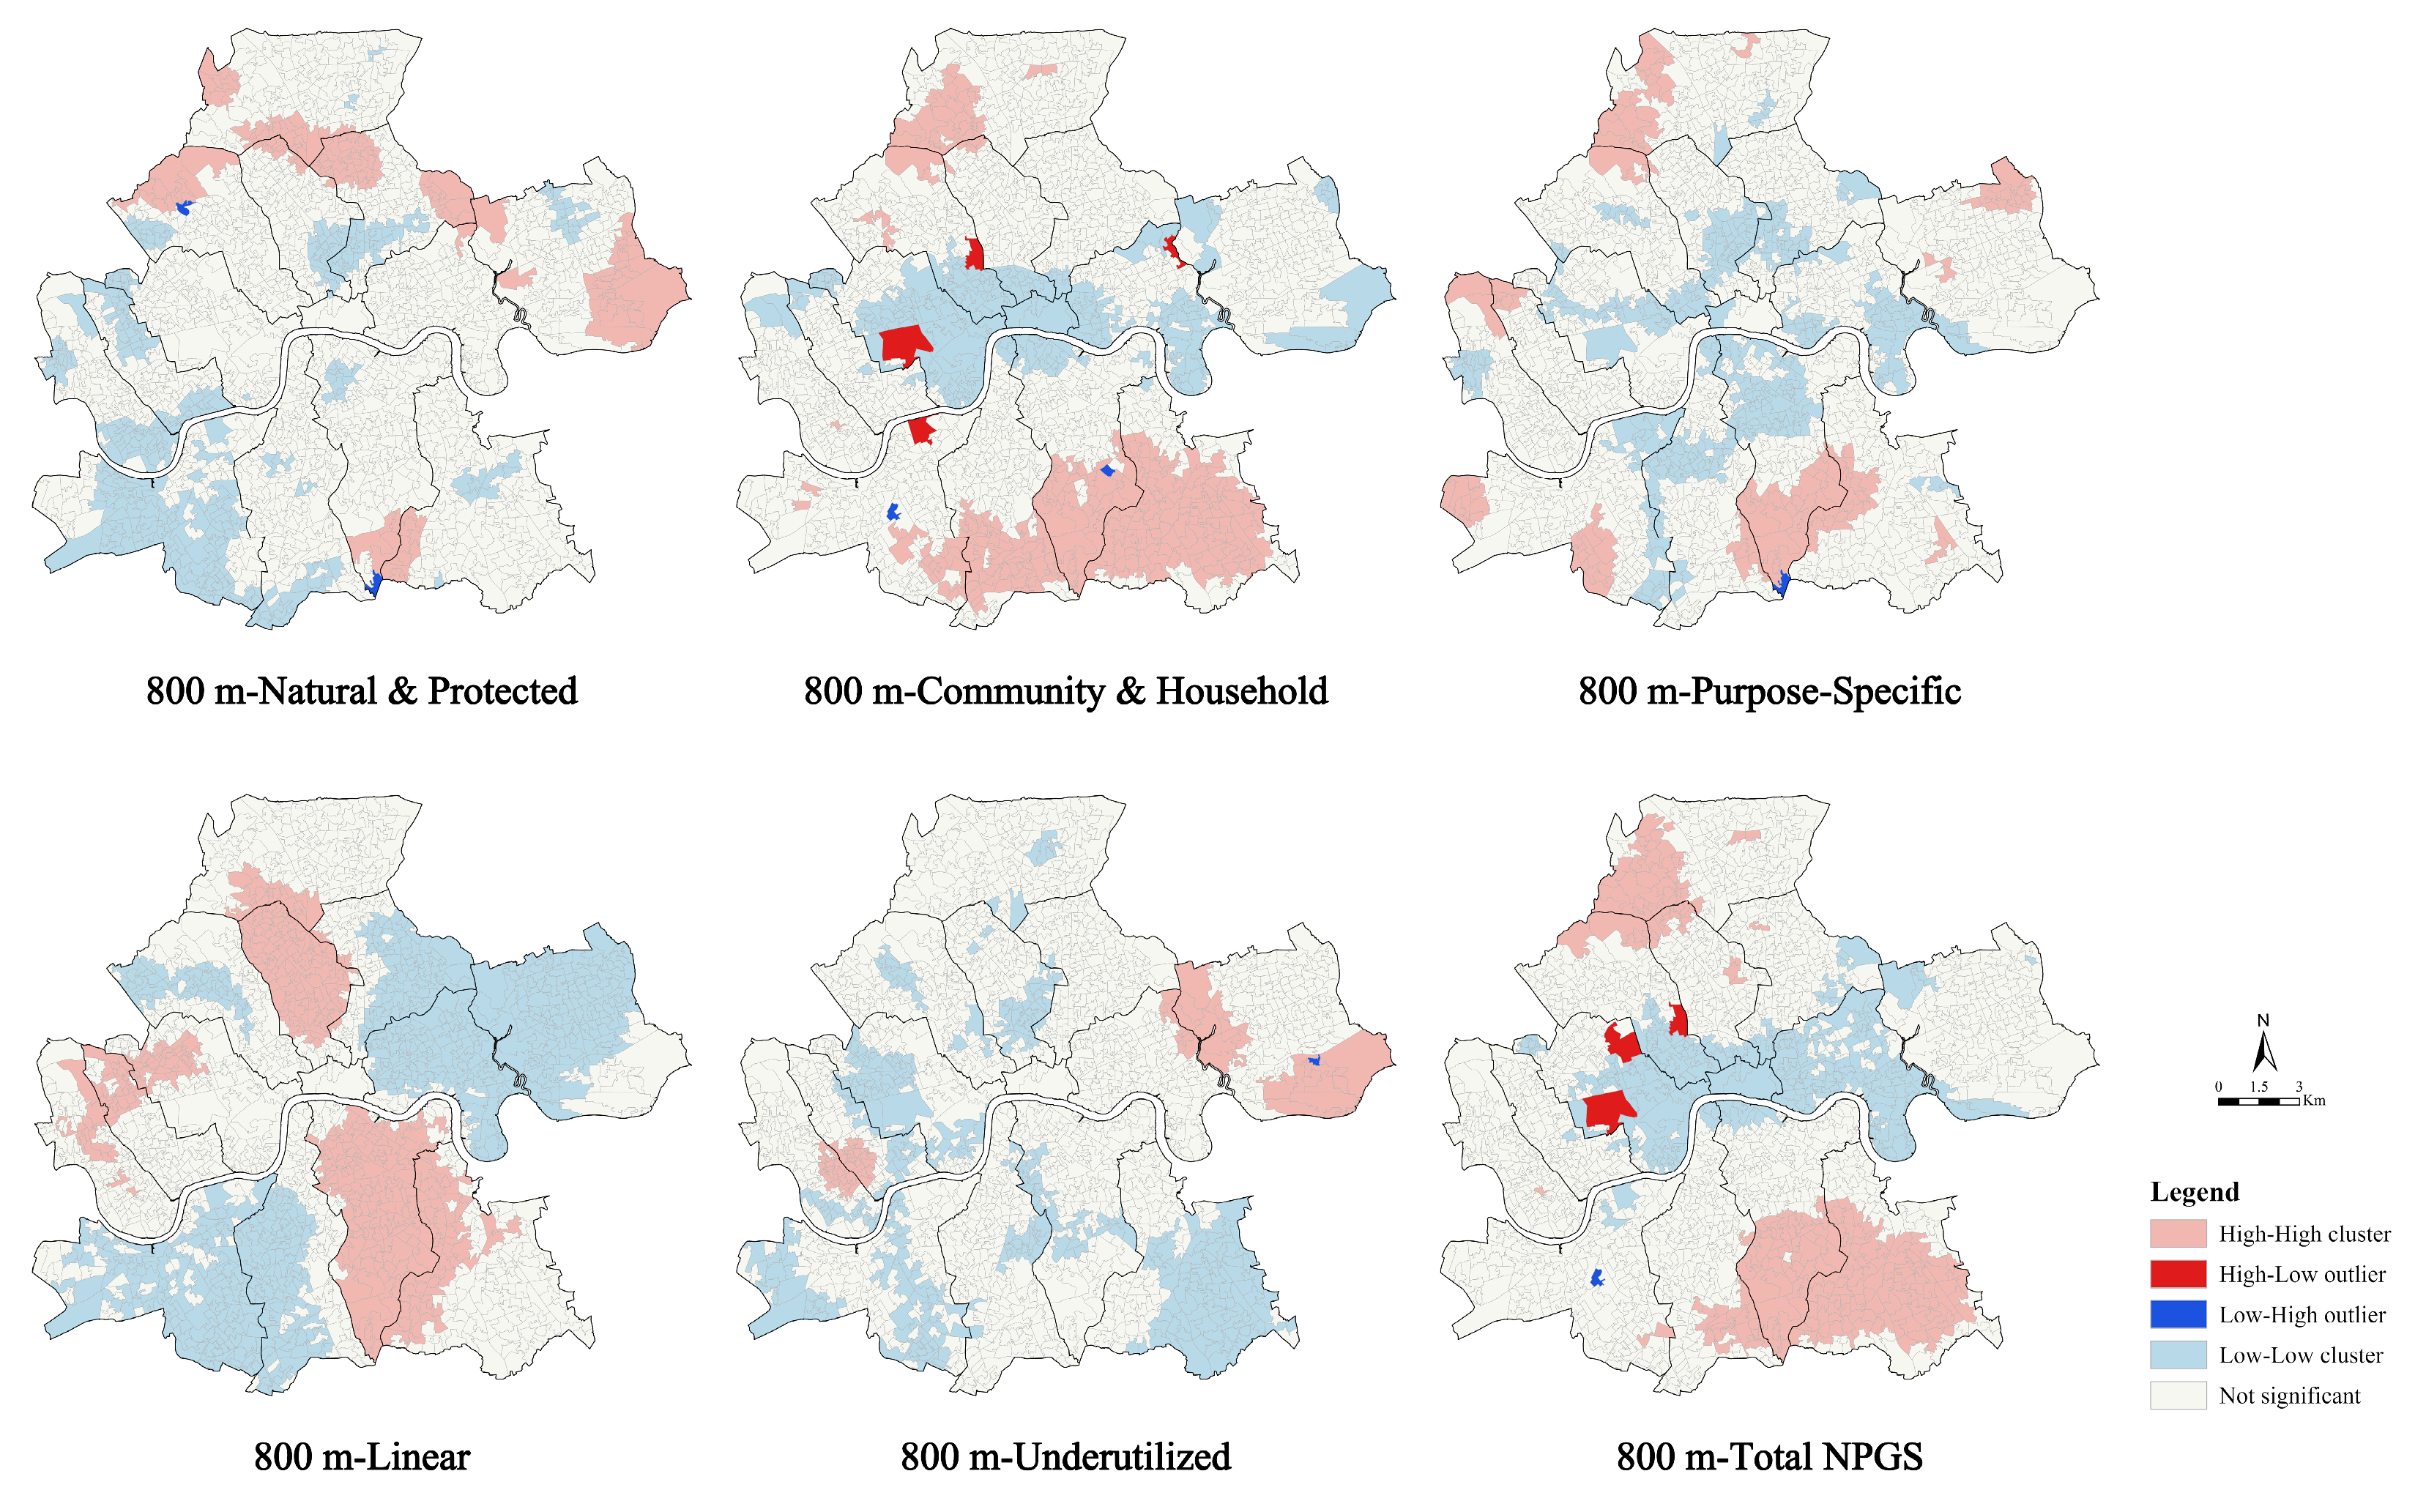
Local Moran’s I analysis further reveals spatial clustering patterns (Figure 7). The spatial autocorrelation intensity generally strengthens with increasing buffer distances, a trend most pronounced in Underutilized. For total NPGS accessibility, high–high clusters predominantly concentrate in southeastern boroughs (Lambeth, Southwark, and Lewisham) and northwestern boroughs (Haringey, Camden, and Islington), while low–low clusters dominate central Thames-north boroughs including Westminster, City of London, and Tower Hamlets, surrounded by high–low spatial outliers.
Natural and Protected exhibit high–high accessibility clusters in the northern borough of Camden and the eastern borough of Newham, in contrast to low–low clusters observed in the southwestern boroughs of Wandsworth and Hammersmith and Fulham. Community and Household mirror the total NPGS distribution pattern, with southeastern/northwestern high–high clusters and central low–low clusters accompanied by peripheral high–low outliers. Purpose-Specific demonstrate distance-sensitive clustering dynamics, transitioning from central high–high clusters to peripheral low–low clusters as buffer distances increase. Linear show concentrated high–high accessibility in the southeastern borough of Southwark and Lewisham, as well as the northwestern borough of Islington. In contrast, low–low clusters are predominantly located in the northeastern boroughs of Tower Hamlets and Newham, and the southwestern borough of Wandsworth. Underutilized initially display limited clustering at 400 m buffers (isolated high–high cluster in Newham), but develop dispersed low–low clusters in Westminster, Wandsworth, and Lewisham as distances increase to 1200 m.

4. Discussion

4.1. Recap of the Main Findings

Our study establishes a typological analytical framework for NPGSs and applies it to Inner London to define and map five distinct typologies. These NPGSs collectively complement parks in forming a more comprehensive urban green infrastructure. Building on this framework, we quantify the accessibility and spatial equity of NPGSs, thereby deepening the understanding of how different forms of non-park greenery contribute to spatial justice within dense urban environments.
While previous research has documented spatial inequities in park provision across London, expanding large-scale parks remains constrained by policy limitations and land costs [90]. In this context, NPGSs demonstrate significant potential due to their dispersed distribution, flexible boundaries, and multi-functional roles in production, ecological protection, infrastructure integration, and habitat restoration [18]. Notably, these spaces play vital roles in microclimate regulation and ecological corridor connectivity [25,27]. Despite their advantages, NPGS management involves diverse stakeholders, with certain sites restricted to specific user groups, thereby limiting universal accessibility [33]. However, NPGSs in Inner London exhibit more equitable spatial distribution and greater proximity to residents compared to parks, which enhances equitable access to their ecosystem services. This inherent advantage underscores the necessity of better integrating these spaces into urban green infrastructure, as they are often overlooked or insufficiently addressed in formal planning and management frameworks.
Accessibility serves as a key index for evaluating green space equity, as walking distance directly reflects spatial proximity, which in turn influences residents’ potential exposure to and benefits from nearby NPGSs [17,62]. The fragmented distribution and constrained service radii of NPGSs justify prioritizing pedestrian accessibility as a critical evaluation metric. This study identifies persistent spatial disparities in NPGS accessibility within walking distances across Inner London, though these inequities progressively diminish as walking distance thresholds increase. These findings align with the UK Government’s Nature Recovery Plan, which mandates equitable 15 min walking access to green–blue infrastructure for all urban residents [91]. Integrating NPGS into urban greening strategies demonstrates the potential to address deficiencies in park provision, offering practical pathways to achieve inclusive access to nature.

4.2. The Role of the NPGS in the Green Infrastructure System

Our analysis reveals that Community and Household exhibit the highest accessibility and spatial equity among the five NPGS types in Inner London. These spaces are the most widely distributed and proximate to residential areas, reflecting their inherent integration with urban housing systems [32]. This finding affirms established evidence of human preference for proximate greenery in residential environments [43]. The existing literature further confirms that Community and Household not only provide ecological benefits comparable to conventional green spaces but also serve as critical hubs for daily activities, social interactions, and neighborhood cohesion [28]. Spatial autocorrelation analysis reveals significant low–low clustering north of the River Thames, alongside the presence of high–low outliers. Land use patterns suggest two contributing factors: proximity to large-scale parks and historical urbanization characterized by high-density building and population, but limited residential land allocation. In contrast, Underutilized demonstrate the lowest accessibility and most severe inequality, with pervasive low–low clusters in central boroughs and high–high clusters confined to suburban areas. This spatial disparity suggests their exclusion from urban planning priorities, aligning with documented trends of marginalizing IGSs [55]. Strategic utilization of Underutilized can significantly enhance urban green coverage while avoiding land-acquisition costs [54].
These spatial disparities indicate broader structural differences among NPGS types, which can largely be attributed to planning policies, land-ownership patterns, and socioeconomic context. Community and Household are typically located on residential or privately managed land, ensuring stable maintenance and accessibility [32,43]. In contrast, Underutilized are often constrained by fragmented ownership and complex planning regulations, which hinder their redevelopment into functional green areas, though they retain substantial potential for ecological restoration and community renewal [53,54,55]. Natural and Protected and Purpose-Specific are mainly distributed along the periphery of Inner London, where planning and conservation regulations restrict redevelopment and limit public access despite their high ecological value [31,45]. Meanwhile, Linear play a crucial role in maintaining ecological connectivity [34], though their uneven distribution across boroughs contributes to accessibility disparities. Similar mechanisms have been observed in other cities such as Chicago and Barcelona, where institutional ownership and planning frameworks strongly shape NPGS equity patterns [54,92]. These insights highlight the importance of considering governance and socioeconomic structures when addressing NPGS equity and integrating diverse green spaces into future planning frameworks [18].
Current policies focus predominantly on parks, overlooking the complementary ecological, climatic, and social contributions of NPGSs, which exhibit great functional diversity and are managed by multiple agencies [36,93]. Integrating NPGSs into statutory planning optimizes the urban green network, enhances access equity, and strengthens the overall resilience of green infrastructure. Improving UGS equity through NPGSs directly contributes to the achievement of the SDGs, specifically Goal 11 on sustainable cities and communities [65]. The attainment of these goals relies on the ecological and social functions of NPGSs and their integration within broader green infrastructure systems. In high-density urban environments, NPGSs serve as a cost-effective lever for meeting interconnected sustainability targets and promoting environmental justice.

4.3. The Provision of NPGSs and Their Implications

Our analysis identifies a significant core–periphery differentiation in NPGS distribution across Inner London. Central boroughs north of the River Thames demonstrate the most severe NPGS supply–demand mismatch [90]. In contrast, peripheral boroughs enhance local well-being through abundant community gardens and private green infrastructures. Central populations primarily depend on fragmented street tree corridors and spatially constrained functional green spaces, worsening limited adaptive capacity against heat stress and air pollution while perpetuating health disparities [61]. These patterns necessitate context-specific management strategies aligned with local resource availability.
However, spatial proximity alone does not guarantee residents’ access to the benefits of NPGSs [17]. Actual use depends on quality factors, including maintenance standards, visual appeal, and biodiversity [88,89]. It also relies on a sense of safety and social inclusion. When green spaces are considered welcoming and secure, they are more likely to be used regularly [94,95]. Conversely, poorly maintained or socially unsafe spaces often remain underused, even if they are within walking distance [7,8]. For example, in Westminster, although street trees increase shade coverage, narrow pavements and traffic noise can limit their restorative function. In contrast, multi-functional green hubs in Newham improve perceived accessibility through participatory governance. Planners should integrate accessibility and quality assessments while incorporating participatory mapping and perception surveys to effectively capture residents’ sense of safety and belonging [96,97,98].
A broader environmental justice framework requires going beyond distributive equity to also address procedural and outcome equity [92,99]. Distributive equity refers to the fair spatial allocation of green resources [100]. Procedural equity ensures that all social groups have a voice in green space design and management [101]. Outcome equity evaluates whether improvements lead to measurable health and social benefits for marginalized populations [102]. Consistent with Schlosberg’s tripartite model, NPGS planning should incorporate both procedural and outcome dimensions [103]. For instance, off-peak garden sharing may reduce spatial inequalities, but without secure legal access, it can unintentionally exclude renters. Future frameworks require integration of geospatial data with perceptual indicators to comprehensively identify and resolve justice gaps.
Our study highlights the value of recognizing NPGSs as a separate planning category. Although traditional UGS planning has often emphasized large parks, recent studies have increasingly recognized the value of dispersed, small-scale green spaces, such as roadside vegetation, vacant green lots, and informal community greens [52,63,93]. NPGSs are not just supplementary spaces but form an integral layer of urban green infrastructure that improves accessibility [30,62]. In dense or underserved areas, they can be transformed into micro-parks, community gardens, or green corridors to build urban resilience and advance spatial equity [42,55]. By identifying and categorizing NPGSs, our framework offers a transferable method for cities where adding large parks is no longer feasible. The approach is relevant to cities like New York, Tokyo, and Paris, where land availability is limited but fragmented green assets exist. Adaptive reuse of NPGSs through temporary or modular greening offers an incremental pathway for implementation without major land-acquisition costs [54,57]. The framework is also applicable to rapidly urbanizing Chinese cities such as Xi’an, Shenyang, and Harbin, which face comparable challenges of spatial inequality and compact urban form. Planning for usability—not just availability—is key. Prioritizing how people actually access and engage with NPGSs can support more equitable green space distribution and contribute directly to environmental justice goals [102].

4.4. Limitations and Future Study

This study has several limitations that warrant consideration. First, the accuracy of linear green features, such as street tree corridors, may be affected by incomplete or outdated point data due to dataset limitations. The remote sensing platforms currently in use may also lack the spatial or spectral resolution required to capture fine-scale or vertically structured NPGS types [66], such as green roofs or facade vegetation. Future research should incorporate advanced technologies, including LiDAR and hyperspectral imaging, to improve the detection and quantification of vertical and microscale green infrastructure [104,105]. Second, the evaluation framework focuses primarily on spatial accessibility and does not reflect the esthetic quality or experiential value of NPGSs. This may lead to an overestimation of their functional relevance in practice. A more comprehensive understanding could be achieved by integrating user perception surveys, observational fieldwork, and behavioral data to assess how residents interact with different types of NPGS and what attributes drive their use [62]. Third, although spatial inequalities in NPGS provision are evident, the socioeconomic mechanisms underlying these patterns remain underexplored. In cities like London, where factors such as ethnicity, income, and education intersect in complex ways, their influence on NPGS equity is not fully understood. Investigating these drivers through spatially explicit models—such as geographically weighted regression combined with machine learning—could reveal context-specific relationships between NPGS access and social disadvantages [106,107]. These approaches would strengthen the evidence base for more equitable and adaptive UGS planning by aligning technical evaluations with social realities and community needs.

5. Conclusions

This study takes Inner London as a case study to analyze NPGSs from the perspectives of classification, accessibility, and spatial equity. First, this study defines NPGSs using multiple open access datasets and classifies them into five categories: Natural and Protected, Community and Household, Purpose-Specific, Linear, and Underutilized. The results reveal a spatially uneven distribution of NPGSs in Inner London, with a clear core–periphery differentiation, where central boroughs experience significant shortages. Second, this study evaluates NPGS accessibility using a multi-ring buffer based on walking distance. It further assesses equity through Lorenz curves and Gini coefficients, and identifies spatial clustering patterns using spatial autocorrelation. The analysis highlights significant spatial and typological disparities: Community and Household tend to be more equitably distributed, whereas Underutilized demonstrate marked inequity. The spatial patterns of hot spots and cold spots underscore localized inequalities in NPGS accessibility across boroughs. Third, this study proposes that underutilized NPGSs, especially those located in central boroughs, could be strategically repurposed into micro-parks, community gardens, or linear green corridors, offering low-cost opportunities to reduce accessibility disparities. Integrating these interventions into existing planning frameworks would directly support SDG 11, which emphasizes universal access to safe, inclusive, and accessible green and public spaces. In conclusion, the analytical framework provides a transferable approach for optimizing NPGS equity in other high-density cities where large-scale park expansion is limited, offering planners practical guidance for developing greener, fairer, and more resilient urban environments.

Supplementary Materials

The following supporting information can be downloaded at: https://www.mdpi.com/article/10.3390/su17209284/s1, Figure S1. Local Moran’s I analysis of Natural & Protected NPGS at different buffer distances (400 m, 800 m, and 1200 m); Figure S2. Local Moran’s I analysis of Community & Household NPGS at different buffer distances (400 m, 800 m, and 1200 m); Figure S3. Local Moran’s I analysis of Purpose-Specific NPGS at different buffer distances (400 m, 800 m, and 1200 m); Figure S4. Local Moran’s I analysis of Linear NPGS at different buffer distances (400 m, 800 m, and 1200 m); Figure S5. Local Moran’s I analysis of Underutilized NPGS at different buffer distances (400 m, 800 m, and 1200 m); Figure S6 Local Moran’s I analysis of Total NPGS at different buffer distances (400 m, 800 m, and 1200 m).

Author Contributions

Conceptualization, T.W. and H.H.; data curation, T.W., X.D. and G.F.; formal analysis, T.W.; methodology, T.W. and H.H.; project administration, G.F. and H.H.; resources, T.W. and G.F.; software, T.W.; supervision, G.F. and H.H.; validation, X.D. and G.F.; visualization, T.W.; writing—original draft preparation, T.W. and X.D.; writing—review and editing, T.W., G.F. and H.H. All authors have read and agreed to the published version of the manuscript.

Funding

This research received no external funding.

Institutional Review Board Statement

Not applicable.

Informed Consent Statement

Not applicable.

Data Availability Statement

Dataset available on request from the authors.

Acknowledgments

During the preparation of this manuscript, the authors used ChatGPT (OpenAI, GPT-5, 2025) for the purpose of language polishing. The authors have reviewed and edited the output and take full responsibility for the content of this publication.

Conflicts of Interest

The authors declare no conflicts of interest.

References

  1. Aerts, R.; Honnay, O.; Van Nieuwenhuyse, A. Biodiversity and Human Health: Mechanisms and Evidence of the Positive Health Effects of Diversity in Nature and Green Spaces. Br. Med. Bull. 2018, 127, 5–22. [Google Scholar] [CrossRef]
  2. Castelli, K.R.; Silva, A.M.; Dunning, J.B. Improving the Biodiversity in Urban Green Spaces: A Nature Based Approach. Ecol. Eng. 2021, 173, 106398. [Google Scholar] [CrossRef]
  3. Diener, A.; Mudu, P. How Can Vegetation Protect Us from Air Pollution? A Critical Review on Green Spaces’ Mitigation Abilities for Air-Borne Particles from a Public Health Perspective—With Implications for Urban Planning. Sci. Total Environ. 2021, 796, 148605. [Google Scholar] [CrossRef]
  4. Li, Y.; Wang, S.; Zhang, S.; Wei, M.; Chen, Y.; Huang, X.; Zhou, R. The Creation of Multi-Level Urban Ecological Cooling Network to Alleviate the Urban Heat Island Effect. Sustain. Cities Soc. 2024, 114, 105786. [Google Scholar] [CrossRef]
  5. Selmi, W.; Weber, C.; Rivière, E.; Blond, N.; Mehdi, L.; Nowak, D. Air Pollution Removal by Trees in Public Green Spaces in Strasbourg City, France. Urban For. Urban Green. 2016, 17, 192–201. [Google Scholar] [CrossRef]
  6. Wang, T.; Hu, H. Mapping Urban Heat Island Networks Using a Landscape Connectivity Approach: A Case Study of Nanjing. Sustain. Cities Soc. 2025, 132, 106800. [Google Scholar] [CrossRef]
  7. Ha, J.; Kim, H.J.; With, K.A. Urban Green Space Alone Is Not Enough: A Landscape Analysis Linking the Spatial Distribution of Urban Green Space to Mental Health in the City of Chicago. Landsc. Urban Plan. 2022, 218, 104309. [Google Scholar] [CrossRef]
  8. Reyes-Riveros, R.; Altamirano, A.; De La Barrera, F.; Rozas-Vásquez, D.; Vieli, L.; Meli, P. Linking Public Urban Green Spaces and Human Well-Being: A Systematic Review. Urban For. Urban Green. 2021, 61, 127105. [Google Scholar] [CrossRef]
  9. Peters, K.; Elands, B.; Buijs, A. Social Interactions in Urban Parks: Stimulating Social Cohesion? Urban For. Urban Green. 2010, 9, 93–100. [Google Scholar] [CrossRef]
  10. Collins, R.M.; Smith, D.; Ogutu, B.O.; Brown, K.A.; Eigenbrod, F.; Spake, R. The Relative Effects of Access to Public Greenspace and Private Gardens on Mental Health. Landsc. Urban Plan. 2023, 240, 104902. [Google Scholar] [CrossRef]
  11. Chalmin-Pui, L.S.; Griffiths, A.; Roe, J.; Heaton, T.; Cameron, R. Why Garden?—Attitudes and the Perceived Health Benefits of Home Gardening. Cities 2021, 112, 103118. [Google Scholar] [CrossRef]
  12. Chen, W.Y.; Jim, C.Y. Cost–Benefit Analysis of the Leisure Value of Urban Greening in the New Chinese City of Zhuhai. Cities 2008, 25, 298–309. [Google Scholar] [CrossRef]
  13. Zhang, H.; Chen, B.; Sun, Z.; Bao, Z. Landscape Perception and Recreation Needs in Urban Green Space in Fuyang, Hangzhou, China. Urban For. Urban Green. 2013, 12, 44–52. [Google Scholar] [CrossRef]
  14. Stern, M.; Lester, T.W. Does Local Ownership of Vacant Land Reduce Crime? J. Am. Plan. Assoc. 2021, 87, 73–84. [Google Scholar] [CrossRef]
  15. Ayala-Azcárraga, C.; Diaz, D.; Zambrano, L. Characteristics of Urban Parks and Their Relation to User Well-Being. Landsc. Urban Plan. 2019, 189, 27–35. [Google Scholar] [CrossRef]
  16. Ward Thompson, C.; Roe, J.; Aspinall, P.; Mitchell, R.; Clow, A.; Miller, D. More Green Space Is Linked to Less Stress in Deprived Communities: Evidence from Salivary Cortisol Patterns. Landsc. Urban Plan. 2012, 105, 221–229. [Google Scholar] [CrossRef]
  17. Wu, J.; Peng, Y.; Liu, P.; Weng, Y.; Lin, J. Is the Green Inequality Overestimated? Quality Reevaluation of Green Space Accessibility. Cities 2022, 130, 103871. [Google Scholar] [CrossRef]
  18. Biernacka, M.; Kronenberg, J.; Łaszkiewicz, E.; Czembrowski, P.; Amini Parsa, V.; Sikorska, D. Beyond Urban Parks: Mapping Informal Green Spaces in an Urban–Peri-Urban Gradient. Land Use Policy 2023, 131, 106746. [Google Scholar] [CrossRef]
  19. Williams, T.G.; Logan, T.M.; Zuo, C.T.; Liberman, K.D.; Guikema, S.D. Parks and Safety: A Comparative Study of Green Space Access and Inequity in Five US Cities. Landsc. Urban Plan. 2020, 201, 103841. [Google Scholar] [CrossRef]
  20. Tang, Q.; Cao, J.; Yin, C.; Cheng, J. Examining the Nonlinear Relationships between Park Attributes and Satisfaction with Pocket Parks in Chengdu. Urban For. Urban Green. 2024, 101, 128548. [Google Scholar] [CrossRef]
  21. Chu, Z.; Li, S.; Li, T.; Qian, H.; Liu, C.; Yan, Z. Numerical Simulation of Layout and Landscape Elements on the Thermal Environment of Urban Squares. Ecol. Inform. 2024, 82, 102770. [Google Scholar] [CrossRef]
  22. Mahmoudi Farahani, L.; Maller, C. Investigating the Benefits of ‘Leftover’ Places: Residents’ Use and Perceptions of an Informal Greenspace in Melbourne. Urban For. Urban Green. 2019, 41, 292–302. [Google Scholar] [CrossRef]
  23. Wang, Y.; Akbari, H. The Effects of Street Tree Planting on Urban Heat Island Mitigation in Montreal. Sustain. Cities Soc. 2016, 27, 122–128. [Google Scholar] [CrossRef]
  24. Stanford, H.R.; Hurley, J.; Garrard, G.E.; Kirk, H. The Contribution of Informal Green Space to Urban Biodiversity: A City-Scale Assessment Using Crowdsourced Survey Data. Urban Ecosyst. 2024, 28, 43. [Google Scholar] [CrossRef]
  25. Erlwein, S.; Zölch, T.; Pauleit, S. Regulating the Microclimate with Urban Green in Densifiying Cities: Joint Assessment on Two Scales. Build. Environ. 2021, 205, 108233. [Google Scholar] [CrossRef]
  26. Wilson, B.; Neale, C.; Roe, J. Urban Green Space Access, Social Cohesion, and Mental Health Outcomes before and during COVID-19. Cities 2024, 152, 105173. [Google Scholar] [CrossRef]
  27. Zhang, Q.; Tang, F.; Chen, H.; Li, F.; Chen, Z.; Jiao, Y. Assessing Landscape Fragmentation and Ecological Connectivity to Support Regional Spatial Planning: A Case Study of Jiangsu Province, China. Ecol. Indic. 2024, 162, 112063. [Google Scholar] [CrossRef]
  28. McClymont, K.; Sinnett, D. Planning Cemeteries: Their Potential Contribution to Green Infrastructure and Ecosystem Services. Front. Sustain. Cities 2021, 3, 789925. [Google Scholar] [CrossRef]
  29. Yang, B.; Wang, Z.; Zou, L.; Zou, L.; Zhang, H. Exploring the Eco-Efficiency of Cultivated Land Utilization and Its Influencing Factors in China’s Yangtze River Economic Belt, 2001–2018. J. Environ. Manag. 2021, 294, 112939. [Google Scholar] [CrossRef]
  30. Sikorska, D.; Łaszkiewicz, E.; Krauze, K.; Sikorski, P. The Role of Informal Green Spaces in Reducing Inequalities in Urban Green Space Availability to Children and Seniors. Environ. Sci. Policy 2020, 108, 144–154. [Google Scholar] [CrossRef]
  31. Battisti, L.; Giacco, G.; Moraca, M.; Pettenati, G.; Dansero, E.; Larcher, F. Spatializing Urban Forests as Nature-Based Solutions: A Methodological Proposal. Cities 2024, 144, 104629. [Google Scholar] [CrossRef]
  32. Aamodt, G.; Nordh, H.; Nordbø, E.C.A. Relationships between Socio-Demographic/Socio-Economic Characteristics and Neighborhood Green Space in Four Nordic Municipalities—Results from NORDGREEN. Urban For. Urban Green. 2023, 82, 127894. [Google Scholar] [CrossRef]
  33. Baró, F.; Camacho, D.A.; Pérez Del Pulgar, C.; Triguero-Mas, M.; Anguelovski, I. School Greening: Right or Privilege? Examining Urban Nature within and around Primary Schools through an Equity Lens. Landsc. Urban Plan. 2021, 208, 104019. [Google Scholar] [CrossRef]
  34. Han, Y.; Zhong, T.; Yeh, A.G.O.; Zhong, X.; Chen, M.; Lü, G. Mapping Seasonal Changes of Street Greenery Using Multi-Temporal Street-View Images. Sustain. Cities Soc. 2023, 92, 104498. [Google Scholar] [CrossRef]
  35. Preston, P.D.; Dunk, R.M.; Smith, G.R.; Cavan, G. Not All Brownfields Are Equal: A Typological Assessment Reveals Hidden Green Space in the City. Landsc. Urban Plan. 2023, 229, 104590. [Google Scholar] [CrossRef]
  36. Stanford, H.R. What to Do with the Spaces in between? The Social-Ecological Value of Informal Green Space and the Challenge of Planning the Unplanned. Landsc. Urban Plan. 2025, 259, 105372. [Google Scholar] [CrossRef]
  37. Stanford, H.R.; Hurley, J.; Garrard, G.E.; Kirk, H. Finding the Forgotten Spaces: Using a Social-Ecological Framework to Map Informal Green Space in Melbourne, Australia. Land Use Policy 2024, 141, 107114. [Google Scholar] [CrossRef]
  38. Xu, Y.; Chen, X.; Ding, L.; Kong, C.-H. Allelopathy and Allelochemicals in Grasslands and Forests. Forests 2023, 14, 562. [Google Scholar] [CrossRef]
  39. Panduro, T.E.; Veie, K.L. Classification and Valuation of Urban Green Spaces—A Hedonic House Price Valuation. Landsc. Urban Plan. 2013, 120, 119–128. [Google Scholar] [CrossRef]
  40. Yan, Y.; Zhao, C.; Xie, Y.; Jiang, X. Nature Reserves and Reforestation Expend the Potential Habitats for Endangered Plants: A Model Study in Cangshan, China. J. Nat. Conserv. 2024, 77, 126533. [Google Scholar] [CrossRef]
  41. Limerick, S.; Hawes, J.K.; Gounaridis, D.; Cohen, N.; Newell, J.P. Community Gardens and the 15-Minute City: Scenario Analysis of Garden Access in New York City. Urban For. Urban Green. 2023, 89, 128107. [Google Scholar] [CrossRef]
  42. Maćkiewicz, B.; Asuero, R.P. Public versus Private: Juxtaposing Urban Allotment Gardens as Multifunctional Nature-Based Solutions. Insights from Seville. Urban For. Urban Green. 2021, 65, 127309. [Google Scholar] [CrossRef]
  43. Wen, Z.; Zhang, S.; Yang, Y.; Zheng, X.; Song, Z.; Zhou, Y.; Hao, J. How Does Enclosed Private Residential Green Space Impact Accessibility Equity in Urban Regions? A Case Study in Shenzhen, China. Urban For. Urban Green. 2023, 85, 127968. [Google Scholar] [CrossRef]
  44. Milbourne, P. Growing Public Spaces in the City: Community Gardening and the Making of New Urban Environments of Publicness. Urban Stud. 2021, 58, 2901–2919. [Google Scholar] [CrossRef]
  45. Evans, D.L.; Falagán, N.; Hardman, C.A.; Kourmpetli, S.; Liu, L.; Mead, B.R.; Davies, J.A.C. Ecosystem Service Delivery by Urban Agriculture and Green Infrastructure—A Systematic Review. Ecosyst. Serv. 2022, 54, 101405. [Google Scholar] [CrossRef]
  46. Sia, A.; Tan, P.Y.; Er, K.B.H. The Contributions of Urban Horticulture to Cities’ Liveability and Resilience: Insights from Singapore. Plants People Planet 2023, 5, 828–841. [Google Scholar] [CrossRef]
  47. Cervinka, R.; Röderer, K.; Hämmerle, I. Evaluation of Hospital Gardens and Implications for Design: Benefits from Environmental Psychology for Architecture and Landscape Planning. J. Archit. Plan. Res. 2014, 31, 43–56. Available online: http://www.jstor.org/stable/43031023 (accessed on 13 September 2025).
  48. Bisgrove, D. Zooscape Ecology: A Conceptual Analysis of Zoos and Landscape Ecology. Landsc. Ecol. 2022, 37, 1733–1745. [Google Scholar] [CrossRef] [PubMed]
  49. Hu, Y. Role of botanical gardens in enhancing urban plant diversity: A case study of shanghai chenshan botanical garden. Landsc. Archit. 2023, 30, 40–45. [Google Scholar] [CrossRef]
  50. Nordh, H.; Wingren, C.; Uteng, T.P.; Knapskog, M. Disrespectful or Socially Acceptable?—A Nordic Case Study of Cemeteries as Recreational Landscapes. Landsc. Urban Plan. 2023, 231, 104645. [Google Scholar] [CrossRef]
  51. Lin, J.; Wang, Q.; Huang, B. Street Trees and Crime: What Characteristics of Trees and Streetscapes Matter. Urban For. Urban Green. 2021, 65, 127366. [Google Scholar] [CrossRef]
  52. Rupprecht, C.D.D.; Byrne, J.A. Informal Urban Greenspace: A Typology and Trilingual Systematic Review of Its Role for Urban Residents and Trends in the Literature. Urban For. Urban Green. 2014, 13, 597–611. [Google Scholar] [CrossRef]
  53. Merwin, L.; Umek, L.; Anastasio, A.E. Urban Post-Industrial Landscapes Have Unrealized Ecological Potential. Restor. Ecol. 2022, 30, e13643. [Google Scholar] [CrossRef]
  54. Rigolon, A.; Banerjee, D.; Gobster, P.; Hadavi, S.; Stewart, W. Transferring Vacant Lots to Private Ownership Improves Care and Empowers Residents: Evidence from Chicago. J. Am. Plan. Assoc. 2021, 87, 570–584. [Google Scholar] [CrossRef]
  55. Escolà-Gascón, Á.; Dagnall, N.; Drinkwater, K.; Denovan, A. Abandoned vs. Regenerated Places: Evidence of Five Social Impacts That Improve Urban Planning. Cities 2024, 146, 104739. [Google Scholar] [CrossRef]
  56. Guo, P.; Yu, F.; Ren, Y.; Liu, D.; Li, J.; Ouyang, Z.; Wang, X. Response of Ruderal Species Diversity to an Urban Environment: Implications for Conservation and Management. Int. J. Environ. Res. Public Health 2018, 15, 2832. [Google Scholar] [CrossRef]
  57. Sanches, P.M.; Mesquita Pellegrino, P.R. Greening Potential of Derelict and Vacant Lands in Urban Areas. Urban For. Urban Green. 2016, 19, 128–139. [Google Scholar] [CrossRef]
  58. Garrison, J.D. Environmental Justice in Theory and Practice: Measuring the Equity Outcomes of Los Angeles and New York’s “Million Trees” Campaigns. J. Plan. Educ. Res. 2021, 41, 6–17. [Google Scholar] [CrossRef]
  59. Rigolon, A.; Németh, J. Green Gentrification or ‘Just Green Enough’: Do Park Location, Size and Function Affect Whether a Place Gentrifies or Not? Urban Stud. 2020, 57, 402–420. [Google Scholar] [CrossRef]
  60. Bowen, W. An Analytical Review of Environmental Justice Research: What Do We Really Know? Environ. Manag. 2002, 29, 3–15. [Google Scholar] [CrossRef]
  61. Ren, Z.; Zhao, H.; Fu, Y.; Xiao, L.; Dong, Y. Effects of Urban Street Trees on Human Thermal Comfort and Physiological Indices: A Case Study in Changchun City, China. J. For. Res. 2022, 33, 911–922. [Google Scholar] [CrossRef]
  62. Ke, X.; Huang, D.; Zhou, T.; Men, H. Contribution of Non-Park Green Space to the Equity of Urban Green Space Accessibility. Ecol. Indic. 2023, 146, 109855. [Google Scholar] [CrossRef]
  63. Sikorski, P.; Gawryszewska, B.; Sikorska, D.; Chormański, J.; Schwerk, A.; Jojczyk, A.; Ciężkowski, W.; Archiciński, P.; Łepkowski, M.; Dymitryszyn, I.; et al. The Value of Doing Nothing—How Informal Green Spaces Can Provide Comparable Ecosystem Services to Cultivated Urban Parks. Ecosyst. Serv. 2021, 50, 101339. [Google Scholar] [CrossRef]
  64. Luo, W.; Wang, F. Measures of Spatial Accessibility to Health Care in a GIS Environment: Synthesis and a Case Study in the Chicago Region. Environ. Plan. B Plan. Des. 2003, 30, 865–884. [Google Scholar] [CrossRef]
  65. United Nations Western Europe. United Nations Sustainable Development Goals (SDGs). Available online: https://unric.org/en/united-nations-sustainable-development-goals/ (accessed on 14 September 2025).
  66. Pettorelli, N.; Vik, J.O.; Mysterud, A.; Gaillard, J.-M.; Tucker, C.J.; Stenseth, N.C. Using the Satellite-Derived NDVI to Assess Ecological Responses to Environmental Change. Trends Ecol. Evol. 2005, 20, 503–510. [Google Scholar] [CrossRef] [PubMed]
  67. Atasoy, M. Monitoring the Urban Green Spaces and Landscape Fragmentation Using Remote Sensing: A Case Study in Osmaniye, Turkey. Environ. Monit Assess 2018, 190, 713. [Google Scholar] [CrossRef]
  68. Tucker, C.J. Red and Photographic Infrared Linear Combinations for Monitoring Vegetation. Remote Sens. Environ. 1979, 8, 127–150. [Google Scholar] [CrossRef]
  69. Jackson, R.D.; Huete, A.R. Interpreting Vegetation Indices. Prev. Vet. Med. 1991, 11, 185–200. [Google Scholar] [CrossRef]
  70. Phillips, B.B.; Navaratnam, A.; Hooper, J.; Bullock, J.M.; Osborne, J.L.; Gaston, K.J. Road Verge Extent and Habitat Composition across Great Britain. Landsc. Urban Plan. 2021, 214, 104159. [Google Scholar] [CrossRef]
  71. Vincent, J. UK Approves Third Runway for London’s Heathrow, Europe’s Busiest Airport. Available online: https://www.theverge.com/2016/10/25/13403534/heathrow-runway-approved-in-london (accessed on 30 January 2025).
  72. Way, J.M. Roadside Verges and Conservation in Britain: A Review. Biol. Conserv. 1977, 12, 65–74. [Google Scholar] [CrossRef]
  73. Fan, P.Y.; Chun, K.P.; Mijic, A.; Tan, M.L.; Liu, M.S.; Yetemen, O. A Framework to Evaluate the Accessibility, Visibility, and Intelligibility of Green-Blue Spaces (GBSs) Related to Pedestrian Movement. Urban For. Urban Green. 2022, 69, 127494. [Google Scholar] [CrossRef]
  74. Staricco, L. 15-, 10- or 5-Minute City? A Focus on Accessibility to Services in Turin, Italy. J. Urban Mobil. 2022, 2, 100030. [Google Scholar] [CrossRef]
  75. Gini, C. Variabilità E Mutabilità: Contributo Allo Studio Delle distribuzioni E Delle Relazioni Statistiche. [Fasc. I.]; Tipografia di P. Cuppini: Bologna, Italy, 1912. [Google Scholar]
  76. Lorenz, M.O. Methods of Measuring the Concentration of Wealth. Publ. Am. Stat. Assoc. 1905, 9, 209–219. [Google Scholar] [CrossRef]
  77. Chen, Y.; Ge, Y.; Yang, G.; Wu, Z.; Du, Y.; Mao, F.; Liu, S.; Xu, R.; Qu, Z.; Xu, B.; et al. Inequalities of Urban Green Space Area and Ecosystem Services along Urban Center-Edge Gradients. Landsc. Urban Plan. 2022, 217, 104266. [Google Scholar] [CrossRef]
  78. Martin, A.J.F.; Conway, T.M. Using the Gini Index to Quantify Urban Green Inequality: A Systematic Review and Recommended Reporting Standards. Landsc. Urban Plan. 2025, 254, 105231. [Google Scholar] [CrossRef]
  79. Wüstemann, H.; Kalisch, D.; Kolbe, J. Access to Urban Green Space and Environmental Inequalities in Germany. Landsc. Urban Plan. 2017, 164, 124–131. [Google Scholar] [CrossRef]
  80. Xu, C.; Chen, G.; Huang, Q.; Su, M.; Rong, Q.; Yue, W.; Haase, D. Can Improving the Spatial Equity of Urban Green Space Mitigate the Effect of Urban Heat Islands? An Empirical Study. Sci. Total Environ. 2022, 841, 156687. [Google Scholar] [CrossRef]
  81. World Bank. Poverty and Shared Prosperity 2016: Taking on Inequality; World Bank: Washington, DC, USA, 2016; Available online: https://documents.worldbank.org/en/publication/documents-reports/documentdetail/en/242251476706821424 (accessed on 29 April 2025).
  82. Wolch, J.R.; Byrne, J.; Newell, J.P. Urban Green Space, Public Health, and Environmental Justice: The Challenge of Making Cities ‘Just Green Enough’. Landsc. Urban Plan. 2014, 125, 234–244. [Google Scholar] [CrossRef]
  83. Chen, L.; Zhang, X.; He, F.; Yuan, R. Regional Green Development Level and Its Spatial Relationship under the Constraints of Haze in China. J. Clean. Prod. 2019, 210, 376–387. [Google Scholar] [CrossRef]
  84. Chen, Y.; Yue, W.; La Rosa, D. Which Communities Have Better Accessibility to Green Space? An Investigation into Environmental Inequality Using Big Data. Landsc. Urban Plan. 2020, 204, 103919. [Google Scholar] [CrossRef]
  85. Zhang, Y.; Liu, Y.; Zhang, Y.; Liu, Y.; Zhang, G.; Chen, Y. On the Spatial Relationship between Ecosystem Services and Urbanization: A Case Study in Wuhan, China. Sci. Total Environ. 2018, 637–638, 780–790. [Google Scholar] [CrossRef]
  86. Houlden, V.; Porto De Albuquerque, J.; Weich, S.; Jarvis, S. A Spatial Analysis of Proximate Greenspace and Mental Wellbeing in London. Appl. Geogr. 2019, 109, 102036. [Google Scholar] [CrossRef]
  87. Zhou, Q.; Liao, Y.; Wang, J. Mapping Global Urban Greenspace: An Analysis Based on Open Land-Cover Data. Urban For. Urban Green. 2022, 74, 127638. [Google Scholar] [CrossRef]
  88. Phillips, A.; Plastara, D.; Khan, A.Z.; Canters, F. Integrating Public Perceptions of Proximity and Quality in the Modelling of Urban Green Space Access. Landsc. Urban Plan. 2023, 240, 104875. [Google Scholar] [CrossRef]
  89. Zhang, J. Inequalities in the Quality and Proximity of Green Space Exposure Are More Pronounced than in Quantity Aspect: Evidence from a Rapidly Urbanizing Chinese City. Urban For. Urban Green. 2023, 79, 127811. [Google Scholar] [CrossRef]
  90. Pan, J.; Bardhan, R.; Jin, Y. Spatial Distributive Effects of Public Green Space and COVID-19 Infection in London. Urban For. Urban Green. 2021, 62, 127182. [Google Scholar] [CrossRef] [PubMed]
  91. Briggs, H. Everyone to Live 15 Minutes from Green Space or Water in England under Plans. BBC News. 30 January 2023. Available online: https://www.bbc.com/news/science-environment-64456455 (accessed on 14 September 2025).
  92. Anguelovski, I.; Connolly, J.J.T.; Masip, L.; Pearsall, H. Assessing Green Gentrification in Historically Disenfranchised Neighborhoods: A Longitudinal and Spatial Analysis of Barcelona. Urban Geogr. 2018, 39, 458–491. [Google Scholar] [CrossRef]
  93. Luo, S.; Patuano, A. Multiple Ecosystem Services of Informal Green Spaces: A Literature Review. Urban For. Urban Green. 2023, 81, 127849. [Google Scholar] [CrossRef]
  94. Clarke, M.; Cadaval, S.; Wallace, C.; Anderson, E.; Egerer, M.; Dinkins, L.; Platero, R. Factors That Enhance or Hinder Social Cohesion in Urban Greenspaces: A Literature Review. Urban For. Urban Green. 2023, 84, 127936. [Google Scholar] [CrossRef]
  95. Rigolon, A. A Complex Landscape of Inequity in Access to Urban Parks: A Literature Review. Landsc. Urban Plan. 2016, 153, 160–169. [Google Scholar] [CrossRef]
  96. Kraemer, R.; Kabisch, N. Parks in Context: Advancing Citywide Spatial Quality Assessments of Urban Green Spaces Using Fine-Scaled Indicators. Ecol. Soc. 2021, 26, 14. [Google Scholar] [CrossRef]
  97. Ramirez Aranda, N.; De Waegemaeker, J.; Van De Weghe, N. The Evolution of Public Participation GIS (PPGIS) Barriers in Spatial Planning Practice. Appl. Geogr. 2023, 155, 102940. [Google Scholar] [CrossRef]
  98. Wu, W.; Ding, K. Optimization Strategy for Parks and Green Spaces in Shenyang City: Improving the Supply Quality and Accessibility. Int. J. Environ. Res. Public Health 2022, 19, 4443. [Google Scholar] [CrossRef]
  99. Calderón-Argelich, A.; Benetti, S.; Anguelovski, I.; Connolly, J.J.T.; Langemeyer, J.; Baró, F. Tracing and Building up Environmental Justice Considerations in the Urban Ecosystem Service Literature: A Systematic Review. Landsc. Urban Plan. 2021, 214, 104130. [Google Scholar] [CrossRef]
  100. Wu, L.; Kim, S.K.; Lin, C. Socioeconomic Groups and Their Green Spaces Availability in Urban Areas of China: A Distributional Justice Perspective. Environ. Sci. Policy 2022, 131, 26–35. [Google Scholar] [CrossRef]
  101. Elderbrock, E.; Russel, K.; Ko, Y.; Budd, E.; Gonen, L.; Enright, C. Evaluating Urban Green Space Inequity to Promote Distributional Justice in Portland, Oregon. Land 2024, 13, 720. [Google Scholar] [CrossRef]
  102. Kim, J.; Lee, K.J.; Thapa, B. Visualizing Fairness: Distributional Equity of Urban Green Spaces for Marginalized Groups. J. Environ. Plan. Manag. 2022, 65, 833–851. [Google Scholar] [CrossRef]
  103. Schlosberg, D. Theorising Environmental Justice: The Expanding Sphere of a Discourse. Environ. Politics 2013, 22, 37–55. [Google Scholar] [CrossRef]
  104. Kuras, A.; Brell, M.; Rizzi, J.; Burud, I. Hyperspectral and Lidar Data Applied to the Urban Land Cover Machine Learning and Neural-Network-Based Classification: A Review. Remote Sens. 2021, 13, 3393. [Google Scholar] [CrossRef]
  105. Münzinger, M.; Prechtel, N.; Behnisch, M. Mapping the Urban Forest in Detail: From LiDAR Point Clouds to 3D Tree Models. Urban For. Urban Green. 2022, 74, 127637. [Google Scholar] [CrossRef]
  106. Liu, W.; Li, H.; Xu, H.; Zhang, X.; Xie, Y. Spatiotemporal Distribution and Driving Factors of Regional Green Spaces during Rapid Urbanization in Nanjing Metropolitan Area, China. Ecol. Indic. 2023, 148, 110058. [Google Scholar] [CrossRef]
  107. Zhang, Y.; Ge, J.; Bai, X.; Wang, S. Blue-Green Space Seasonal Influence on Land Surface Temperatures across Different Urban Functional Zones: Integrating Random Forest and Geographically Weighted Regression. J. Environ. Manag. 2025, 374, 123975. [Google Scholar] [CrossRef] [PubMed]
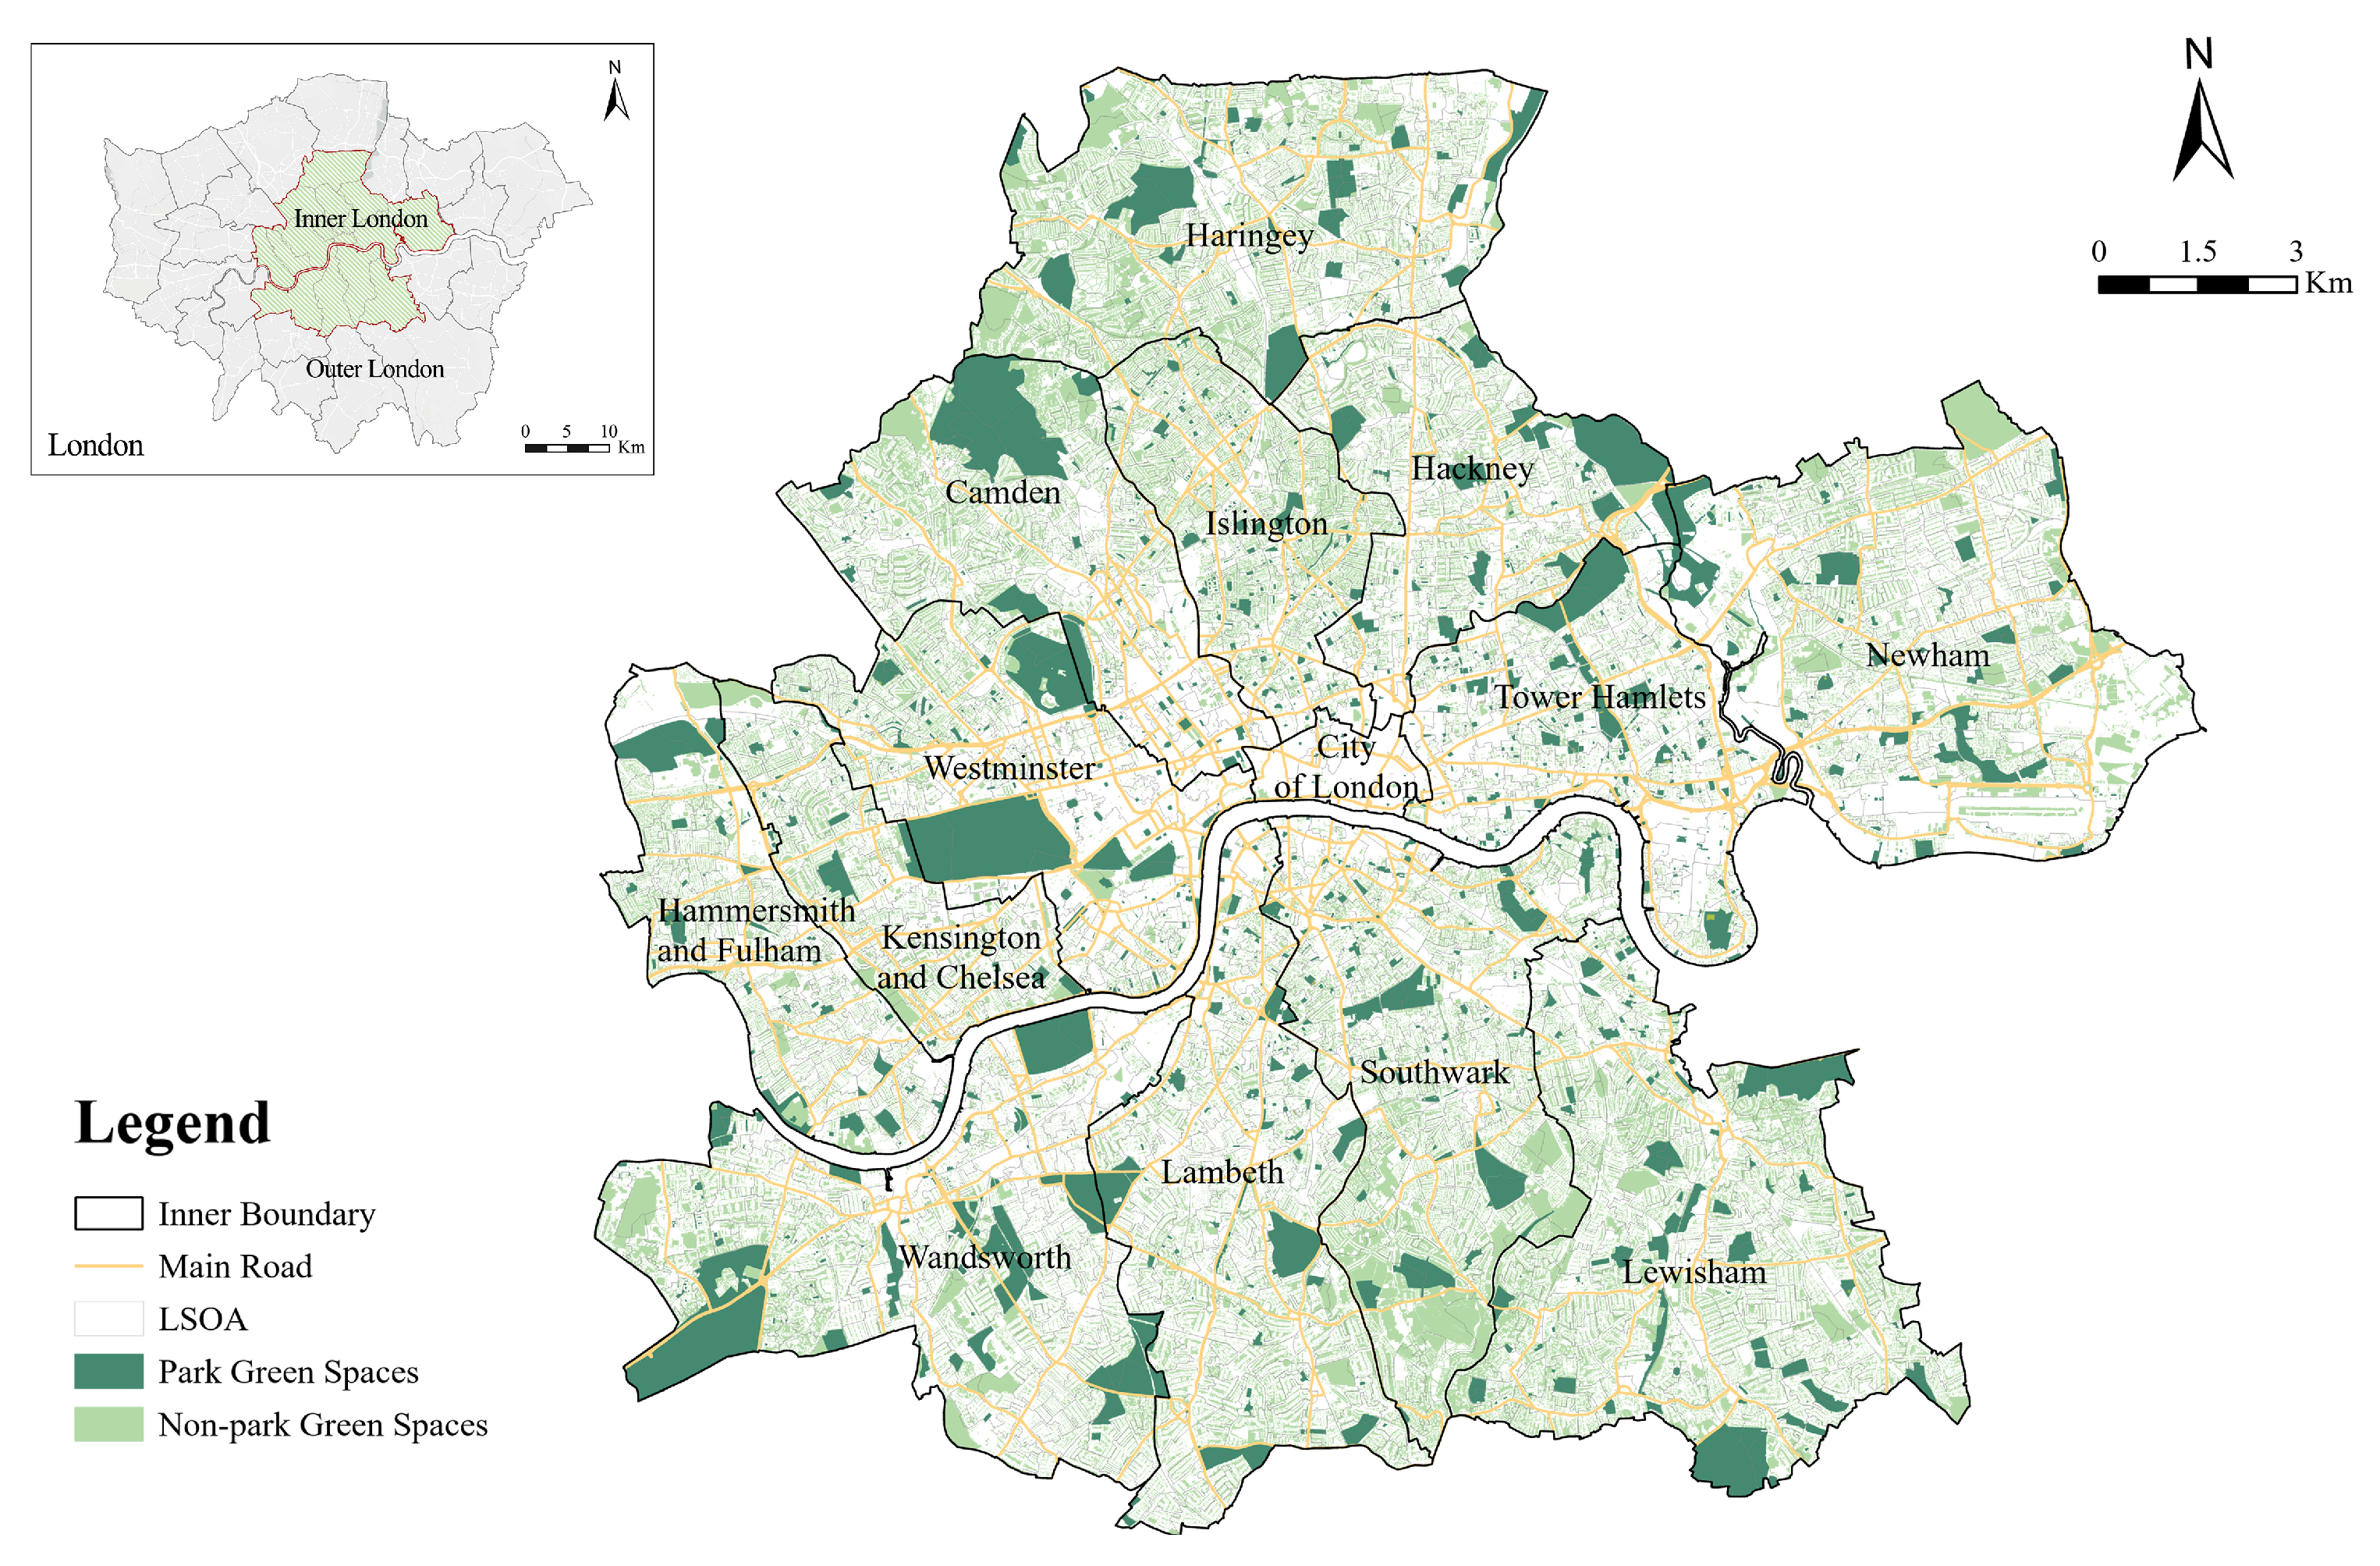
Figure 1. Location of the study area and overall spatial distribution of park and non-park green spaces in Inner London.
Sustainability 17 09284 g001
Figure 2. An integrated framework for definition, classification, and accessibility–spatial equity assessment of NPGSs.
Sustainability 17 09284 g002
Figure 3. Schematic diagram of five NPGS categories in urban areas based on the proposed classification criteria.
Sustainability 17 09284 g003
Figure 4. Spatial distribution and coverage patterns of NPGSs in Inner London: (a) geospatial allocation, (b) category proportion, and (c) borough-level variability.
Sustainability 17 09284 g004
Figure 5. Lorenz curves (a) and Gini coefficients (b) for accessibility of NPGS categories at different buffer distances. Note: Lorenz curves depict the per capita accessibility distribution of five NPGS categories for clarity, while the overall inequality of total NPGS is represented only by its Gini coefficient.
Sustainability 17 09284 g005
Figure 6. Global Moran’s I and Z-score analysis of five NPGS categories.
Sustainability 17 09284 g006
Figure 7. Local Moran’s I analysis (800 m) of five NPGS categories and the total NPGS, showing the spatial distribution of cold and hot spots in Inner London. Note: Only the 800 m buffer distance is shown in the main text for visual clarity. Detailed results for 400 m and 1200 m buffer distances are provided in the Supplementary Materials (Figures S1–S6).
Sustainability 17 09284 g007
Table 1. Typologies and definitions of NPGSs summarized the literature.
CategorySubcategoryLiterature
Natural and Protectedurban forestsforest (remnant woodland, managed forest, mixed forms) [31]
grasslandsgrassland [38]
protected green areasnature [39], nature reserve [40]
Community and Householdcommunity-managed green spacescommunity gardens [41], allotment gardens [42]
neighborhood and residential green spacesneighborhood green spaces [32], residential green spaces [43], tenant gardens [44]
private household gardenshouse gardens [11], private gardens [10]
Purpose-Specificagricultural and horticultural green spacesurban agriculture [45], horticulture [46], cultivated lands [30]
institutional green spacesschool greening [33], hospital gardens [47]
zoological and botanical green spaceszoological gardens [48], botanical gardens [49]
cemeterieschurchyard [29], cemetery [50]
Linearstreet greenerystreet trees [51], street greenery [34]
green vergesroadside green verges, railway green verges [52], airport green verges [18]
Underutilizedbrownfieldsindustrial brownfields [35], post-industrial brownfields [53]
vacant lotsvacant lots [54], vacant land [14]
abandoned, ruderal, and derelict areasabandoned [55], ruderal areas [56], derelict sites [57]
Table 2. The sources of NPGS data.
CategoryApproachData source
Natural and Protectedclassification acquisitionOSM
Community and Householdclassification acquisitionOSM
removal of building footprints and roadsOSM
extracting NDVI within the scope of residential areasNDVI
Purpose-Specificclassification acquisitionOSM
extracting NDVI within the scope of medical and educational areasNDVI
Linearbuffer created by street tree points (6.5 m)London DataStore
extracting NDVI within the buffer created by roads (15 m), railways (25 m), and airport runways (150 m)NDVI
Underutilizedclassification acquisitionOSM
extracting NDVI within the scope of constructionNDVI
Table 3. The types of NPGSs in Inner London.
CategoryDetails in Inner LondonRepresentative Images
Natural and Protectednature reserve, conservation, forest, grassSustainability 17 09284 i001
Community and Householdgarden, allotment, community food growing, green space, village green, residential, estateSustainability 17 09284 i002
Purpose-Specificgolf course, miniature golf, animal enclosure, arboretum, cemetery, churchyard, farmland, flowerbed, greenhouse horticulture, meadow, orchard, plant nursery, planting, medical, educationalSustainability 17 09284 i003
Linearstreet greenery (6.5 m for street tree points), green verge (15 m for roads, 25 m for railways, and 150 m for airport runways)Sustainability 17 09284 i004
Underutilizedbrownfield (post-industrial brownfield, transport-related brownfield, commercial brownfield, derelict brownfield), dead allotments, underutilized areasSustainability 17 09284 i005
Disclaimer/Publisher’s Note: The statements, opinions and data contained in all publications are solely those of the individual author(s) and contributor(s) and not of MDPI and/or the editor(s). MDPI and/or the editor(s) disclaim responsibility for any injury to people or property resulting from any ideas, methods, instructions or products referred to in the content.