Article

Sustainable Marketing: Can Retailers’ Profit-Motivated Consumer Education Enhance Green R&D and Production?

1
School of Management and Economics, University of Electronic Science and Technology of China, Chengdu 611731, China
2
School of Automation Engineering, University of Electronic Science and Technology of China, Chengdu 611731, China
*
Author to whom correspondence should be addressed.
Sustainability 2025, 17(20), 9008; https://doi.org/10.3390/su17209008
Submission received: 5 September 2025 / Revised: 5 October 2025 / Accepted: 6 October 2025 / Published: 11 October 2025
(This article belongs to the Special Issue Sustainable Marketing and Consumer Management)

Abstract

Drawing from practices at Walmart, we model a supply chain where the manufacturer conducts product R&D while the retailer distributes products to two distinct consumer segments: green-conscious consumers who translate environmental principles into purchasing decisions, and non-green-conscious consumers who are deterred by perceived high costs and information deficits. The retailer engages in green education targeted at non-green-conscious consumers, providing clear product explanations to improve their willingness to pay for sustainable products, though this education is motivated by profit maximization rather than altruistic environmental responsibility. Our analysis reveals that while retailer green education can boost product R&D and adoption under certain conditions, this creates a ‘consumer education paradox’—a situation where green education could further enhance product R&D and adoption, but the retailer forgoes it because doing so does not contribute to profit. This occurs because profit-driven retailers limit education to self-beneficial ranges, creating tension between individual profit maximization and overall environmental performance. We then propose two government subsidy solutions—green product quantity subsidies and product R&D subsidies—to resolve this paradox. Both effectively alleviate the tension, but green innovation subsidies, despite requiring greater government investment, consistently outperform in fostering innovation and adoption, offering superior environmental outcomes.

1. Introduction

In response to the significant environmental deterioration caused by traditional industrialization, a growing number of firms are voluntarily channeling resources into product R&D and innovation as part of their corporate sustainability initiatives [1,2]. A prime example is Tesla voluntarily channels billions of dollars into R&D specifically to create innovative products that solve environmental challenges, proving that market-leading success can be achieved through a sustainability-first innovation strategy. The development of their electric vehicles, from the Model S to the Cybertruck, represents a continuous, voluntary investment in R&D to create a zero-emission alternative to internal combustion engine vehicles, directly addressing the largest source of greenhouse gas emissions [3].
However, on the demand side, consumer behavior presents a notable dichotomy. On the one hand, there are green-conscious consumers who translate their environmental principles into deliberate purchasing decisions [4,5]. In contrast, on the other hand, although a vast majority of consumers are aware of and concerned about environmental issues, their actual purchasing habits often fail to reflect this awareness—these are non-green-conscious consumers [6]. For instance, while surveys indicate that over 90% of people are interested in sustainable products, their actual engagement in sustainable practices has stagnated over the past five years. Research suggests that this discrepancy is primarily driven by financial barriers, as higher prices for sustainable goods continue to hinder consumer adoption and enthusiasm, particularly in some regions and markets [7].
To reconcile this divergence and overcome the barriers, green education is posited as a pivotal intervention, as it not only improves consumers’ efficiency in acquiring and evaluating information [8], but also enhances their capability and willingness to consider recommended options [6,9,10]. The practical implementation of this educational function is most effectively embodied by retailers, as they can alleviate consumer doubts and encourage a greater willingness to pay a premium through in-store demonstrations, eco-label explanations, and guided sampling [11,12]. The strategic application of this educational model is exemplified by retailer leaders. Walmart, for instance, translates its sustainability goals into clear eco-label explanations, while leveraging its physical presence to offer tangible in-store demonstrations and guided sampling [13,14]. This multi-pronged strategy serves to effectively address the barriers to environmental purchasing, thereby reducing consumer hesitation within its extensive base of 230 million weekly customers [15].
However, upon exposure to retailers’ green education, consumer trust in green claims exhibits significant variation. According to the Blue Yonder Consumer Sustainability Survey, while 55% of consumers report that their trust depends on the specific brand, message, or company history, there are notable differences in perceptions of companies’ green education efforts. Specifically, respondents in France (25%), the US (23%), the UK (17%) and ANZ (13%) are more likely to believe that companies genuinely use green education initiatives in their advertising and marketing [16]. From a research perspective, the key question is whether profit-maximizing retailers should implement green education to ensure comprehensive information delivery to non-green-conscious consumers, and if so, what implications such efforts would have.
To answer this question, we conceptualize the retailer as an “educator and promoter” for product R&D, aiming to bridge the demand-side gap. More specifically, consistent with the practices of Walmart, we model the retailer engaging in green education targeted at non-green-conscious consumers by providing clear product explanations and improving their willingness to pay for sustainable products. It is crucial to note, however, that the retailer’s motivation for such education is profit maximization, not altruistic environmental responsibility. This theoretical model leads us to our first research question:
Does the retailer’s green education positively influence the manufacturer’s green innovation efforts and market adoption of green products?
Our analysis confirms that while the retailer’s green education can increase the levels of product R&D and the market adoption of green products under certain conditions, it fails to unlock the full potential for growth in these areas. This is because the retailer, driven by profit maximization, only implements education strategies within a range that is beneficial to itself. In other words, there exists a region where green education could further enhance product R&D and adoption, but the retailer forgoes it because doing so does not contribute to profit. This phenomenon—the inherent tension between a retailer’s individual profit maximization and overall environmental performance—is known as the ‘consumer education paradox’.
The paradox exposes a critical conflict: while it highlights a retailer’s limited environmental stewardship, it also signals significant, complex repercussions for the supply chain. To fully understand these consequences, we further examine the paradox’s impact on supply chain partners, leading to our second research question:
Does the retailer’s green education facilitate the manufacturer’s profitability?
Our analysis further uncovers a dual effect of the retailer’s green education, leading to either ‘win–win’ or ‘win–lose’ outcomes for the retailer and manufacturer. The latter outcome is particularly noteworthy as it reflects the retailer’s inherent profit-maximizing behavior, resulting in the retailer’s gain coming at the manufacturer’s expense. To put it another way, the ‘win–lose’ outcome emerges because the retailer strategically deploys green education to capture a greater share of the supply chain value, which in turn directly diminishes the manufacturer’s net profitability.
As the consumer education paradox brings to light a fundamental conflict spanning retailer profit, environmental performance, and manufacturer profitability, this tension ultimately informs our final research question:
What mechanisms can be employed to resolve the consumer education paradox?
To resolve the consumer education paradox, we examine two government subsidy methods with distinct policy objectives: one focused on increasing the quantity of green products, and the other on incentivizing product R&D. Our analysis confirms that while both interventions are effective in alleviating the Consumer Education Paradox, they differ significantly in their fiscal implications. Specifically, although green innovation subsidies require considerably greater government financial commitment to achieve effectiveness, they consistently demonstrate superior effectiveness in fostering higher green innovation levels and green adoption.
This paper proceeds as follows: Section 2 summarizes the related literature. Section 3 formulates models for both scenarios with and without green education. Section 4 presents our key findings, and Section 5 provides concluding discussions.

2. Relevant Literature

A significant strand of literature relevant to our study addresses consumer education. In particular, Bai et al. [8] showed that the manufacturer prefers to partially integrate a component supplier only when the efficiency of its energy conservation investment is neither too low nor too high. Sun and Yuan [17] suggested that if allowing the flexibility of remanufacturing outsourcing, consumer education on green consumption introduces opportunities for opportunistic behaviors that can compromise both profitability and environmental objectives. Zhong et al. [18] indicated that a new product seller (E-retailer) can benefit from the remanufactured goods’ cannibalization in the Agency channel. Wang et al. [19] revealed that increasing the warranty and education levels will not always improve the firm’s profitability. Sun and Liu [20] revealed that government subsidy policies effectively encourage original equipment manufacturers to enter remanufacturing, while consumer education primarily benefits independent remanufacturers despite not always benefiting OEMs. Abdulla et al. [21] argued that, while consumer education about the remanufacturing process fails to increase appeal and willingness to pay for remanufactured products, providing physical exposure significantly enhances both by increasing perceived quality and decreasing disgust. Florea et al. [22] identified customer education in B2B firms as a three-stage process involving preparation, deployment, and measurement, advancing its understanding as a cross-functional capability that requires coordination across multiple stakeholders. Previous studies have highlighted consumer education’s role in improving information acquisition and evaluation but have not addressed the key question of whether profit-maximizing retailers should implement green education to ensure comprehensive information delivery to non-green-conscious consumers. Therefore, we complement this research by examining whether a retailer’s profit-motivated consumer education can enhance green R&D and production.
The second stream of literature related to our study focuses on green innovation. For example, Xie et al. [23] showed that the moderating effect of green subsidies on the relationship between green product innovation and a firm’s financial performance is not supported. Then, Abadzhiev et al. [24] identified three distinct innovation activity configurations at the company level and three alignment mechanisms along the value chain. However, Lin and Lin [25] proposes a novel algorithm for computing network reliability in multistate supply chain networks that integrates supplier sustainability to enhance green innovation through sustainable supplier selection and equitable order allocation. Ai et al. [26] showed that while excessive leverage creates risk accumulation that harms financial outcomes with strategic and substantive green innovations. Subsequently, Quadir et al. [27] found that information sharing improves greening levels when manufacturers are efficient, with Bertrand competition yielding higher greening levels and consumer surplus than Cournot competition, while Lambrecht et al. [28] revealed that relying solely on patent and trademark data to identify green innovative firms leads to significant exclusion of such firms, with green trademarks serving as an effective indicator of green product innovation. While substantial research has examined product R&D, our study distinguishes itself through two key aspects: First, unlike existing studies that assume all consumers are environmentally conscious, we identify a significant segment of non-green-conscious consumers who are deterred by perceived high costs and lack of reliable information. Second, we address the previously unexplored question of whether profit-maximizing retailers should implement green education to ensure comprehensive information delivery to these non-green-conscious consumers.
The final stream of literature indirectly related to our research focuses on government subsidy policies. Azevedo et al. [29] constructed a real options framework to analyze how governmental subsidies and taxation policies influence investment timing and scale. Wang et al. [30] employed a Stackelberg model to examine three government subsidy mechanisms—for manufacturers’ eco-design, retailers’ sales effort, and consumers’ green consumption—demonstrating that retailer subsidies are the least favorable from social welfare and environmental standpoints. Guo et al. [31] explored carbon quota mechanisms and used battery recycling subsidies as alternatives to expiring purchase subsidies and maladapted dual credit policies for China’s new energy vehicle development. Corsini [32] reviewed the study that identifies twelve leverage points and policy recommendations for enabling building components reuse as a circular economy approach. Chen and Keppo [33] examined how government subsidies for data collection interact with voluntary and centralized data sharing among firms. Although previous studies have not focused on retailer green education strategies, they have demonstrated that among various policy tools, green innovation subsidy and green product subsidy are particularly effective, inspiring our research to reconcile the trade-offs between profit-motivated consumer education, product R&D, and adoption stemming from green education.
Table 1 provides the contributions through comparison with the related research.

3. Model

Consistent with Sun et al. [34] and Yang et al. [35], we assume that consumers, with a total mass normalized to one, are vertically heterogeneous according to their valuation of θ . The supply side features a manufacturer who invests in product R&D, enhancing product greenness g > 0 at a cost of η g 2 . Comparable functional forms are extensively employed in green supply chain models examining R&D effort responses [1,6,36]. Notably, this product R&D generates two distinct market segments, reflecting a consumer behavior dichotomy driven by varying valuations of the green attribute g : Green-conscious consumers with a full valuation of g , are incentivized to purchase sustainable products. In contrast, non-green-conscious consumers, constrained by information asymmetry, possess a discounted valuation of ( 1 t ) g . Like Yang et al. [35], Smith and Shulman [37], Nire and Matsubayashi [38], research suggests that similar hesitation discounts have been widely used in the vertical differentiation models of consumer willingness-to-pay. That is, like them, we also allow firms, e.g., Walmart, to translate the efforts to overcome the barriers by providing clear eco-label explanations, while leveraging its physical presence to offer tangible in-store demonstrations and guided sampling [13,14].
Accordingly, like Olsder et al. [39], Yang et al. [35] and Sun et al. [17], we then can model the consumer’s purchasing decision with the following utility function:
U = θ + g G r e e n - c o n s c i o u s   c o n s u m e r s   θ + ( 1 t ) g N o n - g r e e n - c o n s c i o u s   c o n s u m e r s
Then, green-conscious consumers will purchase the product if U = θ + g b p > 0 , while non-green-conscious consumers will do so if U = θ + ( 1 t ) g b p > 0 , respectively, where b > 0 represents price sensitivity. As such, green-conscious consumers will purchase the product when θ > b p g , while non-green-conscious consumers will do so for θ > b p ( 1 t ) g . Since the mass of consumers in the market is normalized to one, the utility function yields the following demand functions q g = 1 + g b p for green-conscious consumers and q n = 1 + ( 1 t ) g b p for non-green-conscious consumers.
Let f ( 0 , 1 ) represent the fraction of non-green-conscious consumers, with the remaining fraction, 1 f being green-conscious consumers. Then, without green education, the demand function is given by
q = q g + q n = ( 1 f ) ( 1 + g b p ) + f ( 1 + ( 1 t ) g b p )
Notably, although the retailer’s green education can overcome the discounted valuation of ( 1 t ) g among non-green-conscious consumers, it would incur an additional cost of c per unit.

3.1. Setting (A): Without Green Education

We begin by establishing a benchmark scenario in which the retailer does not engage in green education. The game unfolds as follows: Stage 1 (Manufacturer): The manufacturer sets the product greenness level ( g ) and the wholesale price ( w ). Stage 2 (Retailer): After observing the manufacturer’s decisions, the retailer subsequently determines the final retail price ( p ).
Formally, adopting backward induction, the retailer’s problem is defined as follows:
max p π r A = ( p w ) q max p ( p w ) ( q g + q n )
Substituting the optimal demand q from (3) into the retailer’s profits, maximizing the retailer’s problem provides p A :
p A = 1 + g   +   b w     g f t 2 b
Anticipating the retailer’s optimal response, the manufacturer chooses greenness g and the wholesale price w to maximize her profits:
max w A , g A π m A = w ( q g + q n ) η g 2 max w A , g A w + g w b w 2 g f t w 2 η g 2
Performing the maximization in (5) yields w A and g A :
w A * = 4 η 8 b η f 2 t 2 + 2 f t 1 ,   g A * = 4 η 8 b η f 2 t 2 + 2 f t 1
By substituting them into p A , q A , π r A and π m A , we derive the equilibrium outcomes for setting A. These results are formally presented in the lemma that follows (All proofs are provided in the Online Appendix A).
Lemma 1.  
When the retailer’s role is limited to distribution and does not include green education, both parties choose the following optimal decisions:
w A * = 4 η 8 b η f 2 t 2 + 2 f t 1 ,   g A * = 4 η 8 b η f 2 t 2 + 2 f t 1 ,   p A * = 6 η 8 b η f 2 t 2 + 2 f t 1 , q A * = 2 b η 8 b η f 2 t 2 + 2 f t 1   , π r A * = 4 b η 2 ( 8 b η f 2 t 2 + 2 f t 1 ) 2 ,   π m A * = η 8 b η f 2 t 2 + 2 f t 1 .

3.2. Setting (B): With Green Education

Recall that if the retailer undertakes green education, she incurs an additional cost of c . This effort, however, offsets the negative impact of the valuation discount ( 1 t ) g on demand, q n . Similar assumptions can also be found in the literature, which looks at process improvement decisions (see, e.g., Yang et al. [35], Arya et al. [40], and Yang et al. [41]).
Since the retailer adopts a green education strategy, its problem can be rewritten as:
max p π r B = ( p w ) q g + ( p w c ) q n max p ( p w ) ( 1 f ) ( 1 + g b p ) + ( p w c ) f ( 1 + g b p )
Maximizing the retailer’s problem provides p B
p B = g + b w + b c f + 1 2 b
Observing p B * , the manufacturer chooses g and w to maximize her profits:
max w B , g B π m B = w ( q g + q n ) η g 2 max w B , g B w g + w b w 2 b c f w 2 η g 2
Solving the problems in (8) yields w B and g B
w B * =   4 η 1 b c f   8 b η 1 ,   g B * = 1 b c f 8 b η 1
Substituting them into p B , q B , π r B and π m B , provides the equilibrium outcomes for setting B in the following lemma (the proof is provided in the Online Appendix B).
Lemma 2.  
When the retailer undertakes distribution and also provides green education, both parties make the following optimal decisions:
w B * =   4 η 1 b c f   8 b η 1 ,   g B * = 1 b c f 8 b η 1 ,   p B * = 6 η c f + 2 b c η f 8 b η 1 q B * =   2 b η 1 b c f   8 b η 1 ,   π r B * = 4 b η 2 ( b c f 1 ) 2 8 b η 1 ,   π m B * = η ( b c f 1 ) 2 8 b η 1 .

4. Main Results

To clarify the influence of the retailer’s green education, we conduct a comparative analysis of the optimal outcomes presented in Section 3.1 and Section 3.2, focusing on its effects on both parties’ strategic choices and financial performance.
The initial finding indicates that the effectiveness of retailers’ green education depends on specific conditions related to its implementation (the proof is provided in the Online Appendix C).
Proposition 1. 
The retailer undertakes green education if and only if c < c i = 2 t f t 2 8 η f 2 t 2 + 2 f t 1 .
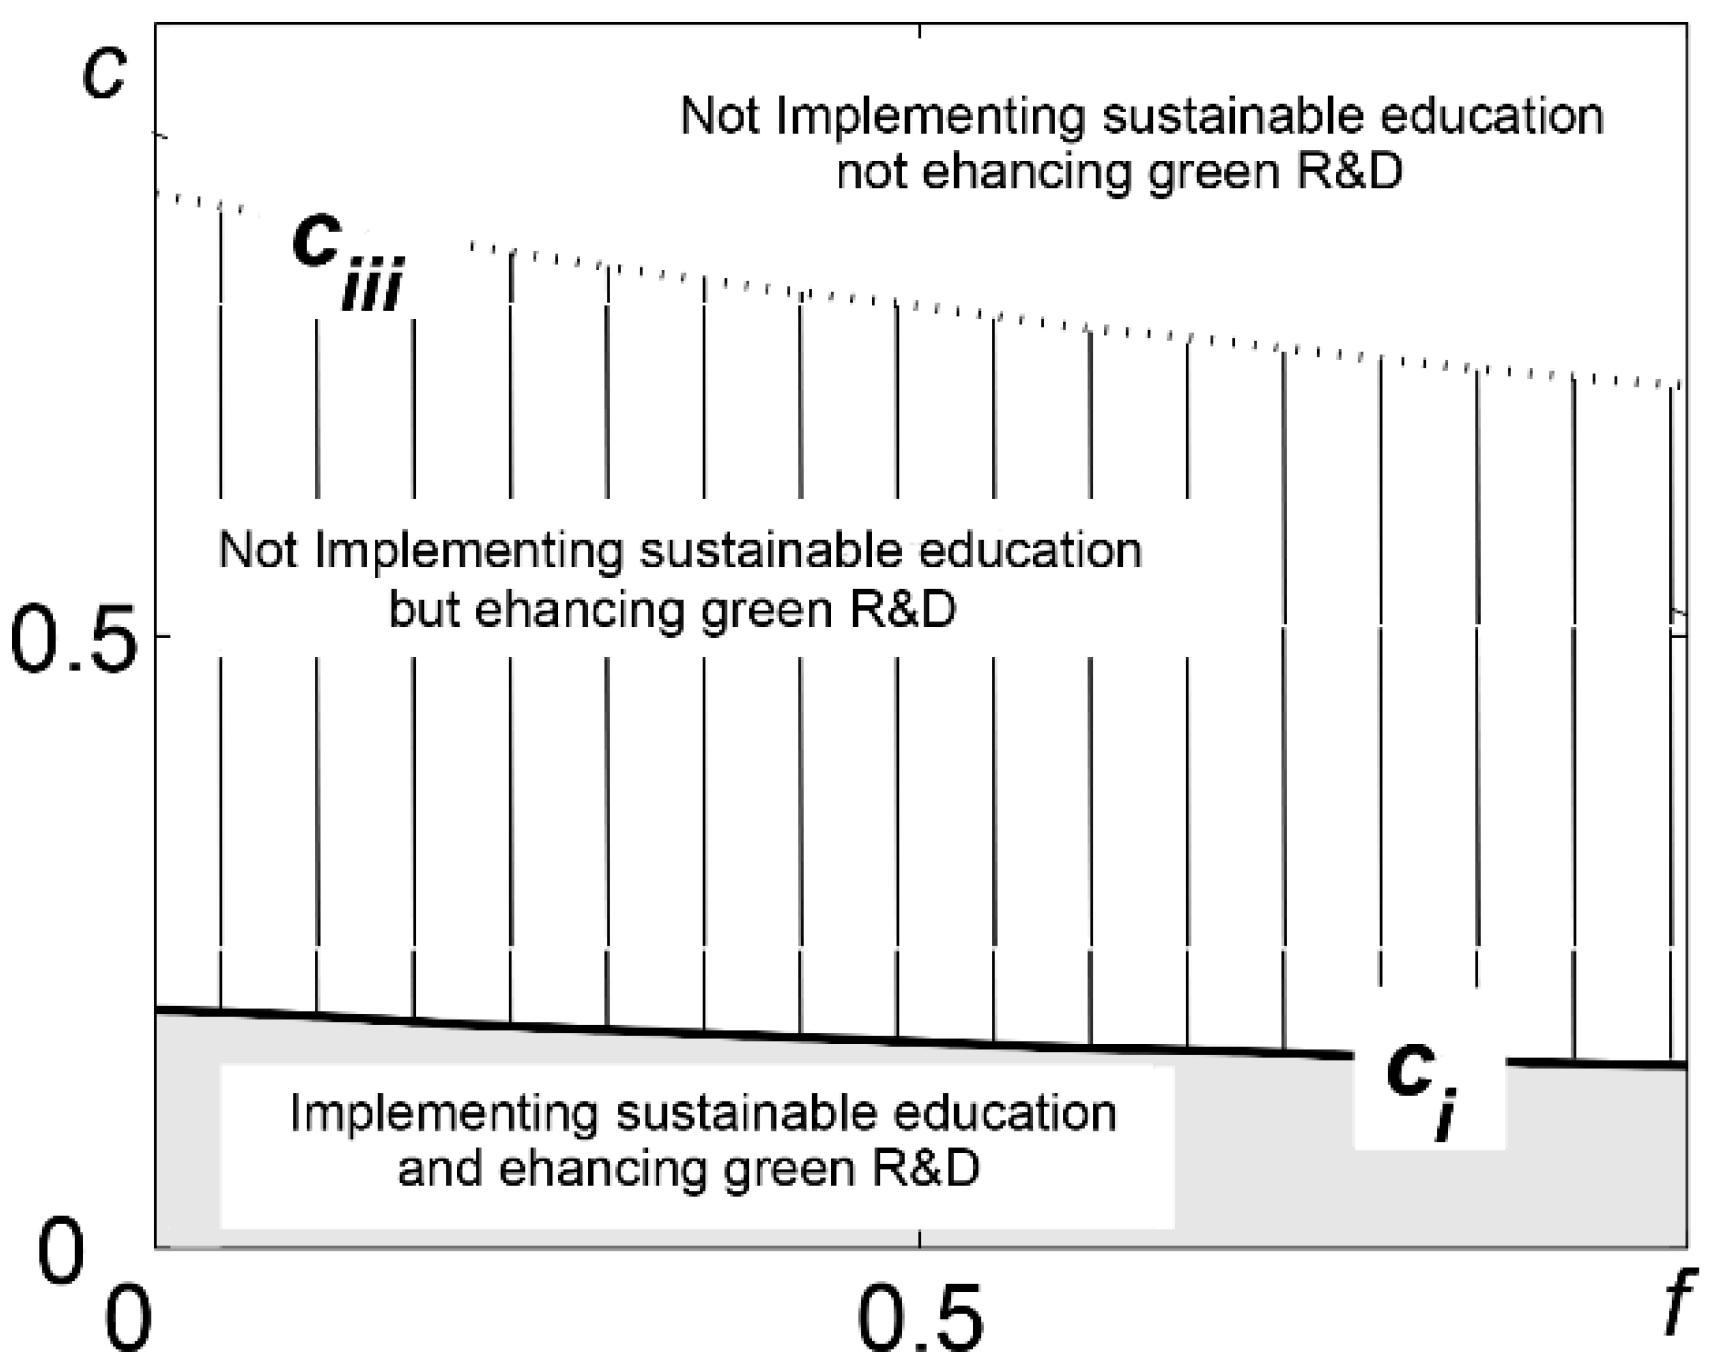
Proposition 1 is consistent with the conventional wisdom that cost management is fundamental to corporate success, positing that profitability and long-term viability are contingent upon a firm’s ability to effectively control its expenditures [42]. Specifically, as Figure 1a indicates, the retailer will opt to provide green education when the associated cost c is less than c i , as this strategy yields a superior profit ( π r B * > π r A * ). Conversely, for costs exceeding the threshold ( c > c i ), the retailer forgoes green education because the profit from doing so is inferior to the alternative ( π r B * < π r A * ).
Note that, although the retailer’s green education can mitigate the valuation discount effect in non-green-conscious consumers, it incurs an additional cost of c . Consequently, with higher proportions of non-green-conscious consumers, green education becomes a more challenging and costly task. Therefore, as Figure 1b demonstrates, there is a negative relationship between the fraction of non-green-conscious consumers and retailer green education implementation ( c i / f < 0 ). On the other hand, since the retailer’s green education effectively modifies the non-green-conscious consumers’ utility function from θ + ( 1 t ) g to θ + g , the higher valuation discount of t allows retailers to capture potential profits due to higher consumer premiums obtained from this segment. Thus, as Figure 1 demonstrates, we find that the opposing directional relationship holds between the cost threshold c i and the discounted valuation t , yielding c i / t > 0 (See Figure 1c).
From Proposition 1, we find that although the retailer undertakes green education within a certain range to offset the negative impact of the valuation discount among non-green-conscious consumers, the retailer’s decision-making remains driven by profit maximization. Thus, it is essential to examine the effects of the retailer’s green education on its optimal quantity decisions, as well as on the manufacturer’s product R&D investment and profitability.
The following proposition analyzes how the retailer’s green education influences green adoption in the market (the proof is provided in the Online Appendix D).
Proposition 2. 
The retailer’s green education enhances green adoption (i.e., q B * > q A * ) if and only if c < c i i = t ( 2 t f ) 8 η b t 2 f 2 + 2 t f 1 ; conversely, when  c > c i i , the opposite holds true.
Ma et al. [43] have revealed that consumer adoption is crucial for the profitability of new products, because it directly influences market penetration rates and creates economies of scale in adoption and distribution. In contrast to the singular profit focus of conventional new product adoption, researchers have established that green adoption not only exerts similar influences on stakeholder profitability but also pursues broader objectives of economic ecological transition and environmental sustainability. In particular, Proposition 2 reveals the consumer education paradox, wherein the retailer’s green education does not necessarily lead to increased sales of green products: while confirming that the retailer’s green education leads to higher product volumes ( q B * > q A * ) when c < c i i , we surprisingly find that the retailer’s green education may result in relatively lower consumer adoption when c > c i i . Furthermore, as Figure 2 shows, since c i < c i i , we can conclude that, although green education can increase sales volumes for c < c i i , the retailer undertakes green education if and only if c < c i . That is, to maximize profits, the retailer only secures part of the potential gains that could boost green adoption, not all of them.
The reasons behind the consumer education paradox in green adoption stem from the retailer’s profit-maximizing behavior. Specifically, when the green education cost is pronounced ( c > c i i ), the retailer must increase the selling price to cover the expense and maintain an appropriate margin. This price increase necessarily results in lower green adoption ( q B * < q A * ). Furthermore, although green education can increase sales volumes for c i < c < c i i , the retailer forgoes this strategy in this interval because it does not contribute to profit maximization (see Figure 2).
Having considered the consumer education paradox in green adoption, we now take a further step to examine whether the retailer’s green education positively influences the manufacturer’s green innovation efforts—a question addressed in the following proposition (the proof is provided in the Online Appendix E).
Proposition 3. 
The retailer’s green education enhances the manufacturer’s green innovation if and only if c < c i i i = t ( 8 η b t f + 1 ) b ( 8 η b t 2 f 2 + 2 t f 1 ) ; conversely, when  c > c i i i , the opposite holds true.
Beyond its importance in profit maximization, green innovation serves as a critical tool for combating the substantial deterioration of the global environment. In particular, Chen et al. [1] found that the degree of green innovation achieved by a manufacturer is determined by its product R&D investment efficiency and spillover, as well as its power relationship with other supply chain actors. Proposition 3 partially validates this conclusion, particularly finding that when the green education cost is not pronounced, i.e., c < c i i i , the retailer’s green education enhances the manufacturer’s green innovation. This enhancement occurs because the retailer’s green education eliminates information asymmetry among non-green-conscious consumers and overcomes their discounted valuation of ( 1 t ) g . Then, when green education costs are not significant ( c < c i i i ), the retailer is willing to share a portion of the profits from non-green-conscious consumers with the manufacturer through higher wholesale prices. Faced with this wholesale price premium, the manufacturer is incentivized to increase its degree of green innovation, resulting in g B > g A .
It should be noted that, as Figure 3 shows, Proposition 3 reveals the second consumer education paradox: although green education can increase product R&D when c i < c < c i i i , retailers forgo this strategy in this interval because it does not contribute to profit maximization. Our findings indicate that while retailer consumer education can enhance product R&D levels and adoption under specific conditions, it does not fully realize the growth potential in these domains. That is, the retailer’s consumer education paradox inherent tension between a retailer’s individual profit maximization and overall product R&D and adoption. It should be noted that for the sake of simplicity, we use product adoption and the level of R&D as proxies for ‘environmental performance’ and ‘sustainability.’ Of course, interested readers may refer to Sun and Yuan [17] and Agrawal et al. [44] for more direct measures, such as emissions or ecological footprint, which are calculated as quantity multiplied by unit emissions.
This paradox reveals a key tension: it underscores the retailer’s limited environmental stewardship while indicating complex supply chain repercussions. To grasp these effects, we examine if the retailer’s green education enhances manufacturer profitability (the proof is provided in the Online Appendix F).
Proposition 4. 
The retailer’s green education enhances the manufacturer’s profitability if and only if c < c i v = 8 b η f 2 t 2 + 2 f t 1 ( 8 b η 1 ) ( 8 b η f 2 t 2 + 2 f t 1 ) 8 η b 2 f b f 3 t 2 + 2 b f 2 t b f ; conversely, the opposite holds true
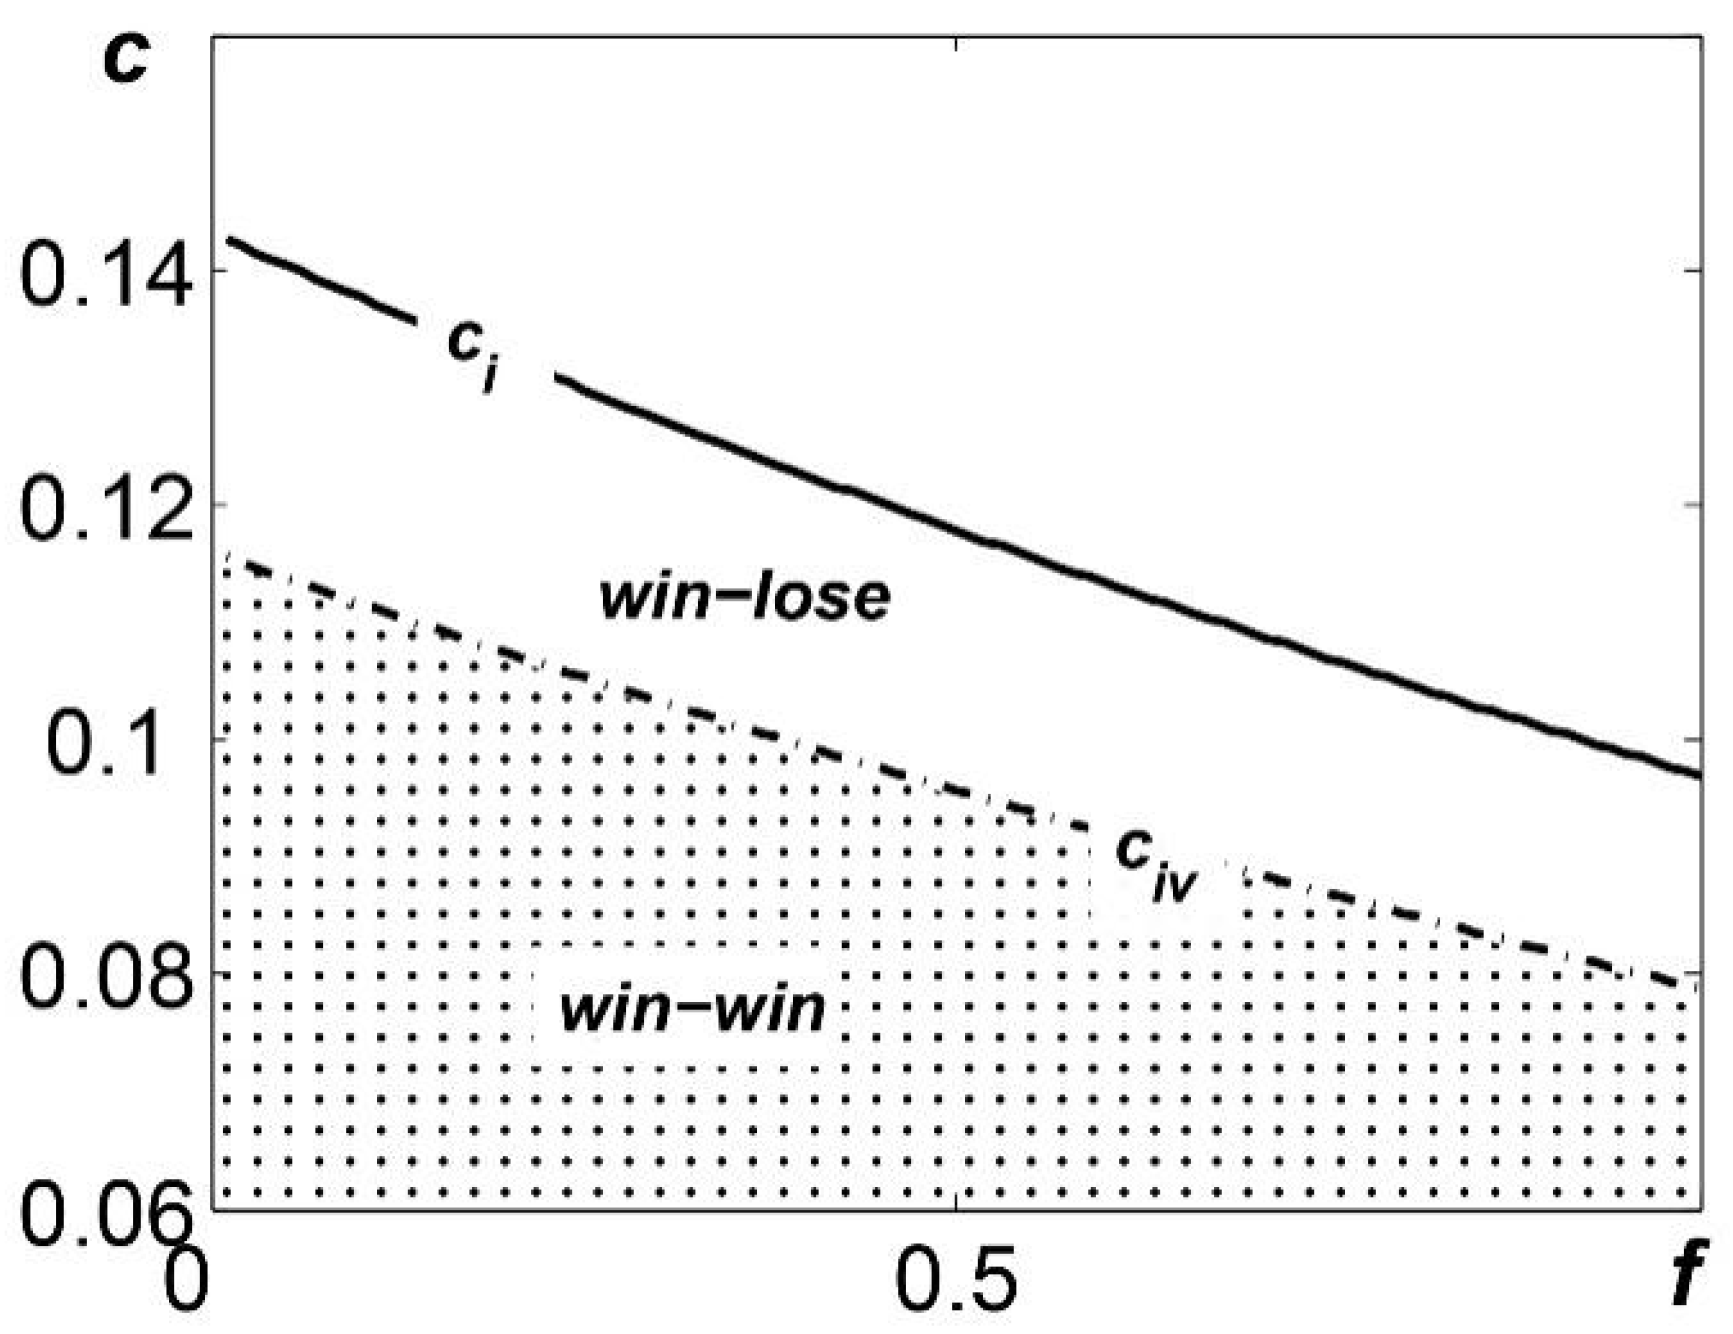
Proposition 4 illustrates the retailer’s strategic approach to using green education for capturing supply chain value, which results in different outcomes. Figure 4 shows that the first scenario occurs when education costs are low ( c < c i v ), where the retailer’s green education boosts manufacturer profitability ( π m A * < π m B * ) by sharing profits from non-green-conscious consumers. In contrast, the second scenario emerges when education costs are high ( c > c i v ), causing the retailer’s green education to reduce manufacturer profitability ( π m A * > π m B * ) as profit-sharing is eliminated. The third observation, based on the relationship c i > c i v , indicates that green education creates ‘win–win’ outcomes when c < c i v , but transitions to ‘win–lose’ outcomes when c i v < c < c i .
Propositions 2, 3, and 4 yield the observation below.
Observation 1. 
For profit-maximizing:
(i) 
The retailer’s green education captures partial, not total, sustainable gains from green adoption and innovation.
(ii)
This education may diminish the manufacturer’s profitability.
Observation 1, which follows directly from Propositions 1, 2, 3 and 4, reveals that, for profit-maximizing, through green education, the retailer triggers the Consumer Education Paradox, which establishes a fundamental conflict between the retailer’s profit and the environmental performance.

5. Extensions

5.1. Nonlinear Costs for Education

While the linear cost function facilitates analysis through straightforward closed-form solutions, its practical utility is diminishing (We sincerely thank an anonymous reviewer for pointing it out). This extension therefore explores the effects of incorporating nonlinearities. Following [17,19], we assume that when retailers engage in consumer education, it enhances customers’ valuation of the discount of ( 1 t ) g by a factor x . However, such education requires retailer effort, which depends on the nonlinear investment k x 2 . To enable focus on the implications of the nonlinear costs of k x 2 , we normalize the costs of the manufacturer η = 1 .
Then, the demand function with green education can be rewritten as
q = q g + q n = ( 1 f ) ( 1 + g b p ) + f ( 1 + ( 1 t ) g + x b p )
In this setting, both the manufacturer and the retailer first decide the green levels of g and the educational efforts of x , respectively. Subsequently, the manufacturer maximizes its profits by choosing the wholesale price w , and then, the retailer responds to it by determining the final retail price p .
As such, the retailer’s and the manufacturer’s problem under consumer education can be rewritten as:
max p , x π r B = ( p w ) q g + ( p w c ) q n k x 2 max w B , g B π m B = w ( q g + q n ) η g 2
Using the backward induction again, we can summarize the equilibrium outcomes in the Appendix G. Comparing the outcomes with those in §3.1 provides the following results (the proof is provided in the Online Appendix H).
Proposition 5. 
(i) 
The retailer undertakes green education if and only if c < c i ,
(ii) 
When  c < c i i , the retailer’s green education can enhance green adoption, green innovation, respectively.
Observation 2.  
The retailer’s green education captures partial, not total, sustainable gains from green adoption and innovation.
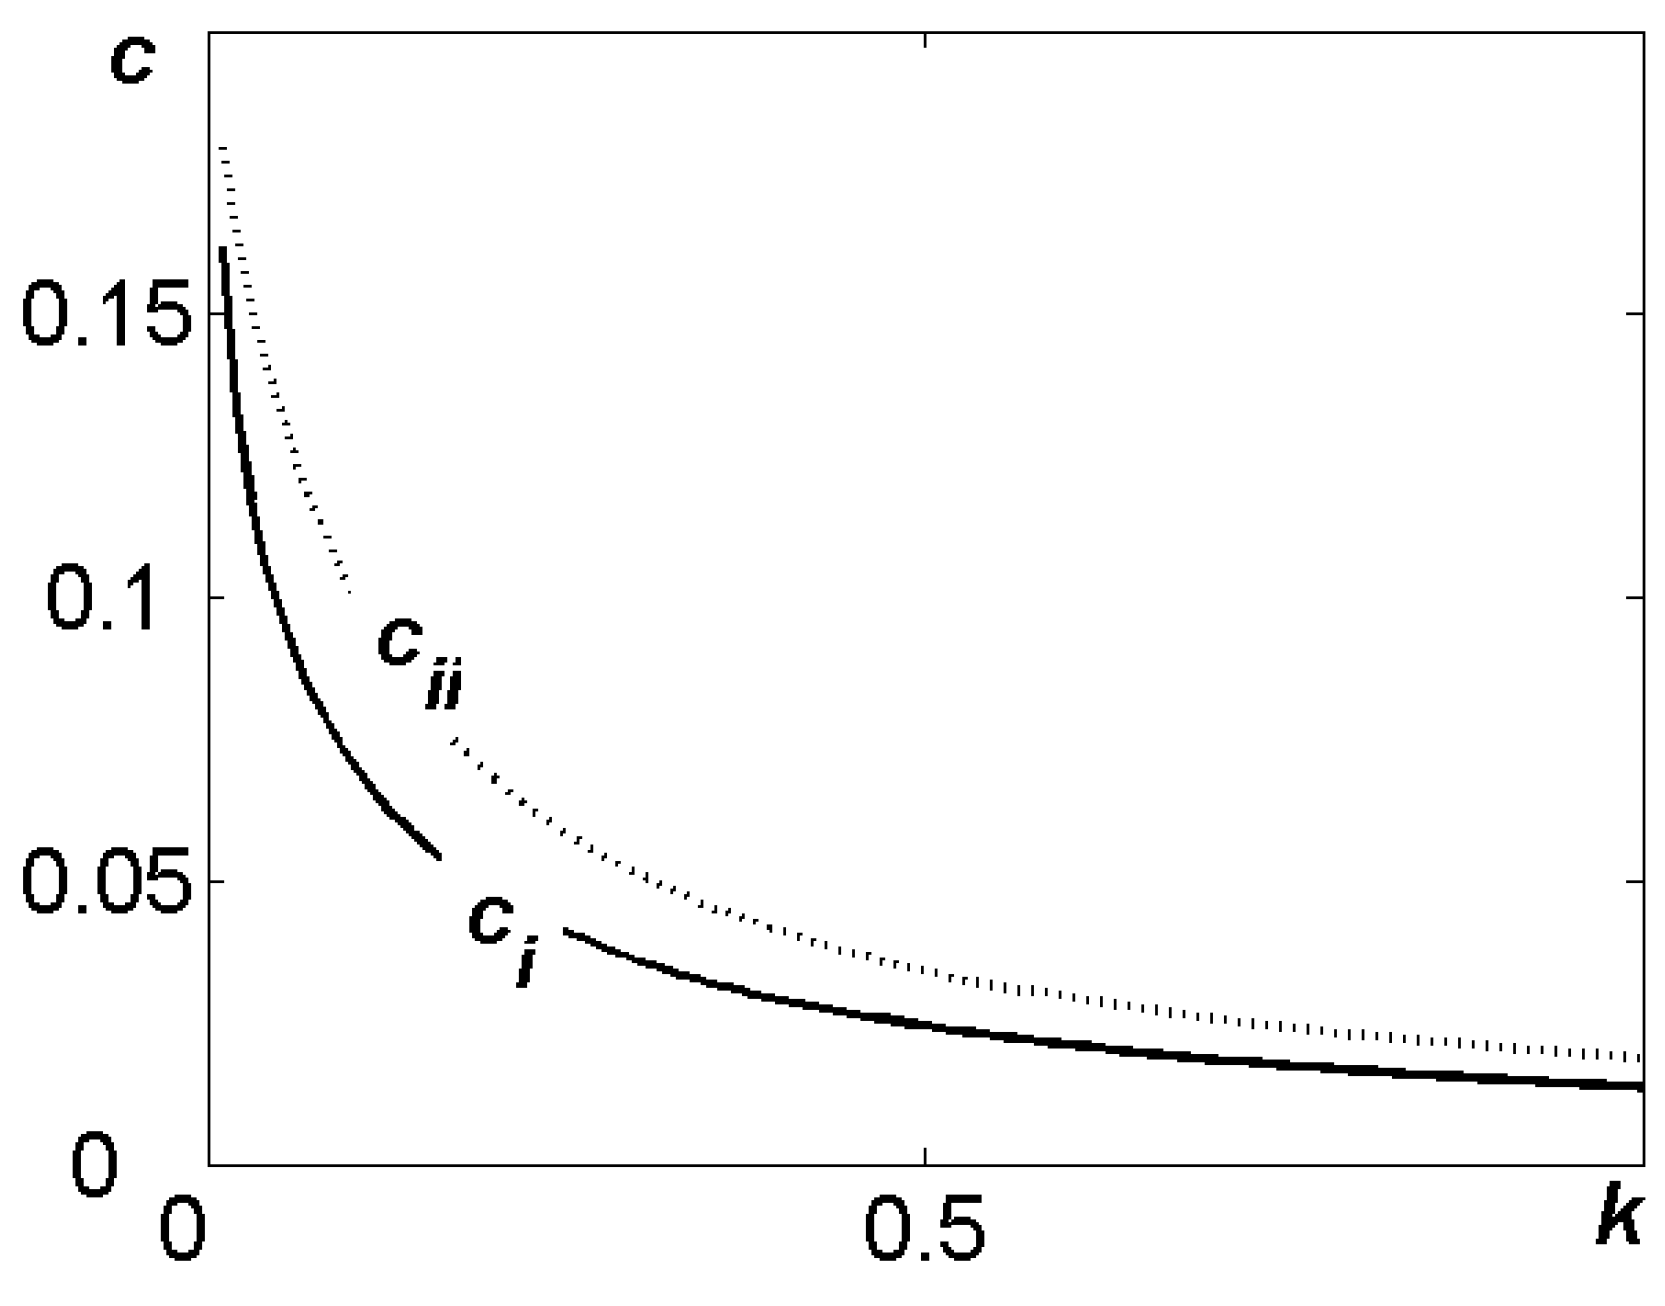
Proposition 5 confirms that our main conclusion remains robust under nonlinear education costs: the retailer provides green education when the associated cost c is below c i , as this strategy yields higher profits ( π r B * > π r A * ). However, for profit maximization, although green education can increase green adoption, and green innovation when c i < c < c i i , the retailer forgoes this approach as it does not contribute to maximizing profits. Moreover, as shown in Figure 5, both the thresholds of c i and c i i decrease with the investment efficiency of k . That is, if the retailer has a higher efficiency in green education, it would be more likely to adopt such a strategy and tolerate a higher additional cost of c . Observation 2, which follows directly from Proposition 5, confirms the result in observation 1. That is, the green education still triggers the Consumer Education Paradox, which establishes a fundamental conflict across three dimensions: retailer profit, and environmental performance.

5.2. Two Remedies

Since retailers’ profit-maximizing behaviors capture only partial, not total, sustainable gains from green adoption and innovation, governmental action becomes essential to achieve more sustainable outcomes through well-designed green policies. Among the various policy tools available, two subsidy mechanisms stand out for their effectiveness: the green product subsidy, which encourages consumers to choose environmentally friendly products by making them more financially attractive, and the green innovation subsidy, where governments offset a portion of manufacturers’ investments in green technology development [45,46].
This subsection first looks at government subsidy models that use the green product subsidy to boost green adoption. Observing the per-unit government subsidy of s , the game sequence follows the same consequence as Setting (B) in §3.2. Then, the retailer’s problem in §3.2 can be rewritten as:
max p π r B = ( p w + s ) q g + ( p w c + s ) q n max p ( p w + s ) ( 1 f ) ( 1 + g b p ) + ( p w c + s ) f ( 1 + g b p )
Maximizing the retailer’s problem provides p B
p B * * = g + b w b s + b c f + 1 2 b
Observing p B * * , the manufacturer chooses g and w to maximize her profits:
max w B , g B π m B = w ( q g + q n ) η g 2 max w B , g B w g + w + w b s b w 2 b c f w 2 η g 2
Solving the problems in yields w B and g B
w B * * =   4 η ( 1 + b s b c f ) 8 b η 1 , g B * * = 1 + b s b c f 8 b η 1
Substituting w B * * and g B * * into p B , π r B and π m B , yields the equilibrium outcomes in the Appendix I. A systematic comparison with §3.1 then exposes the implications of quantity subsidies, as detailed below (the proof is provided in the Online Appendix J).
Proposition 6.  
Given that s > s i , the green product subsidy to boost green adoption, i.e., q B * * > q A * .
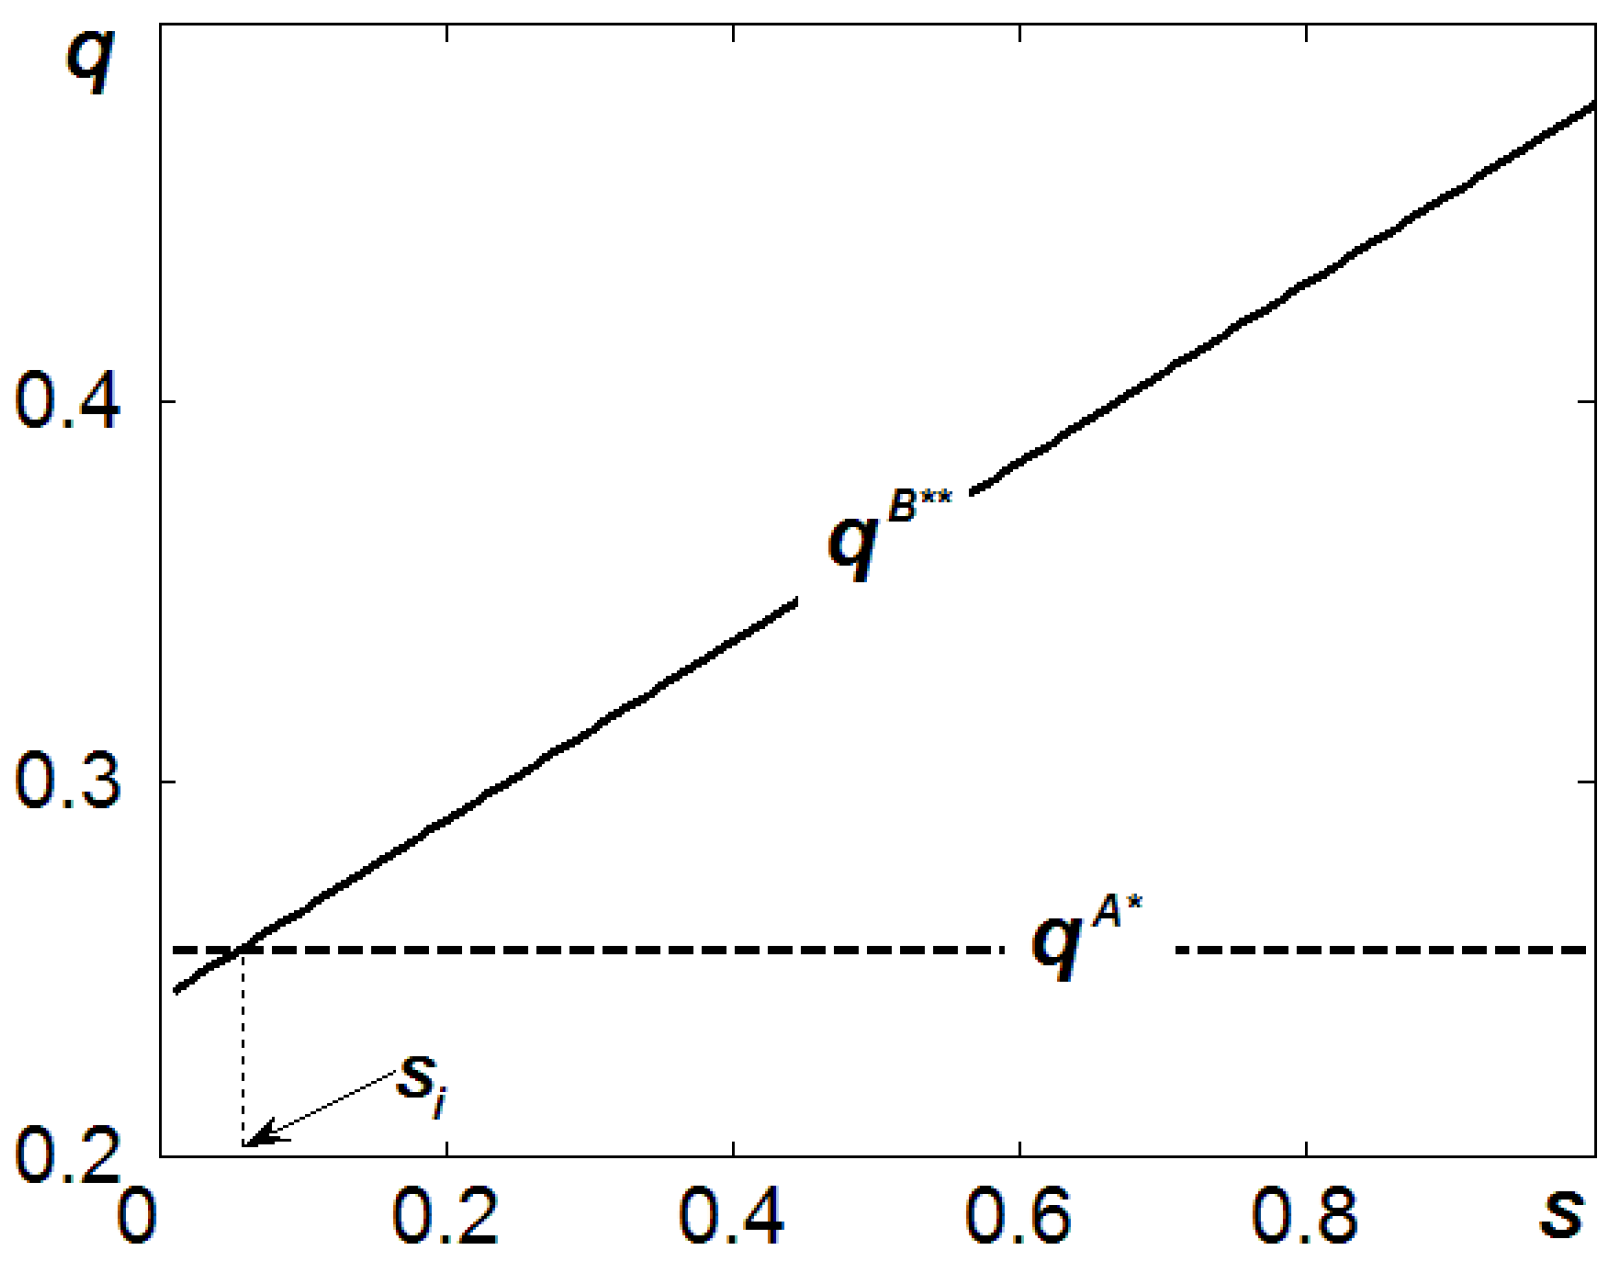
Green product subsidies have been widely implemented to boost green adoption. For example, the U.S. government’s US$7500 income tax credit for electric automobile buyers resulted in a marked increase in sales [45]. This real-world outcome is theoretically substantiated by Proposition 5, which posits that, when quantity subsidies s > s i , green product subsidies become effective in boosting green adoption. Furthermore, when governments enforce quantity-based subsidies, the optimal quantities of q B * * rises monotonically with the subsidy rate s , as reflected in the derivative q B * * / s > 0 . By evaluating the relationship between q B * * and q A * , we identify a pivotal subsidy threshold s i . When s i exceeds this threshold, q B * * systematically surpasses q A * , guaranteeing enhanced adoption rates and long-term sustainability benefits, i.e., q B * * > q A * (Figure 6 illustrates this result).
Our focus now shifts to the green innovation subsidy. Observing the subsidy of s on the manufacturer’s R&D investment of η ( g s ) 2 , the game sequence still follows the same consequence as Setting (B) in §3.2. Because the manufacturer undertakes product R&D investments in both models, the retailer’s problem is consistent with the one described in §3.2. However, given the retailer’s optimal decisions in §3.2, the manufacturer’s problems require explicit redefinition, as detailed next.
max w B , g B π m B = w ( q g + q n ) η ( g s ) 2 max w B , g B w g + w + w b s b w 2 b c f w 2 η ( g s ) 2
maximizing the problems in yields w B and g B :
w B * * * =   4 η ( 1 b c f + s ) 8 b η 1 , g B * * * = 1 + 8 η b s b c f 8 b η 1
Substituting w B * * * and g B * * * into p B , π r B and π m B , provides the equilibrium outcomes under the green innovation subsidy (the proof is provided in the Online Appendix K). Comparing the equilibrium outcomes with those in §3.1 exposes the implications of the green innovation subsidy, as follows (the proof is provided in the Online Appendix L).
Proposition 7.  
Given that s > s i i , the green innovation subsidy boosts green R&D, i.e., g B * * * > g A * .
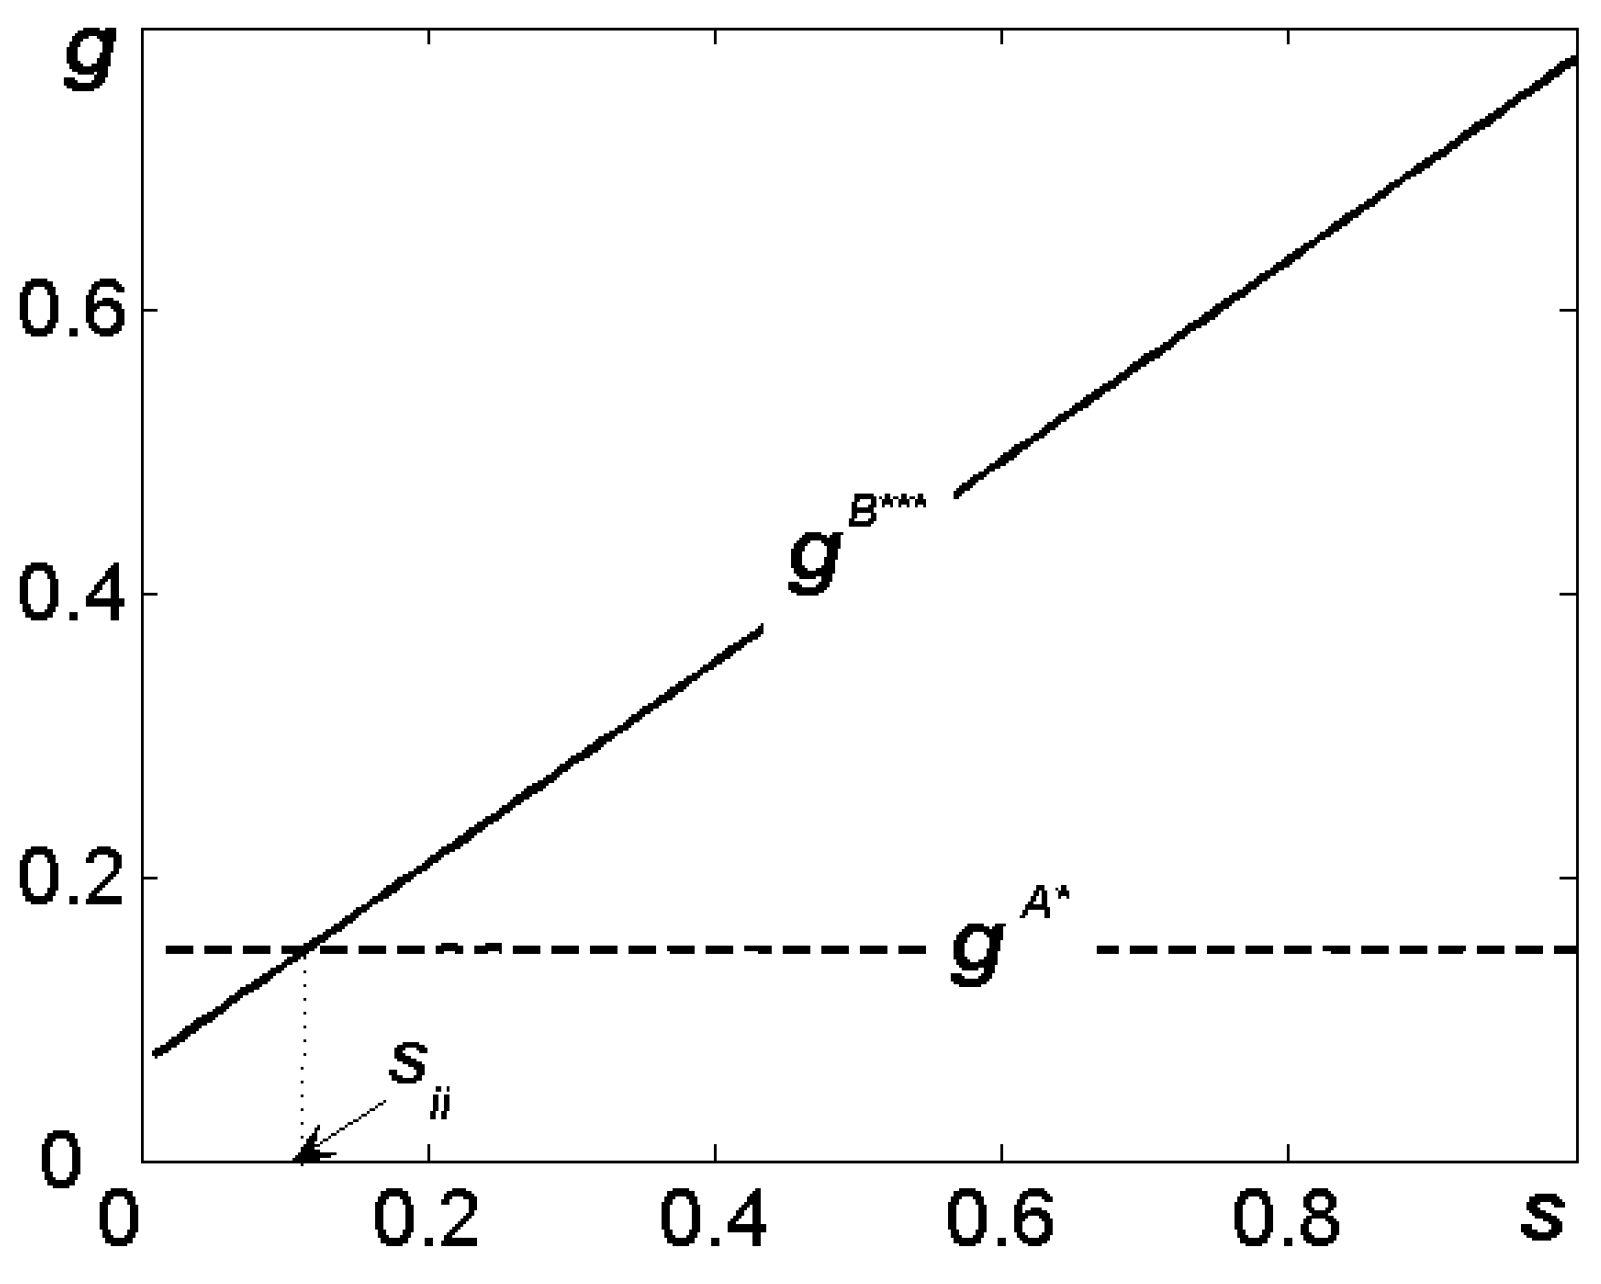
To advance product R&D, governments have widely adopted innovation subsidies. A notable case is the Advanced Propulsion Centre, which invests £30 million triannually in collaborative R&D for zero-emission vehicles [47]. Proposition 6 lends strong theoretical backing to such policies, revealing that when green innovation subsidies s > s i i , green innovation subsidies become effective in boosting green innovation. Furthermore, higher subsidy rates s lead to higher optimal green levels g B * * * , as reflected in the derivative g B * * * / s > 0 . Analyzing the g B * * * g A * relationship reveals a pivotal subsidy threshold s i i . If s > s i i , long-term sustainability also improves, meaning g B * * * > g A * (Figure 7 illustrates this result).
While both subsidies mitigate the Consumer Education Paradox, their fiscal impacts vary considerably. To identify the better option, we extend our analysis in the following observation (the proof is provided in the Online Appendix M).
Observation 3.  
Even if  s i i > s i
(i) 
The green innovation subsidy ensures a strictly higher green level ( g B * * * ) than the green product subsidy ( g B * * ), i.e.,  g B * * * > g B * * ;
(ii) 
Furthermore, the optimal quantity  q B * * * under the green innovation subsidy dominates  q B * * under the green product subsidy, meaning  q B * * * > q B * * .
Comparing the subsidy thresholds under green product subsidies, observation 2 first indicates that if the government aims to improve sustainability by enhancing product R&D, it should implement a higher subsidy rate, i.e., s i i > s i . Furthermore, observation 2 reveals that although the government must bear greater subsidy expenses, green innovation subsidies lead to more significant long-term sustainability improvements. Specifically, both the optimal green product innovation level and adoption under green innovation subsidies are higher than those under green product subsidies, i.e., g B * * * > g B * * , q B * * * > q B * * . This conclusion is reinforced by [45], who found that while green product subsidies are preferable from a cost perspective, green innovation subsidies are always more effective in maximizing subsidy efficiency. However, it should be noted that, unlike their discussion of subsidy strategies in a production process, we focus on the retailer’s green education initiatives. That is, they examine product adoption and green innovation subsidies in production operations contexts, whereas we concentrate on comparing the differences and advantages between the two strategies of retailers’ green education.

6. Conclusions

Previous studies in consumer education have established its dual benefits: enhancing consumers’ efficiency in information acquisition and evaluation and strengthening their capacity and inclination to consider recommended alternatives [6,48]. A critical gap remains, however, as these investigations neglect to address that the ‘educator and promoter’ motivation is fundamentally profit-maximizing rather than environmentally altruistic. This research intends to highlight whether profit-driven retailers should implement green education to ensure comprehensive information reaches non-green-conscious consumers, and what consequences such educational efforts might entail.
More specifically, we model a supply chain where the manufacturer conducts product R&D while the retailer distributes products to two distinct consumer segments. Green-conscious consumers translate environmental principles into purchasing decisions, while non-green-conscious consumers are deterred by perceived high costs and information deficits. The retailer engages in green education targeted at non-green-conscious consumers, providing clear product explanations to improve their willingness to pay for sustainable products. Crucially, the retailer’s motivation for this education is profit maximization, not altruistic environmental responsibility.
From theoretical perspectives, our paper addressed a gap in the literature and yielded several contributions to the aforementioned literature. First, we complement the previous studies, including Sun et al. [20], Abdulla et al. [21] and Florea et al. [22], by addressing the question of whether profit-maximizing retailers should implement green education to ensure comprehensive information delivery to non-green-conscious consumers. Second, following Zhou et al. [6], we also identify the consumer education paradox but distinguish our research by highlighting a significant segment of non-green-conscious consumers who are deterred by perceived high costs and lack of reliable information. Third, to resolve this, we analyze two government subsidy methods: one targeting green product quantity and the other promoting product R&D.
From practical perspectives, our analysis provided several important insights for both retail managers and policymakers seeking to promote sustainable consumption. For example, our analysis confirms that there exists a region where green education could further enhance product R&D and adoption, but the retailer forgoes it because doing so does not contribute to profit. This phenomenon—the inherent tension between a retailer’s individual profit maximization and overall environmental performance—is known as the ‘consumer education paradox’. Second, our analysis further uncovers a dual effect of the retailer’s green education, leading to either ‘win–win’ or ‘win–lose’ outcomes for the retailer and manufacturer. The latter outcome is particularly noteworthy as it reflects the retailer’s inherent profit-maximizing behavior, resulting in the retailer’s gain coming at the manufacturer’s expense. Finally, our analysis confirms that while both interventions are effective in alleviating the Consumer Education Paradox, they differ significantly in their fiscal implications. Specifically, although green innovation subsidies require considerably greater government financial commitment to achieve effectiveness, they consistently demonstrate superior effectiveness in fostering higher green product innovation levels and adoption.
Future research could address several limitations of our study. First, we focused solely on mathematical interpretation involving the division of consumers into two groups—‘green-conscious’ and ‘non-green-conscious’—which creates opportunities for empirical studies to be conducted using real-world data. Second, our assumption that retailers’ green education can overcome consumer discounted valuation at a per-unit cost doesn’t fully account for how effectiveness varies with educator efforts [49], suggesting potential research into alternative cost structures. Third, while we proposed green product and innovation subsidies to address the consumer education paradox, we neglected other remedies such as green credit policies, environmental regulations, and non-green product taxes. Examining these alternatives could broaden the applicability of our results. Finally, future research could explore alternative explanations or practical implementation challenges, such as alternative game-theoretic approaches (e.g., Nash bargaining), empirical validation (e.g., calibration to Walmart data), dual-purpose retailers (e.g., pursuing both profit and social welfare), or multi-supplier dynamics (e.g., Walmart’s interactions with multiple suppliers).

Author Contributions

Writing—original draft preparation, Z.H.; writing—review and editing, J.Z.; supervision, W.Y. All authors have read and agreed to the published version of the manuscript.

Funding

This research received no external funding.

Institutional Review Board Statement

Not applicable.

Informed Consent Statement

Not applicable.

Data Availability Statement

No new data were created or analyzed in this study.

Conflicts of Interest

The authors declare no conflicts of interest.

Appendix A. Analysis for Setting (A): Without Green Education

In setting (A), the total demand function is q = q g + q n = ( 1 f ) ( 1 + g b p ) + f ( 1 + ( 1 t ) g b p ) . Substituting it into max p π r A = ( p w ) q max p ( p w ) ( q g + q n ) , we can rewrite it as max p π r A = ( p w ) ( ( 1 f ) ( 1 + g b p ) + f ( 1 + ( 1 t ) g b p ) ) . Maximizing max p π r A yields p A = 1 + g   +   b w     g f t 2 b .
Substituting p A into max w A , g A π m A = w ( q g + q n ) η g 2 max w A , g A w + g w b w 2 g f t w 2 η g 2 . It is easy to obtain the Hessian matrix as follows.
H = 2 π m A w 2 2 π m A w g 2 π m A g w 2 π m A g 2 = b 1 f t 2 1 f t 2 2 η
From the Hessian matrix, we can obtain that, for η > f t 1 2 8 b , we can obtain that the manufacturer’s optimal wholesale price and greenness are w A * = 4 η 8 b η f 2 t 2 + 2 f t 1 , g A * = 4 η 8 b η f 2 t 2 + 2 f t 1 .
Substituting w A * and g A * into q A * , p A * , π r A * and π m A * , we can get the optimal decisions in Lemma 1.

Appendix B. Analysis for Setting (B): With Green Education

In setting (B), the retailer adopts a green education strategy, which incurs an additional cost of c , but offsets the negative impact of the valuation discount ( 1 t ) g on demand, q n . Then, substituting the demand function of q = q g + q n = ( 1 f ) ( 1 + g b p ) + f ( 1 + ( 1 t ) g b p ) into max p π r B = ( p w ) q g + ( p w c ) q n max p ( p w ) ( 1 f ) ( 1 + g b p ) + ( p w c ) f ( 1 + g b p ) Maximizing max p π r B yields p B = g   +   b w   +   b c f +   1 2 b .
Substituting p B into the manufacturer’s profits, we can obtain that max w B , g B π m B = w ( q g + q n ) η g 2 max w B , g B w g + w b w 2 b c f w 2 η g 2 . It is easy to obtain the Hessian matrix as follows.
H = 2 π m B w 2 2 π m B w g 2 π m B g w 2 π m B g 2 = b 1 2 1 2 2 η
From the Hessian matrix, we can obtain that, for η > 1 8 b , we can obtain that the manufacturer’s optimal wholesale price and product greenness are w B * =   4 η 1 b c f   8 b η 1 , g B * = 1 b c f 8 b η 1 .
Substituting w B * and g B * into q B * , p B * , π m B * and π r B * , we can get the equilibrium outcomes in Lemma 2.

Appendix C. Proof of Proposition 1

To clarify the influence of the retailer’s green education, we conduct a comparative analysis of the retailer’s profits under both scenarios to determine that
π r B * π r A * = 4 b η 2 ( b c f 1 ) 2 ( 8 b η 1 ) 2 4 b η 2 ( f 2 t 2 2 f t 8 b η + 1 ) 2 = 4 b η 2 64 b 4 c 2 η 2 f 2 16 b 3 c 2 η f 4 t 2 + 32 b 3 c 2 η f 3 t 16 b 3 c 2 η f 2 128 b 3 c η 2 f + b 2 c 2 f 6 t 4 4 b 2 c 2 f 5 t 3 + 6 b 2 c 2 f 4 t 2 4 f t 4 b 2 c 2 f 3 t + b 2 c 2 f 2 + 32 b 2 c η f 3 t 2 64 b 2 c η f 2 t + 6 f 2 t 2 4 f 3 t 3 2 b c f 5 t 4 + 32 b 2 c η f + 8 b c f 4 t 3 2 b c f + f 4 t 4 12 b c f 3 t 2 + 8 b c f 2 t 16 b η f 2 t 2 + 32 b η f t ( 8 b η 1 ) 2 ( f 2 t 2 2 f t 8 b η + 1 ) 2 .
Through observation, we find that the equation above is a quadratic function in terms of c , with its quadratic coefficient being b 2 f 2 ( f 2 t 2 2 f t 8 b η + 1 ) 2 > 0 .
Solving π r B * π r A * provides two roots of c 1 = 2 t f t 2 8 η f 2 t 2 + 2 f t 1 , c 2 = f 2 t 2 2 f t 16 η + 2 f + f 3 t 2 8 η f 2 f 2 t > 1 .
Since b 2 f 2 ( f 2 t 2 2 f t 8 b η + 1 ) 2 > 0 and 0 < c 1 < 1 < c 2 , we find that, for η > 1 8 b , π r B * π r A * > 0 holds for any c < c1.
That is, as shown in Proposition 1, there exists a cost threshold of c i = c 1 , and the retailer undertakes green education if and only if c < c i = 2 t f t 2 8 η f 2 t 2 + 2 f t 1 .
After computing the partial derivative with respect to c i , the following results are obtained:
c i f = t 2 ( f 2 t 2 + 4 f t 8 η 3 ) ( 2 f t f 2 t 2 + 8 η 1 ) 2 ,   c i t = 2 ( 1 f t ) ( 8 η 1 ) ( 2 f t f 2 t 2 + 8 η 1 ) 2
Given that η > 1 8 b , it follows that c i / f < 0 and c i / t > 0 .

Appendix D. Proof of Proposition 2

Through a comparative analysis of sales volumes under both scenarios, we obtain the result that q B q A = 2 b η r 2 t 2 2 f t 8 b η + 1 2 b η ( b c f 1 ) 8 b η 1 .
Solving q B q A if c < c i i = t ( 2 t f ) 8 η b t 2 f 2 + 2 t f 1 , then q B q A > 0 .
Comparing c i i with c i , we find that, for η > 1 8 b , c < c i < c i i . Then, we can conclude that, besides q B q A > 0 holding for any c < c i , this relationship remains valid for any c i < c < c i i .

Appendix E. Proof of Proposition 3

Comparing the manufacturer’s green innovation efforts under both scenarios: g B g A = 1 b c f 8 b η 1 f t 1 f 2 t 2 2 f t 8 b η + 1 .
Solving g B g A , we obtain that, if c < c i i i = t ( 8 η b t f + 1 ) b ( 8 η b t 2 f 2 + 2 t f 1 ) , then g B g A > 0 .
Comparing c i i i with c i , we find that, for η > 1 8 b , c < c i < c i i i . We can conclude that, besides g B g A > 0 holding for any c < c i , this relationship remains valid for any c i < c < c i i i .

Appendix F. Proof of Proposition 4

Comparing the analysis of the manufacturer’s profitability under both scenarios, π m B * π m A * = ( η ( b c f 1 ) 2 ) 8 b η 1 + η f 2 t 2 2 f t 8 b η + 1 .
After simplifying, the solution yields the following two roots:
c 3 = f 2 t 2 8 b η 2 f t + 1 + ( 8 b η 1 ) ( 8 b η f 2 t 2 + 2 f t 1 ) b f 3 t 2 8 η b 2 f 2 b f 2 t + b f
c 4 = f 2 t 2 8 b η 2 f t + 1 ( 8 b η 1 ) ( 8 b η f 2 t 2 + 2 f t 1 ) b f 3 t 2 8 η b 2 f 2 b f 2 t + b f
Comparing c 3 = c i v with c 1 = c i , we find that, for η > 1 8 b , c < c i v < c i . Then we can conclude that, besides π m B * > π m A * holding for any c < c i v , π m B * < π m A * for c i v < c < c i .
That is, as shown in Proposition 4, there exists a cost threshold of c i v = c 3 , the retailer’s green education enhances the manufacturer’s profitability if and only if the cost does not exceed this threshold.

Appendix G. Analysis for Green Education with Nonlinear Costs

After substituting (9) in §5.1 into the retailer’s problem (10) in §5.1, we can rewrite this as:
max p π r B = ( p w ) q g + ( p w c ) q n k x 2 max p ( p w ) ( 1 f ) ( 1 + g b p ) + ( p w c ) f ( 1 + ( 1 t ) g + x b p ) k x 2
Maximizing the above problem provides
p = 1 + g + w b f g t + f x + f b c 2 b
Substituting it into the manufacturer’s problem, then we can rewrite it as:
max w B π m B = w ( q g + q n ) g 2 max w B w ( 1 f ) ( 1 + g b p ) + w f ( 1 + ( 1 t ) g + x b p ) g 2
Maximizing it provides
w = 1 f g t + f x + g f b c 2 b
After substituting p and w into both parties’ problems, then we can rewrite them as:
max g B π m B = 1 + 2 f g x 2 f g t + 2 g 2 f 2 g t x + g 2 2 f g 2 t + f 2 x 2 + f 2 g 2 t 2 + 2 f 2 g t b c 2 f 2 x b c 2 g f b c + f 2 b 2 c 2 2 f b c + 2 f x 8 g 2 b 8 b max x B π r B = 16 k x 2 b 2 f g x + 2 f g t 2 g + 2 f 2 g t x g 2 + 2 f g 2 t + 14 f 2 g t b c f 2 g 2 t 2 f 2 x 2 14 f 2 x b c + 2 g f b c f 2 b 2 c 2 + 2 f b c 1 2 f x 16 f b c t g + 16 f b c x 16 b
Maximizing the above problems provides
g = ( r t 1 ) ( c r 2 r 3 c + 2 k b r c 2 k ) 2 k ( 8 k b r 2 + 2 r t r 2 t 2 1 ) X = r ( 2 c t r 2 r c 2 c t r + 2 k + c 8 k b c + r 2 t 2 c r 3 t 2 c + 6 k b r c ) 2 k ( r 2 + 8 k b + 2 r t r 2 t 2 1 )
Substituting them into w B * , q B * , p B * , π m B * and π r B * , π r B * we can get the equilibrium outcomes as follows.
π r B * = 4 f 4 k c + 2 f 5 t 3 c 2 32 f 2 t 2 k 2 b c + 4 f 4 t 4 c k 12 f 3 c 2 t 2 k b + 4 f 2 c 2 k b t 32 c 2 t f 2 k 2 b 2 + 12 c 2 t 3 f 4 k b + 12 k b c 2 f 5 t + 32 k 2 b 2 f 3 c 2 t + 3 f 4 c 2 4 f 5 c 2 + f 2 c 2 + 2 f 6 c 2 + 32 k 2 b 2 c 2 f 3 t 2 4 r 5 t 4 c 2 k b + 16 k 3 b 4 k 2 f 2 12 c t 3 f 3 k + 4 f 6 c 2 t 2 k b 4 f 5 t 2 c 2 k b 12 c 2 t 3 f 5 k b + 4 f 6 t 4 c 2 k b f 6 t 4 c 2 + 2 f 7 t 4 c 2 f 8 t 4 c 2 + 12 f 3 c 2 t k b + 12 f 4 c 2 t 2 k b + 20 k b c 2 f 5 32 k 2 b 2 f 4 c 2 t 2 + 16 k 3 b 3 f 2 c 2 112 k 2 b 2 f 3 c 2 4 f 5 c t 2 k 8 f 6 c 2 k b + 4 f 4 t 2 c k + 12 c t 3 f 4 k 4 k f 3 t c 32 f 2 t k 2 b c + 32 f 3 t 2 k 2 b c 4 f 5 c 2 t + 4 f 4 c 2 t 4 f 5 c k 2 f 7 c 2 t + 2 f 7 t 3 c 2 4 f 6 t 3 c 2 2 f 3 c 2 t 2 f 3 c 2 + 24 f 3 k 2 b c + 4 f 4 k t c 32 k 3 b 2 f c 12 r 3 c t 2 k + 4 r 2 c t k 28 r 4 c 2 k b + 64 r 2 c 2 k 2 b 2 + 32 r 3 c 2 k b 28 k b r 4 c 2 t 4 f c k t + 12 f 2 c t 2 k 4 f 5 t 4 c k 16 k 2 b c f 2 + 4 f 6 c 2 t + 44 k 2 b 2 c 2 f 4 + 32 c t f k 2 b 16 f 2 c 2 k b 4 k ( 1 + f 2 8 k b 2 f t + f 2 t 2 ) 2 g B * = ( f t 1 ) ( c f 2 f 3 c + 2 k b f c 2 k ) 2 k ( 8 k b r 2 + 2 r t r 2 t 2 1 ) x B * = f ( 2 c t f 2 f c 2 c t f + 2 k + c 8 f b c + f 2 t 2 c f 3 t 2 c + 6 k b f c ) 2 k ( f 2 + 8 k b + 2 f t r 2 t 2 1 ) w B * = 2 ( 2 k b f c f 3 c + c f 2 2 k ) 1 + f 2 8 k b 2 f t + f 2 t 2 q B * = ( f 3 c 2 k b f c c f 2 + 2 k ) b 1 + f 2 8 k b 2 f t + f 2 t 2 π m B * = ( 2 k b f c f 3 c + c f 2 2 k ) 2 ( 8 k 2 b f 2 t 2 + 2 f t 1 ) 4 k 2 ( 1 + f 2 8 k b 2 f t + f 2 t 2 ) 2

Appendix H. Proof of Proposition 5

The proof of Proposition 5 is similar to that in Propositions 1, 2, and 3, and thus we omit the details here for brevity. Since the analytical solution is excessively long, to simplify, we further normalize factor b to 1.
Similar to that in Proposition 1, comparing π r B * π r A * provides
c i = ( f 2 t 2 7 2 f t ) ( 4 k 2 t 4 f 4 4 k 2 t 4 f 3 12 k 2 f 3 t 3 + 12 k 2 f 2 t 3 + 2 f 4 t 2 k 2 f 3 k t 2 20 k 2 f 2 t 2 + 20 k 2 f t 2 2 f 3 t k + 2 f 2 t k + 28 k 2 t f 28 k 2 t + f 4 f 3 18 f 2 k + 16 f k + 32 k 2 ) ( ( 448 k 2 t f + f 6 t 4 + 196 t 2 k 2 + 64 f 5 k t 4 + 192 f 4 t 2 k + 256 k 2 192 f 4 k t 3 352 f 3 k t 2 + 480 f 2 t k + 160 f 2 t 2 k + f 2 224 f t k 18 f 3 + 256 f k 24 f 4 t 472 k 2 f 3 t 3 124 k 2 f 2 t 2 4 k 2 t 4 f 4 10 f 4 t 2 4 f 5 t 3 8 k 2 t 8 f 7 + 8 k 2 f 5 t 6 + 48 k 2 f 6 t 7 + 20 f 5 t 2 352 k 2 f 4 t 5 + 752 k 2 f 2 t 3 72 k 2 f t 2 + 12 f 5 t 4 f 7 t 3 + f 8 t 4 10 f 6 t 2 448 k 2 t 2 f 7 t 4 + 72 k 2 t 4 f 3 + 4 k 2 t 8 f 8 + 8 f 6 t 3 + 17 f 4 272 f 2 k 256 f 3 t k + 176 k 2 t 5 f 5 4 k 2 f 6 t 6 24 k 2 t 7 f 7 + 96 k t 3 f 5 32 k t 4 f 4 + 96 k f 3 t 3 32 f 6 k t 4 + 4 t 8 k 2 f 6 24 t 7 k 2 f 5 4 t 6 k 2 f 4 + 176 t 5 k 2 f 3 68 t 4 k 2 f 2 280 t 3 k 2 f + 12 f 3 t ) ( 2 f 2 t 2 k 14 k + f 2 4 f t k ) 2 ) ( 1 / 2 ) 2 ( f 2 t 2 7 2 f t ) 28 k 2 t f + 12 f 4 t k + 2 f 6 t 3 k f 5 k t 4 + 32 k f 3 2 f 4 t 2 k + 2 f 4 k t 3 + 14 f 2 t k 2 f 5 3 f 3 + 49 f k f 4 t + 12 k 2 f 3 t 3 + 2 f 6 k t 4 f 7 k t 4 + 20 k 2 f 2 t 2 4 k 2 t 4 f 4 + 2 f 5 t + 28 k 2 t f 2 + 5 f 4 82 f 2 k 26 f 3 t k + 2 f 5 t 2 k 20 k 2 f 3 t 2 + 16 k 2 f f 6 t 4 k t 3 f 5 + 4 k 2 t 4 f 5 12 k 2 f 4 t 3
Comparing q B * q A * provides
c i i = f 14 k 7 f 2 + f 4 t 2 2 f 3 t + 7 f f 3 t 2 + 2 f 2 t 2 f 2 t 2 + 4 f t k ,
Comparing g B * g A * provides
c i i i = c i i = f 14 k 7 f 2 + f 4 t 2 2 f 3 t + 7 f f 3 t 2 + 2 f 2 t 2 f 2 t 2 + 4 f t k .

Appendix I. Analysis for Green Education Under Product Subsidy

If we ;et s represent the per-unit government subsidy, the retailer’s problem in §3.2 can be rewritten as:
max p π r B = ( p w + s ) q g + ( p w c + s ) q n max p ( p w + s ) ( 1 f ) ( 1 + g b p ) + ( p w c + s ) f ( 1 + g b p )
Maximizing the retailer’s problem provides p B :
p B * * = g   +   b w     b s +   b c f +   1 2 b
Observing p B * * , the manufacturer chooses g and w to maximize her profits:
max w B , g B π m B = w ( q g + q n ) η g 2 max w B , g B w g + w + w b s b w 2 b c f w 2 η g 2
Solving the problems in yields w B and g B :
w B * * =   4 η ( 1 + b s b c f ) 8 b η 1 , g B * * = 1 + b s b c f 8 b η 1
Substituting w B * * and g B * * into q B * * , p B * * , π m B * * and π r B * * , we can get the equilibrium outcomes as follows.
p B * * = 6 η + s c f 2 η b s + 2 η b c f 8 b η 1 ,   q B * * = 2 b η ( 1 + b s b c f ) 8 b η 1 π m B * * = η ( b s b c f + 1 ) 2 8 b η 1 ,   π r B * * = 4 b η 2 ( b s b c f + 1 ) 2 ( 8 b η 1 ) 2 .

Appendix J. Proof of Proposition 6

Comparing the analysis of quantities under green product subsidies with q A * under setting A,
q B * * q A * = 2 b η ( 1 + b s b c f ) 8 b η 1 2 b η 2 f t f 2 t 2 + 8 b η 1 = 2 b η ( 2 f t f 2 t 2 b s f 2 t 2 + 2 b s f t + 8 b 2 η s b s + b c f 3 t 2 2 b c f 2 t 8 b 2 η c f + b c f ) ( 8 b η 1 ) ( 2 f t f 2 t 2 + 8 b η 1 )
Solving q B * * q A * , we can obtain that, if c > t ( 2 f t ) b ( 2 f t f 2 t 2 + 8 b η 1 ) , there exists a threshold of s i = f ( f t 2 2 t b c f 2 t 2 + 2 b c f t + 8 b 2 η c b c ) b ( 2 f t f 2 t 2 + 8 b η 1 ) > 0 . Then, q B * * > q A * would be true for s > s i .

Appendix K. Analysis for Green Education Under Green Innovation Subsidy

Since the manufacturer undertakes green R&D investments in both models, the retailer’s problem is consistent with the one described in §3.2. That is, substituting the demand function of q = q g + q n = ( 1 f ) ( 1 + g b p ) + f ( 1 + ( 1 t ) g b p ) into max p π r B = ( p w ) q g + ( p w c ) q n max p ( p w ) ( 1 f ) ( 1 + g b p ) + ( p w c ) f ( 1 + g b p ) Maximizing it yields p B * * * = g   +   b w   +   b c f +   1 2 b .
Substituting p B * * * into the manufacturer’s profits, we can obtain that max w B , g B π m B = w ( q g + q n ) η ( g s ) 2 max w B , g B w g + w + w b s b w 2 b c f w 2 η ( g s ) 2 . Maximizing the manufacturer’s problems in yields w B and g B :
w B * * * =   4 η ( 1 b c f + s ) 8 b η 1 , g B * * * = 1 + 8 η b s b c f 8 b η 1
Substituting w B * * * and g B * * * into q B * * * , p B * * * , π m B * * * and π r B * * * , we can get the equilibrium outcomes as follows.
p B * * * = 6 η s c f + 6 η + 2 η b c f 8 b η 1 , q B * * * = 2 b η ( 1 b c f + s ) 8 b η 1 , π m B * * * = η ( s b c f + 1 ) 2 8 b η 1 , π r B * * = 4 b η 2 ( 1 b c f + s ) 2 ( 8 b η 1 ) 2 .

Appendix L. Proof of Proposition 7

Comparing the analysis of green levels under the green innovation subsidy with g A * under setting A: g B * * * g A * = 1 + 8 η b s b c f 8 b η 1 f t 1 f 2 t 2 2 f t 8 b η + 1 .
Solving g B * * * g A * , we can obtain that, if c > t ( 1 f t + 8 b η ) b ( 2 f t f 2 t 2 + 8 b η 1 ) , there exists a threshold of s i i = f ( f t 2 t b c f 2 t 2 + 2 b c f t + 8 b 2 η c b c 8 t b η ) 8 b η ( 2 f t f 2 t 2 + 8 b η 1 ) > 0 . Then, we can obtain that, g B * * * > g A * would be true for s > s i i .

Appendix M. Proof of Observation 3

Comparing s i i and s i ,
s i i s i = f 64 c b 2 η 2 8 c b 2 η 8 c b f 2 η t 2 + c b f 2 t 2 + 16 c b f η t 2 c b f t + 8 b η t 8 c b η + c b + 8 f η t 2 f t 2 16 η t + t 8 b η ( 2 f t f 2 t 2 + 8 b η 1 ) . Solving it, we find that, for any c > t ( 1 f t + 8 b η ) b ( 2 f t f 2 t 2 + 8 b η 1 ) , s i i s i > 0 is always true.
Comparing g B * * * and g B * * ,
g B * * * g B * * = 1 + 8 η b s b c f 8 b η 1 1 + b s b c f 8 b η 1 = b s 8 k 1 8 b k 1
we find that, for η > 1 8 b , g B * * * > g B * * holds.
Comparing q B * * * and q B * * ,
q B * * * q B * * = 2 b η ( 1 b c f + s ) 8 b η 1 2 b η ( 1 + b s b c f ) 8 b η 1 = 2 b η s ( b 1 ) 8 b k 1
we find that, for η > 1 8 b , q B * * * > q B * * holds.

References

  1. Chen, X.; Wang, X.; Zhou, M. Firms’ green R&D cooperation behaviour in a supply chain: Technological spillover, power and coordination. Int. J. Prod. Econ. 2019, 218, 118–134. [Google Scholar] [CrossRef]
  2. Li, R.R.; Du, J.; Wu, J.; Chen, X.L. Government carbon reduction policies and the shift to green lifestyles: The role of innovation, incentive, driving and economic effect. J. Environ. Manag. 2025, 374, 124056. [Google Scholar] [CrossRef] [PubMed]
  3. Tesla Impact Report 2024. Available online: https://www.tesla.com/ns_videos/2024-tesla-impact-report-highlights.pdf (accessed on 20 September 2025).
  4. Tully, S.M.; Winer, R.S. The Role of the Beneficiary in Willingness to Pay for Socially Responsible Products: A Meta-analysis. J. Retail. 2014, 90, 255–274. [Google Scholar] [CrossRef]
  5. Zhou, X.; Checco, J.; Akber, M.A.; Aziz, A.A. Factors influencing consumer preferences for sustainably produced rice: A systematic review. Clean. Responsible Consum. 2025, 18, 100309. [Google Scholar] [CrossRef]
  6. Zhou, Y.; Xiong, Y.; Jin, M. Less is more: Consumer education in a closed-loop supply chain with remanufacturing. Omega 2021, 101, 102259. [Google Scholar] [CrossRef]
  7. GlobeScan Healthy & Sustainable Living Report 2024. Available online: https://globescan.wpenginepowered.com/wp-content/uploads/2024/12/GlobeScan_Healthy_and_Sustainable_Living_Highlights_Report_2024-V2.pdf (accessed on 22 September 2025).
  8. Bai, Q.; Chen, J.; Xu, J. Energy conservation investment and supply chain structure under cap-and-trade regulation for a green product. Omega Int. J. Manag. Sci. 2023, 119, 102886. [Google Scholar] [CrossRef]
  9. Nath, V.; Kumar, R.; Agrawal, R.; Gautam, A.; Sharma, V. Consumer Adoption of Green Products: Modeling the Enablers. Glob. Bus. Rev. 2013, 14, 453–470. [Google Scholar] [CrossRef]
  10. Wen, D.; Xiao, T.; Dastani, M. Channel choice for an independent remanufacturer considering environmentally responsible consumers. Int. J. Prod. Econ. 2021, 232, 107941. [Google Scholar] [CrossRef]
  11. Zhang, X.Q. Retailer anticipated regret under carbon tax policy. RAIRO-Oper. Res. 2024, 58, 4341–4371. [Google Scholar] [CrossRef]
  12. Lou, Y.Q.; Feng, L.P.; He, S.G.; He, Z.; Zhao, X.K. Logistics service outsourcing choices in a retailer-led supply chain. Transp. Res. E-Log. 2020, 141, 101944. [Google Scholar] [CrossRef]
  13. Gielens, K.; Geyskens, I.; Deleersnyder, B.; Nohe, M. The New Regulator in Town: The Effect of Walmart’s Sustainability Mandate on Supplier Shareholder Value. J. Mark. 2018, 82, 124–141. [Google Scholar] [CrossRef]
  14. Kim, Y.M.; Bendle, N.T.; Hulland, J.; Pfarrer, M.D. Corporate sustainability research in marketing: Mapping progress and broadening our perspective. J. Acad. Mark. Sci. 2024, 52, 1495–1512. [Google Scholar] [CrossRef]
  15. Green Digest Evaluating a Company’s Impact (The Case of Walmart). Available online: https://www.greendigest.co/p/evaluating-a-company-s-impact-the-case-of-walmart (accessed on 4 October 2025).
  16. Blue Yonder 2025 Sustainability Survey. Available online: https://edge.sitecorecloud.io/blueyonderie8e6-corporateefb0-prod6ccb-be06/media/project/blueyonder/corporate/files/resources/consumer-sustainability-survey.pdf (accessed on 23 September 2025).
  17. Sun, L.; Yuan, Q.X. Only the Friendly Face? The Consequences of Consumer Education for Green Consumerism in Remanufacturing. Sustainability 2024, 16, 7411. [Google Scholar] [CrossRef]
  18. Zhong, L.; Nie, J.J.; Lim, M.K.; Xia, S.M. Agency or Self-Run: The effect of consumer green education on recyclers’ distribution channel choice under platform economy. Int. J. Logist. Res. Appl. 2022, 25, 814–836. [Google Scholar] [CrossRef]
  19. Wang, M.M.; Yang, F.; Xia, Q. Design of the reverse channel for the third-party remanufacturing considering consumer education. RAIRO-Oper. Res. 2021, 55, 3513–3540. [Google Scholar] [CrossRef]
  20. Sun, H.X.; Liu, Y.X. Production decisions in remanufacturing under the cap-and-trade considering consumer education and government subsidies. Comput. Ind. Eng. 2023, 182, 109358. [Google Scholar] [CrossRef]
  21. Abdulla, H.; Abbey, J.D.; Atalay, A.S.; Meloy, M.G. Show, don’t tell: Education and physical exposure effects in remanufactured product markets. J. Oper. Manag. 2024, 70, 243–256. [Google Scholar] [CrossRef]
  22. Florea, D.L.; Rangarajan, D.; Nieto-Saucedo, M.; Shanka, M.S.; Osakwe, C.N. Customer education in business-to-business contexts. Ind. Mark. Manag. 2025, 128, 54–70. [Google Scholar] [CrossRef]
  23. Xie, X.M.; Huo, J.G.; Zou, H.L. Green process innovation, green product innovation, and corporate financial performance: A content analysis method. J. Bus. Res. 2019, 101, 697–706. [Google Scholar] [CrossRef]
  24. Abadzhiev, A.; Sukhov, A.; Sihvonen, A.; Johnson, M. Managing the complexity of green innovation. Eur. J. Innov. Manag. 2022, 25, 850–866. [Google Scholar] [CrossRef]
  25. Lin, K.; Lin, Y. Network reliability evaluation of a supply chain under supplier sustainability. Comput. Ind. Eng. 2024, 190, 110023. [Google Scholar] [CrossRef]
  26. Ai, M.Y.; Luo, F.; Bu, Y. Green innovation and corporate financial performance: Insights from operating risks. J. Clean. Prod. 2024, 456, 142353. [Google Scholar] [CrossRef]
  27. Quadir, A.; Raj, A.; Foropon, C.R.H. Sharing demand information in competing supply chains with greening efforts. J. Environ. Manag. 2025, 373, 123626. [Google Scholar] [CrossRef] [PubMed]
  28. Lambrecht, D.; Willeke, T.; Cucculelli, M.; Meloni, D. Green patents and green trademarks as indicators of green innovation. Res. Policy 2025, 54, 105138. [Google Scholar]
  29. Azevedo, A.; Pereira, P.J.; Rodrigues, A. Optimal timing and capacity choice with taxes and subsidies under uncertainty. Omega 2021, 102, 102312. [Google Scholar] [CrossRef]
  30. Wang, Y.; Wang, Z.; Li, B.Y.; Cheng, Y.B. The choice of subsidy policy for incentivizing product design for environment. Comput. Ind. Eng. 2023, 175, 108883. [Google Scholar] [CrossRef]
  31. Guo, Z.; Du, Y.; Zhao, Y. Sustaining the advancement of new energy vehicles in the post-subsidy era: Carbon quota mechanisms and subsidy mechanisms for recycling of used batteries. Sustain. Prod. Consum. 2024, 45, 158–176. [Google Scholar] [CrossRef]
  32. Corsini, L. A systems approach the Circular Economy: Policy recommendations to increase building components reuse. Sustain. Prod. Consum. 2025, 57, 292–305. [Google Scholar] [CrossRef]
  33. Chen, Z.; Keppo, J. R&D Data Sharing in New Product Development. M&Som-Manuf. Serv. Oper. Manag. 2025, 27, 1275–1294. [Google Scholar]
  34. Sun, F.; Yang, H.; Chen, J.; Chen, B.; Yu, B. Information service and quality strategies in a supply chain. Transp. Res. E-Log. 2025, 199, 104169. [Google Scholar] [CrossRef]
  35. Yang, Q.; Sun, L.; Wu, X.; Li, Y. Implications of retailer-owned digital twins services: The trade-offs between customer experience, misfit returns reduction, and investment costs. J. Retail. Consum. Serv. 2026, 88, 104478. [Google Scholar] [CrossRef]
  36. Wu, D.D.; Ding, H.; Cheng, Y. Green technology investment in competitive supply Chains: Exploring technology spillovers and altruistic preferences under carbon tax policy. J. Clean. Prod. 2025, 517, 145871. [Google Scholar] [CrossRef]
  37. Smith, E.O.; Shulman, J.D. Product diversion by vertically differentiated firms. Prod. Oper. Manag. 2022, 31, 1928–1939. [Google Scholar] [CrossRef]
  38. Nire, K.; Matsubayashi, N. Entry decisions for vertically differentiated markets with brand spillovers. Eur. J. Oper. Res. 2024, 314, 565–578. [Google Scholar] [CrossRef]
  39. Olsder, W.; Martagan, T.; Tang, C.S. Improving Access to Rare Disease Treatments: Subsidy, Pricing, and Payment Schemes. Manag. Sci. 2022, 69, 5256–5274. [Google Scholar] [CrossRef]
  40. Arya, A.; Mittendorf, B.; Sappington, D.E.M. The Bright Side of Supplier Encroachment. Mark. Sci. 2007, 26, 651–659. [Google Scholar] [CrossRef]
  41. Yang, J.; Li, K.W.; Huang, J. Manufacturer encroachment with a new product under network externalities. Int. J. Prod. Econ. 2023, 263, 108954. [Google Scholar] [CrossRef]
  42. Porter, M.E. Competitive Strategy: Techniques for Analyzing Industries and Competitors; Free Press: Washington, DC, USA, 2020. [Google Scholar]
  43. Ma, Z.F.; Gill, T.; Jiang, Y. Core Versus Peripheral Innovations: The Effect of Innovation Locus on Consumer Adoption of New Products. J. Mark. Res. 2015, 52, 309–324. [Google Scholar] [CrossRef]
  44. Agrawal, V.V.; Ferguson, M.; Toktay, L.B.; Thomas, V.M. Is Leasing Greener Than Selling? Manag. Sci. 2011, 58, 523–533. [Google Scholar] [CrossRef]
  45. Li, Y.; Tong, Y.; Ye, F.; Song, J. The choice of the government green subsidy scheme: Innovation subsidy vs. product subsidy. Int. J. Prod. Res. 2020, 58, 4932–4946. [Google Scholar] [CrossRef]
  46. Wang, J.; Shao, X.F.; Liu, G.M.; Yuan, Z.L. Domestic substitution and supply chain performance: The impact of technology and price subsidies. Transp. Res. E-Log. 2025, 201, 104218. [Google Scholar] [CrossRef]
  47. Gov. UK APC 12: Advancing the UK’s Low Carbon Automotive Capability—Innovation Funding Service. Available online: https://apply-for-innovation-funding.service.gov.uk/competition/279/overview (accessed on 23 August 2025).
  48. Shah, S.; Jajja, M.; Chatha, K.A. Antecedents and consequences of effective customer participation: The role of customer education and service modularity. J. Serv. Theory Pract. 2023, 33, 697–720. [Google Scholar] [CrossRef]
  49. Reimann, M.; Xiong, Y.; Zhou, Y. Managing a closed-loop supply chain with process innovation for remanufacturing. Eur. J. Oper. Res. 2019, 276, 510–518. [Google Scholar] [CrossRef]
Figure 1. Retailer’s choices and variations.
Sustainability 17 09008 g001
Figure 2. Implications of green education on adoption ( η = 1 , t = 0.5 ).
Sustainability 17 09008 g002
Figure 3. Implications of green education on product R&D ( η = 1 , t = 0.5 ).
Sustainability 17 09008 g003
Figure 4. Implications of green education on manufacturers’ profits ( η = 1 , t = 0.5 ).
Sustainability 17 09008 g004
Figure 5. Implications of k on c ( η = 1 , t = 0.5 , f = 0.3 ).
Sustainability 17 09008 g005
Figure 6. Implications of s on quantities ( η = 1 , t = 0.5 , f = 0.3 , c = 0.4 ).
Sustainability 17 09008 g006
Figure 7. Implications of s on green levels ( η = 1 , t = 0.5 , f = 0.3 , c = 0.4 ).
Sustainability 17 09008 g007
Table 1. Contributions of this paper.
Related ResearchConsumer EducationGreen InnovationGovernment Subsidy
Sun and Yuan [17], Wang et al. [19], Sun and Liu [20], Abdulla et al. [21], Florea et al. [22]
Xie et al. [23], Abadzhiev et al. [24], Lin and Lin [25], Ai et al. [26], Lambrecht et al. [28]
Azevedo et al. [29], Wang et al. [30], Guo et al. [31], Corsini [32], Chen and Keppo [33]
This paper
Disclaimer/Publisher’s Note: The statements, opinions and data contained in all publications are solely those of the individual author(s) and contributor(s) and not of MDPI and/or the editor(s). MDPI and/or the editor(s) disclaim responsibility for any injury to people or property resulting from any ideas, methods, instructions or products referred to in the content.