Article

Heterogeneity in Education-Driven Residential Mobility: Evidence from Tianjin Under China’s School District System

1
Zhou Enlai School of Government, Nankai University, Tianjin 300350, China
2
School of Economics and Management, Harbin Institute of Technology (Shenzhen), Shenzhen 518055, China
*
Author to whom correspondence should be addressed.
Sustainability 2025, 17(18), 8326; https://doi.org/10.3390/su17188326
Submission received: 10 August 2025 / Revised: 7 September 2025 / Accepted: 12 September 2025 / Published: 17 September 2025
(This article belongs to the Special Issue Demographic Change and Sustainable Development)

Abstract

Education has become one of the important drivers of residential mobility. The school district system in China has transformed school choice into a competition for housing ownership based on family capital, resulting in the capitalization of education and gentrification. Understanding the patterns of education-driven residential mobility is therefore of significant importance for urban planning, educational policy and social equity research. In this study, we depicted and analyzed the heterogeneity of residential mobility formed by the interaction of schooling choice, diversity of family characteristics, and housing preferences. Based on the household questionnaire survey conducted in Tianjin, we identified five typical education-driven residential mobility patterns by using the K-Prototype clustering algorithm. The empirical results implied that in China, particularly in megacities like Tianjin with a strict school district system tied to housing, wealthy families approach high-quality education through their socio-economic advantages for cultural reproduction; families sacrifice living conditions to access leading schools by acquiring old second-hand housing or smaller new-commercial housing; lower-income families relocate to within a short distance of the city center to change home ownership status for basic school eligibility; and families opting out of school districts achieve residential improvements and display greater locational diversity in relocation. Education-driven residential mobility is reshaping urban space, and may intensify socio-spatial stratification, even influencing long-term urban sustainability through patterns of resource allocation, neighborhood stability, and social equity. While this study focuses on Tianjin, the impacts of such school-housing-linked policies hold broader relevance for global cities facing similar challenges.

1. Introduction

Education has the potential to promote social mobility and plays a crucial role in personal growth and social development. The quality of education affects children’s future wages and socio-economic status, which in turn drives differences in work, income, social status, and lifestyle across generations [1]. Therefore, parents pursue good-quality education to take the initiative regarding their families’ social stratification.
It has been shown that education has become a new driver of residential mobility and an important factor affecting urban space in China [2]. Different urban groups access high-quality educational resources by changing their residence. Frenkel et al. captured culture and education as significant factors influencing knowledge-workers’ residential choices [3]. The middle class regards education-driven relocation as an effective means of social–spatial reproduction [4,5]. The study of Yang suggests that a parent’s intention to relocate is more affected by their children’s educational opportunities [6] than their dependence on employment. Residential relocation and mobility triggered by the pursuit of education have become an increasingly common phenomenon.

1.1. Residential Relocation and Educational Capitalization Under the School District System

Geographical location is the key to understanding the impact of school system choice. The geographical distribution of educational resources is shaped by institutional arrangements [7]. In China, the school district system is implemented for the management of compulsory education, including primary and secondary schools. By dividing the space within an administrative district into several school catchments, only a child who has a hukou (where the property is registered) within a given school catchment is eligible for enrollment in the corresponding school. As a result, the choice of education becomes a matter of geography—that is, where the housing is located directly affects which school children enroll in and the quality of the education they access. This residential-based enrollment system links high-quality educational opportunities with housing ownership in corresponding school catchments, leading to competition for purchasing “school district housing” [8]. This objectively induces families that pursue leading schools to relocate their residences and gather specific aggregations, which has exacerbated the differentiation of urban residential space [9].
In China, a key school district is a residential zone assigned to a highly prestigious, high-performing public school (often a historical “key school”). The specific communities zoned for each key school district are announced in the respective schools’ annual admission notices [10]. Due to the high demand for quality education, access to these schools is primarily determined by one’s home address being within this designated zone. The concept of “key school” in China represents a multifaceted institutional reality that encompasses policy support, resources, teacher qualifications, and reputation. Such schools are widely perceived by parents to provide substantially better education quality compared to ordinary schools owing to their higher per capita funding, their superior teaching quality, and the more advantaged socioeconomic backgrounds of their students [11]. The label “key school” is recognized as representing high-quality education by many Chinese parents. Parents’ concern regarding key schools influences their relocation behavior and affects housing prices. For instance, a policy redesignating an ordinary school as key school in a Shanghai residential area led to a 6.9% increase in the housing prices [12].
Education-driven residential mobility also maps educational capitalization. The strong demand for key schools and the intense supply–demand conflict caused by the limited availability of school places have translated into a significant premium for school district housing [13]. When a school enjoys a good reputation or has a higher ranking, the price of the surrounding real estate is obviously more expensive [14,15]. Similar findings have been verified in studies of global housing prices from London to Vancouver and from Beijing to Shanghai [16,17,18,19]. In addition to the quality of schools, the quantity, accessibility, and capital investments of schools also have a positive impact on surrounding housing prices [12,20,21]. Living in a particular school catchment area has become a major consideration in parent’s housing choices and they are willing to pay a high housing premium to ensure their children have access to good schools [22].

1.2. Residential Choices of Different Families and Social Differentiation Driven by Education

Differences in the demographic characteristics of families lead to diversity in education-driven relocation and residential mobility. Many studies have demonstrated that age, educational attainment, occupation, income, and family structure are all related to residential mobility [3,4,23,24]. These factors also affect parents’ choices of schools and residences. Yang found that well-educated families usually place great importance on their children’s education [6], and they may relocate to neighborhoods that are close to key schools. Davis-Kean and Pamela explored how parent’s socio-economic characteristics, especially their income and education level, indirectly influence children’s academic achievements [25]. The economic status and capital holdings of families determine whether households have sufficient assets to afford the housing premium caused by education [26,27,28]. Butler studied the competition for the few available apartments within school catchment areas among the affluent middle class in East London [29]. The occupation of the parent is not only closely related to the tier of school their children attend, but also affects their choice of neighborhood [30]. In China, hukou limits the accessibility of public services, and children without local hukou are denied access to good schools [31,32].
Under the school district system, different families seek educational resources by changing their residence, which promotes the spatial agglomerations of groups with similar demographic characteristics and gradually forms separate residential areas for the upper-middle class and lower class within the city [29]. The catchment areas of key schools have become social assimilation zones for the middle class and newly wealthy urbanites, exacerbating residential segregation [33]. The pursuit of leading schools has led to wealthier groups gradually moving back to the city center and relocating to apartments near leading schools, displacing the original, lower-income households. Wu defined this education-led gentrification as jiaoyufication [9]. This concept stresses social class reproduction through territory-based cultural production within a school catchment area. Therefore, educational segregation powerfully impacts social stratification and class solidification by differentiating the educational opportunities of different social groups [1,5].
Based on a review of the related literature, education-driven residential mobility lies at the intersection of urban space, social structure, and resource access. Whether focusing on the capitalization and gentrification of education triggered by the cultural attributes of school catchment housing [1,9,29,34], or residential segregation and social re-differentiation intensified by a household’s behavioral choices [1,5,29,33], there has been a wide range of research exploring and discussing the outcomes of education-driven residential mobility and its externalities [12,13,14,15,16,17,18,19]. Only a few studies focus on the heterogeneity of this type of residential mobility, which is caused by the diversity of family characteristics and the variability of relocation features (i.e., distance moved and preferred location). However, few studies have explored the heterogeneity of education-driven residential mobility, which arises from the diversity of household characteristics (e.g., income level, educational background of householders, family age structure) and the variability of relocation features (e.g., distance moved, preferred location, transition to home ownership). Therefore, the first question we are concerned with is as follows: What heterogeneity does education-driven residential mobility show in these respects?
Residential mobility involves a complex decision-making process. Although families with school-age children will primarily consider the relationship between new their residence and access to education, their decision is also affected by housing characteristics, such as housing area, price, building type, community environment, and surrounding resources [6,35,36,37,38]. Households tend to make optimal residential decisions after balancing various factors. This raises the second question in which we are interested: What are the differentiated housing features of different families driven by education? How do different households balance housing-related costs and access to quality education during the relocation process?
In this article, we attempted to depict the heterogeneity of residential mobility under the school district system. We studied the residential decisions made by different families based on school catchment choices, demographic characteristics, and housing preferences, then identified the relocation features and typical patterns of education-driven residential mobility and discussed the spatial and social outcomes that may arise.

2. Materials and Methods

2.1. Sampling Site

Tianjin is one of the four municipalities directly under the central authority in China, with an urban residential population of 11.66 million and a home ownership rate of about 83.7%. The city contains 4.4284 million households and housing market transactions in 2023 numbered 0.24 million (Tianjin Statistical Yearbook, 2024, chapter 6) [39]. Residential mobility is relatively frequent. Meanwhile, as a national experimental zone for the comprehensive reform of compulsory education, Tianjin has abundant educational resources. There are 610 secondary schools and 873 primary schools (Tianjin Statistical Yearbook, 2024, chapter 21) [39]. Therefore, it is a suitable example for studying education-driven residential mobility in China.
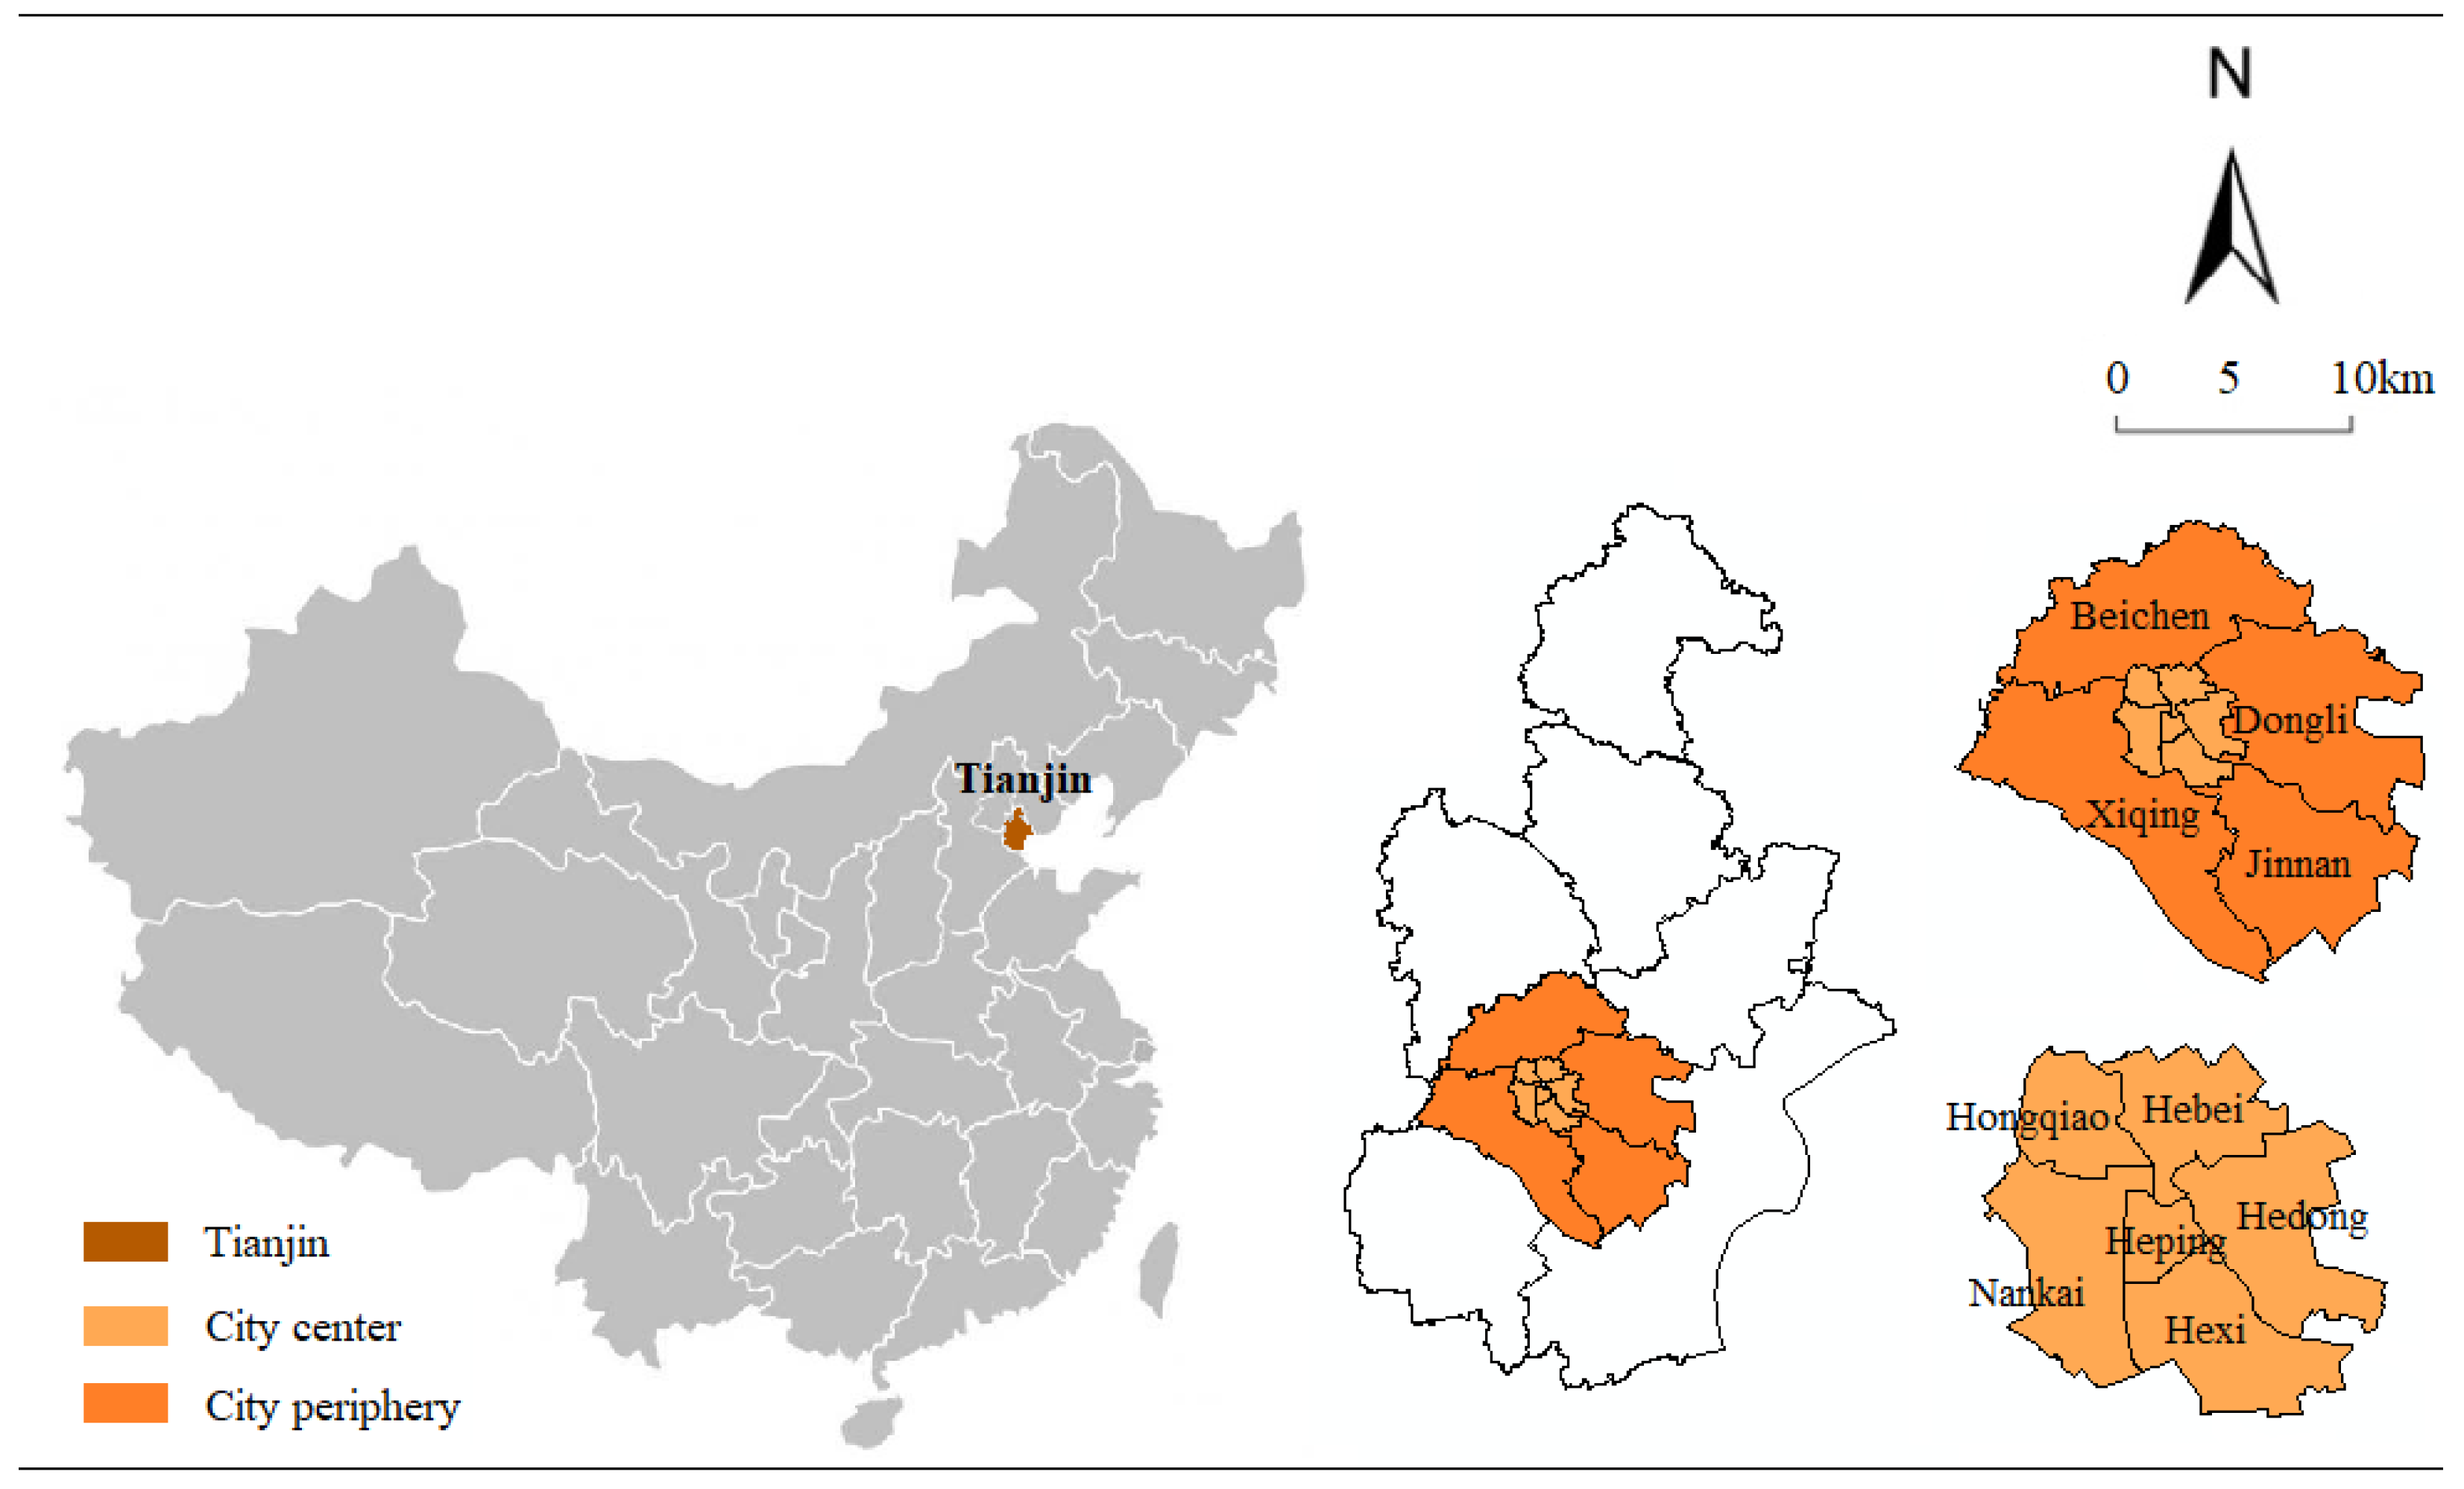
This city includes four spatially distinct areas: the city center (which includes six administrative districts), the city periphery (which includes four administrative districts), the remote suburbs and counties, and the Binhai New Area. Considering the distribution of schools and the restrictions of hukou, the districts in the city center and periphery were taken as the study areas, as shown in Figure 1.
The city center is the most developed area in Tianjin with the most comprehensive public infrastructures, including six administrative districts: Heping, Hebei, Hexi, Nankai, Hongqiao, and Hedong. The city periphery is a mixed space of urban–rural interaction with a large urban population, including four administrative districts: Jinnan, Xiqing, Dongli, and Beichen. Similarly to other cities in China, where most of the key primary and secondary schools are located in the city center, leading schools in Tianjin are concentrated in the districts of Heping, Hexi, and Nankai.

2.2. Data Collection

The demographic and housing data were sourced from a large-scale household questionnaire survey conducted by the UK and China collaborative research project in 2018–2020: “Re-making of Chinese Urban Neighborhoods: Social Spatial Transformation and Access to Public Services”. The questionnaire covers models of demographic characteristics, housing features, relocation experience, and socio-economic status [40]. According to the purpose of our study, we selected data including family size, age of the householder when moving, per capita monthly income of the family, the educational attainment, occupation, gender and hukou of the householder, the name of the residential estate, and the ownership status and area of the present place of residence and the last one.
A stratified sampling of residential areas in the central and peripheral urban zones was conducted to achieve broad and even coverage of the study area. The area was divided into three regions according to the urban ring roads: the central urban area, the middle built-up zone, and suburban areas. Further stratification was implemented by integrating multiple dimensions, including community type (old and new commercial housing, government-subsidized housing, privatized work unit housing, and resettlement housing), construction age, property rights type, and primary building type, in order to select representative communities. Within each selected community, on-site convenience sampling was adopted: in each selected neighborhood, several buildings were randomly selected or chosen at fixed intervals. Within each building, one entrance unit was selected, and within each unit, one household per floor was invited to participate. Data were collected through face-to-face questionnaire interviews.
Of the 1996 questionnaires returned, we screened out those families who considered children’s education as the primary reason for relocation and regarded this as one of the factors affecting relocation. After eliminating questionnaires with missing data, we finally obtained 1441 valid household samples.
The unit housing price data of the included residential estates was collected from the housing agent platform Beike (KE Holdings Inc., Beijing, China), and the total housing value and the unit price ratio were calculated based on this. To ensure the quality of our data, we implemented strict data screening (obviously abnormal or duplicate listing information was eliminated). To ensure the rationality of the unit price ratio (calculated as present housing unit price/former housing unit price) and the comparability of housing value data, we implemented time alignment during data collection: When collecting the “former housing” and “present housing” data of each family, we aligned all records with the same temporal reference: the month in which the survey data collection was completed. All POI and unit price data also correspond to that same month. The geographic coding of residential estates was completed using the Gaode Map API V10.35.1.2655 (Amap Software Co., Ltd., Beijing, China). We standardized and cleaned all residential estate names during the matching process. For samples that could not be matched automatically, we conducted manual verification and eliminated those that could not be confirmed. Each residential estate’s location data was matched based on POI data from Gaode Map, with results displayed in ArcMap 10.4 (Esri Inc., Redlands, CA, USA). Location data for each residential estate was matched to a commercial map database, and then the location change for each family was identified and the moving distance for relocation was calculated.

2.3. Analytic Tool: K-Prototype

The clustering algorithm aims to find the diversity among clusters and the similarity between samples within each cluster. The study would like to explore the heterogeneity of education-driven residential mobility; thus, the clustering algorithm can be used to identify the diversity of residential relocation patterns and the typical characteristics of each pattern. Among the commonly used clustering methods, the K-Means method is only suitable for calculating numerical values, while the K-Modes method is only available for analyzing categorical data. The K-prototype clustering algorithm, as a combination of K-means and K-modes methods, can be used to analyze variables with mixed attributes. Considering that the data chosen for this study include both numerical and categorical attributes, the K-prototype clustering algorithm is an appropriate tool for analysis.
Similarly to other clustering methods, the K-Prototype uses distance to measure the dissimilarity of different samples and classifies them into different clusters accordingly. Suppose there are n samples and m attributes. D = { X 1 , X 2 , , X n } , X i , X j represent two samples.
First, the numerical attributes are normalized (Z-score standardization); then, the traditional method of Euclidean distance is used to calculate the dissimilarity between two samples. The formulas are as follows:
Z = X μ σ
X is the original value of a numeric variable, μ is the mean of that variable across all samples, and σ is its standard deviation.
d 1 X i , X j = l = 1 m r ( x i l r x j l r ) 2
For categorical attributes, the dissimilarity between two data points is calculated by the Hamming distance method, using the following formula:
d 2 X i , X j = l = 1 m t δ ( x i l t , x j l t )
where when x i l t = x j l t , δ x i l t , x j l t = 0 ; x i l t x j l t , then δ x i l t , x j l t = 1 .
For sample i , x i l r and x j l r are numerical attributes; x i l t and x j l t are categorical attributes. m r and m t are the number of numerical and categorical attributes, respectively. The dissimilarity among mixed data can be calculated by combining the different attributes into a single dissimilarity matrix, where k is the number of clusters. Q c = { q c 1 , q c 2 , , q c m } , Q j means the cluster center selected in cluster c . Then, the distance between sample X i and cluster center Q j can be defined as follows:
d 1 X i , Q j = l = 1 m r ( x i l r q j l r ) 2 + γ l l = 1 m t δ ( x i l t , q j l t )
where γ is the balancing factor used to balance the numerical and categorical attributes.

3. Results

3.1. Family Characteristics and Relocation Features of the Education-Driven Residential Mobility

3.1.1. Family Demographics

For the education-driven residential mobility, the average size of families is 3.35, concentrated in the family size of three persons (43.26%) or four persons (35%), which is consistent with the family structure of two generations. A total of 62.41% of householders were between 20 and 40 years old at the time of the move, which corroborates the life-cycle theory of relocation due to the demand for school-age children. The overall education level of householders is relatively high, with 70.92% of them having received university or higher education (Table 1).
In China, most large cities have housing purchase restrictions based on hukou or local work experience. People need to have a Tianjin hukou or have worked there for more than two years if they want to buy housing in Tianjin. Therefore, under the restriction of the hukou system, 96.45% of householders in samples have urban hukou within the city center. The percentage of householders engaged in professional or management positions is 53.9%, 31.21% of families have a per capita monthly income of more than 5000 CNY, and the cumulative proportion of households with a per capita monthly income of over 3000 CNY reaches 58.87%. The overall economic and social status of the sampling families corresponds to the middle or upper class.

3.1.2. Spatial Features of Moving and Changes in the Housing Characteristics

Education-driven residential mobility mainly occurred in the city center (78.01%). More than half of families relocated to another district (52.48%) and about a quarter of families moved within the same district (25.53%). Most of the moves were less than 5 km (47.52%), and a straight-line distance of relocation between 5 km and 10 km accounted for 37.59% of total moves (Table 2).
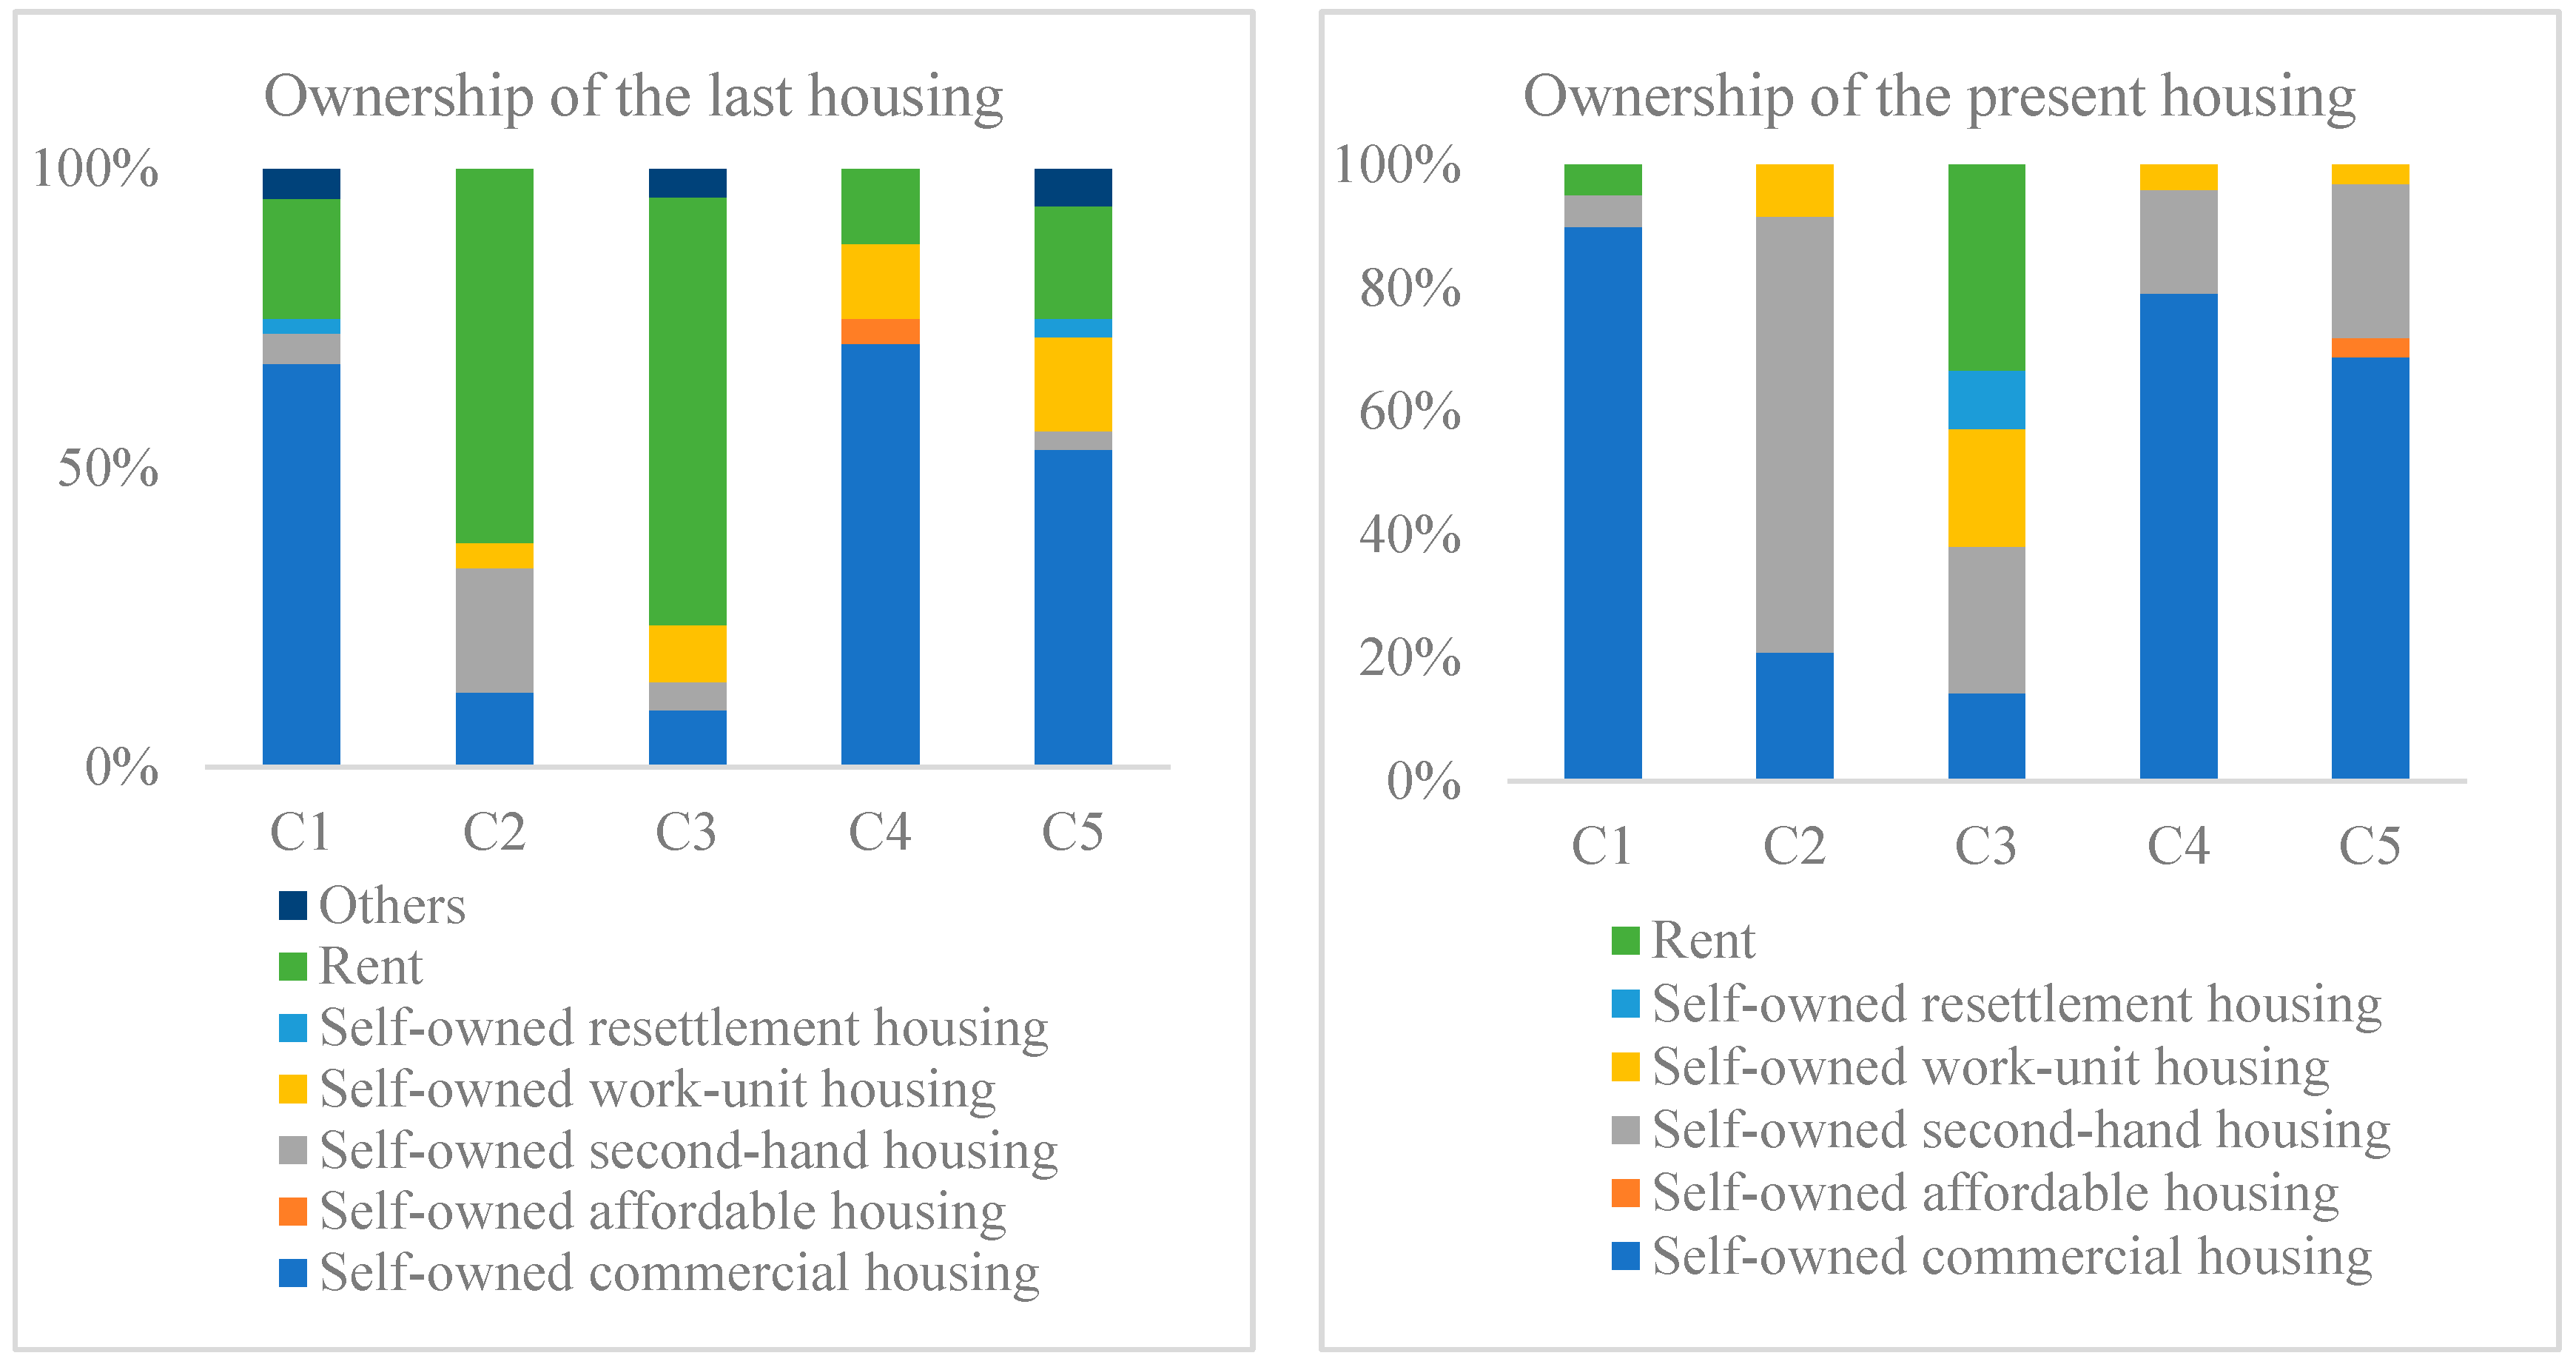
Among the interviewed households, 57.45% of families moved to school district housing, and the housing area was concentrated within 50–75 m2 (30.5%) and 75–100 m2 (24.11%). A total of 36.88% of families had their housing area reduced after relocation (the ratio of the area of the present housing to the last place of residence is less than 1), while 63.12% of households experienced an increase in housing area. The value of the present housing was mostly between the range of 3 million to 8 million CNY (accounting for 61.7% in total), and 45.39% of the housing unit prices were 1.5 times higher than that of the last one. In terms of changes in housing ownership, the proportion of rental families decreased from 33.33% to 6.38%, and the percentage of second-hand properties purchased increased from 6.38% to 25.53%. After moving, 60.28% of households owned new commercial housing.

3.2. The Heterogenicity of Education-Driven Residential Mobility

Twelve categorical attributes and four numerical attributes were used in the clustering algorithm. The categorical attributes included ownership of the present housing and the last house, the location change, the housing unit price ratio, the housing area ratio, moving distance, the age, educational attainment, sex, occupation and hukou of the householder, and the school district of the present housing. The numerical attributes included the total price and area of the present housing, the size, and the per capita monthly income of the family (Table 3). Numerical attributes were standardized before analysis.

3.2.1. K-Prototype Analysis of Education-Driven Residential Mobility

The K-prototype cluster analysis was processed as follows:
The samples from dataset D were randomly selected as the initial cluster centers.
The distance (dissimilarity) between each sample in the dataset and each cluster center was calculated based on Equation (4); then, each sample was divided into the nearest cluster.
Cluster centers were updated and the dissimilarity among each sample was calculated; then, samples were classified into the corresponding clusters again.
The process was iterated until no sample changed cluster and the center of each cluster was fixed. The results were analyzed when the clustering algorithm converged.
The γ parameter was determined via grid search, with the optimal value γ = 0.5 selected to balance the contributions of numeric and categorical variables. The “Cao” method was used as the initialization strategy, which is suitable for mixed-type data. The number of random restarts was 10. A convergence tolerance of 0.001 was obtained and there was a maximum of 100 iterations (all runs converged before reaching the iteration limit). Random seed was fixed at 42 to ensure the reproducibility of results. No significant outliers interfering with clustering were observed. Rare categories in categorical variables were merged into an “Other” category to maintain clustering stability.

3.2.2. Model Estimation for Cluster Analysis

Silhouette Coefficient is a method to choose the optimal number ( k ) of clusters and evaluate the clustering effect. It combines the two factors of cohesion and separation, and can be used to evaluate the effect of different running modes of the same algorithm on the clustering results. The formula is as follows:
s i = b i a ( i ) m a x { a i , b ( i ) }
a ( i ) denotes the average distance between sample i and other samples in the same cluster, and b ( i ) indicates the average distance between sample i and other samples in different clusters. When calculating the silhouette coefficients of all samples in the dataset, the average value is used as the silhouette coefficient of current clustering k . The value of the silhouette coefficient ranges from −1 to 1. When it approaches 1, the sample is more suitable for its cluster, which means that the clustering results are more effective.
The silhouette coefficient is computed following the K-Prototype distance formula, which is designed to handle mixed data types comprising both numerical and categorical variables. For a given sample and another sample within the same cluster, the distance is computed in two parts: the Euclidean distance for numerical attributes and the Hamming distance for categorical attributes. These two components are then combined via a weighted sum to yield the final K-Prototype distance. This integrated metric is directly employed in the silhouette coefficient calculation to ensure it accurately reflects the inter-sample similarity within the mixed-type clustering structure.
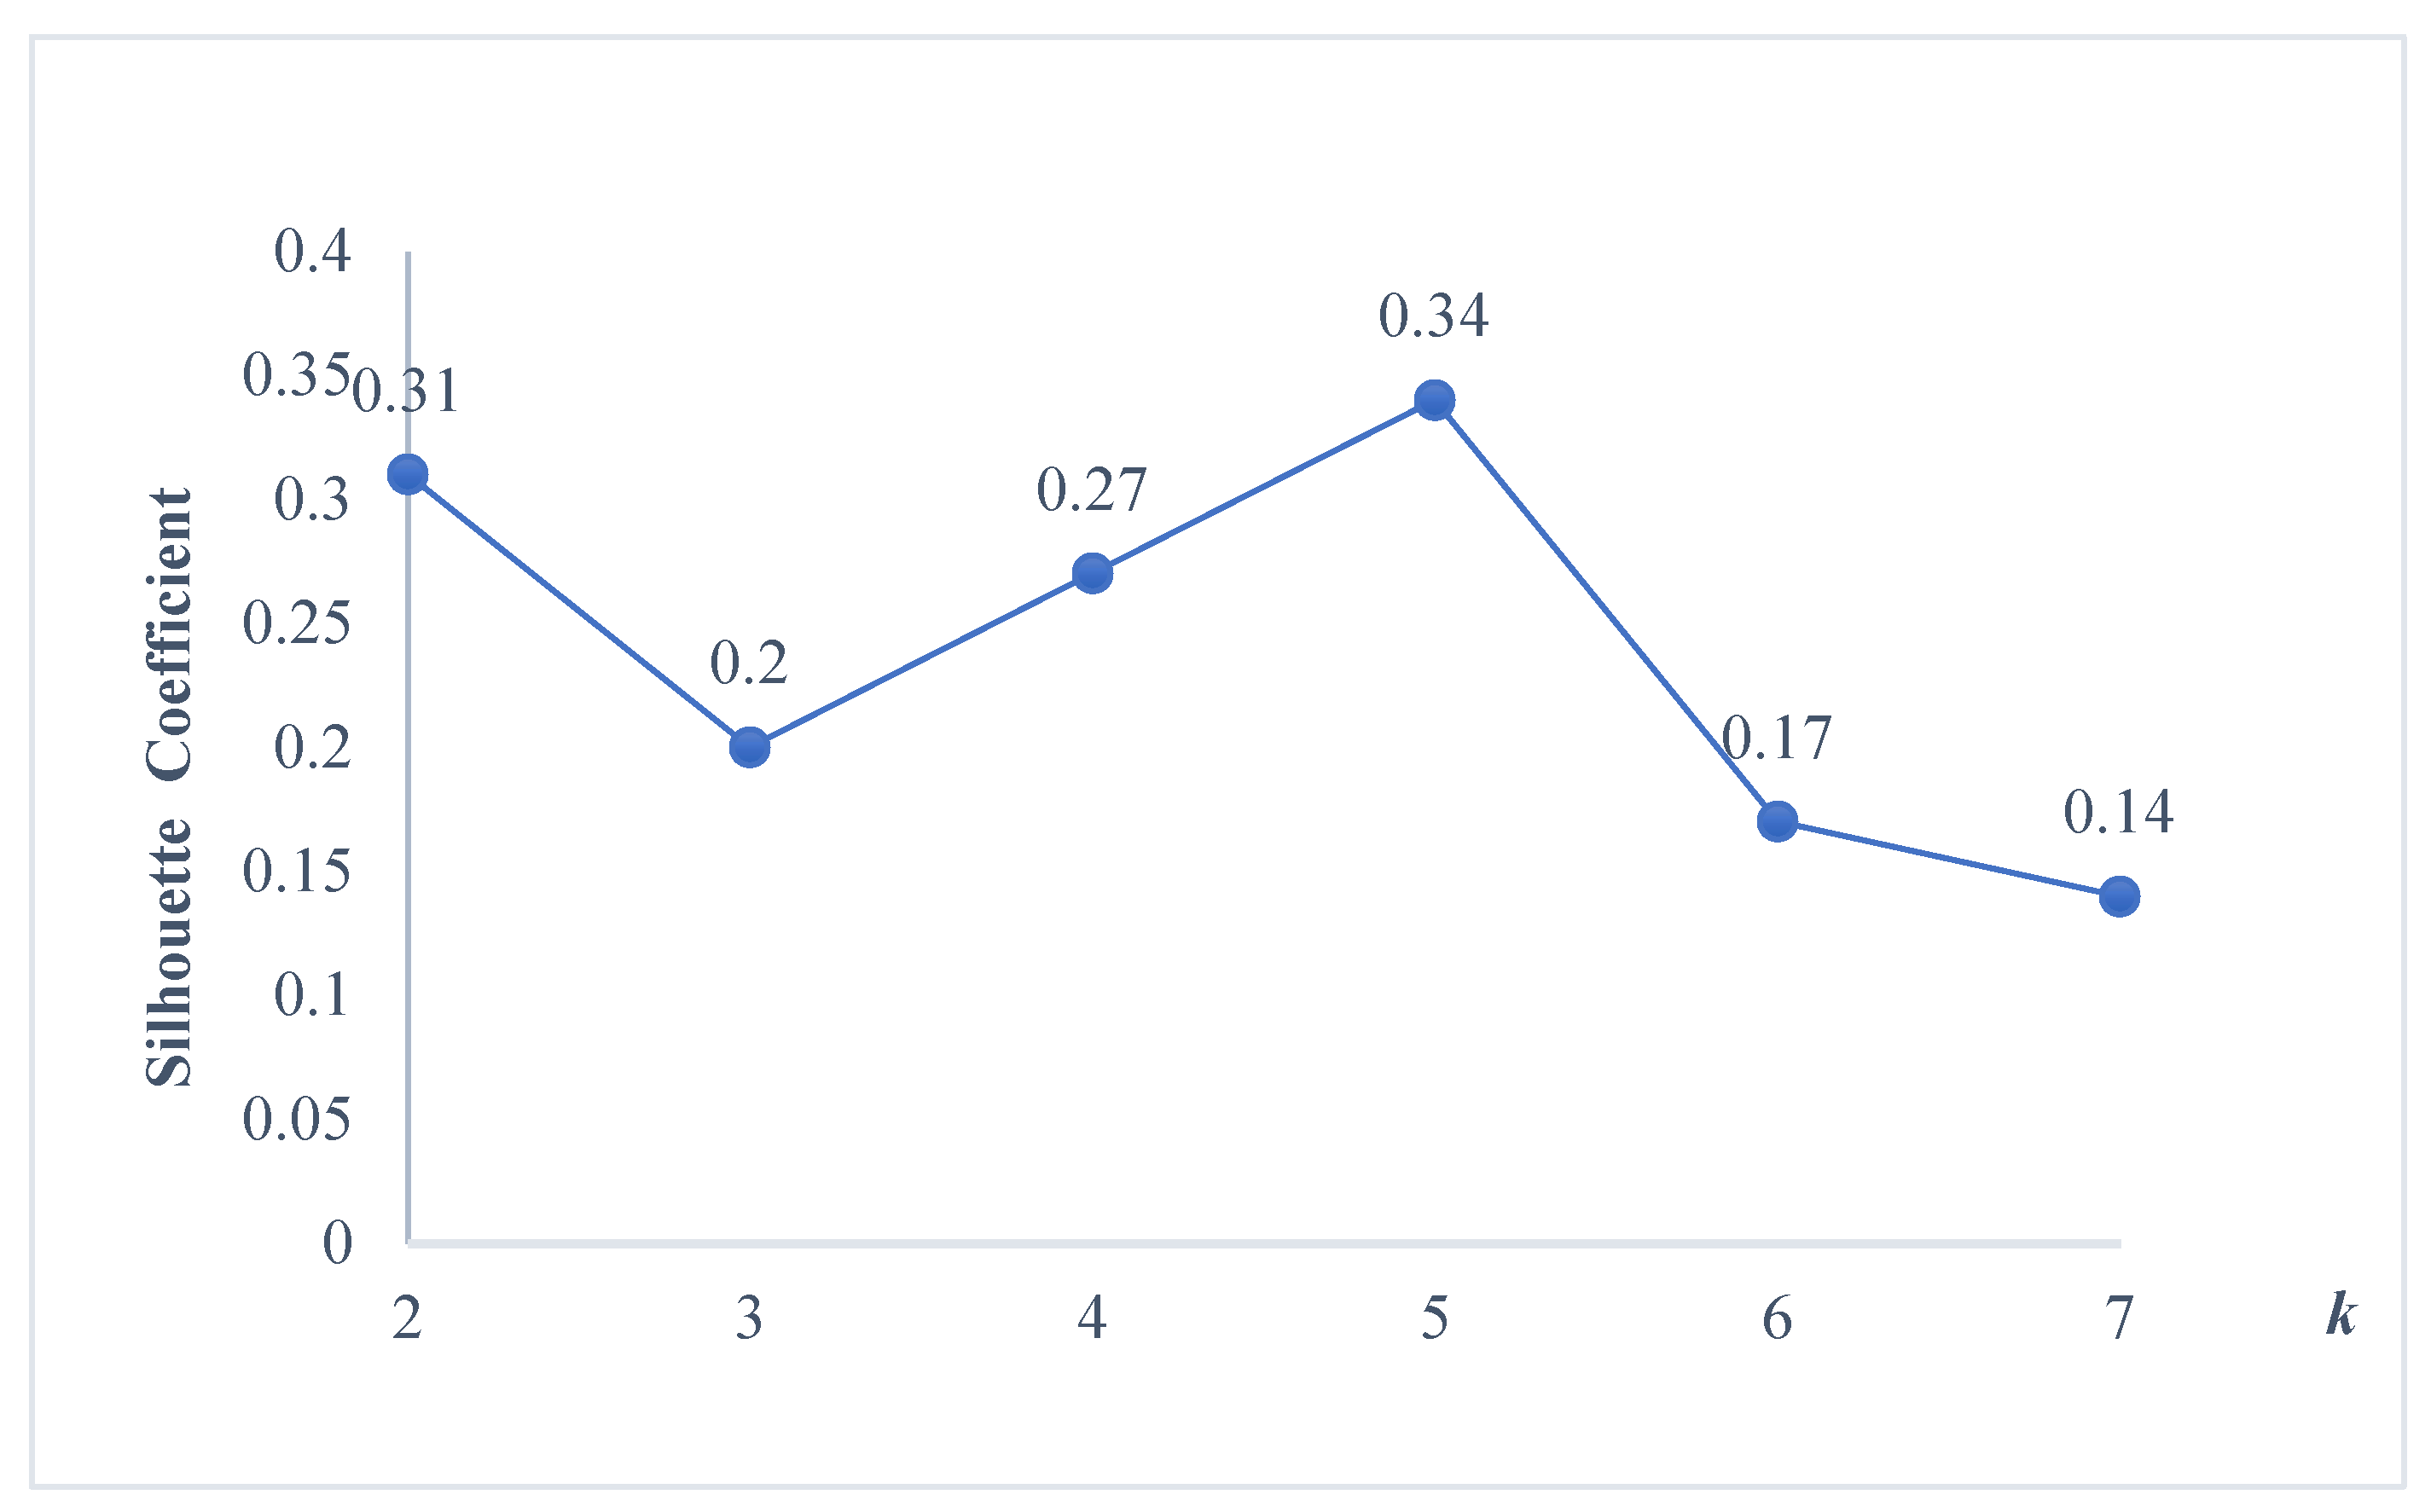
Considering the total number of samples in this study, the range of clustering numbers was set from 2 to 7. Figure 2 shows that when the k = 5 , the silhouette coefficient is at its maximum and the clustering effect is relatively reasonable. Therefore, we classified education-driven residential relocation into five clusters and described and discussed the characteristics of each cluster.

3.2.3. Education-Driven Residential Mobility Patterns

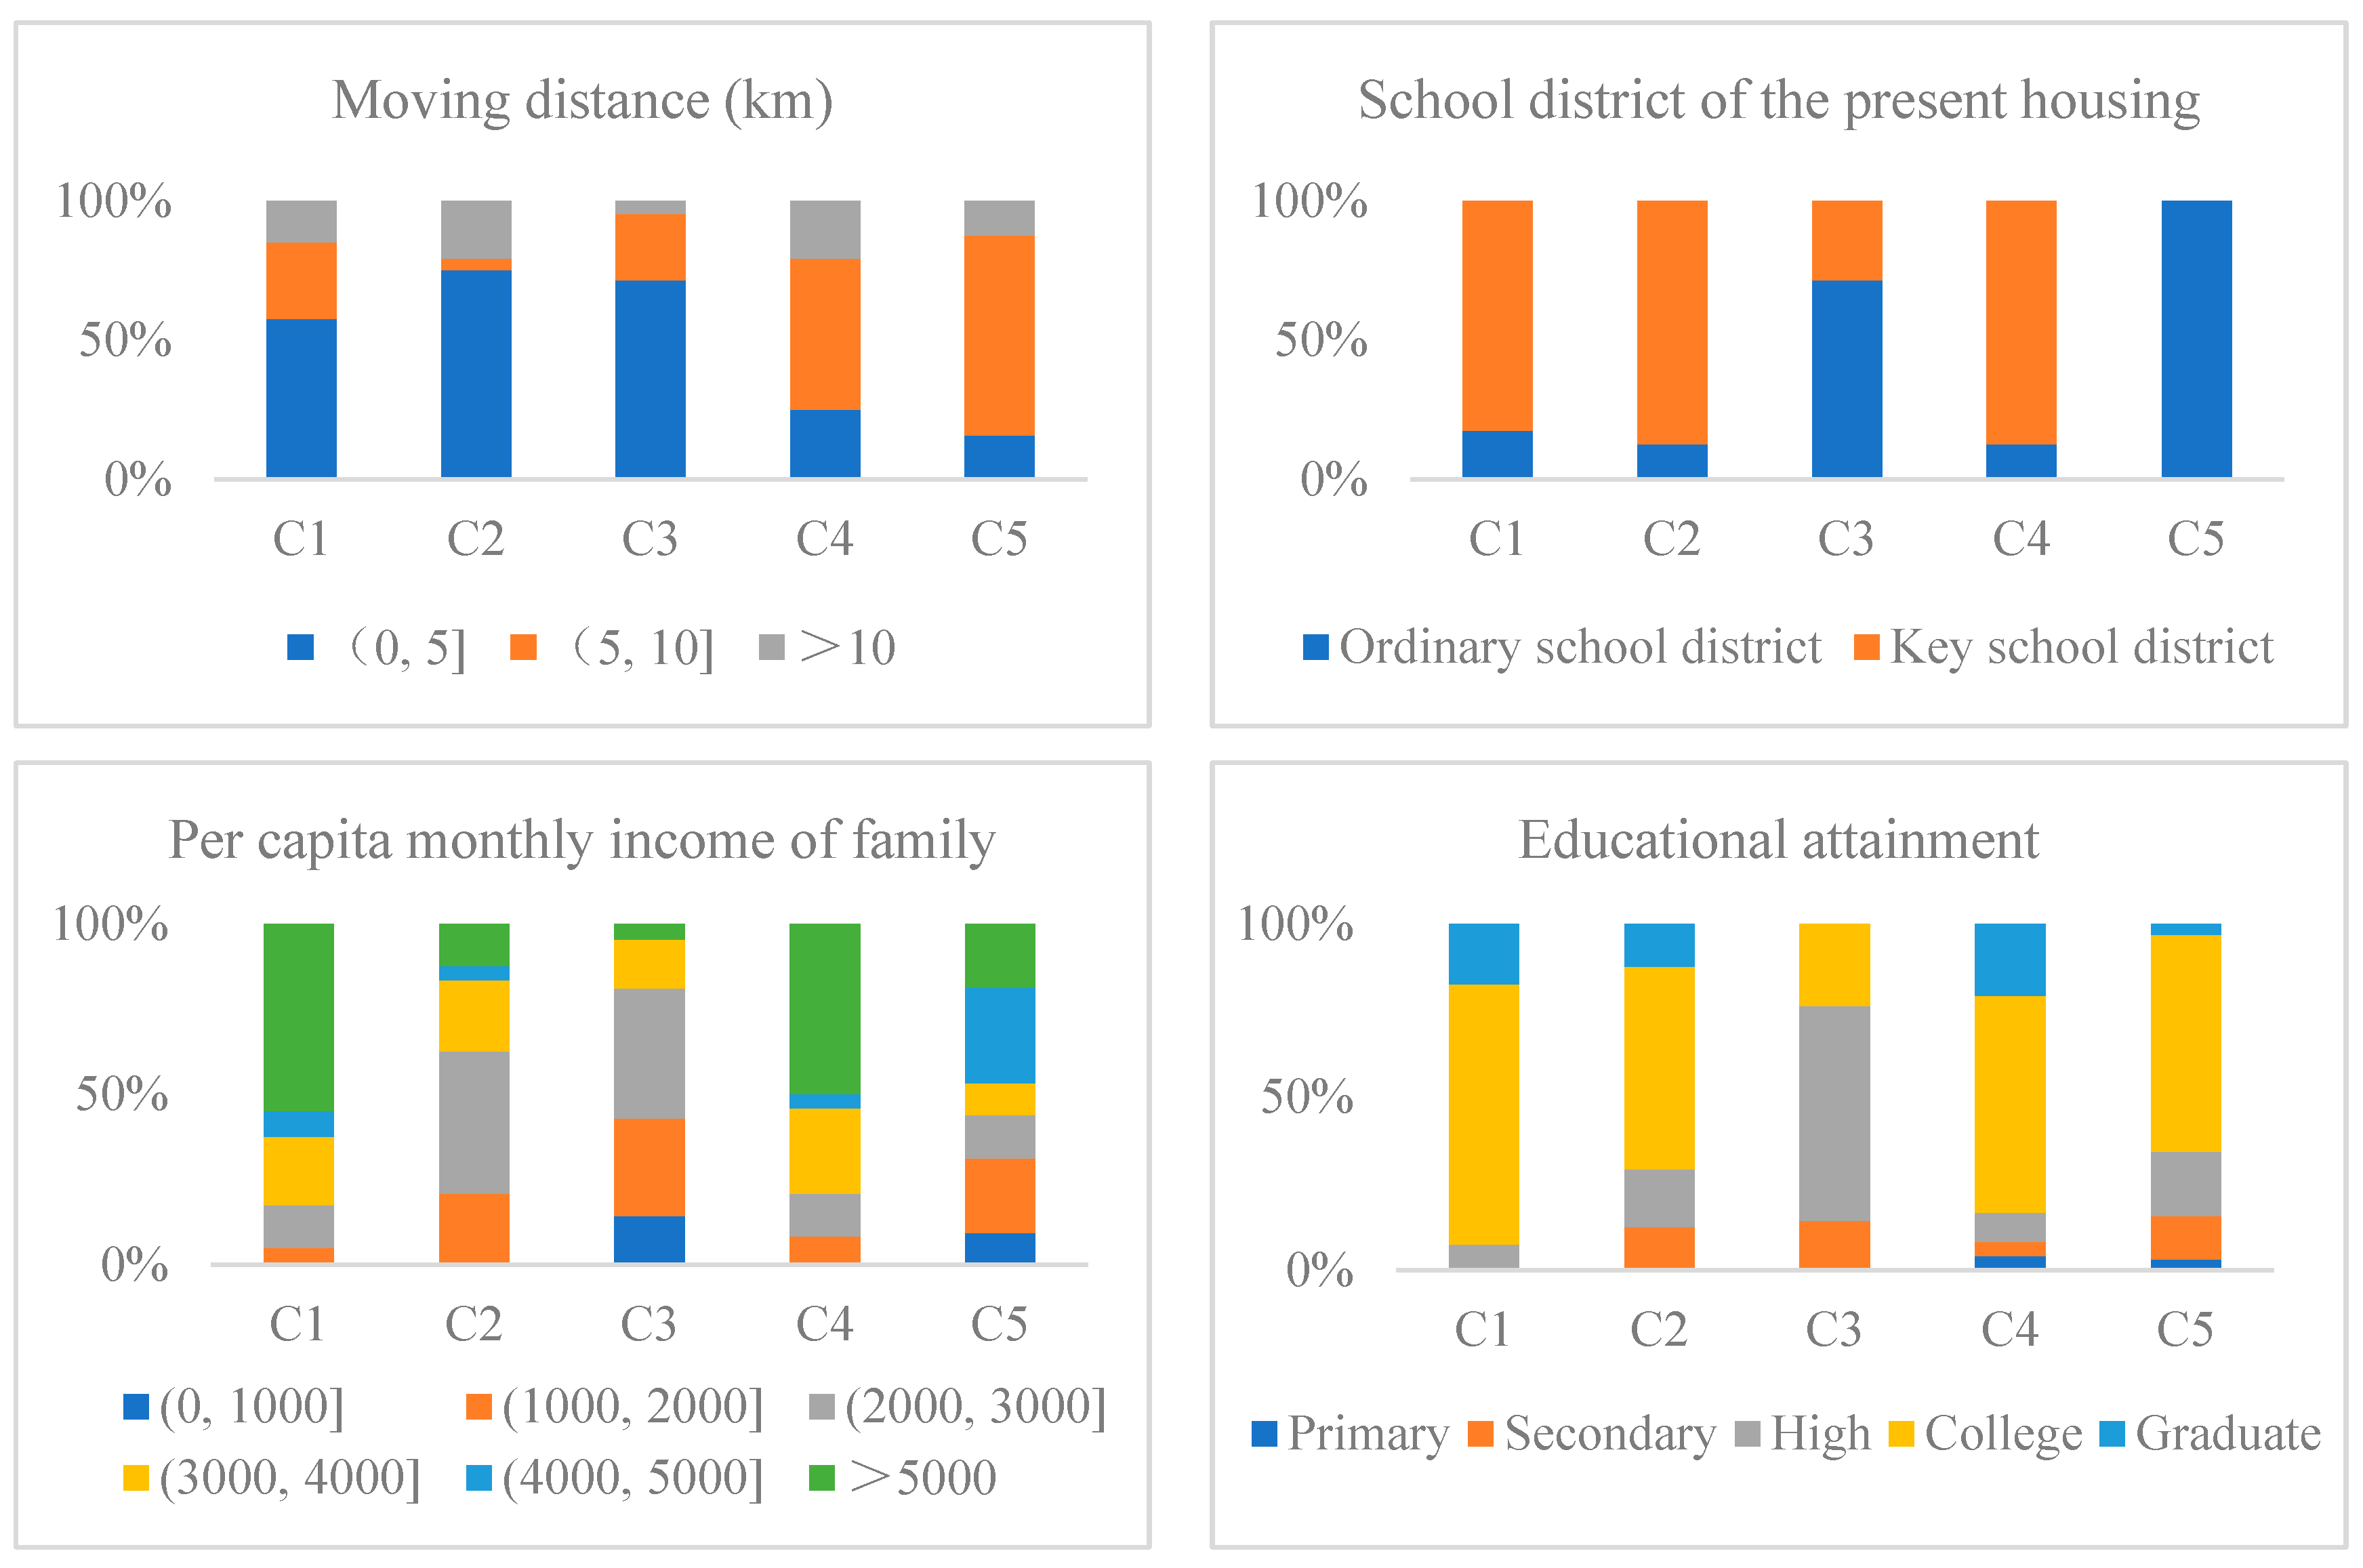
Based on the K-Prototype clustering, five typical patterns of education-driven residential mobility were identified (Figure 3). The characteristics of each pattern are depicted as follows.
  • Cluster 1: Relocation of Wealthy Families to Key School Districts by Purchasing New Commercial Housing
This cluster primarily consists of high-income and highly educated families who prioritize education by relocating to spacious housing in key school districts, with migration mainly occurring within the city.
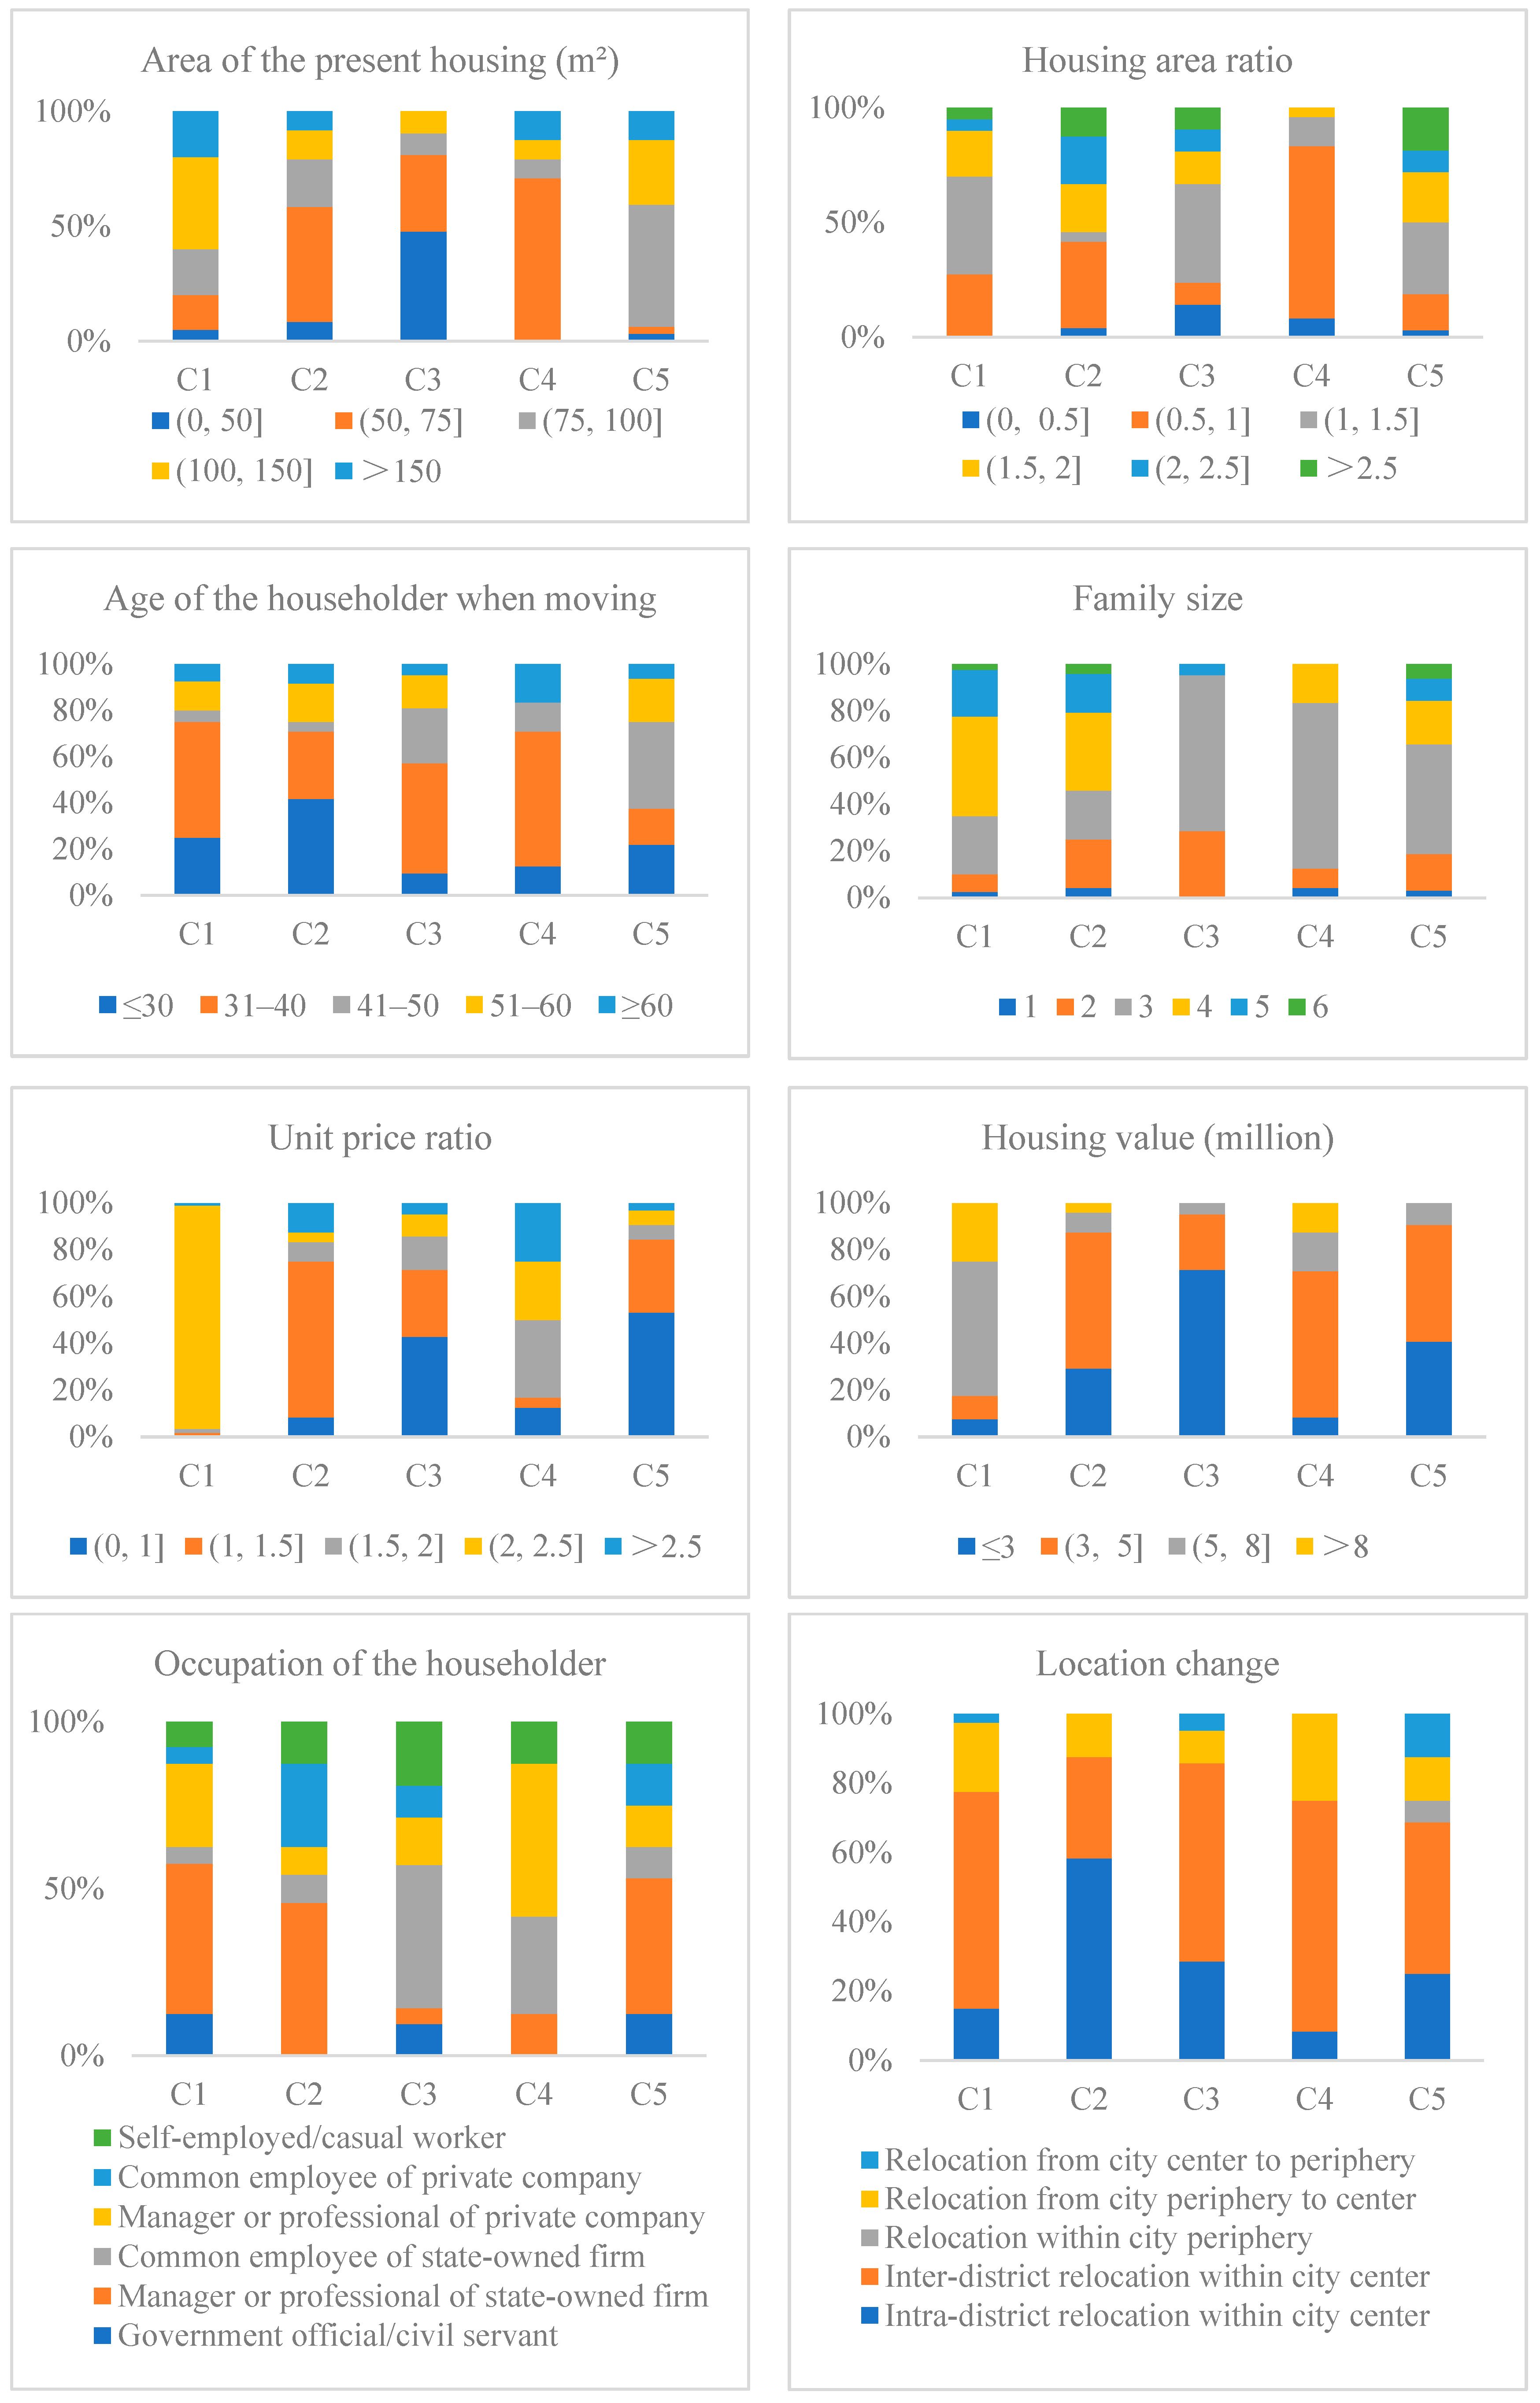
A total of 55% of families in this cluster had a per capita monthly income of more than 5000 CNY, which is the highest among all clusters. The positions of the householders were mostly managers or professionals (70%); 45% of them were employed in work-units or state-owned enterprises and 25% of householders worked in private or foreign companies. The proportion of householders with the occupation of government official or civil servant was 12.5%. These results demonstrate that most of the families enjoy a high social status.
A total of 90% of the households purchased new commercial housing, and 82.5% of them moved to key school districts. These families also live in spacious housing, with 60% of them having a present housing area of more than 100 m2 (for 40%, the housing area was 100–150 m2 and for 20% the housing area was greater than 150 m2). Compared to their previous residence, their housing area expanded by 1 to 1.5 times (42.5%). The total price of their present housing was concentrated in the range of 5 million to 8 million (57.5%), and 25% of the present housing cost even more than 8 million (CNY).
This cluster has the highest overall level of education. Householders who have a bachelor’s degree and who have a master’s degree accounted for 75% and 17.5% of the total, respectively. Half of the householders were between 31 and 40 years old at the time of relocation, and a quarter were younger than 30 years old. The family size was mainly four persons (42.5%) or five persons (20%). A total of 62.5% of families moved across the district but within the city center, while 20% of families moved from the city periphery to the center.
  • Cluster 2: Intra-District Relocation of Young Families to Purchase Second-Hand School District Housing
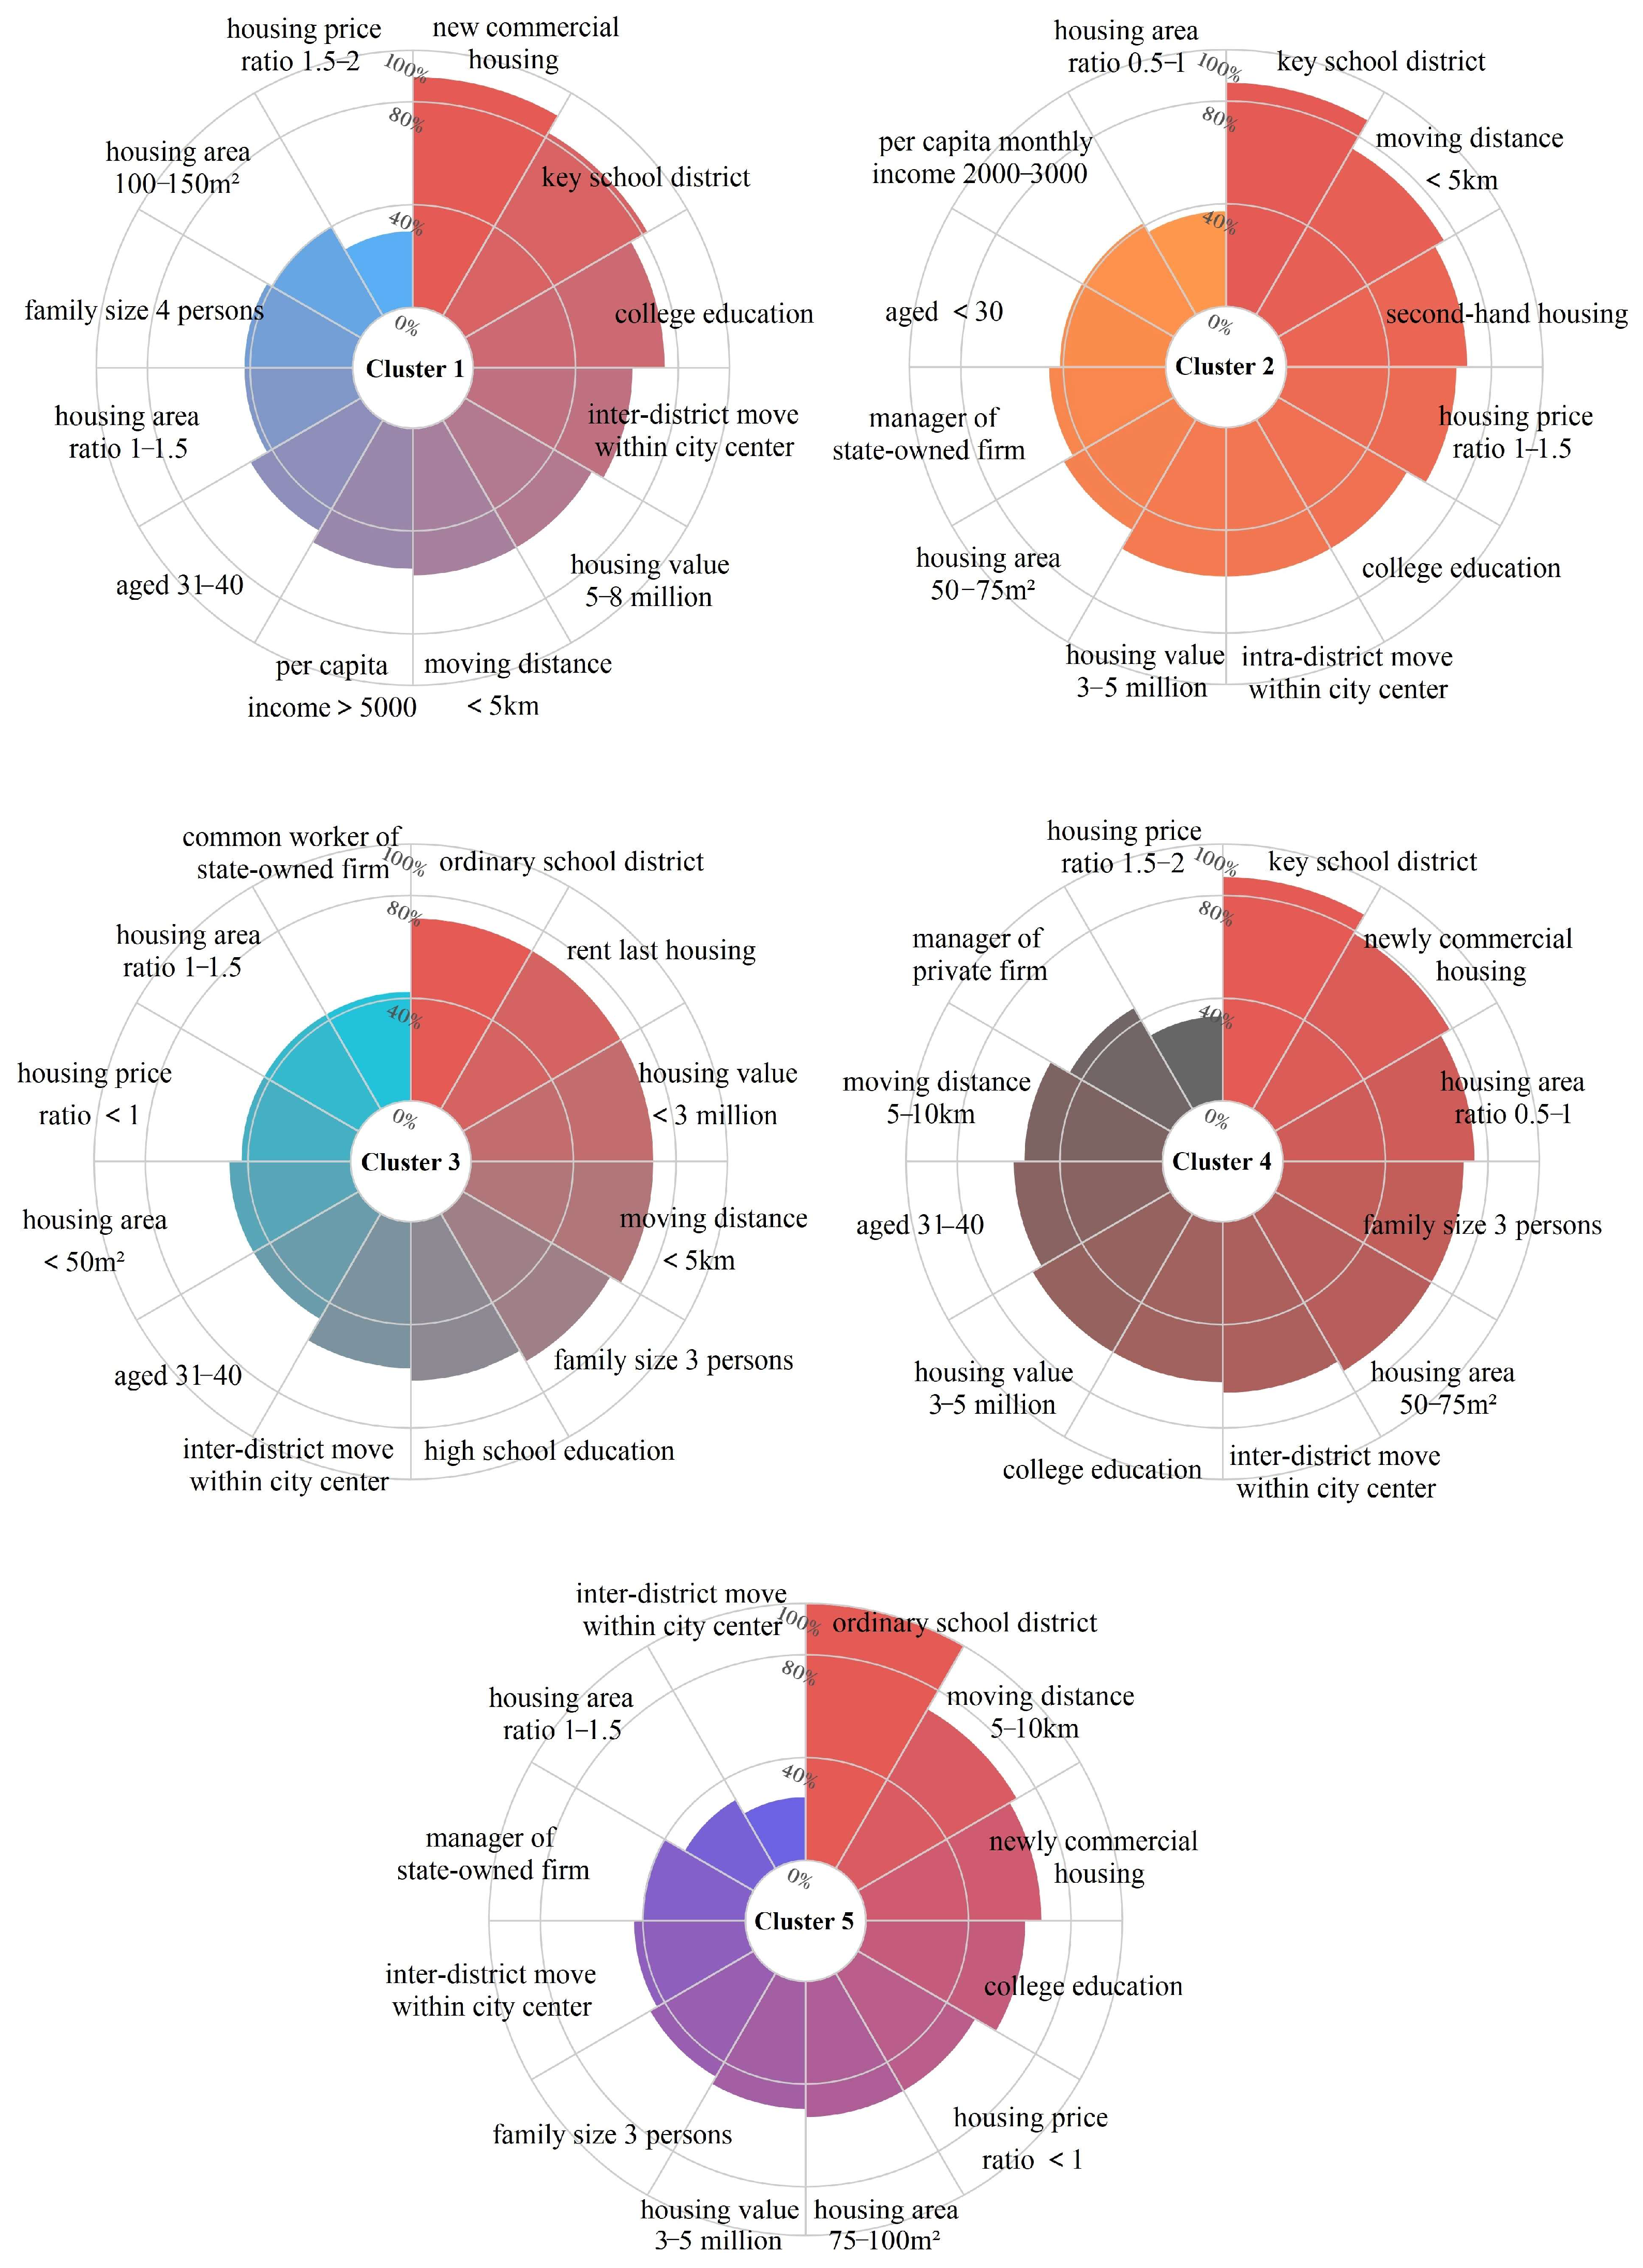
Figure 3. Typical characteristics of each cluster.
Sustainability 17 08326 g003
This cluster consists of young, middle-income families who sacrificed living space and conditions to purchase expensive, old, second-hand housing in key school districts for their children’s education, typically undertaking very short-distance moves within the same central urban district.
Households in this cluster were overall younger when they relocated compared to those in other clusters. Specifically, the age structure mainly consisted of those younger than 30 years old (41.67%) and aged between 31 and 40 years old (29.17%). The per capita monthly income of the family was mostly between 2000 and 4000 CNY (62.5%), and the householders were predominantly employed in management or professional positions in state-owned enterprises or work-units (45.83%). Four persons (33.33%) or three persons (20.83%) were the main family sizes in this cluster. A total of 58.33% of the residential relocations took place within the same district in the city center, so the moving distances were relatively short, with 75% of families relocating less than 5 km.
Residential mobility moving toward key school districts was 87.5%, and 70.83% of families chose to purchase second-hand housing within these districts. Influenced by the work-unit system (danwei), school district housing is frequently located in old communities: dilapidated physical landscapes, high-quality education, poor living conditions, and expensive housing prices are typical features of this type of school district housing. The scarcity of school district apartments has forced many families to buy this type of second-hand housing to access leading schools. For this reason, 41.67% of families sacrifice larger housing areas, and the ratio of their present living area to the previous one is less than 1. The percentage of families with a total housing area between 50 and 75 m2 was 50%, and most families’ present housing was valued at 3–5 million CNY (58.33%). Due to the high proportion of young families in this cluster, it is more likely that these families will choose to relocate again in order to improve housing conditions after their children graduate from key primary or secondary schools.
  • Cluster 3: Short-Distance Relocation within the City Center to Change Home Ownership Status
This cluster consists of low-income families with medium education levels. They transitioned from renting to owning small homes primarily to secure school enrollment eligibility for their children. However, limited funds restrict most from accessing the top school districts. Their mobility is characterized by short-distance moves within the city center.
Families in this cluster have a high rental rate of 71.43% before moving; the proportion of families who own their residences soared to 66.67% after relocation. Since the child’s registered residence is tied to school enrollment, the change to home ownership provides more schooling opportunities for children.
The per capita monthly income of families was concentrated in the range of 1000 to 3000 CNY (66.67%). The majority of householders worked as ordinary employees of state-owned enterprises or work-units (42.86%), and there were also some self-employed individuals in this cluster (19.05%). A total of 61.9% of householders received a high school education.
These families do not have sufficient funds to purchase expensive school district housing; only 28.57% of families moved to key school catchment areas. A total of 47.62% of households had a present housing area of less than 50 m2, and 33.33% of households lived in housing with an area between 50 m2 and 75 m2. However, compared to the size of their last residence, the new housing area is still enlarged by 1 to 2 times (a total of 57.15%). The value of families’ present housing is generally less than 3 million (CNY), with this accounting for 71.4% of the total values recorded.
Most of the relocations in this cluster occurred in the city center, including 57.14% inter-district relocations and 28.57% intra-district relocations. The linear distance of the mobility was usually less than 5 km (71.43%).
  • Cluster 4: Inter-district Relocation in Pursuit of Leading Schools while Reducing Housing Area
This cluster consists of highly educated, high-income nuclear families who undertook long-distance inter-district moves to central key school districts, characterized by their bearing extremely high housing costs and sacrificing living space for educational quality.
Within this cluster of residential mobility, the majority of households purchased new commercial housing (79.17%), and 87.5% of the families moved to key school districts. Half of the households had a per capita monthly income of more than 5000 CNY, and those with a monthly income between 3000 and 4000 CNY account for a quarter. A total of 45.83% of householders were engaged in management or professional positions in private or foreign-funded enterprises. The percentages of householders educated at the university level and the postgraduate level were 62.5% and 20.83%, respectively, with this group having the highest proportion of postgraduate-educated householders in all clusters. Most of the families were three-person families (70.83%).
Because of the extremely expensive price of school district housing, families in this cluster had to buy smaller residences within their limited budgets in pursuit of good quality education. A total of 83.33% of the families had their housing area reduced after relocation, and the area of the families’ present housing was mainly in the range of 50 m2 to 75 m2 (70.83%). However, the value of the housing was as high as 3–5 million (62.5%), or even between 5 million and 8 million CNY (16.67%). These families had to accept an increase in housing price to more than 1.5 times higher than the previous housing (83.33%), as well as undertaking longer relocation distances. Families with moving distances between 5 km and 10 km and over 10 km were 54.17% and 20.83%, respectively, of the total. In terms of location change, 91% of households experienced a relocation from one administrative district to another, with 66.67% of inter-district relocations taking place in the city center, and 25% of relocations moving from the city periphery to the city center.
  • Cluster 5: Long-distance Relocation of Middle-Aged Families to Increase Housing Size
This cluster consists of middle-aged families with stable careers. They made a trade-off in their relocation decision, ultimately choosing long-distance moves to obtain significantly larger housing rather than pursuing key school districts.
Although we screened families for those who considered their children’s schooling needs at the time of relocation, this cluster of families ultimately did not choose to move to key school catchments. Most of the householders were aged from 41 to 50 years old when moving (37.5%) and were managers or professionals in state-owned enterprises or work-units (40.63%). These families enjoyed a larger housing area after relocation, with 53.13% obtaining a present housing area of 75–100 m2 and 28.13% obtaining a present housing area of 100–150 m2. Compared to their former housing, the housing area doubled or trebled for 53.13% and 28.13%, respectively, of the families. Half of the families in this cluster own housing worth between 3 million and 5 million (CNY). Residential relocation is a complex process, and families in this group weighed their children’s schooling needs against the overall improvement in housing conditions when they made the decision to move.
This cluster has the longest straight-line mobility distance, with 71.88% of households moving between 5 km and 10 km and 12.5% of households moving more than 10 km (Figure 4). Around half of the relocations were inter-district moves within the city center (43.75%), and 12.5% of relocations moved from the city center to the periphery.

4. Discussion

In Tianjin, people’s education-driven housing choices are related to the spatial distribution of K-12 schools. Education-driven residential mobility is residential relocation to satisfy endogenous schooling needs due to changes in the life-cycle of families and the uneven spatial distribution of educational facilities. As a kind of public service product, the externality of compulsory education leads to an increase in the price of surrounding real estate [12,13,14,15,16,17,18,19]. Families must make housing decisions based on their ability to pay; thus, there are different types of residential mobility driven by education.
Overall, families with sufficient financial strength tend to gain a ticket to leading schools by purchasing school district housing. This phenomenon occurred in Cluster 1, Cluster 2, and Cluster 4. As demonstrated in studies by Collins, Breen, and Petric, schools have become one of the most important institutions for class reproduction [41,42,43]. Wealthy families use their economic advantages to retain their social capital by accessing key school catchment zones (Cluster 1). In Cluster 2 and Cluster 4, families made a potentially risky decision by sacrificing living space or housing conditions to afford high housing prices and move into a particular inner-city locality. This kind of residential relocation is seen as an effective way to strengthen the middle-class self-identify of their children and to consolidate the social status of their families [9]. Similar findings can be found in Bridge’s study [1], which focused on the risky decision-making of white-collar workers, with high cultural strength but low economic capital, when purchasing properties in run-down neighborhoods. Therefore, in the context of cultural reproduction and class solidification, the decision to move into a key school district is a rational strategy for these families.
It is worth noting that families who compromised on housing conditions to access high-quality education are likely to relocate again to enhance their living space and environment after their children complete compulsory education (such as Clusters 2 and 4), resulting in a high mobility for residents in key school districts [5,44]. Apartments in school districts have become a site for selective belonging, rather than a long-term residence or a dwelling embedded in local identity [5]. Additionally, Smith and Holt argued that the consequences of studentification are often the downgrading of neighborhoods and the physical degradation of buildings [34]; as the parents know that they will move away when their children enter secondary school or high school, their willingness to completely renovate their housing is generally low. There is no need to consider improving housing and communities as part of the strategy to increase the economic and cultural capital of housing because there will always be more parents willing to purchase school district housing. This instability discourages long-term community investment, potentially leading to the physical degradation of housing stock, which is an inefficient form of resource use and may lead to weakened social networks, impacting neighborhood resilience and sustainability [45,46].
For those households who do not purchase housing in a key school district (Cluster 5), they make a deliberate relocation decision after combining the considerations of their children’s education, the overall improvement in housing, and the financial capital of the family. As the schooling need is not the only driver for their residential mobility, the housing needs of these families are met to some extent. Compared to the tendency to move to the city center for families pursuing housing based on educational needs, these families have a more diverse choice of residential location, including inter-district relocation within the city center, relocation from the city periphery to the city center, and also relocation from the city center to the periphery.
Considering the overall characteristics of families in Tianjin that are driven by educational needs, these parents generally have a high level of education, engage in occupations with a certain social status, and earn a middle or above-average income. The value of their present housing is usually higher than 3 million CNY. As education transformed from privilege-based to territorial-based school hierarchies, disadvantaged families became excluded from social mobility [9]. Buyers not only pay for the property itself but also for the rare “admission ticket” to desirable schools [47]. Mathur found that house prices rise as school quality increases [48]. Rising housing costs and rents are often accompanied by increases in the overall cost of living within the community, including recoverable versus irrecoverable costs such as goods, services, and fees [49]. When rent rises surpass what low-income families can afford, or when landlords choose not to renew leases in favor of selling or renting to higher bidders, low-income families have no choice but to move out of the school district in search of more affordable housing.
Butler pointed out that school choice has obvious ‘exclusionary displacement’ and ‘displacement pressure’ [29]. If spatially defined opportunity barriers emerge, they may restrict social mobility and limit access to quality education for disadvantaged groups. In many countries, access to quality public education is often tied to home ownership and residential location, which drives up housing costs in areas with good schools. This dynamic not only aggravates housing affordability challenges but also reinforces educational inequality [14,15,50]. This pattern mirrors the Western phenomenon of “gentrification”—where education quality drives housing market dynamics and residential segregation [1,5,9,29,33]—but is intensified by China’s hukou system and the dual requirements of property ownership and registration status for school admission. Thus, while the mechanisms differ, the outcomes are convergent: educational resources become capitalized into housing markets, and spatial inequalities are reinforced, limiting opportunities for disadvantaged groups and exacerbating socio-economic segregation.
Based on the distinct characteristics of each residential mobility cluster in Tianjin, targeted policies can be formulated to address their specific needs while promoting educational equity: policies for wealthy relocating families (Cluster 1) can focus on implementing progressive property taxation to mitigate housing speculation in premium school districts [51]; policies for young middle-income households (Cluster 2) can provide housing renovation subsidies and property tax relief for owners of aging school-district housing; policies for low-income households (Cluster 3) can prioritize implementing multi-school zoning policies to weaken the link between specific housing location and school access; policies for high-income nuclear families (Cluster 4) can develop targeted housing assistance programs for families purchasing compact units in central school districts; policies for middle-aged families trading school for space (Cluster 5) can prioritize infrastructure investment and quality school development in peripheral receiving areas.

5. Conclusions

Based on the data from a household survey in Tianjin (N = 1441), we used the K-prototype clustering algorithm to identify the typical patterns and relocation characteristics of education-driven residential mobility. We specifically included five distinctive types of relocation: the relocation of wealthy families to a key school district by purchasing new commercial housing (28.37%); the intra-district relocation of young families to purchase second-hand school district housing (17.02%); short-distance relocations within the city center to change home ownership status (14.89%); inter-district relocation in pursuit of leading schools while reducing housing area (17.02%); the long-distance relocation of middle-aged families to increase housing size (22.70%).
As expected, in Tianjin, school district housing is the top choice for families who can afford this option. To this end, parents are willing to pay expensive housing premiums and sacrifice their housing area, which may result in a lower willingness to renovate housing and the possibility of relocating again. Therefore, in Chinese megacities like Tianjin—characterized by scarce high-quality educational resources and rigid school–housing–hukou linkage—urban planning and policy-making must prioritize equitable educational resource allocation (e.g., balancing high-quality school distribution across Tianjin’s central and peripheral districts) and weaken the over-reliance on housing for school access. Education not only influences the family’s housing choice and relocation decisions but also reshapes urban residential patterns and social mobility; as Gulson and Fataar studied in the cases of London, Sydney, and Vancouver, educational policy is core restructuring the neoliberal urban space [52]. Sustainable urban futures require strategies to loosen the rigid coupling between accessing essential public goods (like quality education) and specific, high-cost, locationally constrained housing resources [53].
For families that are influenced by educational needs but who ultimately do not choose to move into a key school catchment, there is an overall improvement in their housing conditions. In addition to the quality of schools, accessibility, commuting distance, and neighborhood environment are also important components of the educational system [30,54]. This study is situated within the context of education-driven residential mobility under China’s school district system. It defines school quality through distinguishing only between “key schools” and “ordinary schools” to measure the impact of residential relocation on children’s education. Therefore, whether the relocation decisions of these families shorten the commuting distance to school for their children or improve the accessibility of education are important issues to be considered and further explored in the research of education-driven residential mobility. The “reason for move” variable in this study was collected through retrospective self-reports: participants were asked to recall the primary reason for their most recent relocation. This approach inherently carries recall bias. Given the cross-sectional design of this study, future longitudinal studies are needed to further verify the potential causal pathways.
While this study focuses on Tianjin, the impacts of such school-housing-linked policies hold broader relevance for global cities facing similar challenges. The mechanisms driving education-related residential mobility—such as school quality influencing housing prices, the trade-off between affordable housing and school access, and the role of parental socio-economic status in shaping educational opportunities—exhibit transferability to contexts such as Europe and the United States. In these regions, similar patterns of “school catchment gentrification” and exclusionary displacement have been observed, particularly in cities with competitive public school systems and geographically constrained access to high-performing schools. However, the hukou system in China introduces a unique institutional barrier that intensifies the stratification effects by legally tying public service access to local registration status—a feature absent in most Western contexts. Moreover, the historical legacy of “key schools” and the highly centralized distribution of elite educational resources in Chinese cities may amplify spatial inequalities more acutely than in systems with greater school choice or more decentralized resource allocation [5,10]. Nevertheless, the underlying dynamics of housing market response to school quality, the strategic behavior of middle-class families, and the resulting socio-spatial segregation demonstrate convergent trends across diverse institutional settings [9].
This study elucidates the heterogeneous mechanisms underlying education-driven residential mobility in Tianjin, revealing the multidimensional characteristics of distinct relocation patterns. By applying K-Prototype clustering, five unique mobility patterns were identified, each exhibiting specific household attributes and relocation behaviors. We operationalized the concept of “balancing housing costs against access to quality education” by comparing changes in housing area and price before and after relocation with the probability of entering a key school district. Additionally, we proposed targeted policy recommendations for different household groups, offering a foundation for policies aimed at promoting equitable resource allocation.

Author Contributions

Conceptualization and original draft preparation, Y.Y.; methodology, S.Y.; review and editing, Y.Y. and T.S. All authors have read and agreed to the published version of the manuscript.

Funding

This study was funded by Shenzhen Philosophy and Social Sciences Foundation (grant number SZ2025B011), and Key Project of Shenzhen Research Center for Pilot Demonstration Zone (grant number SFQZD2405).

Institutional Review Board Statement

The study was conducted in accordance with the Declaration of Helsinki, and the protocol was approved by the Research Ethics Committee of University of Glasgow (protocol code 400190112) on 1 January 2016.

Informed Consent Statement

Verbal informed consent was obtained from the participants. Verbal consent was obtained rather than written because the cultural sensitivity.

Data Availability Statement

Restrictions apply to the availability of these data. Data were obtained from UK Data Service and are available at https://doi.org/10.5255/UKDA-SN-854334 (accessed on 7 September 2021) with the permission of UK Data Service.

Conflicts of Interest

The authors declare no conflicts of interest.

References

  1. Bridge, G. It’s not just a question of taste: Gentrification, the neighbourhood, and cultural capital. Environ. Plan. A Econ. Space 2006, 30, 1965–1978. [Google Scholar] [CrossRef]
  2. Liu, Y.; Yu, S.; Sun, T. Heterogeneous housing choice and residential mobility under housing reform in China: Evidence from Tianjin. Appl. Geogr. 2021, 129, 102417. [Google Scholar] [CrossRef]
  3. Frenkel, A.; Bendit, E.; Kaplan, S. Residential location choice of knowledge-workers: The role of amenities, workplace and lifestyle. Cities 2013, 35, 33–41. [Google Scholar] [CrossRef]
  4. Lawton, P.; Murphy, E.; Redmond, D. Residential preferences of the ‘creative class’? Cities 2013, 31, 47–56. [Google Scholar] [CrossRef]
  5. Wu, Q.; Edensor, T.; Cheng, J. Beyond space: Spatial (re)production and middle-class remaking driven by Jiaoyufication in Nanjing city, China. Int. J. Urban Reg. Res. 2018, 42, 1–19. [Google Scholar] [CrossRef]
  6. Yang, Z.; Hao, P.; Wu, D. Children’s education or parents’ employment: How do people choose their place of residence in Beijing. Cities 2019, 93, 197–205. [Google Scholar] [CrossRef]
  7. Wu, Q.; Zhang, X.; Waley, P. When Neil Smith met Pierre Bourdieu in Nanjing, China: Bringing cultural capital into rent gap theory. Hous. Stud. 2017, 32, 659–677. [Google Scholar] [CrossRef]
  8. Chen, J.; Li, R. Pay for elite private schools or pay for higher housing prices? Evidence from an exogenous policy shock. J. Hous. Econ. 2023, 60, 101934. [Google Scholar] [CrossRef]
  9. Wu, Q.; Zhang, X.; Waley, P. Jiaoyufication: When gentrification goes to school in the Chinese inner city. Urban Stud. 2016, 53, 3510–3526. [Google Scholar] [CrossRef]
  10. Huang, B.; He, X.; Xu, L.; Zhu, Y. Elite school designation and housing prices-quasi-experimental evidence from Beijing, China. J. Hous. Econ. 2020, 50, 101730. [Google Scholar] [CrossRef]
  11. You, Y. A deep reflection on the “key school system” in basic education in China. Front. Educ. China 2007, 2, 229–239. [Google Scholar] [CrossRef]
  12. Feng, H.; Lu, M. School quality and housing prices: Empirical evidence from a natural experiment in Shanghai, China. J. Hous. Econ. 2013, 22, 291–307. [Google Scholar] [CrossRef]
  13. Jin, Z.; Wang, X.; Huang, B. The enrolment reform of schools and housing price: Empirical evidence from Shanghai, China. Int. Rev. Econ. Financ. 2023, 84, 262–273. [Google Scholar] [CrossRef]
  14. Zahirovic-Herbert, V.; Turnbull, G.K. School quality, house prices and liquidity. J. Real Estate Financ. Econ. 2008, 37, 113–130. [Google Scholar] [CrossRef]
  15. Haisken-DeNew, J.; Hasan, S.; Jha, N.; Sinning, M. Unawareness and selective disclosure: The effect of school quality information on property prices. J. Econ. Behav. Organ. 2018, 145, 449–464. [Google Scholar] [CrossRef]
  16. Gibbons, S.; Machin, S. Valuing school quality, better transport, and lower crime: Evidence from house prices. Oxf. Rev. Econ. Policy 2008, 24, 99–119. [Google Scholar] [CrossRef]
  17. Hamnett, C.; Butler, T. “Geography matters”: The role distance plays in reproducing educational inequality in East London. Trans. Inst. Br. Geogr. 2011, 36, 479–500. [Google Scholar] [CrossRef]
  18. Zheng, S.; Hu, W.; Wang, R. How much is a good school worth in Beijing? Identifying price premium with paired resale and rental data. J. Real Estate Financ. Econ. 2016, 53, 184–199. [Google Scholar] [CrossRef]
  19. Chan, J.; Fang, X.; Wang, Z.; Zai, X.; Zhang, Q. Valuing primary schools in urban China. J. Urban Econ. 2020, 115, 103183. [Google Scholar] [CrossRef]
  20. Cellini, S.R.; Ferreira, F.; Rothstein, J. The value of school facility investments: Evidence from a dynamic regression discontinuity design. Q. J. Econ. 2010, 125, 215–261. [Google Scholar] [CrossRef]
  21. Wen, H.; Zhang, Y.; Zhang, L. Do educational facilities affect housing price? An empirical study in Hangzhou, China. Habitat Int. 2014, 42, 155–163. [Google Scholar] [CrossRef]
  22. Peng, Y.; Tian, C.; Wen, H. How does school district adjustment affect housing prices: An empirical investigation from Hangzhou, China. China Econ. Rev. 2021, 69, 101683. [Google Scholar] [CrossRef]
  23. Deurloo, M.C.; Clark, W.A.V.; Dieleman, F.M. The move to housing ownership in temporal and regional contexts. Environ. Plan. A Econ. Space 1994, 26, 1659–1670. [Google Scholar] [CrossRef]
  24. Wu, Y.; Coulter, R.; Dennett, A. Understanding the relationships between the family structures and destinations of married migrants with children in China. Appl. Geogr. 2023, 160, 103102. [Google Scholar] [CrossRef]
  25. Davis-Kean, P.E. The influence of parent education and family income on child achievement: The indirect role of parental expectations and the home environment. J. Fam. Psychol. 2005, 19, 294–304. [Google Scholar] [CrossRef]
  26. Noden, P.; West, A.; David, M.; Edge, A. Choices and destinations at transfer to secondary schools in London. J. Educ. Policy 1998, 13, 221–236. [Google Scholar] [CrossRef]
  27. Clark, W.; Deurloo, M.; Dieleman, F. Residential mobility and neighbourhood outcomes. Hous. Stud. 2006, 21, 323–342. [Google Scholar] [CrossRef]
  28. Rabe, B.; Taylor, M. Residential mobility, quality of neighbourhood and life course events. J. R. Stat. Soc. Ser. A Stat. Soc. 2010, 173, 531–555. [Google Scholar] [CrossRef]
  29. Butler, T.; Hamnett, C.; Ramsden, M.J. Gentrification, education and exclusionary displacement in East London. Int. J. Urban Reg. Res. 2013, 37, 556–575. [Google Scholar] [CrossRef]
  30. Xiang, L.; Gould, M.; Stillwell, J. What determines pupils’ travel distance to school in China? A multilevel analysis of educational access in Beijing. Urban Stud. 2022, 59, 1048–1067. [Google Scholar] [CrossRef]
  31. Yang, Z.; Cai, J.; Qi, W.; Liu, S.; Deng, Y. The influence of income, lifestyle, and green spaces on interregional migration: Policy implications for China. Popul. Space Place 2017, 23, e1996. [Google Scholar] [CrossRef]
  32. Yang, Z.; Dunford, M. City shrinkage in China: Scalar processes of urban and hukou population losses. Reg. Stud. 2018, 52, 1111–1121. [Google Scholar] [CrossRef]
  33. Zhou, X.; Moen, P.; Tuma, N.B. Educational stratification in urban China: 1949–94. Sociol. Educ. 1998, 71, 199. [Google Scholar] [CrossRef]
  34. Smith, D.P.; Holt, L. Studentification and ‘apprentice’ gentrifiers within Britain’s provincial towns and cities: Extending the meaning of gentrification. Environ. Plan. A Econ. Space 2007, 39, 142–161. [Google Scholar] [CrossRef]
  35. Friedman, J. A conditional logit model of the role of local public services in residential choice. Urban Stud. 1981, 18, 347–358. [Google Scholar] [CrossRef]
  36. Gober, P.; McHugh, K.E.; Reid, N. Phoenix in flux: Household instability, residential mobility, and neighborhood change. Ann. Assoc. Am. Geogr. 1991, 81, 80–88. [Google Scholar] [CrossRef]
  37. Henderson, J.V.; Ioannides, Y.M. Dynamic aspects of consumer decisions in housing markets. J. Urban Econ. 1989, 26, 212–230. [Google Scholar] [CrossRef]
  38. Li, S.; Zhu, Y.; Li, L. Neighborhood type, gatedness, and residential experiences in Chinese cities: A study of Guangzhou. Urban Geogr. 2012, 33, 237–255. [Google Scholar] [CrossRef]
  39. Tianjin Municipal Bureau of Statistics. Available online: https://stats.tj.gov.cn/nianjian/2024nj/zk/indexch.htm (accessed on 8 February 2025).
  40. Wang, Y.; Sun, T.; Wu, F.; Zhai, L.; Li, C.; Sun, X.; Hu, W.; Du, P.; Zhang, L.; Zheng, F.; et al. The Re-Making of Chinese Urban Neighbourhoods: Case Studies in Tianjin, Chengdu and Hangzhou 2016–2019; UK Data Service: Colchester, UK, 2020. [Google Scholar] [CrossRef]
  41. Breen, R.; Karlson, K.B. Education and Social Mobility: New Analytical Approaches. Eur. Sociol. Rev. 2013, 30, 107–118. [Google Scholar] [CrossRef]
  42. Collins, J. Social Reproduction in Classrooms and Schools. Annu. Rev. Anthropol. 2009, 38, 33–48. [Google Scholar] [CrossRef]
  43. Petrik, F. Schooling Inequality: Aspirations, Opportunities and the Reproduction of Social Class. Br. J. Educ. Stud. 2025, 73, 273–276. [Google Scholar] [CrossRef]
  44. Butler, T.; Hamnett, C. The Geography of Education: Introduction. Urban Stud. 2007, 44, 1161–1174. [Google Scholar] [CrossRef]
  45. Putnam, R.D. Bowling Alone: The Collapse and Revival of American Community; Simon and Schuster: New York, NY, USA, 2000; 541p. [Google Scholar] [CrossRef]
  46. Hipp, J.R.; Perrin, A.J. The Simultaneous Effect of Social Distance and Physical Distance on the Formation of Neighborhood Ties. City Community 2009, 8, 5–25. [Google Scholar] [CrossRef]
  47. Wen, H.; Xiao, Y.; Zhang, L. School district, education quality, and housing price: Evidence from a natural experiment in Hangzhou, China. Cities 2017, 66, 72–80. [Google Scholar] [CrossRef]
  48. Mathur, S. The Myth of “Free” Public Education: Impact of School Quality on House Prices in the Fremont Unified School District, California. J. Plan. Educ. Res. 2017, 37, 176–194. [Google Scholar] [CrossRef]
  49. DiSalvo, R.W.; Yu, J.H. Housing Affordability and School Quality in the United States. J. Hous. Econ. 2023, 60, 101933. [Google Scholar] [CrossRef]
  50. Guan, R.; Liang, J.; Koo, K.M.; Su, K. Fairer schooling for a better housing environment: Effect of abolishing school zones on the housing market. Habitat Int. 2024, 153, 103199. [Google Scholar] [CrossRef]
  51. Du, Z.; Zhang, L. Home-purchase restriction, property tax and housing price in China: A counterfactual analysis. J. Econom. 2015, 188, 558–568. [Google Scholar] [CrossRef]
  52. Gulson, K.N.; Fataar, A. Neoliberal governmentality, schooling and the city: Conceptual and empirical notes on and from the Global South. Discourse Stud. Cult. Politics Educ. 2011, 32, 269–283. [Google Scholar] [CrossRef]
  53. Zhao, Y.; Ma, J.; Lan, Z. Balancing education and real estate: The impact of the teacher rotation policy on school district housing prices. Financ. Res. Lett. 2024, 69, 106131. [Google Scholar] [CrossRef]
  54. Zangger, C. The social geography of education: Neighborhood, class composition, and the educational achievement of elementary school students in Zurich, Switzerland. Z. Für Soziologie 2015, 44, 292–314. [Google Scholar] [CrossRef]
Figure 1. The city center and city periphery in Tianjin.
Sustainability 17 08326 g001
Figure 2. The silhouette coefficient evaluated for optimal k.
Sustainability 17 08326 g002
Figure 4. Features of residential mobility for the five types.
Sustainability 17 08326 g004aSustainability 17 08326 g004bSustainability 17 08326 g004c
Table 1. Family characteristics of educational-driven residential mobility.
AttributeCategory/ValueProportion
Family size12.84%
214.89%
343.26%
424.82%
511.35%
62.84%
Age of the householder
when moving
≤3022.70%
31–4039.72%
41–5016.31%
51–6012.77%
≥608.51%
Sex of the householderMale67.38%
Female32.62%
Educational attainment
of the householder
Primary1.42%
Secondary7.80%
High19.86%
College59.57%
Graduate11.35%
Householder’s occupationGovernment official/civil servant7.80%
Manager or professional of state-owned enterprise32.62%
Common employee of state-owned enterprise16.31%
Manager or professional of private or foreign company21.28%
Common employee of private or foreign company9.93%
Self-employed/casual worker12.06%
Hukou of the householderTianjin hukou within city center96.45%
Tianjin hukou within city periphery0.71%
Urban hukou outside Tianjin1.42%
Rural hukou outside Tianjin1.42%
Per capita monthly
income of the family
(0, 1000]4.26%
(1000, 2000]15.60%
(2000, 3000]21.28%
(3000, 4000]17.73%
(4000, 5000]9.93%
>500031.21%
Table 2. Spatial features and housing characteristics of relocation.
AttributeCategoryProportion
Moving distance(km)(0, 5]47.52%
(5, 10]37.59%
>1014.89%
Location changeIntra-district relocation within city center25.53%
Inter-district relocation within city center52.48%
Relocation within city periphery1.42%
Relocation from city periphery to center16.31%
Relocation from city center to periphery4.26%
School district of the present housingOrdinary school district42.55%
Key school district57.45%
Area of the present housing(m2)(0, 50]10.64%
(50, 75]30.50%
(75, 100]24.11%
(100, 150]22.70%
>15012.06%
Housing area ratio
(present housing/old housing)
(0, 0.5]4.96%
(0.5, 1]31.91%
(1, 1.5]28.37%
(1.5, 2]17.02%
(2, 2.5]8.51%
>2.59.22%
Total price value for the present housing
(million CNY)
≤328.37%
(3, 5]38.30%
(5, 8]23.40%
>89.93%
Unit price ratio
(present housing/old housing)
(0, 1]24.82%
(1, 1.5]29.79%
(1.5, 2]19.15%
(2, 2.5]12.77%
>2.513.48%
Ownership of the present housingSelf-owned commercial housing60.28%
Self-owned affordable housing 0.71%
Self-owned second-hand housing25.53%
Self-owned work-unit housing5.67%
Self-owned resettlement housing1.42%
Rent6.38%
Ownership of the last housingSelf-owned commercial housing46.81%
Self-owned affordable housing 0.71%
Self-owned second-hand housing6.38%
Self-owned work-unit housing7.80%
Self-owned resettlement housing1.42%
Rent33.33%
Other3.55%
Table 3. Categorical variable encoding.
Categorical AttributesCategoryCodeMinMax
Ownership of the present housingSelf-owned commercial housing116
Self-owned affordable housing 2
Self-owned second-hand housing3
Self-owned work-unit housing4
Self-owned resettlement housing5
Rent6
Ownership of the last housingSelf-owned commercial housing117
Self-owned affordable housing 2
Self-owned second-hand housing3
Self-owned work-unit housing4
Self-owned resettlement housing5
Rent6
Other7
Location changeIntra-district relocation within city center115
Inter-district relocation within city center2
Relocation within city periphery3
Relocation from city periphery to center4
Relocation from city center to periphery5
Unit price ratio
(present housing/old housing)
(0, 1]115
(1, 1.5]2
(1.5, 2]3
(2, 2.5]4
>2.55
Housing area ratio
(present housing/old housing)
(0, 0.5]116
(0.5, 1]2
(1, 1.5]3
(1.5, 2]4
(2, 2.5]5
>2.56
Moving distance(km)(0, 5]113
(5, 10]2
>103
Age of the householder
when moving
≤30115
31–402
41–503
51–604
≥605
Educational attainment
of the householder
Primary115
Secondary2
High3
College4
Graduate5
Sex of the householderMale112
Female2
Householder’s occupationGovernment official/civil servant116
Manager or professional of state-owned enterprise2
Common employee of state-owned enterprise3
Manager or professional of private or foreign company4
Common employee of private or foreign company5
Self-employed/casual worker6
Hukou of the householderTianjin hukou within city center114
Tianjin hukou within city periphery2
Urban hukou outside Tianjin3
Rural hukou outside Tianjin4
School district of the present housingOrdinary school district112
Key school district2
Disclaimer/Publisher’s Note: The statements, opinions and data contained in all publications are solely those of the individual author(s) and contributor(s) and not of MDPI and/or the editor(s). MDPI and/or the editor(s) disclaim responsibility for any injury to people or property resulting from any ideas, methods, instructions or products referred to in the content.