1. Introduction
The contemporary economic landscape faces a series of transformative developments, notably globalization, internationalization, and integration processes, which have precipitated an escalation in the competitive intensity within the global market. Today, a multitude of factors contribute to the growth and development of economies. In addition to conventional productive inputs (labor, natural resources, and capital), emerging elements such as knowledge, innovative technologies, sophisticated infrastructure, and skilled employees have emerged as significant drivers [
1]. In order to maintain competitiveness in the marketplace, companies are compelled to perpetually enhance the quality and range of their products and services. This is also true for farms. In order to compete in domestic and global markets, farmers must implement measures that will lead to the optimization of production and increase the quality of their output. This is closely related to the proper organization of agricultural production processes and the improvement of the manufacturing technologies used, and thus involves the need for modern technical facilities. As Babuchowska and Marks-Bielska have noted, the necessity of implementing changes on farms to modernize them is indisputable, because modernization is defined by transformations that result in progress [
2].
It is important to acknowledge that the modernization of farms is influenced not only by the investment capabilities of farm owners, which are often determined by financial markets, but also significantly by state policy in this regard. Agricultural policy, and, in particular, the European Union’s Common Agricultural Policy, plays an important role in stimulating and intensifying the agricultural modernization process. Within the CAP’s broader framework, a range of instruments is systematically implemented during each programming period to facilitate investment activities on EU farms [
3]. Czubak et al. underscore the pivotal role of intervention policies enacted by the government, particularly in light of the distinct characteristics inherent to agricultural production [
4]. The cost-effectiveness of investment in agriculture is significantly lower compared to other sectors of the economy. Farmers confront a limited capacity to generate profit from agricultural production, which in turn relatively restricts their ability to mobilize internal funds for investment purposes.
Upon Poland’s accession to the EU in 2004, domestic farms were incorporated into the direct payment schemes implemented under the 1st Pillar of the Common Agricultural Policy (CAP), along with specific rural development programs, which constituted the 2nd Pillar. On the one hand, the provision of direct payments to farmers has been shown to facilitate the development of their investment capacity [
5]. This, in turn, has the potential to accelerate the process of technological transformation [
6]. On the other hand, farmers became eligible for support under rural development programs, which were designed to primarily support agricultural investment and essentially consisted of non-refundable investment subsidies. The promotion of investment activities among farmers is regarded as a crucial strategy for enhancing agricultural competitiveness [
7].
Rural Development Programs implemented under the CAP offer investment support for farm modernization, thereby underscoring the necessity for its comprehensive evaluation. Therefore, it is particularly important to analyze the instruments that were expected to have the greatest impact on the transformation of agriculture. One such instrument was the Measure “Modernisation of agricultural holdings”, which was implemented under the 2007–2013 Rural Development Program (RDP) and continued, in a slightly modified form, in subsequent programs.
While the literature has extensively documented the efforts of farmers to secure EU funding and the regional disparities in the allocation of these funds, there remains a paucity of research that is both comprehensive and systematic in its examination of the consequences of the implementation of RDP investment measures. As Wieliczko observes, even the EU system of evaluating RDP support lacks the capacity to provide adequate knowledge regarding the effects of implementing individual measures [
8]. This hinders the capacity to evaluate the instruments’ efficacy and ascertain which instruments should be implemented in contexts characterized by diverse development needs across countries or regions. To date, the extant literature has focused primarily on two aspects: the number of applications submitted in each region and the number of contracts concluded. For example, Wawrzyniak has examined the number of applications submitted in each region [
9]. Hornowski has evaluated the economic efficiency of RDP-financed investments carried out in selected farms [
10]. In turn, Pawlowska and Bocian estimated the impact of 2014–2020 RDP investment measures (in Poland) on labor productivity growth by comparing a group of farms benefiting from subsidies against a similar group in terms of selected characteristics that did not receive such support [
11]. The authors employed two distinct research approaches in their study: the method of combining data based on the probability of being subjected to the impact (propensity score), and the analysis of the robustness of the obtained result to the number of units considered in the control group, using the method of weighting the data by probability. In both cases, it was demonstrated that beneficiaries of RDP’s investment measures exhibited higher labor productivity compared to farms that did not receive investment payments during the same period. Michalek arrived at analogous conclusions when estimating the effects of the Agrarinvestitionsförderungsprogramm (AFP) implemented in the Schleswig-Holstein region of Germany [
12]. His study demonstrated that labor productivity in the beneficiary group exhibited a greater increase than that observed in the control group of farms.
A multitude of studies conducted by various authors have demonstrated the existence of regional disparities in the extent of agricultural development across Poland (e.g., [
13,
14,
15,
16,
17]). A series of studies undertaken in Poland (e.g., [
18,
19,
20]) have indicated that beneficiaries of RDP investment funds are often larger farms, both in economic terms and in terms of acreage. Furthermore, these studies have shown that the frequency of applications for these funds is higher in areas characterized by a relatively superior agrarian structure. However, the question of evaluating the effects of implementing modernization measures in areas with similar farming conditions remains unanswered.
The primary objective of this paper was to assess whether the implementation of modernization measures has contributed to the improvement of agricultural development indicators in areas with a high number of modernization projects implemented, compared to areas with similar farming conditions but with low interest among farmers in this measure.
The present study pertains to the measure entitled “Modernisation of agricultural holdings” established under Council Regulation (EC) No. 1698/2005. In essence, the objective was to ascertain the existence of a correlation between the implementation of modernization measures by farmers and the improvement of indicators that evaluate the level of agricultural development, under the condition that there were no initial differences in agricultural development.
The subsequent section delineates the adopted work plan. The paper presents the applied research method, and then describes the measure of 2007–2013 RDP, entitled “Modernisation of agricultural holdings”, which is subject to analysis. In accordance with the findings of Kiryluk-Dryjska, Więckowska, and Sadowski [
21], regions exhibiting analogous agricultural conditions, distinguished by a comparatively elevated or diminished frequency of fund application for modernization purposes, have been delineated. In the subsequent stage of the research, the analyzed areas were characterized in terms of the level of agricultural development in 2010 and 2020 (the periods when the general agricultural censuses were carried out in Poland). This allowed for an assessment of changes during the implementation of the measure “Modernisation of agricultural holdings.” On this basis, an assessment was conducted to determine whether there are differences in the effects of the implementation of the analyzed measure between areas with similar farming conditions. The results obtained were discussed, and final conclusions were proposed.
2. Materials and Methods
The analysis was grounded in the research conducted by Kiryluk-Dryjska, Więckowska, and Sadowski [
21]. In their work, the authors demonstrated the existence of territorial clusters of rural areas in Poland, in which the rate of applications for the measure “Modernisation of agricultural holdings” was above or below the national average. The analysis was conducted at the local level, specifically NUTS 5 (municipalities), which corresponds to the smallest administrative units in Poland. The analysis encompassed both rural and urban-rural municipalities. The coefficients of frequency of application by farmers for funding under the analyzed measure of the 2007–2013 RDP were calculated based on the number of applications for support submitted by farmers under the measure “Modernisation of agricultural holdings” compared to the total number of farms in the municipality. The empirical Bayesian smoothing routine was applied to the calculated indicators [
22]. In a subsequent step, the authors implemented the global Moran (I) statistic [
23] to ascertain the presence of spatial autocorrelation in the index. They also employed a local version of the Moran statistic (developed by Anselin [
24]) to determine whether neighboring municipalities exhibit clusters of similar index values. Kiryluk-Dryjska et al. [
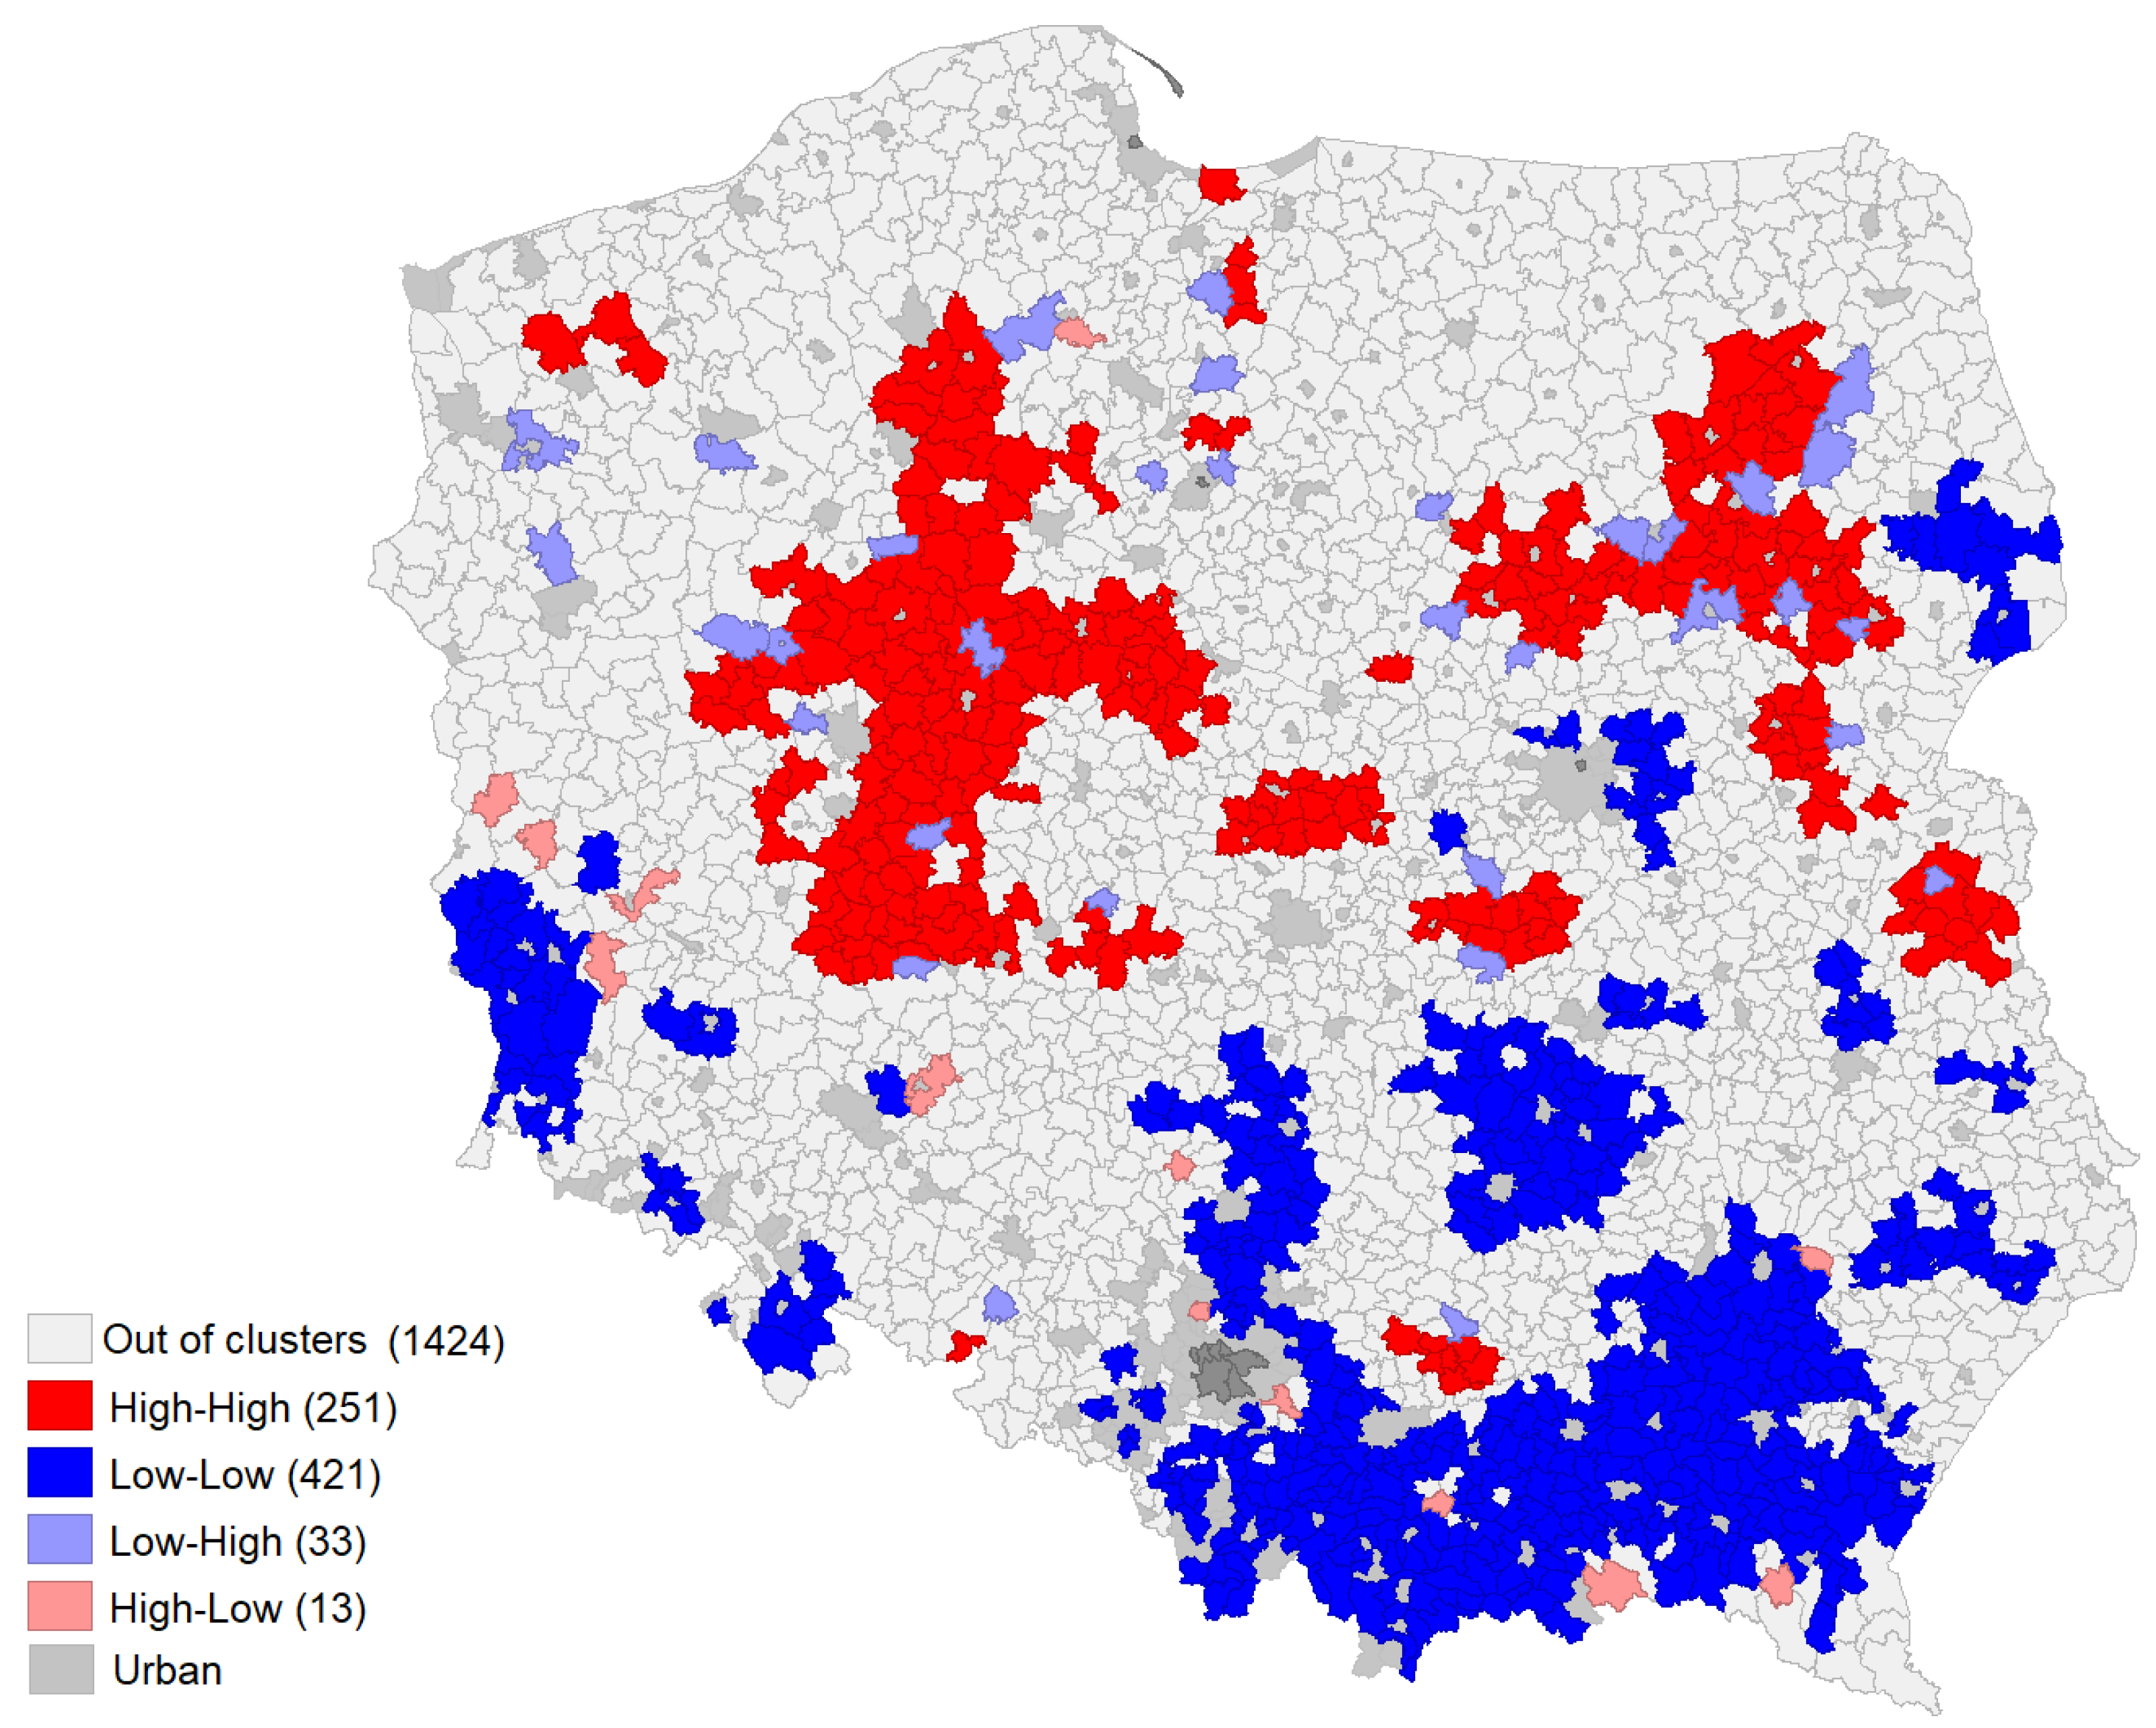
21] demonstrated the presence of clusters in Poland exhibiting varying frequencies of application for investment funds of the 2007–2013 RDP under the measure “Modernisation of agricultural holdings.” The identified clusters are distributed across the landscape as illustrated in
Figure 1.
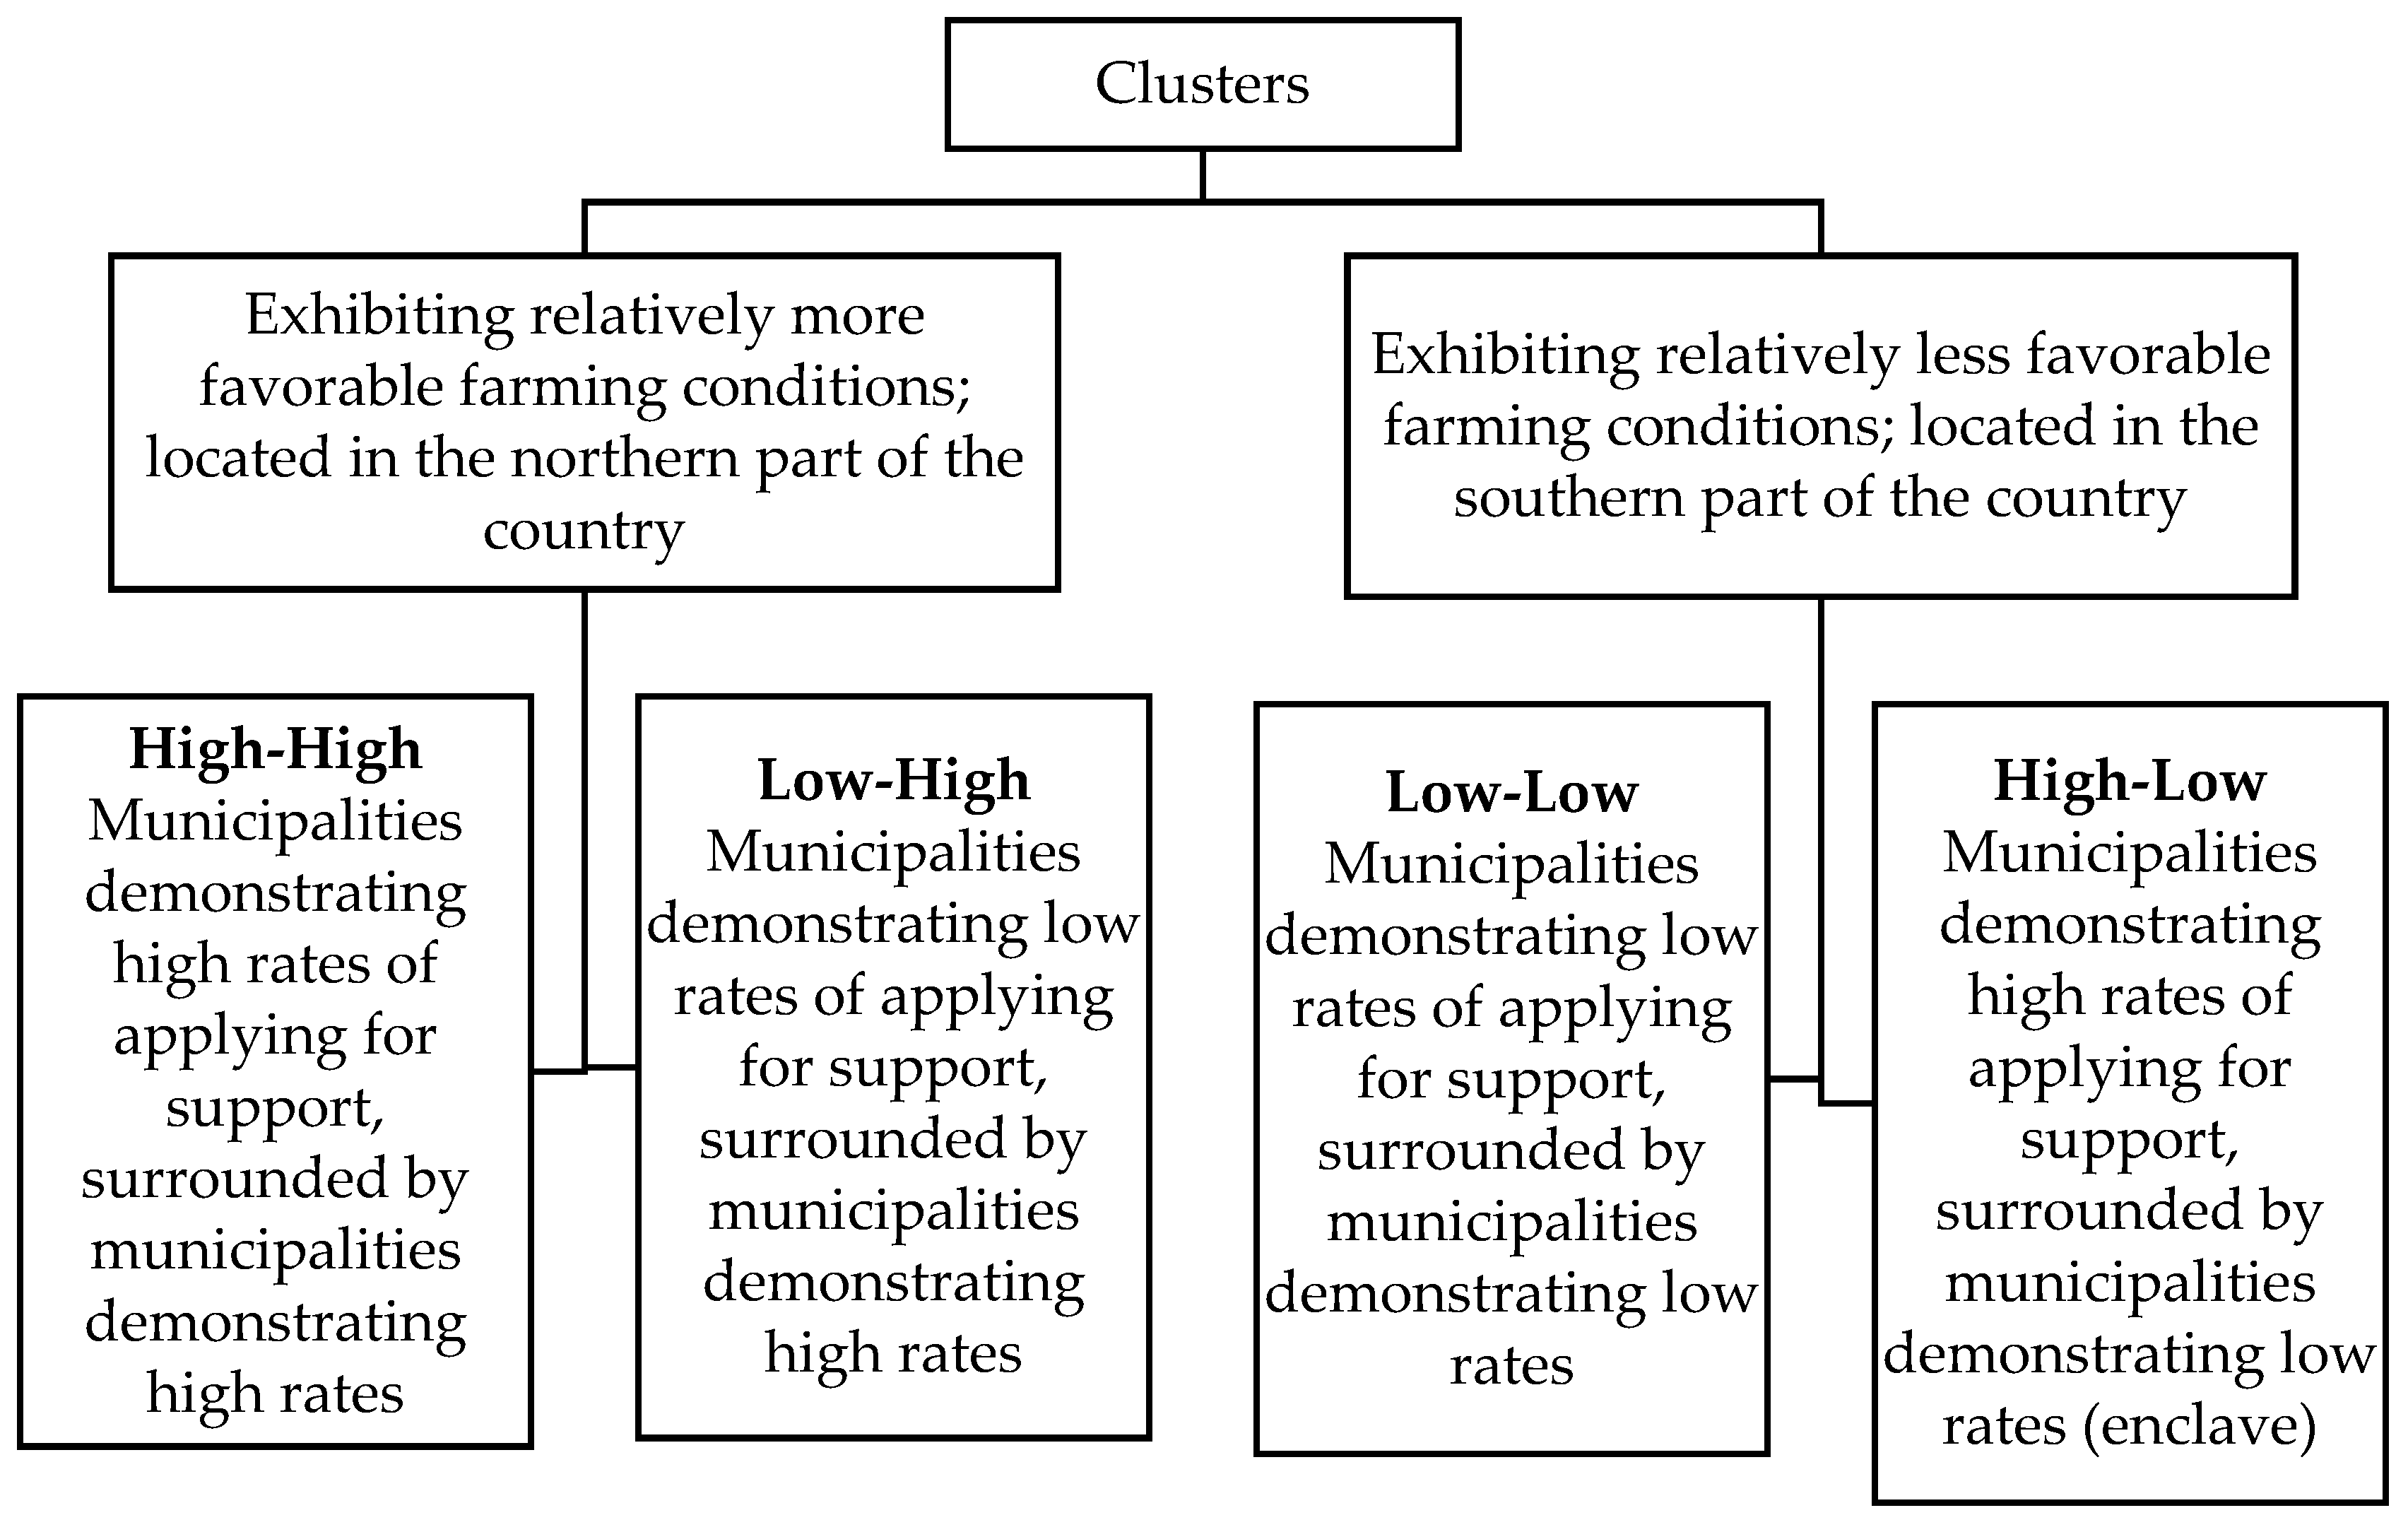
In accordance with the method employed in this study, four clusters with different frequencies of application were identified in Poland. The first cluster, designated “High–High,” included 251 municipalities (11.7%) with above-average frequency rates of application. The second cluster, “Low–Low,” encompassed 421 municipalities (19.7%) where the level of application was below the national average. The third and fourth clusters were identified as outliers, defined as statistically significantly different from neighboring municipalities in terms of frequency of application (46 units in total). The Low–High cluster consisted of low-index municipalities surrounded by high-index municipalities, while the High–Low cluster included high-index municipalities applying for funds adjacent to municipalities where they apply far less frequently. The remaining 1424 municipalities exhibited average application rates.
The geographical distribution of these clusters demonstrated a robust correlation with the agrarian structure of Polish farms. Members of the High–High cluster are located in the northern part of the country, primarily in the Wielkopolskie and Kujawsko-Pomorskie voivodeships. These regions are distinguished by a notable proportion of farms that exceed 10 hectares in area. According to Kiryluk-Dryjska and Wawrzynowicz [
25], the areas of the Wielkopolskie voivodeship that are part of the High–High cluster are among the most economically developed regions in Poland. They are also distinguished by their well-developed economic infrastructure, the quality of their labor market resources, and their capacity for market absorption. Conversely, the municipalities comprising the Low–Low cluster are predominantly situated in the southern region of the country, specifically within the boundaries of the Małopolskie, Świętokrzyskie, Podkarpackie, and Dolnośląskie voivodeships. These regions are distinguished by a relatively high degree of agrarian fragmentation, which is predominantly a consequence of historical developments [
26].
The study by Kiryluk-Dryjska et al. [
21] thus corroborates the hypothesis that there is a relationship between the level of agricultural development and the rate of application for support. A general observation indicates that the frequency of applications for support is higher in areas with a higher level of agricultural development, such as Northern Poland. This is in contrast to Southern Poland, where the agrarian structure is less favorable. A particularly salient result from the standpoint of the stated research objective of this paper is the demonstration of the existence of outlier clusters of Low–High and High–Low municipalities. Farmers in the Low–High regions of northern Poland faced comparable farming conditions to those in the High–High clusters. However, the frequency at which they sought modernization measures was notably lower. Conversely, farmers in High–Low clusters inhabit regions characterized by suboptimal agrarian structures, yet their inclination towards modernization measures exceeded the national average. These relationships constituted the foundation for the analysis of the effects of modernization measures presented in this publication. The analysis compared the outcomes of modernization measures in areas with similar agrarian conditions characterized by relatively high and low frequency of applying for modernization funds.
In the initial stage, members of the four clusters distinguished by Kiryluk-Dryjska and others [
21] were identified, and for these municipalities, the fundamental indicators of agricultural development were calculated over two periods: 2010 and 2020. During this period, the Central Statistical Office in Poland undertook comprehensive agricultural censuses, facilitating the compilation of pertinent indicators. It was hypothesized that in 2010, the implementation of the measure was in its nascent stage, thereby establishing 2010 as the point of origin for the analysis. It was anticipated that by 2020, the effects of the measures would become discernible. The dynamics of these changes were also analyzed. Subsequently, the dynamics of agricultural development indicators were compared with each other in clusters located in the same region of Poland. These clusters were characterized by similar farming conditions and similar characteristics (climatic conditions, farm size, crop structure, production direction, etc.), but differed in their activity in applying for investment funds from the Modernization measure. In other words, the increments of agricultural development indicators were compared in the High–High and Low–High (northern Poland) and Low–Low and High–Low (southern Poland) clusters. This way of presenting data facilitated an assessment of the role that the implementation of modernization measures played in enhancing agricultural development indicators in regions with a high number of modernization projects implemented, relative to regions with low farmers’ interest in this measure. Additionally, the analysis sought to determine whether the initial level of agricultural development was a determining factor in any observed differences in the improvement of these indicators.
The indicators covered by the analysis characterized the overall level of agricultural development, including the agrarian structure of farms, animal production, crop production, the degree of mechanization of farms, and the level of fertilization (the definitions and sources of the indicators are given in
Table 1). These are mainly indicators that determine the size and potential of agricultural holdings, as well as their connection to the market. The selection of indicators was driven by an attempt to encompass a diverse array of variables, thereby ensuring a comprehensive depiction of Poland’s agricultural development. On the other hand, the selection of variables was also constrained by the availability of data. The extant studies on the effectiveness of investment support under the Common Agricultural Policy [
11,
12,
27] utilized variables presenting the financial and economic situation of farms. This was achieved by employing data at the level of individual farms, utilizing FADN data (or farm bookkeeping data). The present research, in turn, focuses on analysis at the level of municipalities—the smallest administrative unit of local government in Poland.
The application of analysis of variance using the Kruskal–Wallis ANOVA rank test enabled the assessment of the initial level of agricultural development among individual clusters and the development of a comparative scheme among municipalities within clusters.
3. “Modernisation of Agricultural Holdings” Under the 2007–2013 RDP
In recent decades, Poland’s agricultural sector has undergone relatively rapid transformations, particularly following its accession to the European Union in 2004. This event signified a pivotal moment for the nation, as it coincided with the initiation of substantial support through successive programs. The initial opportunities for agricultural development emerged with the implementation of the Sectoral Operational Program–Agriculture and the Rural Development Plan for 2004–2006. These measures were implemented to facilitate modernization initiatives among agricultural producers in Poland. However, the initial period of support from EU funds was comparatively brief. It was not until the subsequent budget period that the full range of agricultural support opportunities became available. The implementation of the 2007–2013 Rural Development Program aimed to modernize various forms of agriculture through the implementation of construction investments and the equipping of farms with machinery necessary for agricultural production. A notable 2007–2013 RDP measure, particularly important in the context of achieving economic self-sufficiency, was “Modernisation of agricultural holdings.” From 2004 to 2006, it was financed by the European Agricultural Guidance and Guarantee Fund. Later, from 2007 to 2013, it source of financing was the European Agricultural Fund for Rural Development. The overarching objective of the measure was to support the modernization of farms. This was expected to result in increased economic efficiency through the improved use of productive inputs, including better production quality, the introduction of new technologies, the diversification of agricultural activities, the harmonization of production conditions on the farm with environmental requirements, and improved production hygiene and animal welfare conditions.
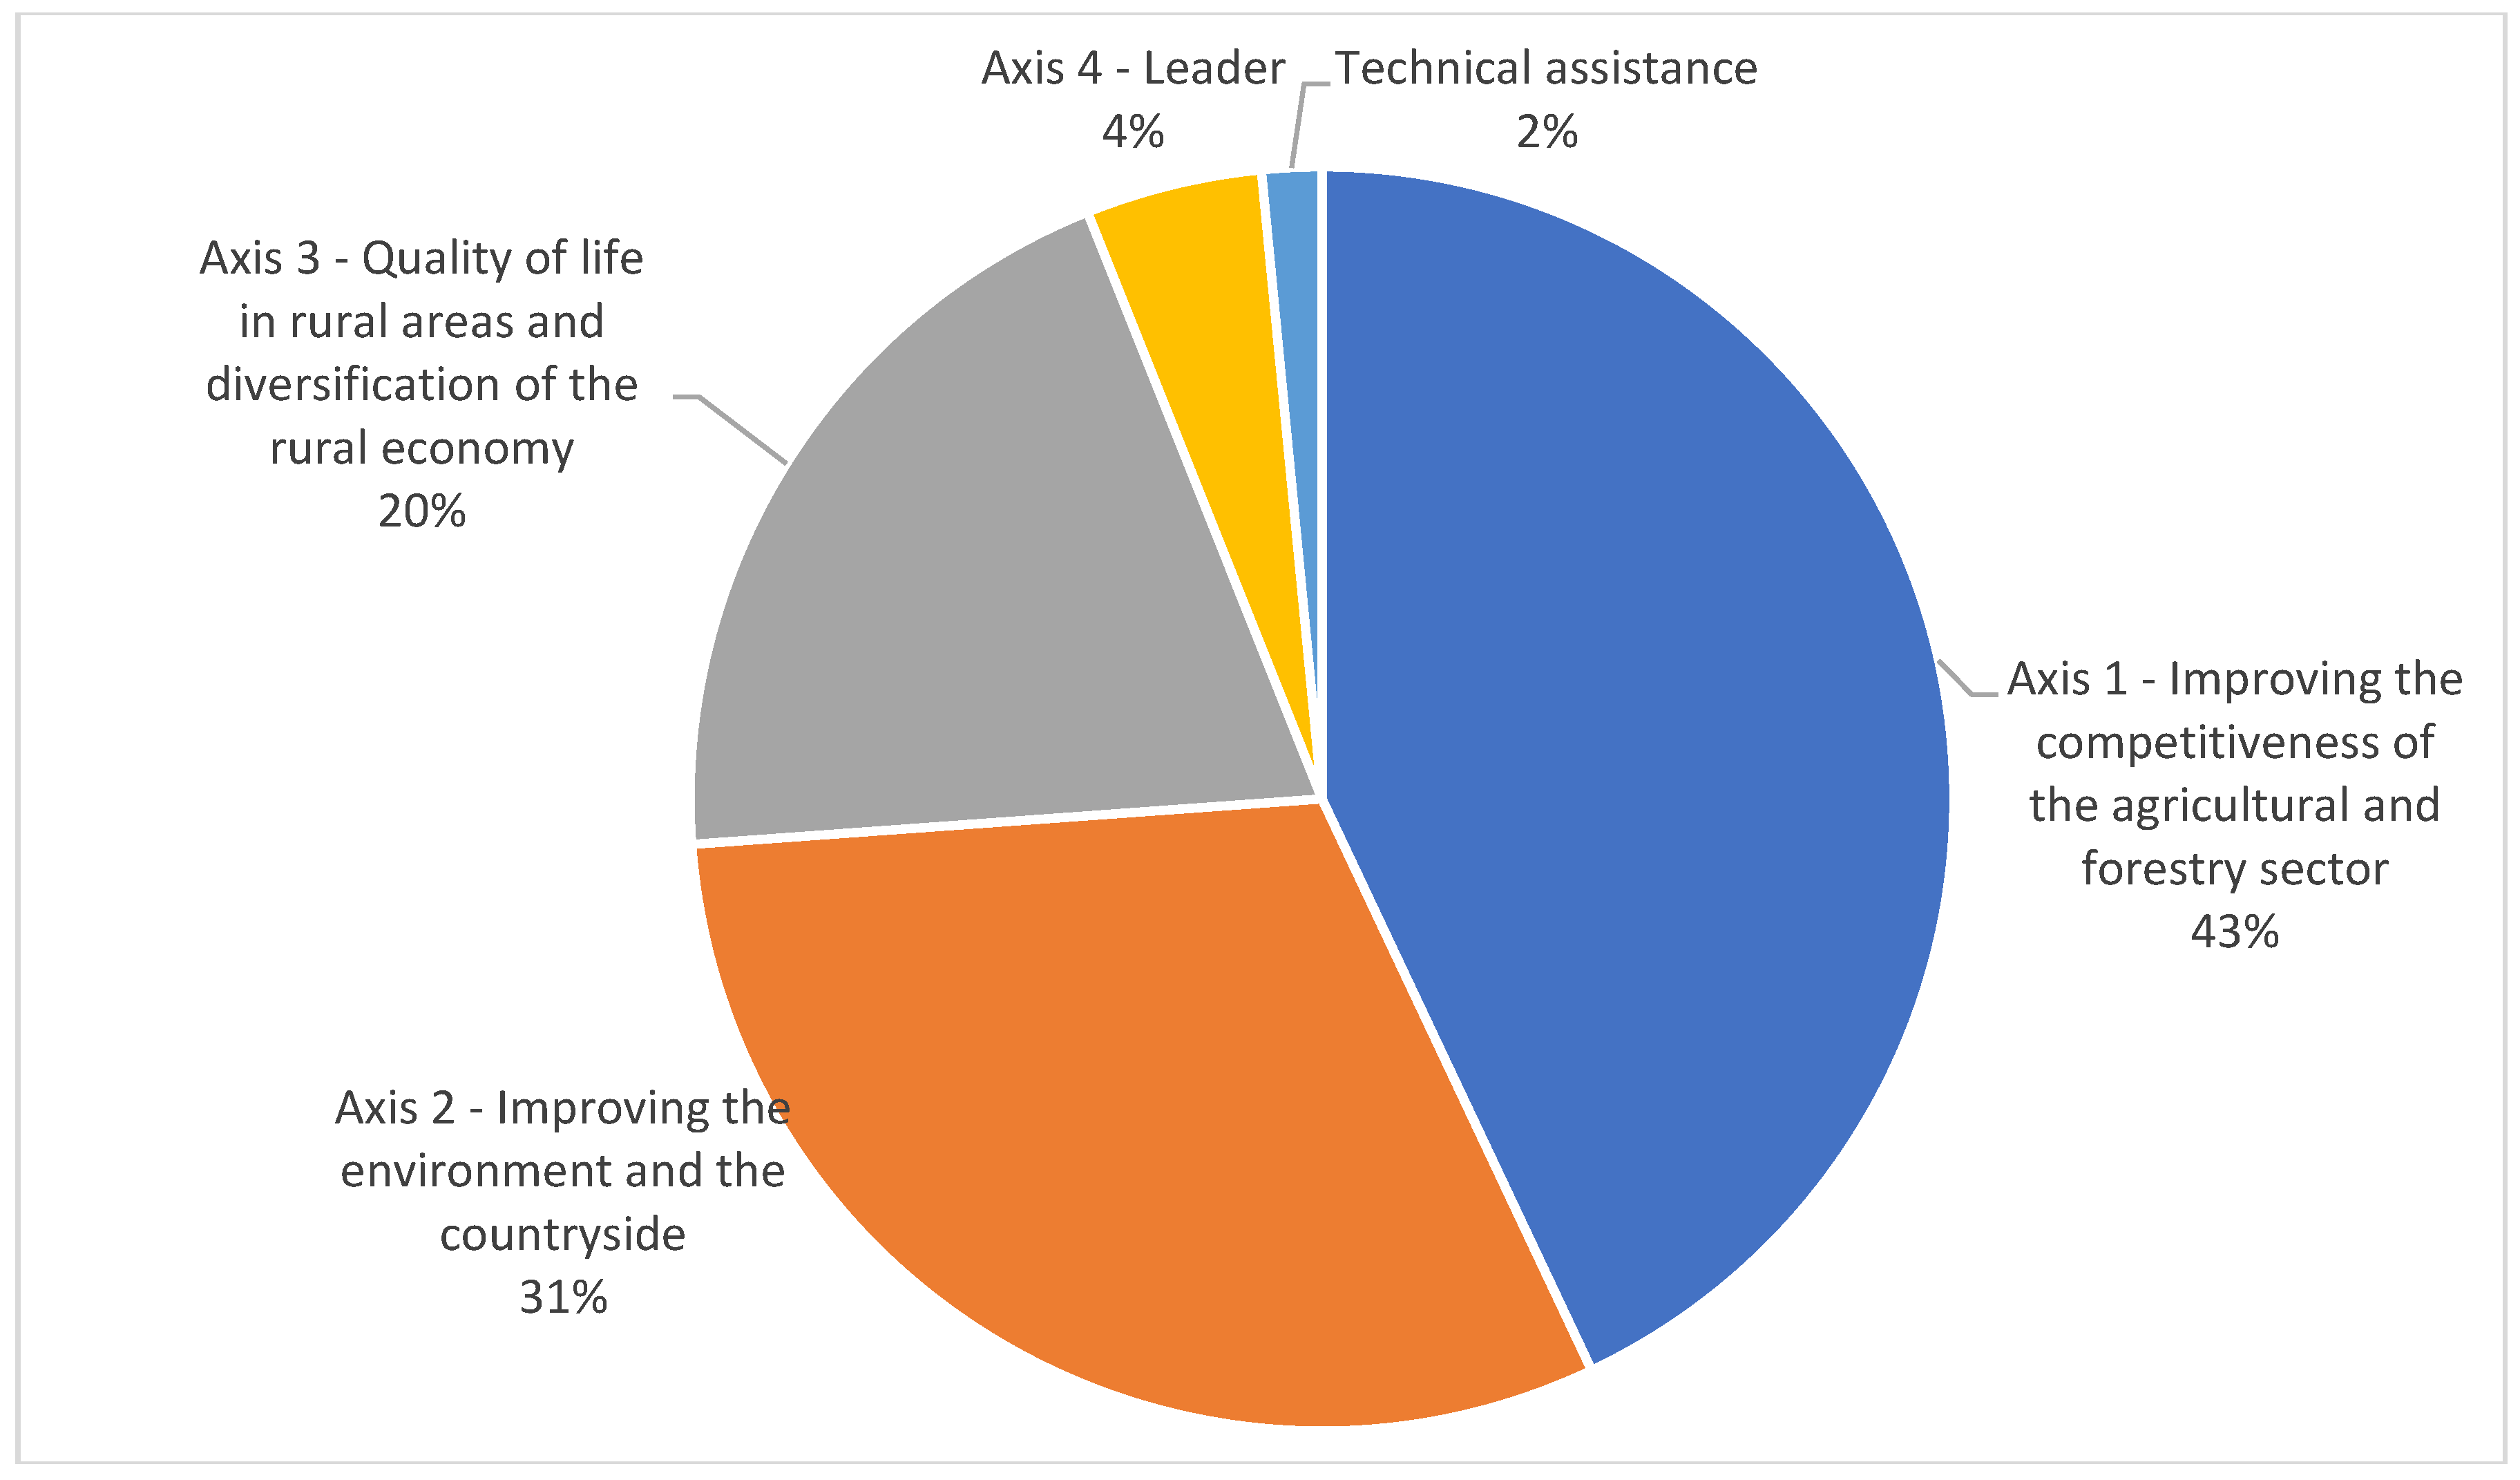
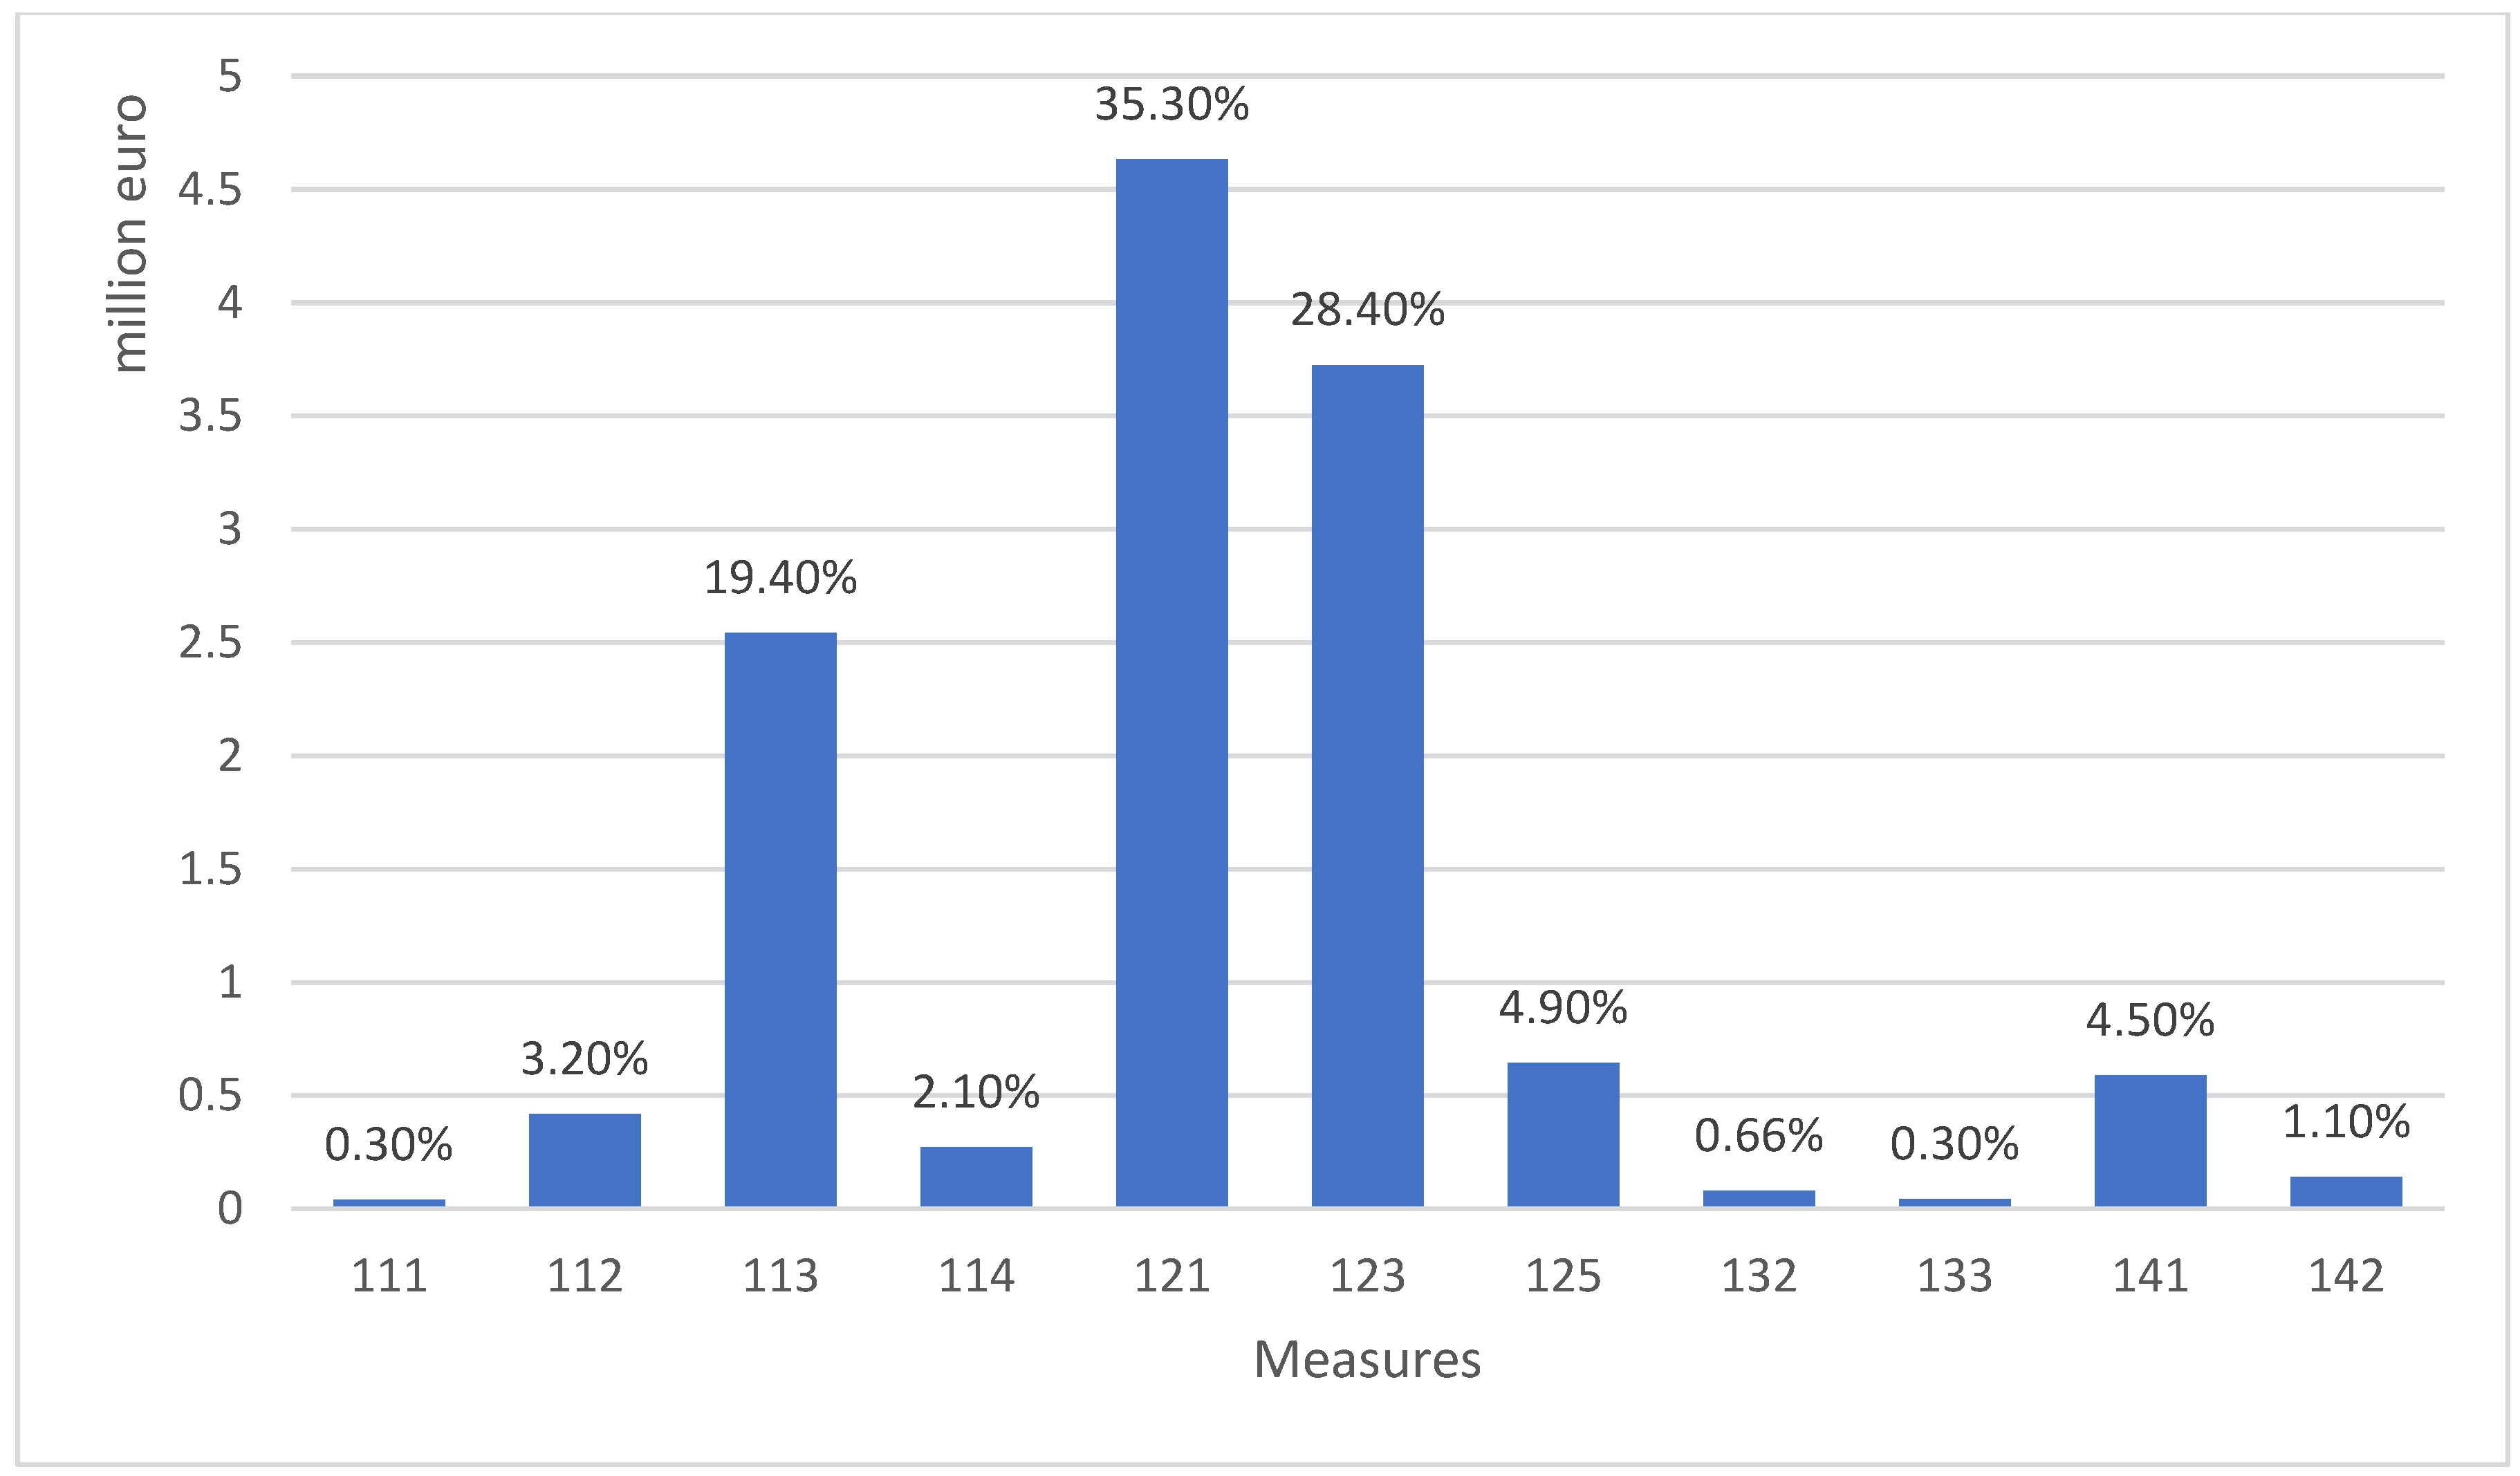
The 2007–2013 RDP budget was EUR 17.4 billion, 75% of which was EAFRD support. The program was implemented under four priority axes (Council Regulation (EC) No. 1698/2005). Measure 121, “Modernisation of agricultural holdings,” was part of Axis 1, “Improving the Competitiveness of the Agricultural and Forestry Sector,” which received the largest amount of payments. Approximately 43% of the entire RDP 2007–2013 budget was allocated to its implementation (
Figure 2). At the same time, the funds spent on implementing the analyzed measure accounted for as much as 35% of the expenditures under Axis 1 (
Figure 3) and ca. 14% of the total program budget [
28]. By the end of 2015, more than 73,000 contracts had been signed under the measure [
29]. The measure’s significant role in the context of financial support from EU funds in the process of modernizing farms is evident, given its large share of the 2007–2013 RDP budget.
Most beneficiaries financed investments in machinery and equipment, means of transport, and equipment for ongoing agricultural production with the support received. Second in popularity were investments in the construction and modernization of farm buildings. The least interest was in purchasing computer equipment and investing in perennial plantations [
30].
4. Results of the Study
At the initial stage of the research, the significance of the differences between the variables defined for the study (based on 2010 data) was assessed for all municipalities in each cluster, based on the calculated indicators of the level of agricultural development in Poland. To this end, analysis of variance was performed using the Kruskal–Wallis ANOVA rank test. It revealed that, at baseline in 2010, High–High and Low–High cluster municipalities in the northern part of the country had similar economic conditions. A similar situation occurred with the Low–Low and High–Low cluster municipalities located in the southern part of the country. In most cases, no statistically significant differences were found at the
p < 0.05 significance level between clusters located in the same regions of Poland (
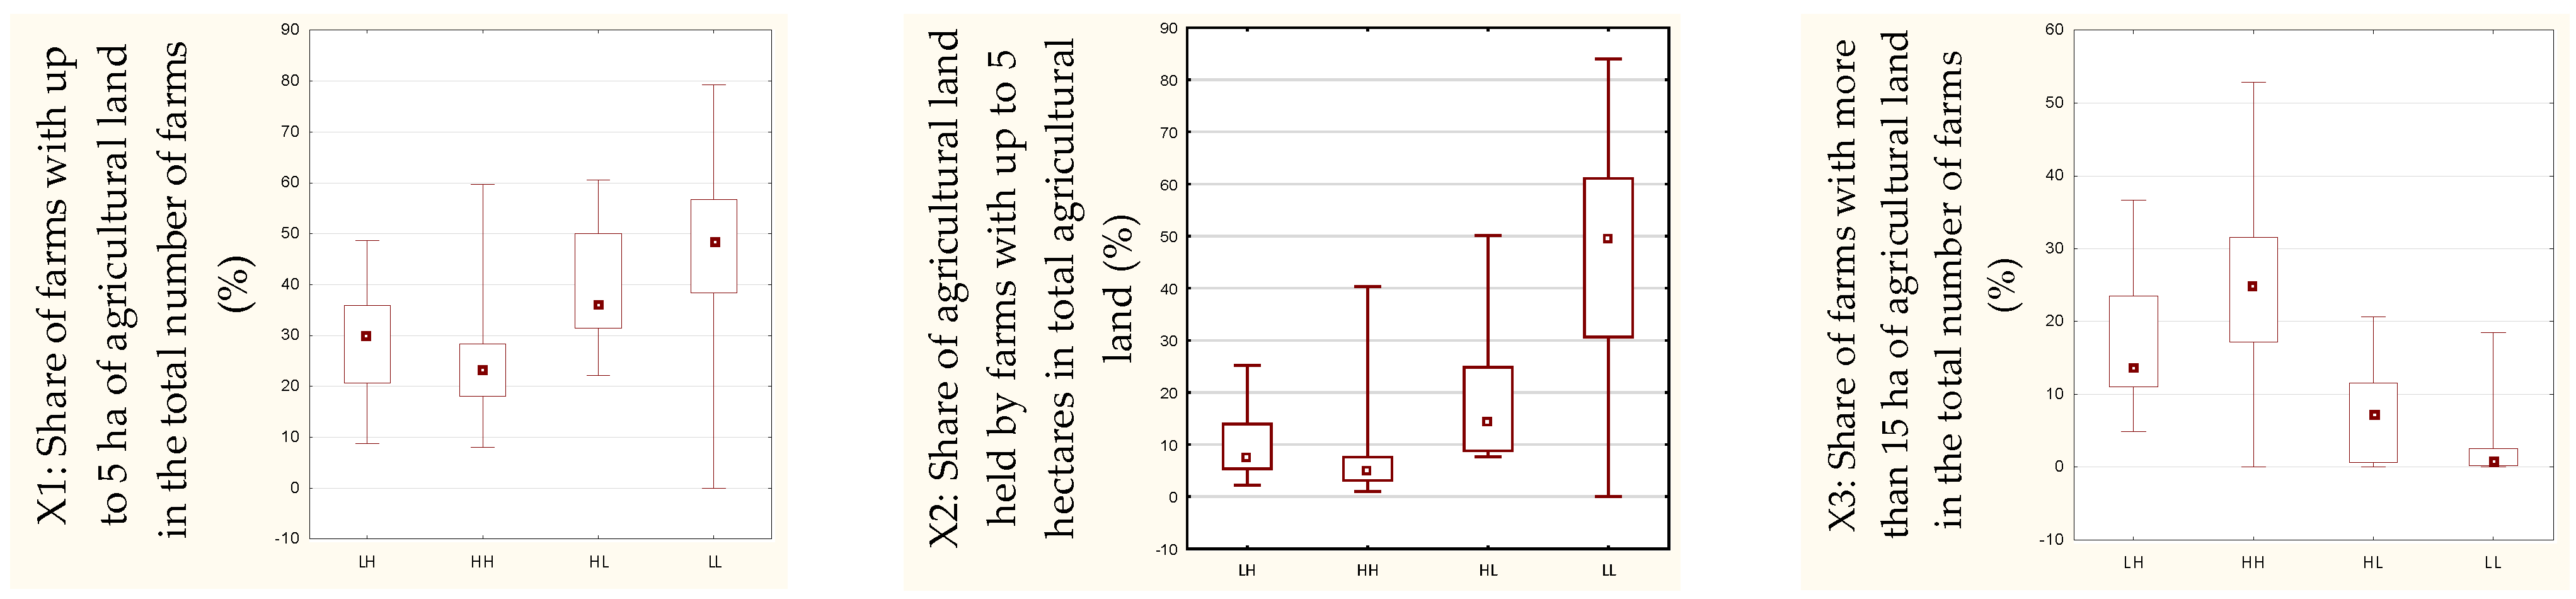
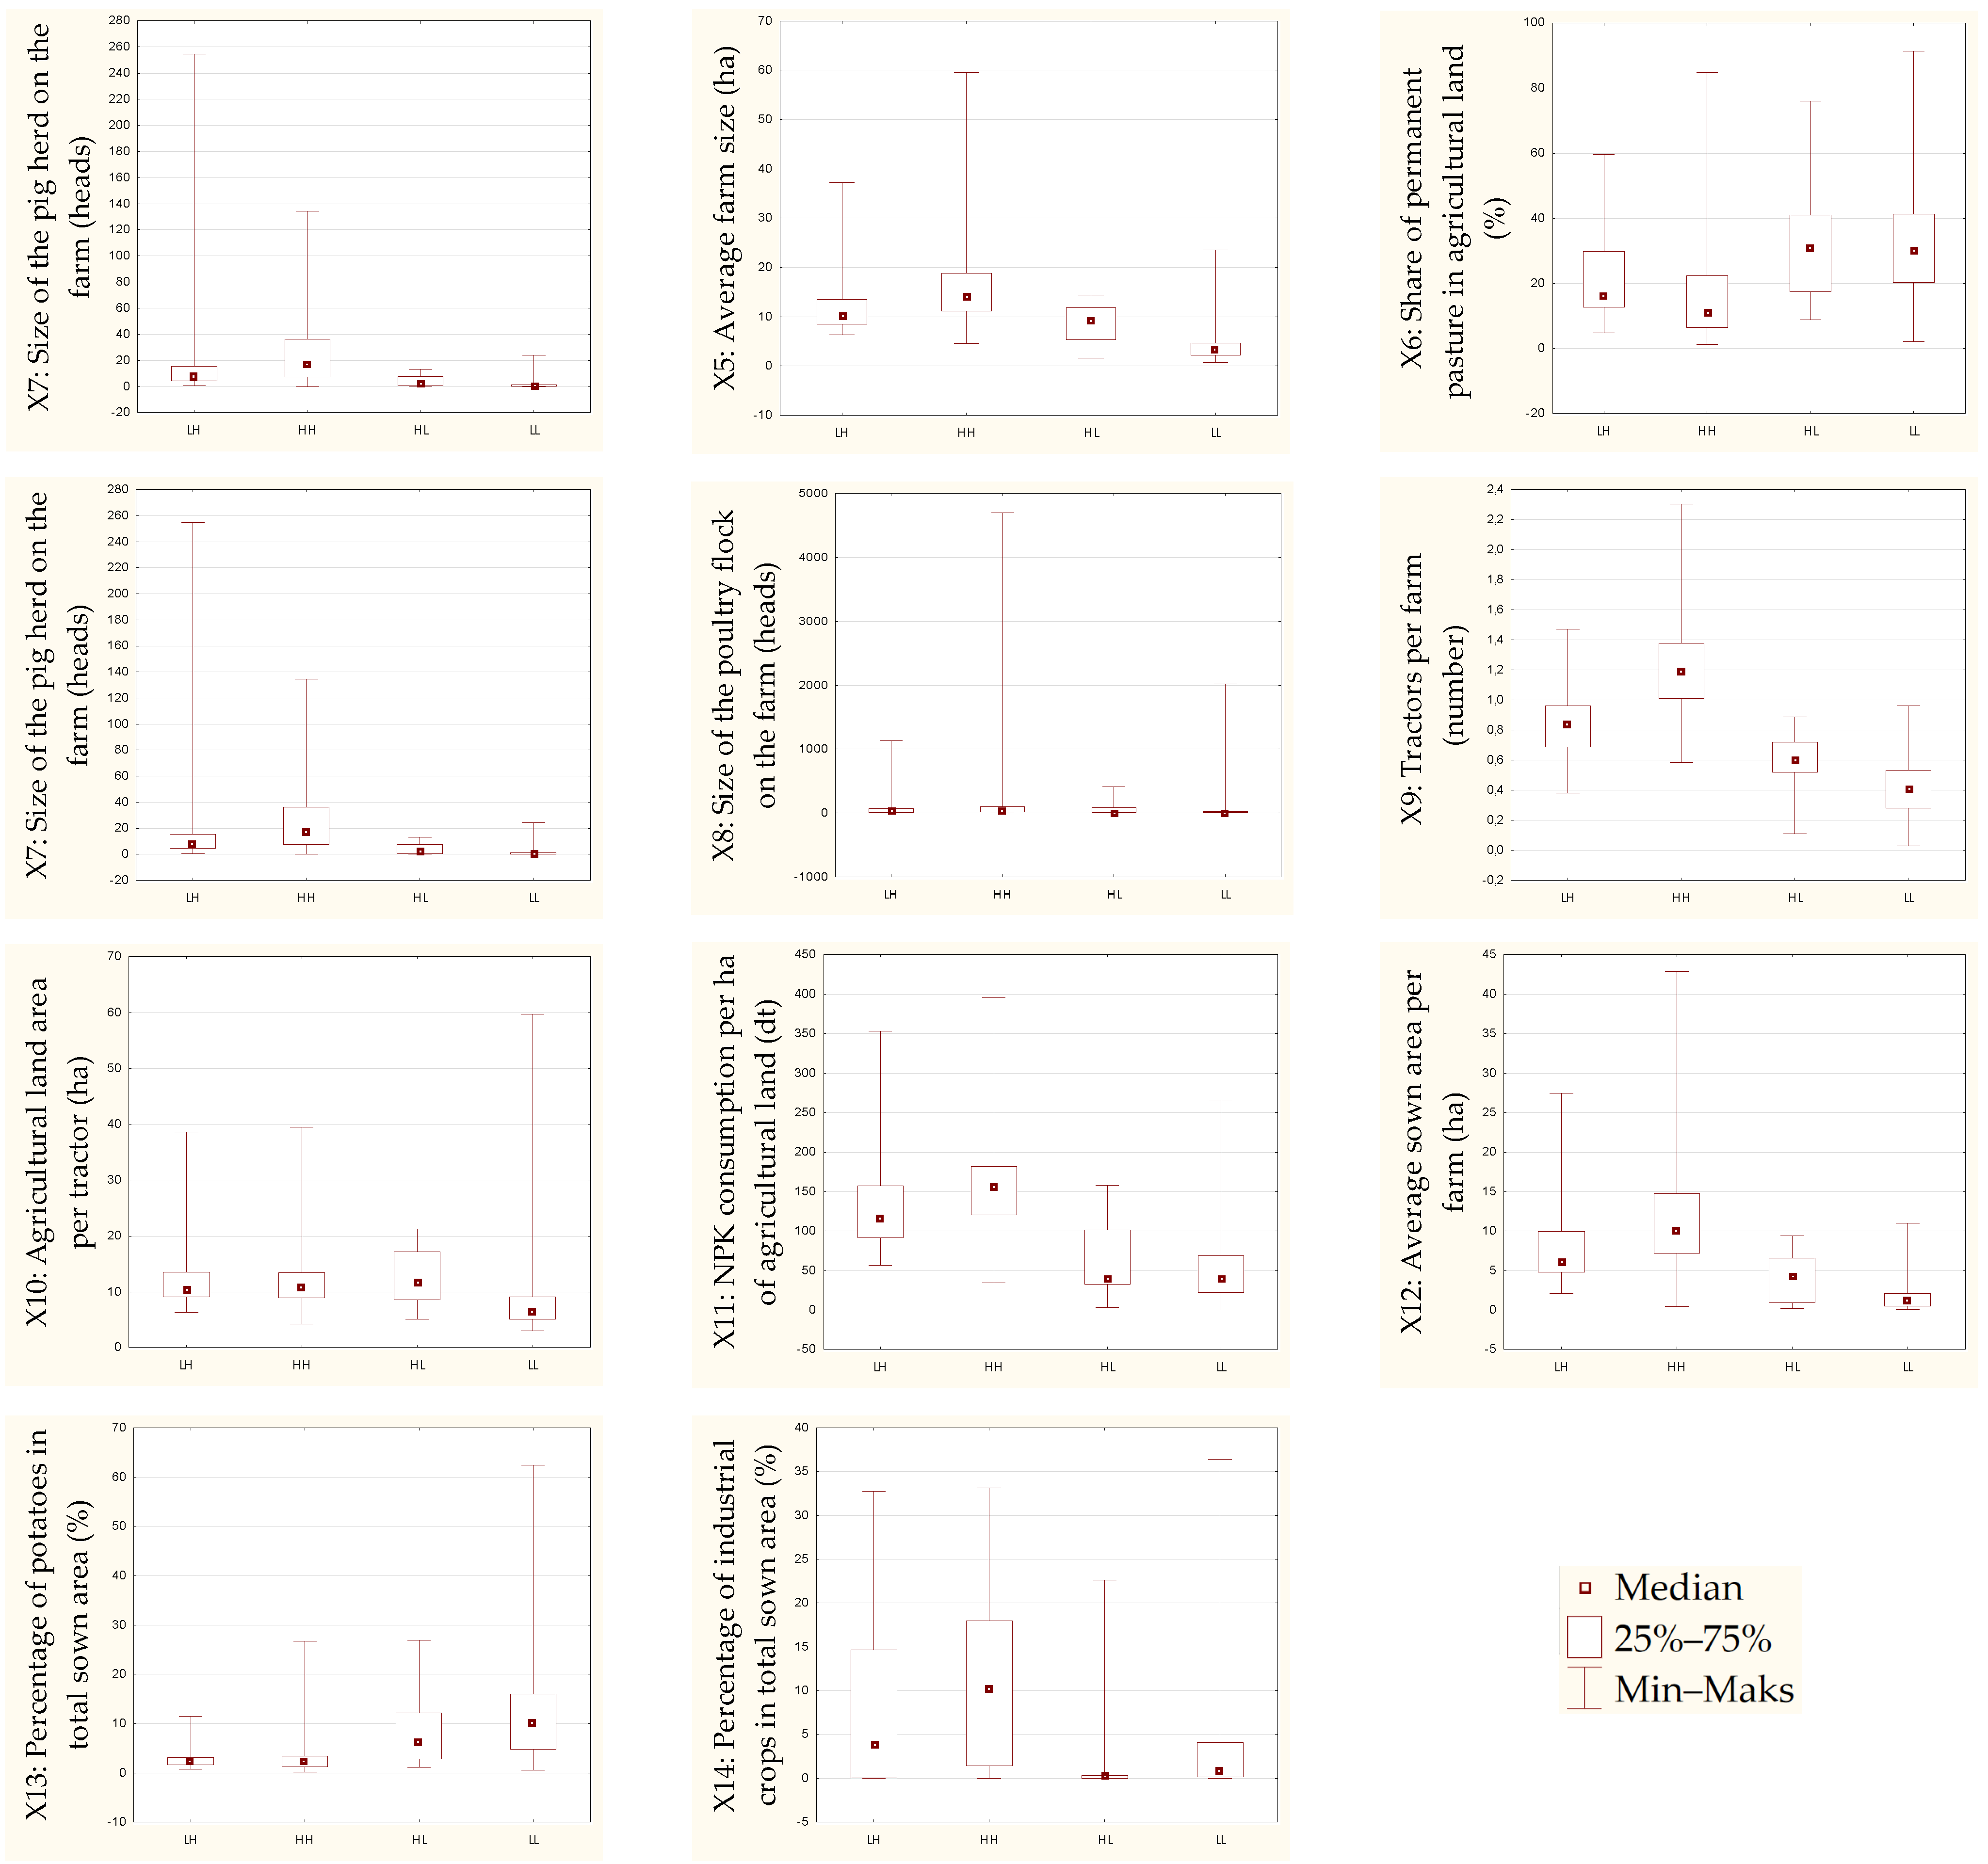
Table 2). However, statistically significant differences in the levels of variables were discovered between northern and southern clusters. The results of the analysis of variance, which showed the similarity of business conditions between the High–High and Low–High and the Low–Low and High–Low areas, formed the basis for further analysis and for constructing a scheme to compare municipalities in clusters. The graphical results demonstrate that the distributions of the majority of the analyzed indexes are similar between the High–High and Low–High areas, and between the Low–Low and High–Low areas (
Figure 4). A simplified comparison scheme is presented in
Figure 5.
However, it is worth pointing out that significant differences were shown in two indicators of the agrarian structure of the municipalities included in southern Poland clusters (Low–Low and High–Low), which demonstrate relatively highly fragmented agriculture. These were the share of agricultural land held by farms up to 5 hectares in total agricultural land (%), and the average farm area (hectares). This finding suggests that as regards the Low–Low cluster, which showed negligible activity in seeking funds under the measure “Modernisation of agricultural holdings,” the reason for this was the applicants’ inability to meet the criterion for minimum farm area.
In the subsequent phase of the study, a comparative analysis was conducted between the municipalities belonging to the High–High cluster and those classified within the Low–High cluster. The distribution of these units was geographically concentrated in the northern part of the country. The fundamental characteristics of agriculture in both clusters, with data collected in 2010 and 2020, are shown in
Table 3. The analysis of the aforementioned data enabled the assessment of changes in the level of agricultural development of municipalities belonging to both clusters during the period under study. Prior to the evaluation of the alterations, it is imperative to acknowledge that both the High–High and Low–High clusters were initially regions characterized by relatively conducive farming conditions. The average area of farms was comparatively elevated, at 12.5 hectares in the Low–High cluster and 15.7 hectares in the High–High cluster, with the Polish average of 10.23 hectares in 2010. The area exhibited a significantly higher level of fertilization, as indicated by the consumption of NPK fertilizers per hectare of farmland, or higher animal production, as demonstrated by the size of the pig or poultry herd on the farm, in comparison to farms located in the southern part of the country (
Table 4).
However, within the framework of the research objective, the primary focus is on the analysis of the variations in the alterations that transpired during the specified period between the compared clusters. The findings revealed that both the High–High cluster, which exhibited the highest frequency of submitting applications for funds from the “Modernisation of agricultural holdings” measure, and the Low–High cluster, where this frequency was minimal, exhibited positive changes in the analyzed indicators. Furthermore, in numerous instances, the direction and rate of change were comparable. Irrespective of the extent to which farms demonstrated a propensity to apply for financial resources, analogous alterations were observed in numerous indicators that underwent analysis. The agrarian structure of farms was undergoing a positive transformation. The proportion of farms with an area exceeding 15 hectares exhibited an analogous growth trajectory (approximately 1.3–1.4%), as did the proportion of farmland area belonging to such farms within the total farmland area (by 1.1% in both clusters). The average farm area exhibited an increase of 4 hectares in the High–High cluster, which demonstrated a higher frequency of applying for funds, and an increase of as much as 5.8 hectares in the Low–High cluster, which exhibited a lower frequency of fund application. Similar positive changes for both clusters are also occurring in terms of the level of livestock production, the equipment of farms with means of production, the level of fertilization, the structure of crops, and the level of development of organic farming.
A thorough examination of the data presented in
Table 3 reveals that the impact of seeking financial resources from the “Modernisation of agricultural holdings” under the 2007–2013 RDP in regions characterized by a relatively advanced agricultural sector is negligible. A modest discrepancy is observed among the clusters that vary in how actively they applied for funds under Measure 121. The development of farms within both clusters, irrespective of the investment support received, exhibits a comparable pattern.
Table 4 presents data on the level of agricultural development in clusters located in the southern part of Poland. The analysis encompassed 421 municipalities (Low–Low cluster) that exhibited a minimal propensity for submitting applications for investment funds under Measure 121, and 13 outlier municipalities (High–Low cluster) where there was a pronounced level of activity in obtaining funds. Initially, i.e., in 2010, the municipalities in question exhibited comparatively lower values for the indicators of agricultural development when compared with other municipalities located in the northern part of the country. According to the analysis, they were experiencing strong farm fragmentation, accompanied by substantially lower fertilization levels and smaller livestock numbers. Conversely, organic farming exhibited a more robust development, characterized by a higher percentage of farms dedicated to organic production and a greater proportion of farmland allocated for organic cultivation.
A comparative analysis of the analyzed clusters reveals discrepancies in the developmental trajectories of agricultural holdings. In the High–Low cluster, where farmers more frequently submitted applications for aid funds under Measure 121, there were observed to be more favorable changes in the values of indicators than in the cluster where the level of application for funds was low (Low–Low). In absolute terms, there was an increase in average farm size of 6.3 hectares in the High–Low cluster between 2010 and 2020, while in the Low–Low cluster it went up by 3.2 hectares. Concurrently, substantial increases were documented for various metrics, including the proportion of farms exceeding 15 hectares in area, the extent of cultivated land per farm, the size of the livestock herd, and the area dedicated to sown crops per farm. However, it is noteworthy that municipalities within the Low–Low cluster also demonstrate positive shifts in indicator values, though their absolute rate of change (actual change) is comparatively lower.
5. Discussion
Today’s agricultural sector continues to be confronted with numerous challenges, necessitating ongoing adaptation to evolving market dynamics. The Common Agricultural Policy, through measures such as “Modernisation of agricultural holdings” implemented under the Rural Development Program, provides significant support to agricultural regions aimed at improving the competitiveness and efficiency of the agricultural sector. Investment, particularly in fixed assets, plays a pivotal role in the process of modernizing agriculture. According to Solow, “investment is at best a necessary condition for growth, surely not a sufficient condition” [
31]. In the context of agricultural holdings, capital endowment, a byproduct of investment decisions, exerts a substantial influence on the level of agricultural production, the farm’s economic performance, the prevailing working conditions, and the standard of living experienced by farmers [
32,
33]. According to Giannakis and Bruggeman, countries with high levels of fixed asset inputs in agriculture are highly likely to be much more productive [
34]. Indeed, technological progress is frequently regarded as a pivotal factor in the development of European agriculture [
35], a process that, according to Kirchweger et al., can only be implemented through investment [
36]. This investment, in turn, fosters the capacity of farms to maintain a competitive edge in the market. Concurrently, the significance of this assistance is accentuated for smaller farms, which, in the absence of EU funds, would be incapable of making investments [
2,
37].
The findings indicated advancements in the realm of agriculture in Poland during the period covered by the analysis. This progress was observed in all regions, including those where demand for funds was relatively low. However, the velocity of these alterations exhibited variability. As demonstrated in this study, the allocation of financial resources towards modernization initiatives has a favorable impact on the rate of transformation, particularly in regions initially characterized by a comparatively underdeveloped agricultural infrastructure. In regions affected by relatively deficient agricultural conditions and a lower level of agricultural development, even modest investments in modernization can result in substantial enhancements in the quality of agricultural equipment, the efficiency of agricultural operations, and even an increase in farmers’ incomes. The modernization of farms in areas facing less favorable agricultural conditions can also engender other advantageous outcomes, including the promotion of land consolidation, the integration of state-of-the-art technologies, and even the mitigation of regional disparities in agricultural development at the national level. In regions where conditions for agricultural production are more favorable (in this case, in the northern part of the country), the implementation of the “Modernisation of agricultural holdings” measure did not yield significant results. In regions characterized by intensive and relatively well-developed agriculture, the marginal benefits of further investment are smaller. This is because these farms are often already equipped with modern technological facilities and enjoy a strong market position.
As posited by numerous scholars, including [
18,
19,
20,
30,
37], the intensity of fund use is significantly lower in areas with a fragmented agricultural structure. This may be attributed to the conditions for program participation, as in these regions, only a small percentage of farms meet the eligibility criteria for support, primarily due to their limited economic scale. This assertion is substantiated by the disparities in the values of the indicators presented in the publication. Specifically, the proportion of agricultural land held by farms with an area of up to 5 hectares in relation to the aggregate agricultural land of all farms, as well as the mean farm size expressed in hectares (within the context of clusters in southern Poland, namely Low–Low and High–Low). In regions where applications for support are more frequent (High–Low), these indicators were already more favorable in 2010.
Research conducted in the Czech Republic [
37] lends further support to this claim. The findings indicate that the repercussions of support, manifested as augmented gross value added or labor productivity, are particularly evident in farms situated within LFA regions and in medium-sized farms. Nevertheless, the authors underscore the persistent issue of low labor productivity in the region. Kirchweger and Kantelhardt [
38] arrived at analogous conclusions, noting that in Austria, the impact of support is less evident among farms with above-average production potential.
Research on the implementation of the “Modernisation of agricultural holdings” measure in Poland and Romania [
39] indicates that the implementation of a larger number of smaller projects ensures more uniform agricultural and rural development and contributes to the development of rural entrepreneurship. The positive effects for regional development are more pronounced when small-scale projects are financed by regional entities, as opposed to large, well-functioning operators.
However, the implementation of the “Modernisation of agricultural holdings” measure, which supports investment projects in rural areas, may have unintended social and environmental consequences, in addition to its anticipated economic benefits [
40]. The implementation of modern technologies and mechanization of agriculture, and thus the intensification of agricultural production (especially in regions with relatively better-developed agriculture), may lead to a reduction in the demand for labor and an increase in rural unemployment. Concurrently, the integration of state-of-the-art agricultural technologies can contribute to environmental degradation, manifesting in a decline in biodiversity and an escalation in greenhouse gas emissions. The nature and magnitude of these effects are contingent on the characteristics of the region concerned [
41] and the nature of agricultural production [
42]. Therefore, it is imperative to adapt modernization measures to regional conditions and implement them in a sustainable manner, taking into account not only economic aspects, but also social and environmental ones.
Since our research aimed to examine changes in the level of agricultural development across geographical areas, the study was based on aggregated data at the municipality level. It should be acknowledged, however, that such aggregation—although intentional—may obscure farm-level dynamics. Moreover, the outcomes presented may also be influenced by ongoing shifts in market conditions.
We are also aware that a critical element warranting further investigation is the expansion of the database upon which the analysis is conducted. Additionally, social and environmental dynamics in the compared regions represent important dimensions that could be explored in future research.
It should also be acknowledged that changes in agriculture are multifaceted, and their genesis does not exclusively stem from the implementation of the EU Common Agricultural Policy. The second pillar of the CAP functions on a voluntary basis. Potential beneficiaries who meet the eligibility criteria may submit applications for support. Consequently, the allocation of financial assistance is contingent upon the submission of such applications [
13]. Farmers’ decisions to apply may be influenced not only by the structural conditions of agriculture, but also by additional factors such as access to advisory services or individual motivation. As demonstrated by Kalinowski [
43], using the example of farmers’ protests in Poland, farmers’ expectations and motivations may be influenced by a variety of additional factors and do not always align with the actual causes of the economic situation.
In general, the decisions regarding investments in agricultural holdings are contingent on numerous factors [
38]. They can be influenced by local and political conditions, as well as personal attitudes, beliefs, and the individual needs of farmers and their families. Rizzo et al. [
44] conducted a comprehensive review of the factors that drive farmers’ behavior in the context of implementing innovations on farms in developed countries (primarily in Europe). Also, the implementation of RDP investment funds frequently entails the introduction of innovative solutions that are not familiar to the farmer. The extant research clearly demonstrates that the factors influencing farmers’ behavior in this regard are primarily psychological [
45,
46] and socio-economic, including the farmer’s age, income, and even education [
45,
47,
48]. Furthermore, specific contextual elements, including farm size and the environmental and political context within which farmers operate, have been demonstrated to influence the outcomes [
49,
50,
51]. Moldovan and Beleiu [
52] further explore the factors influencing investment decisions in agriculture, highlighting increasing returns on investment stemming not from increased income but from cost reductions due to the acquisition of new machinery. The presence of these factors, which are often unobservable and unmeasurable, complicates the achievement of clear findings. Consequently, it would be advantageous to incorporate additional elements into subsequent analyses, including qualitative aspects, which are challenging to obtain from public databases and could be further explored through the lens of behavioral economics.
6. Conclusions
The Rural Development Program is predicated on the primary objective of fostering investment in agricultural holdings, with the overarching ambition of enhancing their productivity. Approximately 14% of the total RDP budget was allocated to the implementation of Measure 121, entitled “Modernisation of agricultural holdings” during the period from 2007 to 2013. From the perspective of politicians, therefore, a critical question is whether the support allocated to farmers actually contributes to the development of individual farms and stimulates specific investments.
The assertion that municipalities exhibiting similar agricultural conditions yet demonstrating a substantially higher propensity for securing financial resources for farm modernization undergo faster development than those where farmers exhibit a lower inclination to seek support could not be unequivocally substantiated. Regional disparities have been observed in this regard within Poland.
In northern Poland, where agricultural conditions are more favorable, agricultural potential is higher, and agricultural structures are more developed, the impact of applying for funds under Measure 121 is negligible. Farms invariably evolve in a similar manner, irrespective of whether they have sought external support. In the region under discussion, there is a significant number of farms that demonstrate above-average production potential, with respect to both the land and the assets they possess. In the context of these agricultural holdings, the impact of support measures is less evident. A comparative analysis reveals that the direction and pace of change are similar among municipalities that applied for funds and those that accessed fewer funds. Research by Michałek et al. [
53] indicated that RDP beneficiaries would have carried out their investments even in the absence of support. This suggests that farmers who apply for funding less frequently may not make investments in their farms contingent on receiving subsidies. If support funds are unavailable, they rely on alternative forms of financing. Additionally, investment support from the RDP does not appear to accelerate their planned future investments.
The findings from this study indicate that the role of support for investment financing is significantly more pronounced in areas characterized by substantial agricultural fragmentation and predominance of small farms. In the southern regions of Poland, where agricultural output was below the national average, the disparities in agricultural development between municipalities that received substantial RDP investment funds and those that received less support were more highlighted. Municipalities that received financial assistance under the “Modernisation of agricultural holdings” measure demonstrated comparable or superior results, particularly in absolute terms. As demonstrated in the research conducted by Babuchowska and Marks-Bielska [
2], EU funds prove to be relatively highly useful in the Lubelskie voivodeship. Smaller farms often make their investments dependent upon the availability of EU funds. Consequently, access to funding has been demonstrated to influence the implementation of modernization investments, which, in turn, results in an increase in agricultural development indicators. In this context, a critical issue for future decision-makers is the appropriate allocation of financial resources within the framework of measures designed to encourage investment in agricultural holdings. These findings offer valuable insights for future EU policy design and highlight areas where targeted interventions could enhance the effectiveness of development programs. They may also be applicable to other EU countries where agricultural modernization remains a key priority. For instance, in Romania, where the demand for investment support significantly exceeds the available budget, the smallest farms are often unable to obtain credit to co-finance investments and are, therefore, to some extent, excluded from accessing such support [
54]. Also, in Slovakia, the impact of investment support on the rural economy in Slovakia appears to be ambiguous [
55].
To sum up, our results suggest that modernization funds should be directed toward regions with lower production potential and more fragmented agricultural structures, where the impact of support is likely to be more pronounced. Furthermore, efforts to encourage farmers to apply, along with the strengthening of advisory services, should be prioritized in regions where program effects are visible but the number of applications remains limited.