1. Introduction
With the in-depth industrialization and informatization of the global economy, large-scale exploitation and consumption of fossil fuels have led to a continuous rise in greenhouse gas emissions, exacerbating risks such as global warming, extreme high temperatures, and glacier melting, and triggering frequent extreme weather events. These have exerted a profound impact on food security, public health, and even geopolitical patterns, and thus the high-carbon energy consumption model is widely regarded as a significant obstacle to achieving sustainable development [
1,
2,
3]. Countries have successively formulated carbon peaking and carbon neutrality roadmaps, seeking to reshape their economic growth patterns while ensuring energy security. As the world’s largest developing country, energy consumer, and carbon emitter [
4,
5], China faces more complex and multiple challenges: due to its natural resource endowment of “rich in coal, poor in oil, and lacking in gas,” it has long formed a coal-dominated energy consumption pattern. As of 2022, coal accounted for 56.2% of primary energy consumption, while the external dependence on crude oil and natural gas reached 71.2% and 40.2%, respectively [
6]. This pattern not only exceeds ecological carrying capacity, leading to environmental pollution and resource waste, but also, against the backdrop of heightened international geopolitical risks, has exacerbated energy security challenges [
7,
8].
To address this, since formally proposing the “energy production and consumption revolution” in 2015, China has successively incorporated the five development concepts of “innovation, coordination, green development, openness, and sharing” into the “14th Five-Year Plan,” clarified the goals of “carbon peaking before 2030 and carbon neutrality before 2060” in 2020, and emphasized “building a new energy system and promoting green and low-carbon transformation” at the 2024 National Energy Work Conference. Through measures such as large-scale bases + large power grids, national carbon emission rights trading, and county-wide promotion of distributed photovoltaics, China has initially formed a pattern of diversified clean energy supply. Data from the National Energy Administration show that from 2013 to 2023, China’s GDP grew by approximately 70%, the proportion of non-fossil energy consumption increased from 9.8% to 17.5%, installed renewable energy capacity exceeded 1.3 billion kilowatts, and fossil energy was replaced by an average of about 700 million tons of standard coal annually, with evident results in low-carbon transformation. This transformation is not only a necessary path for China to achieve the “dual carbon” goals but also a key pathway to addressing energy security challenges, enhancing long-term economic resilience, and promoting sustainable economic development [
9]; it not only contributes to global climate governance but also lays a solid foundation for its own high-quality development.
In recent years, China has vigorously promoted energy structure adjustment and green low-carbon transformation. Since 2016, Zhejiang, Fujian, Henan, and Sichuan provinces have taken the lead in carrying out pilot projects for paid use and trading of energy quotas [
10,
11]. The implementation of this policy has significant strategic significance: as a major global energy producer and consumer, China is under the dual pressure of energy structure transformation and ecological environmental protection and is in urgent need of coordinating the contradiction between resource constraints and economic growth through market-oriented mechanisms. As a key institutional innovation, energy quota trading provides fundamental support for building a clean, low-carbon, safe, and efficient energy system. With the market mechanism at its core, the policy forms a resource allocation model of “total quantity constraint and flexible adjustment” by setting total energy consumption quotas and allowing transactions among market entities, effectively guiding the transformation of energy consumption structure from high-carbon to clean and low-carbon [
12]. In practice, energy quota trading not only improves resource utilization efficiency but also achieves a dynamic balance between promoting short-term economic growth and ensuring long-term sustainable development. In 2021, energy quota trading was linked with carbon emission rights trading, further strengthening the synergistic effect between demand-side management of energy consumption and source reduction of pollutants [
13]. By 2022, the pilot projects had covered key energy-intensive industries such as chemicals, steel, and building materials, with a total trading volume of over 120 million tons of standard coal [
14].
Based on this, this paper focuses on the energy quota trading system and seeks to delve into the following key issues: First, can the energy quota trading system truly and effectively promote the decarbonization of energy consumption to zero in practical scenarios? Second, what is the specific internal mechanism by which the energy quota trading system propels the decarbonization of energy consumption to zero? Third, when juxtaposed with traditional energy management methodologies, in which aspects are the merits of the energy quota trading system manifested? Fourth, in the process of implementing the energy quota trading system across diverse regions, what disparities are there in the policy effects? To answer these questions, this paper has collected the panel data of 30 provinces in China from 2012 to 2022 and employed the difference-in-differences method to delve deep into the analysis of the impact of the energy quota trading system on the decarbonization of energy consumption to zero.
The main innovations of this paper focus on three aspects. First, the innovation in quantitative methods breaks through the limitations of traditional single indicators by subclassifying energy consumption into three categories: high-carbon fossil energy, low-carbon fossil energy, and zero-carbon energy. Additionally, it constructs a zero-carbon energy consumption index using the angle between spatial vectors algorithm to more accurately describe the transformation degree of the energy structure. Second, there is an in-depth analysis of mechanisms that combines the difference-in-differences model with the causal steps method to identify the mediating effect between green technology innovation and energy consumption intensity. Lastly, the extension of regional heterogeneity provides empirical support for “precise policy implementation” through a multidimensional analysis based on industrialization levels, resource endowments, and geographical regions. This approach addresses the shortcomings of existing research that inadequately considers regional differences.
2. Literature Review and Hypothesis Development
2.1. Measurement and Analysis of Influencing Factors for Decarbonization of Energy Consumption
The decarbonization of energy consumption is an important pathway for the global response to climate change. As a result, research on its quantitative assessment and driving mechanisms has always been a focal point in academia. Currently, academic discussions mainly revolve around two dimensions: the innovation of measurement methods and the analysis of influencing factors. However, there is still a gap in research regarding market-oriented environmental policies.
2.1.1. Construction and Evolution of Measurement Methodology System
The quantitative research on energy consumption structure is showing a trend of development from a single dimension to a comprehensive system. Early studies predominantly employed single-indicator methods, commonly using metrics like the share of natural gas consumption and the installed capacity ratio of wind power to reflect the transformation characteristics of the energy consumption structure. Although such methods are straightforward to apply, they struggle to comprehensively capture the complex substitution relationships among various energy types within the energy system [
15]. As research has progressed, composite index methods have gradually become mainstream. Some scholars have developed the “Dual Substitution Index for Energy Structure” to dynamically measure the low-carbon transition process of energy structure [
16]. Additionally, an energy consumption index constructed using an improved weighted multidimensional vector angle algorithm can effectively assess the optimization degree of the energy structure [
17].
2.1.2. Endogenous Dynamics and External Intervention of Influencing Factors
The process of decarbonizing energy consumption is influenced by both internal structural factors and external policy factors. From an internal structural perspective, improving energy self-sufficiency is key to reducing dependence on external high-carbon energy and decreasing the share of coal in final energy consumption [
18]. At the same time, the economies of scale and resource sharing effects generated by industrial agglomeration can significantly enhance energy utilization efficiency, supporting energy conservation and emission reduction [
19]. However, the expansion of energy-intensive industries and the use of outdated production equipment within the traditional industrial structure can severely restrict improvements in energy utilization efficiency, hindering the decarbonization process [
20]. In terms of external policy interventions, differentiated environmental policies have a significant impact on green development. For instance, carbon trading policies enhance energy utilization efficiency through price mechanisms and actively promote the development of renewable energy [
21]. Incorporating green performance into the assessment system of officials can incentivize local governments to strengthen pollution control in enterprises and improve energy utilization efficiency [
22]. It is worth noting that some emission-reduction policies may, driven by short-term economic interests, lead to increased early extraction and consumption of fossil energy, negatively impacting the decarbonization of energy consumption [
23].
2.2. Study on the Economic Effects of Energy Quota Trading Policy
The energy quota trading policy, as a significant measure to promote the market-oriented reform of energy and environmental regulation in China, operates on the core logic of optimizing resource allocation through a dual mechanism of quota constraints and market trading. Current research on the economic effects of this policy has gradually produced certain results, but further exploration is needed regarding its mechanisms of action and regional differences [
14].
2.2.1. Innovation-Driven Effects and Technology Diffusion Mechanisms
Based on the theoretical logic of the “Porter Hypothesis” [
24], energy quota constraints compel enterprises to view technological innovation as a key pathway to overcome development bottlenecks. To reduce energy costs and gain market competitive advantages, enterprises actively increase their research and development investments in energy-saving technologies and energy management systems [
25]. Research shows that enterprises compliant with quota requirements actively introduce advanced energy-efficient equipment and production processes, and promote the diffusion of advanced technologies within the industry through market competition mechanisms [
26,
27].
2.2.2. Dual Transformation of Industrial Structure and Energy Structure
At the industrial structure level, the energy quota trading policy compels energy-intensive industries to either upgrade or exit the market by increasing their energy costs, thereby freeing up space for the development of low-energy, high-value emerging industries [
28]. In pilot provinces such as Sichuan and Zhejiang, this policy has effectively facilitated the green upgrade of traditional industries including chemicals, steel, and liquor. Regarding energy structure adjustments, enterprises proactively increase the proportion of clean energy use to avoid energy quota constraints and reduce energy costs, thereby promoting the decarbonization of the energy structure [
29].
2.3. Development of Research Hypotheses
Integrating the theory of market-oriented environmental regulation with the analytical framework of regional development differences, this paper proposes the following research hypotheses:
2.3.1. Direct Impact of Policies on Decarbonization of Energy Consumption
The energy quota trading policy can directly promote the decarbonization of energy consumption through the dual functions of quota constraint mechanisms and market price mechanisms. On one hand, total quota control imposes a rigid constraint on the consumption of high-carbon energy by enterprises. On the other hand, the energy quota trading market reflects the scarcity of energy through price signals, guiding enterprises to reduce consumption of high-carbon energy sources such as coal and increase the use of zero-carbon energies like wind and solar.
Therefore, the following hypothesis is proposed:
Hypothesis 1. The energy quota trading policy can significantly promote the decarbonization of energy consumption.
2.3.2. Mediating Effects of Green Technological Innovation
According to the “innovation compensation theory”, the pressure of the energy quota trading policy on energy costs compels enterprises to allocate more resources to green technological innovation. To meet quota requirements, enterprises must reduce energy consumption through the research and development of energy-saving technologies and the development of clean energy, while the results of green technological innovation can effectively promote the overall decarbonization of energy consumption.
Therefore, the following hypothesis is proposed:
Hypothesis 2. The energy quota trading policy promotes decarbonization of energy consumption indirectly by fostering green technological innovation.
2.3.3. Mediating Effects of Energy Consumption Intensity
Based on the “energy efficiency improvement theory”, the energy quota trading policy encourages enterprises to focus more on the efficient use of energy through price mechanisms and quota allocation. To maximize benefits within limited quotas, enterprises in pilot provinces actively implement energy-saving measures, improve production processes, and eliminate energy-intensive equipment, thereby reducing the energy consumption intensity per unit of output. A reduction in energy consumption intensity means a decrease in the total demand for high-carbon energy, creating conditions for a larger proportion of low-carbon energy in the energy structure and further promoting the decarbonization of energy consumption.
Therefore, the following hypothesis is proposed:
Hypothesis 3. The energy quota trading policy indirectly promotes decarbonization of energy consumption by reducing energy consumption intensity.
2.3.4. Theoretical Analysis of Regional Heterogeneity
According to regional development theory, the effectiveness of the energy quota trading policy is influenced by local industrial structure, resource endowments, and other factors. In regions with lower levels of industrialization, the industrial structure is relatively simple, allowing for greater adjustment space. Therefore, the policy is more easily able to promote industrial transformation through approaches such as “replacing old industries with new ones”, resulting in more significant policy effects. In regions with higher industrialization, the industrial structure is more rigid, and the costs associated with transition are higher, which may result in delayed policy effects. In resource-rich areas where energy-intensive industries are concentrated, there is significant potential for energy conservation and emission reduction, and the policy can unleash stronger emission-reduction effects in resource development and industrial upgrading. In resource-scarce regions, the industrial structure tends to be lightweight, and the energy consumption intensity is already low, leading to relatively limited marginal effects of the policy. Additionally, due to the strong synergy of industrial chains in the Yangtze River Economic Belt, the policy can create economies of scale through cross-regional quota trading and energy cooperation.
In summary of the above analysis, the following is proposed:
Hypothesis 4. The implementation of the energy quota trading policy is more pronounced in regions with lower industrialization levels, abundant resources, the Yangtze River Economic Belt, and central and western regions.
3. Research Design
3.1. Research Materials
This study, based on balanced panel data from 30 provinces in China (excluding Hong Kong, Macao, Taiwan, and Tibet) over the period 2012–2022, focuses on the impact mechanism of the energy quota trading policy on the decarbonization of energy consumption, aiming to empirically examine the actual effects of the policy pilot launched in 2017 on the decarbonization transition of energy consumption across various regions. Sample division strictly follows the pilot list published by the National Development and Reform Commission of China, with the treatment group consisting of four provinces—Zhejiang, Fujian, Henan, and Sichuan—that launched the pilot in 2016, and the remaining 26 provinces serving as the control group, and the policy net effect is identified through a difference-in-differences framework. Data sources balance authority and comprehensiveness: core economic indicators are from the National Bureau of Statistics; environmental and energy-related data are obtained from the China National Regional Data System (CNRDS); supplementary variables refer to the Chinese Securities Market and Accounting Research (CSMAR) database and the China City Statistical Yearbook, with multiple data sources cross-validated to ensure information reliability. The variable system is constructed in accordance with theoretical logic and quantitative scientific principles: the dependent variable is the carbon neutralization index of energy consumption (
lnlces), which integrates the consumption proportions of high-carbon fossil energy, low-carbon fossil energy, and zero-carbon energy through a spatial vector angle algorithm, more accurately depicting the depth of energy structure transformation compared to traditional single indicators; the core explanatory variable is the policy dummy variable (did), set through the interaction term of “treatment group × policy time,” with the policy time starting in 2017; mechanism variables include energy consumption intensity (es) and green technology innovation (lnpat), where the former is measured as “energy consumption/GDP” and the latter uses the number of green invention patent applications in each province; control variables cover eight categories of indicators such as tax burden (tax) and government intervention intensity (gov) to exclude the interference of regional heterogeneity and macroeconomic fluctuations. The specific construction methods, units of measurement, and descriptive statistics of each variable are detailed in
Table 1.
3.2. Research Method
Given the limitations of traditional causal inference methods, this study employs the difference-in-differences (did) method for policy evaluation. Compared to synthetic control models, which are subject to subjective data selection influences, and regression discontinuity designs, which can only estimate local effects, the did method effectively controls for unobserved time-invariant bias by comparing the changes between treatment and control groups before and after policy implementation, while also being more accommodating in terms of data precision.
The analysis was conducted using Stata 17.0 software. First, an event study approach was utilized to verify the parallel trends assumption, ensuring that there are no significant differences in trends between the two groups prior to policy implementation. Next, a baseline model was constructed, controlling for province and year fixed effects. To address endogeneity issues, lagged values of the core variables were introduced as instrumental variables, which are verified for validity through the Kleibergen–Paap test. Finally, the robustness of the conclusions was strengthened through a placebo test involving 1000 pseudo-treatment group resamples, as well as heterogeneity analysis across dimensions such as industrialization level and resource endowment.
This method follows a logical chain of “policy shock-mechanism transmission-effect manifestation,” providing rigorous causal inference evidence for the innovation incentive effects of energy quota policies.
3.3. Formulation of the Model
To examine the impact of the energy quota policy on the transition of energy consumption towards zero-carbonation, this paper establishes the following benchmark regression model and mechanism model:
Among them,
and
represent the province and the year, respectively. The explained variable
represents the decarbonization of energy consumption.
is a dummy variable for provinces in the pilot areas.
is a dummy variable for the occurrence time of the pilot policy.
is the control variable.
and
are the provincial fixed effects and the yearly fixed effects respectively, and
is the random error term.
denotes the mechanism variables. (1) is the benchmark regression model [
30]. (1) and (2) are the mechanism verification models [
30,
31,
32].
Here, denotes the mechanism variables, specifically the number of green invention patent applications and the ratio of energy consumption to GDP. If both β and in Equations (1) and (2) are significant, it indicates that the energy quota trading system promotes energy decarbonization by influencing these mechanism variables.
3.4. Variable Explanation
The following is an introduction to the explained variable.
The decarbonization of energy consumption () is a pivotal criterion for measuring the transformation process of the regional energy system towards the zero-carbon target. In this paper, the decarbonization energy consumption index(lces) is used as a quantitative indicator. Higher values indicate better performance in areas such as the application of low-carbon technologies and the decarbonization of consumption. Therefore, a larger value of represents stronger decarbonization of regional energy consumption; conversely, lower values correspond to a weaker degree of energy consumption decarbonization. This variable is positively correlated with the expected energy quota. Unlike traditional measurement models that focus solely on the proportion of renewable energy or carbon intensity, this study employs a spatial vector angle algorithm to accurately calculate the decarbonization energy consumption index. The specific calculation method is as follows:
First, the consumed energy is divided into three categories: high-carbon fossil energy, low-carbon fossil energy [
33], and zero-carbon energy [
34]. The consumption share of each energy type in year (t) is utilized as an element of a spatial vector, thereby creating a series of three-dimensional vectors.
where
represent the consumption shares of high-carbon fossil energy, low-carbon fossil energy, and zero-carbon energy in year t, respectively. The reference vector is defined as follows:
The formula for the angle between vectors:
Among them,
,
, then, the expanded angle formula for each type of energy is:
In year t, based on the computed angle
intervening between the energy consumption vector
and the benchmark vector
the weight vector
is brought in, where
is the weight of the angle of the j-th benchmark vector, and which complies with
. By weighted summation of all the vector angles, the decarbonization energy consumption index
is established. The specific formula is as follows:
Among them,
specifically represents the angle vector in year t. This index comprehensively considers the effects of the angles of different benchmark vectors [
35]. By allocating weights, it highlights the importance of the reference benchmarks of each energy structure, thus more precisely quantifying the degree of decarbonization energy consumption in region
in year
.
Next, we will introduce the core explanatory variable. The dummy variable did (), which is related to the energy quota trading policy, serves as the core explanatory variable in this paper. Among these variables, serves as a group dummy variable. This variable is assigned a value of 1 if an energy quota pilot has been established in the region; conversely, it is assigned a value of 0 if no such pilot exists. Meanwhile, functions as a time dummy variable. Among them, is a group dummy variable. The policy was released in 2016, and since the data collected are annual data, 2017 is chosen as the starting year for the policy.
Then, let us move on to the mechanism variable. The energy consumption intensity (es) is a significantly important indicator for measuring the energy utilization efficiency of a country. It refers to the energy consumption amount per unit of economic output. Energy consumption is measured in “10,000 tons of standard coal equivalent (tce)”, economic output in “100 million yuan (RMB)”, and energy intensity is expressed as the ratio of “10,000 tce per 100 million yuan”. The smaller the value, the lower the intensity, the higher the energy efficiency. The variable is negatively correlated with the expected energy quota. Now, the formula for calculating the energy consumption intensity is presented as follows, where energy represents the energy consumption amount.
represents the energy intensity of province
in year
.
Green technology innovation (
). In this paper, the data on green technology innovation employ the number of green patent invention applications in each province. Measuring green technology innovation by the number of green patent invention applications in each province can effectively capture the innovation activity, with a much smaller lag compared to the authorization data [
14,
21]. Moreover, by relying on the international classification standards and the authoritative data from the National Intellectual Property Administration, this measurement approach significantly has cross-regional comparability and policy application value. As the value of this data increases, it indicates a stronger capability for green technological innovation. This variable is negatively correlated with the expected energy quota.
Next, we introduce the instrumental variable, where the explanatory variable lags three periods [
36,
37]. In terms of exogeneity, the three-period lagged data, determined by the early economic system state of the explanatory variable, has no direct association with the error term of the current model, effectively avoiding the interference of reverse causality and unobserved confounding factors in the same period. From the perspective of relevance, economic theories suggest that most macro or micro economic variables exhibit dynamic persistence, and the three-period lagged value of the explanatory variable can form a significant correlation with its current value through an autoregressive mechanism. Additionally, considering the time scale of the research question, the three-year lag span reasonably matches the policy transmission cycle or the adjustment lag of economic variables, while avoiding the erosion of the instrument variable’s exogeneity by short-term fluctuations.
In summary, the selection of these variables aims to eliminate other potential factors that may influence the decarbonization process of energy consumption, thereby allowing for a more accurate assessment of the actual effects of the energy quota trading policy [
38,
39].
4. Empirical Results and Analysis
4.1. Descriptive Statistics
Table 2 reports the summary statistics. In the sample, the average value of the tax burden (tax) is 0.083, indicating that the overall tax burden on enterprises is relatively low. The average value of government intervention intensity (gov) is 0.259, suggesting that the degree of government intervention in most regions is moderate. The average value of industrialization level (ind) is 0.328, showing that the industrialization degree of the sample regions is average. The average value of the opening-up level (open) is 0.265, reflecting that the overall opening-up level of enterprises is not high. The average value of industrial structure (ris) is 1.384, indicating that there are certain differences in industrial structures across regions. The average value of informatization level (infor) is 0.061, indicating a low level of informatization development. The average value of economic development level (lnpgdp) is 9.300, showing that there are certain differences in the economic development levels of the sample regions. Overall, the sample shows a certain degree of diversity in various indicators.
4.2. Calculation Results of the Decarbonization Level of Energy Consumption
Based on the derivation in Equations (2)–(4),
Figure 1 shows the distinctly observable changing trends of the average values of the decarbonization of energy consumption in the whole country and major regions. The level of decarbonization of energy consumption in different regions of China presents a pattern of “Western > Eastern > Central”, which is an interesting finding worthy of further analysis. To better demonstrate the extent of decarbonization in energy consumption, we selected four specific years for data analysis: 2012 and 2022 as the starting and ending years, respectively, and 2016 as the implementation year of the energy quota trading policy. To maintain appropriate intervals between the years, we also included 2020. As shown in
Figure 1, the changes in these four years indicate a noticeable deepening of the decarbonization extent in energy consumption year by year, with the core driver being the implementation and deepening of the energy quota trading policy: through the construction of market mechanisms such as carbon trading platforms, which allow regions to trade energy quotas, and the combination of guiding measures such as preferential policies for low-carbon projects, the policy has activated the enthusiasm of each province to promote the decarbonization of energy consumption; under the constraints of quotas and cost incentives, all regions have increased investment in green technology innovation, accelerated the adjustment of energy structure, and the proportion of high-carbon energy use has continued to decrease, promoting a step-by-step improvement in the level of decarbonization.
4.3. Estimated Regression
This study performs a regression analysis following the specifications outlined in Equation (1). The regression outcomes related to the decarbonization of energy consumption are summarized in
Table 3. Column (1) includes only fixed effects for provinces and years, while columns (2) to (8) progressively introduce various control variables while maintaining fixed effects for provinces and years. The results reveal that after adding the control variables, the estimated coefficients for the energy quota trading policy variable (did) in columns (2) to (8) remain significantly positive, indicating the necessity of controlling for relevant variables. Specifically, the energy quota trading policy increases the degree of decarbonization in energy consumption by 6.24%, passing the 5% significance level test. This conclusion aligns with Hypothesis 1, which indicates that the energy quota trading policy has a substantial positive effect on promoting the decarbonization of energy consumption through the establishment of market mechanisms and quota constraints. This is because the market mechanism endows energy quotas with tradable attributes through carriers such as carbon trading platforms, and price signals will guide regions and enterprises to actively reduce the use of high-carbon energy—exceeding the quota requires purchasing quotas, which will increase costs, while the saved quotas can be sold for profit, and this profit-driven mechanism urges them to switch to low-carbon energy; at the same time, quota constraints form a rigid limit on the total consumption of high-carbon energy, forcing all regions to increase green technology innovation, adjust energy structures, and reduce dependence on high-carbon energy. The two jointly promote the decarbonization process of energy consumption.
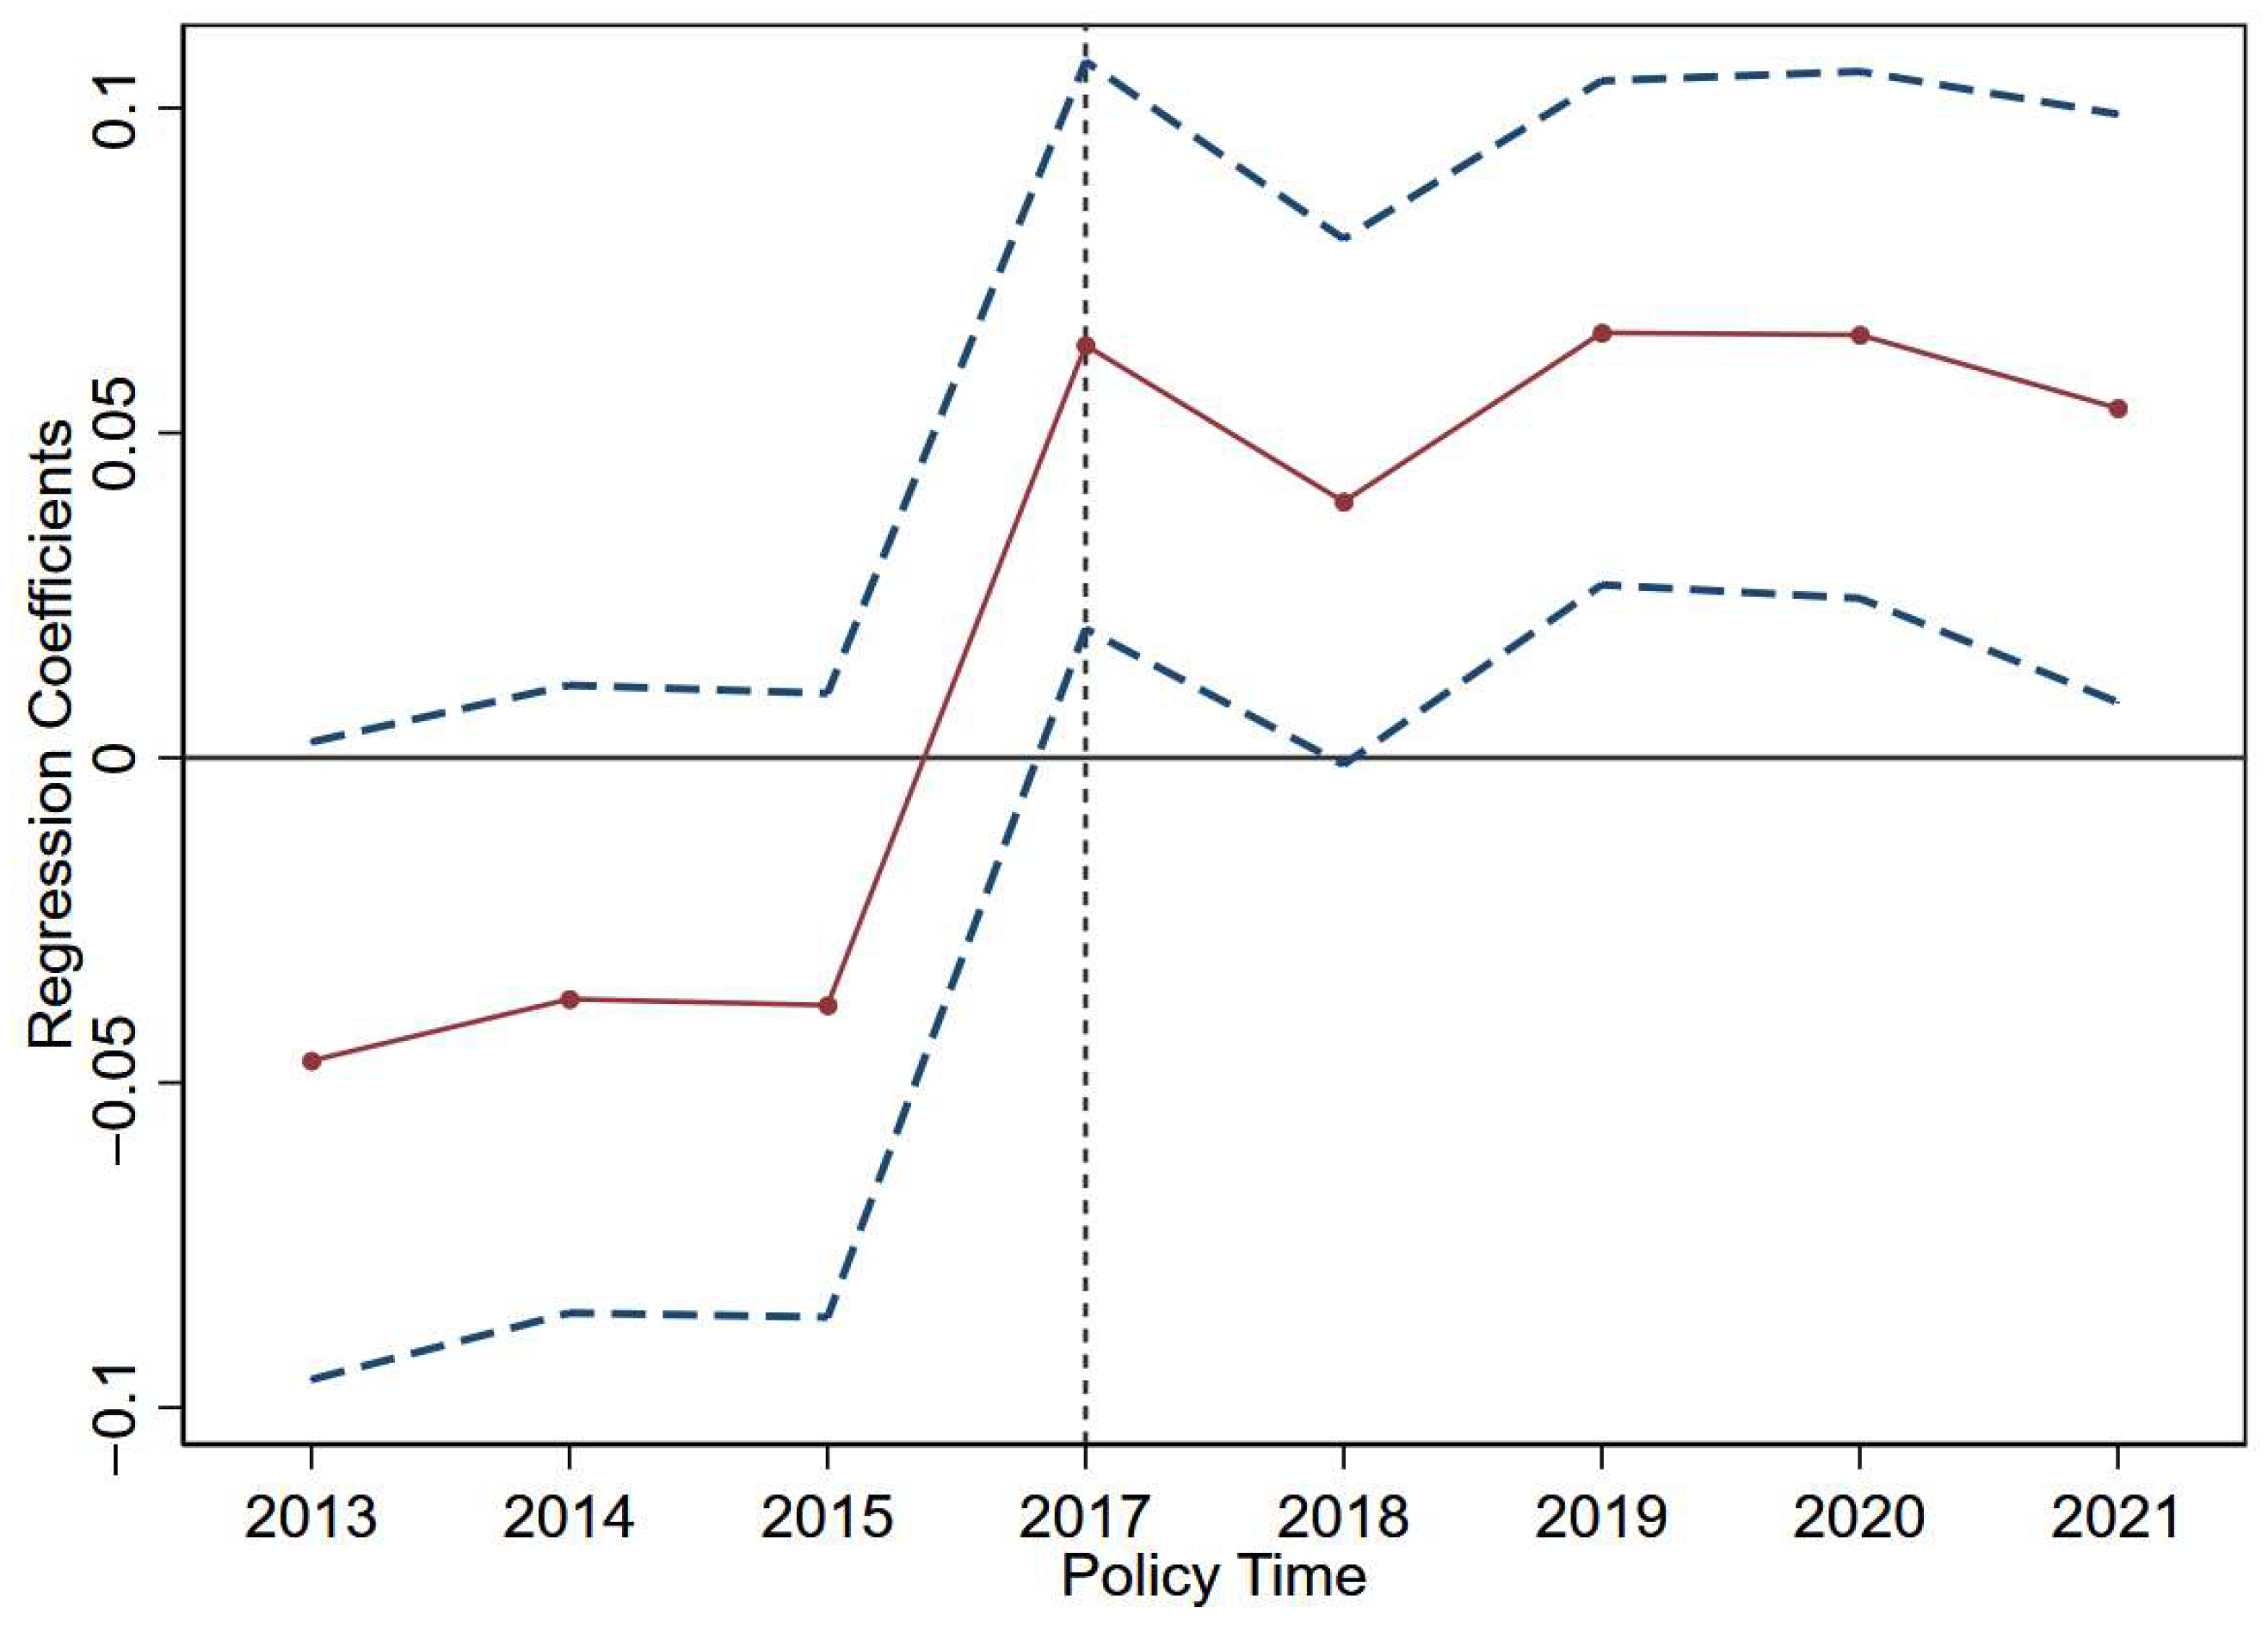
4.4. Parallel Trends Test
Based on the event study method [
40,
41], the parallel trend characteristics of the treatment group and the control group are assessed using the following model:
In Model (11),
refers to the difference in decarbonization of energy consumption between the treatment group and the control group compared to the baseline period, where m represents the number of periods since the implementation of the energy quota trading policy
. To exclude the interference of policy expectations or other temporary factors, the period prior to the policy implementation is removed. If
is not significantly different from zero compared to the baseline sample before the policy shock, the parallel trend assumption is satisfied.
Figure 2 illustrates the variations in the estimated coefficients of decarbonization of energy consumption within the 95% confidence interval. The blue dashed line represents the confidence interval, while the red solid line represents the estimated coefficients. It is found that, compared to the reference baseline, there is no statistically significant difference in the decarbonization of energy consumption between the treatment group and the control group prior to the implementation of the energy quota trading policy. This observation supports the parallel trends assumption.
4.5. Robustness Test
This study systematically verified the reliability of the core conclusions through a variety of robustness test methods. Firstly, the placebo test was used to exclude the interference of other irrelevant factors on the baseline regression results, ensuring the independence of the policy effect. The endogeneity test was employed to mitigate the impact of potential endogeneity issues on the estimation results. Meanwhile, the test of excluding municipalities directly under the central government further verified the stability of the conclusions under different sample compositions. In addition, the mechanism test revealed the specific path through which the policy plays its role, and the heterogeneity test clarified the differences in policy effects under different contexts, both providing supplementary evidence for the core conclusions.
It should be noted that this study has not adopted the propensity score matching method for testing, which is a limitation of the research. Future studies may consider introducing the propensity score matching method (refer to the classic research on propensity score matching methods by Gustavo de Andrade Melo et al. [
42]) to further control sample selection bias, assess the policy effect more accurately, and thus provide more comprehensive support for the robustness of the research conclusions.
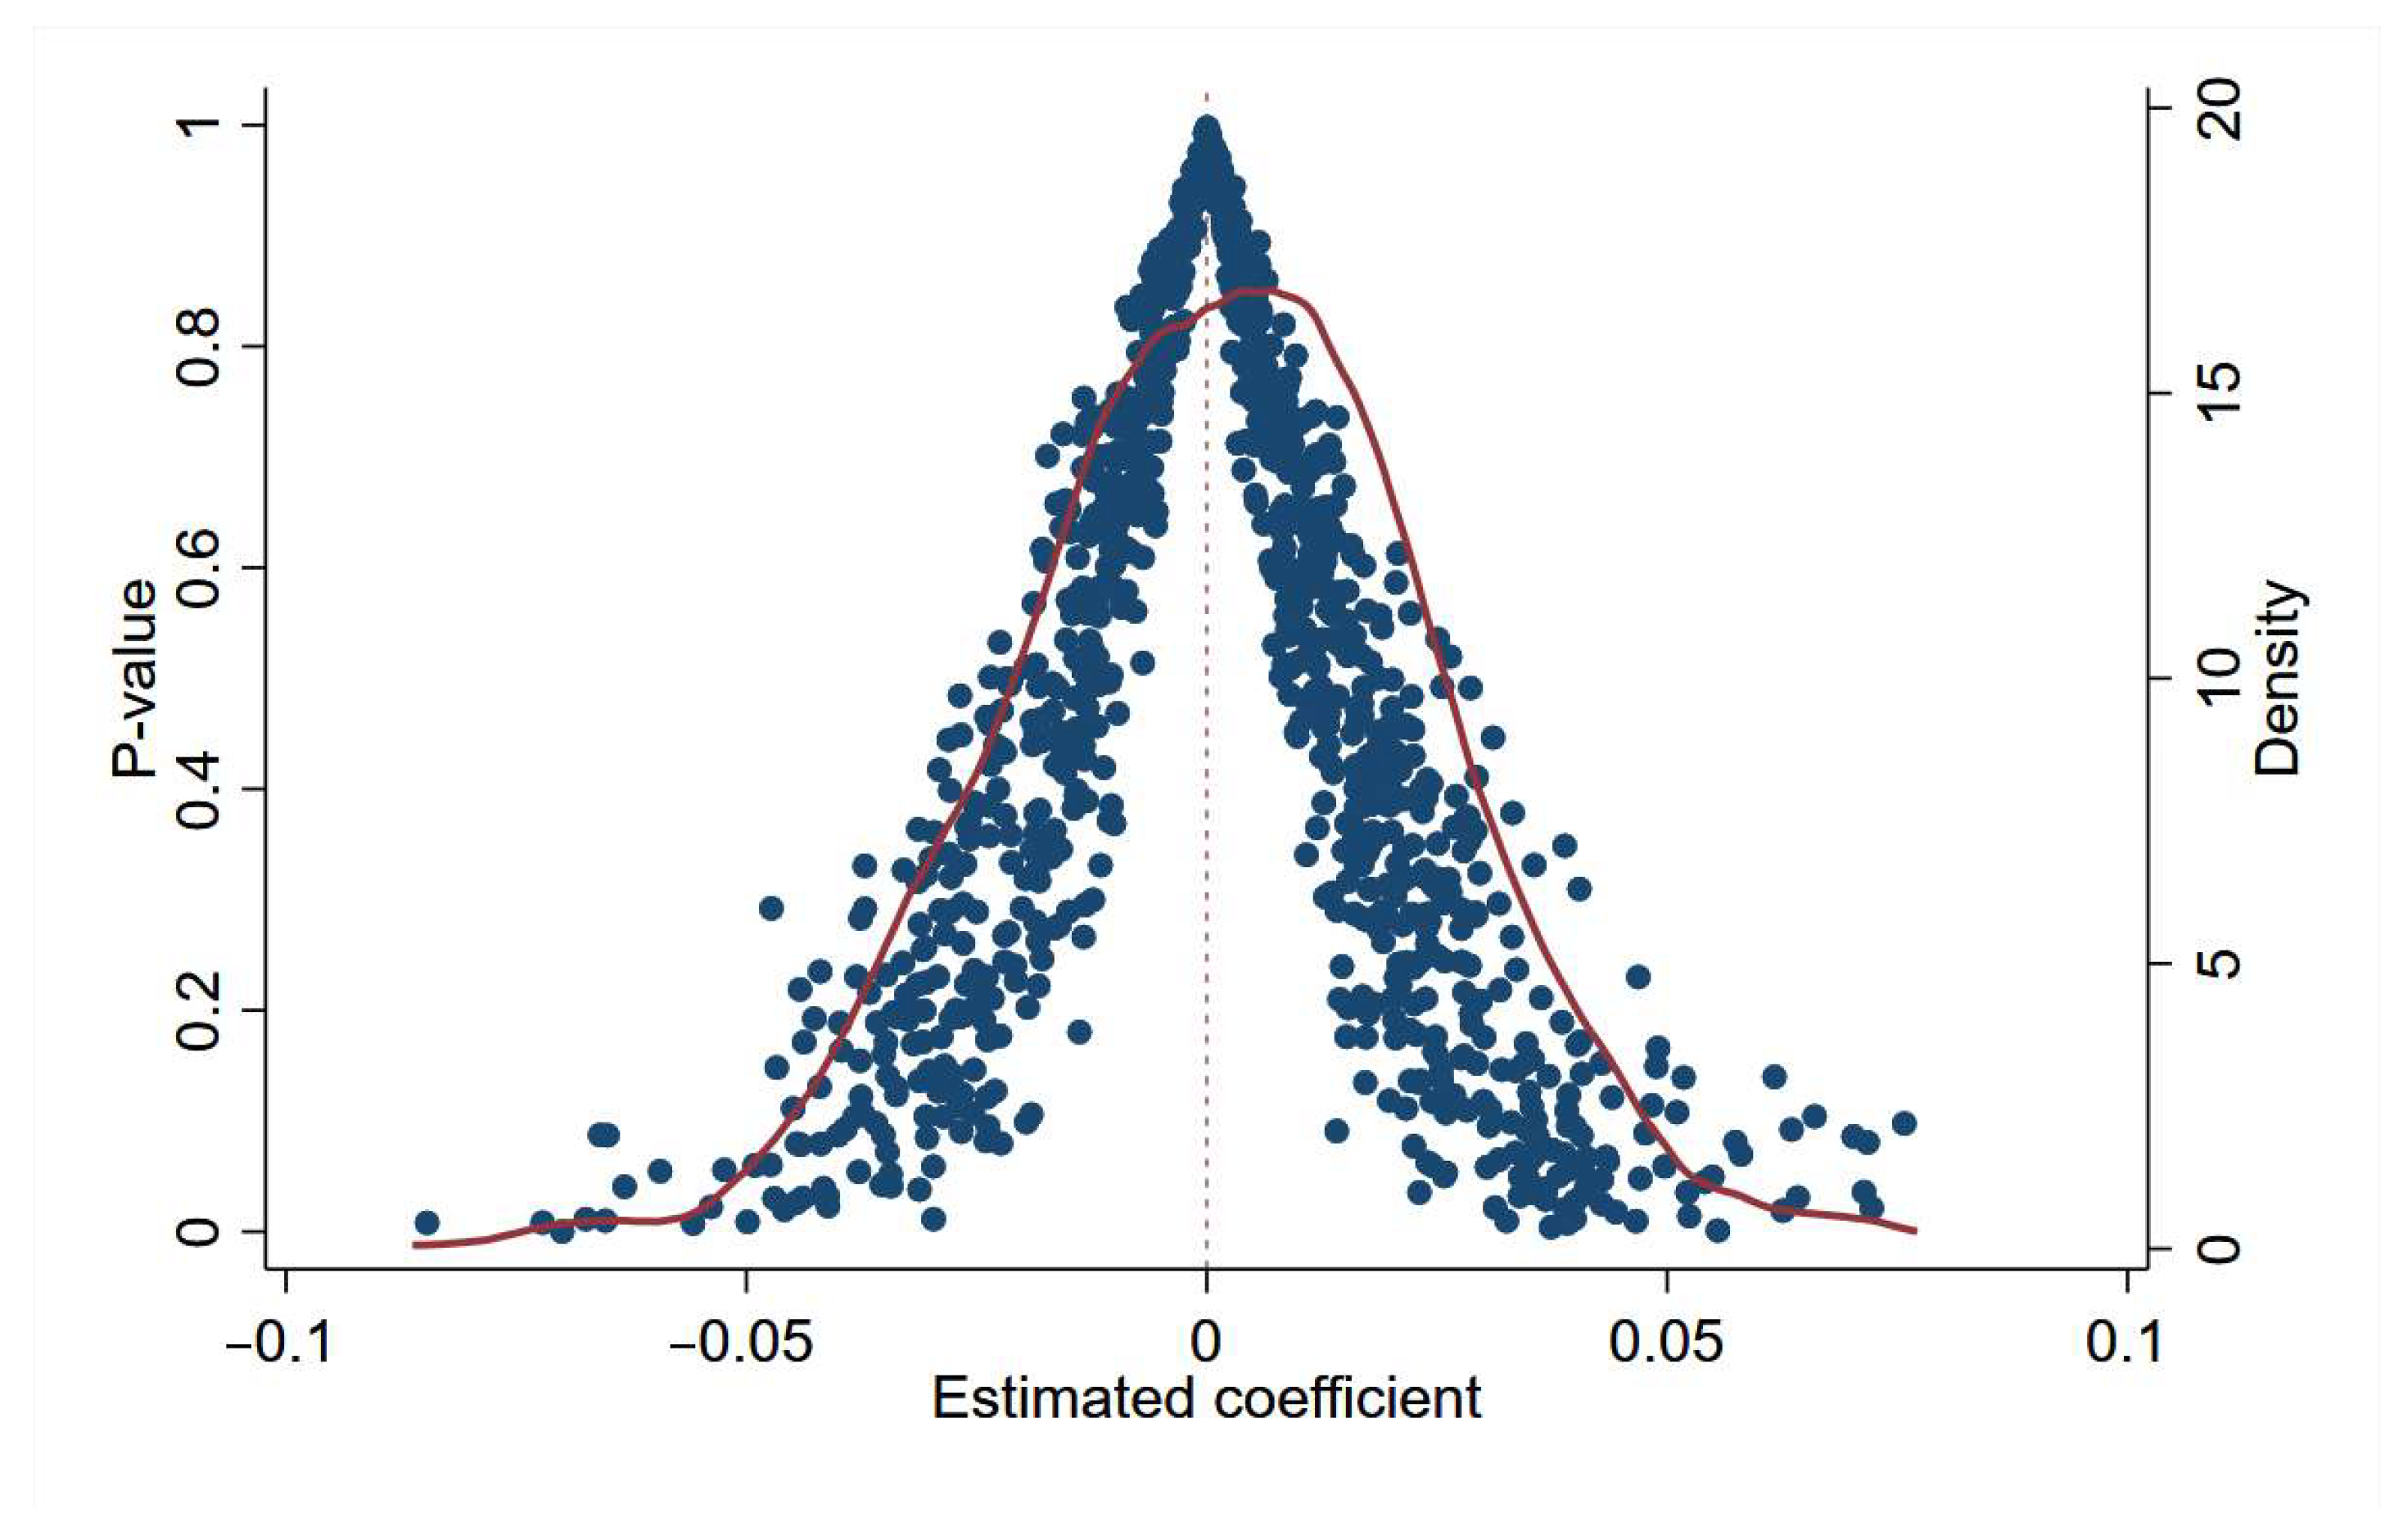
4.5.1. Placebo Test: An Approach to Further Assess the Reliability of the Results
Building on the successful completion of the parallel trend test, this study further employed placebo tests (
Figure 3) to examine the specific extent to which the baseline regression results are influenced by other irrelevant factors. In the research process, drawing on the methodological approach of Eggers et al., a treatment group was first randomly generated based on the sample distribution characteristics of the energy quota trading policy variable, and then 1000 regression analyses were repeated on this basis. To conduct the placebo test, the study proceeded with relevant analyses by plotting the kernel density curve of the estimated regression coefficients.
Figure 3 in this study presents the kernel density curve of the coefficients of the “pseudo” energy quota trading policy variable, where the abscissa represents the estimated coefficients, the left ordinate denotes
p-values, and the right ordinate stands for kernel density. From the test results, the kernel density plot shows a high degree of overlap with the normal distribution with a mean of zero. Moreover, the baseline regression results lie outside the critical value threshold of the kernel density curve and exhibit significant differences compared with the estimated coefficients obtained from the pseudo-energy quota trading policy variable. This situation further strongly supports the robustness of the main conclusions, indicating that the policy effects reflected in the baseline regression results are not accidentally caused by random factors or other interfering factors but have reliable empirical basis.
4.5.2. Endogeneity—Two-Stage Least Squares Method: Addressing Endogeneity Issues
Columns (1) and (2) of
Table 4 clearly present the detailed outcomes of the endogeneity test conducted by using the precise the Two-Stage Least Squares (2SLS) method with the specifically selected variables lagged by three periods as instrumental variables [
10]. In the application of the instrumental variable model, we employed the Kleibergen–Paap rk Lagrange Multiplier Statistic (KPrkLM statistic) to test for weak instrument problems. This statistic, proposed by Kleibergen and Paap [
43], is primarily used for over-identification tests or under-identification tests and is especially suitable for models based on a Two-Stage Least Squares (2SLS) estimation. Through this test, we can assess whether the correlation between the instrumental variable and the endogenous explanatory variable is sufficient to support model identification, thereby ensuring the validity of parameter estimation and the reliability of hypothesis testing. The Kleibergen–Paap rk Wald F statistic (KPWaldrkF statistic) is an important statistic used to test for weak instrument issues when conducting regression analysis with instrumental variables. In instrumental variable regression, if the correlation between the instrumental variable and the endogenous explanatory variable is too weak, it can lead to biased and unreliable estimates, which is known as the weak instrument problem. The KPWaldrkF statistic helps determine whether such problems exist with the instrumental variables.
In the first-stage regression, the regression result of the instrumental variable (IV) on the core explanatory variable did exhibits a significant positive value. This indicates that there exists a substantial and robust correlation between the instrumental variable and the core explanatory variable did. Meanwhile, the value of the KPrkLM statistic in the first-stage regression is 178.6000, and the value of the KPWaldrkF statistic is 171.9000. Both of these statistical values exhibit significance, further indicating that the chosen instrumental variable is reasonable and effective, and it has passed the weak instrumental variable test [
44].
In the second-stage regression, the regression result of the variable "did" on the explained variable shows a significant positive outcome. This implies that after controlling for the endogeneity problem, the energy quota trading policy exerts a pronounced and substantial positive influence on the decarbonization of energy consumption. This suggests that the energy quota trading policy can considerably enhance key metrics, including energy utilization efficiency. Moreover, the model incorporates the control of other relevant variables, and both individual fixed effects and time fixed effects are taken into account simultaneously. The overall results indicate that using the variables lagged by three periods as instrumental variables for the Two-Stage Least Squares regression effectively solves the potential endogeneity problem in the model, and the estimated results show that the energy quota trading policy exerts a notable and positive influence on the outcome variables of interest in this study.
4.5.3. Excluding Municipalities Directly Under the Central Government: A Robustness Test Approach
Column (1) of
Table 5 presents the robustness check results after excluding the municipalities directly under the central government. This examination controlled for the same set of control variables while fixing the provinces and years. The coefficient associated with the energy quota trading policy is 0.0587, which demonstrates statistical significance at the 10% level. Compared to the coefficient from the baseline regression, this value has decreased, indicating that, in the context of the energy quota trading policy, excluding the municipalities results in a larger impact on the decarbonization transition of energy consumption than the full sample; however, it still shows a significant positive influence, thereby confirming the robustness of the main regression conclusions. This means that even when excluding the special sample of municipalities directly under the central government, the policy’s role in promoting the decarbonization of energy consumption still exists, indicating that the conclusion is not dominated by the special circumstances of municipalities directly under the central government; at the same time, it also reflects that although there are differences in policy effects among regions at different administrative levels, the core direction of the role is consistent [
1].
4.6. Mechanism Test
The foregoing analysis has validated that the energy quota trading system can significantly promote the decarbonization of energy consumption in pilot cities by using the difference-in-differences method and an array of robustness tests [
24]. Then, precisely what is its specific transmission mechanism? In other words, which crucial key variables does the energy quota trading system influence so as to propel the decarbonization of energy consumption? This calls for a more in-depth exploration of its underlying mechanism. Based on the theoretical analysis above, this paper adopts Jiang Ting’s [
32] causal steps method to comprehensively examine the specific mechanisms through which the energy quota trading system boosts the decarbonization of energy consumption from two aspects: promoting green technology innovation and influencing energy consumption intensity.
The results of this mechanism test are presented in
Table 6. Hypothesis 1 posits that the energy quota trading policy can promote the decarbonization of energy consumption. To avoid the endogeneity bias associated with traditional testing methods, this paper refers to the mediating effects framework proposed by Jiang Ting and utilizes a model for regression analysis to assess the impact of the energy quota trading policy on the mechanism variables, which in turn demonstrates the role of these variables in the decarbonization of energy consumption. The regression results of this model are listed in the table.
From columns (1) and (2) of
Table 6, we can see that the coefficient for the regression of the energy quota trading policy on the decarbonization of energy consumption is 0.0624, passing the 5% significance test; by contrast, the coefficient for the regression of the energy quota trading policy on green technological innovation is 0.0913, also passing the 5% significance test. This indicates that the energy quota trading policy positively promotes the decarbonization of energy consumption through the path of green technological innovation, thus validating Hypothesis 2: that is, green technological innovation plays an effective mediating role between the policy and decarbonization, and the promoting effect of the policy is partially achieved by stimulating technological innovation.
Additionally, from columns (1) and (3) of
Table 6, we observe that the coefficient for the regression of the energy quota trading policy on the decarbonization of energy consumption remains at 0.0624, passing the 5% significance test; however, the coefficient for the regression of the energy quota trading policy on energy intensity is −0.0451, which passes the 1% significance test. This means that the energy quota trading policy promotes decarbonization of energy consumption through the effective reduction of energy intensity, thereby validating Hypothesis 3: that is, the policy reduces the consumption of energy per unit of output, indirectly lowering the reliance on high-carbon energy and becoming another important transmission path in the decarbonization process.
4.7. Further Analysis
4.7.1. Heterogeneity of Industrialization Level
From the perspective of industrialization level, cities with different levels of industrialization exhibit differences in economic structure and energy demand, which can affect the effectiveness of relevant policies on the decarbonization of energy consumption. This study measured the industrialization level by the proportion of industrial output value to regional GDP, using the median of this data as a threshold. Regions above the median are classified as having a high level of industrialization, and those below as having a low level of industrialization.
Columns (1) and (2) of
Table 7 present the regression results for cities with varying levels of industrialization. In cities with a low level of industrialization, the regression coefficient is 0.1490, which passes the 1% significance test, indicating that the energy quota trading policy has a significant positive impact on these cities. In contrast, the regression coefficient for cities with a high level of industrialization is 0.0523 and is not significant. This comparison suggests that the energy quota trading policy may have a greater impact on cities with a low level of industrialization. This may be because cities with low industrialization have more room for industrial structure adjustment and less resistance to the transformation of energy consumption structure, while cities with high industrialization have a high proportion of industry and strong rigidity in energy demand, which restricts the effect of the policy.
4.7.2. Heterogeneity of Resource Endowments
Differences in resource endowments lead to significant variations in economic development models and energy utilization methods across cities. This study measures the level of resource endowment by the proportion of resource taxes to regional GDP, with the median of this data serving as the threshold. Regions above the median are classified as resource-rich, and those below as resource-poor. A comparison of the results for resource-poor and resource-rich cities in columns (3) and (4) of
Table 7 shows that the regression results for resource-poor cities are not significant. In contrast, the regression coefficient of the energy quota trading policy in resource-rich cities is 0.1466, which is significant at the 1% level. This indicates that relevant policies have a more pronounced effect on promoting the decarbonization of energy consumption in resource-rich cities, possibly because resource-rich cities originally have a higher dependence on high-carbon energy, and the constraints and incentive mechanisms of the policy can better promote them to break the path dependence and accelerate the transition to low-carbon.
4.7.3. Heterogeneity of the Yangtze River Economic Belt
The Yangtze River Economic Belt holds a unique position in regional economic development, exhibiting differences in economic development models, industrial layouts, and policy environments compared to areas outside the Yangtze River Economic Belt. According to the regression results presented in columns (1) and (2) of
Table 7, the results for regions outside the Yangtze River Economic Belt are not significant, while in the Yangtze River Economic Belt, the regression coefficient for the energy quota trading policy is 0.2070 and is significant at the 1% level. This indicates that the energy quota trading policy has a significant positive effect on the decarbonization of energy consumption in cities within the Yangtze River Economic Belt, while there is no significant impact on cities outside this region. This may be because the Yangtze River Economic Belt itself has more advantages in green development planning and industrial collaboration mechanisms, with more complete supporting conditions for policy implementation, thus enabling the energy quota trading policy to exert its effects more fully.
4.7.4. Heterogeneity Among the Eastern, Central and Western Regions
There are significant differences in economic development levels, industrial structures, and resource allocation between the central and western regions of China and the eastern regions. According to the regression results presented in columns (3) and (4) of
Table 8, the regression coefficient for the energy quota trading policy in the central and western regions is 0.1045 and is significant at the 1% level, while the results for the eastern regions are not significant. This indicates that the energy quota trading policy has a relatively more pronounced effect on improving energy efficiency in the central and western regions, possibly because the central and western regions have greater potential for policy impact in terms of the starting point of energy utilization and room for structural adjustment, while the eastern regions already have relatively high energy utilization efficiency, resulting in a relatively weaker marginal effect of the policy.
In summary, the implementation effects of the energy quota trading policy are more significant in areas with lower levels of industrialization, rich resources, the Yangtze River Economic Belt, and the central and western regions. This validates Hypothesis 4: that is, the intensity of the policy’s role varies due to differences in regional heterogeneous characteristics, and it can more fully release its effectiveness in promoting energy transformation in the abovementioned specific regions.
The study finds that the energy quota policy promotes the decarbonization of the energy consumption through two pathways: green technology innovation and reduced energy intensity. This conclusion aligns with the perspective of Du et al. [
1], who assert that “market mechanisms drive technological upgrades”. Their research emphasizes the role of market mechanisms in encouraging enterprises to invest in research and development and in promoting technological advancements for achieving low-carbon transitions, which is consistent with the role of energy quota policies as a market mechanism that stimulates green technology innovation in this study.
Additionally, this finding resonates with the conclusions of Wang et al. [
4], who focus on the relationship between energy intensity and carbon emissions. They point out the positive impact of decreasing energy intensity on reducing carbon emissions, which echoes the mechanism in this study where the energy quota policy drives down energy intensity, thereby facilitating decarbonization.
Compared to existing research, the innovations of this study include the following: (1) In terms of methodology, the study quantifies the degree of decarbonization in the energy consumption using a spatial vector approach, which overcomes the inadequacies of traditional indicators in depicting the substitution relationships among various energy types; (2) In terms of mechanisms, the study verifies for the first time the synergistic mediating effect that exists between energy intensity and green technology innovation; (3) The analysis of regional heterogeneity reveals that the effectiveness of the policy is greater in regions that have low levels of industrialization and abundant resources, thus providing empirical support for the implementation of policies that are precise.
5. Conclusions and Policy Recommendations
This study is based on the panel data of 30 provinces in China from 2012 to 2022 and employs the difference-in-differences method to empirically analyze the impact of the energy quota trading system on the decarbonization of energy consumption; the results show that this system has significantly promoted the decarbonization of energy consumption in the pilot areas, and the conclusion remains valid after the parallel trends test and multiple robustness tests; mechanism analysis indicates that under the pressure of energy quotas and costs, enterprises in pilot provinces increase investment in green technology innovation, reduce the proportion of high-carbon energy use through peer-group effect and scale effect, and actively improve processes, eliminate energy-intensive equipment, and reduce energy consumption intensity, thereby creating favorable conditions for increasing the proportion of low-carbon energy. Heterogeneity analysis finds that the system has more significant effects in regions with lower industrialization levels, abundant resources, the Yangtze River Economic Belt, and central and western regions, while in regions with high industrialization levels, scarce resources, and eastern regions, the policy effects are relatively limited, mainly affected by industrial structure and adjustment difficulties.
Based on the above conclusions, the following policy recommendations are put forward: accelerate the construction of a national energy quota trading market, as the construction of a national energy quota trading market is imperative, which will provide a solid foundation for reform in the energy sector, and it should be regarded as a key task, with pilot areas needing to summarize experiences, optimize institutional design, standardize trading processes, gradually expand the pilot scope, improve the regulatory system, enhance regulatory efficiency, reduce transaction costs, ensure market fairness and transparency, and improve the efficiency of energy resource allocation; optimize the supply of regionally differentiated policies, given that there are significant differences in economic structures and resource endowments across regions in China, so it is necessary to formulate supporting policies according to local conditions, and for regions with lower industrialization levels and rich resources, policy guidance should be used to promote industrial upgrading and technological transformation, and improve energy utilization efficiency, while for the Yangtze River Economic Belt and central and western regions, it is necessary to deepen regional industrial collaboration, amplify the policy scale effect, and accelerate the decarbonization process of energy consumption; strengthen the driving force of green technology innovation, as green technology innovation is the core driving force for achieving the decarbonization of energy consumption, and the government should further increase support, including establishing special funds, improving incentive mechanisms, reducing enterprises’ R&D costs, promoting industry–university–research cooperation and technology achievement transformation, and accelerating the industrial application of clean energy and energy-saving and emission-reduction technologies; promote collaborative governance of energy and the environment, since energy transition and environmental governance are inseparable and need to be advanced in a coordinated manner, and it is necessary to promote the coordinated development of energy consumption structure adjustment and environmental governance, expand the application of renewable energy, reduce dependence on fossil energy, strengthen the linkage between environmental supervision and energy management, build an integrated monitoring system, achieve full-process control of energy consumption and pollution emissions, and promote the coordinated development of the economy and the environment.
6. Practical Implications
This study explores the impact of the energy quota trading policy on promoting the decarbonization of energy consumption in China, with its significance reflected in several aspects:
(1) Addressing the need for global climate change mitigation. As global temperatures continue to rise and extreme weather events become more frequent, reducing carbon emissions has become an urgent task for the world. As the largest energy consumer and carbon emitter, China’s implementation of effective energy policies to lower carbon emissions not only helps achieve the national dual carbon goals (carbon peak and carbon neutrality) but also plays an important role in global climate change mitigation.
(2) Promoting green technology innovation. This study reveals that the energy quota trading policy significantly improves energy efficiency by promoting green technology innovation. This finding provides policy support for enterprises to increase investment in clean energy and green technologies, thus facilitating broader industrial transformation and upgrading. The promotion of green technology applications not only enhances the sustainability of industries but also creates new economic growth opportunities for businesses.
(3) Optimizing policies and providing practical guidance. The findings of this study provide empirical evidence for policymakers, aimed at optimizing the existing energy quota trading market and formulating more effective regional policies. By analyzing the regional differences in policy implementation, this research can offer more precise guidance for different regions to develop specific carbon reduction measures based on their resource endowments and levels of economic development. Such a policy feedback mechanism not only improves the targeting and effectiveness of policies but also contributes to the formation of regional collaborative development.
(4) Enhancing public and corporate environmental awareness. Through an in-depth study of the decarbonization of energy consumption, this research can enhance public awareness and corporate commitment to sustainable development. Therefore, not only the government but also businesses and the public can participate in carbon reduction actions, collectively promoting green development and creating an atmosphere of societal involvement.
(5) Laying the foundation for future research. This study opens a new research area regarding energy quota trading policies and their impacts, providing scholars and research institutions with rich data and analytical frameworks. It also offers valuable insights for future exploration of the integration of market mechanisms and environmental policies.
In summary, the energy quota trading policy discussed in this study is of significant importance for China’s energy structure adjustment and environmental protection, while also contributing to the improvement of the global climate governance system. The effective implementation of these policies will bring long-term benefits to all parties, promoting a more sustainable future.
7. Deficiencies and Prospects
This study has achieved certain advancements in exploring the impact of the energy quota trading system on the decarbonization of energy consumption. However, it has significant limitations, mainly reflected in the restrictions of data availability and research methods. Specifically, the lack of enterprise energy data hinders the ability to deeply analyze the micro-level impact of the energy quota system and accurately evaluate the dynamic adjustment process of energy consumption of enterprises. Meanwhile, the energy quota trading market is still in its initial development stage. The incompleteness of relevant indicator data poses challenges to quantifying the market scale and its impact on the adjustment of the energy consumption structure. Future research should focus on the impact of the energy quota trading system on energy decision-making of enterprises as well as analyzing the modes of action of market mechanism optimization on the decarbonization of enterprises’ energy consumption, so as to provide a more scientific theoretical basis for policy formulation.


