1. Introduction
With increasing urban populations and the multiplication of daily activities undertaken by individuals in cities, mobility has become a pressing issue in urban management [
1]. According to López-lambas et al. [
2], the rapid growth of car ownership in emerging countries has led to a global vehicle fleet exceeding one billion, with forecasts predicting it will soon reach two billion. This rapid motorization has exacerbated urban challenges, such as congestion, pollution, and social inequities in mobility access.
In response to these challenges, the vision of sustainable mobility has gained prominence among scholars, planners, and policymakers worldwide [
3,
4]. However, for sustainable mobility to transition from a conceptual vision to a practical reality, it requires changes in individual travel behaviors, shifting from habitual practices to more sustainable travel alternatives [
3] This highlights the urgent need to rethink mobility strategies in the coming decades.
Universities, as important trip generation hubs, are increasingly committed to creating sustainable environments by adopting measures that encourage the use of active modes and public transport [
5]. Nevertheless, Banister [
6] argues, behavioral change is essential for achieving sustainable mobility, and researchers and decision-makers must fully understand the complex and diverse challenges faced by transport and energy providers, as well as transport users themselves.
Addressing these challenges requires a comprehensive perspective that combines behavioral analysis methods, diverse policy options, and the engagement of all stakeholders. In this context, the urgent need to promote behavioral change in mobility, coupled with advancements in machine learning and artificial intelligence (AI), presents an opportunity to assist decision-makers in fostering healthier and more sustainable university environments by encouraging the increased use of active and public transport modes.
While prior studies have applied sentiment analysis to examine public perceptions of transportation systems, few have systematically explored perceptions of sustainable mobility specifically within university contexts, particularly using social media data as a scalable, real-time information source. Additionally, there is limited evidence on how perceptions vary across cities with different cultural and infrastructural characteristics, or how these perceptions may align with behavioral intentions toward sustainable transport choices.
This study addresses these gaps by applying sentiment analysis to 120,236 tweets collected from São Paulo, Rio de Janeiro, Lisbon, and Porto, focusing on perceptions of different transport modes within university environments compared to the broader city context. It is hypothesized that universities will exhibit more positive sentiment toward active and public transport modes compared to individual motorized modes, supporting their potential role in promoting sustainable mobility. By leveraging social media data, this research contributes to a data-driven understanding of public perceptions, supporting the development of targeted strategies to encourage sustainable transport choices in university settings.
Overall, the objective of this study is to investigate the potential for increasing sustainability in university campus mobility by employing machine learning models to analyze sentiment from social media data. By harnessing the power of these models, the research aims to identify specific mobility patterns and trends that can enhance decision-making processes for more sustainable and efficient transportation systems. Specifically, this study seeks to use sentiment data to inform which transport modes are perceived more positively or negatively by users, thereby supporting evidence-based mobility planning and targeted policy interventions that promote sustainable commuting behaviors in university environments.
2. Background and Literature Review
The rise of social media and user-generated content has created unprecedented opportunities for understanding how individuals perceive, react to, and interact with transportation systems. Among the analytical techniques now widely adopted, sentiment analysis (SA), a branch of natural language processing (NLP), has gained particular prominence. Its ability to capture subjective evaluations of service quality, policy measures, infrastructure projects, and modal choices makes it a valuable tool in the evolving field of transport research. This section explores how SA has been applied in transportation studies, emphasizing methodological developments, the range of transport modes examined, data sources, and its broader relevance to sustainability and planning.
Some studies have primarily employed lexicon-based models, such as SentiStrength, SentiWordNet, VADER, and NRC, to classify polarity (positive, negative, neutral) in user comments [
7,
8,
9,
10]. For instance, Chang et al. [
11] used Baidu’s API and TextRank to analyze 14.5 million Weibo posts in Shanghai, mapping congestion and accident zones. Sdoukopoulos et al. [
12] applied a simple bag-of-words approach to evaluate sustainable mobility indicators in London, identifying perceived weaknesses in reliability and cleanliness.
Another set of studies has increasingly incorporated machine learning (ML) and deep learning (DL) models to improve classification accuracy and contextual understanding. Mounica and Lavanya [
13] showed that combining part-of-speech feature selection with RNNs increased accuracy from 56% to 88% in classifying traffic-related tweets. RoBERTa and CrisisTransformers were employed by Pullanikkat et al. [
14] to detect transportation complaints across Indian cities, achieving over 91% accuracy.
Aspect-based sentiment analysis (ABSA) and hybrid models have also gained attention. Rahimi et al. [
15] proposed a SentiHawkes model combining ABSA with multivariate point processes, uncovering causal links between service attributes and public reactions. Gong et al. [
16] presented a robust lexicon-driven framework integrated with SKEP (Sentiment Knowledge Enhanced Pre-training) to evaluate urban rail transit services across 10 Chinese cities.
The use of social media as a primary data source has been a consistent trend across studies applying sentiment analysis in transport research. Twitter remains the most widely utilized platform, as demonstrated by analyses conducted in Australia [
17], Chile [
18], India [
19], China [
16], and Germany [
20]. Other platforms have also gained attention: TripAdvisor was employed to analyze traveler satisfaction in public transport and aviation contexts [
21,
22]. Weibo posts formed the basis for spatial sentiment mapping in Chinese metropolitan areas [
11,
23]; and user reviews from Google Maps were leveraged to evaluate intercity bus services [
24]. Studies also incorporated Facebook data [
25] and content from blogs and news media [
26,
27] to diversify their information sources.
The transport modes examined across these studies reveal significant variation. Nevertheless, public transit systems remain the primary focus, with particular attention given to metro networks, suburban railways, and city bus services. Research on metro systems includes evaluations of passenger sentiment and service quality for networks in Madrid [
28] and several major Chinese cities [
16], while suburban train satisfaction was assessed in Mumbai [
9], and bus transportation quality was studied through extensive online reviews in Pakistan [
24] and service-related tweets in Indonesia [
29].
While public transport dominates, research has also expanded to active mobility and micromobility, reflecting the growing sustainability agenda. Bicycling has been analyzed both from the perspective of barriers and motivators. For example, Cebeci et al. [
30] studied perceptions of cycling infrastructure in Turkey, while Serna et al. [
31] investigated factors influencing the adoption of bike-sharing schemes in Spain using sentiment analysis. In the domain of electric vehicles (EVs), studies by Pani et al. [
32] and Pandey et al. [
19] highlighted the influence of perceived cost, autonomy limitations, and inadequate charging infrastructure on public attitudes based on large-scale social media mining.
Air travel has also been a notable area of research. Aguarón et al. [
33] applied sentiment-based decision support systems to assess pandemic-related concerns in Spain’s passenger air transport, while Nam and Lee [
22] explored user experiences of nine global airlines through sentiment modeling combined with online reviews. In a slightly different context, Setälä et al. [
34] analyzed public reactions to Finnair’s sustainability signaling through the announcement of future electric aircraft, emphasizing the reputational impact of innovation narratives.
Research on emerging technologies, particularly autonomous vehicles (AVs), has started to attract increasing research interest. Jing et al. [
35] used public comments from Weibo and TikTok to understand shifts in public sentiment following a fatal accident involving a semi-autonomous car in China, showing significant increases in negative perceptions about automation safety. In a complementary perspective, Kinra et al. [
26] examined how news articles and tweets shape public attitudes toward driverless cars in Denmark, providing evidence that media frames strongly influence consumer trust and perceived risks associated with new technologies.
Several studies incorporate spatial analysis by geotagging or inferring locations from text. Osorio-Arjona et al. [
28] used GWR to map complaints by metro station in Madrid, showing higher negativity in peripheral zones. Luo et al. [
23] evaluated heterogeneity in user satisfaction in Shenzhen by age, gender, and time-of-day, finding that women and suburban residents were particularly critical of crowding and safety conditions.
Other studies used kernel density estimation (KDE*) to identify accident-prone areas [
11], while Gong et al. [
16] utilized topic- and sentiment-weighted heatmaps to detect peaks of user dissatisfaction across nine service dimensions, including temperature, ventilation, and train orderliness.
Sentiment analysis has also proven effective in assessing public reactions during crises and policy interventions. During the COVID-19 pandemic, multiple studies observed surges in negative emotions related to uncertainty, risk, and operational disruptions [
36,
37,
38]. In Vancouver, Tran et al. [
36] detected peaks in fear and anger among older adults and young users; in India, Habib and Anik [
37] found increased enthusiasm for biking and remote work.
Policy communication has also been a focus. Setälä et al. [
34] analyzed reactions to Finnair’s electric aircraft announcement and found that transparency and technological innovation yielded largely positive sentiment. Mathews et al. [
39] evaluated public discourse on transport communication strategies in Queensland, recommending more responsive digital engagement. Similarly, Lock and Pettit [
17] suggested that social media sentiment reflects passive participation, which, if harnessed responsibly, could enhance traditional planning processes. Chang et al. [
11] and Pullanikkat et al. [
14] advocated for integrating real-time sentiment monitoring into smart transportation systems to detect operational failures early.
Despite methodological progress, significant challenges persist. Lexicon-based tools often fail to capture sarcasm or contextual nuance [
12], while machine learning models require extensive annotated data. Geolocation is often missing (less than 0.5% in some cases), and social media data may reflect sampling bias, overrepresenting younger, urban, or more vocal users [
9,
27].
Nevertheless, innovative methods are emerging. Chang et al. [
11] fused textual and spatiotemporal features to classify tweets into congestion and accident events. Gong et al. [
16] introduced TUI (Term Usage Innovation) as a novel indicator to detect evolving public concerns. Mounica and Lavanya [
13] showed how part-of-speech patterns improve feature selection in traffic tweet classification. Meanwhile, Pineda-Jaramillo and Pineda-Jaramillo [
21] and Nam and Lee [
22] combined sentiment with performance metrics (e.g., TAIPA, MLP classifiers) to assess satisfaction in tourism and aviation.
Sentiment analysis enables researchers and policymakers to capture public emotions in near-real time. It facilitates participatory planning, helps evaluate equity in transport services, and offers insights into environmental perceptions. As shown by Pani et al. [
32], sentiment trends can reflect macro-policy shifts. Meanwhile, Jakopović [
40] demonstrated how framing and sentiment in news media shape public trust and operator reputation.
In summary, sentiment analysis has evolved into a mature and versatile tool in transport research. With appropriate ethical safeguards, multimodal integration, and sensitivity to context, its integration with other datasets promises to advance the development of smarter, fairer, and more responsive transportation systems.
Despite significant methodological advances, the literature still lacks a conceptual framework that explicitly connects sentiment, behavioral intention, and transport mode choice. In this context, sentiment is understood as an indicator of user perception and emotional response, capable of influencing behavioral intentions and, ultimately, mobility decisions.
Furthermore, although sentiment analysis has been widely applied in transport research, few studies systematically explore how user sentiment varies across distinct spatial contexts—particularly in trip generation hubs, such as universities—and there is limited evidence on how these perceptions may align with sustainable mobility goals within these environments. Additionally, most existing studies have focused on English-language datasets, with minimal exploration of sentiment analysis applied to transportation perceptions in Portuguese-language contexts. These gaps underscore the need for systematic, data-driven studies that leverage sentiment analysis to understand perceptions of different transport modes within university settings and to compare these perceptions with those observed in the broader urban context, supporting targeted strategies for promoting sustainable mobility.
3. Methodology
3.1. Case Study Cities Selection
The selection of São Paulo, Rio de Janeiro, Lisbon, and Porto as case study cities was guided by their significance as major urban centers with diverse demographic, infrastructural, and cultural characteristics relevant to sustainable mobility analysis. Additionally, it is noteworthy that the four cities share the same official language, Portuguese, despite regional linguistic differences between Brazil and Portugal, which facilitates the comparative analysis of social media data.
São Paulo and Rio de Janeiro, as two of the largest cities in Latin America, are characterized by high population densities, elevated motorization rates, and complex transportation systems facing challenges related to congestion, pollution, and social equity in mobility access. Both cities have ongoing initiatives aimed at expanding active transport infrastructure and improving public transport systems to address these issues.
Lisbon and Porto, as significant European urban centers, present different transport dynamics, with higher investments in public transport and active mobility infrastructure, reflecting policies aligned with European Union goals for sustainable urban mobility. Both cities have well-established public transport networks, including metro systems and extensive bus and tram services, and have implemented measures to encourage active mobility, such as bike-sharing programs and the expansion of cycling infrastructure.
According to Silveira-Santos et al. [
41], these cities differ in urban morphology, transportation infrastructure, modal share, and other aspects, yet they serve as significant employment hubs in their regions. Despite these differences, both countries face challenges related to low infrastructure for active modes and a low modal share for scooters and bicycles.
The inclusion of these four cities provides a comparative perspective, enabling the exploration of how public perceptions of sustainable mobility vary across different contexts, with distinct transport policies, infrastructure, and cultural attitudes toward mobility. This diversity supports a robust analysis of sentiment toward different transport modes in university environments within each city, contributing to a comprehensive understanding of opportunities to promote sustainable mobility in diverse urban contexts.
3.2. Data Collection
Data collection is essential for research in data science. The massive amounts of data generated daily on social media platforms offer insights into user preferences and perceptions of urban mobility. This wealth of data is essential for understanding customer behavior and informing decision-making processes. In this study, Twitter was chosen as the social media platform for data collection due to its real-time access to a vast amount of publicly available user-generated data. Twitter’s API (Application Programming Interface) is user-friendly, making it a valuable resource for various research purposes, including sentiment analysis
The Version 4.15.0 of Python library Tweepy was used to access Twitter’s API and retrieve relevant tweets. Tweepy simplifies various tasks, such as searching, streaming, and processing tweets, and is widely adopted in research involving sentiment analysis and topic modeling. By handling the low-level details of Twitter API requests and responses, Tweepy allows developers to focus on high-level functionality. This library is widely used for social media analysis, topic modeling, sentiment analysis, and other Twitter-related tasks.
It is important to note that geolocated tweets were not used in this study due to their limited availability on Twitter, making it impractical to rely on precise geolocation for spatial filtering. Instead, tweets were filtered using the “author location” field to associate them with the cities of interest—São Paulo, Rio de Janeiro, Lisbon, and Porto—and the city name was included in the search queries to increase the likelihood that tweets belonged to the analyzed context. This approach allowed the inclusion of tweets from users who self-identified as being in these locations, enhancing the capture of locally relevant opinions.
The search queries used in this study included the name of each city and the modes of transport.
Table 1 shows the total number of tweets found for each mode of transport in the selected cities.
To ensure that the tweet belongs to the region of interest, only tweets with the “author location” matching the region being studied were selected (
Table 2). The consequence of this is a higher probability of dealing with information about the opinion of local users, which can be a problem in cities where there is a high flow of people or significant tourist activity.
The advantage is having a more accurate opinion of the relationship that users have with each mode of transport. This occurs because local users tend to have a better understanding of the transport systems in their own city. However, the perception of external users who express their opinions about transport modes is lost.
Another crucial set of data to be collected consists of tweets that specifically discuss the use of different modes of transportation associated with the university (
Table 3). Since the premise of this study is that universities serve as an environment conducive to promoting sustainable mobility, it is important to quantify and indicate which modes of transport can be stimulated, making the process more effective.
To ensure that this study dealt with universities in general, no specific university names were included in the search. This led to a significant decrease in the number of tweets found, but it ensured a simplified search approach. As the quantity of tweets per transport mode was reduced, and to increase the reliability of the analyses, the counts were aggregated by mode group (e.g., active modes, public transport, and individual motorized transport).
To summarize, for both the general city context and the university context, tweet collection was based on search queries that combined each transport mode (e.g., “bus”, “bike”, “subway”) with the name of the city. In the specific case of universities, tweets were selected using a refined query that incorporated generic academic terms (e.g., “university”) alongside each mode of transport (e.g., query = mode + university).
3.3. Manual Classification and Data Balancing
In this sense, a fundamental aspect involved was the development of a sentiment analysis classifier through the creation and utilization of a randomly selected dataset containing an interesting number of labeled tweets. This dataset served as the basis for training a supervised model, providing a comprehensive foundation for the algorithm to learn and generalize sentiment patterns.
Each tweet in the dataset was meticulously examined and labeled by human annotation, reflecting three possible sentiment categories: negative (0), neutral (1), and positive (2). This ensures a rich and diverse set of examples for the model to understand complexities of sentiment expressions in natural language.
The inclusion of this sizable and labeled dataset in the training step was pivotal, as it allowed the supervised model to effectively discern sentiment nuances and make informed predictions on new, unseen data. This robust training approach forms the backbone of the sentiment analysis framework proposed in this work, enhancing the model’s accuracy and applicability in real-world scenarios.
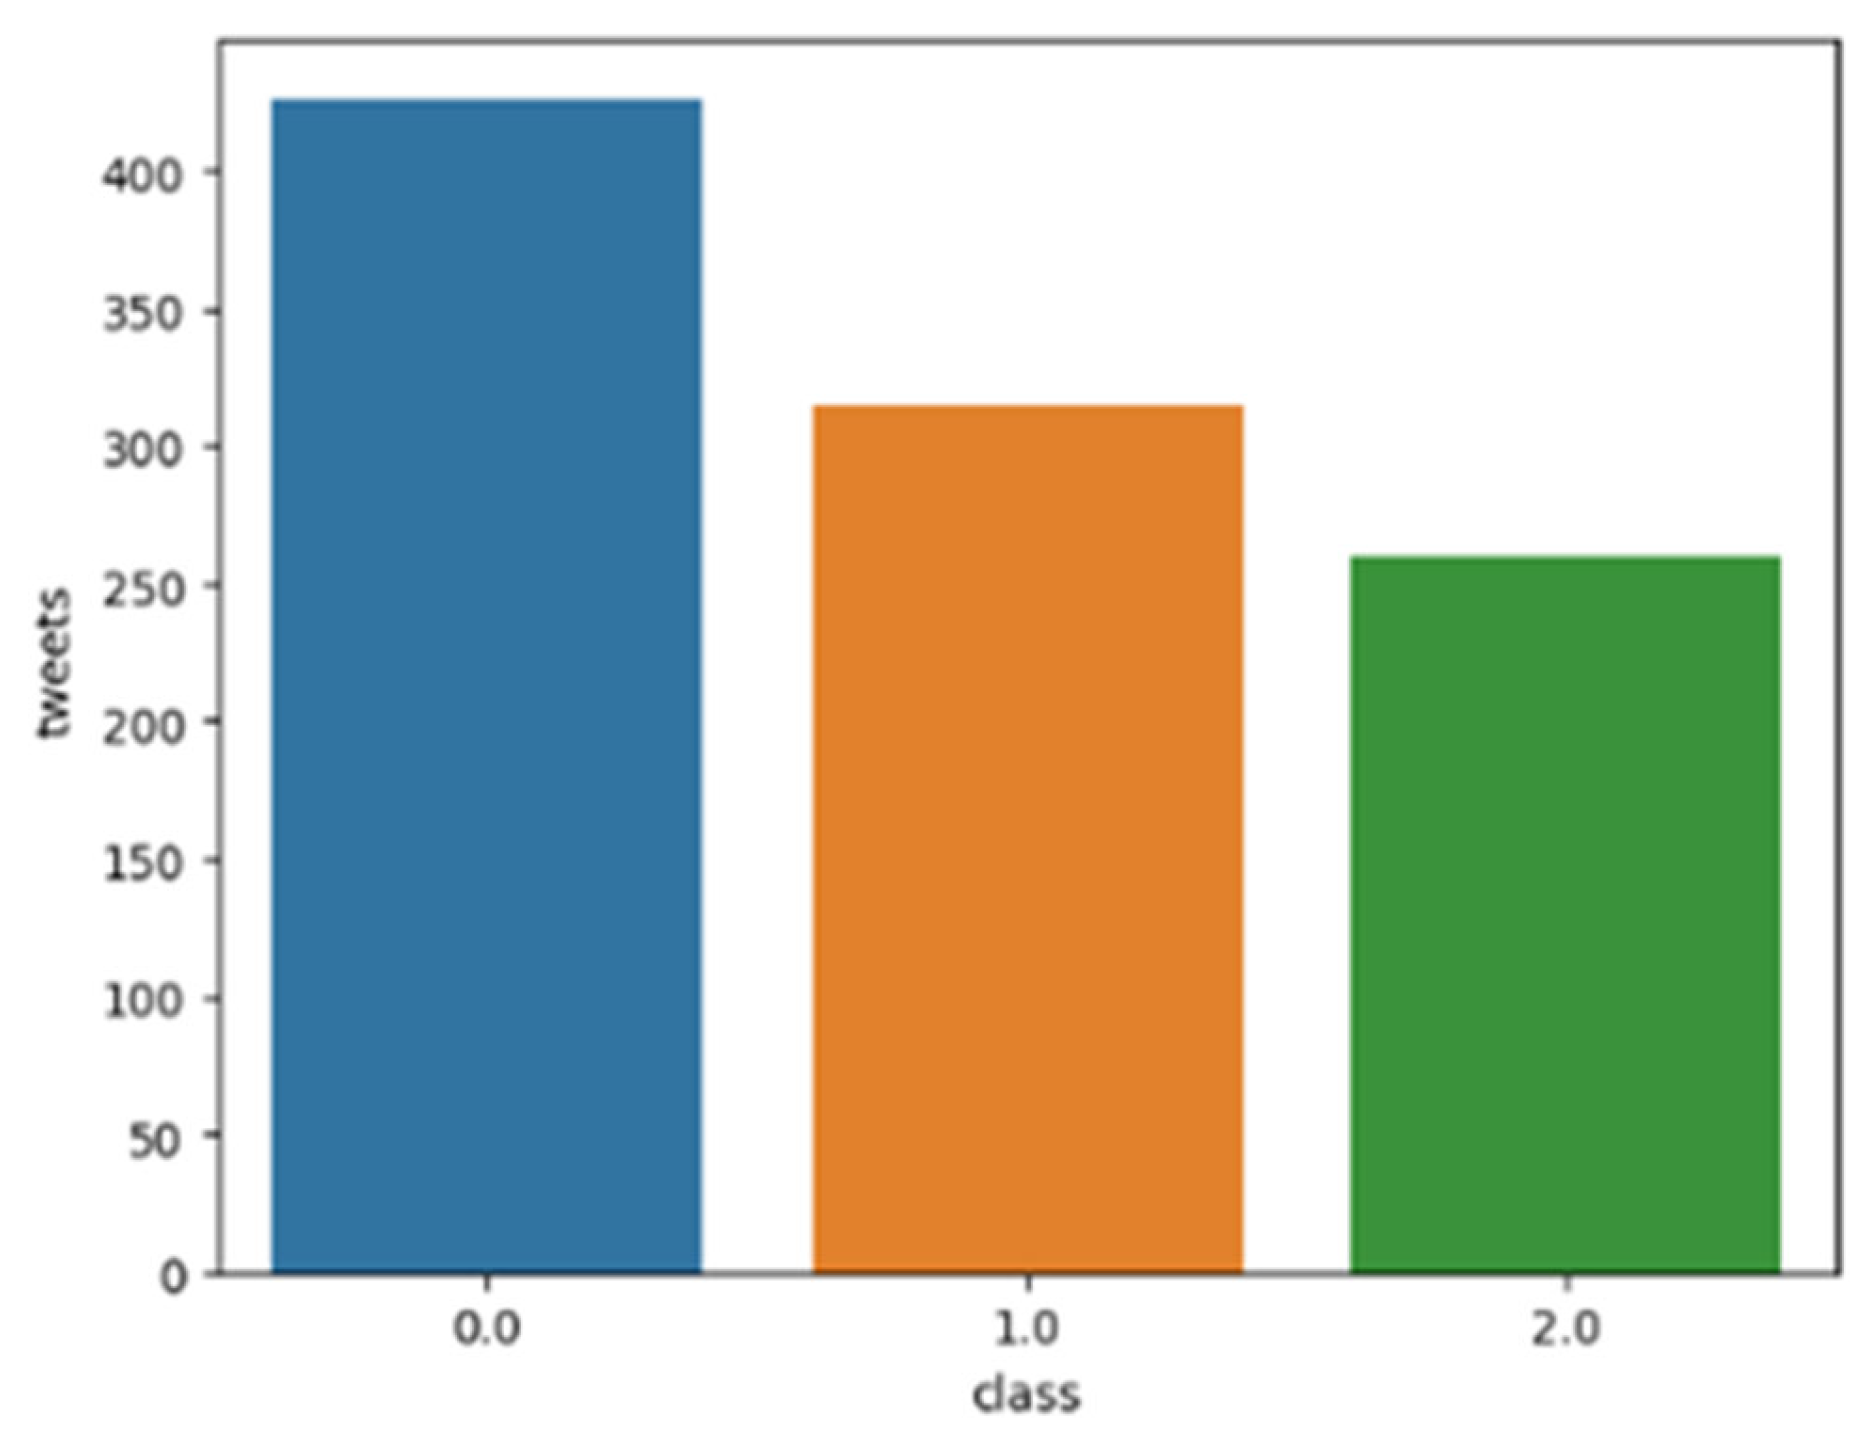
Figure 1 presents the dataset employed during the training phase of our analysis. In this step, a representative sample of a thousand tweets was randomly selected and manually classified.
Furthermore, an important aspect in the dataset is presented: its imbalance in terms of sentiment distribution. This creates a very common problem in classification when there is an imbalance in the data, that is, there are much more data from one class than from another (this can also occur for problems with more than two classes). So, when there is a class imbalance, the machine learning classifier tends to be more biased towards the majority class, causing misclassification of the minority class.
An alternative is to obtain more training data—preferably from the minority class. Another option is to change the performance metric, instead of using accuracy. Accuracy is a metric very sensitive to overall correctness, so it does not perform well in measuring the quality of models when the dataset has a significant imbalance between classes. To solve this problem, other performance metrics can be used, such as F1-Score. Another alternative is to perform resampling, and for that, there are two options (undersampling and oversampling).
The chosen option was to perform minority oversampling, which involves randomly creating new data based on the minority class until all three classes have an equal amount of data. In this case, each class (Negative, Neutral, and Positive) was adjusted to match the highest class, which consists of 426 instances.
3.4. Sentiments Data Training and Classifications
Supervised machine learning models were implemented in Python to perform sentiment analysis on Twitter data. The process involved standard natural language processing steps, including text tokenization, vectorization (using both TF-IDF and count-based methods), model training, and performance evaluation. Several classifiers were tested, such as logistic regression, random forest, passive-aggressive classifiers, and support vector machines. The final model was selected based on cross-validation results, using accuracy and F1-score as the primary evaluation metrics.
In
Table 4, the models are applied to oversampled data, refining the models tuning the hyperparameters.
Among the tested models, the combination of TF-IDF vectorization and a Support Vector Classifier (SVC) was selected for the final classification task. This choice was based on its superior performance in both accuracy and F1-score, as well as its robustness in handling imbalanced datasets and high-dimensional textual features. While other models yielded competitive results, SVC consistently outperformed them in terms of generalization and precision, particularly when processing the noisy and informal language typical of social media content.
Following this evaluation, the sentiment analysis pipeline was finalized by training the selected TF-IDF + SVC model on the complete dataset. The trained vectorizer and classifier were then serialized using the pickle module, enabling efficient reuse in subsequent sentiment analysis tasks.
For assessing the performance of the sentiment analysis model, an evaluation report is important to access metrics such as precision, recall, F1-score, and accuracy for each sentiment class. These metrics provide insights into how well the models are performing in terms of correctly identifying positive, negative, and neutral sentiments.
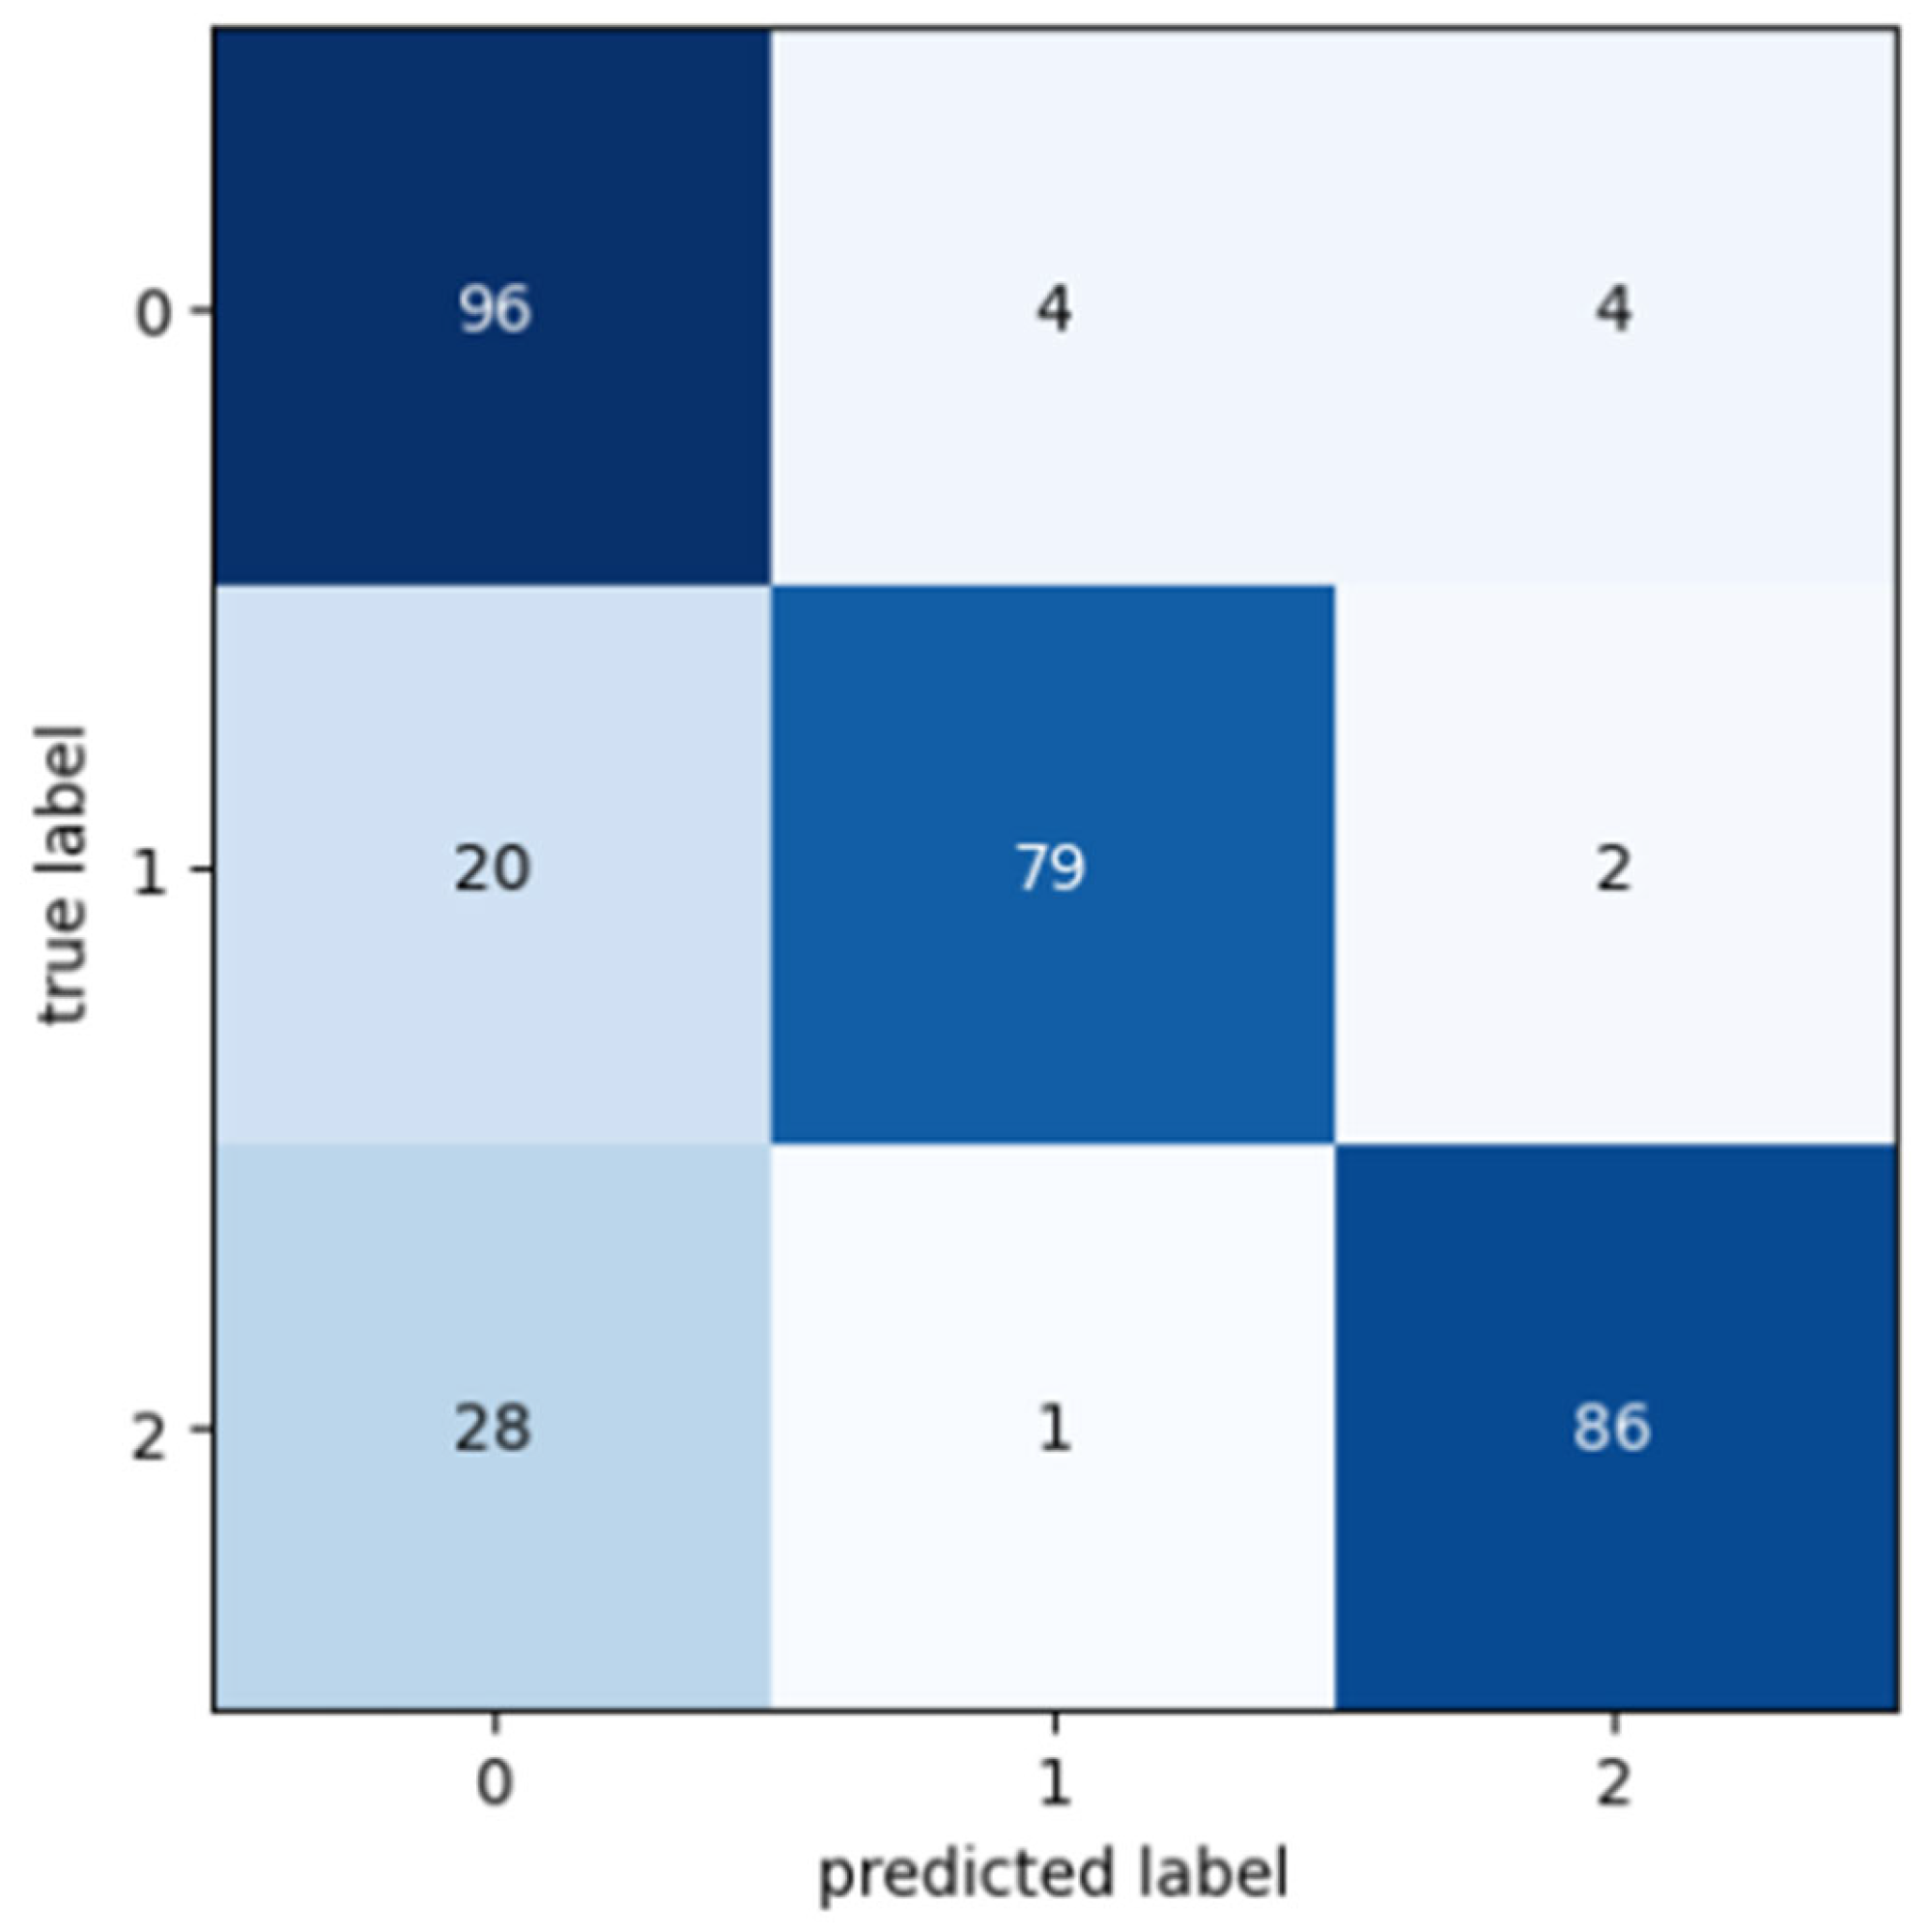
In summary, this evaluation report suggests that the model performs well in distinguishing between different classes, with relatively high precision, recall, and F1-score values. The confusion matrix (
Figure 2) provided a granular view of the model’s performance on individual class predictions.
4. Results
In the urban landscapes of São Paulo and Rio de Janeiro in Brazil, as well as Lisbon and Porto in Portugal, this application of sentiment analysis proved to be an essential tool for understanding public sentiment across different transport modes within both city and university environments. The integration of sentiment analysis technology enabled the monitoring and assessment of people’s emotions and experiences over time, as shared on social media, while utilizing public transportation along the city or riding a bicycle through university campuses, for example.
In the following sections, the conduction of sentiment analysis for each city is shown, providing insights into the prevailing emotions and sentiments within their respective communities.
4.1. Evaluation in São Paulo
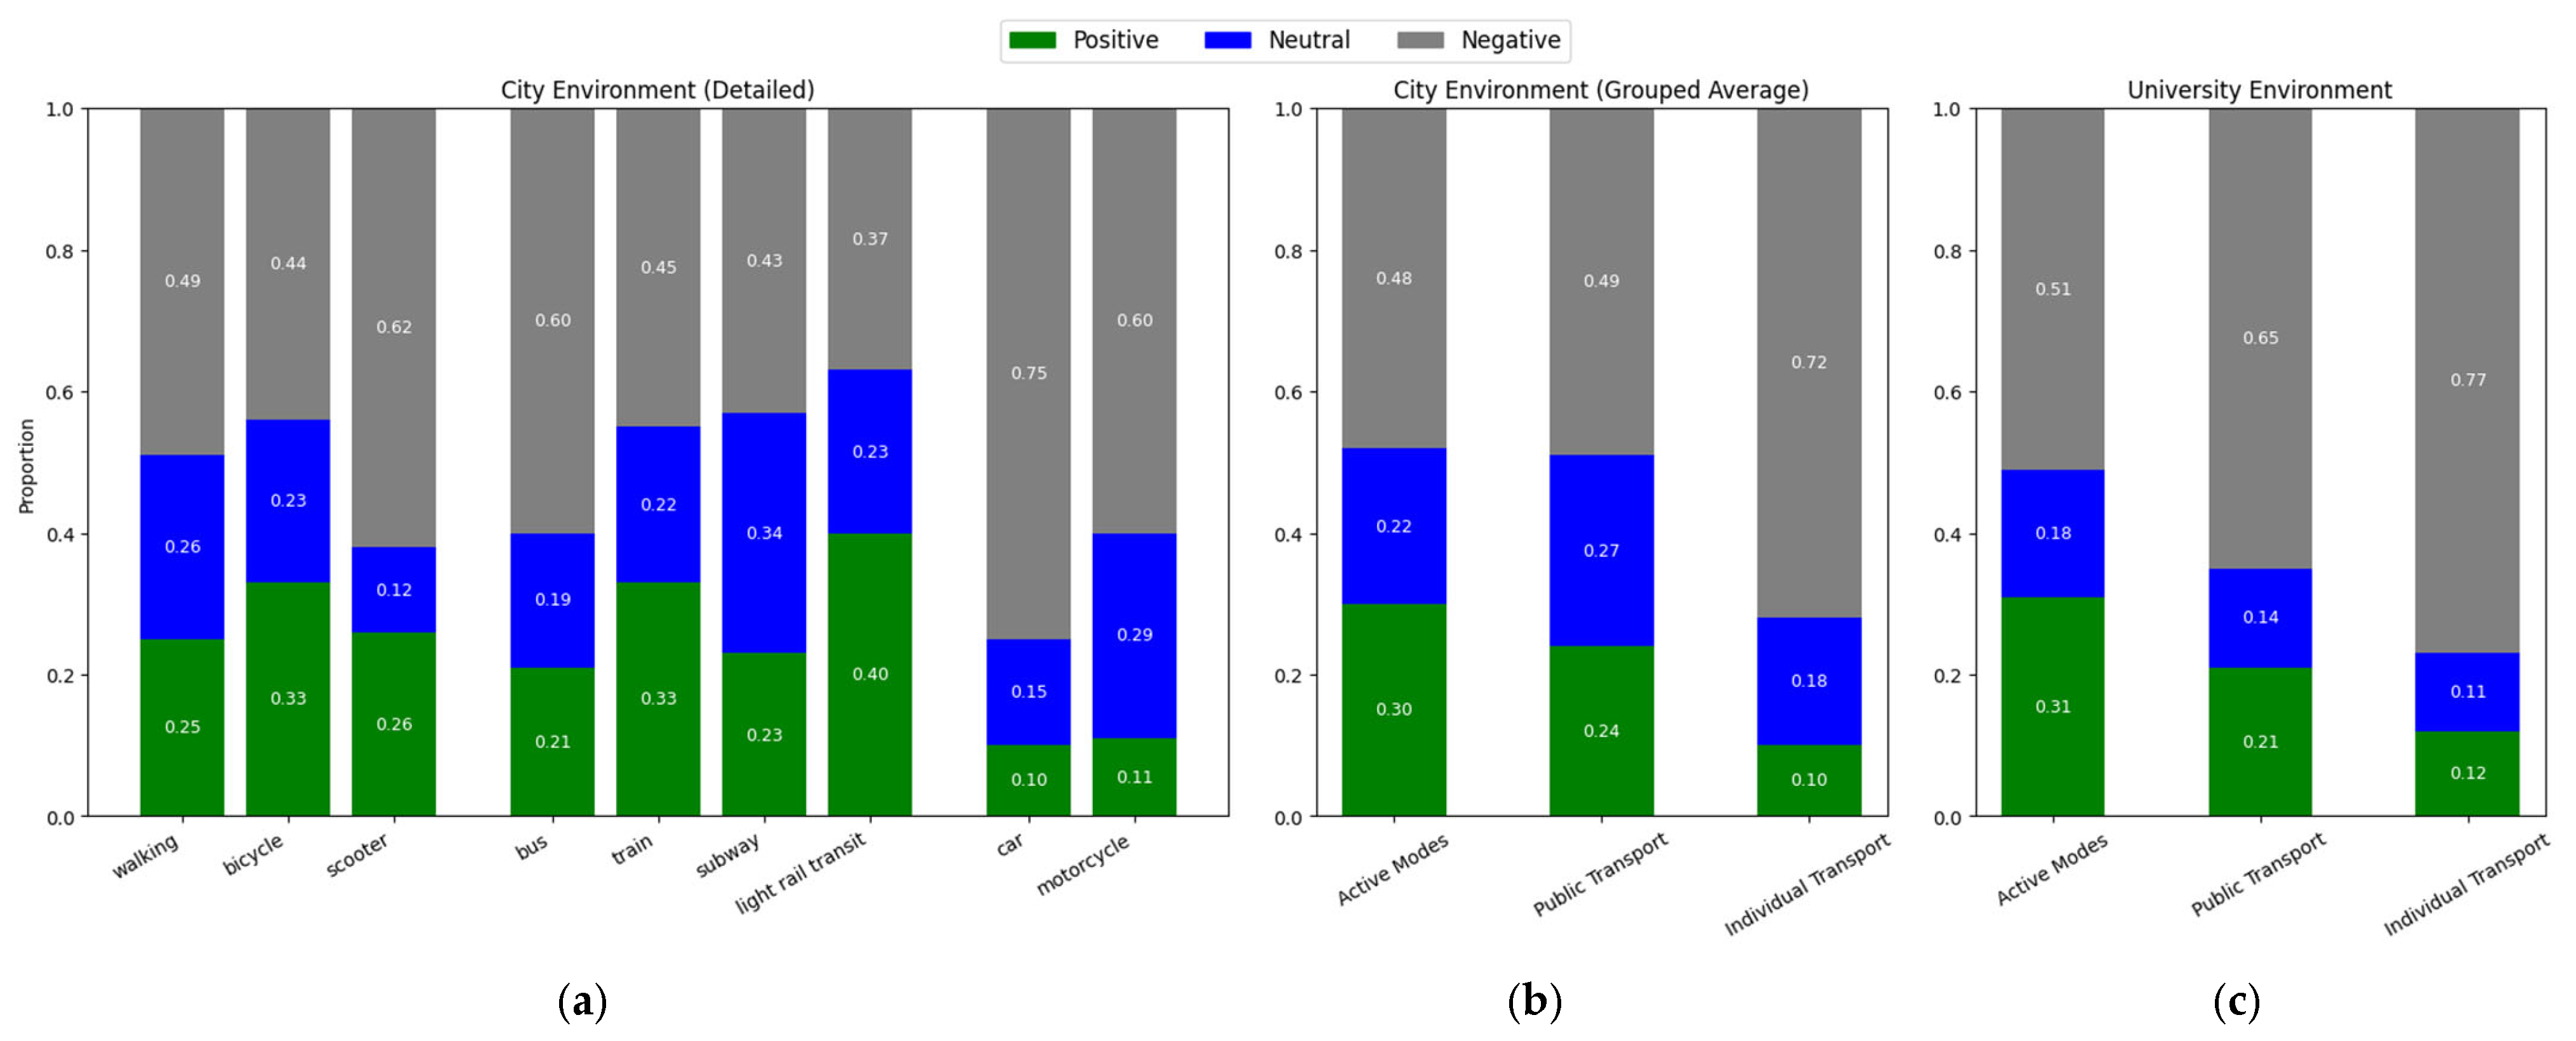
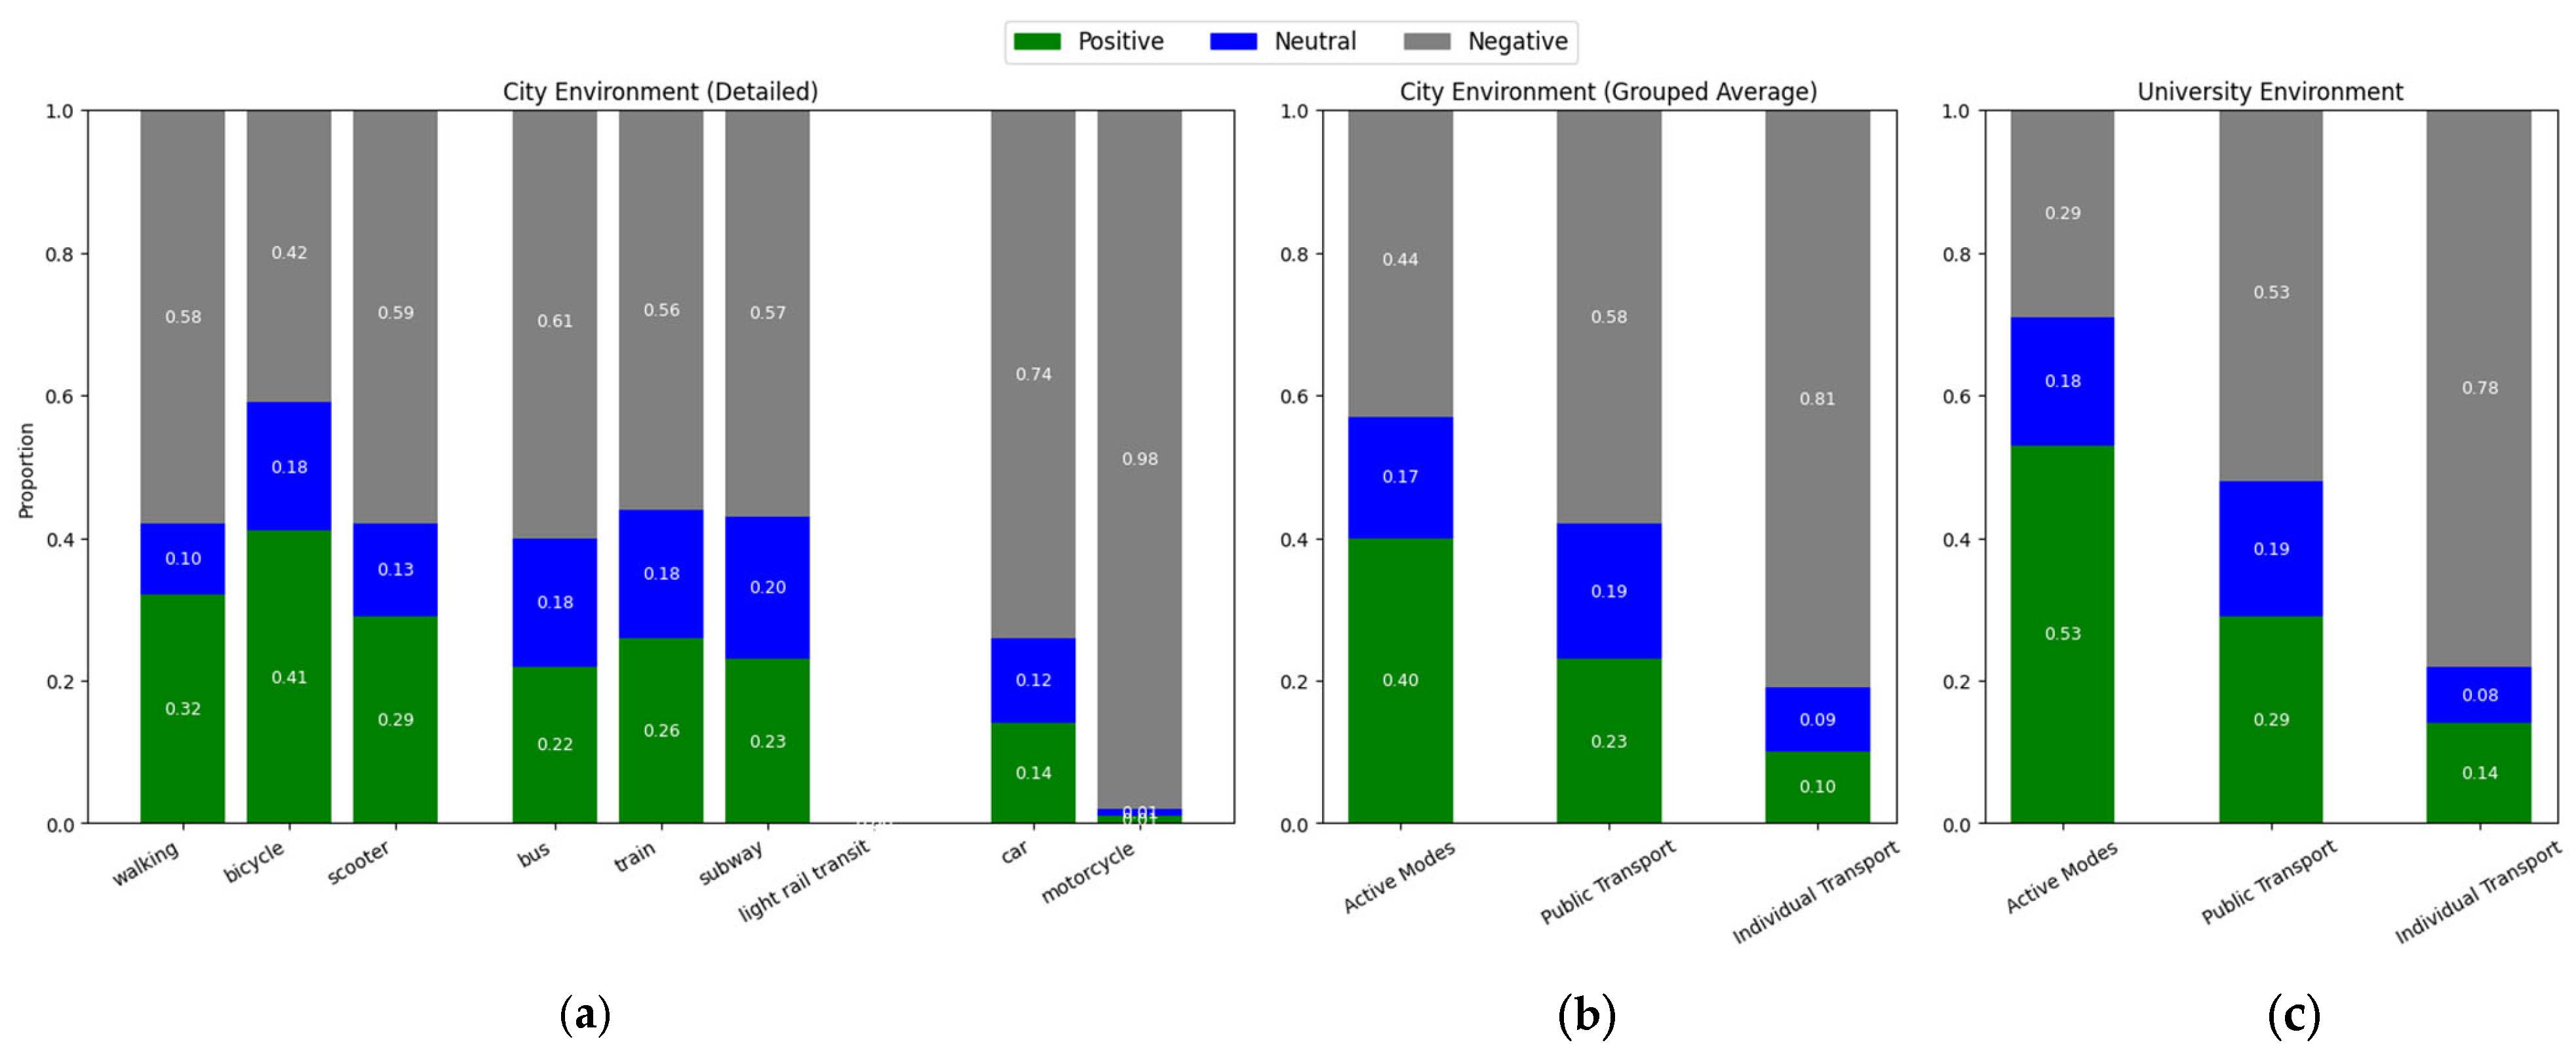
Figure 3 shows the results of the sentiment analysis conducted for São Paulo, presenting the perception of each mode of transport within the city environment and of each mode group within the cases under study.
The findings presented in
Figure 3a,b reveal a discerning perspective on transportation preferences in the city of São Paulo. Notably, the data illustrate a more positive perception of public transport and active modes compared to individual motorized modes of transport.
Furthermore, the non-negative (neutral and positive) perception towards active modes of transport, as well as high-capacity transport, stands out positively, and this suggests a favorable scenario for promoting sustainable mobility. In addition, the high non-positive (neutral and negative) evaluation of individual modes of transport also shows an interesting scenario for a possible modal shift.
Analyzing only the university environment,
Figure 3c presents the results of the sentiment analysis conducted for São Paulo, showing the overall perception of each mode group in this context.
Initially focusing on active modes, the proportion of positive mentions was practically the same between the city and university environments; however, the proportion of non-positive mentions (neutral + negative) was higher within the university context. It is noteworthy that in the city environment, the perception of bicycle use was more positive than the overall perception of active modes in both contexts under study.
Moreover, non-positive mentions of individual motorized modes is more pronounced within the university context, suggesting a potential for attracting more sustainable modes of transport in this environment. On the other hand, public transport modes did not show a more positive sentiment regarding their use in universities compared to the general sentiment in the city. However, they still demonstrated greater potential for use than individual motorized modes.
In the case of São Paulo, the chi-square test of independence confirmed the robustness of the sentiment analysis results across the two contexts under study. Within the city environment, a highly significant association was found between transport mode and sentiment distribution (χ2(16) = 4819.42, p < 0.001), reflecting the large data volume and the clear differentiation of perceptions among modes in the urban context. In the university environment, the test also indicated a significant association (χ2(4) = 21.90, p < 0.001), although with considerably lower intensity, consistent with the reduced data volume in this specific context. Nevertheless, the results suggest that differentiated perceptions regarding transport modes are also present within the university environment.
4.2. Evaluation in Rio De Janeiro
Figure 4 illustrates the results of the sentiment analysis for Rio de Janeiro, reflecting the perception of each transport mode within the city environment and of each mode group in the two scenarios under study.
In the case of Rio de Janeiro, within the city context, a lower overall share of non-positive sentiment is observed when compared to São Paulo. However, the pattern of more positive sentiment towards active and public transport modes compared to individual motorized modes is repeated. According to the results, a greater non-negative (neutral + positive) sentiment is highlighted about higher capacity modes of transport, fundamental in large metropolises such as Rio de Janeiro.
Additionally, social media data revealed consistently positive sentiment toward bicycles, reinforcing their potential as a key element in promoting sustainable mobility. Analyzing only the university environment,
Figure 4c presents the results of the sentiment analysis for Rio de Janeiro, showing the overall perception of each mode group in this context.
Compared to the scenario presented in
Figure 4a,b, a more favorable overall assessment is observed, including positive sentiment toward individual motorized modes. However, once again, the pattern of higher positive sentiment toward active and public transport modes, compared to individual motorized modes, is evident. The consistently low negative perception of active transport modes is particularly noteworthy, especially regarding the use of bicycles, which shows a low negative sentiment of approximately 20%.
In contrast with the university environment in São Paulo, active modes and public transport in this case present a more positive sentiment regarding their use in universities compared to the general sentiment in the city. Furthermore, a consistent pattern emerges in which individual motorized modes receive more negative sentiment compared to active and public transport modes. Regarding scooters and light rail transit, their isolated impact within the university context cannot be evaluated due to the low number of data collected.
For Rio de Janeiro, the chi-square test of independence also confirmed the validity of the sentiment analysis results across the two contexts. In the city environment, a strong and statistically significant association was observed between transport mode and sentiment distribution (χ2(16) = 2752.93, p < 0.001), demonstrating clear differences in perception across transport modes, similar to the pattern identified in São Paulo. Within the university environment, a significant association was also found (χ2(4) = 24.65, p < 0.001), indicating that, even with a lower data volume, perceptual differences among transport modes are present in the university setting.
4.3. Evaluation in Lisbon
Figure 5 presents the sentiment analysis results for Lisbon, highlighting the perception of each transport mode within the city environment and of each mode group when comparing the general urban setting with the university environment.
From a European perspective, Lisbon presented a more favorable evaluation of active transport modes, particularly bicycles. Public transport also received a more favorable evaluation than individual motorized modes. Overall, the results indicated a pattern of more positive sentiment toward more sustainable transport modes. Light rail transit was excluded from the study due to naming ambiguities in European Portuguese.
Analyzing just the university environment,
Figure 5c shows the results of sentiment analysis conducted for Lisbon considering the overall perception of each mode group of transport. When compared with the general city environment, a more positive assessment was observed regarding active modes, particularly bicycle use (53%), according to the results. Public transport also received a more positive overall evaluation than in the city environment. Furthermore, sentiment regarding individual motorized modes was also slightly less negative in this context.
Finally, it is important to note that in Lisbon’s university environment, limited data was collected, especially regarding active modes, affecting both the reliability and feasibility of analyzing some transport modes. However, a more positive perception of more sustainable mode groups was observed within the university context.
For Lisbon, the chi-square test of independence confirmed the significance of the sentiment analysis across both contexts. In the city environment, a statistically significant association was identified between transport mode and sentiment distribution (χ2(14) = 1276.86, p < 0.001), indicating clear differences in perception across transport modes within the urban context, although with lower intensity compared to São Paulo and Rio de Janeiro, possibly reflecting differences in data volume or contextual factors. In the university environment, the test also indicated a statistically significant association (χ2(4) = 17.90, p < 0.01). However, the lower data volume and reduced variability in this setting suggest that this result should be interpreted with caution, as the smaller sample may limit the robustness of the associations identified, even if differences in perceptions across transport modes are still observable within the university context.
4.4. Evaluation in Porto
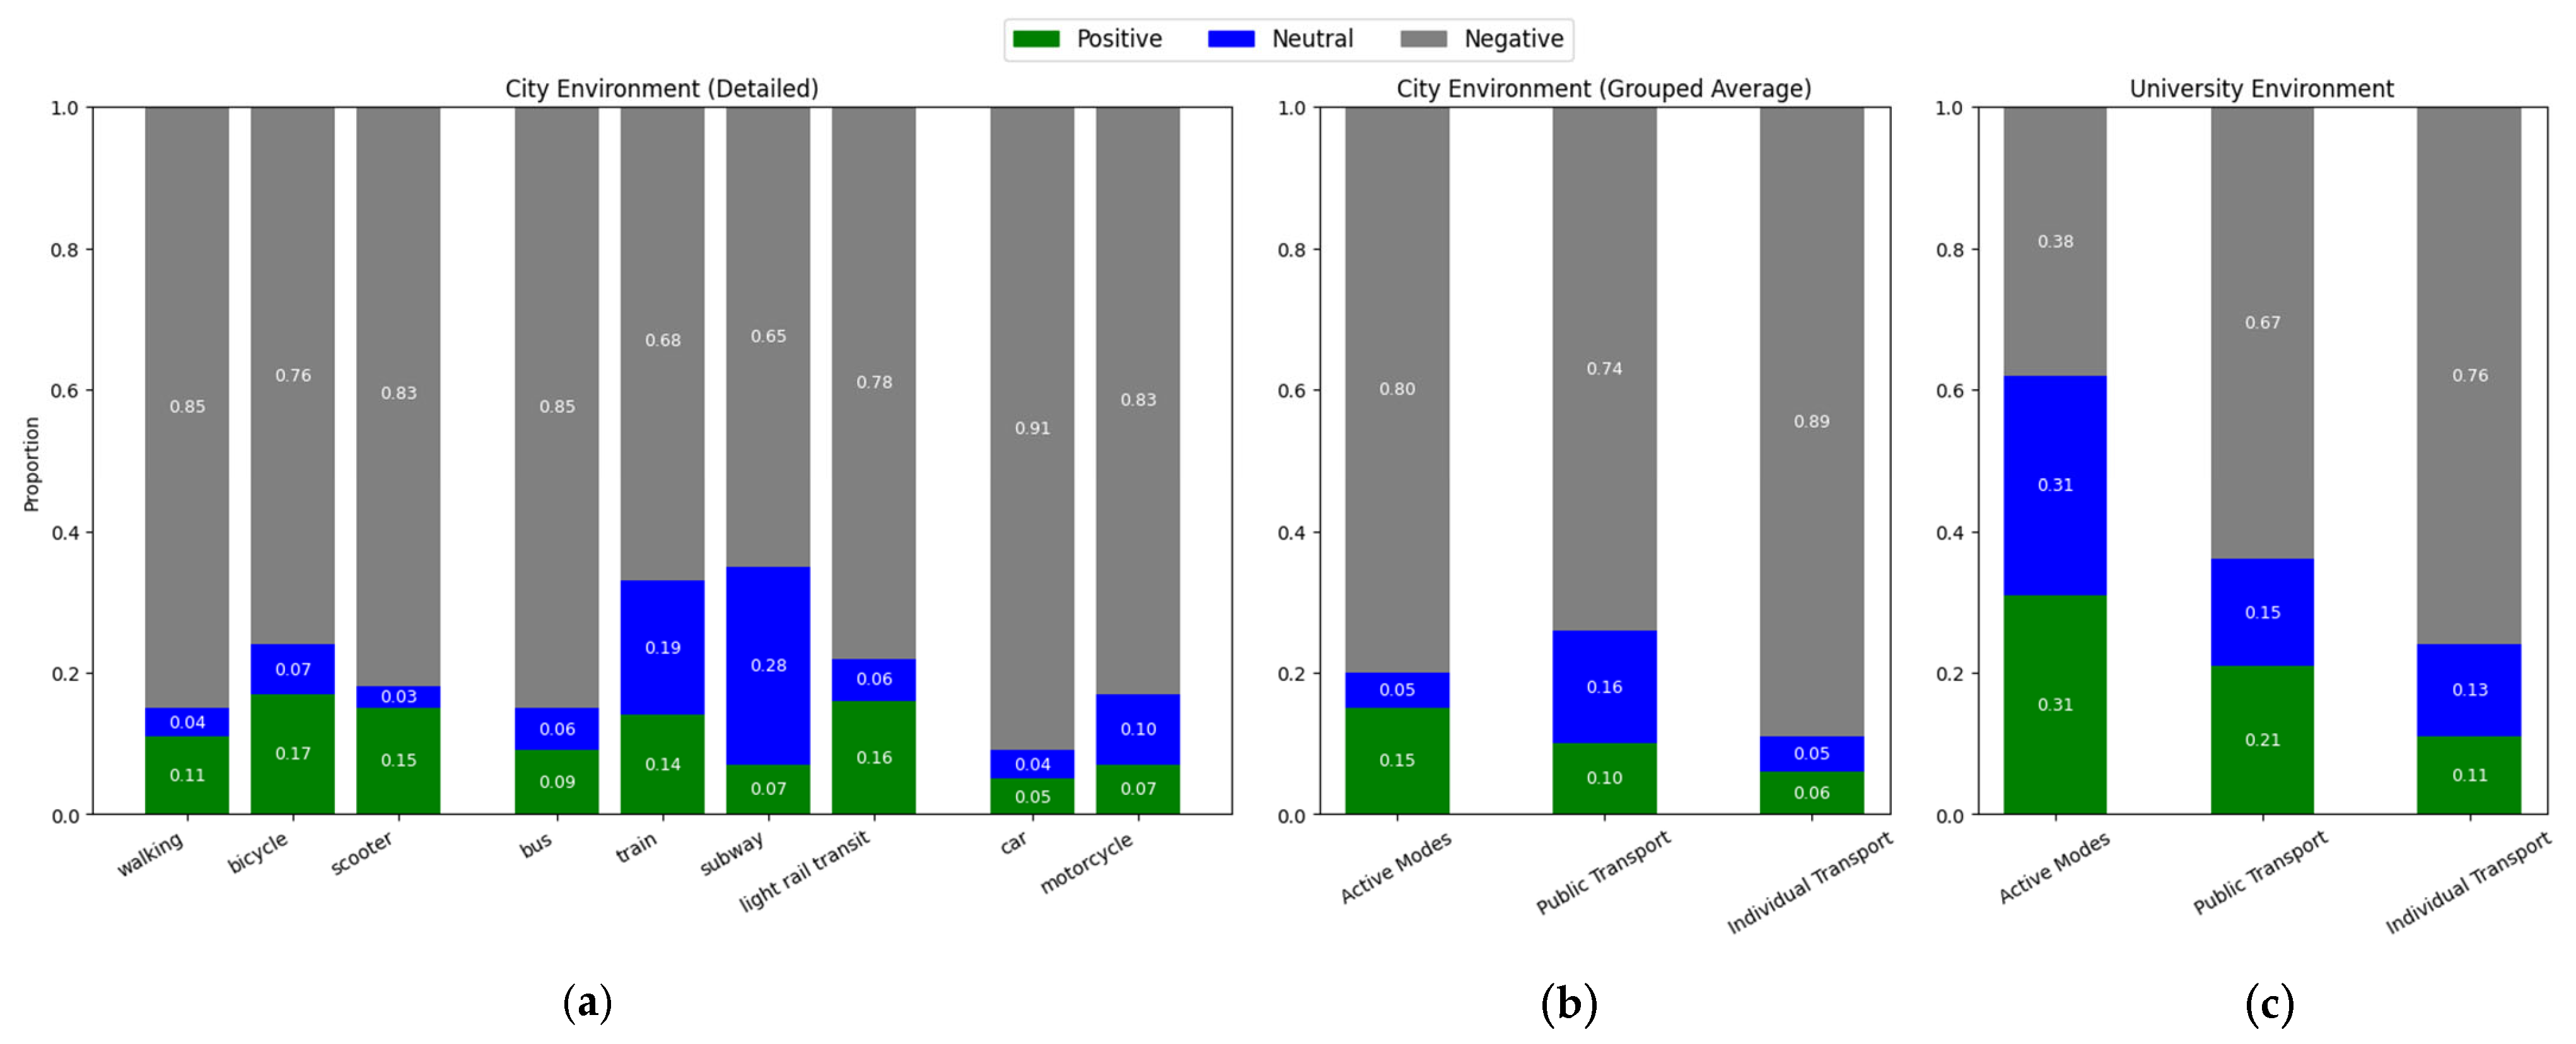
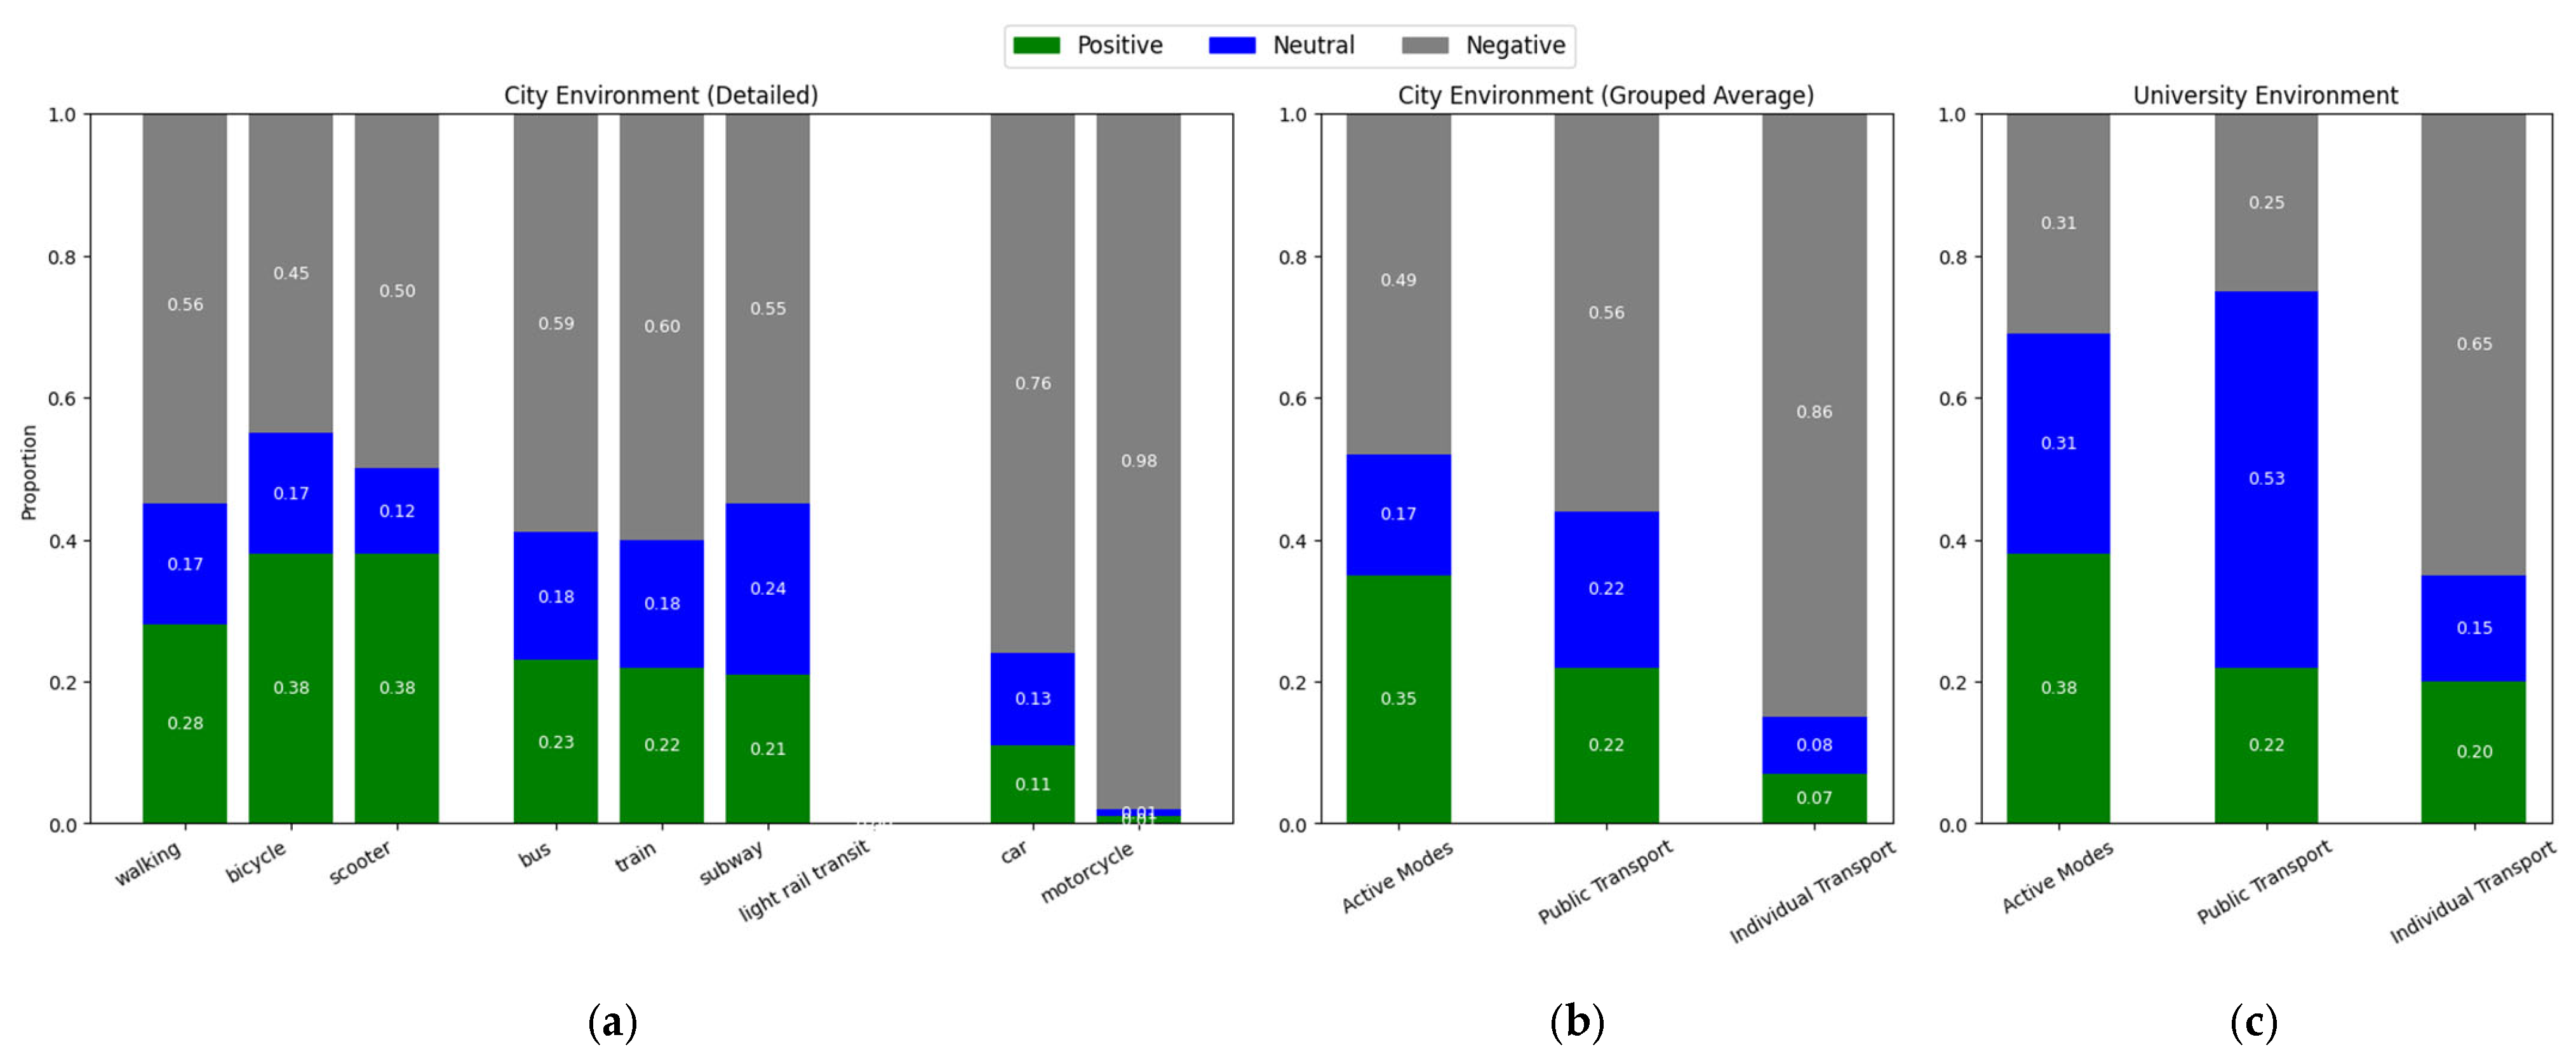
Figure 6 presents the results of the sentiment analysis conducted for Porto, reflecting the perception of each transport mode within the city environment and including the same comparison between mode groups as made for the other cities.
From another European perspective, according to
Figure 6a,b, Porto also showed a more favorable evaluation of active transport modes, particularly bicycles and scooters. Public transport once again received a more favorable evaluation than individual motorized modes. Moreover, the results also reveal a stronger pattern of positive sentiment toward active modes and public transport compared to individual motorized modes.
Moreover, focusing exclusively on the university environment,
Figure 6c presents the sentiment analysis results for Porto, reflecting overall perceptions of each mode group of transport. In this case, active transport modes were analyzed and presented a more positive evaluation within the city environment; however, the reliability of the results is low due to the limited amount of data collected.
Equally important, compared to the general city environment, more non-negative sentiment was observed regarding the use of public transport. In addition, a pattern of more positive sentiment about public transport than individual motorized modes was subtly repeated, even with the most positive car evaluation.
Similarly, for Porto, the chi-square test of independence indicated a statistically significant association between transport mode and sentiment distribution across both contexts. In the city environment, a significant association was identified (χ2(14) = 705.96, p < 0.001), revealing differentiated perceptions across transport modes, although with lower intensity than in the other cities, consistent with the smaller data volume collected. In the university environment, the test also showed a significant association (χ2(4) = 15.16, p < 0.01). Nonetheless, this result should also be interpreted with caution as the limited data volume and reduced variability in the university context may constrain the robustness of the associations identified, even though differences in perceptions across transport modes are still observable.
4.5. Additional Exploratory Analyses
Based on the analyses already conducted, numerous possibilities exist for advancing insights using social media data in the context of sustainable mobility. These possibilities extend across different cities, contexts, and transport modes, particularly when combining sentiment analysis techniques with topic modeling approaches.
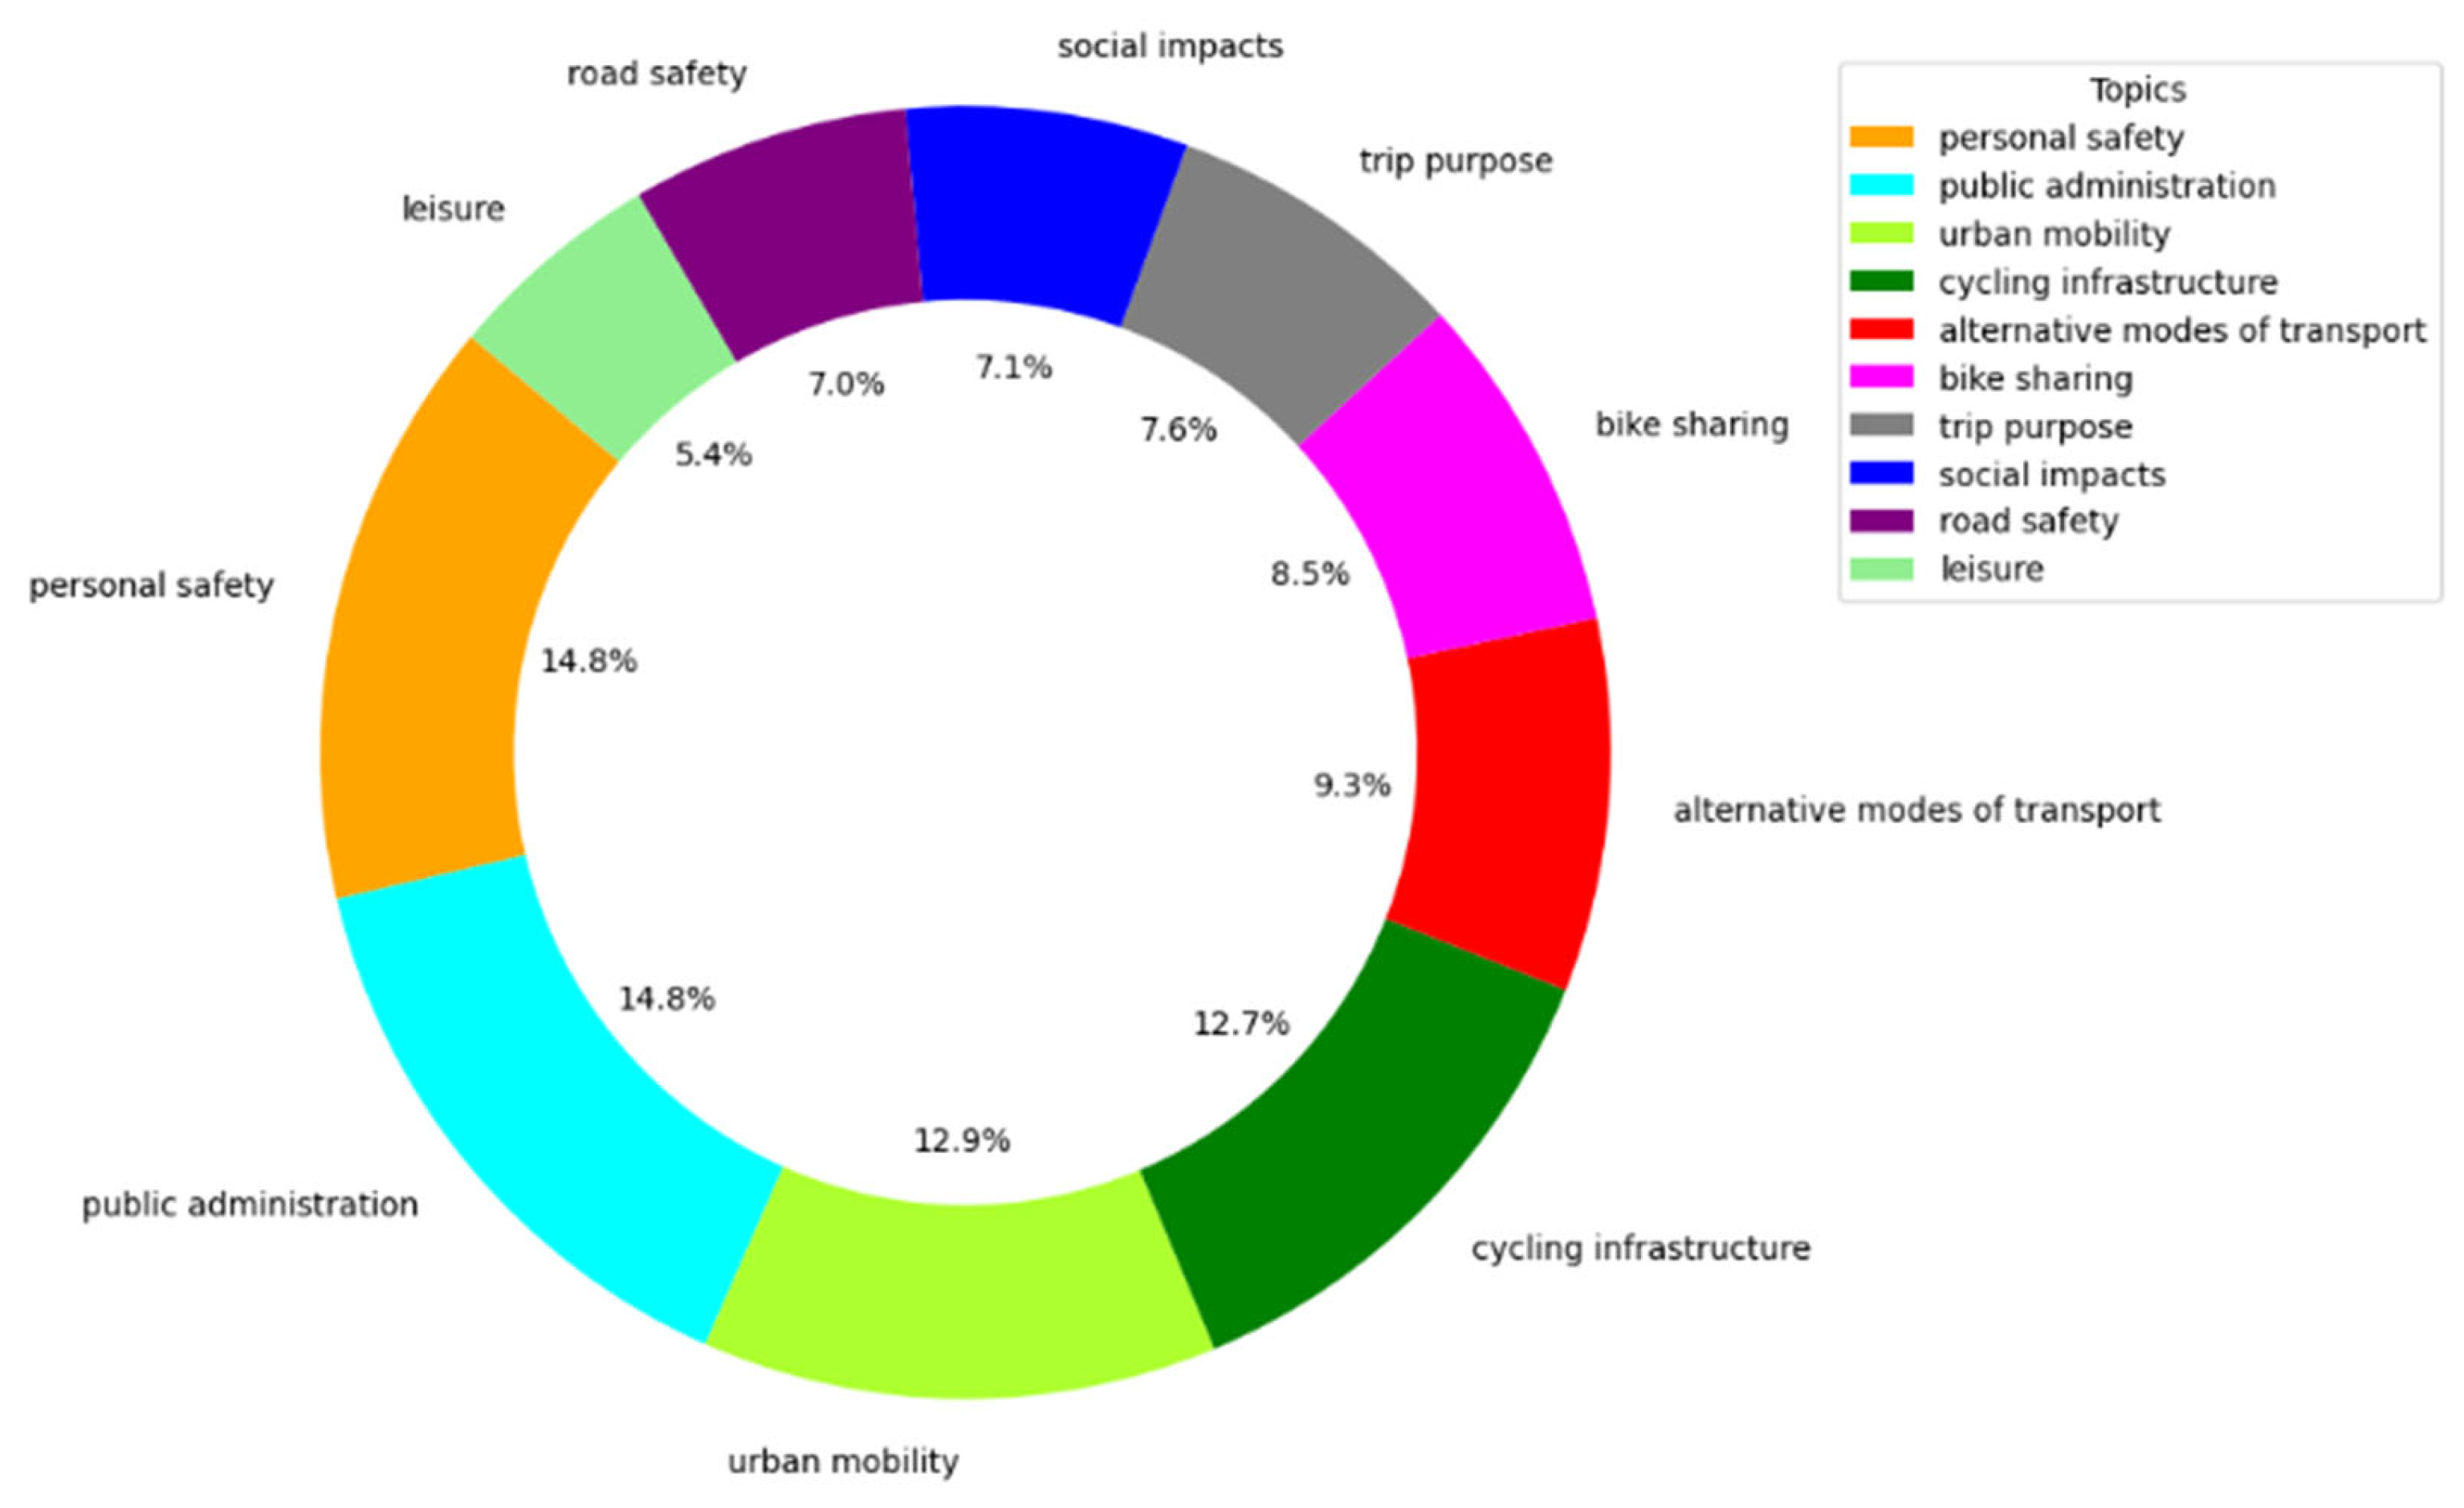
As an exploratory analysis and to partially address the low reliability of sentiment analysis for active transport modes within university contexts—due to the limited number of tweets collected—Latent Dirichlet Allocation (LDA) topic modeling was applied to bicycle-related tweets in São Paulo (n = 1412) to investigate the main topics mentioned by users regarding bicycle use in the city environment. It is noteworthy that, in this specific case, São Paulo presented a more positive perception of bicycle use in the general city context than in the university environment, providing insights into elements that could potentially be extended to university campuses to foster active mobility.
Figure 7 shows the distribution of the main topics identified, with more than half concentrated in four key themes: personal safety, public administration, urban mobility, and cycling infrastructure.
This distribution highlights user concerns regarding safety while cycling, the role of public authorities in promoting and managing cycling conditions, the integration of bicycles within the broader urban mobility system, and the availability and quality of infrastructure to support cycling in the city environment.
Additionally,
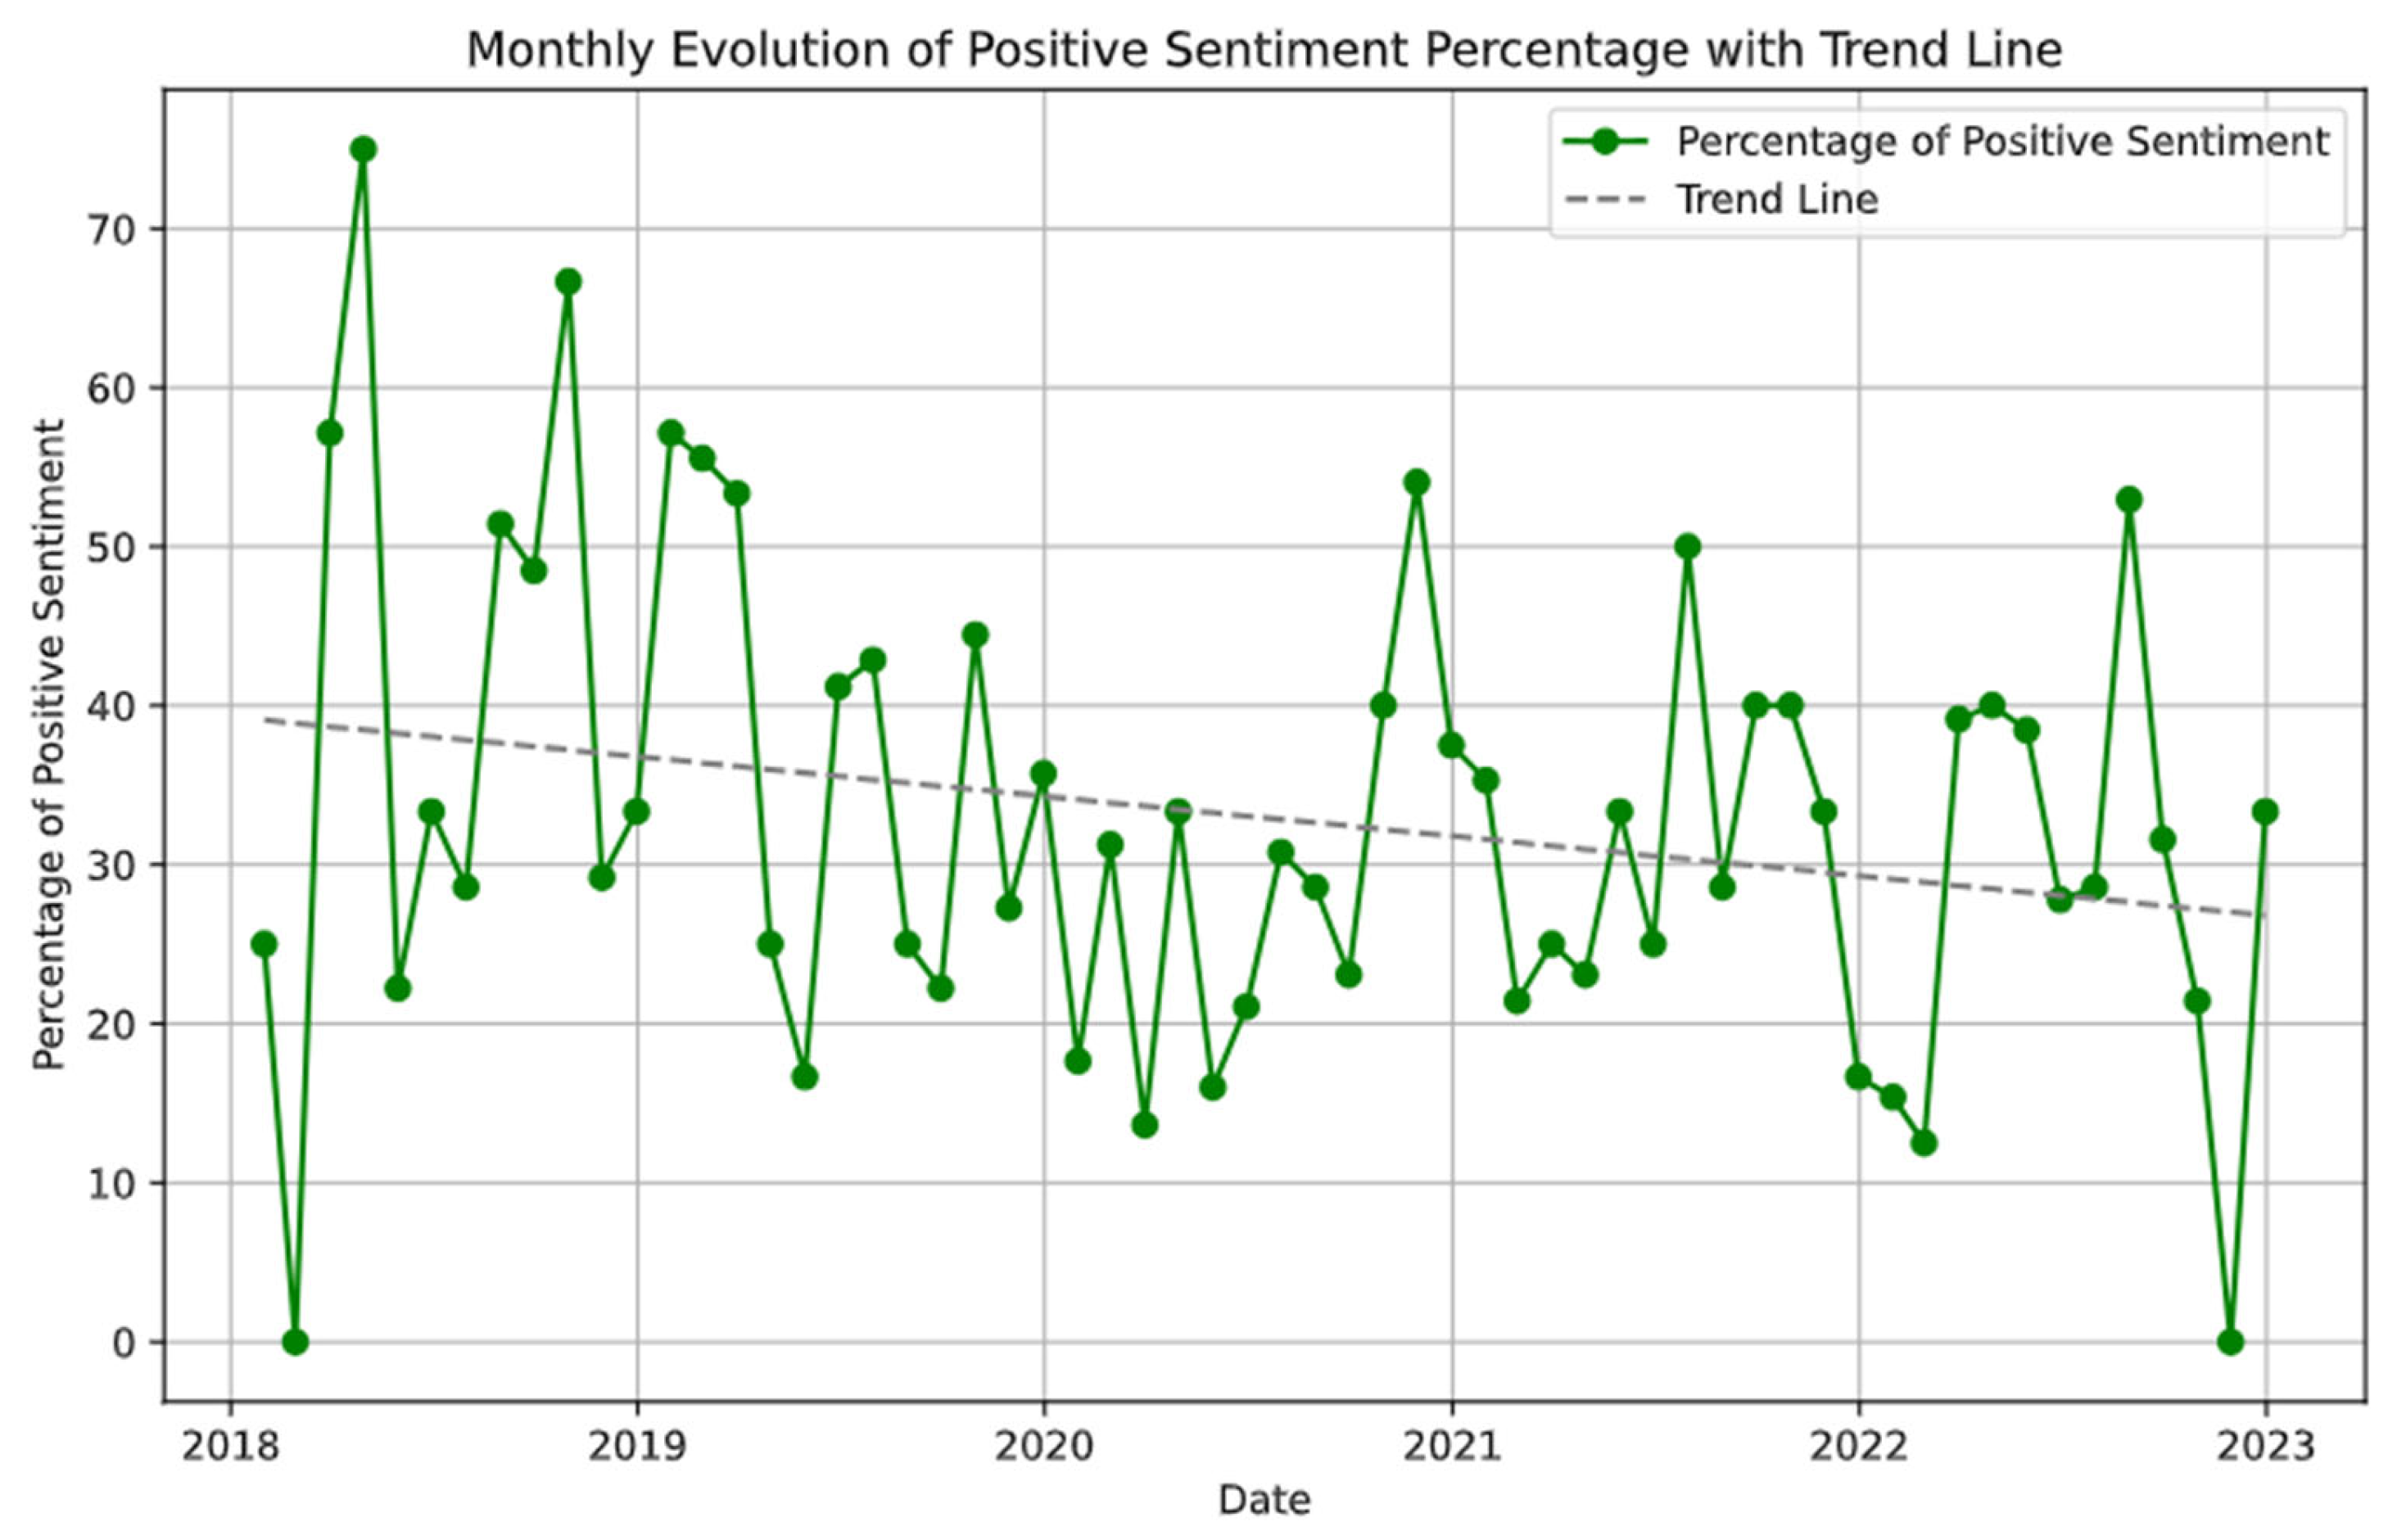
Figure 8 presents the monthly evolution of positive sentiment towards bicycle use in São Paulo, illustrating a downward trend over the analyzed period, which coincides with the pandemic period when the use of bicycles may have intensified due to restrictions on public transport.
Furthermore,
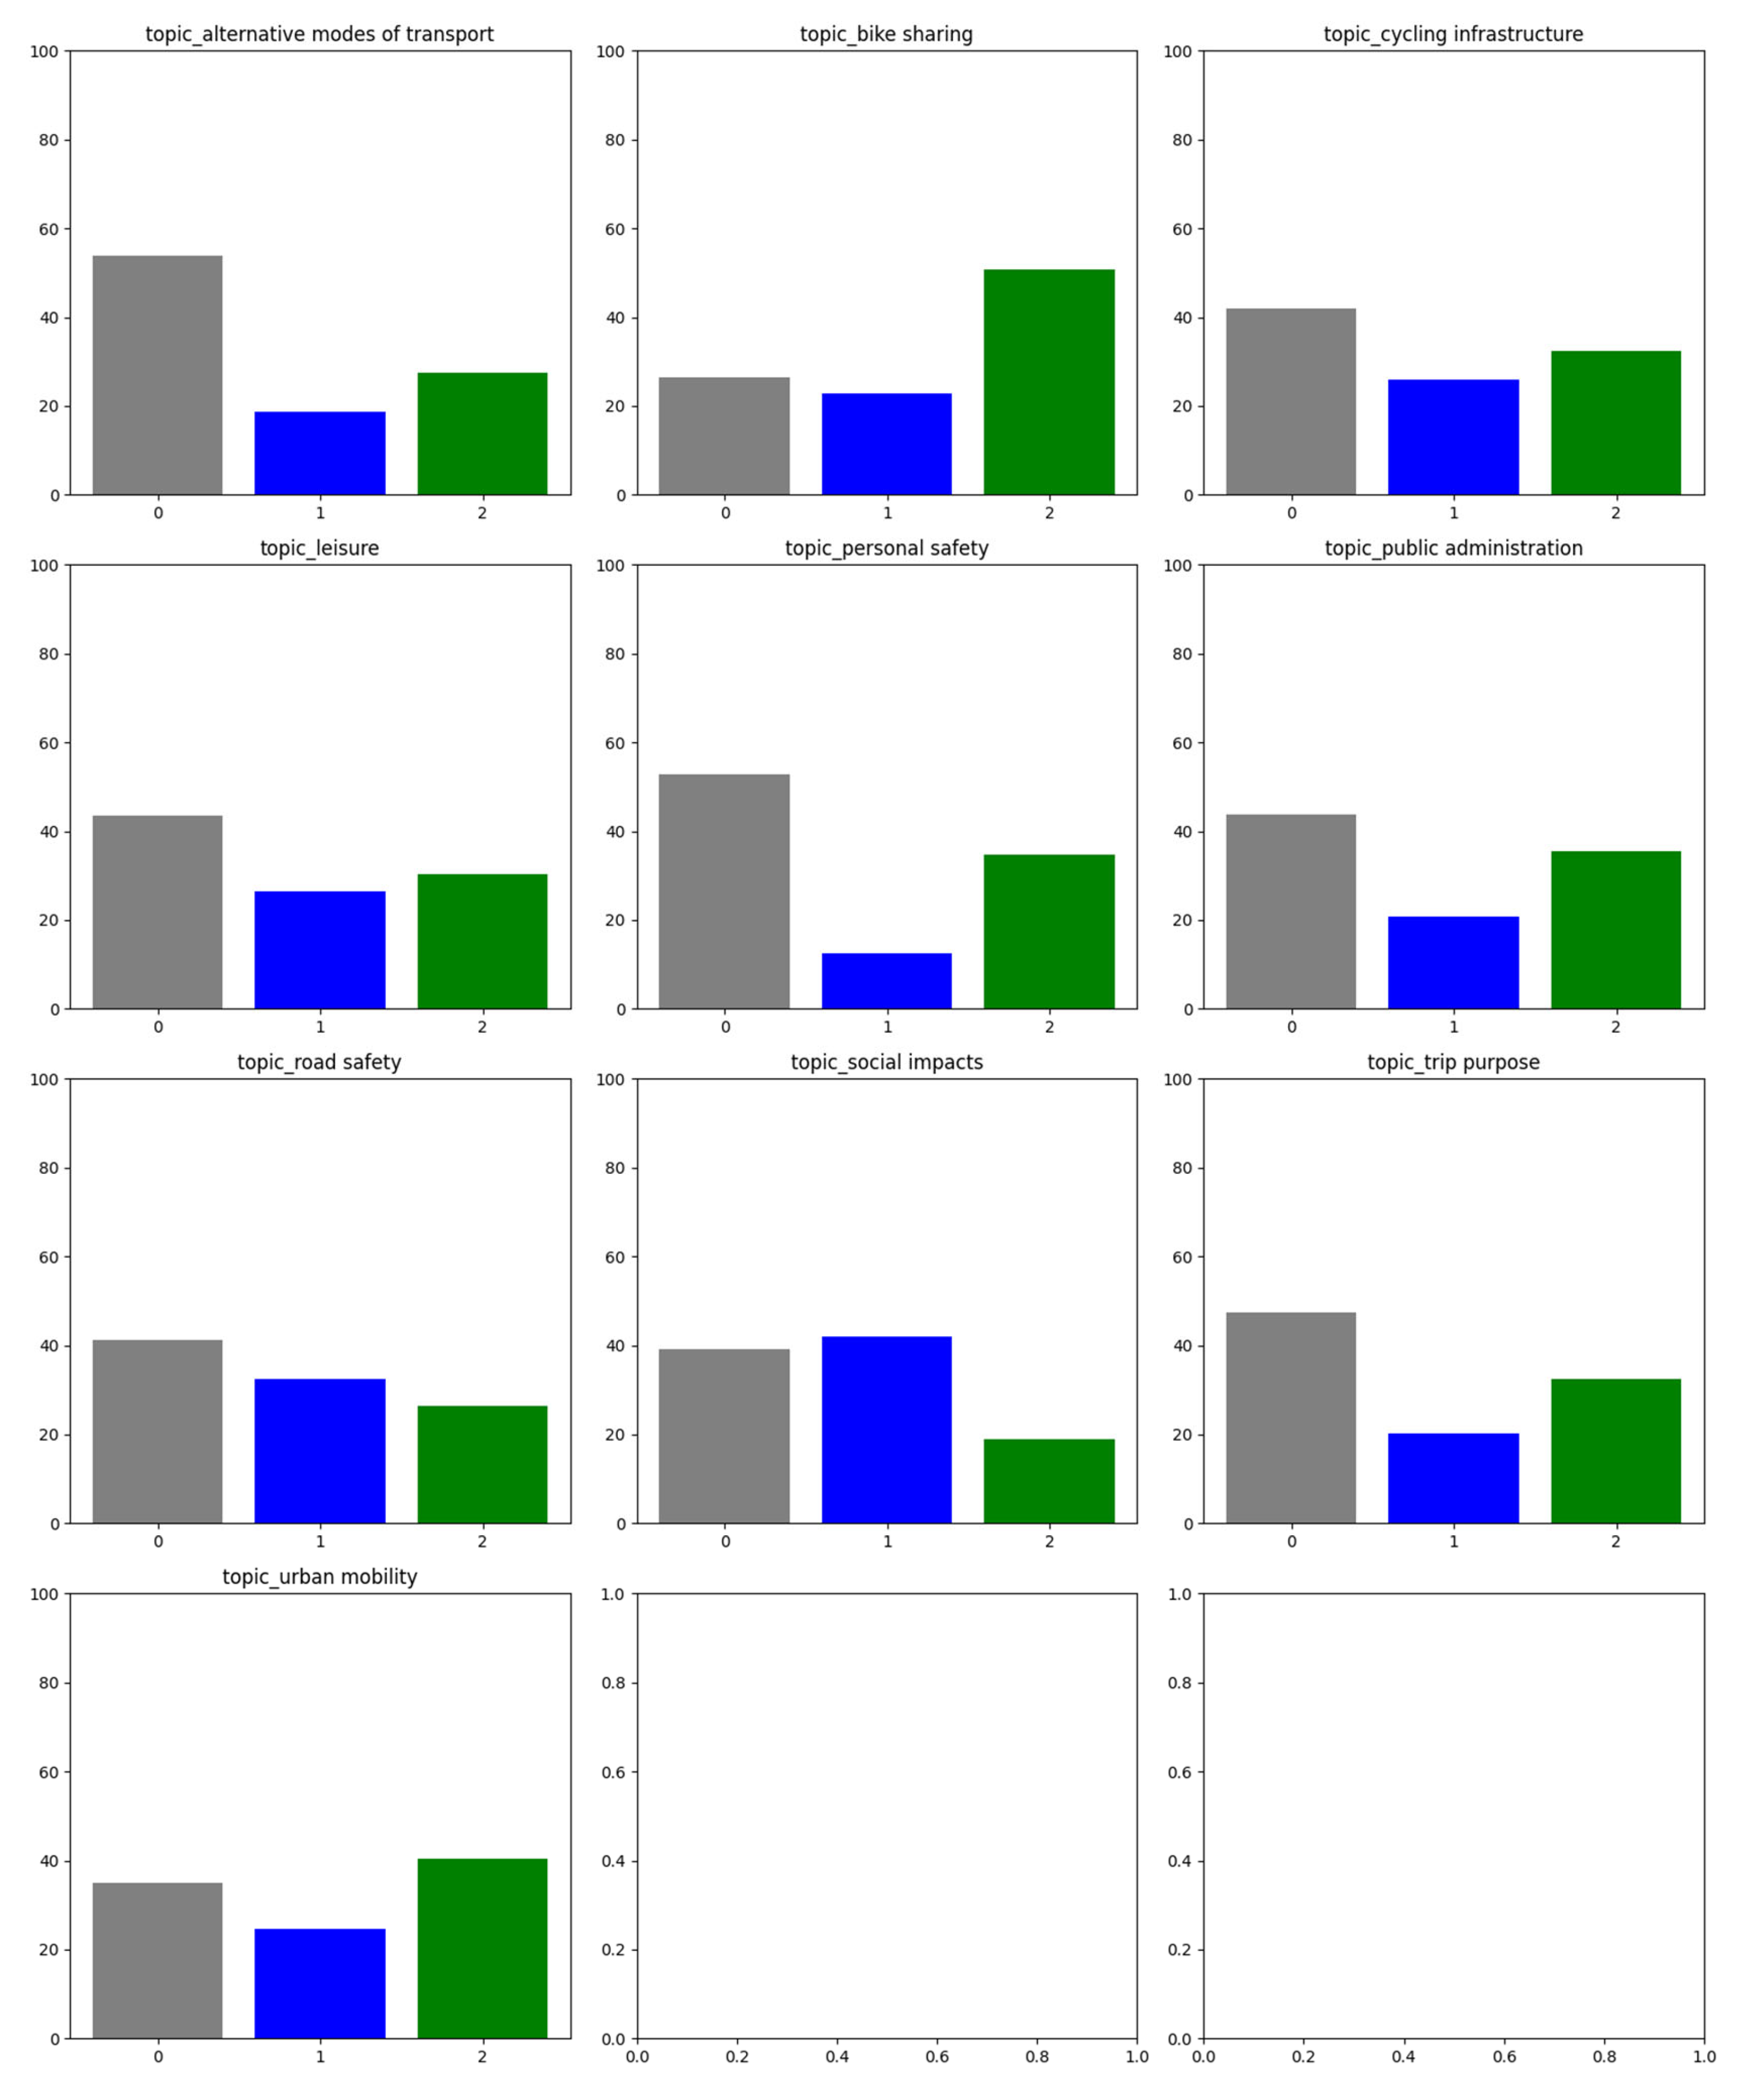
Figure 9 shows the intersection between sentiment analysis and topic modeling for bicycle-related tweets, highlighting how certain topics contribute more positively or negatively to overall sentiment. Notably, mentions associated with bike-sharing services show a more positive perception, suggesting that such initiatives could represent important strategies for promoting active mobility within university contexts.
Overall, this exploratory analysis highlights how the integration of sentiment analysis with topic modeling can generate targeted insights to identify opportunities for promoting sustainable mobility, including strategies that can be tailored to university environments.
5. Discussion
The results of this study highlight the potential of sentiment analysis as a tool for understanding public perceptions of different transport modes in urban environments, particularly within university campuses. The findings from São Paulo, Rio de Janeiro, Lisbon, and Porto reveal several key insights into the public attitudes toward sustainable mobility options.
In both Brazilian cities, a discernible preference is observed for public transport and active modes of transport over individual motorized modes. This positive sentiment toward sustainable modes suggests significant potential and an opportunity for promoting these options. The data from university environments further support this finding, showing a particularly positive sentiment towards bicycle use in São Paulo, and a generally favorable view of public transport in both cities. This indicates that universities can serve as pivotal hubs for encouraging sustainable transport behaviors.
The analysis of Lisbon and Porto provides a European perspective, where there is a more positive sentiment toward active modes of transport, particularly bicycles. Public transport also received a favorable evaluation compared to individual motorized modes. The data from university environments in these cities corroborate the overall city data, indicating a marked environment for promoting sustainable transport solutions in these types of trip generation hubs.
Comparing the cities, it becomes evident that, while there are cultural and infrastructural differences, the overall trend points towards a growing acceptance and preference for sustainable mobility options. This is a positive indication for policymakers and urban planners who aim to reduce greenhouse gas emissions and promote healthier, more sustainable cities.
The use of sentiment analysis in this study demonstrates its effectiveness in capturing real-time public opinions and experiences. This can aid in tailoring transport policies to better meet the needs and preferences of the population. Additionally, the study underscores the importance of addressing behavioral change, as emphasized by Banister [
6], as a critical component for achieving sustainable mobility.
The findings of this study align with the theoretical framework and the literature reviewed, reinforcing the role of universities as important trip generation hubs with the capacity to foster sustainable mobility behaviors. The consistent pattern of higher positive sentiment toward active and public transport modes within university contexts observed here supports the theoretical perspective that sentiment, as an indicator of user perception, can influence behavioral intentions and, ultimately, mobility choices. This interpretation aligns with behavioral change theories, such as the Theory of Planned Behavior, which suggests that attitudes and perceptions influence behavioral intentions and subsequent actions, providing a conceptual foundation for using sentiment as an indicator of mobility choices.
This connection emphasizes the relevance of using sentiment analysis as a tool for understanding perceptions that may drive modal shifts toward sustainable alternatives, aligning with prior studies while addressing the identified gap in exploring these dynamics specifically within university environments. Additionally, the variation in sentiment patterns across cities with different infrastructural and cultural characteristics illustrates the necessity for context-sensitive mobility planning, as suggested in the reviewed literature, supporting targeted strategies for promoting active and public transport modes within these settings.
While the findings offer valuable insights into public perceptions of transport modes, several limitations and potential confounding factors must be considered. First, transport culture—such as modal availability, historical investments, and safety perceptions—varies considerably across cities and could influence sentiment independently of actual service quality. Second, Twitter users tend to be younger, more urban, and more digitally engaged, which may not reflect the broader population’s sentiment.
This demographic bias could lead to an overrepresentation of perceptions from specific user groups while underrepresenting others, potentially influencing the sentiment distributions observed for different transport modes within the environment under study. For example, the more positive perception toward active modes identified in this research may, in part, reflect the fact that younger individuals—who are more active on social media—also represent a larger share of users of these transport modes. However, it is important to note that within university environments, this demographic bias is partially mitigated by the fact that younger populations are precisely the primary target group for potential strategies aimed at promoting sustainable mobility. These limitations should be considered when interpreting the findings and their applicability to broader populations.
About the model, it should also be noted that inter-rater reliability metrics were not calculated for the manual classification process in this study, as the dataset was labeled by a single researcher. This represents a methodological limitation, as assessing inter-rater reliability is important to ensure consistency and transparency in manual classification. Future studies should consider involving multiple reviewers and reporting inter-rater reliability metrics to strengthen the robustness of the manual labeling process.
Potential misclassifications in sentiment analysis, particularly when distinguishing neutral sentiments from adjacent classes, may influence the sentiment distributions presented in this study. This limitation is amplified when applied to smaller datasets, as higher randomness in these contexts can increase variability in sentiment distribution outcomes. This factor should be considered when interpreting the findings and their implications for mobility analysis.
In this study, a support vector classifier (SVC) combined with a TF-IDF Vectorizer was used for sentiment analysis due to its interpretability, balanced performance, lower computational demands, and ease of replication in large-scale social media datasets. However, it is acknowledged that transformer-based models such as BERT have the potential to capture richer contextual and semantic nuances in text data, and exploring these advanced models could enhance sentiment classification performance in future mobility-related studies, particularly as computational resources and access to pre-trained models continues to expand.
Additionally, refining the keyword strategy by incorporating specific academic terms or references to known university zones could further enhance data quality when analyzing mobility perceptions within the studied environments. Such refinement may increase the volume of relevant data collected, thereby expanding the dataset available for analysis while ensuring that the findings remain applicable.
It is also important to acknowledge that this study did not satisfactorily account for the actual quality, availability, or recent policy changes related to transportation infrastructure, which could influence public sentiment toward different transport modes. Approaches such as topic modeling, as applied in the exploratory analysis, may assist in identifying nuances that influence sentiment toward different transport modes across diverse contexts in each city.
Moreover, sentiment classification models trained in Portuguese are sensitive to regional expressions and informal language use, which may affect consistency between Brazilian and European Portuguese contexts. The lack of integration between user-generated content and the actual demand for transportation also limits the analytical depth of mobility research. An empirical validation in this area would enhance the contribution of the research.
In addition, social media platforms operate through engagement-driven algorithms that tend to amplify polarizing content, thereby distorting public sentiment and reducing data representativeness. Access restrictions, governance changes, and corporate interests further compromise data transparency and hinder the replicability of studies. These factors pose significant risks when such platforms are used as the sole basis for policy decisions.
Ethical concerns also emerge, including the absence of user consent and threats to privacy. The use of social media data, such as Twitter, can inadvertently bypass considerations of user privacy and consent, as individuals may not explicitly consent to the systematic analysis of their posts for research or policy purposes. For example, analyzing geotagged tweets can potentially reveal individual travel behaviors, posing risks to user anonymity. These ethical challenges underscore the need for careful anonymization procedures and strict adherence to ethical research practices when utilizing user-generated content [
42].
Despite these challenges, the general patterns observed—such as higher positive sentiment toward active and public transport modes—suggest promising avenues for application in other university settings. However, policy recommendations based on this approach should be context-sensitive and supported by complementary local data sources.
6. Conclusions
This research has successfully employed sentiment analysis to uncover public perceptions of various transport modes in major urban areas and university campuses in Brazil and Portugal. The study reveals a generally positive sentiment toward public transportation and active modes of transport, such as bicycles, across the studied cities. This sentiment is even more pronounced within university environments, indicating their potential as catalysts for promoting sustainable mobility.
Universities are identified as strategic hubs for fostering sustainable transport behaviors, with positive sentiment towards bicycles and public transportation supporting the implementation of targeted interventions to encourage sustainable commuting options.
Sentiment analysis has proven to be an important tool in understanding public opinions on transportation, providing actionable insights that can guide policymakers and planners in designing and implementing effective sustainable mobility strategies. Achieving sustainable mobility requires not only infrastructural changes but also a significant shift in public behavior and attitudes toward transportation. The positive sentiments toward sustainable modes suggest a readiness for such a shift, which can be improved through appropriate policies and initiatives.
Despite cultural and infrastructural differences, both Brazilian and Portuguese cities show similar trends in the acceptance of sustainable transport options, indicating a universal potential for promoting sustainable mobility, albeit with context-specific adaptations.
Future research should continue to leverage advanced machine learning techniques and expand the geographical scope to include more diverse urban environments. Additionally, incorporating other data sources, such as surveys and interviews, can complement sentiment analysis and provide a more comprehensive understanding of public attitudes toward sustainable mobility.
Finally, this study contributes to the field of sustainable mobility by demonstrating that sentiment analysis can be effectively used as a scalable, near real-time tool to capture public perceptions toward different transport modes, providing actionable insights for policy and planning. The consistent pattern of higher positive sentiment toward active and public transport modes across different cities and contexts highlights universities as strategic hubs for promoting sustainable mobility behaviors. Methodologically, this research advances the integration of sentiment analysis with transport studies, illustrating how social media data can inform evidence-based strategies while addressing practical challenges such as demographic biases and potential misclassification. These findings support the development of targeted interventions to encourage sustainable commuting in university settings, contributing to the broader transition toward healthier, low-carbon urban mobility systems.
