Article

The Effect of Blockchain Adoption on Corporate Sustainable Development Performance: Evidence from Chinese Listed Firms

1
School of Economics and Finance, Xi’an Jiaotong University, Xi’an 710069, China
2
School of Public Policy and Administration, Xi’an Jiaotong University, Xi’an 710069, China
3
Institute of “Belt and Road” Pilot Free Trade Zone, Xi’an Jiaotong University, Xi’an 710069, China
*
Author to whom correspondence should be addressed.
Sustainability 2025, 17(14), 6631; https://doi.org/10.3390/su17146631
Submission received: 14 June 2025 / Revised: 11 July 2025 / Accepted: 14 July 2025 / Published: 21 July 2025

Abstract

To respond to China’s sustainable development goals, this study uses a dynamic panel data set (2009–2023) and the PSM-DID model to examine how blockchain adoption impacts corporate sustainable development performance (CSDP). The results show that blockchain significantly enhances CSDP by 9.8–12.3%, primarily through two channels (reducing financing constraints by improving transparency and decreasing chairman-CEO duality) to optimize governance. Regional environmental regulation strengthens this relationship. Heterogeneity analysis reveals stronger impacts in unregulated industries, private firms, and central–western regions, while state-owned firms show policy-driven governance improvements. The study enriches the understanding of blockchain’s dual role in balancing efficiency and sustainability, offering insights for integrating digital technology into green policy frameworks.

1. Introduction

The urgent need for global sustainable development has become a catalyst for firms to adopt technologies that can harmonize economic growth with environmental stewardship and social responsibility. As the United Nations’ Sustainable Development Goals face a 12-year window for execution, industries across the globe are experiencing significant pressure to achieve a 45% reduction in carbon emissions by the year 2030. Blockchain, renowned for its decentralized ledger, the inherent immutability of its records, and its transparent nature, has emerged as a revolutionary instrument with profound implications for corporate governance and sustainability practices [1]. This kind of technology enables secure and traceable transactions, enhancing the credibility of information, which is a crucial factor in mitigating information asymmetry [2]. It also optimizes resource allocation [3] and fosters accountability—critical elements that are essential for advancing sustainable development goals in the corporate sector [4]. However, despite its theoretical potential, empirical evidence on how blockchain adoption influences corporate sustainable development performance (CSDP) is still relatively scarce [5]. This is especially true in emerging markets such as China, where institutional frameworks and strategies for environmental and digital transformation are evolving at a swift pace.
China, recognized as the world’s second-biggest economy and a principal actor in the global movement towards sustainability, offers a unique contextual setting for analysis. The country’s ambitious “Double Carbon” policy, which aims to peak carbon emissions by the year 2030 and achieve carbon neutrality by 2060, has opened up vast opportunities for green investment. This policy framework has sparked a surge in the demand for environmentally friendly projects and technologies. Furthermore, China’s strategic initiatives to bolster the digital economy, as evidenced by the “14th Five-Year Plan for Blockchain Development”, underscore the pivotal role that technology is expected to play in the nation’s future growth [6]. These initiatives not only highlight the importance of technological innovation but also signal a shift toward a more sustainable and digitally advanced economic model. However, Chinese listed firms are grappling with specific obstacles that could potentially be mitigated through blockchain adoption. These challenges include limited access to financing for green investments and internal governance complexities that may hinder the effective allocation of resources towards sustainable practices. The technical attributes of blockchain, such as its transparency, immutability, and decentralized nature, present promising solutions to these issues. Despite these potential benefits, the existing body of research has not extensively explored how blockchain can be leveraged to address these challenges and thereby improve CSDP. Consequently, there is a significant gap in understanding the role that blockchain adoption can play in fostering sustainability within the corporate sector of China.
Existing research and studies on blockchain in corporate settings primarily focus on financial applications, like supply chain finance and cryptocurrency [7], or narrow aspects of ESG (environmental, social, and governance) reporting [8], with limited attention to the holistic impact on CSDP across economic, environmental, and social dimensions [9]. Moreover, the mediating mechanisms—particularly financing constraints and internal governance processes linking blockchain adoption to CSDP—remain under-theorized, as evidenced by recent debates in sustainable operation research [10]. This theoretical gap persists despite documented evidence of blockchain’s capacity to reshape organizational governance structures in regulated industries [11]. Furthermore, the moderating role of institutional environments, including regional environmental regulations and policy frameworks, continues to be overlooked in empirical analyses of blockchain efficacy [12], particularly in contexts characterized by strong governmental oversight of sustainable development initiatives [13].
This study endeavors to bridge these scholarly voids by investigating the causal impact of blockchain implementation on CSDP among listed companies in China. Using a dynamic panel data set from 2015 to 2023, this study utilizes a difference-in-difference (DID) framework to establish causal inference, complemented by mediating and moderating effect analyses to disentangle the underlying mechanisms and contextual contingencies. Specifically, we address three core research questions: (1) Does blockchain adoption significantly improve CSDP? (2) Are financing constraints and internal governance key transmission channels for this effect? (3) How does regional environmental regulation modulate the association between blockchain adoption and CSDP?
The subsequent structure of this study is organized as follows. Section 2 theoretically explicates the mechanisms through which blockchain adoption influences CSDP and constructs an analytical framework grounded in institutional theory and resource-based view. Section 3 details the research design, encompassing the selection of research samples, data sources, econometric models, and methodological approaches employed. Section 4 presents the empirical findings, including baseline regression results, robustness checks, and causal inference validation. Section 5 conducts a multi-dimensional heterogeneity analysis, focusing on industry regulation intensity, ownership structure, and regional development levels, before exploring the mediating roles of financing constraints and internal governance mechanisms. Additionally, this section investigates the moderating effect of regional environmental regulations on the association between blockchain adoption and CSDP. Section 6 synthesizes the core conclusions of the study, derives policy implications for stakeholders, and outlines directions for future research.

2. Theoretical Framework

2.1. Blockchain Adoption and CSDP

2.1.1. Theoretical Foundations

The relationship between blockchain adoption and CSDP is rooted in the Triple Bottom Line (TBL) theory, which posits that firms must balance economic prosperity, environmental stewardship, and social equity [14]. Blockchain’s technological features—decentralization, immutability, and smart contract automation—address critical challenges in each dimension: (1) economic dimension: reduces transaction costs and information asymmetry, enabling efficient resource allocation for sustainable investment [15]—studies demonstrate blockchain’s role in optimizing financial flows while maintaining audit transparency [16]; (2) environmental dimension: enhances traceability of supply chain emissions and resource use, facilitating compliance with environmental regulations—research on green supply chains shows blockchain significantly improves carbon footprint monitoring in manufacturing sectors [17]; (3) social dimension: strengthens stakeholder trust through transparent reporting of social impacts, aligning with global ESG standards [18]—empirical evidence indicates that clustered institutional investors prioritize blockchain-enabled ESG disclosures to mitigate reputational risks [19].

2.1.2. Mechanisms of Direct Impact

Firstly, blockchain’s distributed ledger system improves operational efficiency by automating processes, leading to higher asset utilization and profitability. Additionally, blockchain enables new business models, like peer-to-peer energy trading, creating revenue streams from sustainable products or services. Based on this, we propose that blockchain adoption positively influences economic performance.
Secondly, environmental regulations increasingly require firms to disclose granular data on carbon footprints and pollution. Blockchain’s immutability ensures tamper-proof records of environmental inputs, reducing green-washing risks [20]. Higher data credibility enhances firms’ scores in ESG rating systems, directly elevating environmental performance [21]. Based on this, we propose that blockchain adoption positively influences environmental performance.
Thirdly, blockchain facilitates transparent tracking of social impacts, such as ethical sourcing and fair labor practices. Studies on digital governance frameworks demonstrate how decentralized technologies can standardize cross-border accountability mechanisms [22]. By enabling decentralized voting systems for stakeholder participation, blockchain also enhances corporate accountability, a principle aligned with innovations in organizational process modeling that prioritize stakeholder visibility [23]. Based on this, we propose that blockchain adoption positively influences social performance.
Combining the above mechanisms, we propose the following hypothesis:
Hypothesis 1.
Blockchain adoption significantly promotes CSDP.

2.2. Mediation Mechanisms

2.2.1. Financing Constraints

The alleviation of financing constraints by blockchain is rooted in the theoretical frameworks of information economics and transaction cost theory. Blockchain establishes an immutable firm data system through distributed ledger technology, covering multi-dimensional information such as financial performance, supply chain transactions, and ESG practices, which significantly reduces information asymmetry between firms and external investors—for example, in supply chain finance, blockchain can verify the authenticity of trade data in real time, helping financial institutions assess creditworthiness more accurately and reduce adverse selection risks. The automated execution feature of smart contracts further optimizes financing processes by triggering loan disbursements, interest settlements, and other links through pre-programmed rules, eliminating time delays and operational costs caused by traditional manual reviews, particularly providing more efficient financing channels for small and medium-sized firms. Additionally, blockchain-supported asset tokenization expands firms’ collateral scope, enabling entities lacking traditional tangible assets to obtain financing through intangible assets. Based on this, we propose the following:
Hypothesis 2.
Blockchain adoption enhances CSDP by alleviating financing constraints.

2.2.2. Internal Governance

Based on agency theory and organizational control theory, blockchain optimizes corporate internal governance structures through multi-dimensional mechanisms. Firstly, blockchain’s immutability creates a “hard constraint” on management behavior, significantly increasing the costs of agency problems such as financial data fraud and resource misappropriation [24]. Meanwhile, smart contracts can directly link executive compensation to ESG targets, aligning management interests with shareholders’ long-term objectives [25]. Secondly, the decentralized autonomous organization model supported by blockchain reconstructs the decision-making mechanism through a token voting system, allowing stakeholders such as shareholders and employees to directly participate in major issues, reducing decision-making lag and information filtering problems in traditional hierarchical structures [26]. Additionally, blockchain platforms provide real-time governance tools for boards of directors—independent directors can retrieve supply chain carbon emissions, community investment, and other data via blockchain to dynamically monitor management’s sustainable development initiatives. Based on this, we propose the following:
Hypothesis 3.
Blockchain adoption promotes CSDP by improving internal corporate governance.

2.3. Moderating Effect of Environmental Regulation

Institutional theory posits that external regulatory environments critically influence technological innovation diffusion [27]. In China, regional environmental regulations, measured as industrial pollution control investment or industrial added value, create a policy-driven pressure-incentive framework for blockchain adoption in sustainable development: (1) compliance cost reduction: stricter environmental regulation increases firms’ environmental compliance costs, motivating them to adopt blockchain for cost-efficient data management [28]; (2) transparency demands: regulatory requirements for public ESG disclosures align with blockchain’s traceability features; (3) policy synergy: high-ranked environmental regulation regions often offer targeted subsidies for green technologies, creating institutional complementarities between emission control and digital transformation [29]. Based on this, we propose the following:
Hypothesis 4.
Tightened regional environmental regulation significantly reinforces the positive effect of blockchain adoption on CSDP.

3. Research Design

3.1. Data Source and Sample Selection

This study designates Chinese A-share listed companies on the Shanghai and Shenzhen Stock Exchanges spanning the period from 2009 to 2023 as the initial research sample. To maintain sample representativeness and data integrity, we exclude firms in the financial and insurance sectors, those classified as ST or *ST (indicating special treatment for financial distress), and companies undergoing significant core business restructuring during the observation period. Furthermore, observations with abnormal data values or severe missing information are filtered out, yielding a final data set comprising 16,368 valid firm-year observations. This sample selection protocol adheres to the data quality control benchmarks commonly employed in longitudinal corporate finance research [30].
In terms of data sources, the environmental performance and social performance indicators are taken from the Wind database, which has been widely adopted in sustainability research due to its comprehensive coverage of corporate environmental disclosures [31]. The data related to green technology innovation are derived from the China Research Data Service Platform (CNRDS), a methodology consistent with recent technology innovation assessments in emerging markets [32]. The remaining variable data are collected from the CSMAR database, a common practice in Chinese financial empirical studies.
The measure of the intensity of environmental regulation is “the ratio of investment completed in industrial pollution control to industrial added value”, and the data are provided by the National Bureau of Statistics on an annual and provincial basis. This metric reflects the spatial–temporal heterogeneity of regulatory pressures, a critical factor identified in environmental policy effectiveness research [33].
To gauge the substantive extent of corporate blockchain use, we eschew simple keyword counts and instead implement a two-stage machine-learning-assisted content analysis of annual reports (including MD&A sections) and public announcements for all A-share listed firms from 2009 to 2023. In the first stage, eleven synonymous expressions—such as “block-chain” and “distributed ledger”—are extracted via regular-expression filters to create a candidate sentence pool. In the second stage, each sentence is processed by a supervised semantic classifier that assigns it to one of three adoption tiers, culminating in Level 3, which denotes organization-wide or core-process integration. The classifier, trained on 2000 manually labeled sentences, attains an out-of-sample F1-score of 0.92 under five-fold cross-validation, demonstrating a strong ability to distinguish mere buzzwords from genuine technological uptake. For external validation, the classification outcomes are cross-referenced with firms’ blockchain-related patent filings housed at the China National Intellectual Property Administration and with membership rosters of major consortia such as Hyperledger and the Enterprise Ethereum Alliance, yielding an average concordance rate of 88.6 percent; any discrepancies are manually adjudicated. This hybrid approach—combining text classification with external verification—captures both the depth and functionality of blockchain implementation, thereby ensuring that the measure accurately reflects the technology’s real deployment within firms.

3.2. Variable Definitions

3.2.1. Dependent Variable

Corporate sustainable development performance (CSDP) serves as the dependent variable. Following the Triple Bottom Line framework, CSDP integrates economic, environmental, and social dimensions through a composite index constructed from both internal financial data and external third-party evaluations. (1) Economic performance is proxied by return on assets (ROA), capturing a firm’s profitability and economic benefits. (2) Environmental performance is represented by the environmental score (ENV) from Huazheng’s ESG rating system, which reflects a firm’s environmental management and outcomes [34]. (3) Social performance is gauged by the social score (SOC) in the same Huazheng ESG system, indicating the fulfillment of corporate social responsibility [35].
Finally, based on the entropy weight method, the indicators of the above three dimensions are weighted to calculate the comprehensive sustainable development performance index (Table 1). The specific calculation steps will be shown in the following formula.
Step 1: Data standardization (for positive indicators)
X i j = X i j min X 1 j , , X m j max X 1 j , , X m j min X 1 j , , X m j i = 1,2 , , m ; j = 1,2   , , n
Step 2: Feature proportion calculation
P i j = X i j i = 1 m X i j
Step 3: Entropy value calculation
e j = 1 ln m i = 1 m P i j ln P i j
Step 4: Coefficient of variation calculation
d j = 1 e j
Step 5: Entropy weight assignment
W j = d j j = 1 n d j
Step 6: CSDP index construction
C S D P i t = 0.306 × R O A i t + 0.463 × E N V i t + 0.231 × S O C i t

3.2.2. Independent Variable

Blockchain adoption (BA) is the study’s focal independent variable. This variable is the interaction term between the event dummy variable Treat and the time dummy variable Time, reflecting the blockchain adoption situation of the firm. The initial year of implementing blockchain and each year thereafter are considered as the year in which blockchain is adopted, with a value of 1. For the remaining years without implementation and sample companies without implementation, a value of 0 is assigned [36].

3.2.3. Mediating Variables

Two mediating variables in this study are employed. The first is financing constraints (FC). Introduced as an intermediary variable and measured using the corporate financing constraints index at the firm level. This index takes into account factors such as a firm’s cash flow situation [37], asset structure [38], profitability [39], and external financing environment [40], providing a comprehensive reflection of the constraints firms face in the financing process. The larger the financing constraints index value, the more severe the financing constraints faced by the firm, and the weaker the ability to coordinate internal and external funds, which may inhibit its willingness to take risks and investment decision flexibility. By introducing this indicator, this study aims to examine whether financing constraints play a mediating role between fintech and corporate risk-taking, thereby revealing the underlying mechanism through which fintech development influences corporate behavior.
The second one is internal governance. To deeply analyze the potential impact pathway of blockchain adoption on CSDP, we introduce the internal governance level of firms as an intermediary variable and use Dual, whether the general manager and chairman are the same individual, as the measurement indicator. When these two positions merged (Dual = 1), the concentration of management power may lead to weakened supervision mechanisms and reduced decision-making flexibility, thereby inhibiting the firm’s long-term investment in environmental and social responsibilities [41]. Conversely, the separation of two positions (Dual = 0) optimizes the governance structure through power balance and enhances the efficiency of implementing sustainable development strategies [42]. This indicator aims to examine whether internal governance mediates the relationship between blockchain adoption and CSDP, revealing the inherent logic of how blockchain affects corporate behavior by improving governance mechanisms.

3.2.4. Moderating Variable

Regional environmental regulation (ER) is measured by the ratio of industrial pollution control investment to industrial added value, published annually by the National Bureau of Statistics at the provincial level. This indicator reflects the strictness of regional environmental policies and their constraints on corporate operations.

3.2.5. Control Variables

In this study, control variables were selected based on relevant literature to rule out other factors that may affect CSDP. Specifically, the corporate leverage ratio (Lev) is used to measure a firm’s financial leverage, reflecting its capital structure and debt repayment pressure; profitability (ROE) is measured by return on net assets to reflect a firm’s profit-generating capacity. The firm’s establishment period (FirmAge) is included as an indicator of its operational history and development maturity. Additionally, the size of the board (Board), represented by the number of board members, reflects the complexity of the corporate governance structure, while the proportion of independent directors (Indep) reflects the independence and supervisory role of board governance. Ownership concentration is measured by the shareholding ratio of the three shareholders (Top3); the managerial shareholding ratio (Mshare) reflects the degree of alignment between management interests and firm interests. By setting the above control variables, the research can effectively eliminate the interference factors such as internal governance, financial status, and development stage of the firm, so as to more accurately identify the net effect of blockchain adoption on CSDP.
The type of variables and their descriptions are detailed in Table 2, and the descriptive statistics are presented in Table 3.

3.3. Model Setup

3.3.1. Baseline Model

To test the effect of blockchain adoption on CSDP, this study constructs the following benchmark regression model:
C S D P i t = β 0 + β 1 B A i t + γ Controls i t + α i + λ t + ε i t
Among them, CSDPit denotes the corporate sustainable development performance of firm i in year t; BAit is the policy shock term, indicating whether blockchain technology has been implemented in the province where firm i is located in year t; Controlsit represents a set of firm-level control variables; αi and λt respectively firm fixed effects and year fixed effects, which are included to control for time-invariant firm-specific characteristics and common annual shocks; εit is a random disturbance term. The regression coefficient β1 of the core independent variable BAit in the model reflects the direct impact of blockchain adoption on CSDP.

3.3.2. Moderation Effect Model

To test the moderating effect of regional environmental regulation on the relationship between blockchain adoption and CSDP, we construct model (8) and (9). The model (8) only contains BA, ER, and control variables, which are used to analyze the impact of the two on CSDP alone; the model (9) introduces the interaction term (BA × ER) to examine whether environmental regulation changes the direction or intensity of blockchain adoption on CSDP.
C S D P i t = β 0 + β 1 B A i t + β 2 E R i t + γ C o n t r o l s i t + α i + λ t + ε i t
C S D P i t = β 0 + β 1 B A i t + β 2 E R i t + β 3 B A i t × E R i t + γ C o n t r o l s i t + α i + λ t + ε i t
If β3 > 0, it means that environmental regulation strengthens the positive impact of blockchain adoption on CSDP; if β3 < 0, it displays that environmental regulation strengthens the negative impact of blockchain adoption on CSDP. By comparing the two models, it can be judged whether environmental regulation plays a regulatory role in the process of blockchain adoption, affecting CSDP.

3.3.3. Mediation Effect Models

F C i t = β 0 + β 1 B A i t + γ C o n t r o l s i t + α i + λ t + ε i t
C S D P i t = β 0 + β 1 F C i t + β 2 B A i t + γ C o n t r o l s i t + α i + λ t + ε i t
To test the effect of blockchain adoption on financing constraints, Model (10) is employed. A significant β1 indicates that blockchain adoption can alter the degree of corporate financing constraints. Model (11) is designed to examine the effect of blockchain adoption on CSDP while controlling for financing constraints. If β1 remains significant and β2 differs from that in Model (7), it suggests that financing constraints serve as an intermediary element in the relationship between blockchain adoption and CSDP.
D u a l i t = β 0 + β 1 B A i t + γ C o n t r o l s i t + α i + λ t + ε i t
C S D P i t = β 0 + β 1 D u a l i t + β 2 B A i t + γ C o n t r o l s i t + α i + λ t + ε i t
Model (12) is used to test the impact of blockchain adoption on internal governance. If β1 is significant, it shows that blockchain adoption can affect the internal governance structure of firms (such as the status of two-in-one). After controlling internal governance, Model (13) observes the impact of blockchain adoption on CSDP. If β1 is significant, and β2 changes compared with Model (7), suggesting that internal governance serves as an intermediary element in the effect of blockchain adoption on CSDP.

4. Empirical Findings

4.1. Baseline Regression

To examine the effect of blockchain adoption on CSDP, a fixed-effect model is first utilized for baseline regression analysis. Table 4 presents three sets of regression results: Column (1) displays simple regression including only the core independent variable BA; Column (2) incorporates fixed effects; Column (3) further incorporates corporate governance variables to comprehensively reflect the role of internal governance mechanisms in CSDP.
The coefficient of BA is significantly positive at the 1% level in all models, indicating that blockchain adoption significantly promotes CSDP, thus supporting Hypothesis 1. Specifically, without control variables, BA increases CSDP by 0.104 units. After controlling for financial status, firm size, and profitability, the coefficient remains at 0.123 with a smaller standard error, confirming robustness. When governance structure variables are added, the coefficient decreases slightly to 0.0982 but remains significant, suggesting governance structure partially moderates the effect of blockchain adoption.
Among control variables, Lev is significantly positive, possibly indicating that highly leveraged firms have stronger incentives for long-term investment and social responsibility after alleviating financing constraints. ROE and FirmAge also show significant positive effects, implying that profitable and mature firms are more capable of achieving sustainable development goals. In corporate governance, Board, Indep, and Top3 positively impact CSDP, with Board having the largest coefficient (0.352), highlighting the importance of good governance in enhancing ESG performance. Conversely, Mshare is significantly negative, suggesting that excessive managerial incentives may hinder long-term social responsibility.
Generally, baseline regression confirms that blockchain adoption effectively improves CSDP, with robust conclusions across different model specifications. The next section explores the mediating effects of financing constraints and corporate governance to validate Hypotheses 2 and 3.

4.2. Robustness Check

To ensure the reliability and robustness of the foregoing conclusions, this study performs a multi-dimensional robustness test on the core estimation results, encompassing lag term specification, estimation method substitution, sample selection bias control, and placebo test. Specifically, we lag the CSDP by one, two, and three periods, respectively, to alleviate the potential reverse causality problem; the quasi-maximum likelihood estimation is further used to replace the fixed-effect model to enhance the robustness to heteroscedasticity and extreme values. At the same time, we also use the propensity score matching (PSM) method to control the systematic bias caused by observable variables and perform a placebo test by randomizing the did variable to exclude the interference of accidental correlation. The results above are all presented in Table 5.

4.2.1. Lagged Regressions

Column (1), Column (2), and Column (3) report the regression results after lagging CSDP for one, two, and three periods, respectively. The results show that under different lag periods, the coefficients of BA are significantly positive at the 1% and 5% levels, with values of 0.113, 0.119, and 0.150, respectively. Notably, the magnitude of influence increases modestly as the lag period extends. This pattern suggests a temporal lag in blockchain adoption’s impact on CSDP, implying that firms require a transitional period to implement system optimization and realize performance enhancements after adopting blockchain. This finding shows that even if the reverse causality problem is considered, blockchain adoption can still significantly promote CSDP, thus enhancing the credibility of the previous conclusions.

4.2.2. Quasi-Maximum Likelihood Estimation

To address the sensitivity of the traditional fixed-effect model to heteroscedasticity and extreme values, this study employs quasi-maximum likelihood estimation to re-estimate the model specified in Column (4). The results demonstrate that the coefficient of BA is 0.0177, significant at the 1% level. While the coefficient magnitude is relatively small, its positive sign aligns with prior findings, reaffirming the positive impact of blockchain adoption on CSDP. Additionally, key control variables—including Lev, ROE, FirmAge, and Board—retain statistical significance, underscoring the model’s robust performance.

4.2.3. Propensity Score Matching

To further address potential systematic differences arising from firms’ blockchain adoption decisions, one-to-one nearest neighbor matching with a caliper of 0.05 is employed for PSM. Matching co-variables include corporate financial characteristics and governance structure variables. Column (5) presents the regression results for the matched sample, where the BA coefficient is 0.0834, significant at the 5% level. This indicates that after controlling for observable characteristic differences, the positive impact of blockchain adoption on CSDP remains statistically significant.

4.2.4. Placebo Test

To exclude the possibility that the observed relationship between blockchain adoption and CSDP is a spurious artifact of unobserved shocks, the study implements a placebo exercise in which the treatment indicator BA is randomly reassigned across firms and years, thereby generating a pseudo-treated sample. Re-estimating the baseline model 1000 times with this BA_random variable yields an average coefficient of 0.141 with a large standard error that is never statistically significant (p > 0.10). Figure 1 visualizes the distribution of these 1000 placebo coefficients. The blue curve shows the kernel-density estimate, while the red curve overlays the fitted normal density. The distribution is tightly centered around zero, confirming that random reassignment produces no systematic effect.
The robustness results in Column (6) show that the randomized BA variable coefficient is 0.141, but the standard error is large and does not have statistical significance (p > 0.1), indicating that the significant impact observed above is not caused by random disturbance. Taken together, the figure corroborates the regression finding that the positive impact of BA on CSDP is not driven by random noise but reflects a genuine treatment effect.
The above robustness test results consistently show that the positive impact of BA on CSDP remains robust regardless of whether the time series structure of variables is adjusted, the estimation method is replaced, the sample selection bias is controlled, or the placebo test is conducted. This not only enhances the credibility of the research conclusions but also provides a robust empirical foundation for subsequent mechanism analysis and policy formulation.

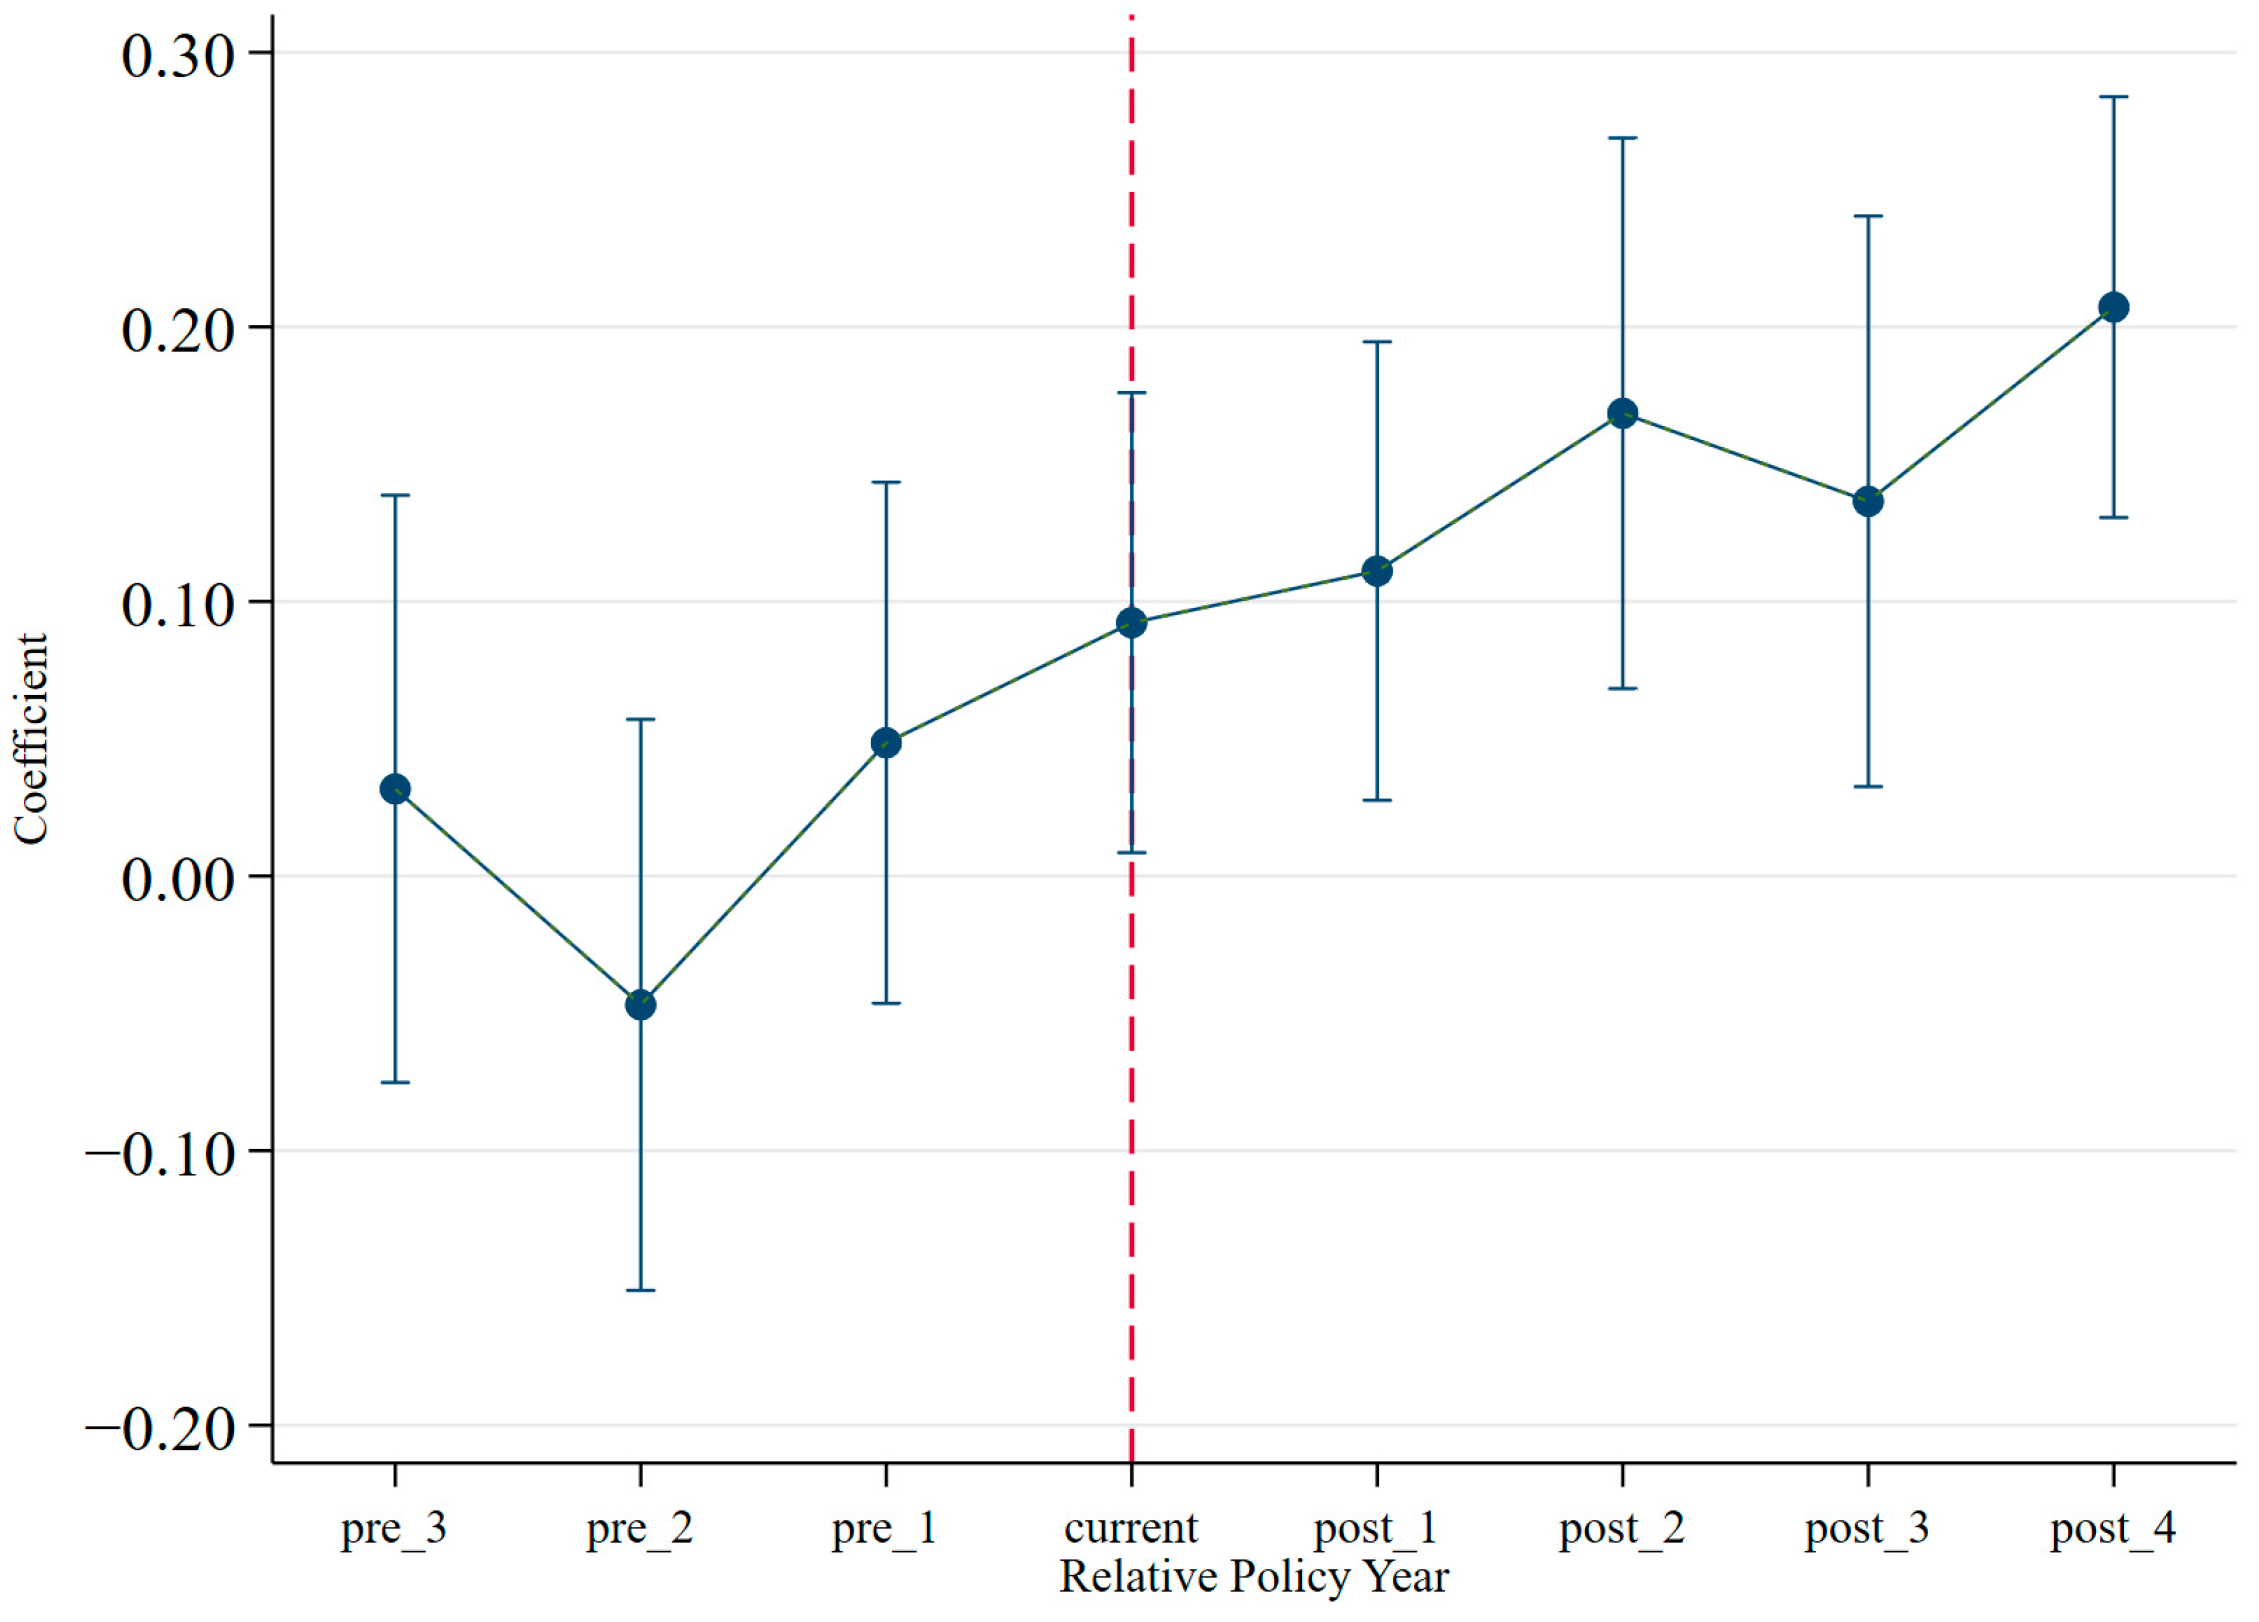
4.2.5. Parallel Trend Test

To authenticate the validity of DID estimation, a parallel trend test is conducted to ensure that the treatment and control groups exhibited comparable trends in CSDP prior to blockchain adoption. Specifically, a set of time-relative event dummy variables is introduced, spanning from three years before to four years after the adoption year, with the year immediately preceding adoption designated as the reference period.
As depicted in Figure 2, the estimated coefficients of the pre-treatment years (pre_3, pre_2, pre_1) are statistically insignificant and close to zero, confirming no significant divergence in CSDP trends between the treated and control firms before blockchain implementation. This validates the parallel trend assumption. Conversely, coefficients for the post-treatment periods (post_1 through post_4) are consistently positive and statistically significant, illustrating a sustained improvement in CSDP following blockchain adoption.
These results provide robust empirical support for the common trend assumption, thereby strengthening the credibility of the DID methodology employed in this study. The observed post-adoption trajectory also further suggests that the blockchain’s impact on sustainable development performance is not instantaneous but evolves incrementally over time, as firms integrate digital governance and optimize resources through blockchain-enabled mechanisms.

5. Further Analysis

5.1. Mediation Analysis

To further reveal the specific path of blockchain adoption, we select FC and Dual as mediating variables to test whether blockchain adoption promotes the CSDP by alleviating financing constraints and improving corporate governance structure, so as to verify Hypotheses 2 and 3. The results above are presented in Table 6.

5.1.1. Financing Constraint Mediation

Column (1) presents the effect of blockchain adoption on financing constraints. The results show that the independent variable BA is significantly negative at the 1% level, indicating that blockchain adoption helps alleviate the severity of firms’ financing constraints. This result may be attributed to the enhanced information transparency brought by blockchain, which strengthens external investors’ confidence and reduces information asymmetry in the financing process.
Column (2) reports the regression results of CSDP when FC is included as an explanatory variable. After controlling for other factors, FC remains significantly negative at the 1% level, suggesting that more severe financing constraints are associated with lower levels of CSDP. Notably, after introducing FC into the model, the coefficient of BA decreases but remains significant at the 5% level, providing evidence of a partial mediating role of financing constraints.
In summary, we find that (1) blockchain adoption significantly reduces financing constraints; (2) financing constraints have a significantly negative impact on CSDP; and (3) the positive effect of blockchain adoption on CSDP remains significant, although weakened, after controlling for financing constraints. Therefore, financing constraints serve as an important mediating mechanism through which blockchain adoption enhances CSDP, supporting Hypothesis 2.

5.1.2. Internal Governance Mediation

We next examine the internal governance variable, Dual, as a mediator. Column (3) shows that blockchain adoption significantly reduces the likelihood of Dual at the 1% significance level, indicating that it promotes power balance within firms and mitigates governance risks caused by excessive concentration of managerial authority.
Column (4) further explores the impact of internal governance on CSDP. After controlling for other variables, Dual remains significantly negative at the 5% level, suggesting that firms with combined CEO–chairman roles exhibit relatively lower levels of CSDP. Meanwhile, the coefficient of BA remains statistically significant after controlling for Dual, indicating that internal corporate governance plays a partial mediating role.
Specifically, blockchain adoption not only directly improves CSDP through increased transparency but also indirectly enhances it by optimizing internal governance structures. This finding supports Hypothesis 3, demonstrating that blockchain adoption contributes to higher CSDP by improving corporate governance mechanisms.
Overall, the mediation analysis confirms that blockchain adoption significantly improves corporate sustainable development performance by alleviating financing constraints and strengthening internal governance. These findings illuminate the specific pathways through which blockchain influences corporate behavior and provide both theoretical insights and practical guidance for promoting sustainable business practices through digital transformation.

5.2. Moderation Effect Analysis

To further explore the boundary conditions of the institutional environment in the process of blockchain adoption, improving CSDP, this study introduces regional environmental regulation intensity (ER) as a moderating variable, and constructs an interaction term (ER × BA) to test whether it enhances or weakens the impact of blockchain adoption on CSDP. These results are reported in Table 7.
Column (1) presents the baseline model that contains only the independent variable ER and control variables. On this basis, Column (2) adds the moderating variable ER and its interaction with BA (ER_BA). The results show that in the basic model, the regional environmental regulation variable ER is positive at the 1% level (coefficient = 0.0429), indicating that local governments strengthening environmental supervision will help to improve CSDP as a whole.
After adding the interaction term (Column 2), the coefficient of the interaction term ER_BA is 0.0619, and it is significantly positive at the 5% level, indicating that regional environmental regulation has a significant positive adjustment effect on the process of blockchain adoption, promoting CSDP. That is, in regions with stricter environmental regulations, blockchain adoption more effectively enhances CSDP. This phenomenon may be attributed to two mechanisms: on the one hand, strict environmental regulation increases the cost pressure of firms to fulfill their social and environmental responsibilities, and encourages firms to adopt emerging technologies such as blockchain to optimize resource management, improve information transparency and reduce compliance risks; on the other hand, blockchain itself has the characteristics of traceability and non-tampering, which helps firms to provide more credible data support when they are subject to government supervision and social supervision, so as to obtain higher ESG scores and policy recognition in a strong regulatory environment.
The regulatory effect analysis demonstrates that regional environmental regulations play a positive moderating role in enhancing CSDP during blockchain adoption. These findings not only enrich the literature on how institutional environments regulate the relationship between technological innovation and sustainable development but also offer novel policy insights: policymakers can better unleash the potential of digital technologies like blockchain in driving firms’ green transformation and high-quality development by improving environmental governance systems and strengthening local regulatory enforcement.

5.3. Heterogeneity Analysis

To delve deeper into the structural variations in the impact of blockchain adoption on CSDP, this study performs a heterogeneity analysis along three dimensions: industry regulatory intensity, ownership structure, and regional development levels. Specifically, the samples are divided into regulated industries and non-regulated industries, state-owned firms and private firms, central and western regions and eastern regions, and regression analysis is carried out on each sub-sample. Table 8 reports six sets of regression results, which clearly reveal the performance differences in blockchain adoption in these situations.

5.3.1. Industry Regulatory Intensity Heterogeneity

Columns (1) and (2) show the effect of blockchain adoption in regulated and non-regulated industries, respectively. The results state that in the regulatory industry, the coefficient of BA is 0.0528, but it does not reach the statistical significance level; in the non-regulated industries, the coefficient is 0.0937, significant at the 1% level. This phenomenon may reflect: on the one hand, the regulatory industry itself is subject to strong external supervision and policy constraints, and it is difficult for firms to obtain additional governance improvement space when introducing blockchain; on the other hand, due to the low transparency of information and the relatively weak internal governance mechanism, blockchain adoption in non-regulated industries is more likely to bring about the improvement of marginal benefits.

5.3.2. Ownership Structure Heterogeneity

Columns (3) and (4) report the estimation results in state-owned and private firms, respectively. It can be seen that in state-owned firms, the coefficient of BA is 0.137, and it is significant at the level of 10%; in private firms, the coefficient is 0.0977, and it is significant at the 1% level. This shows that although private firms are more flexible in the process of technology adoption and blockchain has a more robust role in promoting their sustainable development performance, state-owned firms have certain advantages in policy guidance and access to technological resources, and also show certain positive effects. In addition, the coefficients of Indep and Top3 in the sample of state-owned firms are larger, indicating that the optimization of governance structure may be one of the important paths for the effective blockchain adoption of state-owned firms.

5.3.3. Regional Development Levels Heterogeneity

Columns (5) and (6) report the estimation results for central–western regions and the eastern regions, respectively. In central–western regions, the coefficient of BA is as high as 0.235, significant at the 1% level, while in the eastern regions, the coefficient is 0.0679, significant at the 5% level. This divergence highlights that blockchain adoption fully leverages the “late-mover advantage” in the central–western regions, characterized by relatively underdeveloped digital infrastructure and incomplete governance mechanisms, where technological solutions compensate for institutional shortcomings, thereby significantly enhancing CSDP. In contrast, although firms in eastern regions exhibit higher overall digitization levels, the technology still yields a statistically significant positive impact.
The above heterogeneity analysis demonstrates significant divergent influence pathways of blockchain adoption across contextual dimensions. Specifically, blockchain exhibits a more pronounced promotional effect in non-regulated industries, private enterprises, and firms located in central and western regions. These findings offer critical policy implications: during the promotion of blockchain implementation, policymakers should prioritize regions and firms with weaker institutional foundations and lower governance capabilities to maximize the realization of technological dividend spillover.

6. Conclusions and Policy Recommendations

6.1. Research Conclusions

This study empirically investigates the impact of blockchain adoption on corporate sustainable development performance among Chinese listed firms using a dynamic panel data set (2009–2023) and difference-in-difference models, supplemented by mediating and moderating effect analyses. The key findings and limitations can be summarized as follows:
  • Blockchain adoption is found to significantly enhance corporate sustainable development performance by 9.8–12.3%, with the results remaining robust across alternative model specifications. This effect is primarily driven by improvements in economic efficiency, environmental transparency, and social accountability, which are consistent with the theoretical framework of the Triple Bottom Line theory.
  • Blockchain reduces information asymmetry and automates financing processes, alleviating financing constraints by 6.7%. Reduced financing constraints in turn improve the corporate sustainable development, as evidenced by a 51.9% negative correlation between financing constraints and corporate sustainable development performances, explaining 36% of the total effect; blockchain adoption decreases the probability of chairman–CEO duality by 5.12%, optimizing governance structures. Firms with separated roles show 2.7% higher corporate sustainable development performance, highlighting the importance of power balances in sustainable development.
  • Regional environmental regulation strengthens the positive effect of blockchain on the corporate sustainable development performance. In high-ranked environmental regulation regions, the impact of blockchain on corporate sustainable development performance increases by 6.2%, driven by compliance cost reduction and policy synergy.
  • Blockchain’s impact is more pronounced in unregulated industries than in regulated sectors, where existing supervision limits marginal gains; in terms of technology adoption efficiency, private firms demonstrate stronger performance than state-owned firms. However, state-owned firms can achieve governance optimization driven by policies, which also brings certain positive effects on corporate sustainable development performance; central-western regions exhibit “late-mover advantages”, with blockchain boosting the corporate sustainable development performance by 23.5%, compared to 6.79% in eastern regions, reflecting infrastructure and institutional gaps.
  • The study advances the literature on three fronts. Methodologically, it introduces a semantic-classification approach that measures the depth rather than the mere mention of blockchain use. Empirically, large-sample DID tests show that blockchain adoption boosts sustainable development performance—partly by easing financing constraints and reducing CEO–chair duality—with stronger effects where environmental regulation is stringent. Conceptually, the findings highlight the complementarity between digital technology and regulatory pressure in driving corporate sustainability, offering actionable insights for both managers and policymakers.

6.2. Policy Recommendations

Governments should strengthen blockchain infrastructure while recognizing its “double-edged-sword” nature. Although technology can underpin tamper-proof ESG data and accelerate decarbonization, permissionless chains, and intensive consensus algorithms may raise energy demand. Hence, sector-differentiated R & D tax credits for low-carbon blockchain architectures (e.g., PoS-based or consortium chains) should be coupled with green-power–purchase requirements, ensuring that incentives do not undermine climate objectives.
Policy support needs finer calibration. A tiered subsidy scheme could reimburse a higher share of R & D or deployment costs for micro-, small-, and medium-sized enterprises (MSMEs) or for firms located in digitally lagging provinces, while gradually tapering support for large firms in advanced regions. Complementarily, a “Blockchain–ESG Regulatory Sandbox”—jointly run by financial and environmental regulators—should be launched. Within this sandbox, firms can pilot blockchain-based ESG verification or asset-tokenization solutions under relaxed reporting rules and expedited approval, thereby lowering compliance costs without sacrificing data integrity.
Deepen the synergy between environmental regulation and blockchain. Local governments can integrate mandatory blockchain use for pollution-control data in regions with stringent environmental targets and link compliance to green-credit eligibility. Public–private partnership funds should develop lightweight blockchain toolkits—such as low-cost carbon-footprint modules—so that MSMEs can meet new disclosure rules without prohibitive expenditure.
Promote the integration of blockchain and corporate governance. Linking executive pay to ESG targets via smart contracts, exploring asset-tokenization models to broaden collateral, and enabling independent directors to monitor sustainability data on distributed ledgers will strengthen accountability.
Implement differentiated regional strategies. Expanding blockchain service networks in central and western provinces (e.g., Gansu, Yunnan) can leverage “late-mover advantages,” whereas in unregulated industries, specialized technical-consultation centers should help design industry-specific use cases.
Finally, construct a full-cycle monitoring and audit framework. A national blockchain–ESG performance database and an annual industry white paper should track economic, environmental, and social outcomes. Mandatory “blockchain-impact reports” for listed companies—backed by third-party penetrative audits—will curb hype-driven tokenism and ensure that the technology genuinely advances the “dual-carbon” goals and broader social value creation.
The limitations of this study are as follows. Despite extensive robustness checks, several caveats persist. The blockchain metric—though machine-learning refined—still relies on voluntary disclosure, risking both under-capture of silent adopters and overstatement of rhetorical hype. Causal identification hinges on the parallel-trend assumption; unobserved shocks could bias estimates, and the China-only sample constrains external validity. In addition, the composite CSDP index and mediator proxies carry unavoidable measurement noise.

Author Contributions

Methodology, X.Y.; Validation, X.Y.; Investigation, X.Y.; Resources, S.S. and Q.D.; Data curation, S.S.; Writing—review & editing, Q.D.; Project administration, S.S.; Funding acquisition, Q.D. All authors have read and agreed to the published version of the manuscript.

Funding

We acknowledge the financial support from the National Social Science Foundation Youth Program of China [Grant No. 24CJY017]: The Study on Mechanisms and Pathways empowered by the In-depth Integration of Basic and Applied Research to Develop New Quality Productive Forces.

Institutional Review Board Statement

Not applicable.

Informed Consent Statement

Not applicable.

Data Availability Statement

The data presented in this study are available on request from the corresponding author.

Conflicts of Interest

The authors declare no competing interests.

References

  1. Jimenez-Castillo, L.; Sarkis, J.; Saberi, S.; Yao, T. Blockchain-based governance implications for ecologically sustainable supply chain management. J. Enterp. Inf. Manag. 2023, 37, 76–99. [Google Scholar] [CrossRef]
  2. Yang, Z.; Na, J.; Dong, X. Corporate governance for sustainable development: A study on mechanism configuration. J. Clean. Prod. 2024, 458, 142509. [Google Scholar] [CrossRef]
  3. Chauhan, C.; Kaur, P.; Arrawatia, R.; Ractham, P.; Dhir, A. Supply chain collaboration and sustainable development goals (SDGs). Teamwork Makes Achiev. SDGs Dream Work. J. Bus. Res. 2022, 147, 290–307. [Google Scholar]
  4. Chen, W.; Ren, H.; Shu, Y. The Impact of Corporate Digital Transformation on Sustainable Development in China. Bus. Strategy Environ. 2025, 34, 2721–2747. [Google Scholar] [CrossRef]
  5. Zhang, H.; Lai, J. Greening through ESG: Do ESG ratings improve corporate environmental performance in China? Int. Rev. Econ. Financ. 2024, 96, 103726. [Google Scholar] [CrossRef]
  6. Jiang, S.; Li, Y.; Lu, Q.; Hong, Y.; Guan, D.; Xiong, Y.; Wang, S. Policy assessments for the carbon emission flows and sustainability of Bitcoin blockchain operation in China. Nat. Commun. 2021, 12, 1938. [Google Scholar] [CrossRef]
  7. Zhang, K. The Application of blockchain in Supply Chain Finance. Front. Bus. Econ. Manag. 2024, 13, 48–53. [Google Scholar] [CrossRef]
  8. Khaw, T.Y.; Amran, A.; Teoh, A.P. Factors influencing ESG performance: A bibliometric analysis, systematic literature review, and future research directions. J. Clean. Prod. 2024, 448, 141430. [Google Scholar] [CrossRef]
  9. Munir, M.A.; Habib, M.S.; Hussain, A.; Shahbaz, M.A.; Qamar, A.; Masood, T.; Sultan, M.; Mujtaba, M.A.; Imran, S.; Hasan, M.; et al. Blockchain Adoption for Sustainable Supply Chain Management: Economic, Environmental, and Social Perspectives. Front. Energy Res. 2022, 10, 899632. [Google Scholar] [CrossRef]
  10. Guo, X.; Xia, W.; Feng, T.; Tan, J.; Xian, F. Blockchain adoption and sustainable supply chain finance: The perspective of information processing theory. Corp. Soc. Responsib. Environ. Manag. 2024, 31, 3614–3632. [Google Scholar] [CrossRef]
  11. Tian, L.; Tian, W.; Guo, M. Can supply chain digitalization open the way to sustainable development? Evidence from corporate ESG performance. Corp. Soc. Responsib. Environ. Manag. 2024, 32, 2332–2346. [Google Scholar] [CrossRef]
  12. Song, Y.; Du, C.; Du, P.; Liu, R.; Lu, Z. Digital transformation and corporate environmental performance: Evidence from Chinese listed companies. Technol. Forecast. Soc. Chang. 2024, 201, 123159. [Google Scholar] [CrossRef]
  13. Latan, H.; Lopes de Sousa Jabbour, A.B.; Sarkis, J.; Chiappetta Jabbour, C.J.; Ali, M. The nexus of supply chain performance and blockchain in the digitalization era: Insights from a fast-growing economy. J. Bus. Res. 2024, 172, 114398. [Google Scholar] [CrossRef]
  14. Hartmann, B. Triple bottom line. In Accounting for Sustainability; Routledge: London, UK, 2020; pp. 101–110. [Google Scholar]
  15. Centobelli, P.; Cerchione, R.; Esposito, E.; Oropallo, E. Surfing blockchain wave, or drowning? Shaping the future of distributed ledgers and decentralized technologies. Technol. Forecast. Soc. Chang. 2021, 165, 120463. [Google Scholar] [CrossRef]
  16. Sharma, G.D.; Tiwari, A.K.; Chopra, R.; Dev, D. Past, present, and future of block-chain in finance. J. Bus. Res. 2024, 177, 114640. [Google Scholar] [CrossRef]
  17. Sahoo, S.; Upadhyay, A. Improving triple bottom line (TBL) performance: Analyzing impacts of industry 4.0, lean six sigma and circular supply chain management. Ann. Oper. Res. 2024, 1–32. [Google Scholar] [CrossRef]
  18. Almadadha, R. Blockchain in Financial Accounting: Enhancing Transparency, Security, and ESG Reporting. Blockchains 2024, 2, 312–333. [Google Scholar] [CrossRef]
  19. Wu, B.; Gu, Q.; Liu, Z.; Liu, J. Clustered institutional investors, shared ESG preferences and low-carbon innovation in family firm. Technol. Forecast. Soc. Chang. 2023, 194, 122676. [Google Scholar] [CrossRef]
  20. Li, Y.; Xue, H.; Taskinen, P.; Jokilaakso, A.; Tang, C.; Jin, W.; Rämä, M.; Chen, Y.; Yang, S. Clean antimony production from stibnite concentrate with goethite residue co-treatment for zinc, iron, sulfur conservation. J. Clean. Prod. 2021, 313, 127847. [Google Scholar] [CrossRef]
  21. Ma, X.; Wang, M.; Li, C. A Summary on Research of Household Energy Consumption: A Bibliometric Analysis. Sustainability 2019, 12, 316. [Google Scholar] [CrossRef]
  22. Kautto, T.; Henttonen, P. Records management as invisible work: A study of Finnish municipalities. Gov. Inf. Q. 2020, 37, 101460. [Google Scholar] [CrossRef]
  23. Polančič, G. BPMN-L: A BPMN extension for modeling of process landscapes. Comput. Ind. 2020, 121, 103276. [Google Scholar] [CrossRef]
  24. Ren, S.; He, D.; Zhang, T.; Chen, X. Symbolic reactions or substantive pro-environmental behaviour? An empirical study of corporate environmental performance under the government’s environmental subsidy scheme. Bus. Strategy Environ. 2019, 28, 1148–1165. [Google Scholar] [CrossRef]
  25. Gangi, F.; Daniele, L.M.; Varrone, N.; Vicentini, F.; Coscia, M. Equity mutual funds’ interest in the environmental, social and governance policies of target firms: Does gender diversity in management teams matter? Corp. Soc. Responsib. Environ. Manag. 2020, 28, 1018–1031. [Google Scholar] [CrossRef]
  26. Ford, R.; Maidment, C.; Vigurs, C.; Fell, M.J.; Morris, M. Smart local energy systems (SLES): A framework for exploring transition, context, and impacts. Technol. Forecast. Soc. Chang. 2021, 166, 120612. [Google Scholar] [CrossRef]
  27. DiMaggio, P.J.; Powell, W.W. The Iron Cage Revisited: Institutional Isomorphism and Collective Rationality in Organizational Fields. Am. Sociol. Rev. 1983, 48, 147. [Google Scholar] [CrossRef]
  28. Wang, P.; Dong, C.; Chen, N.; Qi, M.; Yang, S.; Nnenna, A.B.; Li, W. Environmental Regulation, Government Subsidies, and Green Technology Innovation—A Provincial Panel Data Analysis from China. Int. J. Environ. Res. Public Health 2021, 18, 11991. [Google Scholar] [CrossRef]
  29. Yuan, B.; Zhang, Y. Flexible environmental policy, technological innovation and sustainable development of China’s industry: The moderating effect of environment regulatory enforcement. J. Clean. Prod. 2020, 243, 118543. [Google Scholar] [CrossRef]
  30. Hutton, I.; Knill, A.M.; Zutter, C.J. 25 years and counting of corporate finance: What have we learned and where are we going? J. Corp. Financ. 2021, 66, 101896. [Google Scholar] [CrossRef]
  31. del-Castillo-Feito, C.; Blanco-González, A.; Hernández-Perlines, F. The impacts of socially responsible human resources management on organizational legitimacy. Technol. Forecast. Soc. Chang. 2022, 174, 121274. [Google Scholar] [CrossRef]
  32. Wang, W.; Xiao, W.; Bai, C. Can renewable energy technology innovation alleviate energy poverty? Perspective from the marketization level. Technol. Soc. 2022, 68, 101933. [Google Scholar] [CrossRef]
  33. Spyridaki, N.-A.; Stavrakas, V.; Dendramis, Y.; Flamos, A. Understanding technology ownership to reveal adoption trends for energy efficiency measures in the Greek residential sector. Energy Policy 2020, 140, 111413. [Google Scholar] [CrossRef]
  34. Zimmer, C.; McKinley, D. New approaches to pollution prevention in the healthcare industry. J. Clean. Prod. 2008, 16, 734–742. [Google Scholar] [CrossRef]
  35. Garske, B.; Bau, A.; Ekardt, F. Digitalization and AI in European Agriculture: A Strategy for Achieving Climate and Biodiversity Targets? Sustainability 2021, 13, 4652. [Google Scholar] [CrossRef]
  36. Iyengar, G.; Saleh, F.; Sethuraman, J.; Wang, W. Blockchain Adoption in a Supply Chain with Market Power. SSRN Electron. J. 2022, 69, 3415–3436. [Google Scholar]
  37. Hirth, S.; Viswanatha, M. Financing constraints, cash-flow risk, and corporate investment. J. Corp. Financ. 2011, 17, 1496–1509. [Google Scholar] [CrossRef]
  38. Koh, K. New findings on the asset growth anomaly: The joint effect of profitability and financing constraints. Econ. Lett. 2024, 244, 112016. [Google Scholar] [CrossRef]
  39. Hao, Y.; Wu, W. Environment, social, and governance performance and corporate financing constraints. Financ. Res. Lett. 2024, 62, 105083. [Google Scholar] [CrossRef]
  40. Lyu, Y.; Ji, Z.; Zhang, X.; Zhan, Z. Can Fintech Alleviate the Financing Constraints of Enterprises?—Evidence from the Chinese Securities Market. Sustainability 2023, 15, 3876. [Google Scholar] [CrossRef]
  41. Martínez-Ferrero, J.; García-Meca, E. Internal corporate governance strength as a mechanism for achieving sustainable development goals. Sustain. Dev. 2020, 28, 1189–1198. [Google Scholar] [CrossRef]
  42. Black, B.; de Carvalho, A.G.; Khanna, V.; Kim, W.; Yurtoglu, B. Corporate governance indices and construct validity. Corp. Gov. Int. Rev. 2017, 25, 397–410. [Google Scholar] [CrossRef]
Figure 1. Placebo test.
Sustainability 17 06631 g001
Figure 2. Parallel trend test.
Sustainability 17 06631 g002
Table 1. CSDP indicator system and corresponding entropy value.
VariableIndicatorMeasurement MethodEntropy Weight
CSDPEconomic performanceROA0.306
Environmental performanceENV0.463
Social performanceSOC0.231
Table 2. Description of variables.
Variable CategoryVariableSignDescription
Dependent variablesCorporate sustainable performanceCSDPSynthesis of entropy-weight method for economic, environmental, and social performance
Independent variableBlockchain adoptionBADummy variables for blockchain adoption
Moderating variable Regional environmental regulationERIndustrial pollution control investment/Industrial added value
Mediating variablesfinancing constraintsFCComposite index of financing constraints
internal governanceDualDummy variables for concentration of management power
Control variablesFirm leverage ratioLevTotal liabilities/Total assets
Return on equityROENet profit/Owner’s equity
Firm ageFirmAgeNatural logarithm of (current year − founding year + 1)
Board sizeBoardNatural logarithm of board members
Proportion of independent directorsIndepProportion of independent directors
Shareholding ratio of the top three shareholdersTop3Shareholding ratio of top three shareholders
Management shareholding ratioMshareProportion of shares held by management
Table 3. Descriptive statistics.
VariablesCountMeanStandard DeviationMinMax
CSDP16,3685.4690.8931.5979.405
BA16,3680.0580.23301.000
Lev16,3680.3600.1990.0490.923
ROE16,3680.0640.117−0.5850.300
FirmAge16,3682.8960.3162.0793.584
Board16,3682.0770.2011.6092.639
Indep16,3680.3800.0520.3330.571
Top316,3680.5140.1520.1720.868
Mshare16,3680.2400.2210.0000.725
Table 4. Baseline regression results.
(1)(2)(3)
VariablesCSDPCSDPCSDP
BA0.104 ***0.123 ***0.0982 ***
(0.0296)(0.0333)(0.0335)
Lev 0.618 ***
(0.0405)
ROE 0.558 ***
(0.0607)
FirmAge 0.111 ***
(0.0226)
Board 0.352 ***
(0.0474)
Indep 0.397 **
(0.170)
Top3 0.142 ***
(0.0478)
Mshare −0.0896 ***
(0.0316)
Constant5.463 ***5.462 ***3.952 ***
(0.00713)(0.00667)(0.163)
Firm FENOYESYES
Year FENOYESYES
Observations16,36816,36816,368
R-squared0.1010.1310.154
Note: ** and *** denote statistical significance at the 5% and 1% levels, respectively. Robust standard errors clustered at the firm level are reported in parentheses.
Table 5. Robustness checks.
(1)(2)(3)(4)(5)(6)
VariablesCSDP_lag1CSDP_lag2CSDP_lag3ppml_CSDPpsm_CSDPplacebo_CSDP
BA0.113 ***0.119 ***0.150 ***0.0177 ***0.0834 **
(0.0315)(0.0352)(0.0397)(0.0060)(0.0416)
BA_random 0.141
(0.101)
ControlsYESYESYESYESYESYES
Firm FEYESYESYESYESYESYES
Year FEYESYESYESYESYESYES
Observations13,51210,668824916,368374816,368
R-squared0.1330.1370.163 0.1770.154
Note: ** and *** denote statistical significance at the 5% and 1% levels, respectively. Robust standard errors clustered at the firm level are reported in parentheses.
Table 6. Mediating effects analysis.
(1)(2)(3)(4)
VariablesFCCSDPDualCSDP
BA−0.0675 ***0.0628 **−0.0512 ***0.0954 ***
(0.00713)(0.0297)(0.0173)(0.0298)
FC −0.519 ***
(0.0330)
Dual −0.0279 **
(0.0136)
ControlsYESYESYESYES
Firm FEYESYESYESYES
Year FEYESYESYESYES
Observations15,47515,87116,13916,139
R-squared0.4300.1520.0780.152
Note: ** and *** denote statistical significance at the 5% and 1% levels, respectively. Robust standard errors clustered at the firm level are reported in parentheses.
Table 7. Moderating effect analysis.
(1)(2)
VariablesCSDPCSDP
BA 0.458 **
(0.179)
ER0.0429 ***0.0353 ***
(0.0103)(0.0107)
ER_BA 0.0619 **
(0.0238)
ControlsYESYES
Firm FEYESYES
Year FEYESYES
Observations16,31116,311
R-squared0.5460.546
Note: ** and *** denote statistical significance at the 5% and 1% levels, respectively. Robust standard errors clustered at the firm level are reported in parentheses.
Table 8. Heterogeneity analysis.
RegulatedNon-RegulatedSOENon-SOEWesternEastern
(1)(2)(3)(4)(5)(6)
VariablesCSDPCSDPCSDPCSDPCSDPCSDP
BA0.05280.0937 ***0.137 *0.0977 ***0.235 ***0.0679 **
(0.0807)(0.0317)(0.0814)(0.0329)(0.0730)(0.0322)
ControlsYESYESYESYESYESYES
Firm FEYESYESYESYESYESYES
Year FEYESYESYESYESYESYES
Observations239013,978204813,734341012,958
R-squared0.2360.1470.2340.1380.2160.154
Note: *, **, and *** denote statistical significance at the 10%, 5%, and 1% levels, respectively. Robust standard errors clustered at the firm level are reported in parentheses.
Disclaimer/Publisher’s Note: The statements, opinions and data contained in all publications are solely those of the individual author(s) and contributor(s) and not of MDPI and/or the editor(s). MDPI and/or the editor(s) disclaim responsibility for any injury to people or property resulting from any ideas, methods, instructions or products referred to in the content.

