Abstract
As environmental issues are of worldwide concern and consumers grow more concerned about the environment, green investments have emerged as a key factor in attracting consumers. To enhance consumer trust in enterprise investments in green and sustainable practices, blockchain technology, with its tamper-resistant and traceable characteristics, is being adopted by an increasing number of enterprises. However, the resulting spillover effect may lead to adverse consequences in a co-opetitive supply chain. This study examines a green supply chain comprising Brand O, a high brand value entity, and a contract manufacturer (CM) with lower brand value. The two parties collaborate through outsourced production while competing in the retail market. Three decision-making models were constructed, namely, without blockchain, Brand O adopting blockchain, and the CM adopting blockchain, and equilibrium solutions were derived to facilitate analysis. We find that Brand O tends not to introduce blockchain in order to avoid the loss of brand value and the spillover of consumer trust. The CM tends to introduce blockchain to enhance its products’ environmental impact and gain an exclusive competitive advantage, targeting the high-end market. These findings guide managers and practitioners in a co-opetitive green supply chain: high brand value retailers should cautiously evaluate blockchain’s impact, staying alert to risks hidden beneath benefits; upstream manufacturers can prioritize blockchain adoption for competitive advantage.
1. Introduction
With the escalating environmental pressures such as global warming, biodiversity loss, and marine pollution [1], environmental issues have become one of the most pressing global concerns. In 2015, leaders from 193 member states at the United Nations Sustainable Development Summit adopted Transforming Our World: The 2030 Agenda for Sustainable Development, which encompasses 17 Sustainable Development Goals (SDGs) and 169 specific targets, ushering global environmental governance into a new era [2]. This heightened emphasis on environmental sustainability has not only reshaped global governance frameworks but also triggered significant shifts in market dynamics, with growing preferences among consumers and businesses for green products [3]. Many companies have integrated environmental protection and sustainability into their core strategies [4], intensifying efforts in the production and promotion of green products. For instance, in 2022, Sprite abandoned its long-used green plastic bottles in favor of more recyclable transparent ones. Similarly, China’s Yili Group launched a series of green products, including low-carbon dairy, and was recognized in 2023 as one of the “Top Ten Green Development Cases” [5]. However, a critical challenge has emerged: how can companies enhance consumer trust in their green products? And how can consumers avoid being misled by corporate “greenwashing”?
To address this trust crisis and enhance supply chain transparency and accountability, blockchain technology, with its tamper-resistant and traceable characteristics [6], has been widely adopted by enterprises to promote green products [7]. For example, in 2017, leading global food supply chain companies, including Walmart, Dole, and Golden State Foods, announced a blockchain collaboration with IBM to leverage its traceability features, further strengthening consumer confidence in the global food system [8]. To improve supply chain sustainability and transparency in the green supply chain [9], Nestlé partnered with OpenSC to launch a blockchain pilot project tracking the milk powder supply chain from New Zealand to the Middle East. Unilever has utilized blockchain technology to trace the supply chain process from plantations to processing plants, ensuring the sustainability of its palm oil supply chain [10]. As part of the European Union-funded “Typicalp” project, the Fontina PDO cheese supply chain implemented a traceability platform based on green blockchain technology, enabling operators in the Fontina consortium and end consumers to access real-time data, thereby enhancing the environmental sustainability of the entire supply chain [11].
How blockchain can enhance supply chain transparency and sustainability has been a research hotspot in recent years. Song et al. [12] focused on agricultural blockchain, discussing its unique advantages in promoting sustainable agricultural development. Ma et al. [13] explored the significant role of blockchain in increasing consumer trust within closed-loop e-commerce supply chains, further highlighting its benefits for the recycling supply chain. However, we note that few studies investigate the potential spillover effect of blockchain, particularly in a co-opetitive supply chain where differences between upstream and downstream enterprises may lead to unexpected consequences from greater transparency. Therefore, this paper introduces blockchain into a co-opetitive supply chain with differentiated brand value, analyzing the complex impacts blockchain may generate and providing recommendations for enterprise decision-making.
In practice, co-opetitive supply chains based on outsourcing are very common. In such a supply chain, the upstream contract manufacturer serves as the production partner of the downstream retailer, responsible for manufacturing and supplying products, while also launching its own products in the retail market, directly competing with the retailer. For instance, Foxconn Group, while undertaking manufacturing outsourcing for Apple’s iPhone and other products, has also acquired Sharp to produce and sell its own branded consumer electronics, competing with Apple in certain markets [14]. L’Oréal, a globally renowned high-end cosmetics brand, outsources some of its skincare and makeup products to Intercos Group, which has introduced its own brand, Madina Milano, to compete in the retail market [15]. Similarly, Yue Yuen Industrial Holdings Limited, while producing athletic shoes for Nike, established POU CHEN to manufacture footwear, capturing the low-price market and competing with Nike. Consequently, in this structure, the retailer and the upstream contract manufacturer form a unique dynamic characterized by both production collaboration and market competition. However, when blockchain is introduced into this structure, its transparency may intensify competitive tensions between the two parties, giving rise to new supply chain dynamics.
In this outsourced, multi-channel competitive supply chain, the traceability characteristics of blockchain may engender complex impacts. To investigate this impact, we constructed a co-opetitive supply chain consisting of a high brand value brand owner O and a low brand value CM. Blockchain’s traceability empowers consumers to trace products along the supply chain. Consequently, when Brand O attempts to introduce blockchain to further amplify its competitive advantage, the exposure of green practices within the supply chain may allow the CM to “free-ride”, capitalizing on the transparency and brand trust established by Brand O to gain benefits in the retail market. This could even lead to a loss of Brand O’s brand value, thereby intensifying competition with Brand O. To investigate this phenomenon, this study constructs a supply chain framework comprising a high brand value Brand O and a low brand value CM. Brand O outsources its production to the CM while competing with the CM in the retail market. We consider three scenarios: neither Brand O nor the CM adopts blockchain (Mode N), Brand O adopts blockchain and traces its retail products (Mode O), and the CM adopts blockchain and traces its retail products (Mode M). These scenarios are used to address the following questions:
In a co-opetitive supply chain with differentiated brand value and given the combined effects of the spillover effect and enhanced consumer trust, is the overall impact of blockchain on different enterprises more beneficial than detrimental, or more detrimental than beneficial?
To address the above issue, we conducted Stackelberg game analyses for three different models and explored the impact of various factors on enterprise decision-making and profits through sensitivity analysis and numerical examples, thereby providing recommendations for enterprises’ blockchain practices.
This study integrates blockchain technology into a co-opetitive green supply chain based on an outsourcing model, analyzing how blockchain’s traceability function enables consumers to identify the outsourcing production relationship between enterprises, thereby triggering blockchain’s spillover effect. This provides a new perspective for understanding the application effects of blockchain and its multifaceted impacts on supply chain dynamics in a co-opetitive scenario.
The remainder of this paper is structured as follows. The next section reviews the related literature. The third section introduces the model setup, notations, and assumptions. In the fourth section, we derive the impacts of different parameters on the firms’ decisions and compare the decision-making differences between Brand O and the CM across various modes. In the fifth section, we conduct a numerical analysis. Finally, the sixth section summarizes the conclusions and provides an outlook for future research directions.
2. Literature Review
2.1. Literature Review on Blockchain Applications in Supply Chain
Blockchain technology, as a decentralized and tamper-resistant ledger for transaction data, gained prominence through the issuance of cryptocurrencies such as Bitcoin [16]. As a general-purpose technology, blockchain is regarded as an “enabler” of innovation rather than a complete solution [17]. Consequently, blockchain technology can support existing innovations to achieve new objectives and has been applied across various domains.
Owing to its unique characteristics, the emergence of blockchain has attracted significant attention from both academia and industry [18]. Numerous scholars have explored the application of blockchain technology in supply chains across different sectors. To address issues of information asymmetry and centralization in the ride-hailing industry, Wan et al. [19] introduced a consortium blockchain to construct a game-theoretic model, demonstrating how blockchain can provide technical credit support to create a trustworthy environment. Giovanni et al. [20] proposed that blockchain can serve as a digital alternative to traditional online platforms, leveraging its decentralization, information visibility, and immutability to reduce transaction costs and risks in supply chains while enhancing transaction transparency. In the construction industry, Zhang et al. [21] investigated the use of blockchain technology to address the “information silo” problem among participants in modular integrated construction (MiC), thereby fostering mutual trust and improving collaborative efficiency. Mssassi and Kalam [22] focused on mitigating malicious behavior in blockchain networks, utilizing their decentralized nature to design an incentive model that optimizes node behavior, promotes fair incentives, and suppresses malicious actions.
Leveraging blockchain’s traceability and tamper-resistant properties, numerous scholars have incorporated it into green supply chains to examine the responses and impacts of game-theoretic participants, such as consumers, companies, and governments, under traceability scenarios for green products. Zhao et al. [23] utilized blockchain as a tool to enhance transparency and credibility in green supply chains, demonstrating its positive effects on green product pricing and sustainability under specific conditions. Moniruzzaman et al. [24] applied blockchain technology as a secure, transparent, and decentralized platform for peer-to-peer energy trading, incentivizing producer-consumer coalitions to maximize benefits by reducing distribution losses and earning mining rewards. In the context of an e-commerce closed-loop supply chain (E-CLSC), Ma et al. [13] employed blockchain to improve the transparency and credibility of the recycling process, proving that the economic value of blockchain deployment surpasses its initial costs. To explore the balance between bidding strategies and carbon reduction targets for power generation firms in emerging green certificate markets, Cheng et al. [25] integrated blockchain with carbon markets to provide a unified data platform supporting joint transactions, successfully enhancing the efficiency and reliability of market mechanisms. Utilizing blockchain’s traceability, Zhang et al. [26] combined blockchain with the Internet of Things to develop a carbon footprint tracing system for low-carbon supply chains, validating its effectiveness.
Thus, scholars have conducted detailed research on blockchain applications, particularly in green supply chains. However, a frequently overlooked issue is that the traceability effects of blockchain, when transmitted through the supply chain, may trigger more complex game-theoretic dynamics between downstream retailers and upstream manufacturers or suppliers. This can lead to the flow and transfer of factors such as brand value and consumer trust in green products along the blockchain. This phenomenon is particularly pronounced in green supply chains characterized by both outsourcing collaboration and multi-channel competition.
2.2. Research on Multi-Channel Competition in Supply Chain Based on Outsourcing Models
In global manufacturing, outsourcing collaboration between firms is a critical factor influencing supply chain efficiency and sustainability. In recent years, research on supply chains under such outsourcing models has proliferated. Based on a supply chain with outsourced procurement, Niu et al. [4] explored whether coordinating economic and environmental sustainability is feasible under turnkey and consignment modes. Chen et al. [27] constructed a supply chain comprising a CM, a larger original equipment manufacturer (OEM), and a smaller OEM, demonstrating that OEMs’ preferences between buy-sell and turnkey modes depend primarily on factors such as the volatility of CM component prices and component costs. Hsu et al. [28] showed that when firms outsource procurement to competitive buyers, the latter can leverage their procurement decision-making power to influence production by reducing purchase quantities. Xu et al. [29] developed a supply chain model involving an OEM, a CM, and a multinational firm (MNF), examining how differential tax treatments affect the choice between consignment and turnkey strategies. Through the analysis of three game-theoretic scenarios, Wang et al. [30] found that both buyers and manufacturers prefer to assume leadership in Stackelberg games, with competition significantly suppressing manufacturers’ wholesale prices, particularly when outsourcing quantities and wholesale prices are decision variables.
Research on the competition between upstream manufacturers’ direct channels and retail channels has also grown. Spiegel [31] analyzed two types of horizontal subcontracting contracts, showing that when manufacturing profits are sufficient, the CM lacks motivation to sell its own products. Li et al. [32] investigated a dual-channel supply chain comprising a manufacturer’s direct channel and a retail channel, demonstrating through four models the correlation between consumer return rates and manufacturers’ channel choices. To explore how retailers should select product lines when facing challenges from manufacturers’ direct sales channels, Pan [33] analyzed a market with two horizontally differentiated products, proving that retailers ordering only one product can mitigate inter-channel competition. Sharma and Jain [34] examined a dual-channel co-opetitive supply chain involving one manufacturer and one retailer, deriving optimal pricing strategies for channel members and analyzing the impact of fairness and bargaining power on profits. Liu et al. [35] discussed how high market volatility incentivizes manufacturers to expand direct sales channels.
These studies explore the characteristics of supply chains under outsourcing models and the competitive dynamics between upstream manufacturers’ direct sales channels and retail channels from multiple perspectives. However, existing literature rarely addresses how brand value is transmitted along the supply chain and its implications in a co-opetitive model involving a high brand value Brand O and a CM, particularly the potential complexities of this effect when blockchain technology is introduced to enhance green supply chain transparency.
2.3. Research Gap
Prior studies have thoroughly explored the role of blockchain technology in enhancing supply chain transparency, credibility, and sustainability, as well as meticulously analyzed the competitive and cooperative dynamics of enterprises under various strategic modes. However, these studies rarely address the complex game-theoretic interactions triggered by blockchain’s traceability function in a co-opetitve environment, nor their impacts on upstream and downstream supply chain participants, particularly those with differentiated brand values. This limits a comprehensive understanding of blockchain’s effects. In contrast to existing literature, this study introduces blockchain technology into a co-opetitive supply chain, focusing on the transfer of brand value and consumer trust, namely, the spillover effect, which is triggered during the traceability process, thereby providing a more comprehensive elucidation of the dynamic evolution mechanisms of supply chain under blockchain intervention.
3. Model Construction
3.1. Problem Description and Assumptions
We develop a stylized model in which Brand O (he, denoted by O) and the contract manufacturer (CM, she, denoted by M) engage in a Stackelberg competition in the downstream retail market. In the upstream segment, due to their service relationship, they act as business partners. Specifically, the CM undertakes production and sells a portion of the finished products to Brand O, which Brand O then retails directly to the market. The remaining portion of the finished products is sold directly to the market under the CM’s own brand. Figure 1 illustrates the supply chain structure of this study.
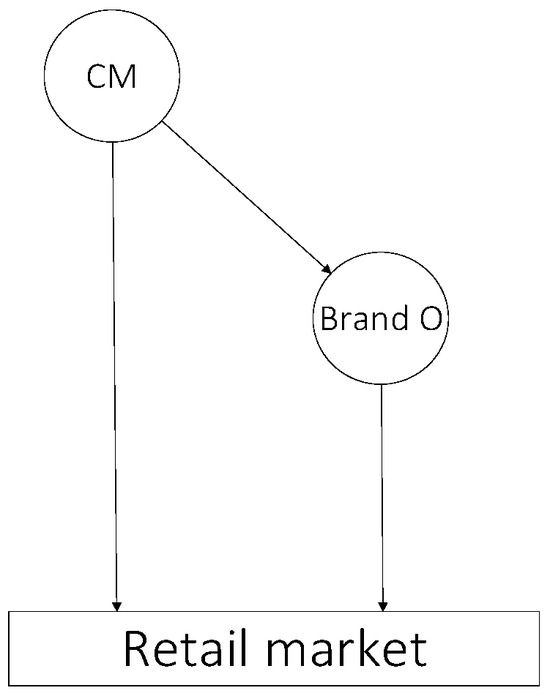
Figure 1.
Supply chain structure diagram.
In our supply chain, the CM produces products and wholesales them to Brand O at a unit wholesale price . Brand O and the CM retail homogeneous products in the market at retail prices and , respectively. Either Brand O or the CM may adopt blockchain, or neither may adopt it. The party adopting blockchain incorporates its retail products into a blockchain system for consumer traceability, allowing consumers to track the entire process from production to sale. This implies that if Brand O adopts blockchain, consumers can trace the production of its products to the CM, whereas if the CM adopts blockchain, Brand O’s retail products cannot be traced.
Assumption 1.
For computational simplicity, we assume the CM’s production cost is zero [36].
Assumption 2.
The total utility consumers derive from purchasing a product comprises economic effects, environmental effects, and brand effects. The economic effect is directly influenced by the prices of the purchased product and its competing product, . The cross-price elasticity coefficient, , reflects the extent to which the competing product’s price affects sales, where .
Assumption 3.
The environmental effect for consumers depends on the product’s green design level, [37], where , consumers’ sensitivity to green design (environmental awareness level), , where , and consumers’ trust in green products (the extent to which consumers believe in the green attributes of the products sold by firms). The term collectively represents the green synergy effect of the product. For simplicity, we treat as a parameter rather than a decision variable.
Assumption 4.
The blockchain cost borne by the adopting firm is [38], where represents blockchain cost sensitivity, , and denotes consumers’ skepticism toward blockchain [23].
Assumption 5.
For products that cannot be traced via blockchain, we assume consumers’ baseline trust in their green attributes, , is a positive parameter [39], where . In this case, the environmental effect of purchasing a unit product is . For products traceable via blockchain, consumers can accurately ascertain the product’s environmental value, yielding an environmental effect of per unit. can be influenced by the blockchain−adopting firm through varying blockchain cost investments, with .
Assumption 6.
If Brand O adopts blockchain, the CM benefits from a spillover of consumer trust in green products induced by blockchain, quantified as , where represents the intensity of the spillover effect, and .
Assumption 7.
In our supply chain structure, Brand O possesses a higher brand value than the CM. For simplicity, we assume Brand O’s brand value is , while the CM has no brand value [40]. If Brand O adopts blockchain for product traceability, consumers discover that Brand O’s products are manufactured by the CM, resulting in a partial loss of Brand O’s brand value, which transfers to the CM. Consequently, Brand O’s brand value becomes [41], and the CM gains a brand value of .
Assumption 8.
To ensure the negative definiteness of second-order derivatives and the economic feasibility of relevant functional expressions, we set .
3.2. Model Building and Solving
In this supply chain structure, all game participants aim to maximize their profits. To investigate the impact of different blockchain adoption strategies on the game, we consider three game modes. Mode N: Neither Brand O nor the CM adopts blockchain traceability; Mode O: Brand O develops a blockchain system, bears and adjusts the associated blockchain costs, and applies blockchain traceability to its retail products, while the CM’s retail products are not included in Brand O’s blockchain system; Mode M: The CM implements a blockchain system, bears and adjusts the associated blockchain costs, and applies blockchain traceability to its retail products, while Brand O’s retail products are not included in the CM’s blockchain system.
3.2.1. Mode N
Based on the research of Li et al. [32] and Xu et al. [42], as well as the above assumptions, the demand functions of the firms are shown in Equations (1) and (2).
The profit functions of the firms are shown in Equations (3) and (4).
In this mode, the CM first determines the wholesale price , and then Brand O and the CM simultaneously determine their retail prices and . The decision sequence is illustrated in Figure 2.
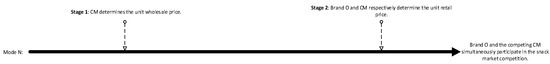
Figure 2.
The decision sequence is illustrated in Mode N.
By employing inverse deduction, we derive the equilibrium retail prices as shown in Equations (5) and (6).
Consequently, the equilibrium wholesale price is shown in Equation (7)
The equilibrium sales volumes are shown in Equations (8) and (9).
Finally, the equilibrium profits are shown in Equations (10) and (11).
3.2.2. Mode O
Based on the research of Li et al. [32], Xu et al. [42], and Zhang et al. [41], as well as the above assumptions, the demand functions of the firms are shown in Equations (12) and (13).
The profit functions of the firms are shown in Equations (14) and (15).
In this mode, Brand O first determines the level of consumer skepticism toward blockchain traceability, In this mode, Brand O first determines the level of consumer skepticism toward blockchain traceability, . Finally, Brand O and the CM simultaneously determine their retail prices, and . The decision sequence is illustrated in Figure 3.
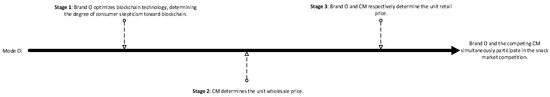
Figure 3.
The decision sequence is illustrated in Mode O.
By employing inverse deduction, we derive the equilibrium retail prices as shown in Equations (16) and (17).
Next, the equilibrium wholesale price is shown in Equation (18).
Subsequently, we derive the equilibrium level of consumer skepticism as shown in Equation (19).
Based on the above, the equilibrium sales volumes are shown in Equations (20) and (21).
Finally, the equilibrium profits are shown in Equations (22) and (23).
3.2.3. Mode M
Based on the research of Li et al. [32] and Xu et al. [42], as well as the above assumptions, the demand functions of the firms are shown in Equations (24) and (25).
The profit functions of the firms are shown in Equations (26) and (27).
In this mode, the CM first determines the level of consumer skepticism toward blockchain traceability, . Subsequently, the CM determines the wholesale price . Finally, Brand O and the CM simultaneously determine their retail prices, and . The decision sequence is illustrated in Figure 4.
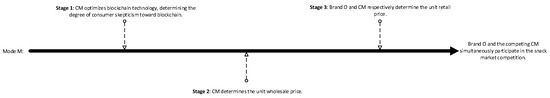
Figure 4.
The decision sequence is illustrated in Mode M.
By employing inverse deduction, we derive the equilibrium retail prices as shown in Equations (28) and (29).
Next, the equilibrium wholesale price is shown in Equation (30).
Subsequently, we derive the equilibrium level of consumer skepticism as shown in Equation (31).
Based on the above, the equilibrium sales volumes are shown in Equations (32) and (33).
Finally, the equilibrium profits are shown in Equations (34) and (35).
4. Analysis
In this section, we compare the equilibrium solutions across the three modes, analyzing the impact of different parameters on the decisions of Brand O and the CM, as well as the differences in their decision-making under various modes.
Proposition 1.
(a) , . (b) , , . (c) , .
Proof.
Since , , and , it follows that , , and , where □
Proposition 1 (a) and Proposition 1 (b) indicate that an increase in the cross-price elasticity coefficient prompts both Brand O and the CM to raise retail prices and achieve higher sales volumes. This stems from enhancing product substitutability, making it easier for consumers to switch between the two brands’ products. For instance, when the price of the CM’s product, , increases, some consumers shift to Brand O’s products, leading to an increase in Brand O’s demand. Similarly, the CM can capture additional market share based on the same logic. As a result, the overall market demand expands, consistent with Werden’s findings [43]. Under this premise, the incentive for a price war diminishes, and firms are more inclined to raise prices to capitalize on demand growth while maintaining profit stability, leading to higher retail prices.
However, beyond the retail market, Proposition 1 (c) suggests that the cross-price elasticity coefficient also positively impacts the CM’s wholesale price . A possible explanation is that higher retail demand increases Brand O’s reliance on the CM’s supply and its tolerance for cost increases. This strengthens the CM’s bargaining power, motivating it to raise . This phenomenon is particularly pronounced in the co-opetition model, where the CM acts as both Brand O’s supplier and retail competitor; it is more inclined to adjust the wholesale price to secure a more advantageous strategic position in the supply chain.
Proposition 2.
(a) , , . (b) , , . (c) , .
Proof.
Since , , and , it follows that , , and , where □
Through Proposition 2 (a) and Proposition 2 (b), we find that an increase in the green synergy effect prompts both Brand O and the CM to raise retail prices across all three modes. This phenomenon stems from the enhanced green attributes positively driving consumers’ willingness to pay. When increases, consumers place greater value on the environmental benefits of products, making them willing to pay a premium for green design. An increase in reflects a higher level of product greenness, further strengthening consumers’ purchase incentives. Consequently, the rise in expands market demand, and this positive demand-side feedback provides Brand O and the CM with the opportunity to increase prices without sacrificing demand, thereby improving unit profit margins.
Proposition 2 (c) reveals the relationship between the product’s environmental effect and the wholesale price. Consistent with Proposition 1 (c), the expansion of the retail market heightens Brand O’s dependence on the CM’s supply and its tolerance for higher costs, thereby enhancing the CM’s bargaining power. Similarly, an increase in the product’s environmental effect produces a comparable impact, positively affecting the wholesale price . Thus, green value not only generates benefits in the retail market but also propagates upstream through the supply chain, contributing to the CM’s profit growth. This underscores the significant role of environmental value in the market and its pervasive positive effect across the entire supply chain.
Proposition 3.
(a) . When , ; otherwise, . (b) , . (c) .
Proof.
Since , it follows that and , where Since , it follows that . And when , ; otherwise, . □
The results of Proposition 3 (a) indicate that in Mode O, the spillover effect induced by blockchain leads to a shift of brand value and consumer trust in green products from Brand O to the CM. This phenomenon originates from consumers’ anchoring effect [44]. Upon discovering a lower-priced substitute from the contract manufacturer, consumers use its price as an anchor, perceiving Brand O’s pricing as excessive, which diminishes their recognition of Brand O’s brand while increasing their approval of the CM’s brand. However, blockchain traceability ensures the credibility of Brand O’s green attributes, leaving its environmental effect intact. Consequently, causes a loss of Brand O’s brand value and a decline in its retail price. Meanwhile, the CM, under pressure from Brand O’s price reduction, is forced to lower its price when the green synergy effect is relatively low. Conversely, when the gains dominate, positively impacts the CM’s retail price. Therefore, in mode O, blockchain transparency poses a direct threat to Brand O’s pricing power, while the CM’s pricing decisions require further consideration of market factors, as blindly raising prices may not be viable.
Proposition 3 (b) reflects that the intensity of the spillover effect further amplifies the market divergence between Brand O and the CM at the demand level. Consistent with Proposition 3 (a), an increase in leads to a decline in Brand O’s sales volume . In contrast, consistently exerts a positive effect on . This suggests that, at the demand level, the benefits brought by can offset the adverse impact of competitive pressure. This result highlights Brand O’s dilemma: while adopting blockchain may enhance the credibility of its green products, it risks weakening its competitive position due to the spillover effect, allowing the CM to gain an advantage in the retail market.
Recalling the conclusions of Proposition 1 (c) and Proposition 2 (c), we observe that the wholesale price is closely tied to Brand O’s retail price and market demand. Consequently, the adverse impact of on Brand O indirectly weakens the CM’s bargaining power; the CM is compelled to lower its wholesale price to stimulate Brand O’s order volume, thereby securing its production revenue. This indicates that the benefits of spillover effect are primarily concentrated in the CM’s retail operations rather than its wholesale market. Thus, the CM must carefully balance its strategies, as its long-term profits depend on maintaining equilibrium between retail expansion and supply chain stability, rather than solely relying on spillover effect. A sustained deterioration in Brand O’s market position could undermine the CM’s wholesale revenue.
Proposition 4.
(a) . (b) . (c) .
Proof.
Since and , it follows that , , , , and . □
Proposition 4 (a) indicates that an increase in the cross-price elasticity coefficient incentivizes firms to optimize blockchain technology, reducing the level of consumer skepticism toward blockchain . Recalling the conclusions of Proposition 1 (a) and Proposition 2 (b), an increase in improves firms’ retail market performance, incentivizing them to invest in blockchain technology to reduce . The findings of Proposition 4 (b) further reveal that similarly encourages technical optimization. This result corroborates Proposition 2 (b), highlighting the role of the product’s environmental effect in unlocking market potential, with blockchain optimization amplifying this potential. Consequently, when is high, firms are inclined to intensify technical optimization efforts to lower consumer skepticism .
Furthermore, the result of Proposition 4 (c) suggests that when Brand O adopts blockchain, the spillover effect weakens its motivation to optimize blockchain technology. This phenomenon reaffirms the conclusions of Proposition 3 (a) and Proposition 3 (b). As increases, the loss of brand value and intensified competition due to the spillover effect escalate. Therefore, Brand O’s motivation to invest in blockchain technology is diminished. This further underscores the dual nature of blockchain technology for Brand O in this specific supply chain: while it enhances green credibility, the risk of brand value erosion caused by suppresses its enthusiasm for technical optimization.
Proposition 5.
(a) When , ; When , . (b) When , . Otherwise, .
Here, , , , , , , , , , and .
The proof of Proposition 5 is given in Appendix A.
Proposition 5 (a) indicates that, compared to Mode N, Brand O’s adoption of blockchain (Mode O) does not necessarily lead to higher retail prices. This is particularly evident when consumers already have a high baseline trust level . This result reveals the complex impact of blockchain on the supply chain. In markets where consumer trust in firms is low, firms urgently need blockchain to build trust. In this case, the marginal benefits of blockchain are sufficient to offset the losses from the spillover effect, prompting Brand O to raise prices. Conversely, when the marginal benefits of blockchain fail to counterbalance adverse market impacts, Brand O not only cannot leverage enhanced trust to increase prices but is forced to lower prices due to competitive pressures.
Furthermore, we find that in Mode M, Brand O can consistently set a higher retail price than in Mode N. This stems from the CM’s price strategy adjustments and the overall expansion of market size in Mode M. As shown in Proposition 5 (b), the CM can always set the highest retail price in Mode M. As Brand O’s upstream partner, the CM’s adoption of blockchain allows it to exclusively enjoy benefits, and avoid intensified market competition caused by spillover effect. Moreover, recalling Proposition 2 (b), a higher environmental effect contributes to overall market size expansion. Together, these factors provide a foundation for the CM to raise retail prices. As a competitor, this indirectly creates conditions for Brand O to raise prices. Thus, when the CM leverages blockchain to target the high-end market, Brand O can capitalize on this market shift to secure greater profits and avoid a price war trap. The specific impact on sales volume will be detailed in Proposition 6.
Meanwhile, when Brand O adopts blockchain (Mode O), the CM’s pricing flexibility is constrained by , as it simultaneously experiences the positive impact of the spillover effect and the negative impact of intensified competition. When is high, the CM is forced to lower its price, resulting in the lowest retail price among the three modes. This result further underscores the profound influence of on blockchain’s marginal benefits and pricing strategies.
Therefore, Brand O is inclined to adopt blockchain to target the high-end market only when L is low, whereas the CM can leverage blockchain to enter the high-end market under any conditions. This result also relates to the differing motivations of Brand O and the CM to optimize blockchain technology, which we will further elaborate on in Proposition 8.
Proposition 6.
(a) When , ; otherwise, . (b) When and , ; otherwise, .
Here, and .
The proof of Proposition 6 is given in Appendix A.
Proposition 6 (a) further reflects the coexistence of benefits and risks when Brand O adopts blockchain. Due to the spillover effect, blockchain adoption does not necessarily lead to increased sales for Brand O, particularly when the spillover effect intensity is high. Therefore, before deciding to adopt blockchain, Brand O should thoroughly assess the market environment and opt for self-developed blockchain only when spillover effects are weak.
However, an intriguing phenomenon is that Brand O’s sales volumes in Mode N and Mode M are equal ( = ), which appears counterintuitive. In Mode M, the CM’s blockchain adoption intensifies market competition, and Brand O’s lack of supply chain transparency might be expected to erode its market share. A possible explanation is that the CM, by raising its retail price to target the green high-end market, indirectly cedes part of the consumer market to Brand O. Additionally, the enhanced green effect expands the overall size of the green market without directly encroaching on Brand O’s existing share, resulting in no significant impact on Brand O’s sales. This finding also corroborates the phenomenon in Proposition 5 (a), providing a basis for Brand O to increase its retail price.
Proposition 6 (b) indicates that the CM can consistently achieve the largest market share when adopting blockchain. Compared to relying on the spillover effect, self-developed blockchain, while unable to capture brand value benefits, allows the CM to exclusively enjoy environmental effect gains and avoid the negative impact of intensified competition. Thus, for the CM, enhancing product environmental effects, such as improving the green design level of its retail products through blockchain, represents a superior short-term strategy for increasing product value and targeting the high-end market, compared to focusing on brand value enhancement.
Furthermore, we observe that while spillover effects appear to benefit the CM, they do not necessarily lead to increased sales, particularly when brand value is low and consumers already have sufficient trust in firms. Recalling Proposition 5, blockchain’s marginal benefits are directly influenced by . Additionally, when brand value is insufficient, the spillover effect more significantly compresses Brand O’s market advantage, intensifying competition. Consequently, high and low force the CM to face declining sales. Conversely, under favorable conditions, the CM can drive sales growth. This suggests that the CM should adjust its strategies based on market dynamics when leveraging the spillover effect, rather than blindly increasing production.
Proposition 7.
When , . When , .
Here, , , , , , , , .
The proof of Proposition 7 is given in Appendix A.
Recalling Proposition 5 and Proposition 6, blockchain’s marginal benefits are affected by the level of consumer baseline trust . Consequently, when is high, the marginal benefits of blockchain for Brand O are further diminished, weakening its performance in the retail market and indirectly forcing the CM to lower its wholesale price Conversely, when is low, blockchain can still improve Brand O’s market performance, providing the CM with the opportunity to raise the wholesale price.
Furthermore, compared to Mode N, the CM’s adoption of blockchain (Mode M) consistently enables it to increase the wholesale price. This phenomenon stems from the overall expansion of market size and adjustments in market prices, which enable increased profits for Brand O, thereby enhancing the CM’s bargaining power. Therefore, self-developed blockchain not only enables the CM to target the high-end retail market and expand market share but also indirectly boosts wholesale market profits through supply chain synergy, fully demonstrating its dual strategic value.
Proposition 8.
The CM’s motivation to adopt blockchain is greater than Brand O’s, i.e., .
Proof.
Since and , . □
Proposition 8 reveals a counterintuitive conclusion: compared to Brand O, which has a higher brand value, the CM is more inclined to adopt blockchain to promote green products. This indicates that the spillover effect significantly diminishes Brand O’s benefits from adopting blockchain, reducing its investment willingness. In contrast, the CM can exclusively enjoy the benefits of blockchain, compensating for its brand disadvantage. Therefore, the CM is more motivated to increase technological investment to achieve a market breakthrough.
Furthermore, this result also explains the pricing differences between Brand O and the CM in Mode O and Mode M, as noted in Proposition 5 (c). Under certain conditions, blockchain adoption by either party can simultaneously drive price increases for both Brand O and the CM. However, due to the CM’s stronger motivation to optimize blockchain technology, the positive market impact of blockchain is greater in Mode M. This effect is particularly pronounced when is high, amplifying the disparity in benefits between Brand O and the CM’s blockchain adoption. Consequently, compared to Mode O, both Brand O and the CM can set higher retail prices in Mode M.
5. Numerical Analysis
In this section, we analyze the impact of key variables on firms’ decisions through numerical analysis, focusing on comparing the decision differences and profit disparities between Brand O and the CM within the same scenario. Based on the general constraints that parameters must satisfy during the equilibrium solution process, combined with practical reasonableness, the parameters are set as follows: , , , , , .
5.1. Comparison of Retail Prices Between Brand O and the CM
We analyzed the impact of the green synergy effect on the retail prices of Brand O and the CM across the three modes and compared their retail prices. Based on the aforementioned baseline parameters, combined with practical managerial implications, we set , . The specific trends are shown in Figure 5.
Figure 5.
Impact of on sales volume.
As depicted in Figure 5, in both Mode M and Mode O, Brand O consistently sets a higher retail price than the CM, regardless of changes in . This indicates that when the CM has not adopted blockchain technology, Brand O can leverage its brand value advantage to maintain a higher retail price, retaining this advantage even in the presence of the spillover effect.
Further examining the price gap between Brand O and the CM in the figure, we observe that as increases, their prices exhibit a nearly synchronized upward trend. This phenomenon reveals the CM’s pricing strategy dilemma when it lacks a unique competitive advantage. Specifically, when the CM lacks independent core competitiveness, the improvement in environmental effects, while to some extent weakening the dominant role of brand value v in pricing, does not enable the CM to set a relatively higher price. This suggests that brand value remains the primary driver of price differences, while does not provide the CM with sufficient independent leverage to alter the existing pricing landscape.
However, when the CM adopts blockchain, the situation changes significantly. As increases, the CM’s retail price gradually surpasses that of Brand O. This phenomenon further confirms the strategic significance of the environmental effect for the CM. As the party with a relative brand value disadvantage, the CM would typically require a long period to penetrate the high-end market by relying solely on accumulated product reputation. Yet, the traceability feature of blockchain can enhance the perceived green value of the CM’s products in the short term, creating a unique competitive advantage. This enables the CM to penetrate the high-end market more efficiently.
5.2. The Impact of Consumer Base Trust on Sales
In our previous analysis, we found that consumer baseline trust is a critical factor influencing the product’s environmental effect in the supply chain market, while also directly affecting the marginal benefits of blockchain technology. To explore its mechanism, this subsection compares the impact of on sales volume in Mode N and Mode M. Based on the aforementioned baseline parameters, combined with practical managerial implications, we set . The results are shown in Figure 6.
Figure 6.
Impact of on sales volume.
As depicted in Figure 6, in Mode N, as increases, the sales volumes of both Brand O and the CM rise to varying degrees, and the CM experiences a greater increase, gradually surpassing Brand O. This phenomenon stems from differences in their price and product effect compositions. When is high, the product’s environmental effect strengthens, reducing the proportion of brand value in the total product effect. Consequently, the added−value gap between Brand O and the CM narrows, making price the dominant factor in sales. Thus, the CM leverages its lower price to progressively gain market dominance. This reveals the differential impact of product effect components on firms’ competitiveness. Brand O’s brand value advantage is not inherently stable; only when it significantly outweighs other effects can Brand O further increase prices and product quality to expand market share. Conversely, Brand O must promptly recognize the declining role of brand value and adjust its strategy accordingly.
Figure 6 also shows that when the CM adopts blockchain, it invariably secures a larger market share, regardless of the strength of consumer baseline trust. This finding echoes the conclusions of Figure 5, underscoring the importance of blockchain as an effective tool for rapidly enhancing competitive advantage. For the CM, which is at a market disadvantage, early adoption of blockchain technology is a critical strategy for seizing market opportunities. Through blockchain, the CM not only strengthens consumer trust in its products but also amplifies its price advantage, enabling it to stand out in the competition.
Notably, in mode M, as increases, the sales gap between Brand O and the CM widens. This contradicts the general conclusion that diminishes blockchain’s marginal effect. A possible explanation is that when is high, the CM, to counter competitive pressure, further intensifies its investment in blockchain technology, thereby artificially amplifying blockchain’s beneficial effect. This strategy makes the CM’s sales advantage more pronounced, further widening the gap with Brand O.
5.3. Analysis of Spillover Effect Under Competitive Interaction
The following analysis examines the impact of increasing spillover effect intensity on the retail prices, sales volumes, and profits of Brand O and the CM. Based on the aforementioned baseline parameters, combined with practical managerial implications, we set , . The results are shown in Figure 7.
Figure 7.
Impact of on retail price, sales volume, and profit.
We find that as α increases, both the retail prices and sales volumes of Brand O and the CM exhibit a declining trend, consistent with previous results. Additionally, when α is sufficiently high, the CM’s sales volume may surpass that of Brand O, though its retail price remains lower than Brand O’s. This further indicates that the CM, lacking a unique competitive advantage, can rely on the spillover effect to increase sales but struggles to capture the high-end market. Another possible reason is that Brand O must bear high procurement costs, which limit its ability to reduce prices. This further suggests that the CM should avoid over-reliance on the spillover effect, as doing so may lead to missed opportunities to proactively develop proprietary technologies and competitive advantages.
In particular, as rises, the CM’s profits initially decline before increasing. This phenomenon results from the tradeoff between intensified market competition and the benefits of the spillover effect. Recalling earlier conclusions, while the spillover effect enables the CM to gain profits, it also exacerbates market competition. Thus, a low fails to offset the losses from intensified competition, leading to a decline in the CM’s profits. This further illustrates the complex impact of Brand O’s blockchain adoption: under certain conditions, blockchain may reduce the overall profits of the supply chain. This serves as a cautionary note for both Brand O and the CM, urging them to carefully balance technology investments with market competition dynamics in their strategic decision-making.
5.4. Profit Analysis
We analyzed the impact of brand value on the profits of Brand O and the CM, focusing on comparing the evolution of the profit gap between Brand O and the CM across different modes as changes. Based on the aforementioned baseline parameters, combined with practical managerial implications, we set . The results are shown in Figure 8.
Figure 8.
Impact of on profit.
Brand value, as a critical factor in market expansion, plays a significant role in profit enhancement, which is consistent with general intuition. Surprisingly, however, despite Brand O’s higher brand value and its position as the market leader and dominant party in the supply chain, it still fails to secure the highest profits in the supply chain. A possible explanation is that the CM benefits from dual profit sources by simultaneously serving Brand O and selling products directly to the retail market. In contrast, Brand O’s profit margin is constrained by the wholesale fees paid to the CM and competitive pressures in the market. In this scenario, the CM gains the upper hand in the bargaining process by controlling the wholesale price , consistently maintaining a profit advantage within the supply chain.
Furthermore, Brand O’s constraints on the supply side lead to another conclusion that contradicts common expectations: as brand value increases, the CM’s profit advantage over Brand O widens further. This result further confirms that the CM’s profit growth largely stems from its absolute control over the wholesale market. While Brand O strengthens its position in the retail market by capitalizing on brand value, the CM captures a larger share of supply chain profits through enhanced bargaining power in the wholesale market, limiting Brand O’s profit growth and widening the profit gap between the two.
This reveals a critical paradox in the supply chain: brand value and market leadership do not necessarily translate into profit advantages. In a multi-channel competitive environment under the contract manufacturing model, the CM’s “dual role” as a manufacturer endows it with greater flexibility and bargaining power, while Brand O may face hidden disadvantages due to its supply chain dependency. This highlights the potential profit allocation advantage of contract manufacturers in the supply chain and serves as a warning for Brand O to prevent excessive supplier dominance and curb their expansion of control over the supply chain in a timely manner.
5.5. Mode Selection Analysis
We analyzed the impact of the blockchain cost coefficient and consumer baseline trust on the profits of Brand O and the CM, comparing the profit differences between Brand O and the CM across different modes to provide insights for their strategic choices. Based on the aforementioned baseline parameters, combined with practical managerial implications, we set , , , and . The results are shown in Figure 9.
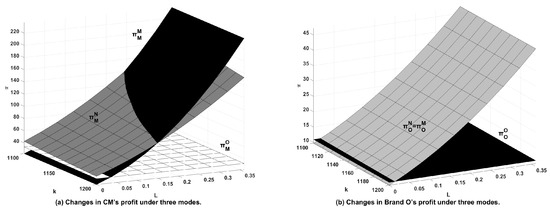
Figure 9.
The analysis of profit.
Consistent with previous findings, Brand O’s adoption of blockchain does not necessarily lead to profit growth. Therefore, Brand O is inclined to adopt blockchain only when blockchain costs are low or consumer trust in the firm is lacking. This urges Brand O to carefully evaluate the multifaceted impacts of blockchain to avoid adverse consequences from blindly adopting new technologies.
In earlier comparisons, we found that Mode M, while not affecting Brand O’s sales volume, prompted Brand O to raise its retail price. Thus, one might expect Brand O to achieve higher profits in Mode M. Interestingly, however, Brand O’s profits in Mode M remain unchanged compared to Mode N. This indicates that while Brand O increases its retail price, the higher wholesale price correspondingly raises costs, making it difficult for Brand O’s profits to grow. This stability indicates that Brand O need not rush to follow competitors’ innovative strategies to protect profits and warns it to guard against competitors leveraging dual pressures from the retail and wholesale markets to hinder its profit growth.
Similar to Brand O’s dilemma, the CM must also weigh the costs and benefits of blockchain adoption. When consumers have sufficient trust in the firm or blockchain costs are too high, the CM is likewise inclined to forgo blockchain. The difference is that the CM is unaffected by the spillover effect. Consequently, the CM’s adoption of blockchain typically yields higher marginal returns. When is at a moderate level, Brand O can no longer profit from blockchain, yet the CM still prefers to adopt it.
Furthermore, we find that under the influence of the spillover effect, the CM’s profits are not always higher than in the no-blockchain scenario (Mode N). As discussed previously, the spillover effect exacerbates market competition. When is high, the spillover effect may simultaneously erode the profits of both Brand O and the CM, even though the CM can “free-ride” on shared brand value and consumer trust in green products. This serves as a reminder for the CM to avoid cognitive biases and comprehensively assess the impact of market dynamics in complex market interactions, as apparent benefits may not be genuine.
6. Conclusions and Implications
6.1. Conclusions
Outsourcing has become a common strategic decision for Brand Os and CMs to optimize operations and enhance competitiveness, particularly when CMs use the same components/materials to produce and sell substitute products. The co-opetitive relationship between contract manufacturers and competing firms alters the benefits of procurement outsourcing, thereby reshaping the supply chain structure. In this context, Brand O and a CM must comprehensively evaluate the gains and losses from upstream collaboration and downstream competition. Moreover, when blockchain is introduced into this supply chain, complex effects, such as increased consumer trust, spillover effect, and intensified market competition, introduce greater uncertainty into decision-making. Therefore, we analyzed three scenarios: no blockchain (Mode N), Brand O adopting blockchain (Mode O), and the CM adopting blockchain (Mode M).
We draw the following conclusions: (1) The CM holds absolute control in the wholesale market, consistently capturing the majority of supply chain profits and limiting Brand O’s profit growth. (2) In a co-opetitive relationship between Brand O and the CM, the CM has greater motivation to develop and optimize blockchain technology. (3) When the spillover effect occurs, Brand O’s profits from adopting blockchain are significantly reduced. (4) For the weaker party in the retail market, leveraging emerging technologies like blockchain is an effective means to rapidly expand market share and enhance product effects in the short term. (5) When the competitors strengthen their competitiveness through factors such as brand value or environmental effects, the firms need not rush to respond, given the market-expanding nature of these factors. Instead, they should make prudent decisions to avoid triggering complex chain reactions that harm their interests. (6) Blockchain adoption by Brand O and the CM is only advisable when the implementation costs are low or baseline consumer trust is low. However, due to the spillover effect, Brand O is generally not inclined to adopt blockchain in a wider range of scenarios, as it often leads to significant profit reductions.
6.2. Implications
Based on the research findings, this paper offers valuable insights from the perspectives of scholars, managers, and practitioners.
- (1)
- From the scholar’s perspective, this paper reveals the dominant position of a CM in the wholesale market and its impact on supply chain profit distribution, providing empirical evidence for understanding supply chain dynamics under power asymmetry. Additionally, the introduction of blockchain technology and its complex effects on cooperation and competition within the supply chain offer insights that enhance the understanding of blockchain’s impact, contributing to this literature stream.
- (2)
- From the manager’s perspective, the research findings provide guidance for strategic decision-making. First, a CM’s dominant position in the supply chain suggests that Brand O managers should cautiously assess the risks of unequal profit distribution when collaborating with a CM, striving to avoid scenarios where a single supplier dominates. Second, while blockchain technology enhances consumer trust, it also introduces a spillover effect that may erode corporate profits. Thus, managers must weigh the costs and benefits of technology investments, prioritizing applications that significantly enhance brand value or product differentiation. Moreover, the “free-riding” effect brought by spillover does not always provide a CM with a competitive advantage. Decision-makers should focus on building exclusive core competencies to comprehensively address complex market dynamics, as this is crucial for enterprises to gain a relative competitive edge in intense competition.
- (3)
- From the practitioner’s perspective, this paper provides actionable insights for supply chain practitioners. First, practitioners should focus on optimizing outsourcing contracts to ensure fair profit distribution in the supply chain. Second, the complexity of blockchain’s impact reminds practitioners to conduct thorough research and testing before implementation, and to take meticulous preventive measures against potential negative effects. Finally, in response to competitors’ strategic shifts, practitioners should focus on improving supply chain efficiency and consumer experience, avoiding unnecessary cost increases due to excessive competition.
6.3. Limitations and Future Research
Future research could explore in the following directions: First, it could analyze proactive strategies for Brand O to counter the blockchain spillover effect, such as emphasizing product differentiation through advertising or patent protection to mitigate adverse impacts and incentivize blockchain technology optimization, and further evaluate their effects on supply chain dynamics. Second, it could examine scenarios where both Brand O and CM adopt blockchain, investigating game-theoretic behaviors, competition over technical standards, and synergistic effects under dual adoption or collaborative models (including self-developed or third-party authorized traceability). This could include assessing their long-term impacts on profit distribution, competitive landscapes, and the sustainability of the green supply chain.
Author Contributions
Conceptualization: H.C.; Methodology: H.C.; Software: H.L.; Validation: H.L. and H.C.; Formal analysis: H.L. and H.C.; Investigation: H.L. and H.C.; Writing—original draft: H.L. and H.C.; Writing—review and editing: H.L. and H.C. All authors have read and agreed to the published version of the manuscript.
Funding
This research was funded by Sichuan Provincial Philosophy and Social Sciences ‘14th Five-Year Plan’ 2024 Annual Academic Research Special Grant (Grant no. SC24E003), Chengdu Park City Demonstration Zone Construction Research Center Project (Grant no. GYCS2022-YB003) and Philosophy and Social Science Research Fund of Chengdu University of Technology (Grant no. YJ2024-QN003).
Institutional Review Board Statement
Not applicable.
Informed Consent Statement
Not applicable.
Data Availability Statement
The data presented in this study are available on request from the corresponding author. The data are not publicly available due to privacy.
Conflicts of Interest
The authors declare no conflicts of interest.
Appendix A
Proof of Proposition 5.
Since , when , ; otherwise, .
Since , when , ; otherwise, .
Since , when , ; otherwise, .
Since and , it follows that , and . □
Proof of Proposition 6.
Since and , when , ; otherwise, .
Since , when and , ; otherwise, .
Since , it follows that .
Since , it follows that . □
Proof of Proposition 7.
Since , when , ; otherwise, .
Since , when , ; otherwise, .
Since , it follows that . □
References
- Lai, R.; Liu, S.; Wang, Y. Optimization of Benefit Distribution in Green Supply Chain for Prefabricated Buildings Based on TFN-TOPSIS-Banzhaf Cooperative Game Theory. Buildings 2025, 15, 850. [Google Scholar] [CrossRef]
- Puppim de Oliveira, J.A.; Qian, H. Perspectives in global environmental governance. Glob. Public Policy Gov. 2023, 3, 5–11. [Google Scholar] [CrossRef]
- Li, X.; Wang, C.; Li, D.; Yang, D.; Meng, F.; Huang, Y. Environmental Regulations, Green Marketing, and Consumers’ Green Product Purchasing Intention: Evidence from China. Sustainability 2024, 16, 8987. [Google Scholar] [CrossRef]
- Niu, B.; Mu, Z.; Chen, L.; Lee, C.K. Coordinate the economic and environmental sustainability via procurement outsourcing in a co-opetitive supply chain. Resour. Conserv. Recycl. 2019, 146, 17–27. [Google Scholar] [CrossRef]
- The 2023 Top Ten Green Development Cases Unveiled by the New Beijing News Zero Carbon Research Institute. Available online: https://www.bjnews.com.cn/detail/1702387009129309.html (accessed on 12 December 2023).
- Liu, Z.; Luong, N.C.; Wang, W.; Niyato, D.; Wang, P.; Liang, Y.-C.; Kim, D.I. A survey on applications of game theory in blockchain. arXiv 2019, arXiv:1902.10865. [Google Scholar] [CrossRef]
- Guo, F.; Wu, Z.; Wang, Y.; Liu, C. Analysis on the impact of dynamic innovation investment strategy of green supply chain enabled by blockchain. PeerJ Comput. Sci. 2024, 10, e2002. [Google Scholar] [CrossRef]
- IBM Announces Major Blockchain Collaboration with Dole, Driscoll’s, Golden State Foods, Kroger, McCormick and Company, McLane Company, Nestlé, Tyson Foods, Unilever and Walmart to Address Food Safety Worldwide. Available online: https://www.prnewswire.com/news-releases/ibm-announces-major-blockchain-collaboration-with-dole-driscolls-golden-state-foods-kroger-mccormick-and-company-mclane-company-nestle-tyson-foods-unilever-and-walmart-to-address-food-safety-worldwide-300507604.html (accessed on 22 August 2017).
- Nestlé Breaks New Ground with Open Blockchain Pilot. Available online: https://www.nestle.com/media/pressreleases/allpressreleases/nestle-open-blockchain-pilot (accessed on 2 July 2019).
- SAP, Unilever Pilot Blockchain Technology Supporting Deforestation-Free Palm Oil. Available online: https://www.unilever.com/news/press-and-media/press-releases/2022/sap-unilever-pilot-blockchain-technology-supporting-deforestationfree-palm-oil/ (accessed on 21 March 2022).
- Varavallo, G.; Caragnano, G.; Bertone, F.; Vernetti-Prot, L.; Terzo, O. Traceability platform based on green blockchain: An application case study in dairy supply chain. Sustainability 2022, 14, 3321. [Google Scholar] [CrossRef]
- Song, L.; Luo, Y.; Chang, Z.; Jin, C.; Nicolas, M. Blockchain adoption in agricultural supply chain for better sustainability: A game theory perspective. Sustainability 2022, 14, 1470. [Google Scholar] [CrossRef]
- Ma, D.; Ma, P.; Hu, J. The impact of blockchain technology adoption on an e-commerce closed-loop supply chain considering consumer trust. Sustainability 2024, 16, 1535. [Google Scholar] [CrossRef]
- Foxconn Seals $3.5 Billion Takeover of Sharp as Executives Seek to Shake Off Doubts. Available online: https://www.reuters.com/article/world/uk/foxconn-seals-35-billion-takeover-of-sharp-as-executives-seek-to-shake-off-dou-idUSKCN0WZ06S/ (accessed on 2 April 2016).
- Intercos Sales Madina to the Percassi Group. Available online: https://www.premiumbeautynews.com/en/intercos-sales-madina-to-the,4195 (accessed on 7 June 2012).
- Frizzo-Barker, J.; Chow-White, P.A.; Adams, P.R.; Mentanko, J.; Ha, D.; Green, S. Blockchain as a disruptive technology for business: A systematic review. Int. J. Inf. Manag. 2020, 51, 102029. [Google Scholar] [CrossRef]
- Justinia, T. Blockchain technologies: Opportunities for solving real-world problems in healthcare and biomedical sciences. Acta Inform. Medica 2019, 27, 284. [Google Scholar] [CrossRef] [PubMed]
- Zheng, Z.; Xie, S.; Dai, H.-N.; Chen, X.; Wang, H. Blockchain challenges and opportunities: A survey. Int. J. Web Grid Serv. 2018, 14, 352–375. [Google Scholar] [CrossRef]
- Wan, X.; Liu, J.; Zhao, S. Evolutionary game study on the governance and development of online car-hailing based on blockchain technology. Sci. Rep. 2022, 12, 9388. [Google Scholar] [CrossRef]
- De Giovanni, P. Blockchain and smart contracts in supply chain management: A game theoretic model. Int. J. Prod. Econ. 2020, 228, 107855. [Google Scholar] [CrossRef]
- Zhang, P.; Wu, H.; Li, H.; Zhong, B.; Fung, I.W.; Lee, Y.Y.R. Exploring the adoption of blockchain in modular integrated construction projects: A game theory-based analysis. J. Clean. Prod. 2023, 408, 137115. [Google Scholar] [CrossRef]
- Mssassi, S.; Abou El Kalam, A. Game Theory-Based Incentive Design for Mitigating Malicious Behavior in Blockchain Networks. J. Sens. Actuator Netw. 2024, 13, 7. [Google Scholar] [CrossRef]
- Zhao, L.-w.; Jin, S.; Gao, P. Dynamics analysis of green supply chain under the conditions of demand uncertainty and blockchain technology. Sci. Rep. 2024, 14, 25339. [Google Scholar] [CrossRef]
- Moniruzzaman, M.; Yassine, A.; Benlamri, R. Blockchain and cooperative game theory for peer-to-peer energy trading in smart grids. Int. J. Electr. Power Energy Syst. 2023, 151, 109111. [Google Scholar] [CrossRef]
- Cheng, L.; Zhang, M.; Huang, P.; Lu, W. Game-theoretic approaches for power-generation companies’ decision-making in the emerging green certificate market. Sustainability 2025, 17, 71. [Google Scholar] [CrossRef]
- Zhang, C.; Xu, Y.; Zheng, Y. Blockchain Traceability Adoption in Low-Carbon Supply Chain: An Evolutionary Game Analysis. Sustainability 2024, 16, 1817. [Google Scholar] [CrossRef]
- Chen, Y.J.; Shum, S.; Xiao, W. Should an OEM retain component procurement when the CM produces competing products? Prod. Oper. Manag. 2012, 21, 907–922. [Google Scholar] [CrossRef]
- Hsu, V.N.; Lai, G.; Niu, B.; Xiao, W. Leader-based collective bargaining: Cooperation mechanism and incentive analysis. Manuf. Serv. Oper. Manag. 2017, 19, 72–83. [Google Scholar] [CrossRef]
- Xu, J.; Hsu, V.N.; Niu, B. The Impacts of Markets and Tax on a Multinational Firm’s Procurement Strategy in China. Prod. Oper. Manag. 2018, 27, 251–264. [Google Scholar] [CrossRef]
- Wang, Y.; Niu, B.; Guo, P. On the Advantage of Quantity Leadership When Outsourcing Production to a Competitive Contract Manufacturer. Prod. Oper. Manag. 2013, 22, 104–119. [Google Scholar] [CrossRef]
- Spiegel, Y. Horizontal subcontracting. RAND J. Econ. 1993, 24, 570–590. [Google Scholar] [CrossRef]
- Li, G.; Li, L.; Sethi, S.P.; Guan, X. Return strategy and pricing in a dual-channel supply chain. Int. J. Prod. Econ. 2019, 215, 153–164. [Google Scholar] [CrossRef]
- Pan, C. Manufacturer’s direct distribution with incumbent retailer’s product line choice. Econ. Lett. 2019, 174, 136–139. [Google Scholar] [CrossRef]
- Sharma, A.; Jain, D. A game theoretic analysis of dual-channel supply chain with nash bargaining fairness concern. J. Bus. Ind. Mark. 2020, 35, 244–259. [Google Scholar] [CrossRef]
- Liu, H.; Sun, S.; Lei, M.; Leong, G.K.; Deng, H. Research on Cost Information Sharing and Channel Choice in a Dual-Channel Supply Chain. Math. Probl. Eng. 2016, 2016, 4368326. [Google Scholar] [CrossRef]
- Xu, W.; Yan, W.; Song, B.; He, J. Blockchain adoption and strategic contracting in a green supply chain considering market segmentation. Ind. Manag. Data Syst. 2023, 123, 2704–2732. [Google Scholar] [CrossRef]
- Hong, Z.; Guo, X. Green product supply chain contracts considering environmental responsibilities. Omega 2019, 83, 155–166. [Google Scholar] [CrossRef]
- Engwerda, J. Linear quadratic differential games: An overview. In Advances in Dynamic Games and Their Application; Birkhäuser: Boston, MA, USA, 2009; pp. 1–34. [Google Scholar]
- Liu, J.; Zhao, H.; Chen, J. Blockchain-driven win–win strategy of economy and environment in the asymmetric competitive supply chain. Comput. Ind. Eng. 2023, 176, 108978. [Google Scholar] [CrossRef]
- Park, S.Y.; Keh, H.T. Modelling hybrid distribution channels: A game-theoretic analysis. J. Retail. Consum. Serv. 2003, 10, 155–167. [Google Scholar] [CrossRef]
- Zhang, G.; Fang, S.; Lai, K.K. Game Analysis in a Dual Channels System with Different Power Structures and Service Provision. J. Syst. Sci. Inf. 2015, 3, 513–524. [Google Scholar] [CrossRef]
- Xu, S.; Tang, H.; Lin, Z.; Lu, J. Pricing and sales-effort analysis of dual-channel supply chain with channel preference, cross-channel return and free riding behavior based on revenue-sharing contract. Int. J. Prod. Econ. 2022, 249, 108506. [Google Scholar] [CrossRef]
- Werden, G.J. Demand elasticites in antitrust analysis. Antitrust LJ 1997, 66, 363. Available online: https://www.jstor.org/stable/40843402 (accessed on 20 January 2025).
- Ariely, D.; Loewenstein, G.; Prelec, D. “Coherent arbitrariness”: Stable demand curves without stable preferences. Q. J. Econ. 2003, 118, 73–106. [Google Scholar] [CrossRef]
Disclaimer/Publisher’s Note: The statements, opinions and data contained in all publications are solely those of the individual author(s) and contributor(s) and not of MDPI and/or the editor(s). MDPI and/or the editor(s) disclaim responsibility for any injury to people or property resulting from any ideas, methods, instructions or products referred to in the content. |
© 2025 by the authors. Licensee MDPI, Basel, Switzerland. This article is an open access article distributed under the terms and conditions of the Creative Commons Attribution (CC BY) license (https://creativecommons.org/licenses/by/4.0/).