Comprehensive Impact of Different Urban Form Indices on Land Surface Temperature and PM2.5 Pollution in Summer and Winter, Based on Urban Functional Zones: A Case Study of Taiyuan City
Abstract
1. Introduction
2. Materials and Methods
2.1. Study Area
2.2. Data Sources
2.3. Data Processing and Variable Generation
2.3.1. Identification of Urban Functional Zones
- Road Network Construction: The primary road network, consisting of main roads and primary to tertiary roads, was extracted from OSM to define the boundaries of the analysis units. Secondary roads were excluded to refine the zoning resolution.
- POI Data Processing: POI data were collected via a Python 3.7-based web crawler. The raw data underwent a cleaning process consistent with the Urban Land Use Classification Standard (GB 50137-2011) [52], involving de-duplication, coordinate correction, and projection to the WGS84 coordinate system. POIs were categorized into functional types (e.g., residential, commercial).
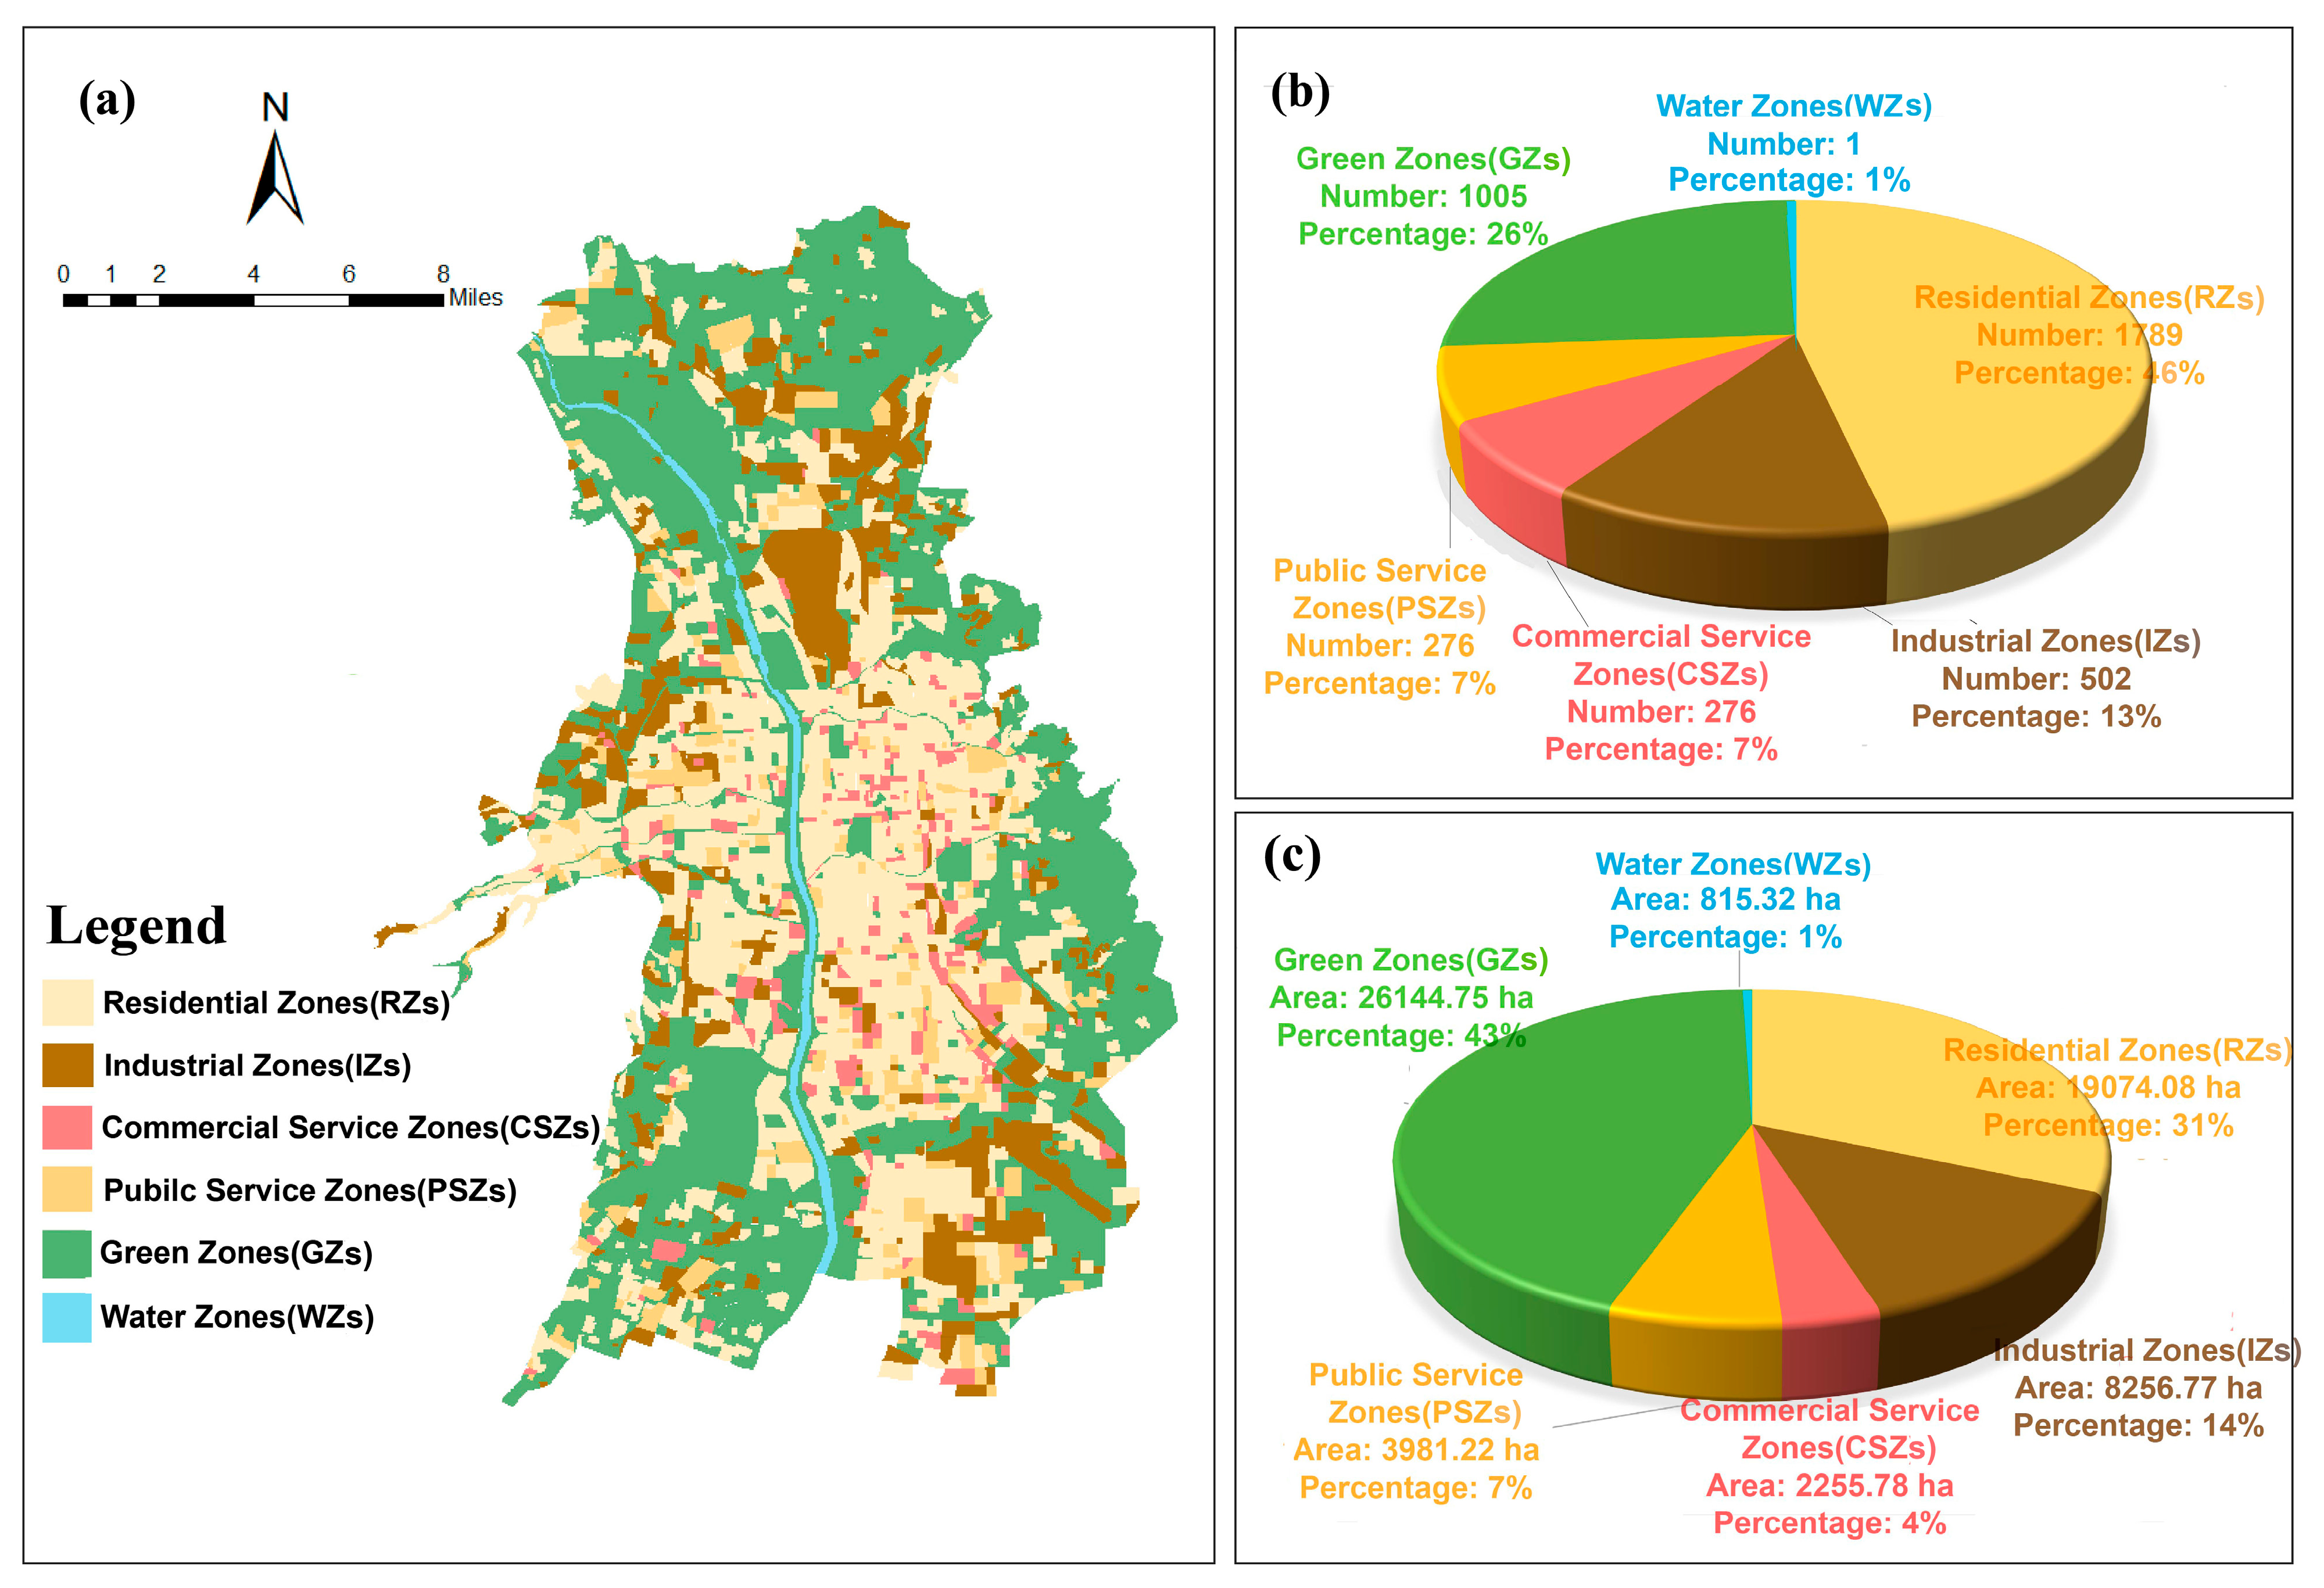
- Functional Zone Classification: Two indicators were calculated for each grid cell using ArcGIS: “frequency density” (the total count of POIs within a unit) and “category ratio” (the proportion of each POI type). The dominant function type for each unit was assigned based on the majority POI category, resulting in six functional zones: residential, industrial, commercial, public service, green, and water areas.
2.3.2. LST Inversion and Delineation
- Radiance Calculation: Thermal band data were converted to spectral radiance using calibration parameters.
- Atmospheric Correction: Atmospheric transmittance, upwelling, and downwelling radiance were estimated using the NASA Atmospheric Correction Parameter Calculator.
- LST Calculation: The RTE was applied as follows:
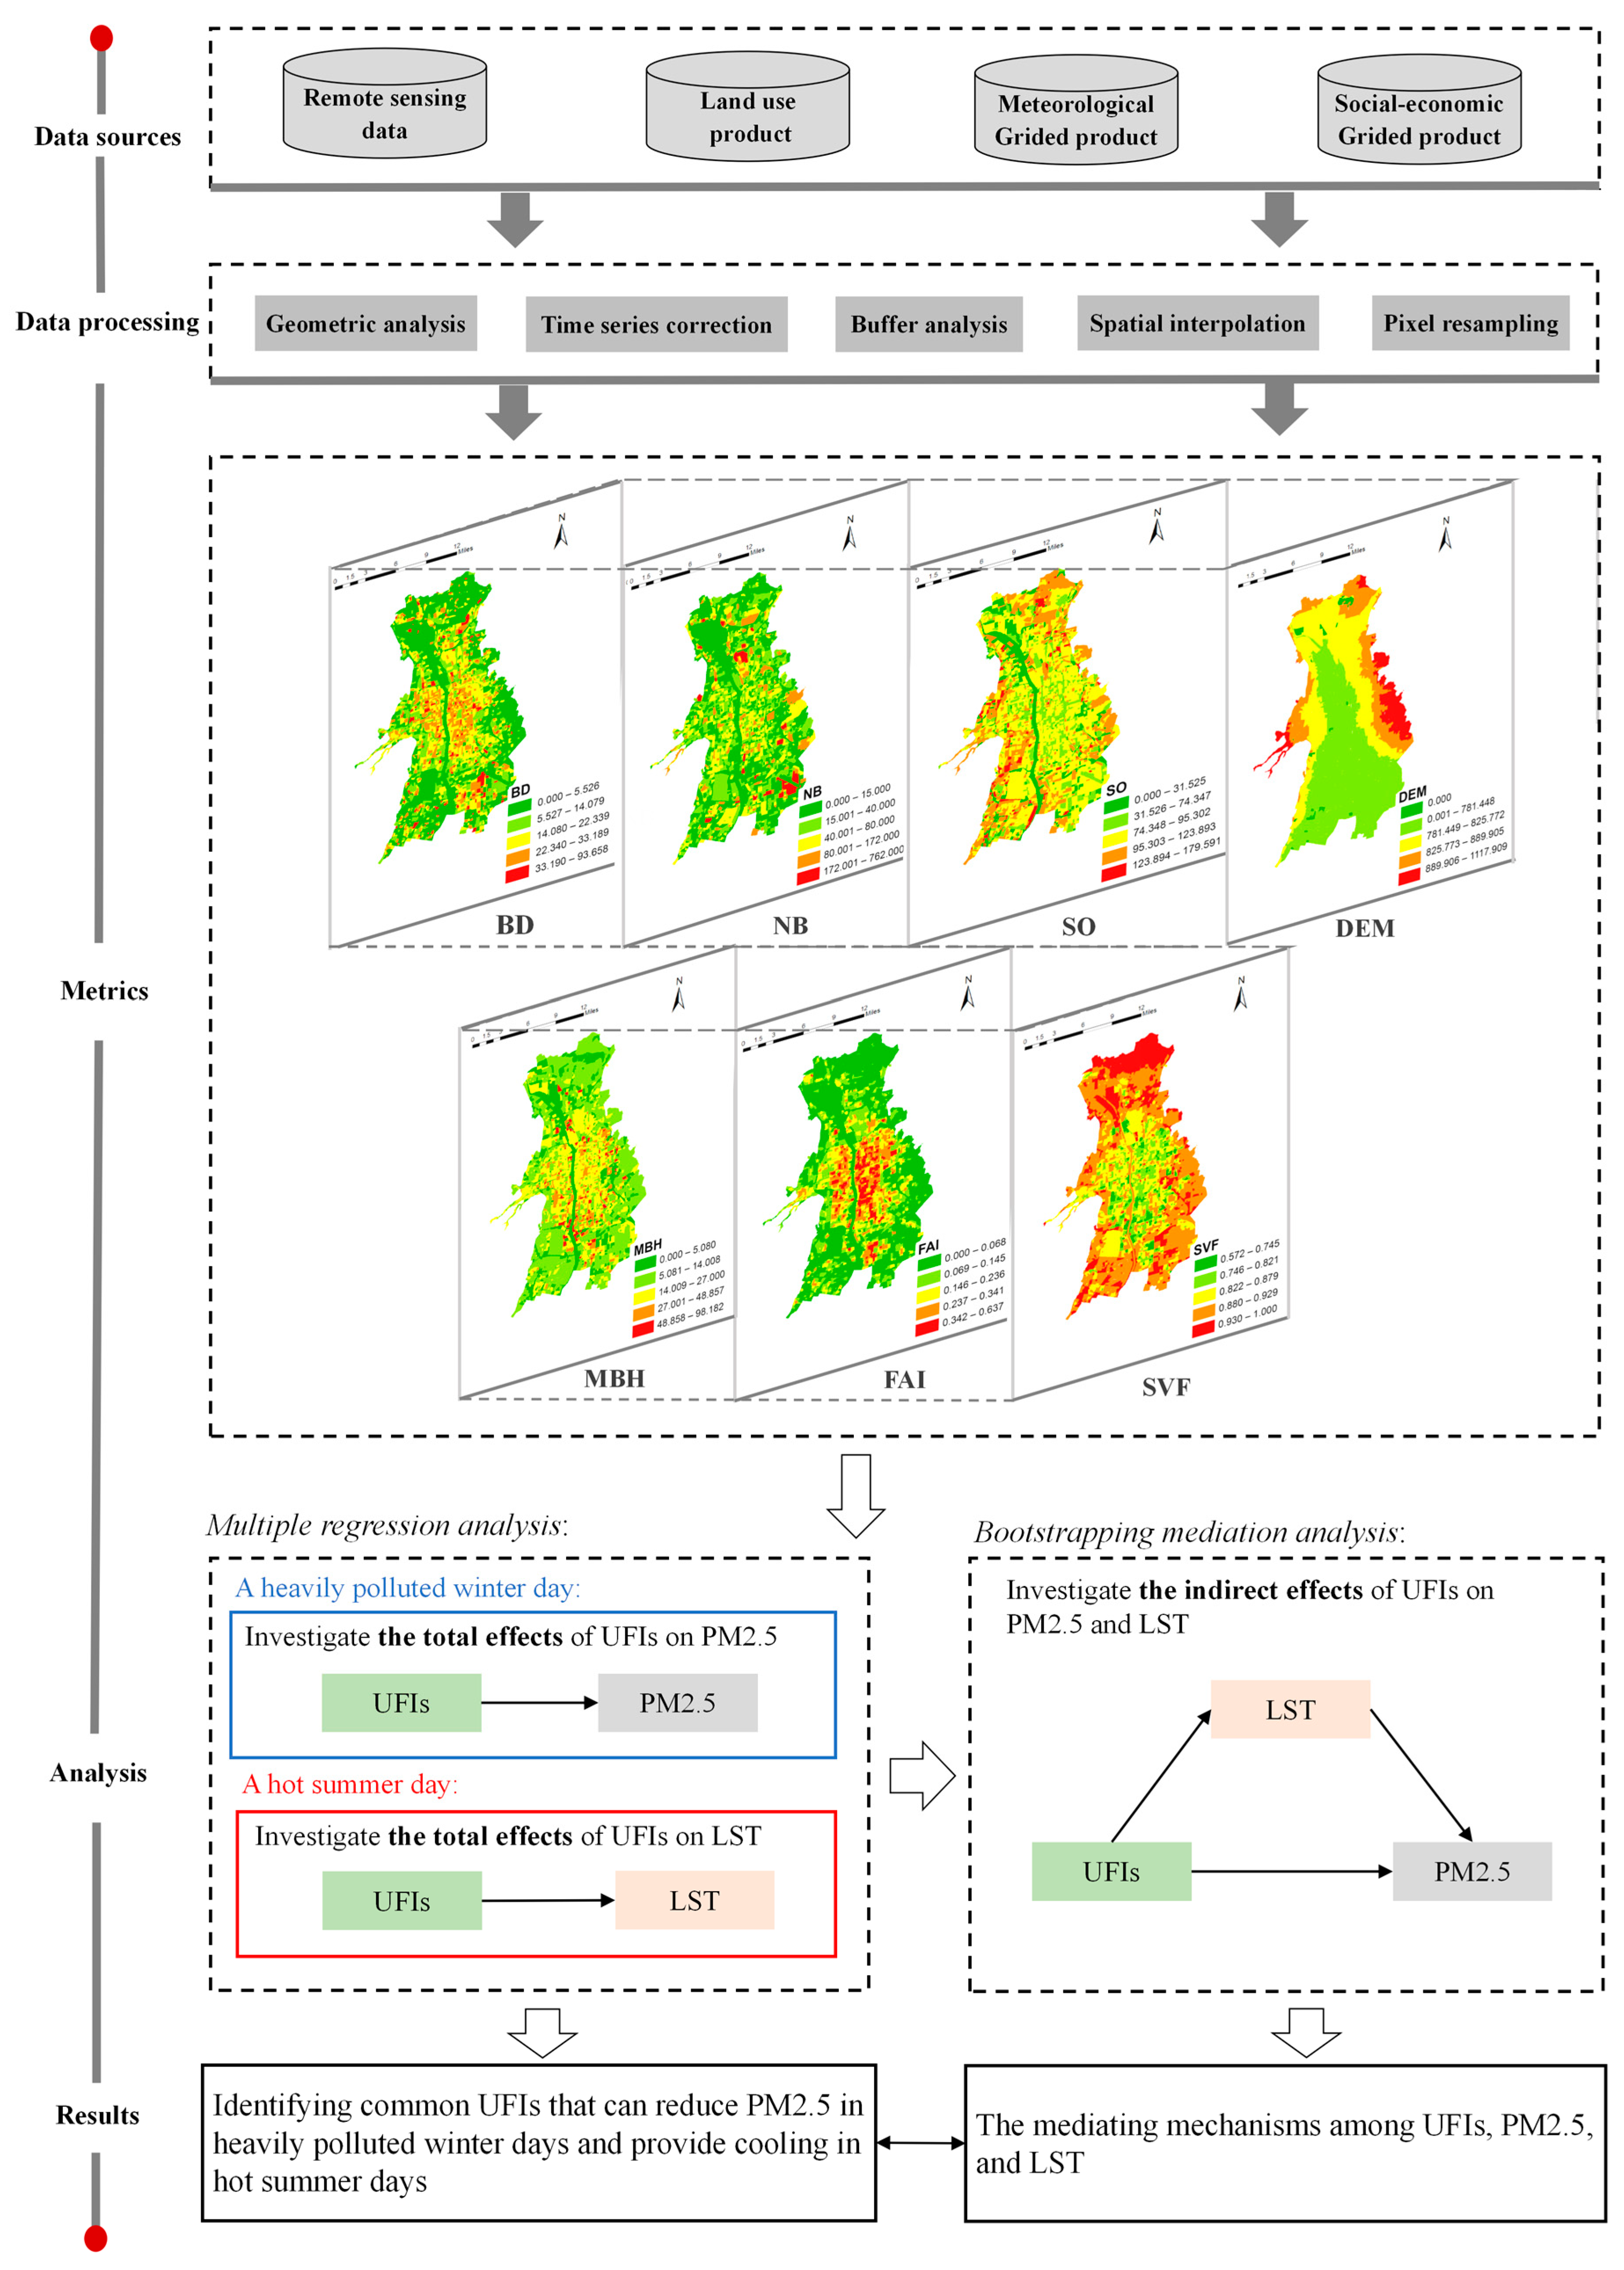
2.3.3. Urban Form Indices (UFIs)
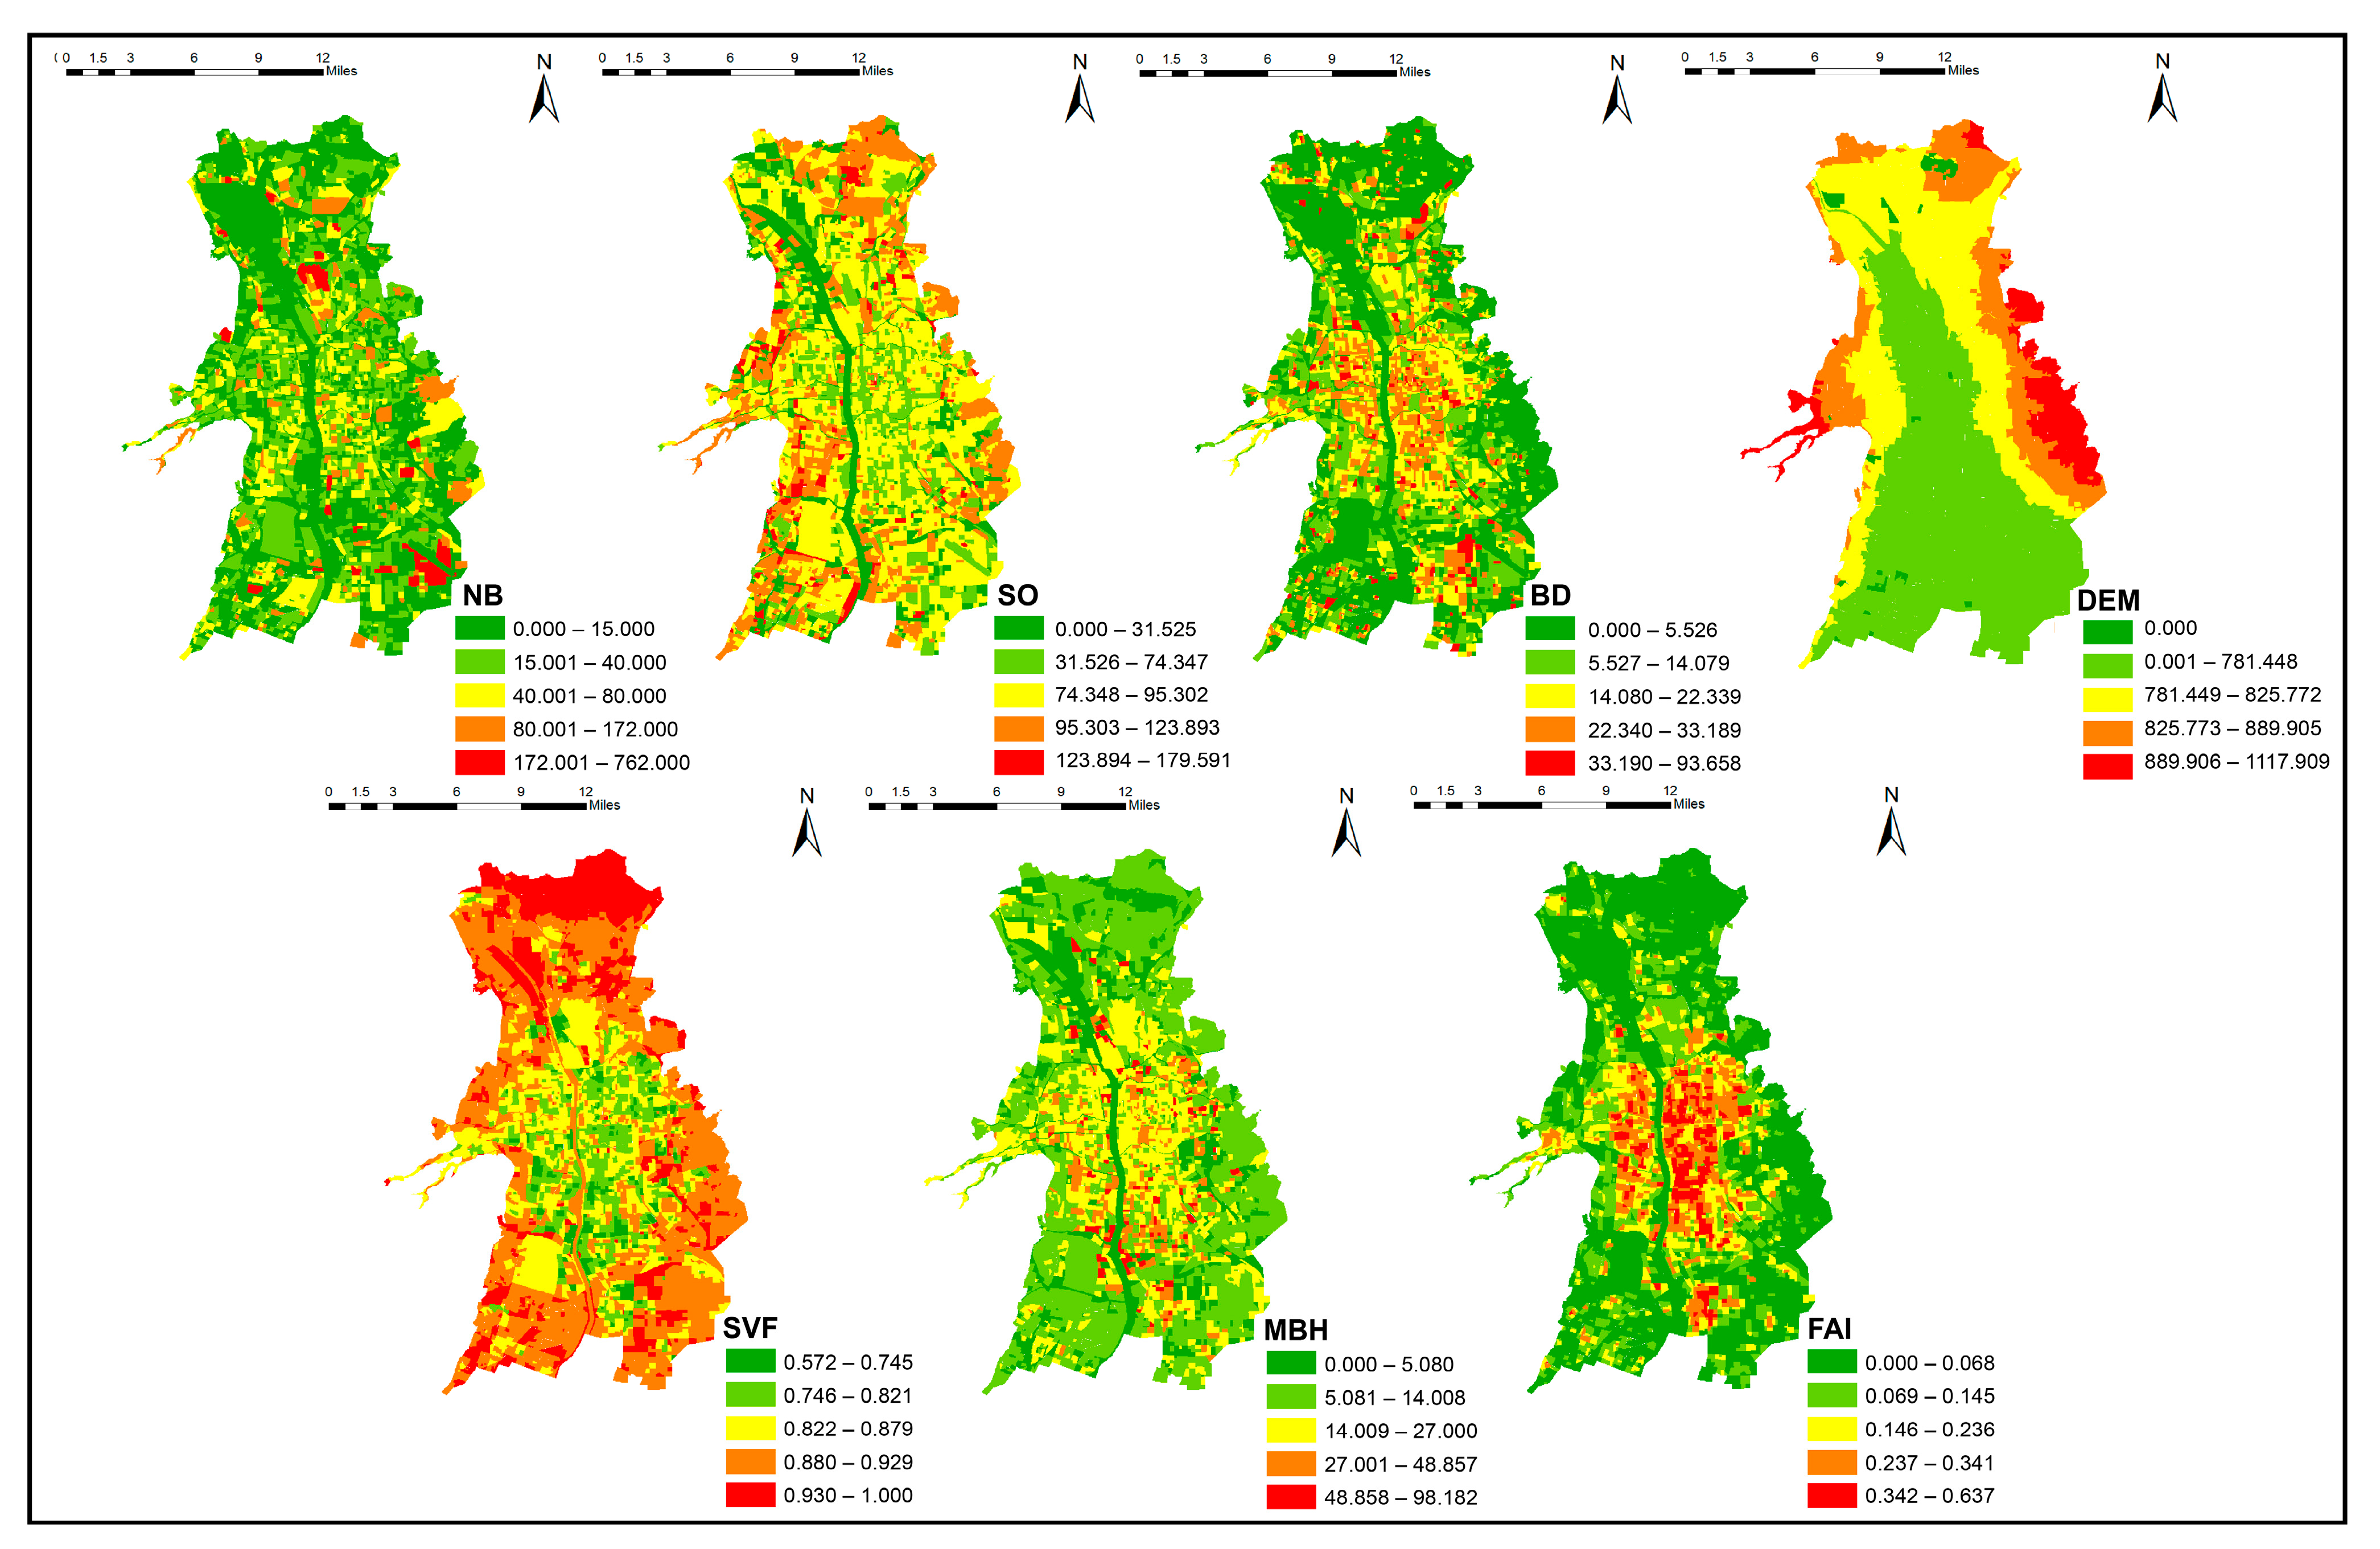
- Number of Buildings (NB): The total count of buildings within a grid cell.where represents the building i in the grid cell.
- Site Orientation (SO): The average building orientation relative to north.where represents is the orientation angle of the building i.
- Building Density (BD): The ratio of total building floor area to grid cell area.where is the total area of the buildings in the grid cell i. is the total area of the grid cell i.
- Sky View Factor (SVF): The fraction of visible sky relative to total hemispherical sky.where is the influence of the terrain height angle on the azimuth angle i; and n is the number of calculated azimuth angles.
- Mean Building Height (MBH): The average height of buildings within a grid cell.where is the total height of buildings in the grid cell i.
- Frontal Area Index (FAI): The ratio of windward building area to grid cell area.where is the total projected area of the building i’s facade onto a vertical plane perpendicular to the wind direction in the grid cell j; is the total area of the grid cell j.
- Digital Elevation Model (DEM): The grid-based elevation of terrain.
2.4. Statistical Analysis
2.4.1. Correlation Analysis
2.4.2. Multiple Regression Modeling
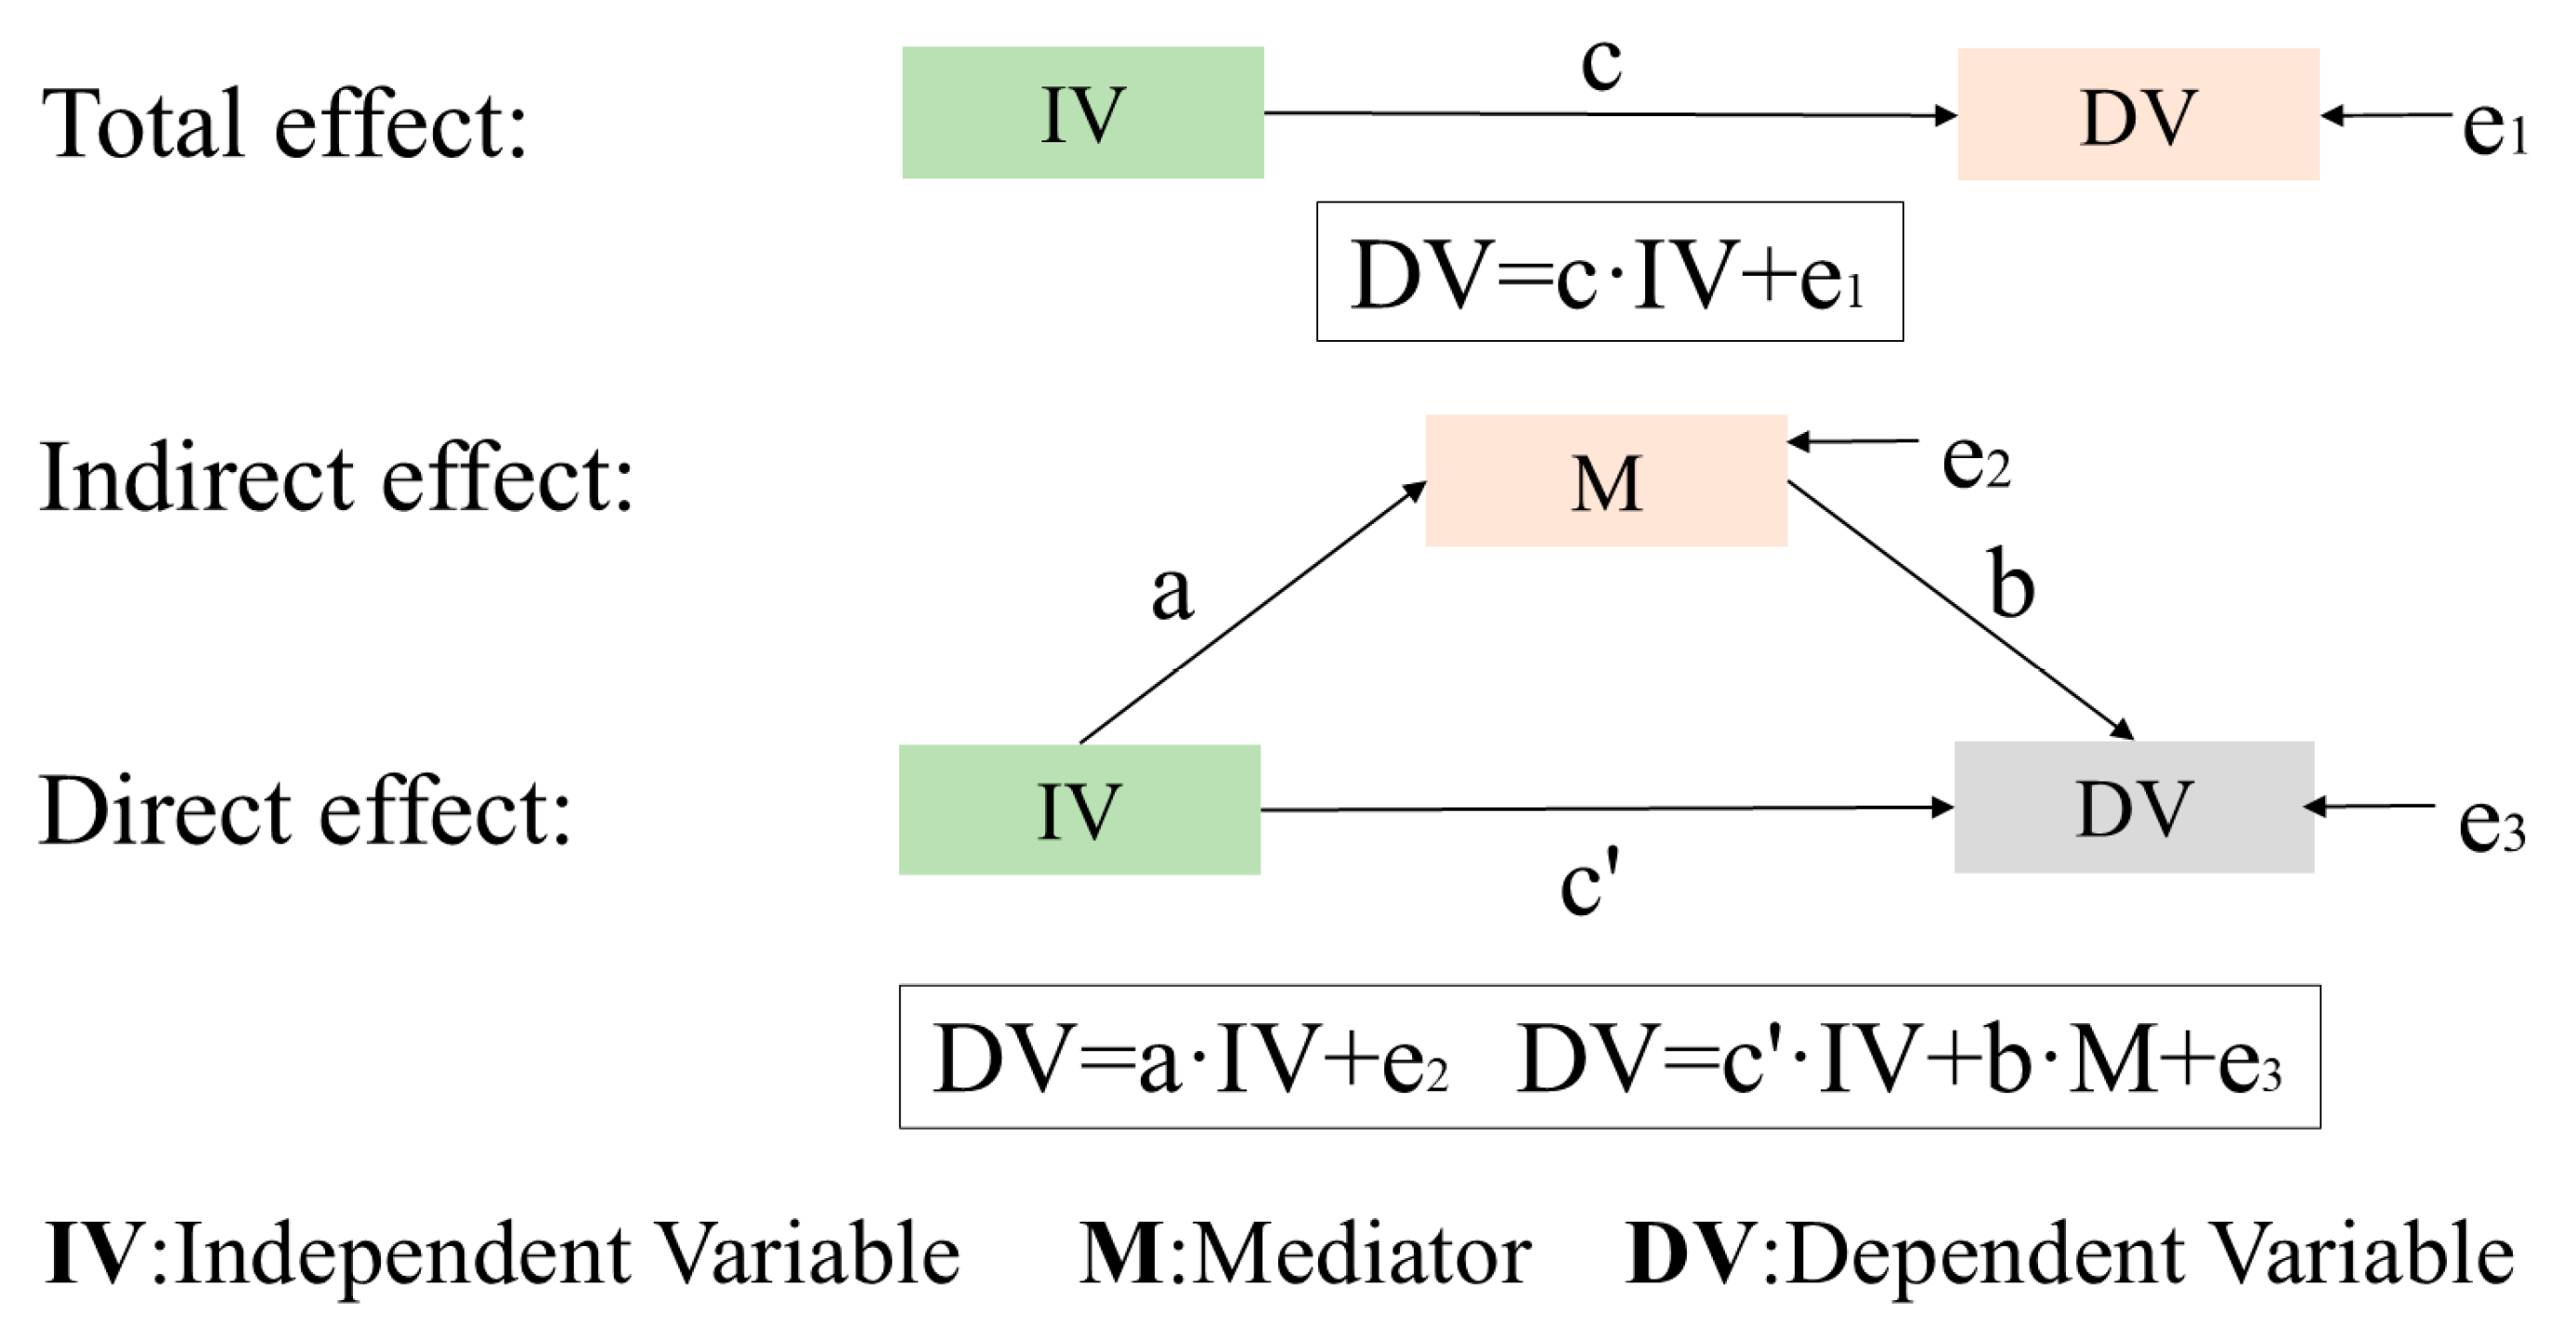
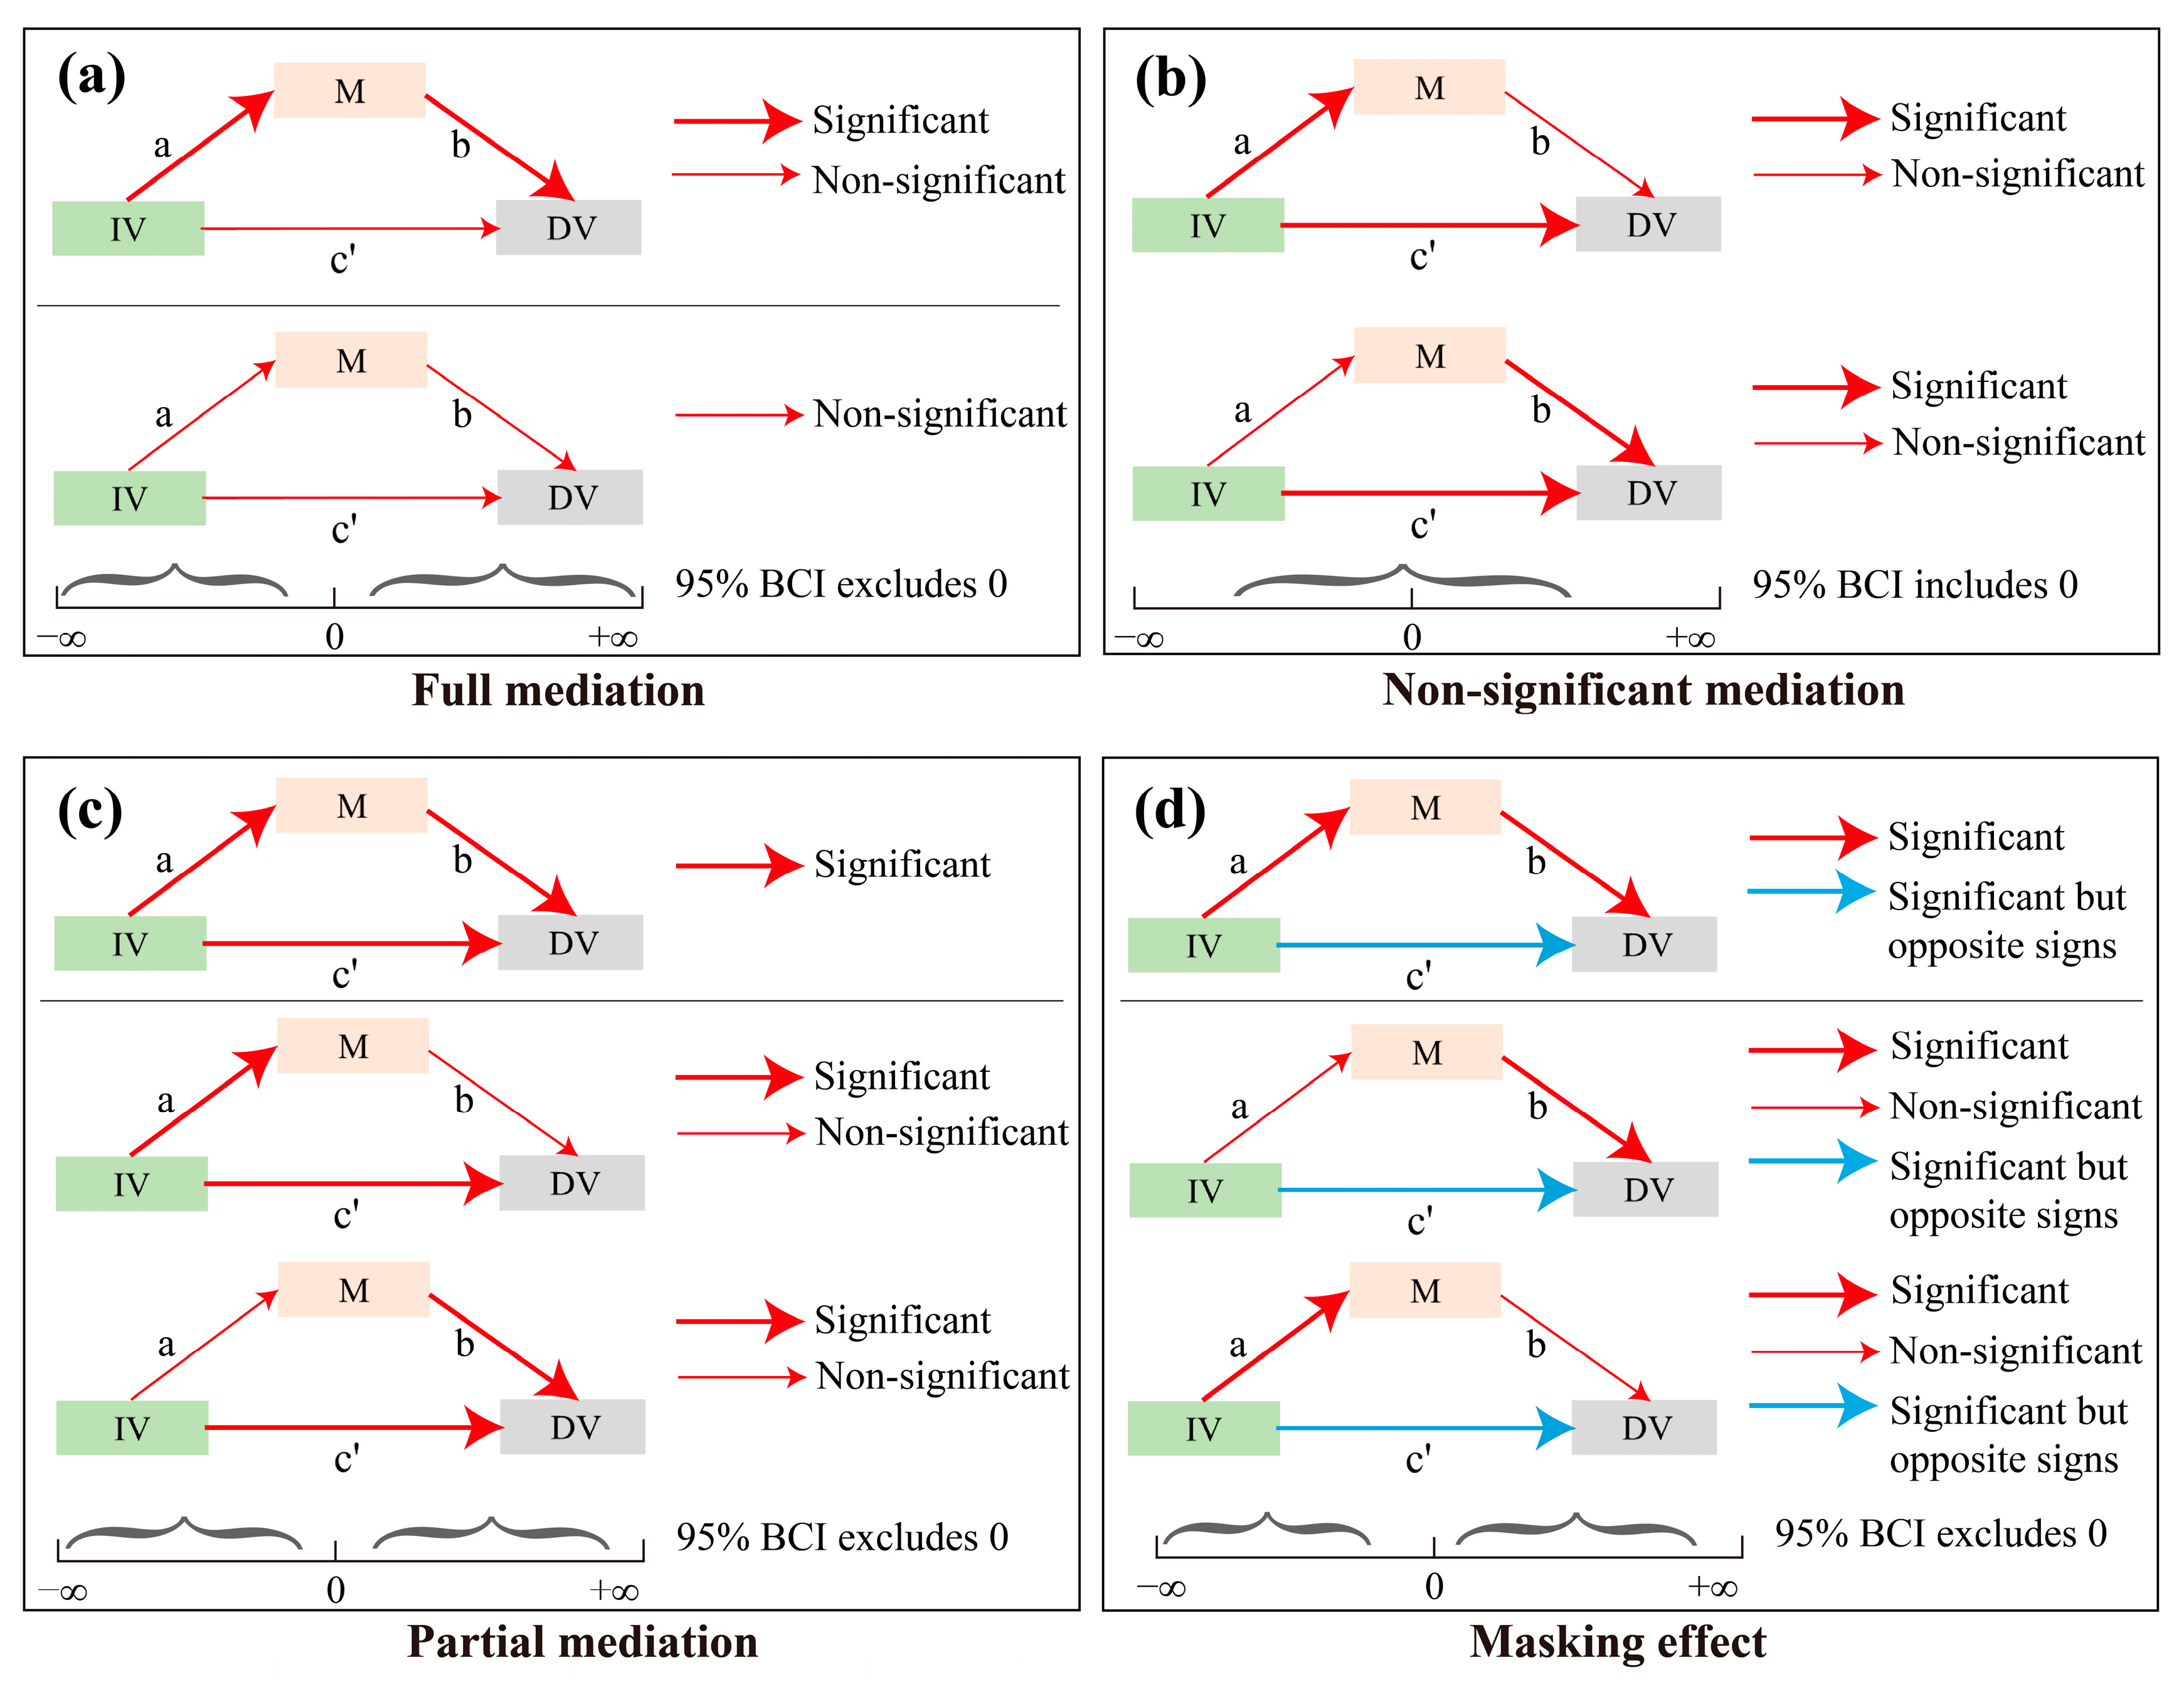
2.4.3. Mediation Effect Analysis
3. Results
3.1. Spatial Distribution of Urban Functional Areas and Urban Form Indices in Taiyuan
3.2. Surface Thermal Environment and Air Pollution Patterns Across Taiyuan’s Functional Zones
3.3. Descriptive Statistics and Correlation Analysis
3.4. Total Effects of Urban Form Indices on PM2.5 and LST
3.5. Mediating Effects of Urban Form Indices on PM2.5 via LST
4. Discussion
4.1. Differential Responses of LST and PM2.5 Across Urban Functional Zones
4.2. Indirect Effects of Urban Form Indices on LST and PM2.5
4.3. Seasonal Reversal of the LST-PM2.5 Relationship and Its Driving Mechanisms in Taiyuan
4.4. Implications for Urban Planning and Design
4.5. Limitations and Future Research
5. Conclusions
Author Contributions
Funding
Institutional Review Board Statement
Informed Consent Statement
Data Availability Statement
Conflicts of Interest
Abbreviations
| LST | Land Surface Temperature |
| PM2.5 | Particulate Matter with a diameter of 2.5 μm or less |
| UFIs | Urban Form Indices |
| NB | Number of Buildings |
| SO | Site of Orientation |
| BD | Building Density |
| MBH | Mean Building Height |
| FAI | Frontal Area Index |
| SVF | Sky View Factor |
| DEM | Digital Elevation Model |
| OLS | Ordinary Least Squares |
| UHI | Urban Heat Island |
| POI | Point of Interest |
| CSZ | Commercial Service Zone |
| RZ | Residential Zone |
| IZ | Industrial Zone |
| PSZ | Public Service Zone |
| GZ | Green Zone |
| WZ | Water Zone |
| BCI | Bias-Corrected Confidence Interval |
| RMSE | Root Mean Square Error |
| IV | Independent Variable |
| DV | Dependent Variable |
| M | Mediator (in mediation analysis) |
Appendix A
| Date | IV | M | DV | a | b | Indirect Effect | Direct Effect | Total Effect | Proportion Mediated (ab/c) 1 | Effect | |||
|---|---|---|---|---|---|---|---|---|---|---|---|---|---|
| ab | 95%BCI | c’ | 95%BCI | c | 95%BCI | ||||||||
| 17 July 2023 | NB | LST | PM2.5 | 0.017 | 0.173 | 0.003 | 0.045~0.093 | −0.002 | −0.003~−0.001 | 0.001 | −0.000~0.002 | 147.168% | Masking effect |
| SO | 0.013 | 0.174 | 0.002 | 0.043~0.086 | −0.002 | −0.003~−0.001 | 0.000 | −0.001~0.001 | 100.962% | Masking effect | |||
| BD | 0.149 | 0.202 | 0.030 | 0.189~0.297 | −0.030 | −0.033~−0.027 | 0.000 | −0.004~0.004 | 100.854% | Masking effect | |||
| MBH | 0.015 | 0.172 | 0.003 | 0.003~0.044 | −0.007 | −0.010~−0.004 | −0.005 | −0.008~−0.001 | 35.742% | Masking effect | |||
| FAI | 10.653 | 0.193 | 2.060 | 0.136~0.220 | −2.602 | −2.901~−2.302 | −0.542 | −0.895~−0.189 | 79.173% | Masking effect | |||
| SVF | −5.593 | 0.175 | −0.977 | −0.071~−0.028 | 2.247 | 1.730~2.763 | 1.269 | 0.651~1.887 | 43.504% | Masking effect | |||
| DEM | 0.025 | 0.137 | 0.003 | 0.098~0.257 | 0.004 | 0.004~0.005 | 0.008 | 0.007~0.008 | 44.255% | Partial Mediation | |||
| 24 December 2023 | NB | LST | PM2.5 | 0.004 | −0.888 | −0.004 | −0.042~−0.018 | 0.004 | −0.000~0.007 | 0.000 | −0.004~0.004 | 100% | Full Mediation |
| SO | 0.002 | −0.877 | −0.002 | −0.030~−0.008 | −0.001 | −0.004~0.002 | −0.003 | −0.006~0.001 | 100% | Full Mediation | |||
| BD | 0.021 | −0.967 | −0.020 | −0.076~−0.042 | 0.052 | 0.041~0.062 | 0.031 | 0.021~0.042 | 39.514% | Masking effect | |||
| MBH | 0.008 | −0.901 | −0.007 | −0.038~−0.015 | 0.026 | 0.017~0.035 | 0.019 | 0.009~0.028 | 28.084% | Masking effect | |||
| FAI | 2.804 | −1.090 | −3.057 | −0.115~−0.073 | 8.162 | 7.192~9.132 | 5.104 | 4.109~6.100 | 37.460% | Masking effect | |||
| SVF | −2.968 | −0.966 | 2.867 | 0.036~0.067 | −9.742 | −11.430~−8.054 | −6.875 | −8.628~−5.122 | 29.426% | Masking effect | |||
| DEM | −0.006 | −0.591 | 0.003 | 0.048~0.085 | 0.014 | 0.012~0.015 | 0.017 | 0.015~0.018 | 20.581% | Partial Mediation | |||
References
- Seto, K.C.; Güneralp, B.; Hutyra, L.R. Global forecasts of urban expansion to 2030 and direct impacts on biodiversity and carbon pools. Proc. Natl. Acad. Sci. USA 2012, 109, 16083–16088. [Google Scholar] [CrossRef] [PubMed]
- IPCC. Climate Change 2021: The Physical Science Basis; Contribution of Working Group I to the Sixth Assessment Report of the Intergovernmental Panel on Climate Change; Cambridge University Press: Cambridge, UK, 2021. [Google Scholar]
- Weng, Q. A remote sensing? GIS evaluation of urban expansion and its impact on surface temperature in the Zhujiang Delta, China. Int. J. Remote Sens. 2001, 22, 1999–2014. [Google Scholar] [CrossRef]
- Saha, M.; Al Kafy, A.; Bakshi, A.; Nath, H.; Alsulamy, S.; Rahaman, Z.A.; Saroar, M. The urban air quality nexus: Assessing the interplay of land cover change and air pollution in emerging South Asian cities. Environ. Pollut. 2024, 361, 124877. [Google Scholar] [CrossRef] [PubMed]
- Khor, N.; Arimah, B.; Otieno, R.; Oostrum, M.; Mutinda, M.; Martins, J. World Cities Report 2022 Envisaging the Future of Cities; United Nations Human Settlements Programme (UN-Habitat): Nairobi, Kenya, 2022; Available online: https://unhabitat.org/world-cities-report (accessed on 1 June 2025).
- Zhou, L.; Dickinson, R.E.; Tian, Y.; Fang, J.; Li, Q.; Kaufmann, R.K.; Tucker, C.J.; Myneni, R.B. Evidence for a significant urbanization effect on climate in China. Proc. Natl. Acad. Sci. USA 2004, 101, 9540–9544. [Google Scholar] [CrossRef] [PubMed]
- Wei, Z.; Tu, J.; Xiao, L.; Sun, W. Urbanization and carbon emissions in China: Analysis of dynamic relationships from 1978 to 2020. J. Geogr. Sci. 2024, 34, 1925–1952. [Google Scholar] [CrossRef]
- Varquez, A.C.; Kanda, M. Impact of urbanization on exposure to extreme warming in megacities. Heliyon 2023, 9, e15511. [Google Scholar] [CrossRef] [PubMed]
- Baker, G.H. Le Corbusier; Taylor & Francis: Oxford, UK, 1996. [Google Scholar]
- Lynch, K. The Image of the City; MIT Press: Cambridge, MA, USA, 1964. [Google Scholar]
- Desai, B.H. 14. United nations environment programme (UNEP). Yearb. Int. Environ. Law 2020, 31, 319–325. [Google Scholar] [CrossRef]
- Guan, D.; Su, X.; Zhang, Q.; Peters, G.P.; Liu, Z.; Lei, Y.; He, K. The socioeconomic drivers of China’s primary PM2.5 emissions. Environ. Res. Lett. 2014, 9, 024010. [Google Scholar] [CrossRef]
- Cachon, F.B.; Cazier, F.; Verdin, A.; Dewaele, D.; Genevray, P.; Delbende, A.; Ayi-Fanou, L.; Aïssi, F.; Sanni, A.; Courcot, D. Physicochemical characterization of air pollution particulate matter (PM2.5 and PM>2.5) in an urban area of Cotonou, Benin. Atmosphere 2023, 14, 201. [Google Scholar] [CrossRef]
- Yan, H.; Li, Q.; Feng, K.; Zhang, L. The characteristics of PM emissions from construction sites during the earthwork and foundation stages: An empirical study evidence. Environ. Sci. Pollut. Res. 2023, 30, 62716–62732. [Google Scholar] [CrossRef] [PubMed]
- Huo, L. Haze pollution and urban sprawl: An empirical analysis based on panel simultaneous equation model. PLoS ONE 2024, 19, e0296814. [Google Scholar] [CrossRef] [PubMed]
- Liu, Y.; He, L.; Qin, W.; Lin, A.; Yang, Y. The effect of urban form on PM2.5 concentration: Evidence from China’s 340 prefecture-level cities. Remote Sens. 2021, 14, 7. [Google Scholar] [CrossRef]
- Wu, J.; Zhang, P.; Yi, H.; Qin, Z. What causes haze pollution? An empirical study of PM2.5 concentrations in Chinese cities. Sustainability 2016, 8, 132. [Google Scholar] [CrossRef]
- Tang, R.; Wu, Z.; Li, X.; Wang, Y.; Shang, D.; Xiao, Y.; Li, M.; Zeng, L.; Wu, Z.; Hallquist, M. Primary and secondary organic aerosols in summer 2016 in Beijing. Atmos. Chem. Phys. 2018, 18, 4055–4068. [Google Scholar] [CrossRef]
- Wu, H.; Wang, T.; Wang, Q.g.; Riemer, N.; Cao, Y.; Liu, C.; Ma, C.; Xie, X. Relieved air pollution enhanced urban heat island intensity in the Yangtze River Delta, China. Aerosol Air Qual. Res. 2019, 19, 2683–2696. [Google Scholar] [CrossRef]
- Jacobson, M.Z. Global direct radiative forcing due to multicomponent anthropogenic and natural aerosols. J. Geophys. Res. Atmos. 2001, 106, 1551–1568. [Google Scholar] [CrossRef]
- Fang, Y.; Gu, K. Exploring coupling effect between urban heat island effect and PM2.5 concentrations from the perspective of spatial environment. Environ. Eng. Res. 2022, 27, 200559. [Google Scholar] [CrossRef]
- Li, H.; Meier, F.; Lee, X.; Chakraborty, T.; Liu, J.; Schaap, M.; Sodoudi, S. Interaction between urban heat island and urban pollution island during summer in Berlin. Sci. Total Environ. 2018, 636, 818–828. [Google Scholar] [CrossRef] [PubMed]
- Song, Z.; Li, R.; Qiu, R.; Liu, S.; Tan, C.; Li, Q.; Ge, W.; Han, X.; Tang, X.; Shi, W. Global land surface temperature influenced by vegetation cover and PM2.5 from 2001 to 2016. Remote Sens. 2018, 10, 2034. [Google Scholar] [CrossRef]
- Li, Z.; Ming, T.; Liu, S.; Peng, C.; de Richter, R.; Li, W.; Zhang, H.; Wen, C.-Y. Review on pollutant dispersion in urban areas-part A: Effects of mechanical factors and urban morphology. Build. Environ. 2021, 190, 107534. [Google Scholar] [CrossRef]
- Liang, Z.; Wei, F.; Wang, Y.; Huang, J.; Jiang, H.; Sun, F.; Li, S. The context-dependent effect of urban form on air pollution: A panel data analysis. Remote Sens. 2020, 12, 1793. [Google Scholar] [CrossRef]
- Huszar, P.; Bartík, L.; Karlický, J.; Villalba-Pradas, A. Impact of urbanization on fine particulate matter concentrations over central Europe. Atmos. Chem. Phys. 2024, 24, 397–425. [Google Scholar] [CrossRef]
- Cui, P.; Dai, C.; Zhang, J.; Li, T. Assessing the effects of urban morphology parameters on PM2.5 distribution in northeast China based on gradient boosted regression trees method. Sustainability 2022, 14, 2618. [Google Scholar] [CrossRef]
- Liu, Y.; Wang, Z.; Liu, X.; Zhang, B. Complexity of the relationship between 2D/3D urban morphology and the land surface temperature: A multiscale perspective. Environ. Sci. Pollut. Res. 2021, 28, 66804–66818. [Google Scholar] [CrossRef] [PubMed]
- Hoek, G.; Beelen, R.; De Hoogh, K.; Vienneau, D.; Gulliver, J.; Fischer, P.; Briggs, D. A review of land-use regression models to assess spatial variation of outdoor air pollution. Atmos. Environ. 2008, 42, 7561–7578. [Google Scholar] [CrossRef]
- Shi, Y.; Xie, X.; Fung, J.C.-H.; Ng, E. Identifying critical building morphological design factors of street-level air pollution dispersion in high-density built environment using mobile monitoring. Build. Environ. 2018, 128, 248–259. [Google Scholar] [CrossRef]
- Wen, H.; Malki-Epshtein, L. A parametric study of the effect of roof height and morphology on air pollution dispersion in street canyons. J. Wind Eng. Ind. Aerodyn. 2018, 175, 328–341. [Google Scholar] [CrossRef]
- Páez, A.; Farber, S.; Wheeler, D. A simulation-based study of geographically weighted regression as a method for investigating spatially varying relationships. Environ. Plan. A Econ. Space 2011, 43, 2992–3010. [Google Scholar] [CrossRef]
- Yu, R. Correlation analysis of urban building form and PM2.5 pollution based on satellite and ground observations. Front. Environ. Sci. 2023, 10, 1111223. [Google Scholar] [CrossRef]
- Kim, J.; Lee, D.-K.; Brown, R.D.; Kim, S.; Kim, J.-H.; Sung, S. The effect of extremely low sky view factor on land surface temperatures in urban residential areas. Sustain. Cities Soc. 2022, 80, 103799. [Google Scholar] [CrossRef]
- Jacobs, J. The Death and Life of Great American Cities; Random House, Inc.: New York, NY, USA, 1961; Volume 21, pp. 13–25. [Google Scholar]
- Lee, C. Impacts of multi-scale urban form on PM2.5 concentrations using continuous surface estimates with high-resolution in US metropolitan areas. Landsc. Urban Plan. 2020, 204, 103935. [Google Scholar] [CrossRef]
- Ouyang, X.; Wei, X.; Li, Y.; Wang, X.-C.; Klemeš, J.J. Impacts of urban land morphology on PM2.5 concentration in the urban agglomerations of China. J. Environ. Manag. 2021, 283, 112000. [Google Scholar] [CrossRef] [PubMed]
- Darbani, E.S.; Parapari, D.M. Ideal model for investigating urban form effects on urban heat Island and outdoor thermal comfort: A review. Int. J. Eng. Sci. Technol. 2022, 6, 64–90. [Google Scholar] [CrossRef]
- Cai, C.; Li, B.; Zhang, Q.; Wang, X.; Biljecki, F.; Herthogs, P. Bi-directional mapping of morphology metrics and 3D city blocks for enhanced characterisation and generation of urban form. Sustain. Cities Soc. 2025, 129, 106441. [Google Scholar] [CrossRef]
- Fan, P.Y.; He, Q.; Tao, Y.Z. Identifying research progress, focuses, and prospects of local climate zone (LCZ) using bibliometrics and critical reviews. Heliyon 2023, 9, e14067. [Google Scholar] [CrossRef] [PubMed]
- Ma, L.; Zhu, X.; Qiu, C.; Blaschke, T.; Li, M. Advances of local climate zone mapping and its practice using object-based image analysis. Atmosphere 2021, 12, 1146. [Google Scholar] [CrossRef]
- Xue, J.; You, R.; Liu, W.; Chen, C.; Lai, D. Applications of Local Climate Zone Classification Scheme to Improve Urban Sustainability: A Bibliometric Review. Sustainability 2020, 12, 8083. [Google Scholar] [CrossRef]
- Liang, Z.; Huang, J.; Wang, Y.; Wei, F.; Wu, S.; Jiang, H.; Zhang, X.; Li, S. The mediating effect of air pollution in the impacts of urban form on nighttime urban heat island intensity. Sustain. Cities Soc. 2021, 74, 102985. [Google Scholar] [CrossRef]
- Wu, J.; Chang, H.; Yoon, S. Numerical study on microclimate and outdoor thermal comfort of street canyon typology in extremely hot weather—A case study of busan, South Korea. Atmosphere 2022, 13, 307. [Google Scholar] [CrossRef]
- Al-Kurdi, N.; Awadallah, T. Role of street-level outdoor thermal comfort in minimizing urban heat island effect by using simulation program, Envi-Met: Case of Amman, Jordan. Res. J. Environ. Earth Sci. 2015, 7, 42–49. [Google Scholar] [CrossRef]
- Chen, X.; Wang, Z.; Yang, H.; Ford, A.C.; Dawson, R.J. Impacts of urban densification and vertical growth on urban heat environment: A case study in the 4th Ring Road Area, Zhengzhou, China. J. Clean. Prod. 2023, 410, 137247. [Google Scholar] [CrossRef]
- Parvar, Z.; Mohammadzadeh, M.; Saeidi, S. LCZ framework and landscape metrics: Exploration of urban and peri-urban thermal environment emphasizing 2/3D characteristics. Build. Environ. 2024, 254, 111370. [Google Scholar] [CrossRef]
- Taiyuan Municipal Bureau of Statistics. Taiyuan Statistics Bureau Official Website. Available online: https://stats.taiyuan.gov.cn/ (accessed on 5 June 2025).
- China National Environmental Monitoring Centre. China National Environmental Monitoring Centre Website. Available online: https://www.cnemc.cn/sssj/ (accessed on 5 June 2025).
- National Meteorological Information Center. National Meteorological Science Data Center Website. Available online: https://data.cma.cn/ (accessed on 1 July 2025).
- Liu, B.; Deng, Y.; Li, M.; Yang, J.; Liu, T. Classification schemes and identification methods for urban functional zone: A Review of Recent Papers. Appl. Sci. 2021, 11, 9968. [Google Scholar] [CrossRef]
- GB 50137-2011; Code for Classification of Urban Land Use and Planning Standards of Development Land. Ministry of Housing and Urban-Rural Development of the People’s Republic of China: Beijing, China, 2011.
- Zhengming, W.; Dozier, J. Land-surface temperature measurement from space: Physical principles and inverse modeling. IEEE Trans. Geosci. Remote Sens. 2002, 27, 268–278. [Google Scholar] [CrossRef]
- Preacher, K.J.; Hayes, A.F. Asymptotic and resampling strategies for assessing and comparing indirect effects in multiple mediator models. Behav. Res. Methods 2008, 40, 879–891. [Google Scholar] [CrossRef] [PubMed]
- Kuo, C.-Y.; Tzeng, C.-T.; Ho, M.-C.; Lai, C.-M. Wind tunnel studies of a pedestrian-level wind environment in a street canyon between a high-rise building with a podium and low-level attached houses. Energies 2015, 8, 10942–10957. [Google Scholar] [CrossRef]
- Michioka, T.; Sato, A.; Takimoto, H.; Kanda, M. Large-eddy simulation for the mechanism of pollutant removal from a two-dimensional street canyon. Bound.-Layer Meteorol. 2011, 138, 195–213. [Google Scholar] [CrossRef]
- Huang, Y.-d.; Ren, S.-q.; Xu, N.; Luo, Y.; Sin, C.H.; Cui, P.-Y. Impacts of specific street geometry on airflow and traffic pollutant dispersion inside a street canyon. Air Qual. Atmos. Health 2021, 15, 1133–1152. [Google Scholar] [CrossRef]
- Yuan, C.; Ng, E.; Norford, L.K. Improving air quality in high-density cities by understanding the relationship between air pollutant dispersion and urban morphologies. Build. Environ. 2014, 71, 245–258. [Google Scholar] [CrossRef] [PubMed]
- Chatterjee, S.; Khan, A.; Dinda, A.; Mithun, S.; Khatun, R.; Akbari, H.; Kusaka, H.; Mitra, C.; Bhatti, S.S.; Van Doan, Q. Simulating micro-scale thermal interactions in different building environments for mitigating urban heat islands. Sci. Total Environ. 2019, 663, 610–631. [Google Scholar] [CrossRef] [PubMed]
- Liu, Q.; Chen, G.; Sheng, L.; Iwasaki, T. Rapid reappearance of air pollution after cold air outbreaks in northern and eastern China. Atmos. Chem. Phys. 2022, 22, 13371–13388. [Google Scholar] [CrossRef]
- Yang, M.; Cao, S.; Zhang, D. Spatially Explicit Modeling of Anthropogenic Heat Intensity in Beijing Center Area: An Investigation of Driving Factors with Urban Spatial Forms. Sensors 2023, 23, 7608. [Google Scholar] [CrossRef] [PubMed]
- Zhou, J.; Xiang, S.; Zhang, Y.; Wang, Y.; Ge, W.; Liu, J.; Hu, J.; Wan, Y.; Wang, X.; Liu, Y.; et al. Evaluation of the street canyon level air pollution distribution pattern in a typical city block in baoding, china. SSRN Electron. J. 2021, 19, 10432. [Google Scholar] [CrossRef]
- Silva, J.P. Solar radiation and street temperature as function of street orientation. An analysis of the status quo and simulation of future scenarios towards sustainability in Bahrain. MATEC Web Conf. 2017, 23, 02002. [Google Scholar] [CrossRef]
- Jorga, S.D.; Florou, K.; Kaltsonoudis, C.; Kodros, J.K.; Vasilakopoulou, C.; Cirtog, M.; Fouqueau, A.; Picquet-Varrault, B.; Nenes, A.; Pandis, S.N. Nighttime chemistry of biomass burning emissions in urban areas: A dual mobile chamber study. Atmos. Chem. Phys. 2021, 21, 15337–15349. [Google Scholar] [CrossRef]
- Mou, B.; He, B.-J.; Zhao, D.-X.; Chau, K.-W. Numerical simulation of the effects of building dimensional variation on wind pressure distribution. Eng. Appl. Comput. Fluid Mech. 2017, 11, 293–309. [Google Scholar] [CrossRef]
- Huang, X.; Gao, L.; Guo, D.; Yao, R. Impacts of high-rise building on urban airflows and pollutant dispersion under different temperature stratifications: Numerical investigations. Atmos. Pollut. Res. 2021, 12, 100–112. [Google Scholar] [CrossRef]
- Palusci, O.; Monti, P.; Cecere, C.; Montazeri, H.; Blocken, B. Impact of morphological parameters on urban ventilation in compact cities: The case of the Tuscolano-Don Bosco district in Rome. Sci. Total Environ. 2022, 807, 150490. [Google Scholar] [CrossRef] [PubMed]
- Jiang, Z.; Cheng, H.; Zhang, P.; Kang, T. Influence of urban morphological parameters on the distribution and diffusion of air pollutants: A case study in China. J. Environ. Sci. 2021, 105, 163–172. [Google Scholar] [CrossRef] [PubMed]
- Ren, Q.; Shan, B.; Zhang, Q.; Shui, C. Influence of urban spatial structure on the spatial distribution of gaseous pollutants. Atmosphere 2023, 14, 1231. [Google Scholar] [CrossRef]
- Zou, Y.; Yue, P.; Liu, Q.; He, X.; Wang, Z. Wind field characteristics of complex terrain based on experimental and numerical investigation. Appl. Sci. 2022, 12, 5124. [Google Scholar] [CrossRef]
- Vannucci, P.F.; Cohen, R.C. Decadal trends in the temperature dependence of summertime urban PM2.5 in the Northeast United States. ACS Earth Space Chem. 2022, 6, 1793–1798. [Google Scholar] [CrossRef]
- Zhong, C.; Chen, C.; Liu, Y.; Gao, P.; Li, H. A specific study on the impacts of PM2.5 on urban heat islands with detailed in situ data and satellite images. Sustainability 2019, 11, 7075. [Google Scholar] [CrossRef]
- Schäfer, K.; Emeis, S.; Hoffmann, H.; Jahn, C. Influence of mixing layer height upon air pollution in urban and sub-urban areas. Meteorol. Z. 2006, 15, 647–658. [Google Scholar] [CrossRef] [PubMed]
- Hu, W.; Zhao, T.; Bai, Y.; Shen, L.; Sun, X.; Gu, Y. Contribution of regional PM2.5 transport to air pollution enhanced by sub-basin to-pography: A modeling case over Central China. Atmosphere 2020, 11, 1258. [Google Scholar] [CrossRef]
- Zhang, Z.; Xu, X.; Qiao, L.; Gong, D.; Kim, S.-J.; Wang, Y.; Mao, R. Numerical simulations of the effects of regional topography on haze pollution in Beijing. Sci. Rep. 2018, 8, 5504. [Google Scholar] [CrossRef] [PubMed]
- Zhang, L.; Guo, X.; Zhao, T.; Xu, X.; Zheng, X.; Li, Y.; Luo, L.; Gui, K.; Zheng, Y.; Shu, Z. Effect of large topography on atmospheric environment in Sichuan Basin: A climate analysis based on changes in atmospheric visibility. Front. Earth Sci. 2022, 10, 997586. [Google Scholar] [CrossRef]
- Clements, C.B.; Whiteman, C.D.; Horel, J.D. Cold-air-pool structure and evolution in a mountain basin: Peter Sinks, Utah. J. Appl. Meteorol. 2003, 42, 752–768. [Google Scholar] [CrossRef]
- Song, Y.; Shao, M. Impacts of complex terrain features on local wind field and PM2.5 concentration. Atmosphere 2023, 14, 761. [Google Scholar] [CrossRef]
- Huang, C.-H.; Du, Y.-R.; Tsai, H.-H. Urban planning elements affect thermal environment from solar radiation in subtropics. Int. J. Smart Grid Clean Energy 2019, 8, 763–772. [Google Scholar] [CrossRef]
- Duan, J.; Huang, R.-J.; Li, Y.; Chen, Q.; Zheng, Y.; Chen, Y.; Lin, C.; Ni, H.; Wang, M.; Ovadnevaite, J.; et al. Summertime and wintertime atmospheric processes of secondary aerosol in Beijing. Atmos. Chem. Phys. 2020, 20, 3793–3807. [Google Scholar] [CrossRef]
- Pal, S.; Behrendt, A.; Wulfmeyer, V. Elastic-backscatter-lidar-based characterization of the convective boundary layer and investigation of related statistics. Ann. Geophys. 2010, 28, 825–847. [Google Scholar] [CrossRef]
- Maki, M.; Harimaya, T. The effect of advection and accumulation of downslope cold air on nocturnal cooling in basins. J. Meteorol. Soc. Jpn. Ser. II 1988, 66, 581–597. [Google Scholar] [CrossRef][Green Version]
- Qiao, Q.; Zhen, Z.; Lin, Y. Assessment and simulation of thermal environments in Taiyuan urban built-up area, China. Front. Ecol. Evol. 2023, 11, 1261291. [Google Scholar] [CrossRef]
- Whiteman, C.D.; Zhong, S.; Shaw, W.J.; Hubbe, J.M.; Bian, X.; Mittelstadt, J. Cold pools in the Columbia Basin. Weather. Forecast. 2001, 16, 432–447. [Google Scholar] [CrossRef]
- Beccario, C. Taiyuan City Meteorological Winter Wind Field Data Website. Available online: https://earth.nullschool.net/zh-cn/#2023/12/24/0700Z/wind/surface/level/orthographic=-248.02,37.15,7413 (accessed on 10 June 2025).
- Beccario, C. Taiyuan City Meteorological Summer Wind Field Data Website. Available online: https://earth.nullschool.net/zh-cn/#2023/07/17/0700Z/wind/surface/level/orthographic=-251.88,37.90,1292 (accessed on 4 July 2025).
- Quimbayo-Duarte, J.; Chemel, C.; Staquet, C.; Troude, F.; Arduini, G. Drivers of severe air pollution events in a deep valley during wintertime: A case study from the Arve river valley, France. Atmos. Environ. 2021, 247, 118030. [Google Scholar] [CrossRef]
- Chen, L.-W.A.; Watson, J.G.; Chow, J.C.; Green, M.C.; Inouye, D.; Dick, K. Wintertime particulate pollution episodes in an urban valley of the Western US: A case study. Atmos. Chem. Phys. 2012, 12, 10051–10064. [Google Scholar] [CrossRef]
- Zhou, X.; Zhang, S.; Zhu, D. Impact of urban water networks on microclimate and PM2.5 distribution in downtown areas: A case study of Wuhan. Build. Environ. 2021, 203, 108073. [Google Scholar] [CrossRef]
- Meng, Q.; Gao, J.; Zhang, L.; Hu, X.; Qian, J.; Jancsó, T. Coupled cooling effects between urban parks and surrounding building morphologies based on the microclimate evaluation framework integrating remote sensing data. Sustain. Cities Soc. 2024, 102, 105235. [Google Scholar] [CrossRef]
- Jiang, Y.; Sun, Y.; Liu, Y.; Li, X. Exploring the correlation between waterbodies, green space morphology, and carbon dioxide concentration distributions in an urban waterfront green space: A simulation study based on the carbon cycle. Sustain. Cities Soc. 2023, 98, 104831. [Google Scholar] [CrossRef]
- Bi, S.; Dai, F.; Chen, M.; Xu, S. A new framework for analysis of the morphological spatial patterns of urban green space to reduce PM2.5 pollution: A case study in Wuhan, China. Sustain. Cities Soc. 2022, 82, 103900. [Google Scholar] [CrossRef]
- Ren, J.; Zhao, X.; Guo, X.; Guo, F.; Liu, K. Responses of Ambient Ozone and Other Pollutants to COVID-19 Lockdown in Taiyuan, North China. Pol. J. Environ. Stud. 2022, 31, 2823–2835. [Google Scholar] [CrossRef]
- Li, Z.; Ho, K.-F.; Lee, H.F.; Yim, S.H.L. Development of an integrated model framework for multi-air-pollutant exposure assessments in high-density cities. Atmos. Chem. Phys. 2024, 24, 649–661. [Google Scholar] [CrossRef]



| Data | Spatial Resolution | Source |
|---|---|---|
| PM2.5 | 1 km | https://data.tpdc.ac.cn/zh-hans/data/6168e75d-93ab-4e4a-b7ff-33152e49d0bf (accessed on 12 March 2025) |
| LST | 30 m | https://www.usgs.gov/ (accessed on 12 March 2025) |
| Road | - | https://www.opestreetmap.org (accessed on 20 March 2025) |
| Point-of-Interest (POI) | - | https://lbsyun.baidu.com/ (accessed on 20 March 2025) |
| Building | - | https://lbsyun.baidu.com/ (accessed on 23 March 2025) |
| UFIs | Unit | 17 July 2023 | 24 December 2023 | ||||||
|---|---|---|---|---|---|---|---|---|---|
| Mean | Max | Min | Std. | Mean | Max | Min | Std. | ||
| PM2.5 | μg/m3 | 20.64 | 23.33 | 0.00 | 3.830 | 55.39 | 63.04 | 0.00 | 1.343 |
| LST | Degrees Celsius (°C) | 45.69 | 63.04 | 0.00 | 4.273 | −6.90 | 0.49 | −11.43 | 1.247 |
| NB | - | 23.20 | 762.00 | 0.00 | 31.374 | 23.20 | 762.00 | 0.00 | 31.374 |
| SO | Degree (°) | 73.41 | 179.59 | 0.00 | 37.060 | 73.41 | 179.59 | 0.00 | 37.060 |
| BD | Percentage (%) | 14.13 | 93.66 | 0.00 | 11.222 | 14.13 | 93.66 | 0.00 | 11.222 |
| MBH | Meters (m) | 14.39 | 98.18 | 0.00 | 13.304 | 14.39 | 98.18 | 0.00 | 13.304 |
| FAI | - | 0.15 | 0.64 | 0.00 | 0.120 | 0.15 | 0.64 | 0.00 | 0.120 |
| SVF | - | 0.87 | 1.00 | 0.57 | 0.069 | 0.87 | 1.00 | 0.57 | 0.069 |
| DEM | Meters (m) | 781.18 | 1117.91 | 0.00 | 76.256 | 781.18 | 1117.91 | 0.00 | 76.256 |
| Variables | 17 July 2023 | 24 December 2023 | ||
|---|---|---|---|---|
| LST | PM2.5 | LST | PM2.5 | |
| NB | −0.357 1 | 0.011 | −0.015 | −0.140 |
| SO | −0.004 | −0.021 | −0.008 | −0.123 |
| BD | 1.545 | 0.025 | 0.088 | 0.361 |
| MBH | −0.481 | 0.058 | −0.042 | −0.121 |
| FAI | 10.977 | −0.488 | 3.438 | 4.998 |
| SVF | 15.074 | 2.491 | 1.114 | −3.160 |
| DEM | 5.405 | 1.561 | −0.895 | 4.095 |
| Intercept | −2.579 | 8.647 | −2.165 | 29.772 |
| N | 3849 | 3849 | 3849 | 3849 |
| R2 | 0.616 | 0.367 | 0.215 | 0.342 |
| RMSE | 2.647 | 1.069 | 1.105 | 3.108 |
| p-value | *** 2 | *** | *** | *** |
| Urban Functional Zones | Key UFIs | Control Strategy and Layout Recommendation |
|---|---|---|
| RZs (Residential Zones) | FAI, MBH, BD | Limit BD and MBH, optimize building spacing; avoid large enclosures |
| IZs (Industrial Zones) | SVF, DEM | Increase SVF, choose higher DEM, use topography to create wind tunnels |
| CSZs (Commercial Service Zones) | SO, BD | Adjust SO and BD, avoid deep street canyons |
| PSZs (Public Service Zones) | FAI, DEM | Enhance and utilize topography-driven ventilation |
Disclaimer/Publisher’s Note: The statements, opinions and data contained in all publications are solely those of the individual author(s) and contributor(s) and not of MDPI and/or the editor(s). MDPI and/or the editor(s) disclaim responsibility for any injury to people or property resulting from any ideas, methods, instructions or products referred to in the content. |
© 2025 by the authors. Licensee MDPI, Basel, Switzerland. This article is an open access article distributed under the terms and conditions of the Creative Commons Attribution (CC BY) license (https://creativecommons.org/licenses/by/4.0/).
Share and Cite
Zhao, W.; Xuan, L.; Li, W.; Wang, W.; Wang, X. Comprehensive Impact of Different Urban Form Indices on Land Surface Temperature and PM2.5 Pollution in Summer and Winter, Based on Urban Functional Zones: A Case Study of Taiyuan City. Sustainability 2025, 17, 6618. https://doi.org/10.3390/su17146618
Zhao W, Xuan L, Li W, Wang W, Wang X. Comprehensive Impact of Different Urban Form Indices on Land Surface Temperature and PM2.5 Pollution in Summer and Winter, Based on Urban Functional Zones: A Case Study of Taiyuan City. Sustainability. 2025; 17(14):6618. https://doi.org/10.3390/su17146618
Chicago/Turabian StyleZhao, Wenyu, Le Xuan, Wenru Li, Wei Wang, and Xuhui Wang. 2025. "Comprehensive Impact of Different Urban Form Indices on Land Surface Temperature and PM2.5 Pollution in Summer and Winter, Based on Urban Functional Zones: A Case Study of Taiyuan City" Sustainability 17, no. 14: 6618. https://doi.org/10.3390/su17146618
APA StyleZhao, W., Xuan, L., Li, W., Wang, W., & Wang, X. (2025). Comprehensive Impact of Different Urban Form Indices on Land Surface Temperature and PM2.5 Pollution in Summer and Winter, Based on Urban Functional Zones: A Case Study of Taiyuan City. Sustainability, 17(14), 6618. https://doi.org/10.3390/su17146618


