Article

Urban Shrinkage in the Qinling–Daba Mountains: Spatiotemporal Patterns and Influencing Factors

1
College of Architecture and Civil Engineering, Xi’an University of Science and Technology, Xi’an 710054, China
2
Shaanxi Key Laboratory of Earth Surface System and Environmental Carrying Capacity, College of Urban and Environmental Science, Northwest University, Xi’an 710127, China
*
Authors to whom correspondence should be addressed.
Sustainability 2025, 17(15), 7084; https://doi.org/10.3390/su17157084
Submission received: 28 April 2025 / Revised: 18 July 2025 / Accepted: 1 August 2025 / Published: 5 August 2025
(This article belongs to the Special Issue Sustainable Urban Planning and Regional Development)

Abstract

With the global economic restructuring and the consequent population mobility, urban shrinkage has become a common phenomenon. The Qinling–Daba Mountains, a zone with a key ecological function in China, have long experienced population decline and functional degradation. Clarifying the dynamics and influencing factors of urban shrinkage plays a vital role in supporting the sustainable development of the region. This study, using permanent resident population growth rates and nighttime light data, classified cities in the region into four spatial patterns: expansion–growth, intensive growth, expansion–shrinkage, and intensive shrinkage. It further examined the spatial characteristics of shrinkage across four periods (2005–2010, 2010–2015, 2015–2020, and 2020–2022). A Geographically and Temporally Weighted Regression (GTWR) model was applied to examine core influencing factors and their spatiotemporal heterogeneity. The results indicated the following: (1) The dominant pattern of urban shrinkage in the Qinling–Daba Mountains shifted from expansion–growth to expansion–shrinkage, highlighting the paradox of population decline alongside continued spatial expansion. (2) Three critical indicators significantly influenced urban shrinkage: the number of students enrolled in general secondary schools (X5), the per capita disposable income of urban residents (X7), and the number of commercial and residential service facilities (X12), with their effects exhibiting significant spatiotemporal heterogeneity. Temporally, X12 was the most influential factor in 2005 and 2010, while in 2015, 2020, and 2022, X5 and X7 became the dominant factors. Spatially, X7 significantly affected both eastern and western areas; X5’s influence was most pronounced in the west; and X12 had the greatest impact in the east. This study explored the patterns and underlying drivers of urban shrinkage in underdeveloped areas, aiming to inform sustainable development practices in regions facing comparable challenges.

1. Introduction

Amid ongoing globalization and demographic shifts, urban shrinkage has emerged as a prominent and multifaceted global issue [1,2,3,4,5]. It is an inevitable aspect of urban development and closely linked to economic transformation. This phenomenon encompasses not only population decline but also shifts in resource allocation, economic structure, and social development. Since the 1980s, numerous countries and regions have experienced urban shrinkage due to population decline, including the traditional industrial areas of Europe and the United States [6,7,8], as well as Japan, South Korea [9,10], and Northeast China [11,12]. Scholars in different countries have examined not only the multidimensional identification and typology of urban shrinkage, but also its spatial characteristics and underlying driving mechanisms [13,14,15,16,17,18,19].
Currently, the identification of urban shrinkage has evolved from using a single-dimensional approach to a more diversified one [20,21], incorporating multiple dimensions, such as demographic, economic, social, and spatial factors, to provide a comprehensive assessment of shrinkage. Since the decline in urban population remains the core feature of urban shrinkage, the demographic perspective continues to be commonly used, relying on indicators such as the registered population, permanent resident population, and total population [22,23]. Additionally, nighttime light data [24] and Baidu big data [25] have emerged as new data sources for studying urban shrinkage. Building upon this foundation, scholars have explored the typologies and spatial characteristics of urban shrinkage further, focusing on factors such as the extent of shrinkage [26,27] and its temporal phases [23], spatial patterns [28,29], and characteristics and underlying mechanisms [30,31], thus offering a more systematic understanding of the heterogeneous nature of urban shrinkage. However, two limitations remain: first, the existing typological framework pays insufficient attention to the composite evolutionary pattern of multidimensional shrinkage and growth in both population and space; second, studies often rely on a numerical expression of the degree of shrinkage, which may overlook common features of shrinkage.
Explorations of the factors influencing urban shrinkage are generally characterized by multidimensionality and spatial heterogeneity. Various studies indicate that the manifestations of shrinkage and the factors influencing it are highly localized, closely linked to elements such as the geographical environment, industrial structure, and local culture of specific regions or cities [32,33,34]. Influencing factors identified in existing research include deindustrialization [35], suburbanization [36,37], demographic changes [38], natural and social environments [39,40], and globalization shocks [41]. Although these dimensions have been comprehensively examined, the analysis of the dynamics of these influencing factors requires further refinement. In the case of China, scholars have examined urban shrinkage within the context of unique national conditions, such as the household registration system, urban–rural integration, and regional synergy, with much of the focus being on the northeastern region [42,43] and the periphery of developed urban agglomerations [30,44]. However, substantial scope remains for further investigation into urban shrinkage in underdeveloped regions, particularly in cities that are situated within ecologically sensitive areas. Therefore, conducting systematic research on the patterns and underlying mechanisms of urban shrinkage in such regions can help elucidate the spatial relationship between ecological conservation and urban development, promote the rational allocation of population and resources, and thus provide both theoretical support and practical strategies for advancing sustainable development in underdeveloped areas.
The Qinling–Daba Mountains constitute one of China’s key ecological function zones and continuously poverty-stricken areas. Constrained over a long period of time by multiple factors, such as its geographical remoteness, fragmented terrain, and ecological fragility, the region’s economic development has lagged behind, rendering it a representative example of underdeveloped areas in China. Based on an analysis of permanent resident population data, it is evident that in recent years, the Qinling–Daba region has experienced substantial population decline at the county level, with some counties undergoing large-scale outmigration—a trend that is likely to intensify [5,45,46]. Additionally, the region faces immense pressure from economic restructuring, and the conflict between ecological conservation demands and development needs is particularly pronounced here. Therefore, the Qinling–Daba Mountains exemplify a typical and representative case for urban shrinkage research: on the one hand, they constitute a key area for the coordinated advancement of urbanization and ecological protection in China; on the other hand, widespread population loss and the complexity of its evolution provide a solid basis for identifying regional shrinkage and analyzing its underlying mechanisms.
Therefore, this study takes the county level as its fundamental analytical scale and utilizes permanent resident population data and nighttime light data to conduct multidimensional identification and classification of urban shrinkage, aiming to delineate its patterns and examine the evolutionary characteristics of urban shrinkage in the Qinling–Daba Mountains. Based on this, a Geographically and Temporally Weighted Regression (GTWR) model was applied to examine the main influencing factors and their spatiotemporal differentiation characteristics in relation to urban shrinkage in the Qinling–Daba Mountains. The aim is to address the limited attention given to urban shrinkage in underdeveloped regions in existing studies, provide new insights for a comprehensive understanding of the characteristics and influencing factors of urban shrinkage, and further enrich international research in this area.

2. Materials and Methods

2.1. Study Area

The Qinling–Daba Mountains are located at the intersection of southwestern and northwestern China, spanning six provinces and municipalities: Sichuan, Henan, Hubei, Shaanxi, Chongqing, and Gansu. The terrain is elevated in the west and lower in the east, characterized by significant altitudinal variation. It primarily comprises mountainous and hilly landscapes, interspersed with basins (Figure 1). According to China’s National Major Function-Oriented Zoning Plan, the region is predominantly classified as a key ecological function zone. In 2012, it was designated by China’s State Council as one of the country’s 11 continuously poverty-stricken areas [47].
Similar to other continuously impoverished regions—such as the Yanshan–Taihang Mountains and the Dabie Mountains—the Qinling–Daba region faces natural constraints on infrastructure development and industrial distribution due to its complex topography. These constraints lead to inefficient resource allocation, weak economic agglomeration, and hindered development. Furthermore, the Qinling–Daba Mountains face more pronounced regional challenges: first, its large population base is combined with a persistent and worsening trend of population decline; second, economic development is primarily reliant on specialty agriculture and processing industries, while the tertiary sector remains underdeveloped. This structural imbalance generates substantial pressure on industrial transformation, resulting in weak development momentum and a pronounced conflict between ecological protection and economic growth.
Overall, as a strategic region for China’s efforts to coordinate new urbanization and ecological conservation, the Qinling–Daba Mountains—characterized by significant population loss and acute economic challenges—serve as a representative case for investigating urban shrinkage in underdeveloped mountainous areas. Therefore, selecting the Qinling–Daba Mountains as a research subject facilitates the exploration of the evolution and governance mechanisms of urban shrinkage in such regions, offering theoretical insights and policy guidance for their sustainable development.
Meanwhile, this study examines urban shrinkage from both a temporal and spatial perspective. From a temporal perspective, recognizing that urban shrinkage is a complex and evolving process, the analysis is grounded in policy transitions and urbanization stages, data availability and consistency, and alignment with mainstream research practices. This study features a detailed examination of county-level urban shrinkage in the Qinling–Daba Mountains across four time intervals: 2005–2010, 2010–2015, 2015–2020, and 2020–2022. From a spatial perspective, based on China’s current national conditions, counties are characterized by diversified economic structures, complex population distributions, and strong interconnections with surrounding cities, making them crucial for understanding the heterogeneity and complexity of regional urban shrinkage. These factors also provide a key foundation for accurately grasping shrinkage trends and formulating effective strategies to address them. In summary, this study focuses on 81 county-level cities (including districts and counties) in the Qinling–Daba Mountains.

2.2. Data Sources

In this study, extensive multi-source data, including administrative, natural, demographic, economic, social, and spatial data were collected within the study area (Table 1).
(1)
Administrative Boundary Data: the administrative boundary data for county-level cities in the Qinling–Daba Mountains were sourced from the National Platform for Common GeoSpatial Information Services.
(2)
Statistical Information: The majority of the data on natural, demographic, economic, and social elements used in this study were derived from the Statistical Bulletins and Yearbooks of provincial and prefecture-level municipal areas, as well as from various population and economic censuses. Missing data were incorporated through interpolation techniques.
(3)
Digital Elevation Model (DEM): the Digital Elevation Model was used to calculate the average elevation and topographic relief, while also assisting in the delineation of the study area. The Geospatial Data Cloud served as the source for these data.
(4)
Point of Interest (POI) Data: POI data, in the form of spatial features with geographic identifiers, encompass information such as name, category, latitude, and longitude. These data were sourced from online map service providers, including Amap. Analyzing the spatial distribution of various POIs enables the elucidation of socio-economic indicators, such as investments in science and education, the level of medical services, and environmental livability within a specific region, thereby enhancing and supplementing existing statistical data.
(5)
Nighttime Light Data: The calibration of Defense Meteorological Satellite Program Operational Line Scanning System (DMSP-OLS) data and Suomi National Polar-orbiting Partnership’s Visible Infrared Imaging Radiometer Suite (SNPP-VIIRS) data to generate DMSP-OLS-like data effectively addresses the incompatibility between these two satellite datasets [48]. In this study, the calibrated DMSP-OLS-like data were utilized to extract nighttime light data for the Qinling–Daba Mountains, aiding in the identification of urban shrinkage.
(6)
Road Traffic Data: Vector data representing the road infrastructure within the counties of the Qinling–Daba Mountains, along with the distances from these counties to provincial and prefecture-level cities, were obtained through data extraction from Amap services.

2.3. Research Framework and Methods

2.3.1. Research Framework

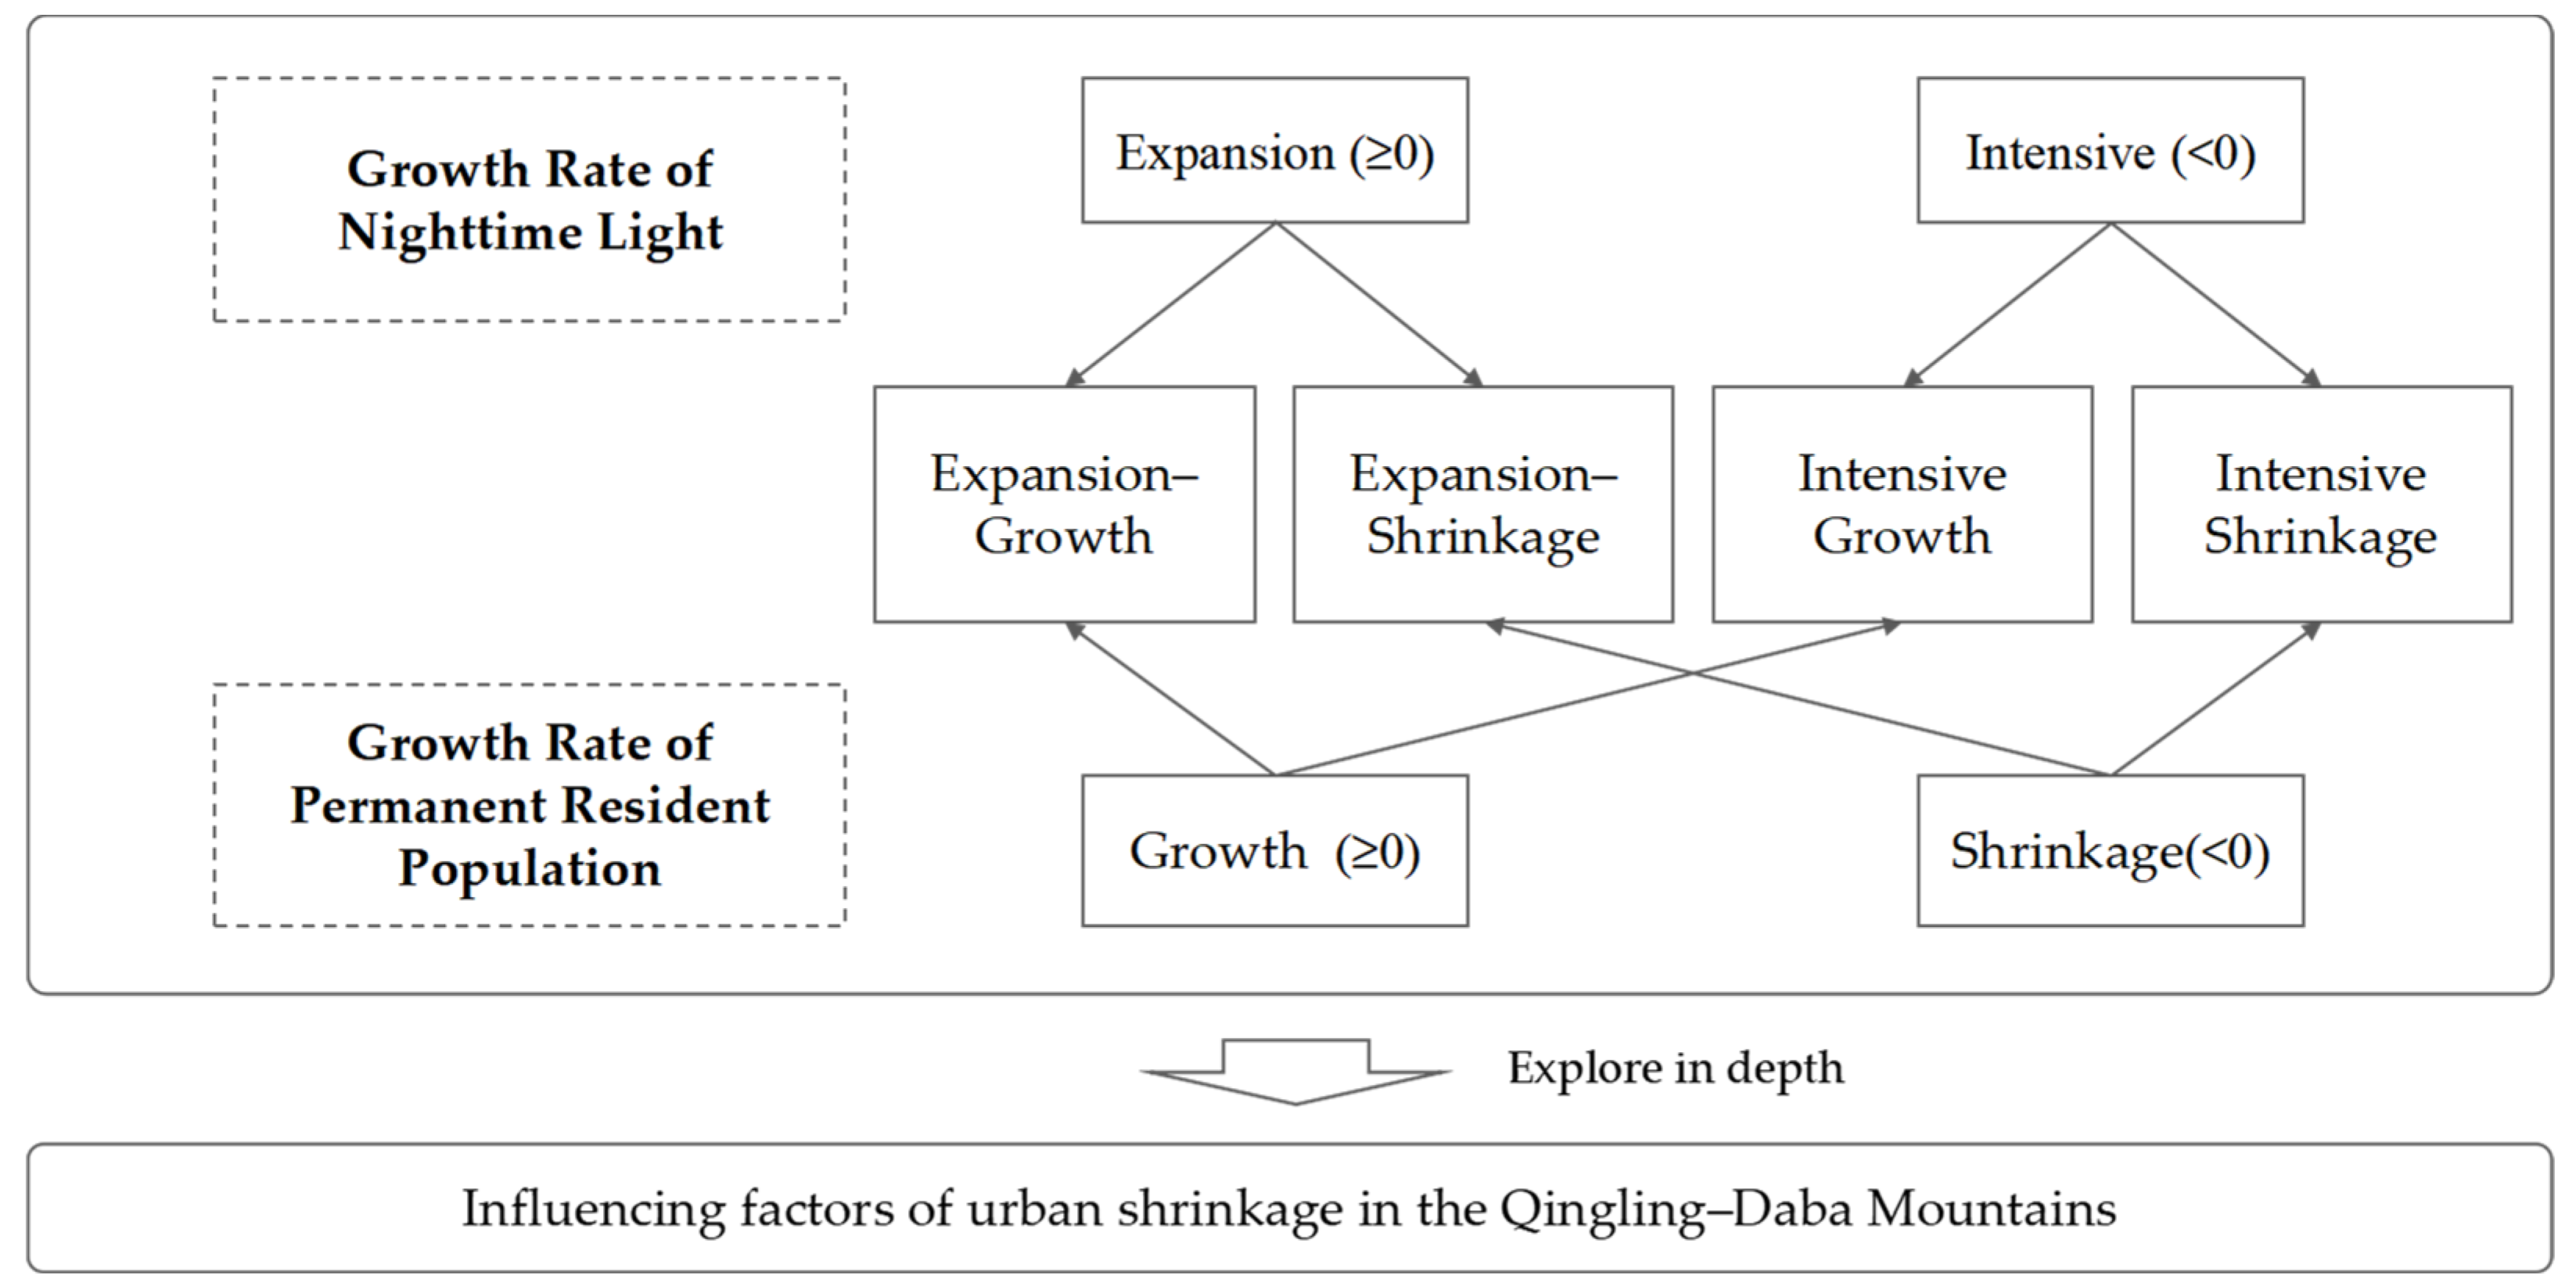
To develop a composite classification method that captures the multidimensional coexistence of urban shrinkage and growth while visually presenting the common characteristics of cities within the study area, this study conducted a detailed classification of urban shrinkage phenomena based on both population and spatial dimensions. Specifically, building upon the methodology of Liang Yuanzhao et al. [49], this study employed the combined growth rates of the permanent resident population and nighttime light data to categorize each district and county into four spatial patterns: expansion–growth, intensive growth, expansion–shrinkage, and intensive shrinkage.
This dual-dimensional approach overcame the constraints associated with a sole dependence on population changes for identifying and classifying urban shrinkage. It further underscored the importance of spatial development conditions in determining urban shrinkage in underdeveloped regions. By offering a locally adaptive classification framework, this study provided a foundation for further exploration of the factors influencing urban shrinkage in the Qinling–Daba Mountains (Figure 2).
The four patterns were defined as follows:
Expansion–Growth: Both the permanent resident population and built-up area were increasing.
Intensive Growth: The permanent resident population was increasing, while the built-up area was decreasing.
Expansion–Shrinkage: The built-up area was increasing, but the permanent resident population was decreasing.
Intensive Shrinkage: Both the permanent resident population and built-up area were decreasing.

2.3.2. Methods

(1)
Measurement of urban shrinkage
(1)
Growth rate of permanent resident population
It is widely recognized among scholars that the defining feature of urban shrinkage is a declining population [23,50]. Among various population metrics, the permanent resident population is considered a more accurate indicator of demographic vitality in a given area than the registered population. Therefore, calculating the growth rate based on permanent resident population data provides a representative approach to identifying urban shrinkage from a demographic perspective [51]. The calculation formula is as follows:
P c i = P t i P o i P o i × 100 %
where Pci represents the growth rate of the permanent resident population during a specific research period in the study area; Poi denotes the total permanent resident population at the beginning of the study period; and Pti signifies the total permanent resident population at the end of the study period.
  • (2)
    Growth Rate of Nighttime Light
The expansion of built-up areas in the Qinling–Daba Mountains is intricately linked to ecological protection objectives and reflects the dynamic changes in the spatial allocation of urban resources. A robust positive correlation between the nighttime light intensity and built-up areas has been extensively documented in prior studies [52]. Consequently, urban spatial dynamics can be accurately approximated by employing the growth rates of nighttime light as an indicator. The calculation formula is as follows:
P c j = P t j P o j P o j × 100 %
where Pcj represents the growth rate of nighttime light during a specific research period in the study area; Poj denotes the total digital number of nighttime light at the beginning of the study period; and Ptj signifies the total digital number of nighttime light at the end of the study period.
(2)
Measurements of the influencing factors
(1)
Construction of an indicator system
To investigate the factors influencing urban shrinkage patterns in the Qinling–Daba Mountains and account for the region’s complex natural environment, this study constructed an urban shrinkage indicator system by selecting 15 influencing factors across five dimensions: natural, demographic, economic, social, and spatial [53,54,55,56,57,58] (Table 2).
The natural dimension comprises two indicators—average elevation and topographic relief—that reflect the region’s complex topography and ecological environment, both of which directly influence urban expansion and sustainable resource utilization. The demographic dimension includes three indicators: the birth rate, natural growth rate, and number of students enrolled in general secondary schools. These indicators capture changes in population structure and population vitality, significantly affecting the labor supply and market demand within a city. The economic dimension emphasizes the city’s economic vitality and industrial structure, incorporating three indicators: the gross regional product, per capita disposable income of urban residents, and gross output value of industrial enterprises above a designated size. The social dimension relates to public services and social welfare, comprising four indicators: the total retail sales of consumer goods; number of commercial residential service facilities; number of science, education, and cultural service facilities; and number of healthcare service facilities. These factors shape residents’ quality of life and the city’s attractiveness. Finally, the spatial dimension comprises three indicators, the total road length in a given year, distance from provincial capitals, and distance to municipalities, which collectively characterize the city’s transportation accessibility and the strength of intra-regional urban linkages.
  • (2)
    Screening of influencing factors
After standardizing all variable data, a linear regression analysis was conducted to examine potential correlations among the influencing factors. Given the stringent requirements for multicollinearity in the GTWR model, each factor’s Variance Inflation Factor (VIF) had to be less than 10. Consequently, prior to applying the GTWR model, factors that did not meet this criterion were excluded, resulting in the selection of eight independent variables (Table 3).
(3)
Analysis of influencing factors
A GTWR model extends the spatial regression framework of Geographically Weighted Regression (GWR) by simultaneously incorporating both spatial and temporal variations in data relationships [59]. To examine urban shrinkage in the Qinling–Daba Mountains across multiple time periods, this study employed the GTWR model to quantitatively analyze influencing factors in county-level cities of this region for the years 2005, 2010, 2015, 2020, and 2022. The following equation was utilized in the analysis:
Y i = β 0 u i , v i , t i + k = 1 p β k u i , v i , t i X i k + ε i
where Yi is the dependent variable, representing the observed value of city i at time ti, which in this context denotes the degree of urban shrinkage; ui and vi denote the spatial coordinates (i.e., latitude and longitude) of city i, which remain constant over time; (ui, vi, ti) denotes the spatiotemporal coordinates of city i at time ti; β0(ui, vi, ti) is the intercept term; p denotes the number of independent variables; βk(ui, vi, ti) is the regression coefficient of the k-th independent variable at city i and time ti; Xik is the observed value of the k-th independent variable (i.e., influencing factor) at city i and time ti; and εi is the model residual.
Concurrently, this study employed the comprehensive index method, as described in prior research, to assess urban shrinkage in county-level cities within the Qinling–Daba Mountains. By integrating data on the permanent resident population and nighttime light intensity at the end of each year, a comprehensive value reflecting the overall extent of urban shrinkage was derived. A smaller comprehensive value indicated a more pronounced degree of urban shrinkage. The calculation formula is as follows:
U D j = j = 1 m W j × X i j
where UDj represents the composite index of the jth region; m denotes the number of indicators; Wj is the weight coefficient of the jth indicator; and Xij is the standardized value of the jth indicator of the ith region. Additionally, to ensure balance, complementarity, and significance in the comprehensive assessment, the weights of the permanent resident population and nighttime light values were both set to 0.5 in this study.

3. Results

3.1. The Spatial and Temporal Characteristics of the Evolution of Urban Shrinkage in the Qinling–Daba Mountains

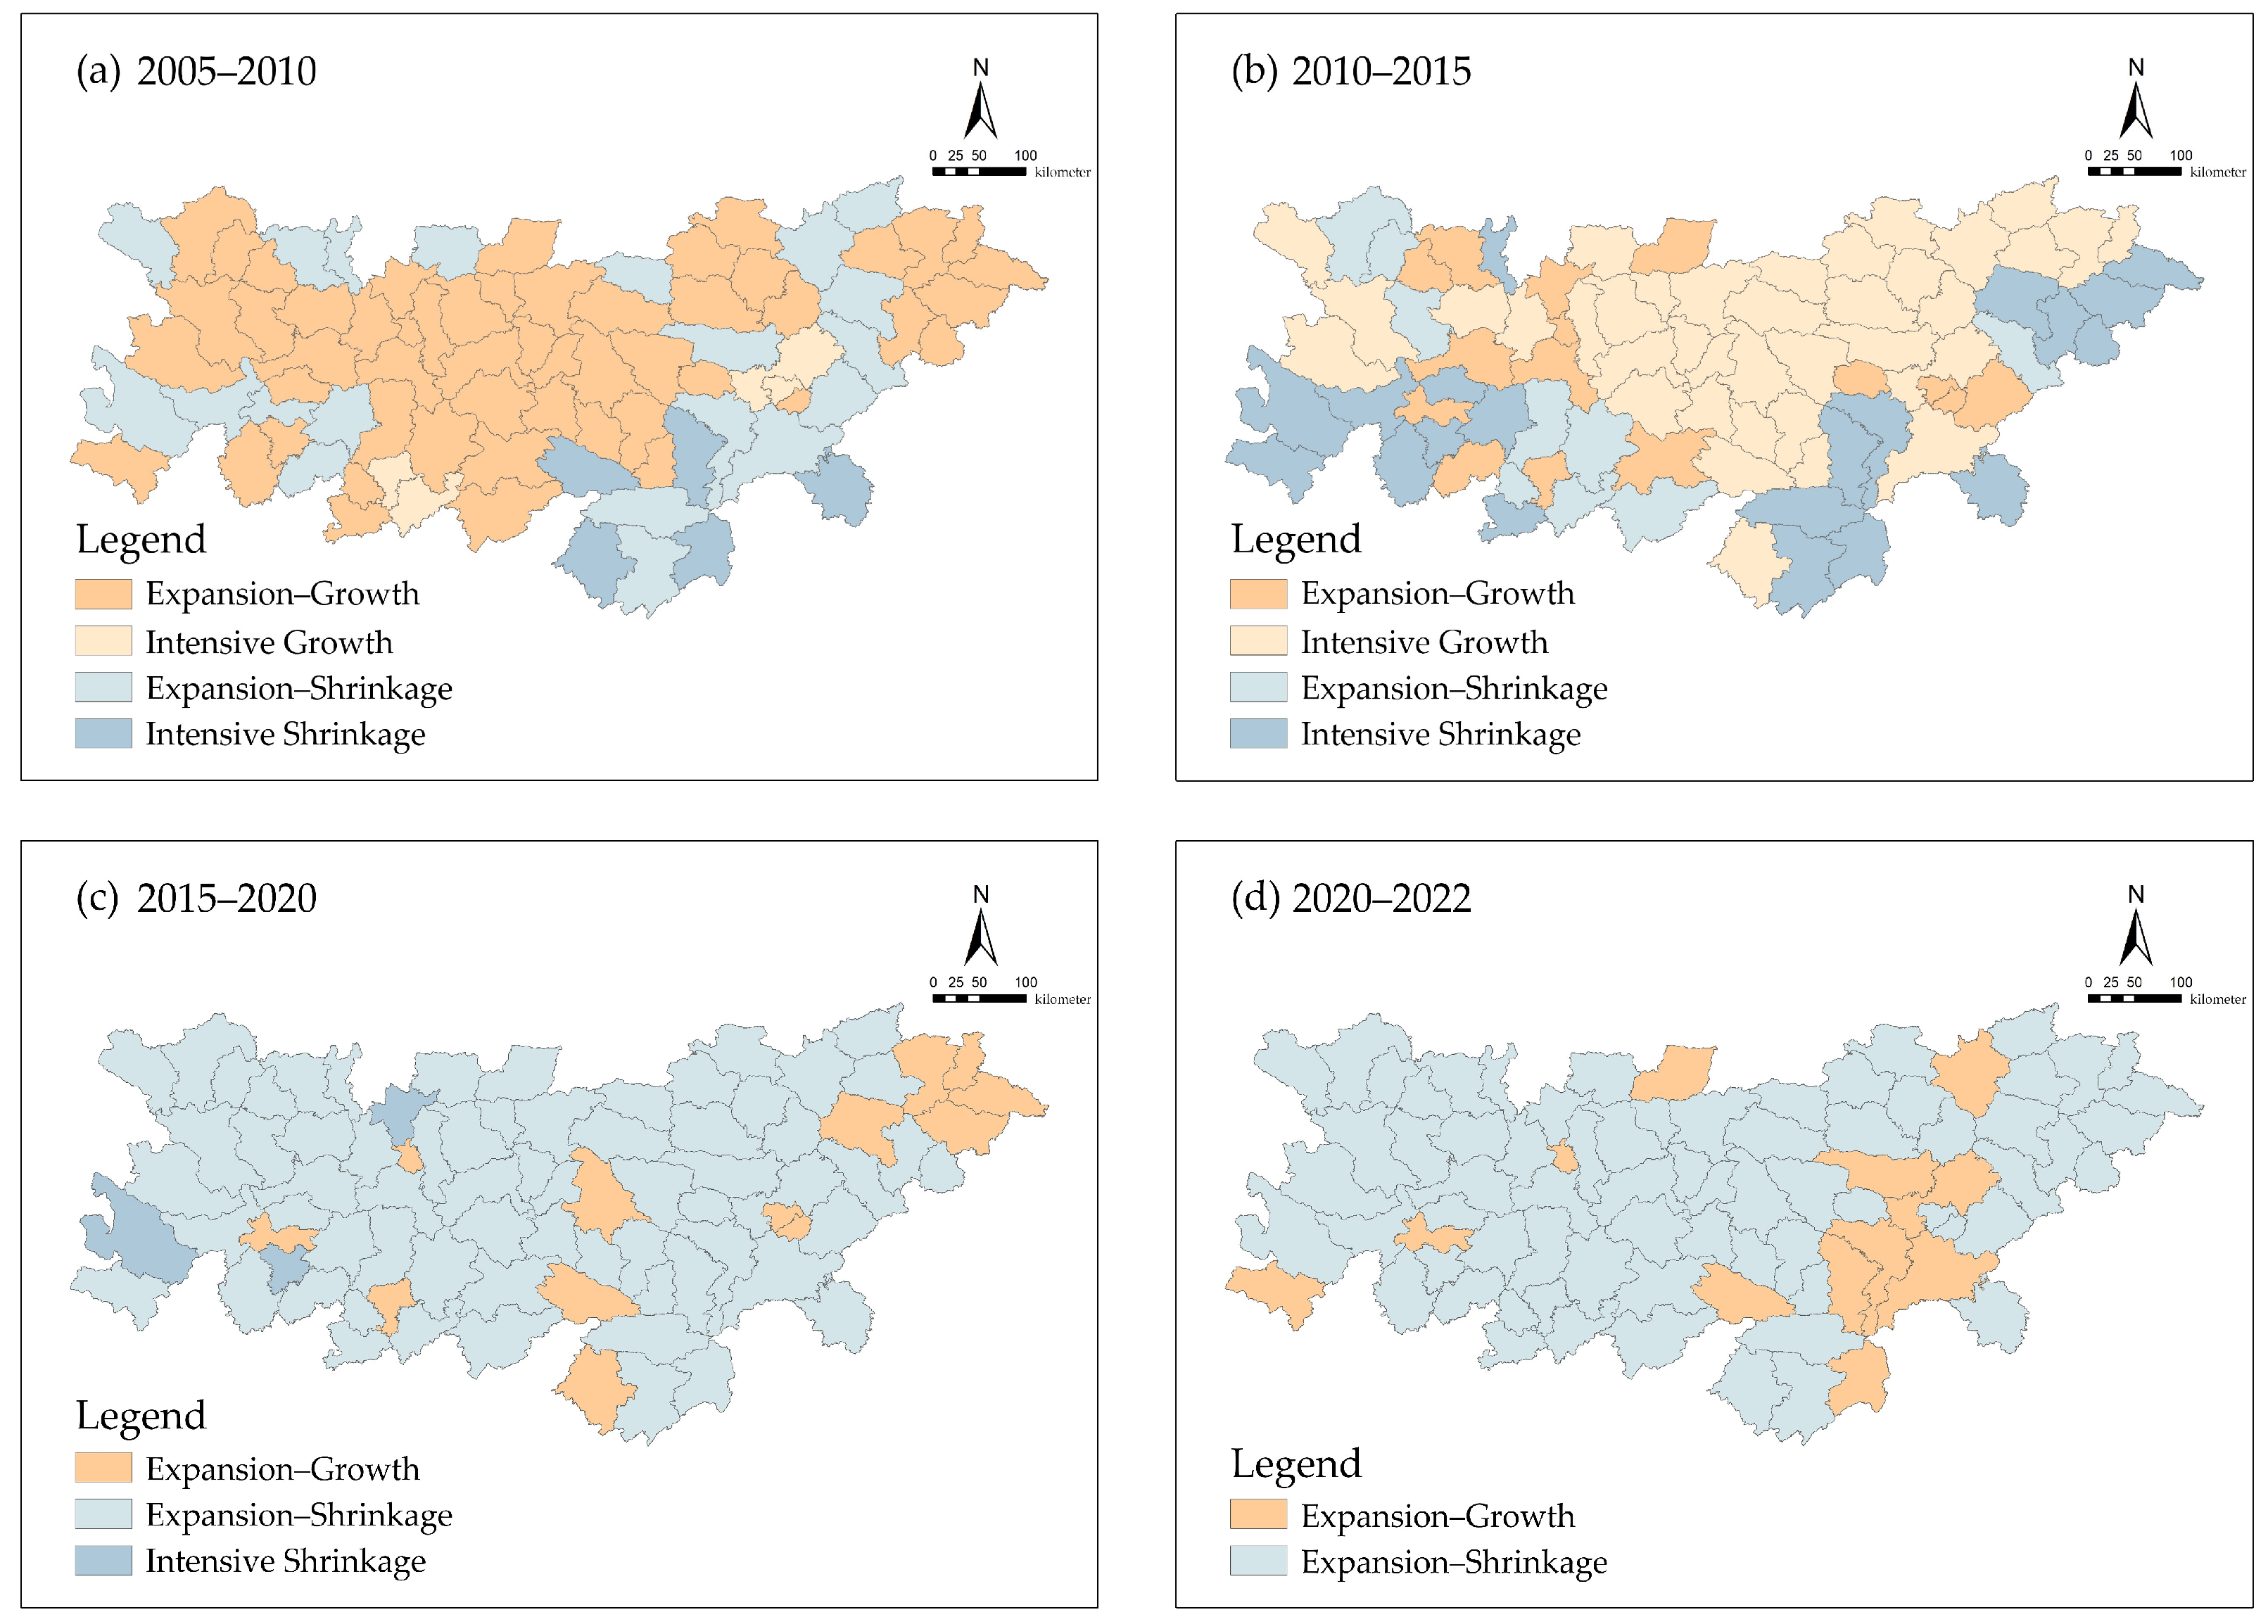
By integrating the growth rates of the permanent resident population data and nighttime light data, this study identified and categorized urban growth and shrinkage in the Qinling–Daba Mountains during the periods of 2005–2010, 2010–2015, 2015–2020, and 2020–2022.
The percentage of different patterns of cities in the Qinling–Daba Mountains varied significantly over time (Table 4). From 2005 to 2010, expansion–growth cities constituted the largest percentage, reaching 64.20%. However, their share declined steadily in subsequent periods. In contrast, intensive growth cities peaked at 45.68% between 2010 and 2015, but after a brief resurgence, they eventually disappeared after 2015. Expansion–shrinkage cities initially declined but later increased, becoming the dominant pattern during 2015–2020 and 2020–2022 and accounting for more than 80% in both periods. Meanwhile, intensive shrinkage cities consistently accounted for a small percentage, peaking at 24.69% between 2010 and 2015 before gradually disappearing. In summary, from 2005 to 2022, the predominant urban development pattern in the Qinling–Daba Mountains shifted from an expansion–growth model to an expansion–shrinkage model. This transition underscores a paradoxical phenomenon: despite a declining population, urban spatial expansion persisted.
In terms of spatial distribution, urban shrinkage in the Qinling–Daba Mountains exhibited distinct spatial heterogeneity (Figure 3). From 2005 to 2010, the majority of expansion–growth cities were distributed across the midwestern portions of the Qinling–Daba Mountains, but they subsequently shifted gradually eastward, with a small cluster emerging in the southeastern region. Intensive growth cities were only observed during two research periods: 2005–2010 and 2010–2015. During 2005–2010, these cities were primarily located in certain urban areas and their surrounding counties, whereas in 2010–2015, they showed a clear spatial concentration in the central and northern zones of the research area, with only a few being scattered along its periphery. Expansion–shrinkage cities were initially distributed sporadically along the regional margins in 2005–2010 and 2010–2015, but they progressively spread to encompass most counties in the study area. The number of intensive shrinkage cities remained relatively low, primarily concentrated in the southeastern and southwestern regions before gradually disappearing.
In summary, urban shrinkage in the Qinling–Daba Mountains has become increasingly severe, ultimately leading to the formation of a widespread expansion–shrinkage pattern, with a small number of expansion–growth cities interspersed. Expansion–growth cities were primarily concentrated in specific urban areas and their surrounding areas, reflecting the relatively strong population aggregation capacity of these cities in the Qinling–Daba Mountains. Notably, the Hantai District of Hanzhong City remained an expansion–shrinkage city throughout the study period, meaning that both its spatial development and population size increased. In contrast, Xichuan County of Nanyang City consistently exhibited an expansion–shrinkage pattern, characterized by ongoing spatial expansion that was accompanied by population decline. Meanwhile, Yunyang County of Chongqing City underwent four distinct developmental stages: starting with intensive shrinkage, transitioning to intensive growth, followed by expansion–growth, and, finally, expansion–shrinkage.

3.2. Influencing Factors of Urban Shrinkage in the Qinling–Daba Mountains

This study utilized the GTWR plug-in in ArcGIS to analyze the spatial relationships of identified urban shrinkage determinants. The statistical results of the model parameters are presented in Table 5. The R2 value of the GTWR model was 0.9073, the adjusted R2 was 0.9055, and the Corrected Akaike Information Criterion (AICc) was −376.93, indicating that the model exhibited a strong goodness-of-fit and excellent explanatory power regarding the factors influencing urban shrinkage. These results demonstrate that the GTWR model can provide relatively accurate analytical insights.
The overall descriptive statistical results of the regression coefficients of the factors affecting urban shrinkage in the Qinling–Daba Mountains are shown in Table 6. The significance ratio of each factor was far greater than 50%, indicating that each factor has statistical significance in explaining urban shrinkage. Comparing the minimum and maximum values, the coefficients of each influencing factor showed a relatively large range, not only in terms of numerical value but also in the sense that the coefficients of some factors, such as the average altitude, birth rate, and medical and healthcare facilities, spanned both the positive and negative ranges. This intuitively reflects the significant temporal and spatial heterogeneity of the effects of each influencing factor on urban shrinkage in the Qinling–Daba Mountains. Therefore, the following sections present an in-depth examination of urban shrinkage from both the spatial and temporal perspectives.

3.2.1. Analysis of the Temporal Evolution of Influencing Factors

To investigate the key influencing factors and their temporal dynamics across the Qinling–Daba Mountains, this study employed a GTWR model to analyze the determinants of urban shrinkage at five time points: 2005, 2010, 2015, 2020, and 2022. The study also calculated the average regression coefficients for each of these years (Table 7). These coefficients reflect both the magnitude and direction of each factor’s effect on urban shrinkage. Specifically, the higher the absolute value of a regression coefficient is, the stronger the impact of the corresponding factor on the dependent variable is, and vice versa. When the regression coefficient of a particular factor has a significantly higher absolute value than those of other influencing factors in a given year, it suggests that this factor plays a particularly prominent role in urban shrinkage during that period. Furthermore, a positive regression coefficient reflects a mitigating influence of the factor on urban shrinkage, while a negative one suggests an exacerbating effect.
As shown in Table 7, the number of commercial residential service facilities (X12) was a significant influencing factor on urban shrinkage in both 2005 and 2010 in terms of its effect intensity. Regarding the direction of influence, topographic relief (X2), the birth rate (X3), the number of students enrolled in general secondary schools (X5), the per capita disposable income of urban residents (X7), and the number of commercial residential service facilities (X12) exerted positive effects. In contrast, the average elevation (X1), number of healthcare service facilities (X10), and distance from provincial cities (X14) had negative effects.
In 2015, the number of students enrolled in general secondary schools (X5) and the per capita disposable income of urban residents (X7) became key influencing factors on urban shrinkage in terms of their effect intensities. Regarding the direction of influence, topographic relief (X2), the birth rate (X3), the number of students enrolled in general secondary schools (X5), the number of healthcare service facilities (X10), and the number of commercial residential service facilities (X12) exerted positive effects. Meanwhile, the average elevation (X1), per capita disposable income of urban residents (X7), and distance from provincial cities (X14) exerted negative effects.
In 2020, in terms of effect intensity, the number of students enrolled in general secondary schools (X5) and per capita disposable income of urban residents (X7) continued to be key influencing factors on urban shrinkage. Regarding the direction of influence, the average elevation (X1), number of students enrolled in general secondary schools (X5), per capita disposable income of urban residents (X7), number of healthcare service facilities (X10), and number of commercial residential service facilities (X12) exerted positive effects, while topographic relief (X2), the birth rate (X3), and the distance from provincial cities (X14) exerted negative effects.
In 2022, in terms of effect intensity, the number of students enrolled in general secondary schools (X5) remained a significant influencing factor of urban shrinkage. Regarding the direction of influence, each influencing factor exhibited the same effect as in 2020.
Overall, the number of students enrolled in general secondary schools (X5), per capita disposable income of urban residents (X7), and number of commercial residential service facilities (X12) were the core indicators influencing urban shrinkage in the Qinling–Daba Mountains from 2005 to 2022. Among them, the number of students enrolled in general secondary schools (X5) exhibited a fluctuating upward trend in terms of its effect intensity, becoming the strongest influencing factor of urban shrinkage by 2022. The per capita disposable income of urban residents (X7) generally had a positive effect but showed a decreasing trend in effect intensity. The number of commercial residential service facilities (X12) was significantly stronger than other influencing factors in 2005 and 2010 but declined year-by-year thereafter.

3.2.2. Analysis of the Spatial Heterogeneity of Influencing Factors

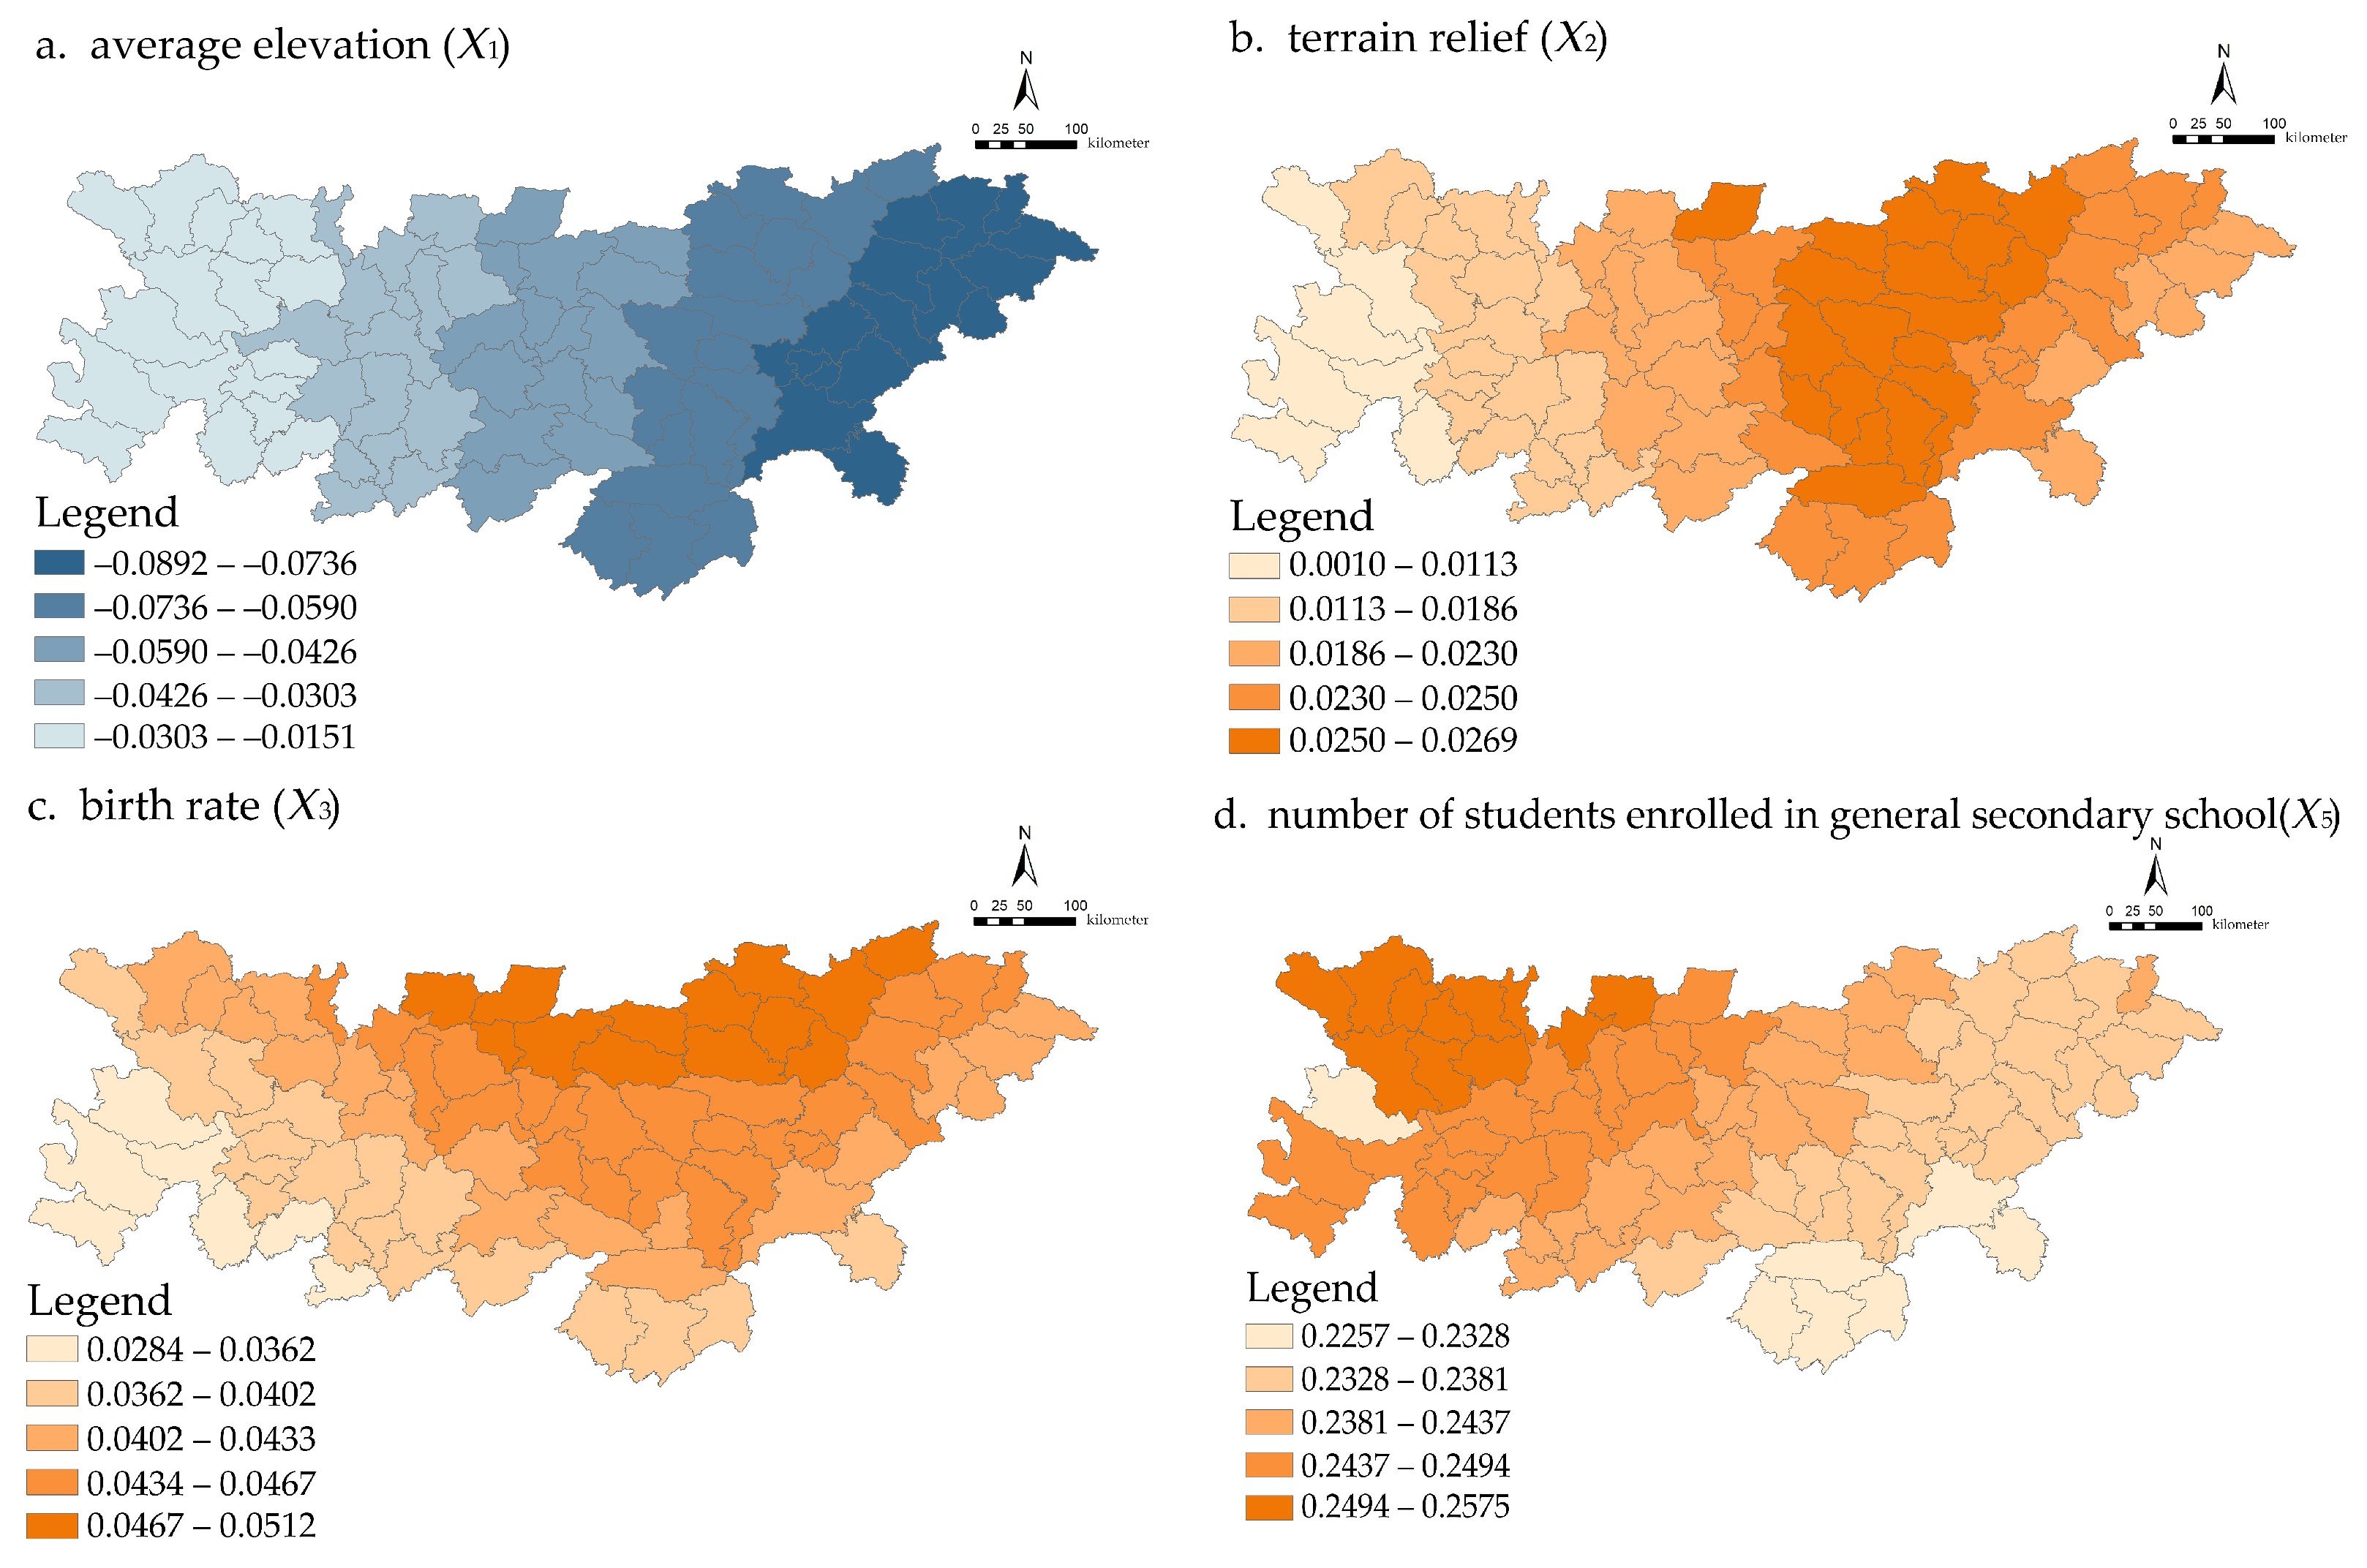
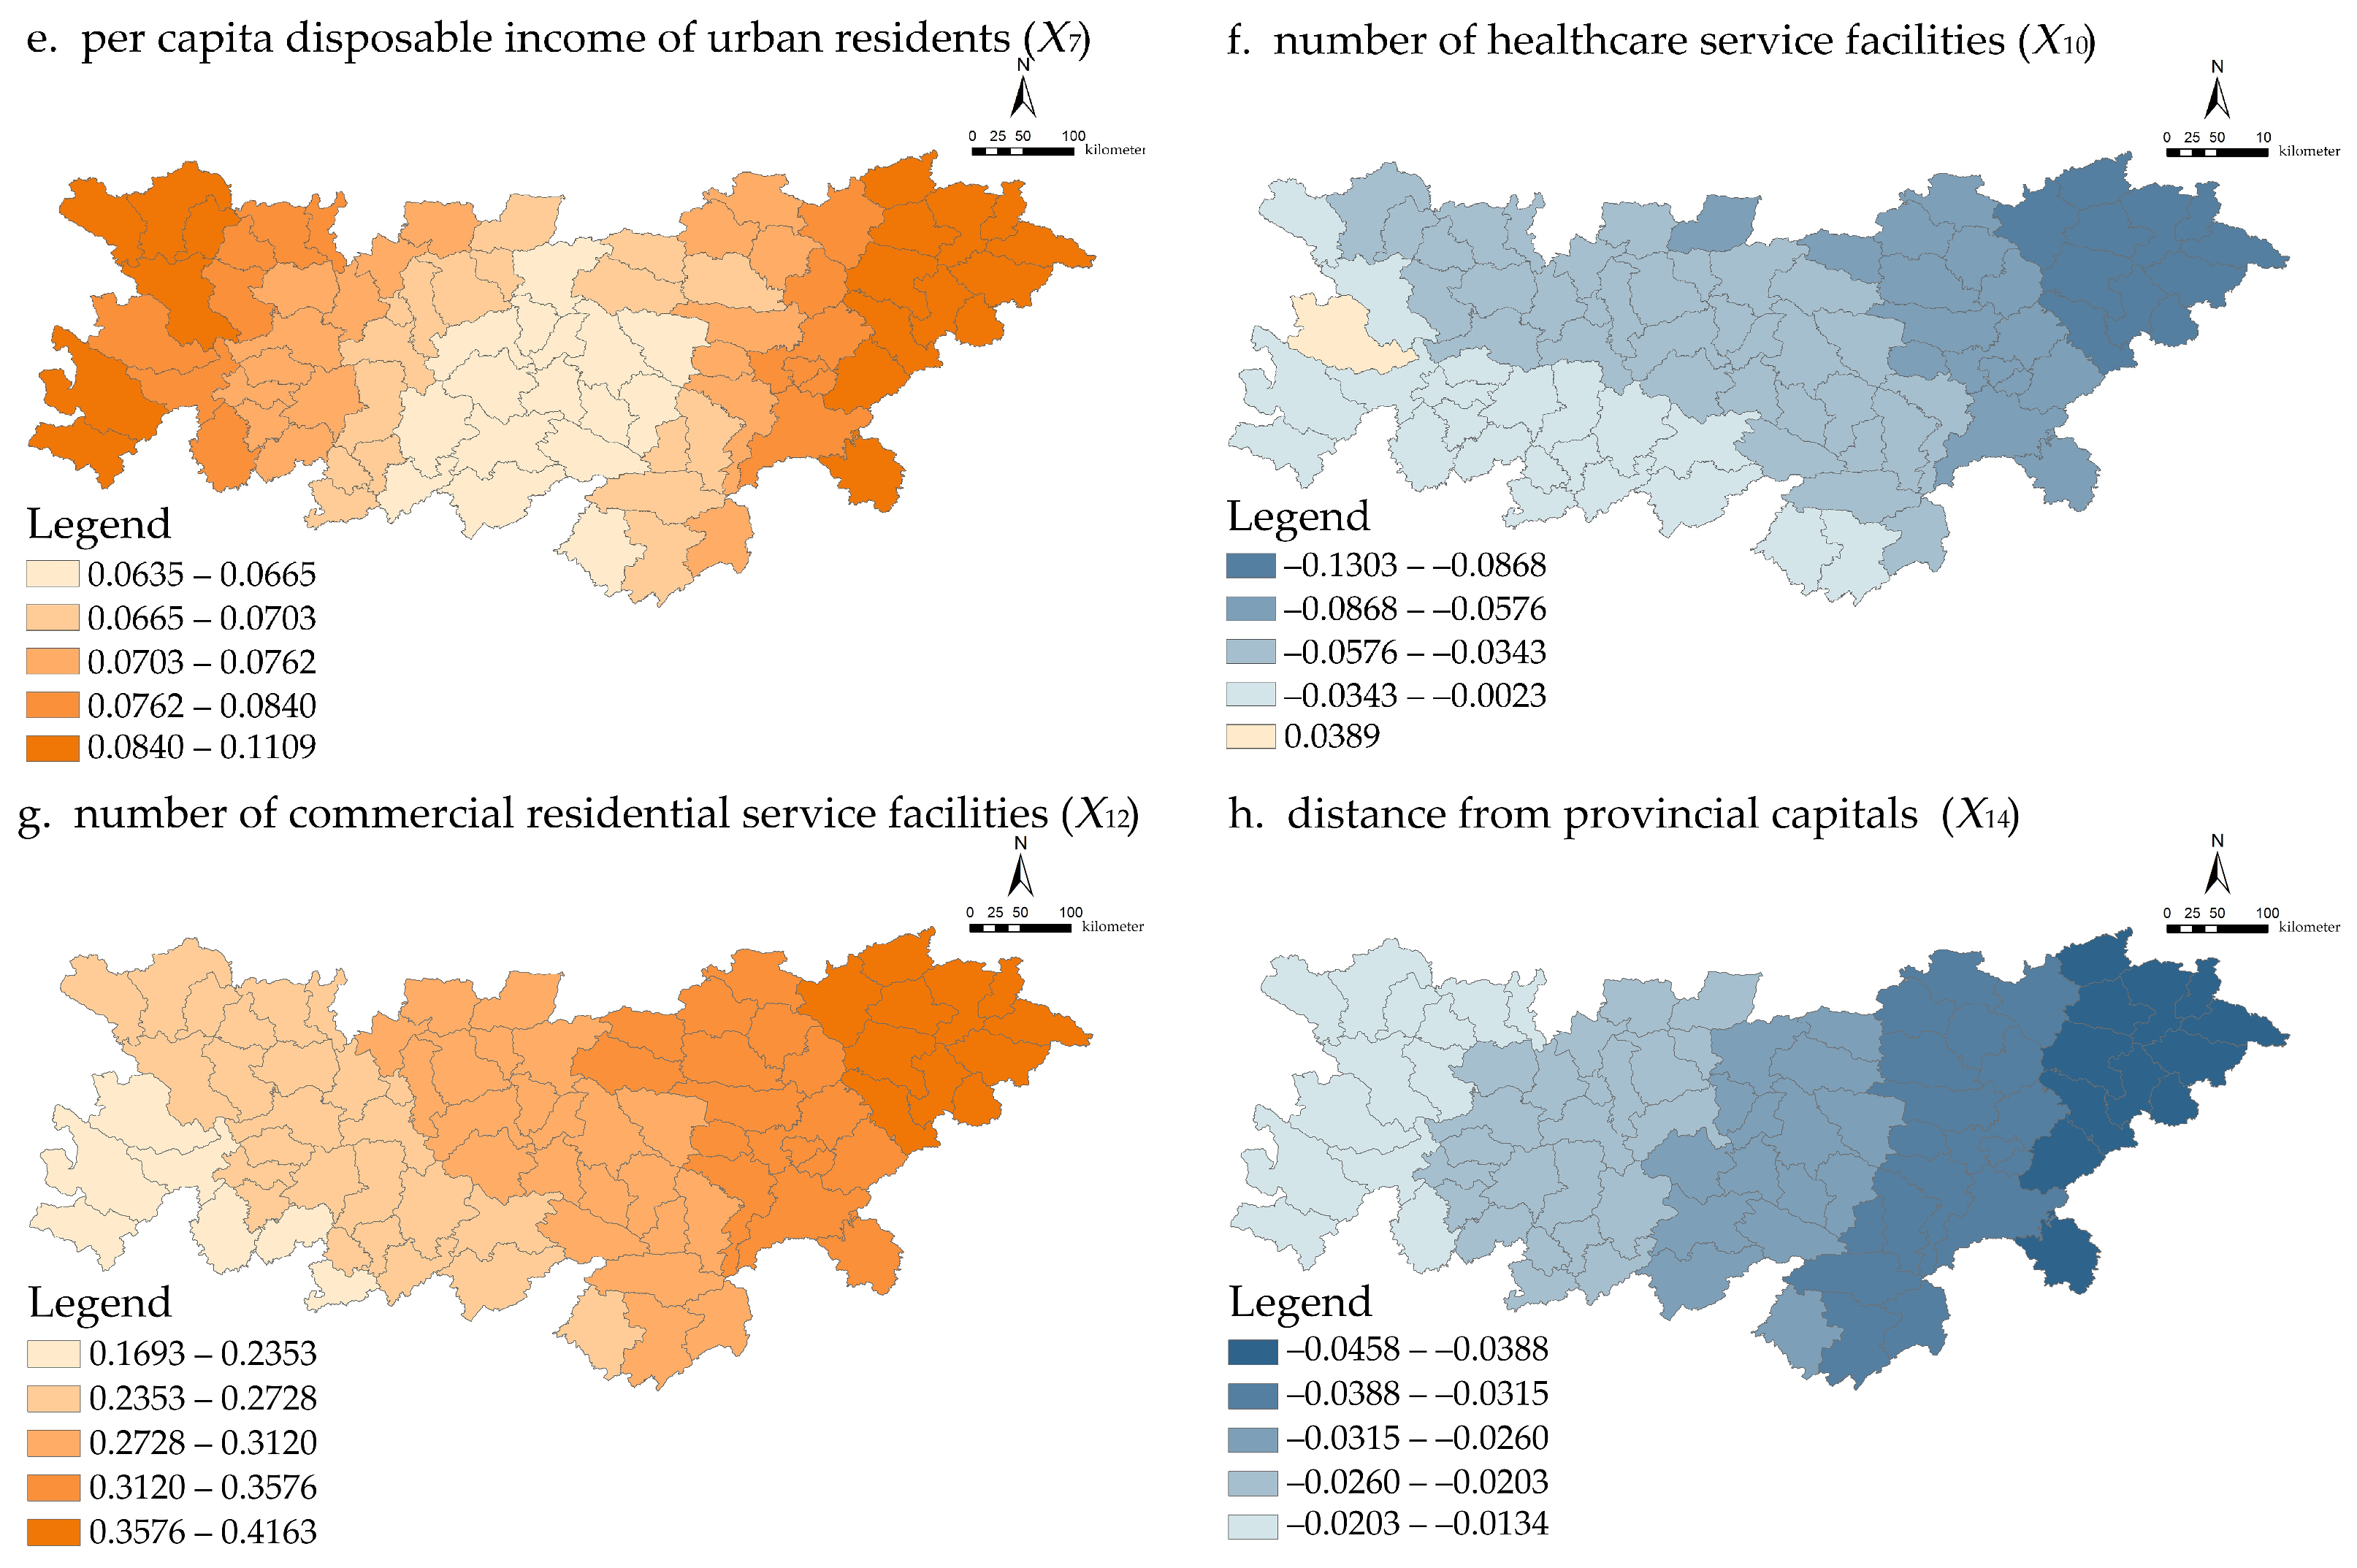
To explore the spatial heterogeneity of urban shrinkage determinants across the Qinling–Daba region in greater detail, this study employed the natural breaks classification method to categorize the coefficient values into five levels based on the effect coefficients—representing both the strength and direction of influence—of each factor across 81 county-level cities throughout the full duration of the study. The spatial distribution patterns were then visualized (Figure 4).
The regression coefficient of the average elevation (X1) generally exhibited a negative effect, indicating that higher elevations exacerbate urban shrinkage in the Qinling–Daba Mountains. Moreover, the intensity of this effect decreased gradually from east to west. Specifically, this factor exerted a stronger influence in certain regions within the Qinling–Daba Mountains, including Henan, Hubei, Chongqing, and Shaanxi Provinces. This can be attributed to the significantly higher overall elevation of the Qinling–Daba Mountains compared with surrounding areas, which accelerates population loss and restricts the expansion of built-up areas. Additionally, since the altitude is closely associated with the level and distribution of road networks, it directly impacts the transportation accessibility. Compared with the western region, the eastern Qinling–Daba Mountains possess a more developed road network, enhancing transportation accessibility and consequently accelerating population outflow.
The regression coefficient of topographic relief (X2) generally exhibited a positive effect, helping mitigate urban shrinkage in the Qinling–Daba Mountains. The strength of this effect gradually intensified from west to east, peaking in the central region, and then decreased. Notably, this factor had a more pronounced influence in certain regions of Shaanxi Province. Areas within the Qinling–Daba Mountains that are characterized by significant topographic relief and accessible transportation often possessed abundant tourism resources and favorable conditions for resource utilization. Examples include the 4A-rated Gigu Ling National Forest Park in Shiquan County, Ankang City, and the 4A-rated Nangong Mountain Scenic Area in Langao County, Ankang City. Tourism development driven by natural landscapes has fostered significant economic growth at the county level, promoted urban development, and, to some extent, slowed the process of urban shrinkage.
The regression coefficient of the birth rate (X3) generally exhibited a positive effect, helping mitigate urban shrinkage in the Qinling–Daba Mountains. The strength of this effect gradually diminished from north to south. Specifically, this factor had a stronger positive influence on urban shrinkage in Shaanxi and Henan Provinces, situated in the northern region of the Qinling–Daba Mountains. This indicates that increased birth rates correlate with a lower likelihood of urban shrinkage, potentially due to regional cultural preferences for larger families and the mass outmigration of young laborers, making natural population growth crucial for offsetting population decline. In contrast, the southwestern region, particularly Sichuan Province, exhibited a relatively weaker correlation, suggesting that the birth rate exerted a less significant impact on urban shrinkage in this area. This may be attributed to return migration trends, where some individuals establish businesses in their hometowns (e.g., through e-commerce or specialty agriculture), thereby alleviating population outflow pressures and reducing the relative importance of the birth rate as a counterbalance to urban shrinkage.
The regression coefficient of the number of students enrolled in general secondary schools (X5) generally exhibited a positive effect, helping mitigate urban shrinkage in the Qinling–Daba Mountains. However, the intensity of this effect gradually diminished from west to east. Notably, this factor exerted a slightly stronger influence in Gansu Province than in other regions, suggesting that the retention of teenagers and families of childbearing age helped curb population outflow, provided potential labor forces, and sustained the urban consumption demand. Moreover, the western Qinling–Daba region was characterized by a weaker economic foundation and a less diversified industrial structure, exacerbating population outmigration pressures. In this context, education serves as one of the few “sticky factors”—a term referring to factors that encourage population retention—which can be leveraged to mitigate urban shrinkage. Therefore, maintaining stable student enrollment is particularly crucial for preserving the region’s basic population size and sustaining economic activity.
The regression coefficient of the per capita disposable income of urban residents (X7) generally exhibited a positive effect, helping mitigate urban shrinkage in the Qinling–Daba Mountains. The intensity of this effect first declined and then increased as it progressed from west to east. Specifically, the positive impact of this variable was more pronounced in certain regions of Sichuan, Gansu, and Henan Provinces within the Qinling–Daba Mountains. In areas with a weaker economic foundation, increases in disposable income more effectively stimulate economic activities such as consumption and investment, thereby alleviating urban shrinkage to a certain extent.
The regression coefficient for the number of healthcare service facilities (X10) generally exhibited a negative effect, primarily exacerbating urban shrinkage. This effect exhibited a westward weakening pattern. Notably, the impact was more pronounced in certain areas of Henan, Hubei, and Shaanxi Provinces within the Qinling–Daba Mountains, primarily due to inadequate healthcare services and insufficient healthcare security, which contribute to population outmigration.
The regression coefficient of the number of commercial residential service facilities (X12) generally exhibited a positive effect, helping mitigate urban shrinkage in the Qinling–Daba Mountains. The correlation was more pronounced in the eastern region and diminished toward the west. This suggests that in the eastern part of the Qinling–Daba Mountains, a greater scale of commercial residential service facilities corresponds to a lower likelihood of urban shrinkage. However, in western areas such as Beichuan Qiang Autonomous County and Pingwu County in Sichuan Province, the impact of commercial residential service facility development on urban shrinkage was relatively limited. This may be attributed to the fact that in ecologically sensitive and continuously depopulating areas in the southwest, the traditional real estate development model is no longer sufficient to sustain urban vitality.
The regression coefficient of the distance from provincial cities (X14) generally exhibited a negative effect, exacerbating urban shrinkage. This suggests that provincial cities continue to attract people from the Qinling–Daba Mountains through economic agglomeration, employment opportunities, and superior public services, resulting in significant population outflow from most counties in the region. The influence of this factor gradually weakened from east to west, with a stronger impact being observed in certain areas of Henan Province, Hubei Province, Chongqing Municipality, and Shaanxi Province. This can be attributed to the relatively well-developed transportation infrastructure in these regions compared with the western areas, facilitating population mobility and thereby intensifying urban shrinkage.

4. Discussion

4.1. The Paradox of Population Loss and Spatial Expansion

From a regional development perspective, the spatial dynamics of urban shrinkage in the Qinling–Daba Mountains remain in a constant state of flux, reflecting the complexity of the region’s shrinkage process. A notable feature is the paradoxical phenomenon of “population decline but spatial expansion” that ultimately prevails in the region: between 2020 and 2022, as many as 85.19% of cities experienced expansion–shrinkage (i.e., spatial expansion accompanied by population loss), while only 14.81% of cities experienced expansion–growth. On the one hand, this reflects the general contradiction between spatial growth and population loss in the Qinling–Daba Mountains; on the other hand, it also mirrors the general trend of widespread regional decline alongside concentrated growth in central urban zones. Together, these two factors demonstrate the unique nature of the spatial pattern of urban shrinkage in the Qinling–Daba Mountains and other underdeveloped areas. The widespread phenomenon of population loss and spatial expansion coexisting with urban shrinkage in the Qinling–Daba Mountains is consistent with previous studies on the urban shrinkage paradox in some Chinese cities [60,61]. To gain a deeper understanding of this paradox, it is essential to analyze the unique policy, planning, and development logic behind it, which differ significantly from the market-driven shrinkage dynamics observed in Europe and the United States.
Analyzing its causes, China’s unique policy and planning context forms the core driving framework. Local governments’ spatial expansion behaviors, driven by multiple incentives, interact with the market-driven social patterns of population mobility and are guided and reshaped by constraints such as ecological protection, collectively shaping this paradoxical landscape.
First, the local development model centering on “land finance” is the fundamental driving force behind spatial expansion. Local governments obtain fiscal revenue through land transfer fees and mortgage financing. This model can significantly boost economic indicators in the short term and has become an important way for numerous counties in the Qinling–Daba Mountains to maintain development investments. Even in the face of population loss, local governments’ heavy reliance on land revenue has led them onto a path that is difficult to escape, continuing to drive spatial expansion.
Second, urbanization policies focusing on scale expansion have further reinforced this trend. Local governments have been dedicated to planning new urban districts and special economic zones, increasing the allocation of developable land to attract investment, build infrastructure, and promote real estate development. However, this type of urbanization model, which centers on physical space expansion, often lacks effective industrial support, leading to the widespread phenomenon of “land without industry”. A significant amount of newly added construction land has failed to attract businesses to establish a substantial presence, resulting in a disconnect between development zone construction and investment attraction outcomes. This has led to lagging industrial development, severe shortages of job opportunities, and, ultimately, an inability to attract and retain population, thus paradoxically accelerating population shrinkage alongside physical expansion. Meanwhile, the “growth inertia” mindset in traditional urban planning has provided institutional support for expansion. Traditional master plans and land use plans are typically based on optimistic projections of an “ideal population” (such as the planned expectation of “absorbing local returning population” or “attracting surrounding population”) to guide spatial planning and allocate construction land indicators. This “growth-oriented” planning mindset suffers from inertia, and even when actual population trends have clearly shifted toward outflow, planning adjustments often lag behind, leading to an increasing mismatch between the spatial supply and real population demand.
Third, although ecological protection policies impose strict constraints on spatial expansion across the entire region, they can, under certain conditions, influence the direction and pattern of expansion. As an ecologically sensitive area, the Qinling–Daba Mountains are subject to stringent red lines of ecological protection, which prohibit large-scale development in designated zones. However, these constraints have not fully suppressed the demand for urban expansion, instead concentrating the development pressure in areas where development is permitted, such as around county seats and along river valleys, resulting in more pronounced and localized problems of inefficient and extensive land use.
Therefore, government-led land expansion initiatives (driven by a reliance on land-based fiscal revenue, scale-oriented policies, and the inertia of planned growth) have not only failed to effectively reverse the trend of population outflow but have also significantly exacerbated the contradictions between population shrinkage and spatial growth. A typical manifestation of this is the emergence of expansion–shrinkage cities, which experience a continuous population outflow despite an increase in total spatial construction. This strongly reflects the challenges that are faced by local development models in the context of rapid urbanization: while local governments actively promote spatial expansion projects such as development zones, infrastructure construction, and real estate development, these zones are characterized by limited scale and development levels, insufficient momentum for the cultivation and upgrading of real industries, and a “small and scattered” structure. This reinforces a vicious cycle of “insufficient employment–population outflow–a shrinking tax base–a further reliance on land finance expansion”, constituting a key bottleneck for regional sustainable development. Meanwhile, delays in providing municipal services and developing a high-quality living environment have significantly reduced an area’s appeal to residents, resulting in its population aggregation capacity lagging far behind the pace of spatial expansion. In contrast, the local growth of a few expansion–growth cities (mainly distributed in urban areas and their surroundings) has benefited more from the transfer of industries from central cities, convenient transportation links, and the spillover effects of central urban areas, rather than from the traditional spatial expansion model that is implemented across the entire region.
In summary, the paradox of “population loss but spatial expansion” in the Qinling–Daba Mountains is essentially the result of local governments’ spatial expansion behavior, driven by strong incentive policies (land finance, scale-oriented urbanization, and planning growth inertia), which conflicts with the socio-economic logic of free population mobility and is guided by constraints such as ecological protection, leading to the alienation of the spatial pattern. This study argues that as the marginal benefits of land resources diminish, these kinds of underdeveloped regions will struggle to reverse long-term population outflows solely through continuous increases in land investment. Moreover, the persistent inefficient use of space may exacerbate developmental crises. The Qinling–Daba Mountain region should abandon traditional growth-oriented thinking and proactively seek adaptive strategies to address the challenges and opportunities posed by urban shrinkage [62,63]. Future research should further investigate how to develop and implement effective urban shrinkage management strategies that respect local characteristics and realistic conditions, thereby promoting the sustainable development of the Qinling–Daba Mountains and other underdeveloped regions.

4.2. The Driving Mechanisms of Urban Shrinkage in Underdeveloped Regions

4.2.1. The Population Dimension: The Bidirectional Feedback Between the Working-Age Population and Educational Resources

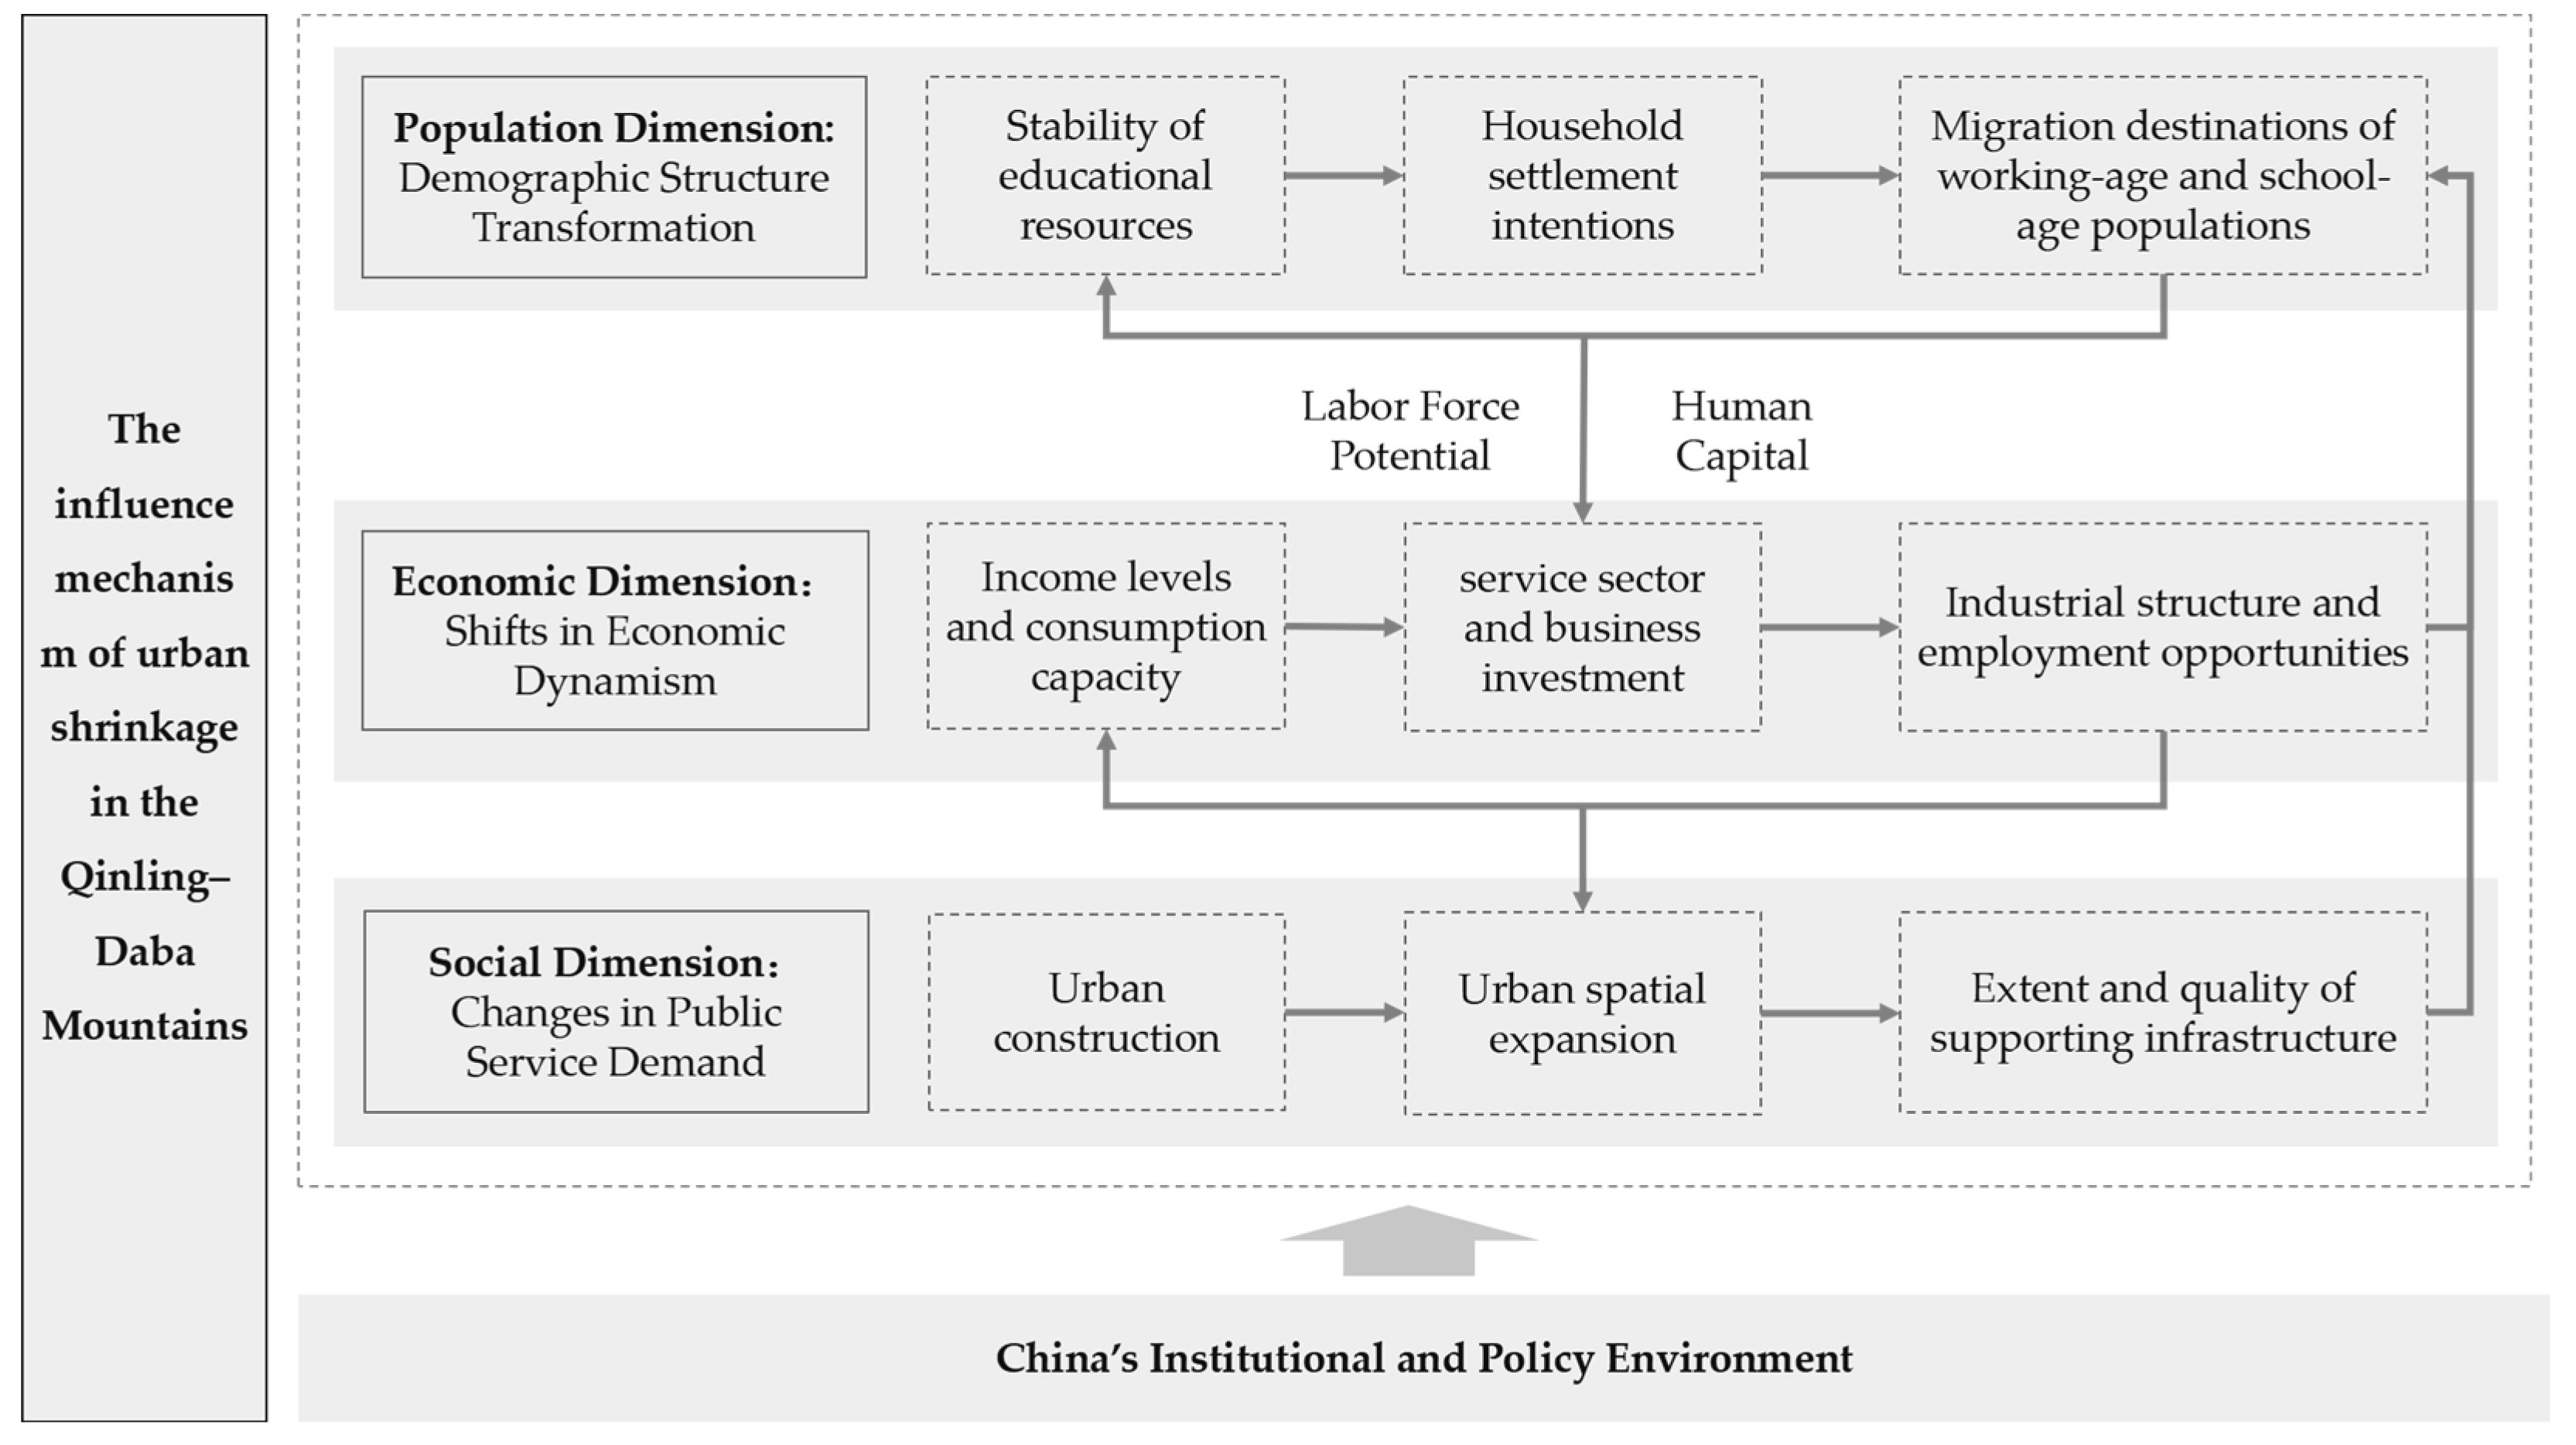
In terms of the population dimension, changes in the population structure, represented by the number of students enrolled in general secondary schools, are key to the shrinkage of cities in the Qinling–Daba Mountains. This is manifested in a two-way positive and negative feedback mechanism between the young and working-age population and the stability of educational resources. In the positive cycle, high-quality basic educational resources (such as key secondary schools) provide the human capital foundation for high-value-added industries by improving the quality of the regional talent pool. In the negative feedback loop, the loss of students accelerates the degradation of educational resources, reduces the size of settled households, and further leads to the merger or closure of primary and secondary schools, increasing the instability of educational resources. This indicates that educational resources are not merely passive carriers of shrinkage but also the core lever for halting population outflow and reconfiguring the attractiveness of cities (Figure 5).

4.2.2. The Economic Dimension: The Negative Cycle of Industrial Hollowing Out and Declining Income and Employment

In terms of the economic dimension, changes in economic momentum, represented by the per capita disposable income of urban residents, are key to the shrinkage of cities in the Qinling–Daba Mountains. Although regional economic development can theoretically alleviate the pressure of shrinkage, a single industrial structure and industrial hollowing out have led to long-term stagnation in residents’ income growth. Low income levels weaken the local consumption capacity and service demand, thereby affecting investment in the service sector and commercial vitality. This, in turn, prevents improvements in industrial structures and employment opportunities, forcing young and middle-aged workers to continue migrating out, creating a vicious cycle of “income stagnation–employment shortages–population loss”. As such, it can be observed that industrial upgrading and transformations driving significant increases in residents’ income is an effective intervention point to break the cycle of population loss (Figure 5).

4.2.3. The Social Dimension: A Staged Mismatch Between Inefficient Spatial Expansion and the Provision of Supporting Functions

In terms of the social dimension, changes in service demand, represented by the number of commercial residential service facilities, are key to urban shrinkage in the Qinling–Daba Mountains, which manifests in a phased disconnect between urban spatial development and public service provision. During the early stages of urbanization, the development of supporting infrastructure can enhance the likelihood of local population aggregation and support settlement intentions. However, with the blind expansion of spatial development, most newly added urban construction land fails to fulfill its intended functions, and infrastructure and public service provision also lag behind, thereby weakening the attractiveness of an area. This highlights the need for spatial governance to shift from a scale-oriented approach to a function-adaptive approach to avoid the temporal mismatch between expansion and demand (Figure 5).
As demonstrated above, the underlying mechanisms of urban shrinkage in underdeveloped regions, as examined in this study, differ significantly from those observed in other regional contexts. Existing research has confirmed that urban shrinkage in Europe and the United States is primarily driven by deindustrialization processes under the influence of globalization and technological revolutions [8,24]. A core feature of this dynamic is the economic recession caused by the relocation of manufacturing industries, which in turn leads to large-scale population loss. In contrast, urban shrinkage in Japan and South Korea is mainly attributable to low birth rates and aging populations [38,64]. From a domestic perspective in China, the drivers of urban shrinkage also vary substantially across regions. In Northeast China, the shrinkage of resource-reliant cities is mainly due to resource depletion and lagging institutional reform [65], essentially forming a chain reaction that is triggered by the decline of the coal industry under market mechanisms. In coastal cities such as Dongguan [66,67], urban shrinkage is largely influenced by the industrial relocation associated with globalization, resulting in significant losses of migrant labor. In certain developed urban agglomerations [30], localized urban shrinkage is mainly caused by the siphoning effect of core cities, which stems from imbalances in resource allocation and institutional capacity.
In comparison with the aforementioned regions, the core indicators of urban shrinkage in the Qinling–Daba Mountains, namely, the number of students enrolled in general secondary schools, per capita disposable income of urban residents, and number of commercial residential service facilities, strongly suggest that the underlying mechanism of shrinkage stems from the deep coupling, mutual reinforcement, and interdependence of multiple dimensions, including population loss, economic recession, inadequate social services, and spatial deterioration. Owing to limited economic momentum, weak industrial foundations, inadequate public service provision, and persistently low urban vitality, these regions lack the capacity to attract and retain production factors. As a result, they are unable to offer residents appealing economic opportunities, high-quality public services, or a livable environment. This further undermines their developmental potential and accelerates the process of urban shrinkage.

4.3. Adaptation Strategies for Shrinkage in Underdeveloped Regions

In light of the foregoing analysis of “the paradox between population loss and spatial expansion” and “driving forces”, this study suggests that the governance of urban shrinkage in China’s underdeveloped regions requires the construction of an adaptive strategy of “government-led and multi-party collaboration”. Unlike developed countries, where market mechanisms dominate the process of responding to urban shrinkage (such as “smart shrinkage” in Europe and the United States, which focuses on resource redistribution, and “compact cities” in Japan, which emphasize functional integration), the response to urban shrinkage in China—especially in underdeveloped regions—should exhibit structural characteristics such as government leadership, planning promotion, and the embedding of ecological policies. This demonstrates that China’s urban shrinkage governance cannot simply copy Western experiences, but needs to combine Chinese-style governance logic, spatial systems, and local development realities to construct a systematic and structural intervention path, thereby guiding the market and social forces to jointly cultivate endogenous momentum in shrinking towns. This study proposes the following three adaptive strategies:
(1)
Deepen the linkage between education and industry to address the structural talent drain
Establish a mechanism to integrate vocational education with the development of local characteristic industries. Through government-led planning, align the curriculum offerings of vocational colleges with regional ecological resources, cultural assets, and potential growth sectors (such as ecological agriculture, cultural tourism, and green handicrafts). Establish a closed-loop system for recruitment, training, and employment to ensure that the supply of skilled talent aligns closely with local industrial demand. This will enhance residents’ local income, effectively boosting young laborers’ willingness and ability to seek employment locally and thereby curbing the ongoing population outflow caused by insufficient education quality and limited employment opportunities. This approach will inject stable human capital and innovative vitality into underdeveloped regions.
(2)
Implement a “smart response” strategy based on the spatial pattern of a city to improve supply efficiency and matching
For expansion–shrinkage cities, the focus should be on “smart shrinkage”, strictly controlling increases and revitalizing existing stock. Draw a “shrinkage red line” to place strict limits on new parks, residential areas, and large commercial land use, and suspend unnecessary municipal infrastructure construction. Prioritize the reuse of idle resources, develop “small yet specialized” community service facilities (such as convenience, childcare, and elderly care services), and promote movable or modular facilities to reduce operational costs and enhance flexibility and adaptability.
Expansion–growth cities should adhere to a “smart growth” path and promote the precise matching of the supply of facilities and population changes. They should strengthen their forward-looking planning and flexible layout of public facilities, give priority to the construction of “15-min living circles”, and improve the convenience of daily life services. At the same time, they should strengthen efficient transportation connections within cities, enhance coordination and resource sharing capabilities between different areas, and enhance the overall resilience of cities.
(3)
Adapt ecological compensation mechanisms to address development challenges arising from population loss and spatial expansion
In the context of concurrent population loss and spatial expansion, it is imperative to establish a government-led ecological compensation mechanism as a key institutional arrangement to balance ecological conservation and regional transformation and development. On the one hand, a vertical compensation mechanism should be established to link the exchange of construction land indicators with ecological restoration, encouraging local governments to withdraw low-efficiency or idle urban land in a structured manner and reclaim it as ecological space, with the proceeds from such indicators being prioritized for improving public services and fostering green industries; on the other hand, coordinated by higher-level governments, a horizontal compensation mechanism should be promoted, including financial transfers from ecologically benefited areas to areas undergoing shrinkage that have ecological protection responsibilities, guiding compensation funds toward investments in green industries and ecological service facility construction, promoting the transformation of ecological advantages into development momentum, and transitioning from “generating wealth from land” to “promoting development through ecology”.

4.4. Innovation and Limitations

This study examined the characteristics and driving mechanisms of urban shrinkage in county-level cities within the Qinling–Daba Mountains, a typical centralized and continuously poverty-stricken region in China. By analyzing the characteristics and underlying causes of urban shrinkage in underdeveloped regions, this study offers a novel perspective and contributes to the existing body of research. Furthermore, this study integrated traditional population data with nighttime light data to construct a “dual growth rate” urban shrinkage identification system. This system classified urban shrinkage based on both the population and spatial dimensions, establishing four overall patterns: expansion–growth, intensive growth, expansion–shrinkage, and intensive shrinkage. This classification framework provides an intuitive representation of the common characteristics and evolutionary patterns of urban shrinkage in the study area, demonstrating methodological innovation in shrinkage classification.
Although this study yielded preliminary findings on urban shrinkage, certain limitations remain. Specifically, regarding the research scale, data acquisition challenges constrained this study, preventing an analysis of urban shrinkage in the Qinling–Daba Mountains from the perspective of urban entity territory. In the future, leveraging remote sensing data, big data, and other emerging data sources may enable a more comprehensive exploration of the urban entity territory, facilitating an in-depth analysis of the spatial characteristics and underlying mechanisms of urban shrinkage. In terms of methodological applications, although the GTWR model effectively captures the spatiotemporal heterogeneity of urban shrinkage, it is highly sensitive to key parameters, such as the spatiotemporal bandwidth and weighting function, as well as data characteristics. This sensitivity may result in substantial variations in parameter estimation across different plausible model settings, thereby affecting the robustness of the conclusions. Moreover, although the comprehensive index method facilitates the quantification of shrinkage levels, its reliance on subjectively assigned weights may undermine the objectivity and explanatory power of the results. Future research could incorporate multiple modeling approaches or explore the integration of more objective weighting methods, such as the entropy weight method, for cross-validation to enhance the robustness of analytical outcomes.

5. Conclusions

This study successfully identified and categorized four patterns of urban shrinkage through a comprehensive analysis of the permanent resident population and nighttime light data of county-level cities in the Qinling–Daba Mountains. Furthermore, it examined their spatial and temporal evolution and clarified the core influencing factors, along with their spatial and temporal variations, on urban shrinkage within the Qinling–Daba Mountains. The principal findings of this study can be summarized as follows:
(1)
There was evident spatial and temporal heterogeneity in the percentage and distribution of urban shrinkage patterns in the Qinling–Daba Mountains. In this study, county-level cities in the region were classified into four urban spatial patterns: expansion–growth, intensive growth, expansion–shrinkage, and intensive shrinkage. From 2005 to 2010, expansion–growth cities accounted for the largest percentage and were primarily distributed in the western and central parts of the Qinling–Daba Mountains. During 2010–2015, intensive growth cities became the dominant category, predominantly located in the northern–central part of the study area. Between 2015 and 2022, the percentage of expansion–shrinkage cities increased significantly, ultimately forming a large expansion–shrinkage zone, while a small number of expansion–growth cities remained interspersed throughout the region. These expansion–growth cities were mainly distributed in specific urban areas and their surrounding areas.
(2)
The influence of various factors on urban shrinkage in the Qinling–Daba Mountains exhibited significant temporal variations. The primary determinants of urban shrinkage in this region were the number of students enrolled in general secondary schools (X5), per capita disposable income of urban residents (X7), and number of commercial and residential service facilities (X12). Collectively, these factors exerted an overall positive impact and mitigated urban shrinkage. However, their dominant roles varied over time. In 2005 and 2010, the primary driver was the number of commercial and residential service facilities (X12). In contrast, in 2015, 2020, and 2022, the predominant factors shifted to the number of students enrolled in general secondary schools (X5) and per capita disposable income (X7). While other influencing factors continued to affect urban shrinkage, their impact generally weakened over time, and their directional influence changed.
(3)
The spatial effects of influencing factors on urban shrinkage in the Qinling–Daba Mountains exhibited significant heterogeneity. Throughout the entire study period, the number of students enrolled in general secondary schools (X5) exerted a significantly stronger influence in the western part of the Qinling–Daba Mountains than in the eastern region. In contrast, the number of commercial residential service facilities (X12) showed the opposite trend. Additionally, the per capita disposable income of urban residents demonstrated a pattern of higher values in the eastern and western regions, with a relative decline in the central part of the region. With the exception of the birth rate (X3), all other influencing factors exerted a stronger effect in the eastern region than in the western region.

Author Contributions

Conceptualization, Y.L. and S.Y.; methodology, S.Y. and Y.L.; software, S.Y.; validation and formal analysis, Y.L., S.Y. and D.Z.; investigation and resources, S.Y., Y.L., Y.H. and S.L.; data curation, S.Y., Y.H. and S.L.; writing—original draft preparation, S.Y.; writing—review and editing, Y.L. and S.Y.; visualization, S.Y. and Y.L.; supervision, Y.L. and D.Z.; project administration, Y.L.; funding acquisition, Y.L. All authors have read and agreed to the published version of the manuscript.

Funding

This research was funded by the National Natural Science Foundation of China (NSFC), grant number 52008336; and the MOE (Ministry of Education of China) Project of Humanities and Social Sciences, grant number 24YJCZH201.

Institutional Review Board Statement

Not applicable. The study used only publicly available statistical and remote sensing data and did not involve any human participants or animals.

Informed Consent Statement

Not applicable. No human subjects were involved in this study, and no personally identifiable data were used.

Data Availability Statement

The raw data supporting the conclusions of this article will be made available by the authors on request.

Conflicts of Interest

The authors declare no conflict of interest.

Abbreviations

The following abbreviations are used in this manuscript:
GTWRGeographically and Temporally Weighted Regression
POIPoint of Interest

References

  1. Hospers, G.J. Policy Responses to Urban Shrinkage: From Growth Thinking to Civic Engagement. Eur. Plan. Stud. 2014, 22, 1507–1523. [Google Scholar] [CrossRef]
  2. Martinez-Fernandez, C.; Weyman, T.; Fol, S.; Audirac, I.; Cunningham-Sabot, E.; Wiechmann, T.; Yahagi, H. Shrinking cities in Australia, Japan, Europe and the USA: From a global process to local policy responses. Prog. Plan. 2016, 105, 1–48. [Google Scholar] [CrossRef]
  3. Eraydin, A.; Özatağan, G. Pathways to a resilient future: A review of policy agendas and governance practices in shrinking cities. Cities 2021, 115, 103226. [Google Scholar] [CrossRef]
  4. Batunova, E.; Gunko, M. Urban shrinkage: An unspoken challenge of spatial planning in Russian small and medium-sized cities. Eur. Plan. Stud. 2018, 26, 1580–1597. [Google Scholar] [CrossRef]
  5. Zhang, W.; Shan, F.F.; Zheng, C.G.; Hu, R. Multi-dimensional Identification and Driving Mechanism Analysis of Shrinking City in China. Urban Dev. Stud. 2019, 26, 32–40. [Google Scholar]
  6. Zingale, N.C.; Riemann, D. Coping with shrinkage in Germany and the United States: A cross-cultural comparative approach toward sustainable cities. Urban Des. Int. 2012, 18, 90–98. [Google Scholar] [CrossRef]
  7. Han, Z.X.; Xie, W.; Yu, H.J.; Xie, H.Y.; Li, Y.; Wang, Y.T. Rethinking industrial land-use in American rust cities towards sustainability based on a block-level model. J. Environ. Manag. 2024, 352, 120067. [Google Scholar] [CrossRef]
  8. Rocak, M.; Hospers, G.-J.; Reverda, N. Searching for Social Sustainability: The Case of the Shrinking City of Heerlen, The Netherlands. Sustainability 2016, 8, 382. [Google Scholar] [CrossRef]
  9. Peng, W.; Fan, Z.; Duan, J.; Gao, W.; Wang, R.; Liu, N.; Li, Y.; Hua, S. Assessment of interactions between influencing factors on city shrinkage based on geographical detector: A case study in Kitakyushu, Japan. Cities 2022, 131, 103958. [Google Scholar] [CrossRef]
  10. Jeon, Y.; Kim, S. Housing abandonment and socio-spatial inequalities: Experience from a shrinking inner-city area of Incheon, South Korea. Hous. Stud. 2023, 39, 2901–2918. [Google Scholar] [CrossRef]
  11. Yan, G.H.; Chen, X.; Zhang, Y. Shrinking Cities Distribution Pattern and Influencing Factors in Northeast China Based on Random Forest Model. Geogr. Sci. 2021, 41, 880–889. [Google Scholar] [CrossRef]
  12. Gao, S.Q.; Long, Y. Distinguishing And Planning Shrinking Cities In Northeast China. Planners 2016, 33, 26–32. [Google Scholar]
  13. Ivanov, B. Narratives of Crisis: How Framing Urban Shrinkage and Depopulation Shapes Policy and Planning Responses in Spain, Germany and The Netherlands. Sustainability 2021, 13, 11045. [Google Scholar] [CrossRef]
  14. Schilling, J.; Logan, J. Greening the Rust Belt A Green Infrastructure Model for Right Sizing America’s Shrinking Cities. J. Am. Plan. Assoc. 2008, 74, 451–466. [Google Scholar] [CrossRef]
  15. Wolff, M.; Wiechmann, T. Urban growth and decline: Europe’s shrinking cities in a comparative perspective 1990–2010. Eur. Urban Reg. Stud. 2018, 25, 122–139. [Google Scholar] [CrossRef]
  16. Sun, P.J.; Wang, K.W. Identification and stage division of urban shrinkage in the three provinces of Northeast China. Acta Geogr. Sin. 2021, 76, 1366–1379. [Google Scholar]
  17. Szymczyk, E.; Bukowski, M.; Kenworthy, J.R. Understanding the Relationship between Urban Form and Urban Shrinkage among Medium-Sized Cities in Poland and Its Implications for Sustainability. Sustainability 2024, 16, 7030. [Google Scholar] [CrossRef]
  18. Eva, M.; Cehan, A.; Lazar, A. Patterns of Urban Shrinkage: A Systematic Analysis of Romanian Cities (1992–2020). Sustainability 2021, 13, 7514. [Google Scholar] [CrossRef]
  19. Ungureanu, T.; Șoimoșan, T.M. An Integrated Analysis of the Urban Form of Residential Areas in Romania. Buildings 2023, 13, 2525. [Google Scholar] [CrossRef]
  20. Liu, F.B.; Zhu, X.G.; Chen, J.; Sun, J.; Lin, X. The Research on the Quantitative Identification and Cause Analysis of Urban Shrinkage from Different Dimensions and Scales: A Case Study of Northeast China during Transformation Period. Mod. Urban Res. 2018, 7, 37–46. [Google Scholar]
  21. Wichowska, A. Economic Aspects of Shrinking Cities in Poland in the Context of Regional Sustainable Development. Sustainability 2021, 13, 3104. [Google Scholar] [CrossRef]
  22. Liu, Z.; Qi, W.; Qi, H.G.; Liu, S.H. Spatial distribution of population decline areas in China and underlying causes from a multi-periodical perspective. Prog. Geogr. 2021, 40, 357–369. [Google Scholar] [CrossRef]
  23. Djurkin, D.; Antic, M.; Djordjevic, D.Z. Demographic Aspects of Urban Shrinkage in Serbia: Trajectory, Variety, and Drivers of Shrinking Cities. Sustainability 2023, 15, 15961. [Google Scholar] [CrossRef]
  24. Zheng, H.; Zhang, R.S. Identification of shrinkage patterns in Japan’s four major metropolitan areas based on nighttime light and population data. Int. J. Appl. Earth Obs. Geoinf. 2025, 136, 104391. [Google Scholar] [CrossRef]
  25. Meng, X.F.; Ma, S.; Xiang, W.Y.; Kan, C.C.; WU, K.; Long, Y. Classification of shrinking cities in China using Baidu big data. Acta Geogr. Sin. 2021, 76, 2477–2488. [Google Scholar]
  26. Zhang, S.; Wang, C.X.; Wang, J.; Yao, S.M.; Zhang, F.; Yin, G.W.; Xu, X.Y. On the comprehensive measurement of urban shrink in China and its spatio-temporal differentiation. Chin. J. Popul. Resour. Environ. 2024, 30, 72–82. [Google Scholar]
  27. He, X.J.; Guan, D.J.; Zhou, L.L.; Zhang, Y.X.; Gao, W.J.; Sun, L.L.; Huang, D.A.; Li, Z.H.; Cao, J.M.; Su, X.Y. Quantifying spatiotemporal patterns and influencing factors of urban shrinkage in China within a multidimensional framework:A case study of the Yangtze River Economic Belt. Sustain. Cities Soc. 2023, 91, 104452. [Google Scholar] [CrossRef]
  28. Wiechmann, T.; Pallagst, K.M. Urban shrinkage in Germany and the USA: A Comparison of Transformation Patterns and Local Strategies. Int. J. Urban Reg. Res. 2012, 36, 261–280. [Google Scholar] [CrossRef]
  29. Zhang, M.D.; Xiao, H. Spatial pattern characteristics and mechanism of urban contraction in Northeast China. Urban Probl. 2020, 1, 33–42. [Google Scholar]
  30. Wu, K.; Long, Y.; Yang, Y. Uran Shinkage in the Beijing-Tianjin-Heibei Region and Yangtze River Delta:Pattern, Trajectory and Factors. Mod. Urban Res. 2015, 30, 26–35. [Google Scholar]
  31. Wang, X.; Li, Z.; Feng, Z. Classification of Shrinking Cities in China Based on Self-Organizing Feature Map. Land 2022, 11, 1525. [Google Scholar] [CrossRef]
  32. Wiechmann, T.; Bontje, M. Responding to Tough Times: Policy and Planning Strategies in Shrinking Cities. Eur. Plan. Stud. 2013, 23, 1–11. [Google Scholar] [CrossRef]
  33. Segers, T.; Devisch, O.; Herssens, J.; Vanrie, J. Conceptualizing demographic shrinkage in a growing region—Creating opportunities for spatial practice. Landsc. Urban Plan. 2020, 195, 103711. [Google Scholar] [CrossRef]
  34. Bernt, M. The Limits of Shrinkage: Conceptual Pitfalls and Alternatives in the Discussion of Urban Population Loss. Int. J. Urban Reg. Res. 2015, 40, 441–450. [Google Scholar] [CrossRef]
  35. Schackmar, J.; Fleschurz, R.; Pallagst, K. The Role of Substitute Industries for Revitalizing Shrinking Cities. Sustainability 2021, 13, 9250. [Google Scholar] [CrossRef]
  36. Jang, G.; Kim, S. Are decline-oriented strategies thermally sustainable in shrinking cities? Urban Clim. 2021, 39, 100924. [Google Scholar] [CrossRef]
  37. Döringer, S.; Uchiyama, Y.; Penker, M.; Kohsaka, R. A meta-analysis of shrinking cities in Europe and Japan. Towards an integrative research agenda. Eur. Plan. Stud. 2019, 28, 1693–1712. [Google Scholar] [CrossRef]
  38. Iwasaki, Y. Shrinkage of regional cities in Japan: Analysis of changes in densely inhabited districts. Cities 2021, 113, 103168. [Google Scholar] [CrossRef]
  39. Deng, P.Y.; Liu, Y.H. Spatial Pattern and Influence Factors Analysis of Population Shrinkage in County Unit in China. Mod. Urban Res. 2018, 3, 31–38. [Google Scholar]
  40. Zhang, X.L.; Zhou, S.M. Evolution of Regional Population Decline and Its Driving Factors at the County Level in China. Econ. Geogr. 2023, 43, 42–51+98. [Google Scholar] [CrossRef]
  41. Martinez-Fernandez, C.; Audirac, I.; Fol, S.; Cunningham-Sabot, E. Shrinking Cities: Urban Challenges of Globalization. Int. J. Urban Reg. Res. 2012, 36, 213–225. [Google Scholar] [CrossRef]
  42. Meng, F.X.; Wang, D.Y.; Li, H. Analysis on Driving Forces of Urban Shrinkage in Old Industrial Cities of Northeast China. Mod. Urban Res. 2020, 3, 25–32. [Google Scholar]
  43. Jiang, Y.H.; Chen, Z.J.; Sun, P.J. Urban Shrinkage and Urban Vitality Correlation Research in the Three Northeastern Provinces of China. Int. J. Environ. Res. Public Health 2022, 19, 10650. [Google Scholar] [CrossRef]
  44. Du, Z.W.; Li, X. Growth or shrinkage: New phenomena of regional development in the rapidly-urbanising Pearl River Delta. Acta Geogr. Sin. 2017, 72, 1800–1811. [Google Scholar]
  45. Luo, F.Z.; Zhou, T.T.; Liu, G.C. Comprehensive Measurement and Type Identification of Urban Shrinkage at County-Level: A Case Study of Shaanxi, A Cluster of Small and Medium-Sized Cities. Mod. Urban Res. 2022, 10, 52–58. [Google Scholar]
  46. Xiao, J.; Qiao, J.; Han, D.; Liu, Y.; Pan, T. Spatial Coupling Relationship and Driving Mechanism of Population and Economy in Rural Areas in Qinling-Daba Mountains, China. Chin. Geogr. Sci. 2023, 33, 779–795. [Google Scholar] [CrossRef]
  47. Yang, W.L.; Tan, J.B.; Fan, B.; Wang, Z.L.; Yang, Y.H.; Liu, H. Spatial-Temporal Coupling Coordination Relationship Between Industrial Ecosystem Adaptability and Resource Environmental Bearing Capacity in County-level Mountain Region—A Case Study of 81Districts and Counties in the Qinba Mountain Region. Res. Soil Water Conserv. 2022, 29, 363–374. [Google Scholar]
  48. Wu, Y.; Shi, K.; Chen, Z.; Liu, S.; Chang, Z. Developing Improved Time-Series DMSP-OLS-Like Data (19922019) in China by Integrating DMSP-OLS and SNPP-VIIRS. IEEE Trans. Geosci. Remote Sens. 2022, 60, 1–14. [Google Scholar] [CrossRef]
  49. Liang, Y.Z.; Wei, Y. The spatiotemporal pattern and influencing factors of urban shrinkage: A comparative study of East Germany and Northeast China. World Reg. Stud. 2024, 33, 40–51+86. [Google Scholar]
  50. Zhang, X.L.; Liu, Y.B.; Lü, C.C. The Background, Identification of Shrinking Cities in China and Their. J. Southeast Univ. (Philos. Soc. Sci. Ed.) 2016, 18, 132–139+148. [Google Scholar]
  51. Zhang, X.L.; Zhang, M.D.; Xiao, H. Study on spatial pattern and formation mechanism of urban contraction in Chengdu-Chongqing city cluster. J. Chongqing Univ. (Soc. Sci. Ed.) 2018, 24, 1–14. [Google Scholar]
  52. Levin, N.; Kyba, C.C.M.; Zhang, Q.; de Miguel, A.S.; Roman, M.O.; Li, X.; Portnov, B.A.; Molthan, A.L.; Jechow, A.; Miller, S.D.; et al. Remote sensing of night lights: A review and an outlook for the future. Remote Sens. Environ. 2020, 237, 111443. [Google Scholar] [CrossRef]
  53. Liu, X.Y.; Feng, J.X. Research on Spatial Pattern and Influencing Factors of Urban Shrinkage in the Yangtze River Delta Based on Panel Data. Mod. Urban Res. 2022, 10, 47–51. [Google Scholar]
  54. Hou, X.J.; Yu, Z.L.; Li, Y.T.; Yuan, L.Y.; Sun, C. Spatial pattern and mechanism of depopulation in the mountainous counties in China. Geogr. Res. 2024, 43, 1205–1224. [Google Scholar]
  55. Banica, A.; Istrate, M.; Muntele, I. Challenges for the Resilience Capacity of Romanian Shrinking Cities. Sustainability 2017, 9, 2289. [Google Scholar] [CrossRef]
  56. Hartt, M. The Prevalence of Prosperous Shrinking Cities. Ann. Am. Assoc. Geogr. 2019, 109, 1651–1670. [Google Scholar] [CrossRef]
  57. Zhang, Y.; Ding, X.; Dong, L.; Yu, S. Research on spatiotemporal patterns and influencing factors of county-level urban shrinkage in urbanizing China. Sustain. Cities Soc. 2024, 109, 105544. [Google Scholar] [CrossRef]
  58. Huang, B.; Wu, B.; Barry, M. Geographically and temporally weighted regression for modeling spatio-temporal variation in house prices. Int. J. Geogr. Inf. Sci. 2010, 24, 383–401. [Google Scholar] [CrossRef]
  59. Zhang, W.; Pei, M.J. Spatial-Temporal Evolution Characteristics of Urban Shrinkage in China:A Multi-Dimensional Perspective. Trop. Geogr. 2022, 42, 762–772. [Google Scholar]
  60. Yang, D.F.; Long, Y.; Yang, W.S.; Sun, H. Losing Population with Expanding Space:Paradox of Urban Shrinkage in China. Mod. Urban Res. 2015, 9, 20–25. [Google Scholar]
  61. Jiang, X.H. The Triple Logic of Urban Shrinking Caused by Spatial Mismatch:Institutional Space Displacement, Policy Space Paradox And Behavior Space Imbalance. Hum. Geogr. 2021, 36, 87–95. [Google Scholar]
  62. Aurora, R.M.; Furuya, K. Spatiotemporal Analysis of Urban Sprawl and Ecological Quality Study Case: Chiba Prefecture, Japan. Land 2023, 12, 2013. [Google Scholar] [CrossRef]
  63. Haase, A.; Bernt, M.; Grossmann, K.; Mykhnenko, V.; Rink, D. Varieties of shrinkage in European cities. Eur. Urban Reg. Stud. 2016, 23, 86–102. [Google Scholar] [CrossRef]
  64. Choi, J.-H.; Park, P. Regional Characteristics of the Shrinking Cities in Korea and its Implication Toward Urban Policies. J. Korean Urban Geogr. Soc. 2020, 23, 1–13. [Google Scholar] [CrossRef]
  65. Hu, Y.C.; Liu, Y.J.; Sun, H.R. Process and Factors of Urban Growth and Shrinkage: A Case Study of Mining Cities in Heilongjiang Province. Geogr. Sci. 2020, 40, 1450–1459. [Google Scholar]
  66. Li, X.; Du, Z.; Li, X. The Spatial Distribution and Mechanism of City Shrinkage inthe Pearl River Delta. Mod. Urban Res. 2015, 9, 36–43. [Google Scholar]
  67. Fu, J.M.; Liu, Y.H. Characteristics and Factors of Shrinking Cities in Guangdong Province: A Case Study of Guancheng in Dongguan City. Trop. Geogr. 2018, 38, 525–535. [Google Scholar] [CrossRef]
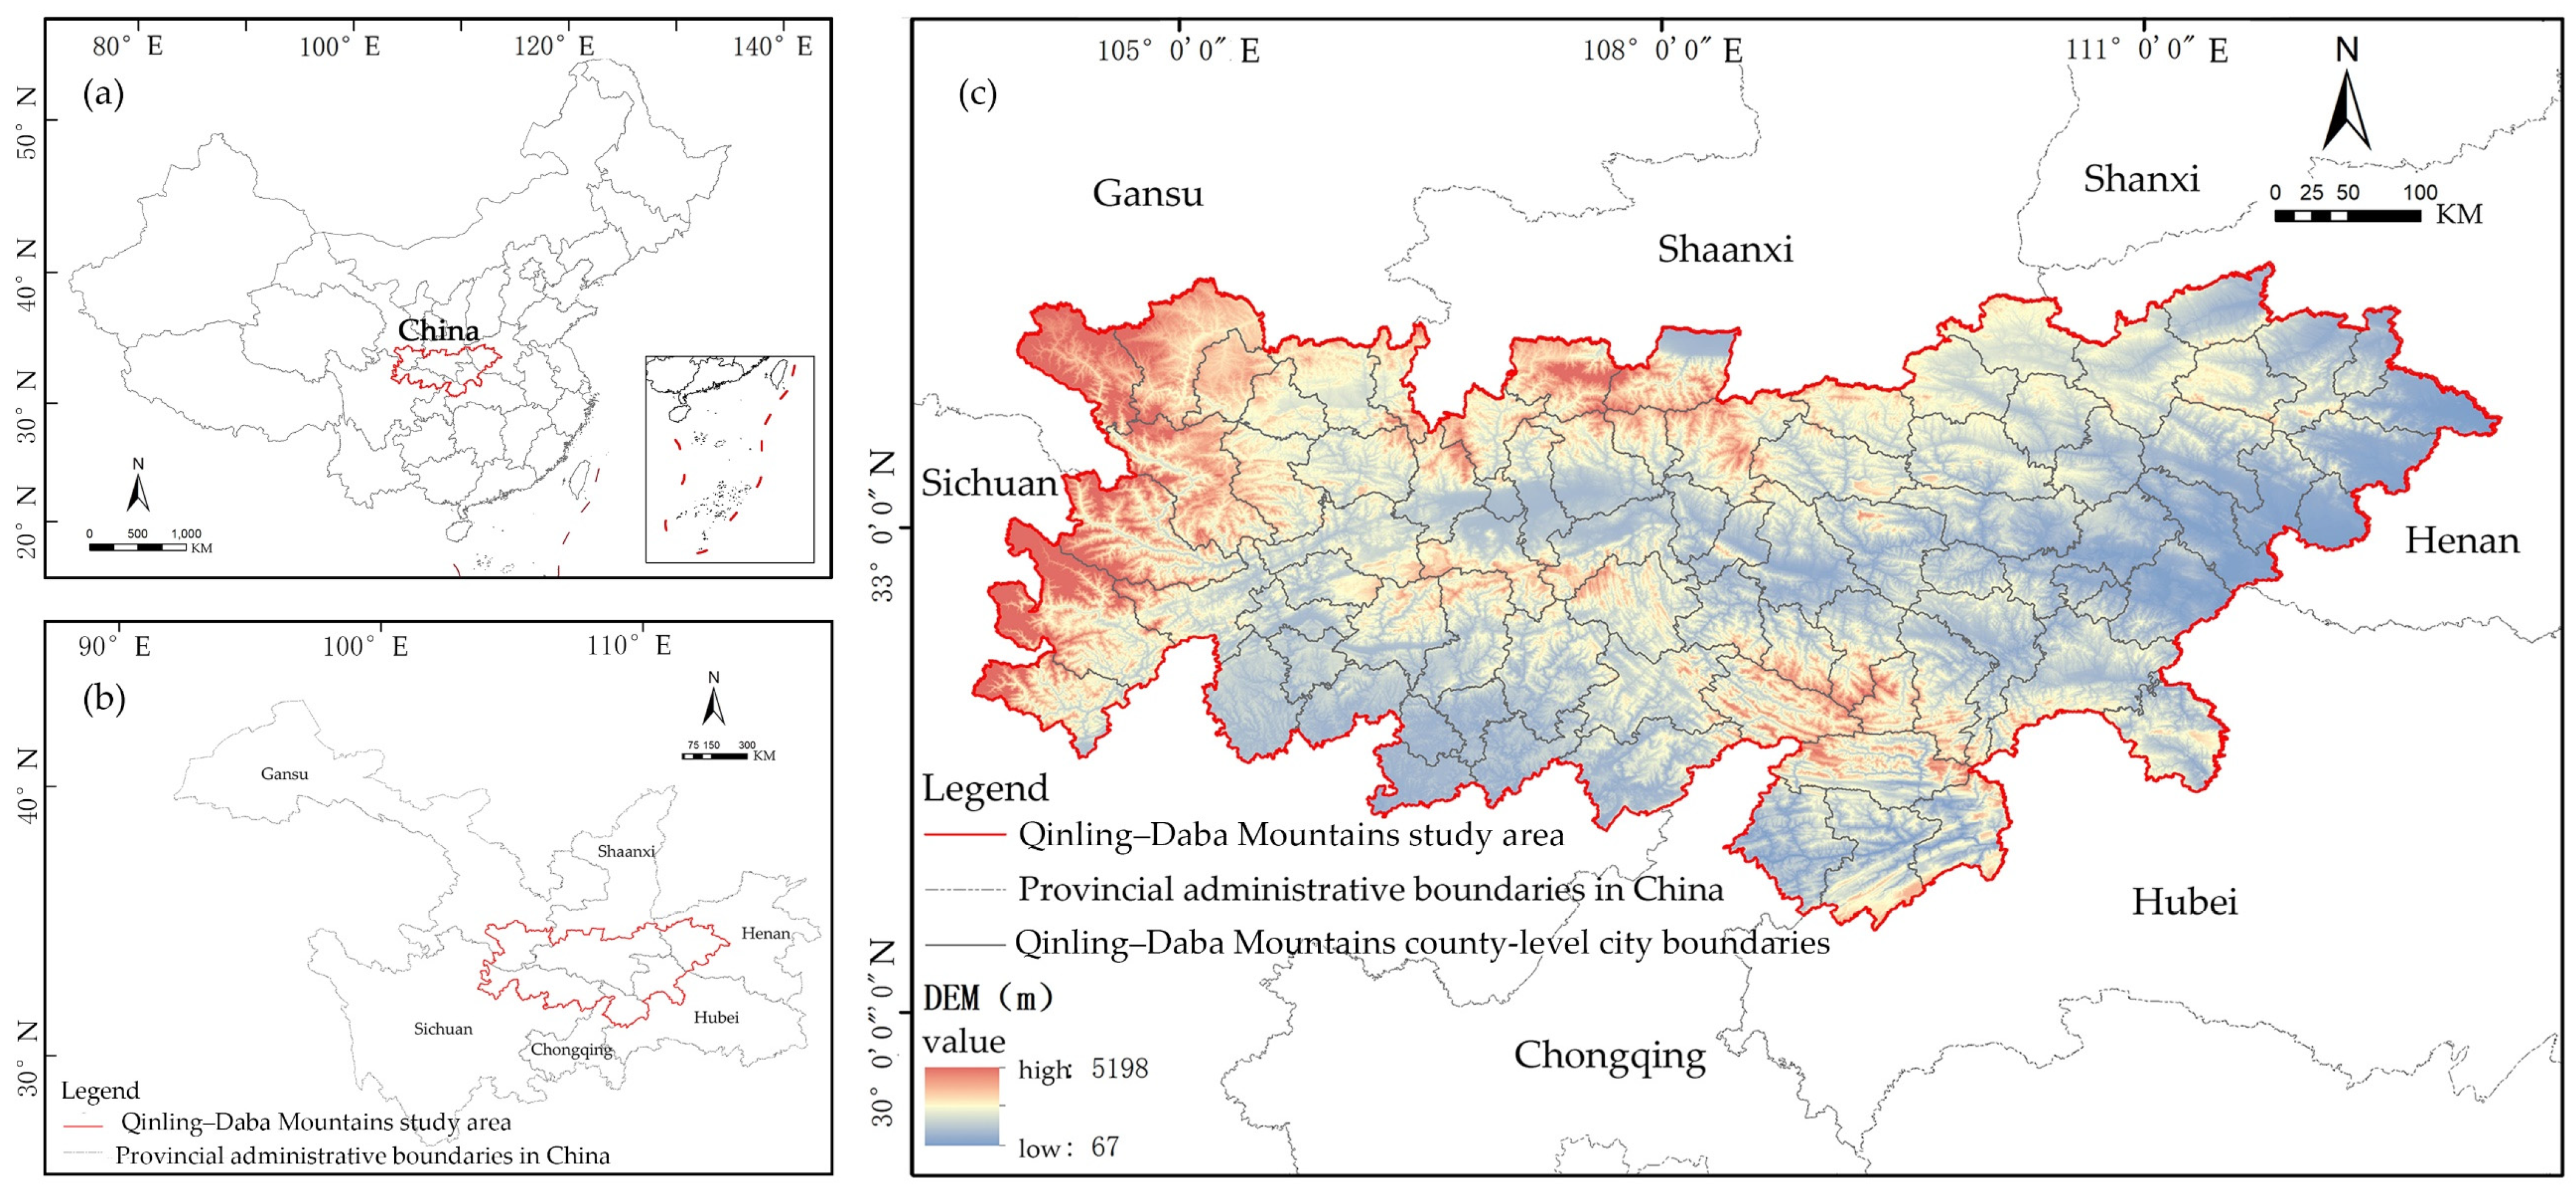
Figure 1. Study area: (a) the location of the Qinling–Daba Mountains in China; (b) the location of the Qinling–Daba Mountains and their six provinces; (c) the location and elevation of 81 county-level cities.
Sustainability 17 07084 g001
Figure 2. Framework of urban shrinkage analysis.
Sustainability 17 07084 g002
Figure 3. Evolution of urban shrinkage patterns in Qinling–Daba Mountains.
Sustainability 17 07084 g003
Figure 4. Spatial distribution of coefficients of various influencing factors in the GTWR model (blue: negative effect; orange: positive effect).
Sustainability 17 07084 g004aSustainability 17 07084 g004b
Figure 5. The factors influencing urban shrinkage.
Sustainability 17 07084 g005
Table 1. Detailed list of data categories, labels, contents, and sources.
Data CategoryData LabelContent DescriptionSource
Administrative
Elements
Administrative Boundary DataGeographic boundaries of county-level cities within the Qinling–Daba Mountains.National Platform for Common GeoSpatial Information Services
Natural
Elements
Digital Elevation Model (DEM)Average elevation and topographic relief information.Geospatial Data Cloud
Demographic
Elements
Population DataCensus data encompassing permanent resident population, population structure, and migration statistics.Provincial and Municipal Bureaus of Statistics and Official County Government Websites
Economic and
Social
Elements
Economic and Social IndicatorsEconomic and social development and other relevant data.Provincial and Municipal Bureaus of Statistics and Official County Government Websites
Points of Interest (POIs)Data on education, healthcare, and public services.Amap
Spatial
Elements
Nighttime Lighting
Data
Nighttime lighting data digital number.DMSP-OLS and SNPP-VIIRS datasets
Road Traffic DataVector data on road infrastructure and distances from counties to provincial and prefecture-level cities.Amap
Table 2. Indicators of factors influencing urban shrinkage.
DimensionIndicatorDescription of VariableUnitNumber
naturalaverage elevationRefers to the average difference in altitude between a given area or location and sea level.mX1
topographic reliefRefers to a calculation of the average topographic relief for each region based on 1 km × 1 km DEM data.mX2
demographicbirth rateRefers to the rate of births per 1000 population, averaged over a given period of time (usually 1 year).X3
natural growth rateRefers to the ratio of the natural increase in population per unit of time in a year to the average annual total.X4
number of students enrolled in general secondary schoolsRefers to the total number of students enrolled and receiving education in general secondary schools (including junior and senior high schools).ten thousandX5
economicgross regional productGenerally refers to the total market value of all final goods and services produced in a region within a year.billion yuanX6
per capita disposable income of urban residentsRefers to the sum of final consumption expenditures and savings available to the average urban household per person over a given period of time.yuanX7
gross output value of industrial enterprises above designated sizeEncompasses all finished industrial goods and productive labor contributions manufactured during a defined interval by industrial enterprises achieving specified annual primary revenue benchmarks.billion yuanX8
socialtotal retail sales of consumer goodsRefers to the monetary value of tangible goods sold directly by enterprises (organizations, individual businesses) to individuals and social groups for non-production and non-operational purposes, as well as the revenue obtained from providing catering services.billion yuanX9
number of healthcare service facilitiesRefers to the number of healthcare facilities according to AMap POI data.unitX10
number of science, education, and cultural service facilitiesRefers to the number of science, education, and cultural facilities, calculated based on AMap POI data.unitX11
number of commercial residential service facilitiesRefers to the number of commercial residential facilities, calculated based on AMap POI data.unitX12
spatialtotal road length in a given yearRefers to the cumulative length of all roads in the study unit.kmX13
distance from provincial capitalsRefers to the road distance between the study unit and the capital city of the province to which it belongs.kmX14
distance to municipalitiesRefers to the road distance between the study unit and its corresponding prefecture-level city.kmX15
Table 3. Screening factors influencing urban shrinkage.
Influencing FactorVariance Inflation Factor (VIF)
naturalaverage elevation (X1)1.779
topographic relief (X2)1.332
demographicbirth rate (X3)1.405
number of students enrolled in general secondary schools (X5)2.149
economicper capita disposable income of urban residents (X7)2.180
socialnumber of healthcare service facilities (X10)3.896
number of commercial residential service facilities (X12)1.038
spatialdistance from provincial capitals (X14)2.711
Table 4. Number and percentage of urban shrinkage patterns (Units: n, %).
Period2005–20102010–20152015–20202020–2022
Pattern NumberPercentageNumberPercentageNumberPercentageNumberPercentage
Expansion–
Growth
5264.201518.521316.051214.81
Intensive
Growth
44.943745.6800.0000.00
Expansion–
Shrinkage
2024.69911.116580.256985.19
Intensive
Shrinkage
56.172024.6933.7000.00
Table 5. Statistical parameters of the GTWR model.
ModelR2R2 AdjustAICc
GTWR0.90730.9055−376.93
Table 6. Statistical summary of GTWR regression coefficients of urban shrinkage factors.
Influencing FactorMinimumFirst Quartile Third QuartileMaximumMeanSignificance
Percentage
(%)
naturalX1−0.1540−0.10720.01280.0605−0.050282.96
X2−0.0332−0.00970.04770.06490.020770.86
demographicX3−0.0934−0.03080.09950.21090.042788.64
X50.14840.19090.26110.42480.2417100
economicX7−0.39030.06030.16460.40350.076399.75
socialX10−0.4303−0.17860.06570.14820.050686.17
X12−0.00970.05870.54900.92450.296497.78
spatialX14−0.0836−0.0345−0.01820.0151−0.028281.98
Table 7. Average regression coefficients of urban shrinkage factors based on the GTWR model (2005–2022).
Influencing
Factor
20052010201520202022
naturalX1−0.1219−0.0921−0.06910.00870.0206
X20.05360.04130.0300−0.0071−0.0141
demographicX30.12540.11020.0496−0.0474−0.0242
X50.20700.25620.20810.16460.3728
economicX70.24390.1671−0.21400.11360.0710
socialX10−0.1575−0.26870.10730.03610.0318
X120.54600.69440.14470.05260.0444
spatialX14−0.0492−0.0362−0.0231−0.0235−0.0093
Disclaimer/Publisher’s Note: The statements, opinions and data contained in all publications are solely those of the individual author(s) and contributor(s) and not of MDPI and/or the editor(s). MDPI and/or the editor(s) disclaim responsibility for any injury to people or property resulting from any ideas, methods, instructions or products referred to in the content.