1. Introduction
Soil is a fundamental component Earth’s ecosystem and a key resource for food production. Its extensive use in agriculture highlights the urgent need for effective protection against pollution to support sustainable development [
1,
2]. In the context of global urbanization, intensive farming, and land overexploration, soil degradation has emerged as a critical environmental challenge worldwide.
In 2015, the United Nations introduced the Sustainable Development Goals (SDGs), consisting of 17 global targets designed to shift from exploitative practices toward sustainable solutions addressing issues such as inequality, poverty, and hunger [
3,
4]. Achieving SDGs related to food security, health, water, and climate places growing pressure on land resources. Preventing land degradation requires an integrated approach, combining sustainable land and water management with transformations in economic systems and societal behavior [
1].
Despite its essential role in ecosystems, agriculture, and societal development, soil is increasingly affected by degradation, pollution, and acidification, threatening both ecosystem stability and global food security [
5,
6,
7,
8]. Maintaining soil quality has become a key priority for governmental institutions and the scientific community alike [
5,
6,
9].
Previous studies have demonstrated that human activity significantly alters the spatial distribution of heavy metals (HMs) in soils, which subsequently has a negative impact on the sustainable state of ecosystems [
10,
11,
12]. One notable example is the Virgin lands Campaign in mid-20th century Kazakhstan, in particular in the Akmola region: the introduction of intensive agricultural practices, plowing of large areas, and long-term use of fertilizers led to soil degradation, the loss of humus, compaction of the structure, and changes in acidity.
Since 1954, after the dissolution of the Akmola region and its transfer to regional subordination, a large-scale campaign to develop virgin and fallow lands began in the territory. Despite the high rates of economic activity, these transformations led to significant changes in the natural resource potential of steppe ecosystems, increasing the vulnerability of the region to soil degradation processes [
13].
Regular use of chemical fertilizers during the development of virgin lands not only increases the content of heavy metals in soils but also changes their bioavailability [
14,
15,
16,
17]. During the urbanization of territories, changes in land use are observed, which lead to an increase in the proportion of impermeable coatings, which affects the migration of heavy metals in soils and their distribution in ecosystems [
18]. Heavy metals such as lead, cadmium, zinc, and copper can enter the human body through the food chain, which poses a health hazard to both humans and animals [
19,
20].
Recent studies in Kazakhstan show significant ecological and geochemical risks due to heavy metal (HM) pollution. Zhyrgalova et al. (2024) reported high levels of HM contamination in the Kostanay region, with ecological risk index (RI) values as 447, primarily driven by As, Cd, Pb, and Zn. This corresponds to a “high ecological risk” category [
21].
The study by Faurat et al. (2025) considered snow cover in the Pavlodar region as a bioindicator of pollution: the ecological risk index of snow (ERI) has reached 192, and the levels of Zn, Cr, Pb, Cd, Mn, and Mo have exceeded the standards, especially in the industrial and residential areas of the city. These results confirm the presence of spatial heterogeneity of HM pollution across the territory of Kazakhstan, with the highest concentrations in areas of intense anthropogenic load. They highlight the need to apply integrated monitoring and risk assessment methods such as Igeo, Cf, Er, and RI, which is consistent with the methodological model of this study [
22].
Despite Kazakhstan’s vast steppe ecosystems and historically low population density, increasing industrial activity and urbanization have contributed to soil contamination by heavy metals. Recent studies highlight regional hotspots of pollution and underline the growing environmental and public health risks posed by these contaminants.
A national soil monitoring campaign between 2010 and 2018 identified elevated concentrations of Pb, Cd, Cu, Zn, and Cr in urban areas, particularly in Balkhash, Ust-Kamenogorsk, Ridder, and Shymkent. The mean values for Pb and Cd in these regions exceeded geoaccumulation thresholds, suggesting significant anthropogenic input and elevated ecological risk. Moreover, the probabilistic risk assessment showed that both adults and children are potentially exposed to hazardous levels of carcinogenic metals [
23].
A broader transect-based survey of potentially toxic elements (PTEs) across Kazakhstan’s highway corridors revealed variable distributions of As, Cd, Co, Mn, and Ni. The study found that soil organic carbon and parent material strongly influence the concentration of metals. Arsenic levels were notably elevated in multiple regions, raising environmental concerns. Although Pb levels were not consistently high, Cd, Mn, and Ni reached or exceeded critical thresholds in several locations [
24].
Efforts toward ecological restoration have also been reported in industrially disturbed sites, such as the Kokdzhon phosphate mining area in southern Kazakhstan. Restoration experiments using human-transported materials and native vegetation showed low short-term engraftment success, indicating poor soil conditions and the need for long-term bioremediation approaches [
25].
These findings collectively underscore the need for sustained monitoring, regulatory oversight, and the development of region-specific soil remediation strategies across Kazakhstan.
Assessing the quality of soil and the geochemical characteristics of heavy metals in agricultural lands is an important step in the analysis of environmental risks and the development of effective soil resource management methods [
26].
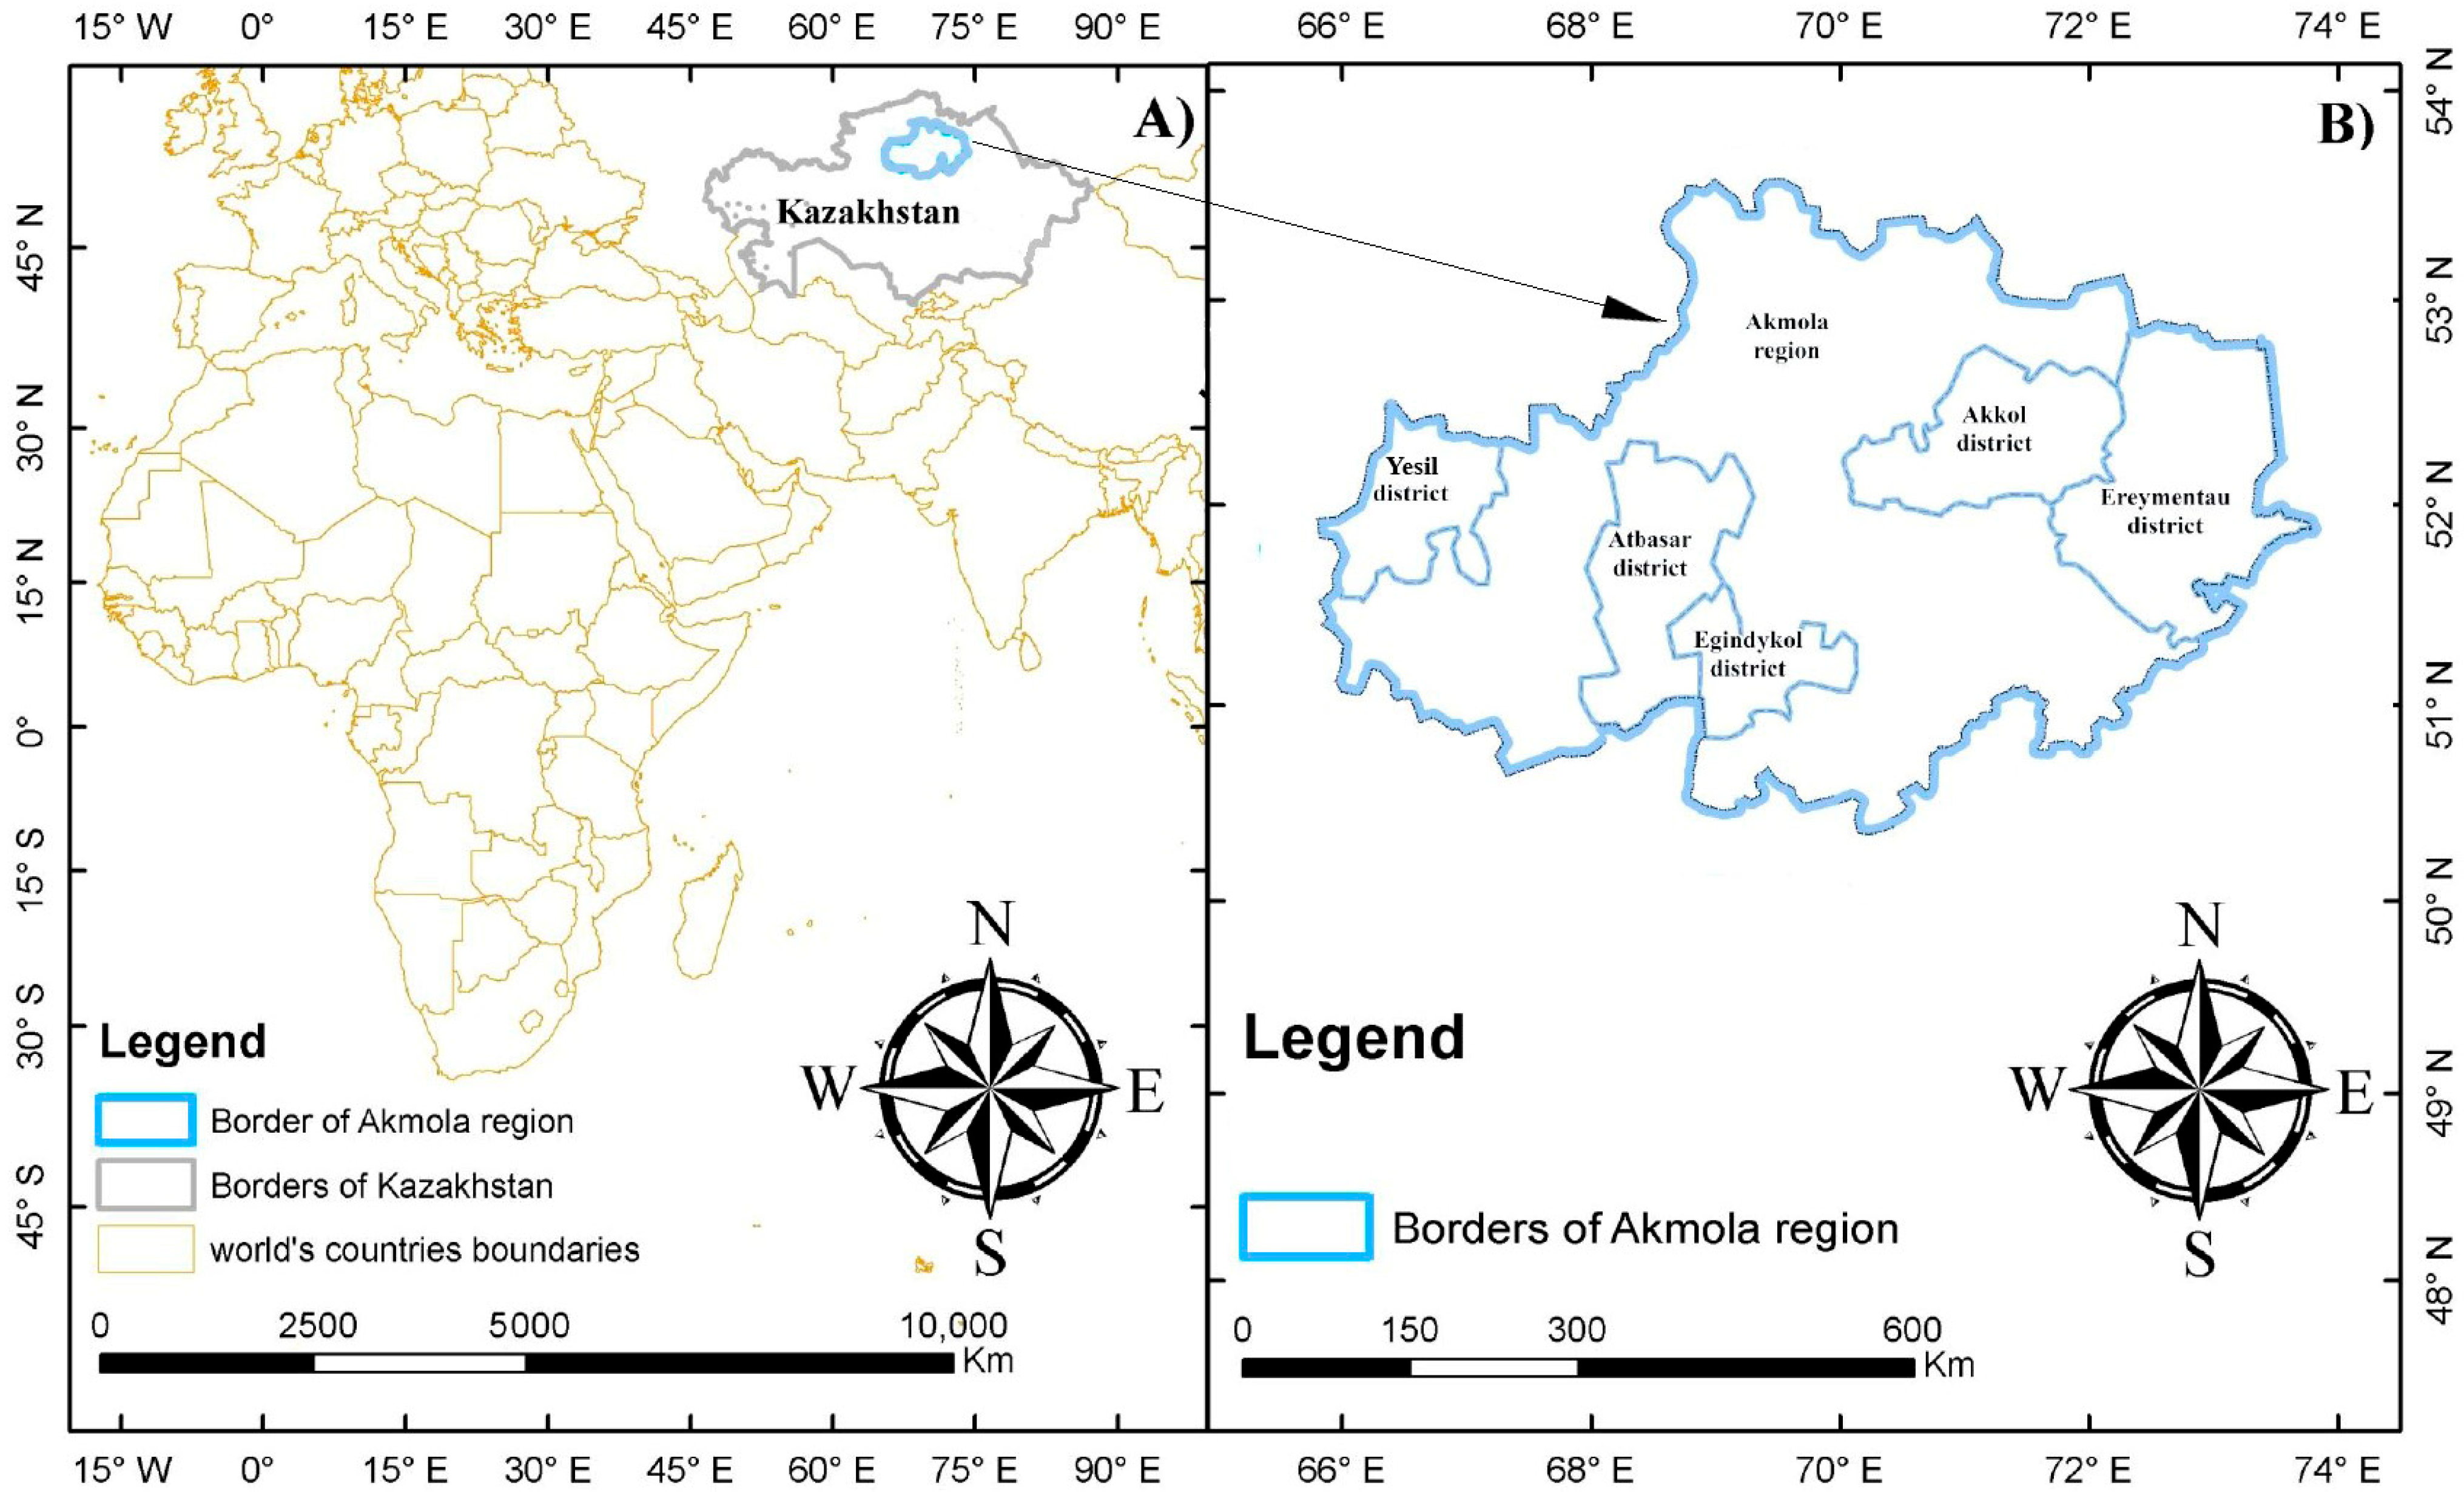
This study analyzes the geochemical characteristics of heavy metals in soils of the Akmola region (Atbasar, Egindykol, Ereymentau, Yesil, and Akkol districts) in order to conduct an ecological and geochemical assessment of the steppe ecosystems of the region. The concentrations of eight heavy metals in soils, which are indicators for assessing the environmental risk on agricultural lands, were studied. The environmental risk of soil pollution is assessed taking into account international and Kazakhstani environmental quality standards for soils. The results of the study are aimed at improving land-use methods and optimizing agricultural production planning, which will help ensure the safety of agricultural products while minimizing environmental risks. The purpose of this study is to conduct an ecological and geochemical assessment of the steppe ecosystems of the Akmola region with an emphasis on the geochemical characteristics of heavy metals in soils, which will help assess the degree of pollution of agricultural lands and identify the environmental risk to the environment. The main focus is on studying the concentration of heavy metals in the upper soil layer to assess their impact on the regional ecosystem, which will allow for the formation of well-founded recommendations for sustainable development of land resources and minimization of environmental impact in agriculture.
3. Results
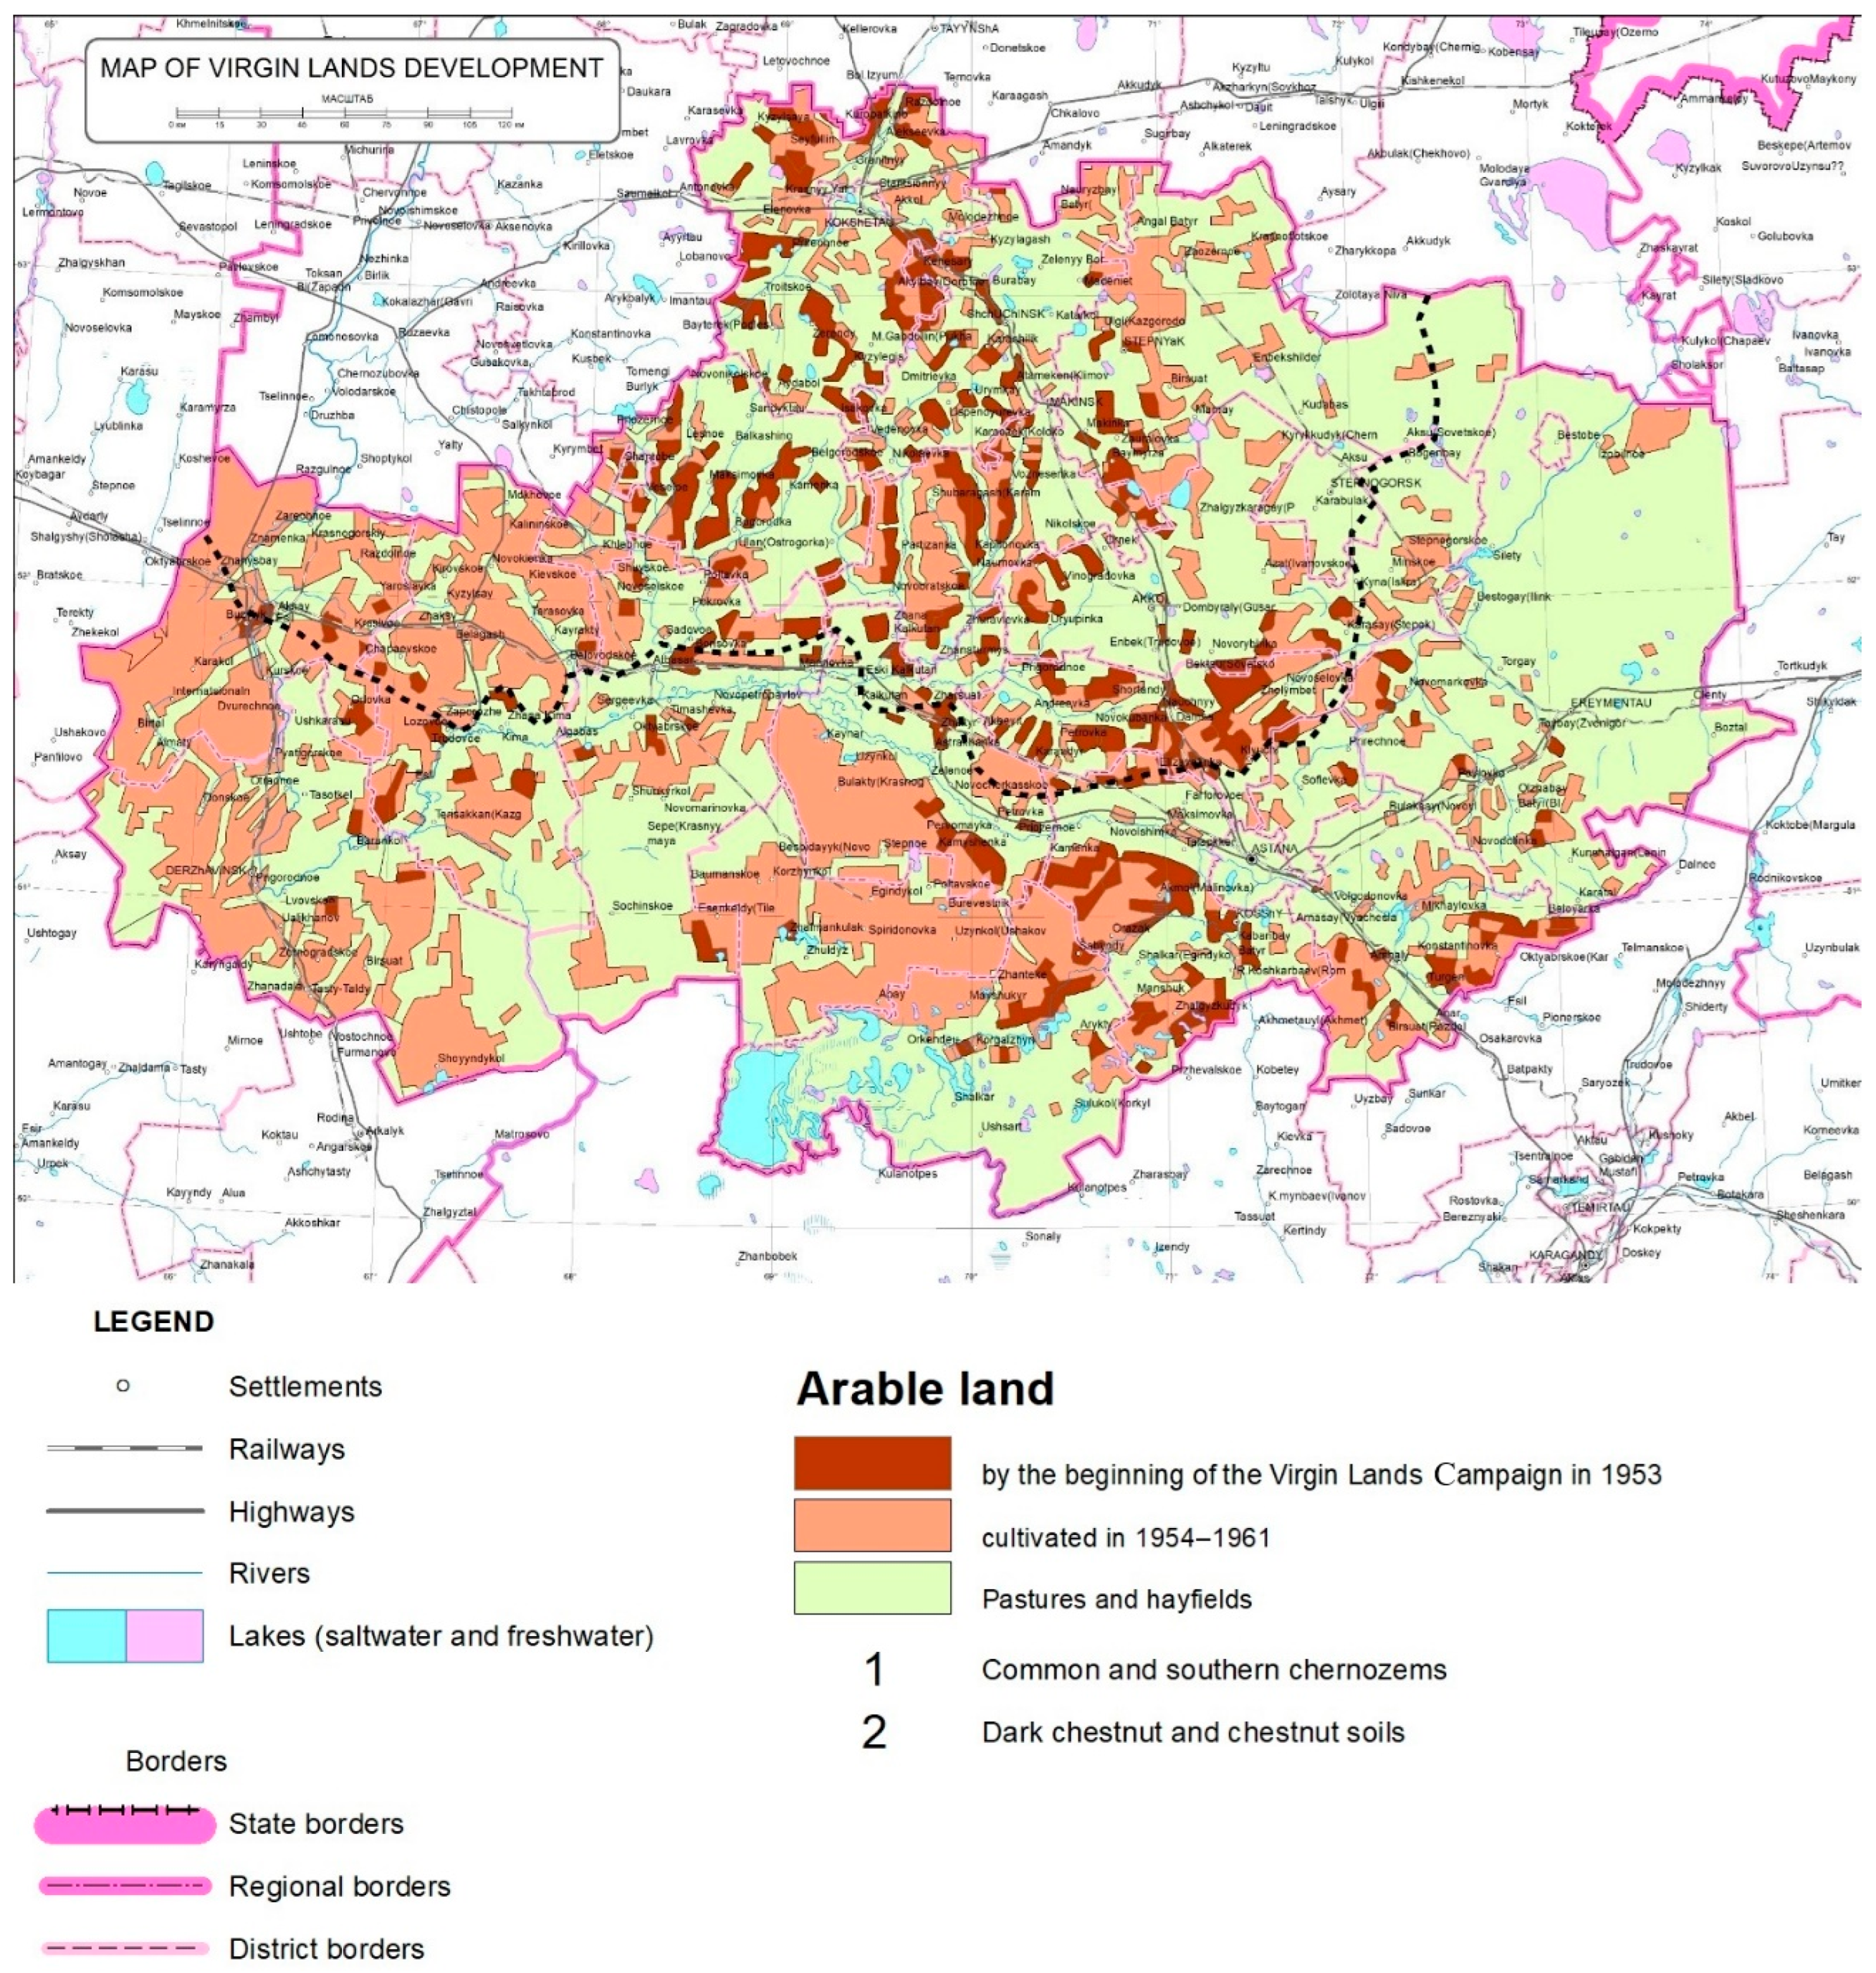
The historical transformation of land use shown in
Figure 2 provides critical insight into the agroecological changes that have shaped soil conditions in the Akmola region. The Virgin Lands Campaign (1954–1961) was a large-scale Soviet agricultural project that led to the plowing of vast steppe areas, including natural pastures and hayfields, primarily on fertile chernozem and chestnut soils.
This transformation had several long-term consequences for soil quality and pollution.
Loss of soil structure and organic matter: The rapid conversion of natural grasslands into croplands disrupted native soil horizons and led to a decline in humus content, which plays a key role in buffering heavy metals.
Increased agrochemical input: The newly cultivated lands were intensively managed using mineral fertilizers, pesticides, and mechanization, which, over decades, contributed to the accumulation of heavy metals (HMs) such as cadmium (Cd), lead (Pb), and zinc (Zn).
Geographical correlation with HM indices: Many of the zones highlighted in
Figure 2 as having been brought under cultivation during the campaign (e.g., Atbasar, Yesil, and Ereymentau districts) coincided with areas that demonstrated elevated values of CF, PLI, and RI in this study. This suggests a direct link between historical land conversion and current geochemical burdens.
Soil type vulnerability: Chernozem and chestnut soils, while agriculturally productive, are known to retain certain heavy metals in the topsoil, especially when organic matter is depleted, and their buffering capacity reduced.
Thus,
Figure 2 is essential for contextualizing the spatial patterns of soil pollution observed in this study. It supports the hypothesis that historical land-use intensity, particularly during the mid-20th century, played a major role in shaping current HM contamination levels. This also underscores the importance of considering legacy agricultural practices when designing modern strategies for sustainable land and soil management.
The map illustrates the spatial extent of arable land prior to 1953 and areas cultivated between 1954 and 1961 during the Virgin Lands Campaign. Pastures and hayfields are shown in green, with the soil types indicated (1—common and southern chernozems; 2—dark chestnut and chestnut soils). These land-use transformations contributed to long-term changes in soil properties and set the foundation for heavy metal accumulation observed in the study area.
Heavy metals (Pb, Cd, Zn, Cu, Co, Ni, Fe, and Mn) were analyzed in the soils of five administrative districts: Atbasar, Akkol, Egindikol, Ereymentau, and Yesil.
Table 1 presents descriptive statistics and calculated ecological indices, including the average concentration, standard deviation, coefficient of variation (CV), background concentration, geoaccumulation index (Igeo), environmental risk factor (Er), contamination factor (CF), pollution load index (PLI), and integrated pollution index (Zc) [
36,
37,
38,
39].
These indicators were selected to provide a multidimensional assessment of soil contamination. While Igeo characterizes the extent of anthropogenic enrichment relative to natural background levels, CF quantifies local contamination intensity. Er incorporates the toxic potential of each metal. PLI and Zc help identify zones with elevated overall pollution pressure. Together, these metrics allow for a nuanced interpretation of spatial differences and inform soil quality status in the context of sustainable land management.
3.1. Pollution Load Index (PLI) Distribution
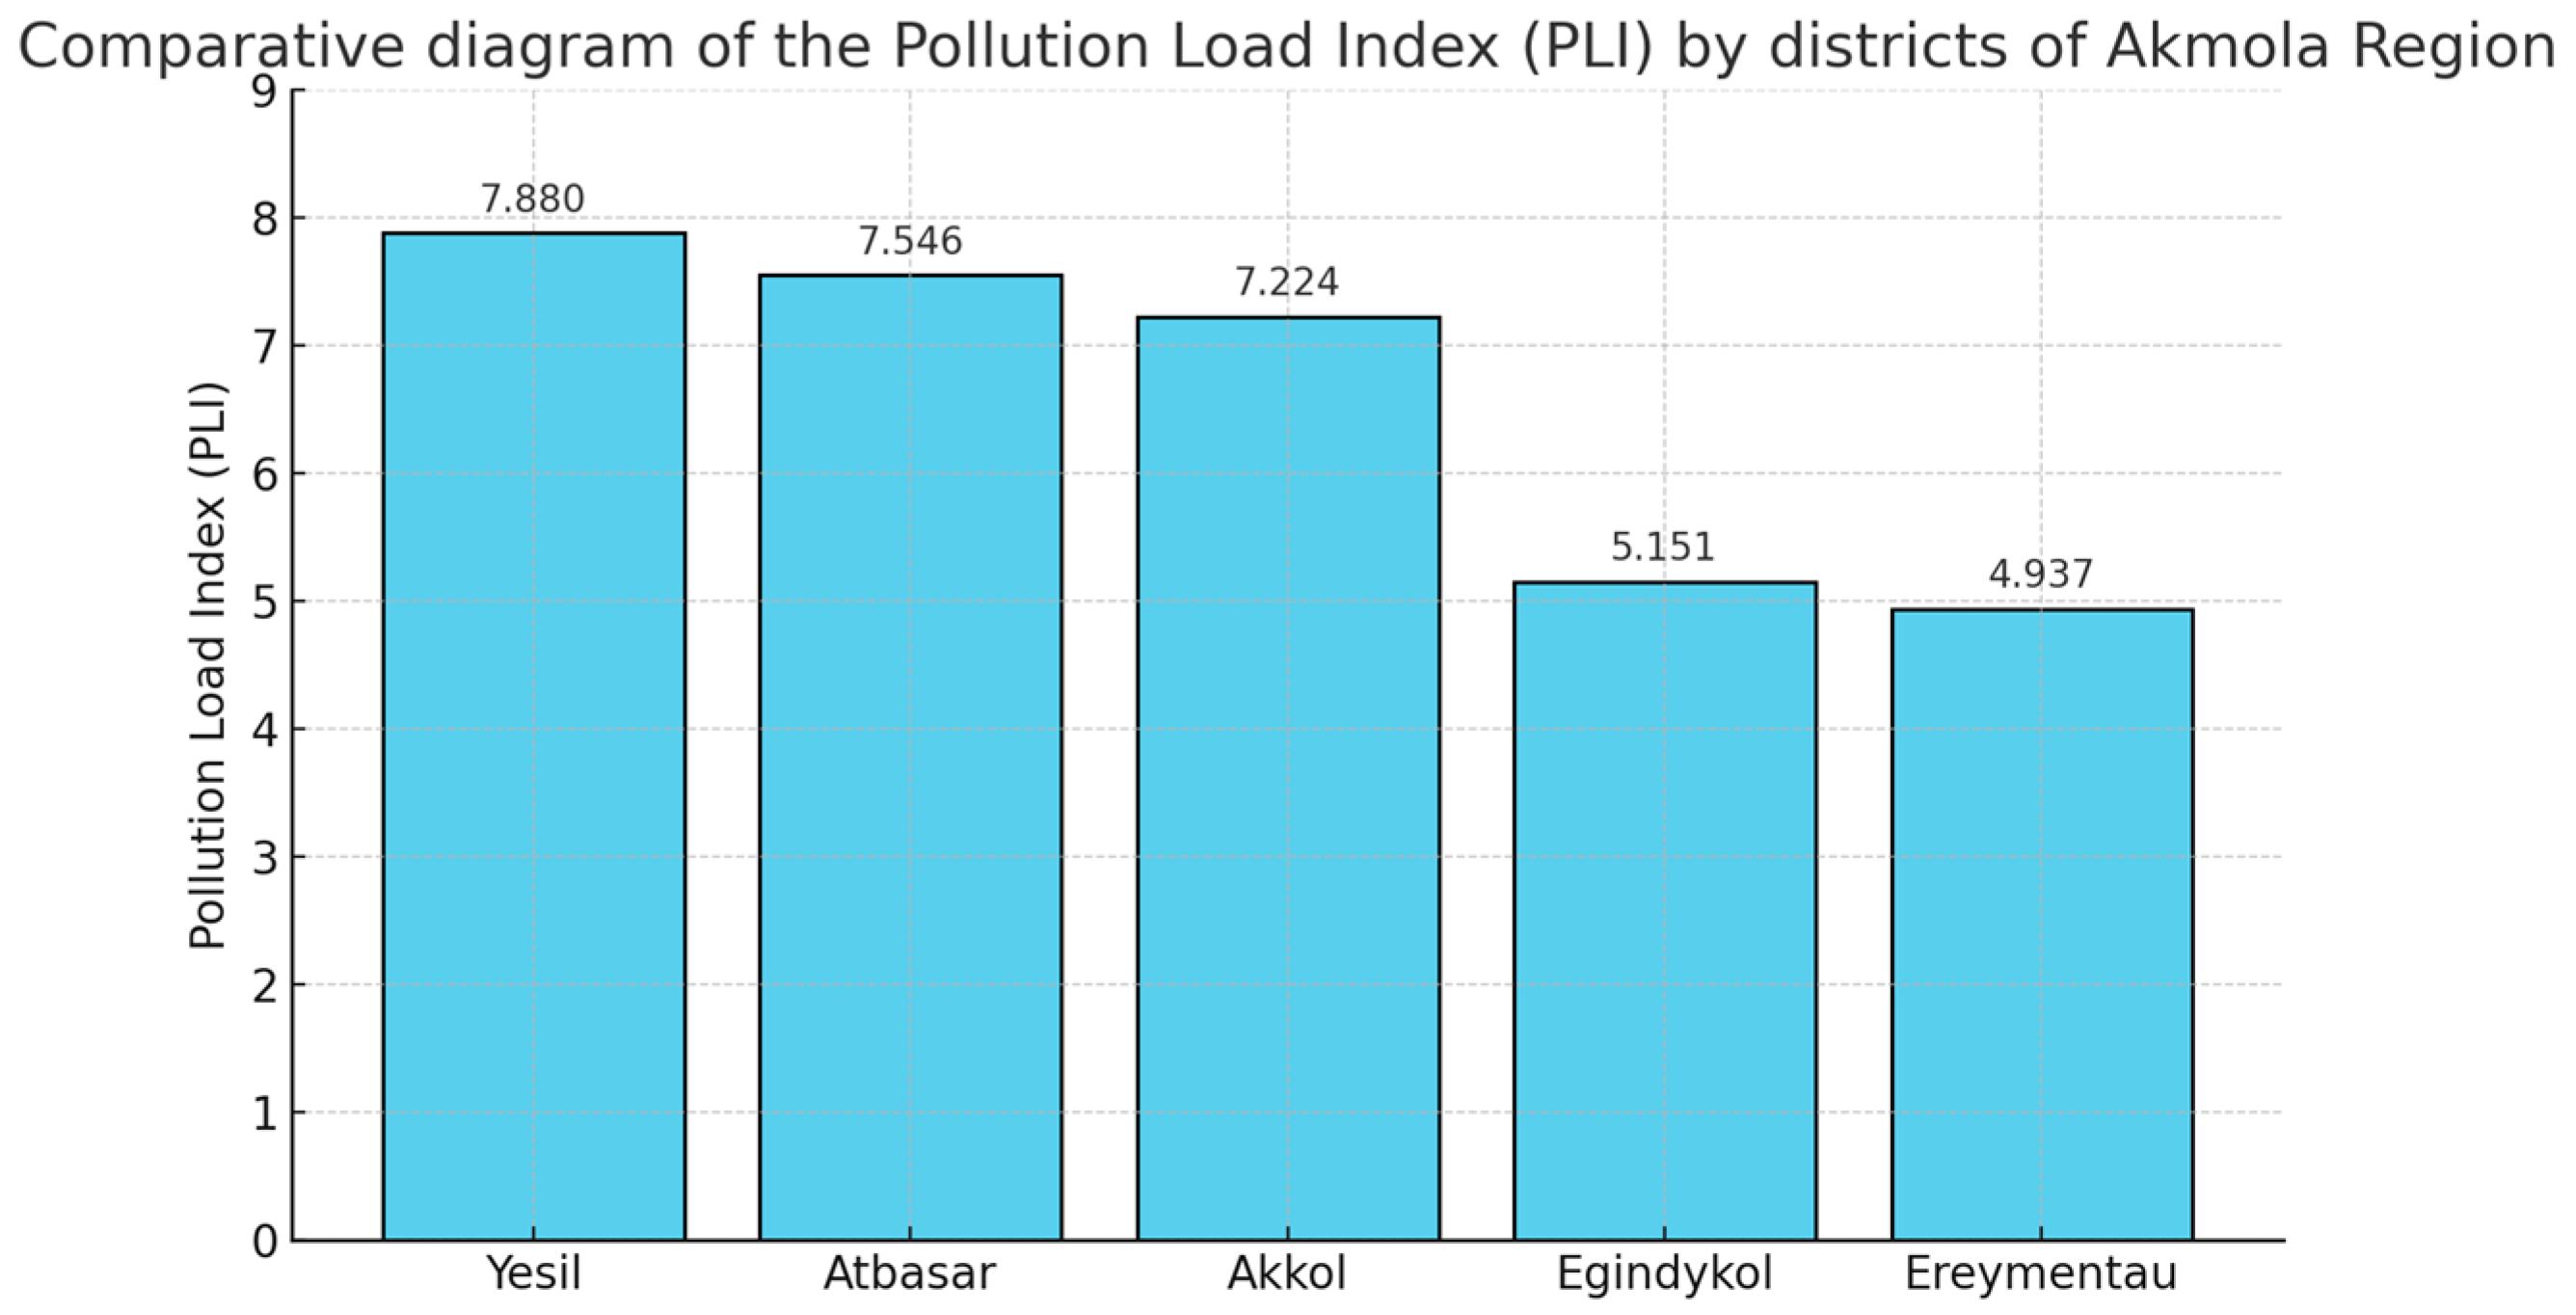
Figure 3 presents a comparative diagram of the pollution load index (PLI) values across the five studied districts of the Akmola region. This index serves as an integrated measure of overall soil pollution with heavy metals. According to Hakanson’s classification, PLI values greater than 1 indicate contamination levels that exceed natural background values [
34].
The highest PLI value was recorded in the Yesil district (7.880), followed by Atbasar (7.546) and Akkol (7.224). The Egindikol and Ereymentau districts exhibited lower PLI values of 5.151 and 4.937, respectively. All five districts demonstrated PLI values above 1, confirming heavy metal pollution relative to the background.
3.2. Ecological Risk and Geochemical Indices
Cadmium (Cd) in the Yesil district showed the highest ecological risk index (Er = 30.000), despite its relatively low concentration, due to its high toxic response factor. As shown in
Table 2, the median Igeo values for all metals fell within the range of −0.152 to 0.125, which, according to Hakanson’s scale, corresponds to the classification of “unpolluted” to “slightly polluted” soils.
Contamination factors (CFs) for all elements were below 1, indicating minimal anthropogenic enrichment. Additionally, the integrated pollution index (Zc) yielded negative values across all districts, suggesting no significant cumulative pollution relative to background concentrations. Note that negative values of Igeo and Zc in
Table 1 reflect concentrations below background levels and should not be confused with typographical hyphens. These are valid outcomes of the log-transformed or differential-based index formulas used for environmental assessment.
3.3. Correlation Analysis
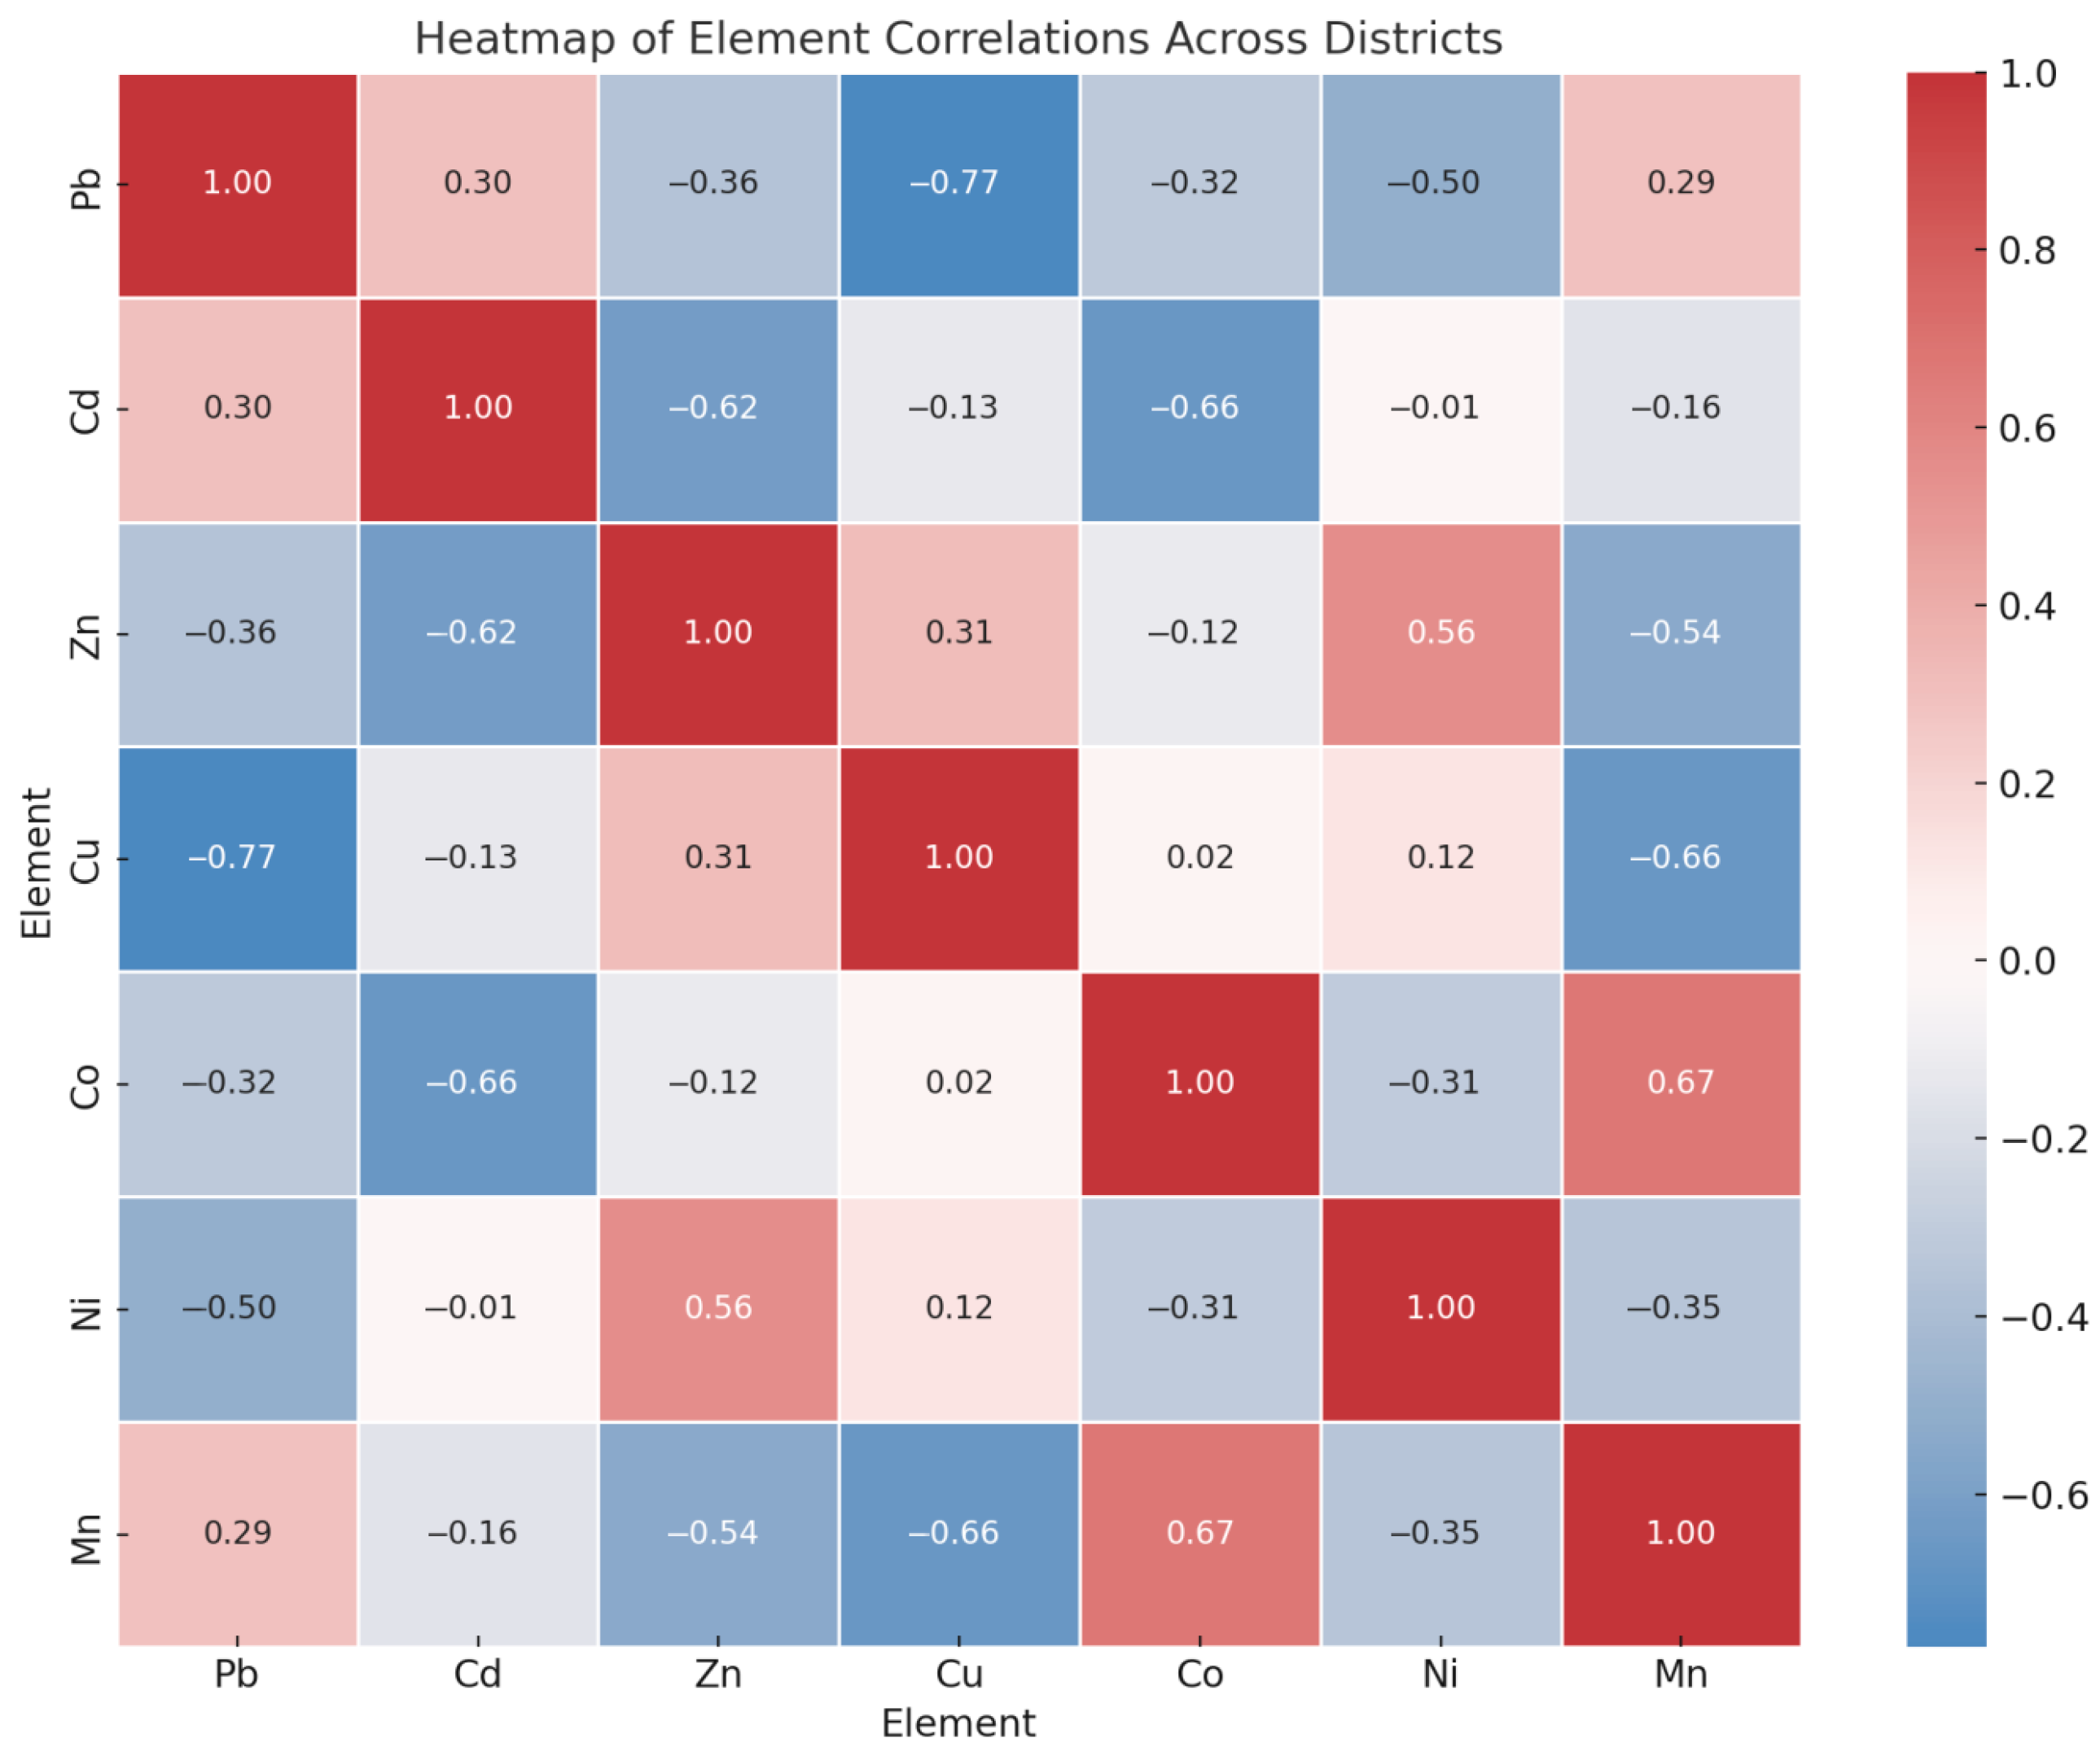
Correlation analysis, visualized in the heatmap (
Figure 4), revealed both positive and negative associations among heavy metals. A strong negative correlation was found between Pb and Cu (r = −0.77) and between Cd and Co (r = –0.66). Additionally, a strong negative correlation was also found between Mn and Cu (r = −0.66), which may reflect contrasting geochemical behaviors or competitive retention in soil minerals. In contrast, Co and Mn exhibited a moderate positive correlation (r = 0.67).
3.4. Cluster and Principal Component Analysis
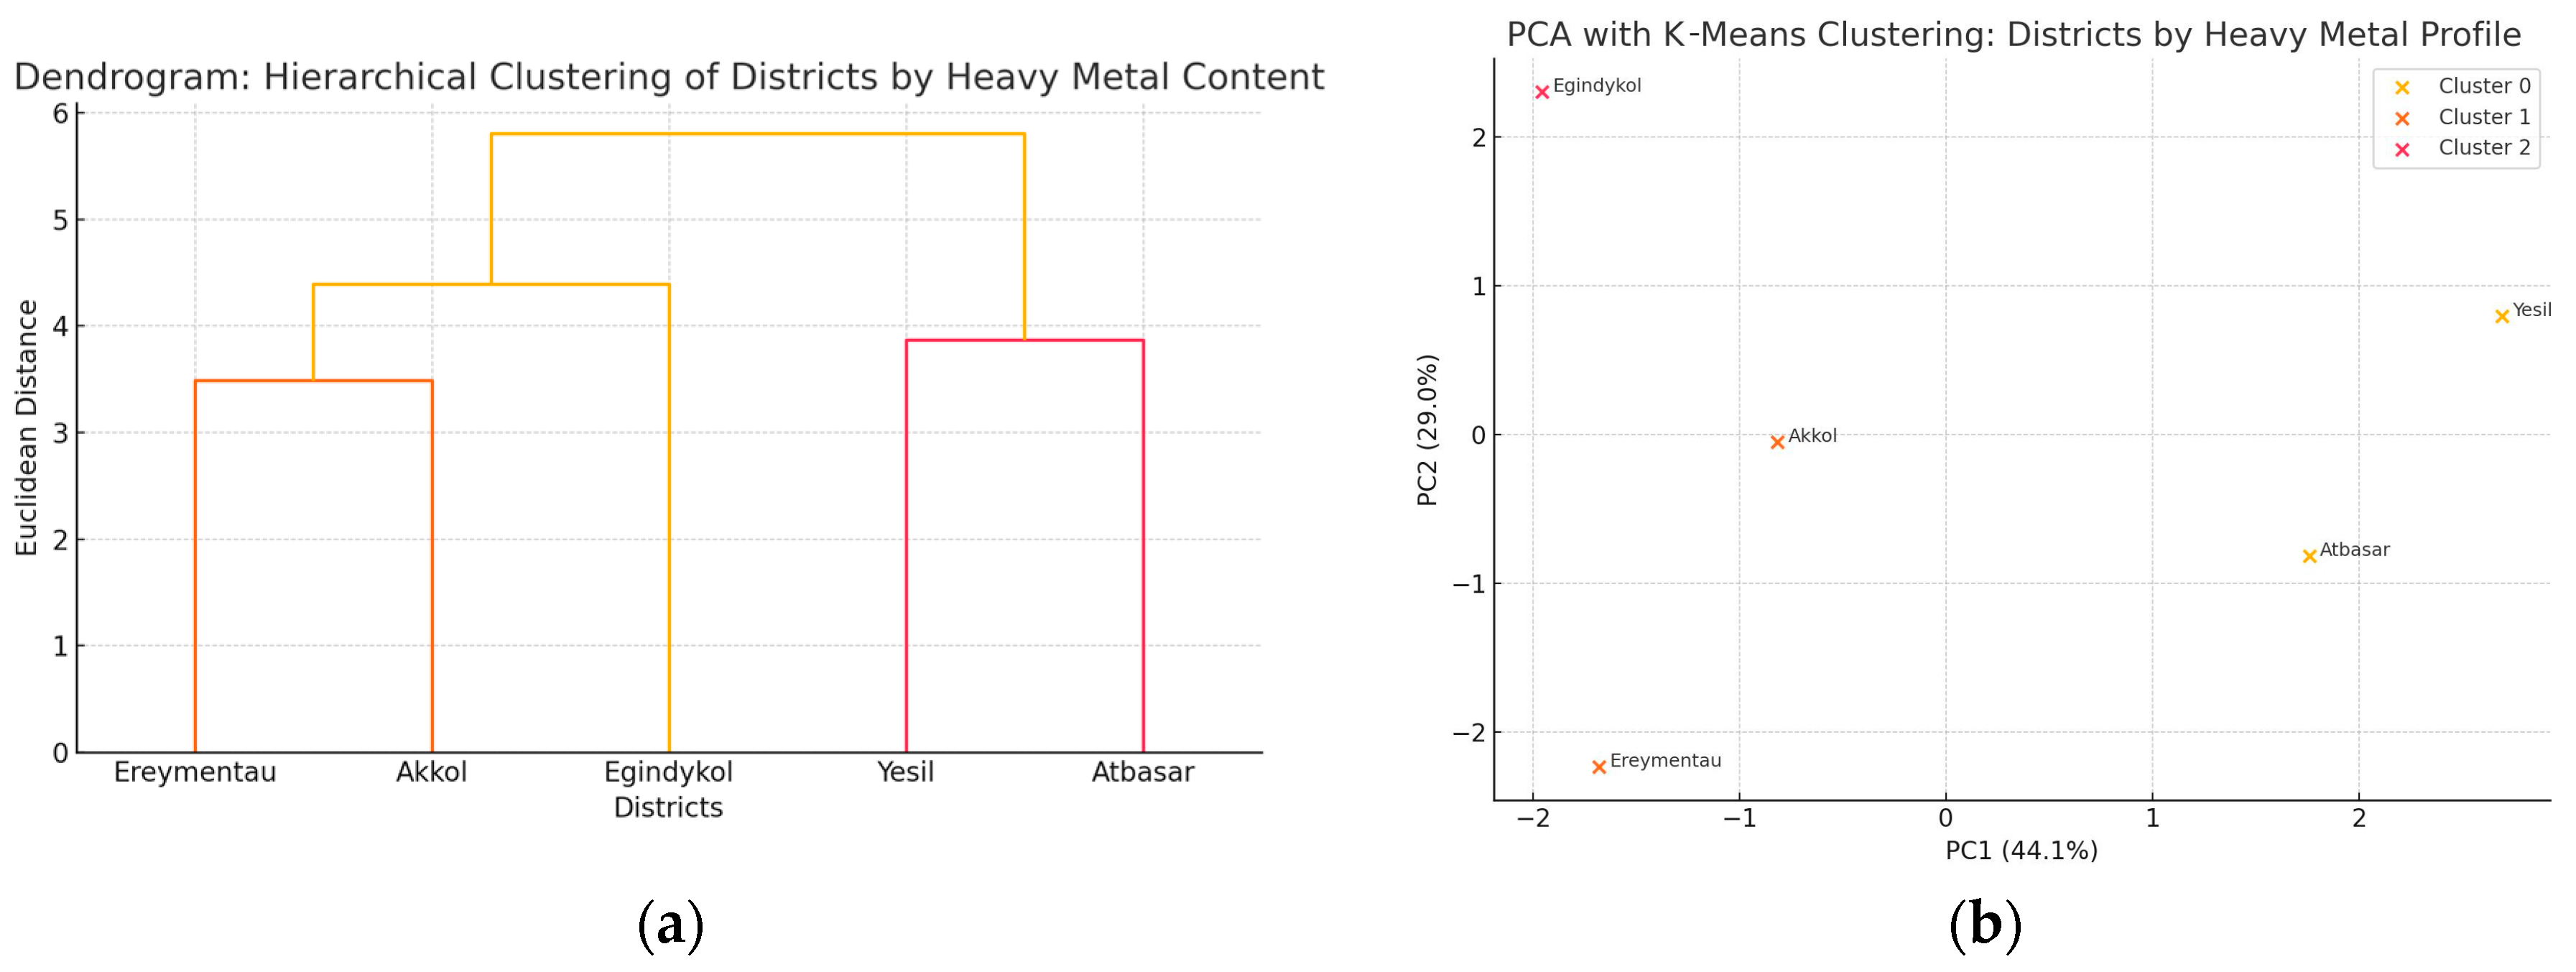
Figure 5 displays (a) a dendrogram based on hierarchical clustering and (b) principal component analysis (PCA) followed by K-means clustering. These analyzes classified the five districts into clusters based on similarities in heavy metal concentrations. Yesil is now represented as a single unified district.
3.5. Integrated Pollution Profiles
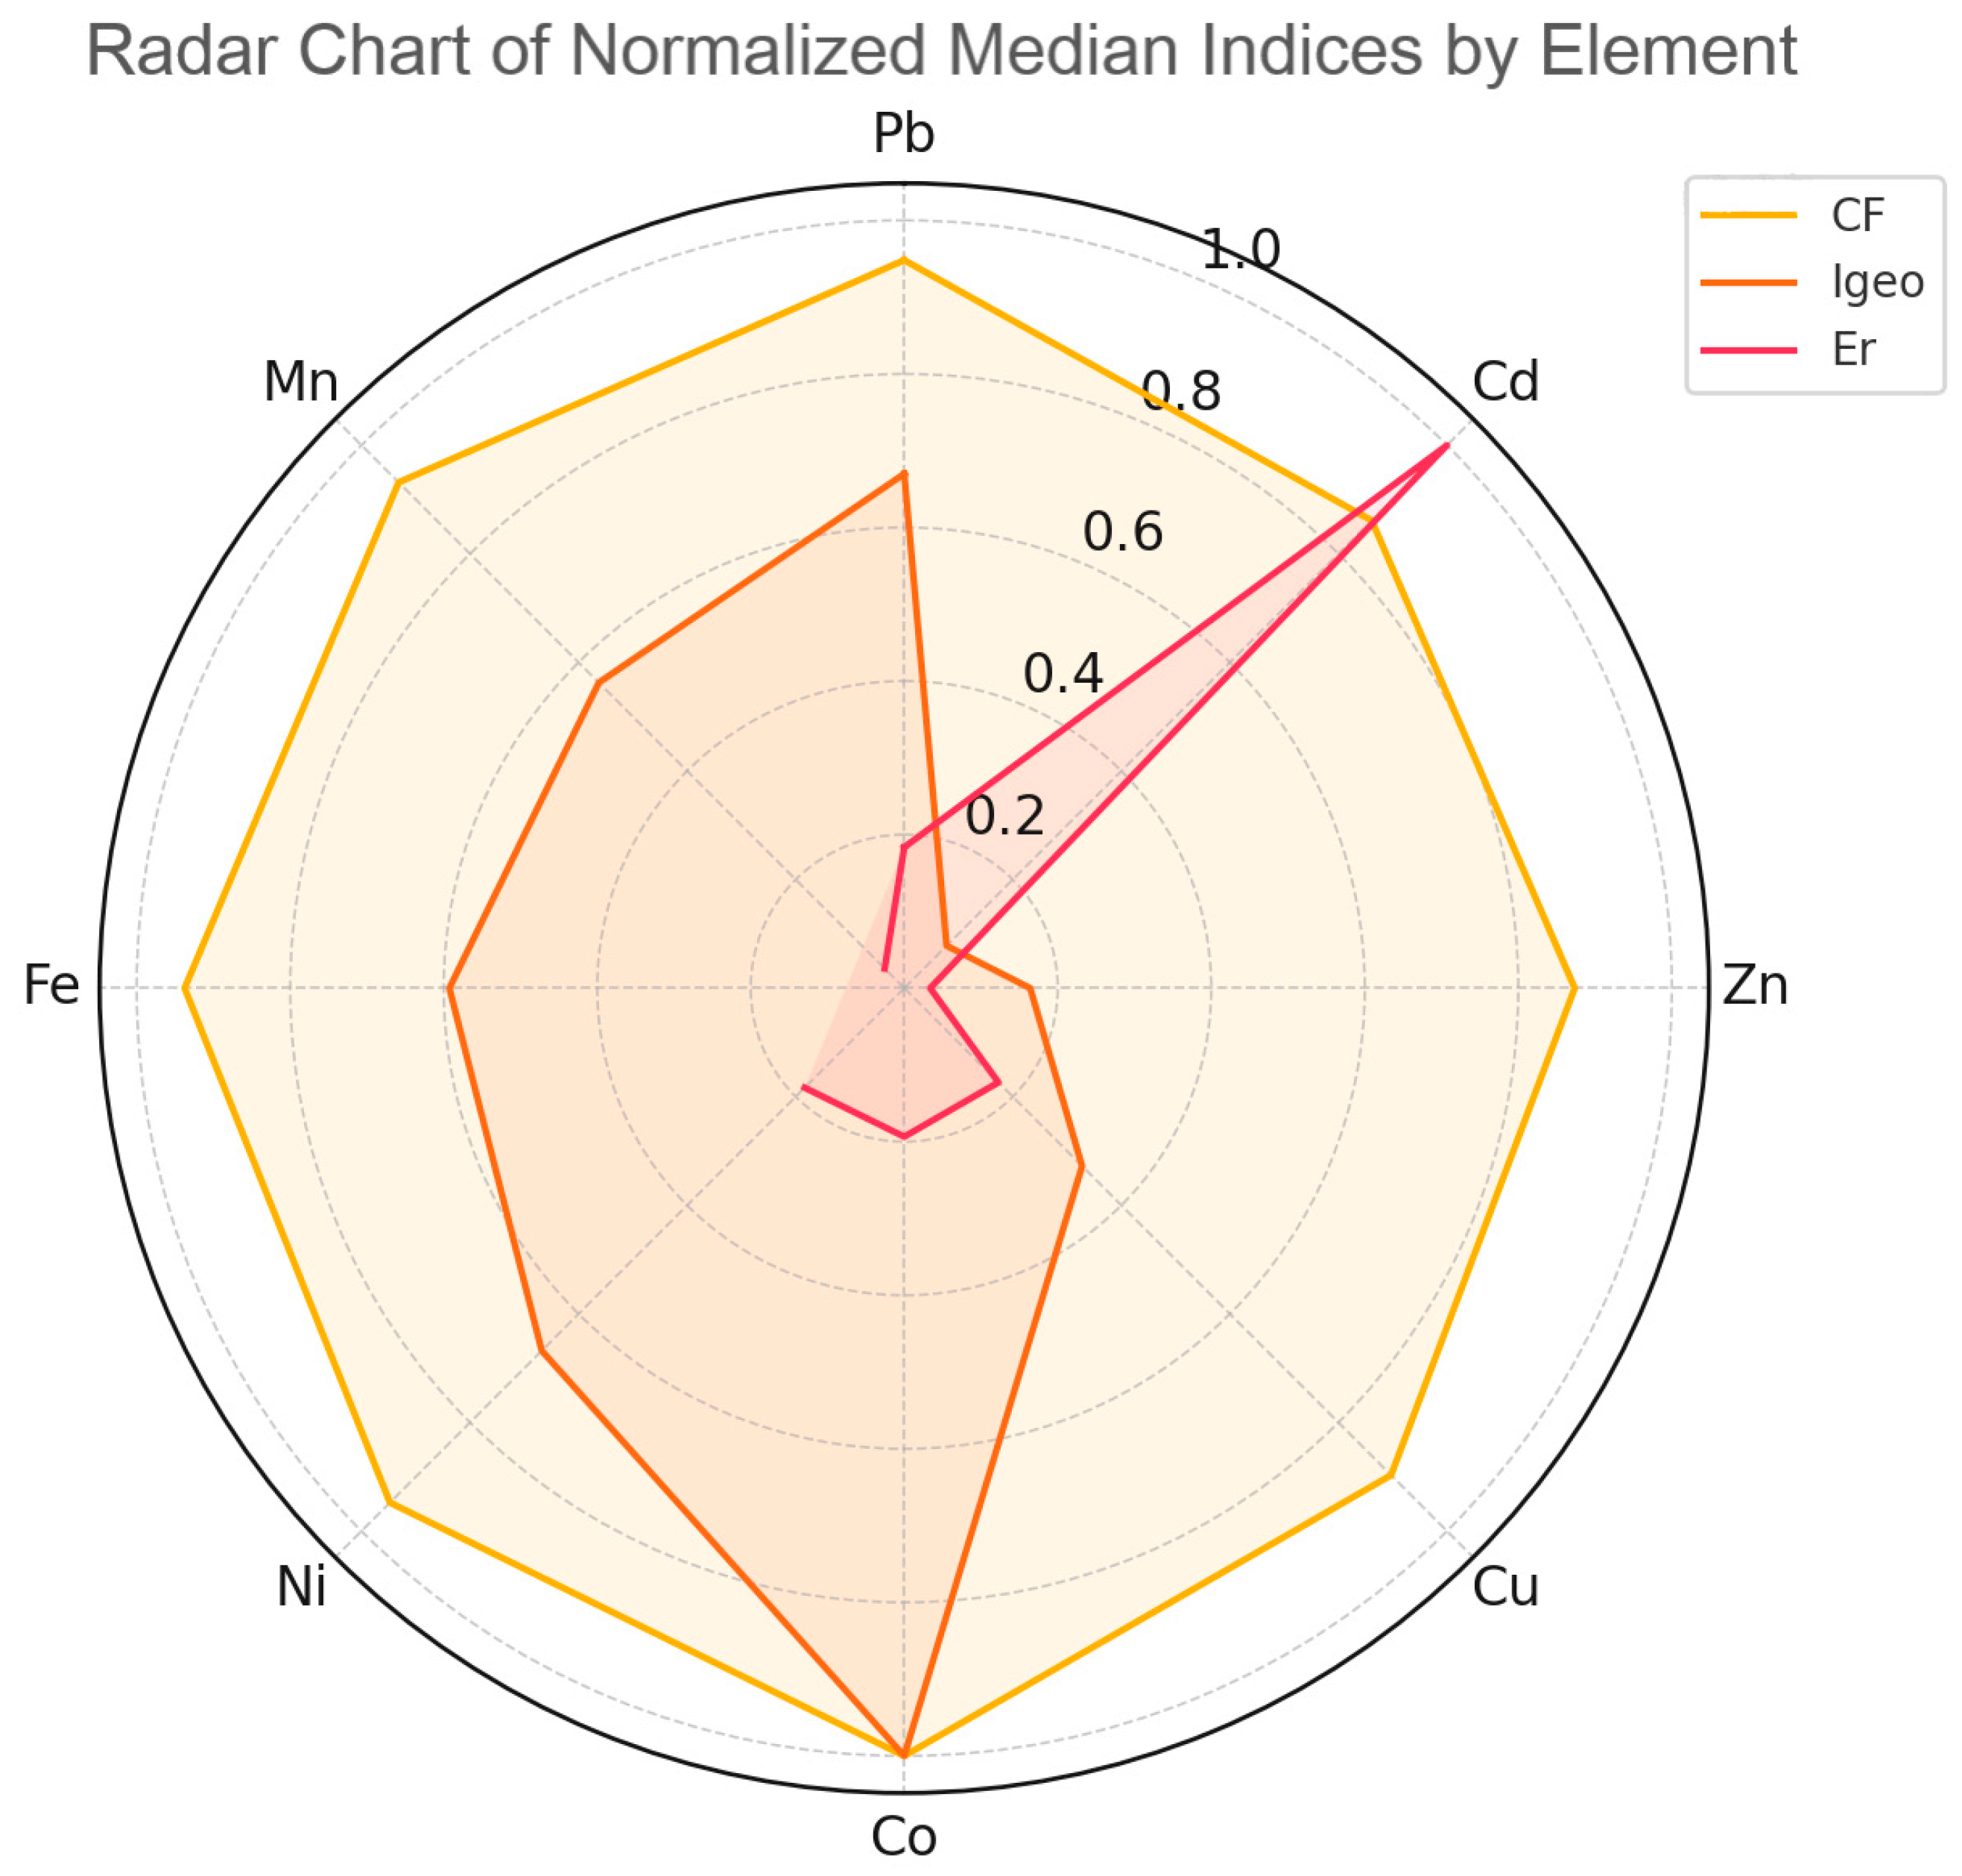
Radar diagrams in
Figure 6 display normalized median values for the Igeo, CF, and Er indices across all elements and districts. These profiles help visualize multi-metal contamination trends and identify districts with elevated ecological risks.
Overall, the study revealed that although all districts exhibit pollution exceeding background levels (PLI > 1), the magnitude and composition of contamination vary. The Yesil, Atbasar, and Akkol districts show the highest cumulative burden, driven in part by cadmium, which consistently displayed the highest ecological risk. The use of multiple indicators—such as PLI, Igeo, Er, and CF—provided a multidimensional view of contamination levels and sources, facilitating robust ecological interpretation. These findings offer a basis for prioritizing remediation or monitoring strategies across different districts in line with sustainable land management goals.
4. Discussion
4.1. Interpretation of Pollution Indices
To assess the ecological and geochemical state of soils in the Akmola region, several standardized indices were employed. These indicators are widely used to quantify contamination levels, potential risks, and anthropogenic impacts on the environment:
The geoaccumulation index (Igeo), proposed by Müller (1979), classifies soil pollution based on the deviation from natural background concentrations. It includes the following categories: ≤0 (unpolluted), 0–1 (slightly polluted), 1–2 (moderately polluted), 2–3 (heavily polluted), 3–4 (very heavily polluted), and >5 (extremely polluted) [
35].
The ecological risk index (Er), introduced by Hakanson (1980), estimates the potential environmental impact of heavy metals, factoring both concentration and toxicity. Values < 40 indicate low risk, 40–80 medium, 80–160 significant, and >160 high ecological risk [
34].
The contamination factor (CF) describes the degree of contamination relative to background levels. A CF < 1 suggests low contamination, 1–3 moderate, 3–6 significant, and >6 very high pollution [
40].
The pollution load index (PLI) is an integrated indicator summarizing overall soil contamination. A value of PLI = 1 reflects baseline levels, PLI < 1 indicates clean soil, and PLI > 1 denotes contaminated conditions [
38].
The integrated pollution index (Zc) reflects the total pollution load in a region. Values < 16 suggest permissible pollution, 16–32 moderate pollution, and ≥32 indicate hazardous levels [
41].
The pollution load index (PLI) values indicated that soils in all districts experienced pollution above background levels, with the highest levels recorded in the Yesil, Atbasar, and Akkol districts. These values reflect a significant technogenic impact, which may be associated with intensive land use, fertilizer application, or proximity to transportation infrastructure. These regions were heavily involved in agricultural expansion during the Virgin Lands Campaign, supporting the hypothesis that historical land use significantly contributed to heavy metal (HM) accumulation [
34].
The high PLI values observed in the Atbasar and Yesil districts suggest the influence of similar pollution factors, both natural and anthropogenic. This may be linked to intensive agricultural activities and the natural geochemical background enriched with elements such as Ni, Cu, and Zn [
42,
43].
The Akkol district demonstrated an average PLI value of 7.224, indicating a moderate pollution level. Elevated concentrations of Co and Mn may reflect the natural geochemical heterogeneity of the parent rock or the influence of agrochemical inputs. Although the PLI value exceeds the threshold, it does so to a relatively lesser extent. Lower concentrations of Cu and Pb in this district may be explained by reduced anthropogenic pressure or specific features of the soil profile (
Table 2) [
44].
4.2. Spatial Patterns of Heavy Metal Contamination
Ecological and geochemical assessment of the steppe soils in the Akmola region reveals spatial differences in pollution patterns and ecological risks from heavy metal (HM) contamination.
The analysis of HM content (Pb, Cd, Zn, Cu, Co, Ni, Fe, and Mn) showed that overall contamination levels are relatively low. According to the median values of the geochemical pollution index (Igeo), pollution levels fall within the range of ≤0 to 0.07, indicating a status of “unpolluted” to “slightly polluted” (
Table 3). This classification is based on Müller’s scale for Igeo values [
35].
The ecological risk index (Er) showed that cadmium poses the highest environmental hazard (Er = 22.788), despite its low absolute concentration. This is due to Cd’s high toxicological coefficient and mobility in the soil environment. Although classified as a “low risk” (Er < 40), cadmium still warrants close attention.
All other elements had Er values below 40, placing them within the “low ecological risk” category (
Table 4), as defined by Hakanson’s classification [
34].
All other elements exhibited Er values below 40, corresponding to a low ecological risk category (
Table 4).
The contamination factor (CF) values for all investigated elements were less than 1, indicating only minor pollution levels. According to the classification scale [
35], CF values < 1 represent low contamination, which is consistent with predominantly lithogenic sources of heavy metals and minimal anthropogenic influence (
Table 5).
The pollution load index (PLI) ranged from 4.937 to 7.880 across districts, significantly exceeding the threshold value of 1, which indicates pollution above background levels. This confirms cumulative soil contamination, especially in the Yesil, Atbasar, and Akkol districts, where agricultural intensification and historical land use are likely contributors. These results align with the PLI classification scale proposed by Tomlinson et al. [
40] (
Table 6).
Despite high PLI values, the integral pollution index (Zc) showed negative values for all districts. This suggests that, when considering the total load relative to background concentrations, there is no severe exceedance, and the soils remain within permissible pollution levels (Zc < 16) (
Table 7), based on standards used in ecological risk assessment studies [
40].
Overall, the results indicate that the steppe soils of the Akmola region are in a conditionally stable ecological state, although localized pollution is observed, primarily associated with cadmium content. Continued monitoring is necessary, especially regarding cadmium and lead concentrations.
4.3. Inter-Element Correlations and Cluster Structure
To explore inter-element relationships, a heatmap was constructed to display correlations between the concentrations of HMs in the soil. Correlation coefficient ranged from +1 to −1, with a value of 0 indicating no linear relationships. Correlation analysis of heavy metals in the Akmola region revealed both positive and negative relationships between the elements. The discrepancy between these values shows the heterogeneity of their origin, behavior in the soil environment, and possible sources of entry.
The most pronounced negative correlation (
Figure 4) was observed between Pb and Cu, suggesting an inverse proportionality: areas with elevated Pb levels tend show reduced Cu concentration. This may reflect a difference in their sources: lead is associated with anthropogenic pollution, particularly from transportation [
45,
46,
47], while Cu is more likely of geogenic origin, influenced by the use of copper-containing fertilizers.
A strong negative correlation was also found between Cd and Co, with r = −0.66, where higher cadmium concentrations corresponded with lower Co levels. This may be attributed to competitive sorption processes or variation in geochemical environments, where one element displaces the other within the soil profile. Similar trends have been observed noted in other steppe and industrial regions [
48].
In contrast, Co and Mn displayed a moderate positive correlation (r = 0.67), which may indicate a shared lithogenic origin or joint migration behavior, as both are common constituents of mafic and ultramafic rocks and oxides in soil [
44].
4.4. Integrated Risk Visualization Using Radar Plots
Multivariate statistical techniques were used to identify patterns in the distribution of heavy metals across the Akmola region. The dendrogram (
Figure 5a) and PCA biplot (
Figure 5b) revealed spatially coherent clusters based on similarities in metal concentration profiles.
The hierarchical clustering analysis separated the five districts into three main groups:
Akkol and Ereymentau were grouped together in the first cluster, indicating similar contamination profiles. This cluster was characterized by moderate levels of Mn and Co, which likely reflect shared lithological backgrounds and agrochemical inputs. Such grouping has been associated with moderately altered soils due to mixed geogenic and anthropogenic sources [
40,
41,
44,
49].
Atbasar and Yesil formed the second cluster, reflecting relatively high concentrations of Cu, Ni, and Zn. Their close proximity in the dendrogram suggests a common geochemical environment and intensive land-use histories. This aligns with areas affected by the Virgin Lands Campaign, where long-term cultivation and fertilization practices have contributed to the accumulation of metals [
38].
Egindikol stood apart as a distinct cluster. The PCA analysis showed it projecting separately along the PC2 axis, suggesting a unique metal distribution pattern, particularly due to elevated levels of Cd and Mn. This pattern may reflect specific local factors such as lithology or unique agro-technical practices [
34,
35].
The PCA analysis supported these groupings, with PC1 (44.1%) and PC2 (29.0%) accounting for a combined 73.1% of the total variance. The spatial separation observed confirms the heterogeneity of metal sources and behaviors across the region.
These results offer a scientifically grounded basis for regional monitoring: areas like Egindikol may require more targeted ecological risk assessment, while Atbasar and Yesil demonstrate cumulative impacts likely associated with long-term anthropogenic activity. Multivariate analysis thus complements traditional indices (Igeo, CF, Er, PLI, and Zc) and enhances spatial understanding of pollution dynamics.
In the dendrogram. the Egindikol and Akkol districts formed a stable cluster at the lowest Euclidean distance. indicating a high degree of similarity in their HM contamination profile. This is likely due to the similar soil-forming parent materials and comparable anthropogenic inputs. particularly from agriculture [
45]. Both districts exhibited elevated concentrations of Mn and Cd suggested common pollution sources [
46].
The Ereymentau district clustered next with Egindikol and Akkol, reflecting a moderate level of similarity. The concentrations of Co and Pb indicate an intermediate nature of pollution, which allows us to consider Ereymentau as a transition zone between groups with different levels of anthropogenic impact [
43].
A separate cluster comprised the Yesil and Atbasar districts, which showed similar concentrations of Zn, Ni, and Cu. This may be due to the geochemical homogeneity of soils and similar natural background conditions, as well as comparable forms of land use [
50].
The PCA results supported these clustering results. The Atbasar and Yesil districts grouped closely the PC1–PC2 space. while Akkol and Ereymentau also showed proximity, reflecting similar derivations in Mn and Cd. The Egindykol district demonstrates as a distinct outlier along the PC2 axis, indicating a unique pollution profile.
Combined PCA and hierarchical clustering successfully identified spatially coherent groups with differing pollution levels and compositions. The principal component analysis allowed us to identify zones of the greatest dispersion and visualize the main directions of differences. The results obtained can be effectively applied to substantiate priority zones for environmental monitoring and to plan soil remediation activities [
46].
Figure 6 presents a radar diagram displaying the normalized median values of the geochemical pollution index (Igeo), the contamination factor (CF), and the ecological risk index (Er) for HMs in Akmola region soils.
Cd demonstrates the highest value of ecological risk. However, the average value of cadmium concentration is low, which is due to its extremely high toxicological coefficient (30) and high mobility in the soil environment. Such indicators confirm the data of previous studies, in which Cd is classified as one of the most dangerous soil pollutants, even at minimal concentrations [
34,
47].
The radar diagram (
Figure 6) provides a comprehensive visualization of the normalized median values of three key indices—the geochemical index (Igeo), contamination factor (CF), and ecological risk index (Er)—for each heavy metal across the studied districts. This representation highlights the relative behavior of individual elements and their contribution to ecological risk.
Cadmium (Cd) exhibits the highest value for the ecological risk index (Er), despite its low average concentration. This reflects its extremely high toxicological response factor (Tr = 30), high bioavailability, and mobility in the soil. These characteristics make Cd a priority pollutant in environmental monitoring, as even trace concentrations can pose significant ecological risks. Similar findings have been reported in other steppe regions, supporting Cd’s classification as one of the most hazardous soil contaminants [
34,
47].
Co, Ni, and Fe show elevated Igeo and CF values, suggesting geogenic sources due to the composition of soil-forming rocks in the Akmola region [
40,
48]. However, their Er values remain low, indicating that their ecological threat is limited under current conditions. These elements are typically less mobile and often form stable complexes in slightly alkaline and carbonate-rich soils.
Pb demonstrates moderate values for both Igeo and CF, implying notable anthropogenic input, likely from vehicular emissions and industrial activities. Yet, its Er remains within a moderate range, due to the relatively low solubility and mobility of Pb in carbonate soils [
51,
52,
53].
Cu and Zn present balanced values across all three indices. Their presence in the soil likely results from a combination of natural mineral weathering and anthropogenic contributions, such as the use of fertilizers and pesticides. Their ecological impact depends largely on their chemical form and bioavailability [
54,
55].
Mn is characterized by consistent, moderate index values, suggesting a stable geochemical behavior. It is an essential micronutrient and is primarily lithogenic in origin in the study area, with accumulation patterns strongly influenced by the mineral composition of parent rocks [
56].
Overall, the radar diagram illustrates that while most elements are within acceptable geochemical and ecological risk thresholds, cadmium remains a standout risk factor. The integration of multiple indicators helps identify priority areas and pollutants for remediation and future monitoring.
4.5. Conclusion to Discussion
The integrated analysis of geochemical and ecological indices confirms that the steppe soils of the Akmola region are exposed to varying levels of anthropogenic and natural heavy metal inputs. Although the pollution load index (PLI) values exceed the background threshold in all districts, the low values of the ecological risk index (Er) and contamination factor (CF) and the negative values of the integrated pollution index (Zc) indicate that overall contamination remains within acceptable ecological limits. Cadmium stands out as the primary risk element due to its high toxicity and mobility, despite its low concentrations.
Spatial and statistical analyses, including correlation matrices, hierarchical clustering, and principal component analysis (PCA), reveal distinct contamination profiles and geochemical patterns among districts. These findings support the need for targeted monitoring—particularly in Yesil, Atbasar, and Egindikol—where localized pollution or distinct geochemical signatures suggest potential hotspots for environmental risk.
This multi-index approach provides a comprehensive framework for assessing soil quality and can inform future environmental management strategies, including the prioritization of remediation areas and sustainable land-use planning.
5. Conclusions
This study presents a comprehensive environmental assessment of heavy metal pollution in steppe soils of the Akmola region using pollution indices and multivariate statistical methods. The results revealed spatial variability of pollution levels in six districts. with the highest pollution load index (PLI) values observed in the Yesil and Atbasar districts. Cadmium (Cd), despite its low concentration, was identified as the most environmentally hazardous element due to its high toxicological coefficient. highlighting the importance of considering element-related risks when assessing environmental conditions.
The combination of the Igeo, CF, Er, PLI, and Zc indices, along with PCA and cluster analysis, allowed for the identification of both natural and anthropogenic sources of pollution. The classification of areas into distinct clusters based on pollution profiles provides a practical basis for soil management and site-specific policy interventions.
The results of the study showed a relationship between the spatial distribution of pollution and the historical development of virgin lands. The highest pollution values are observed in areas actively involved in agricultural turnover during the Virgin Lands Development Campaign. The data obtained show a significant impact of intensive agricultural exploitation on the ecological state of soils. This emphasizes the need to integrate historical and geographical analyses into environmental monitoring and decision making on sustainable land management.
The results highlight the need for targeted soil monitoring programs in regions with intensive agricultural activities and demonstrate the usefulness of integrated assessment tools to support sustainable land-use planning. Further research should focus on metal bioavailability, their transport to crops, and long-term ecological impacts to develop land restoration strategies and ensure food security in semi-arid ecosystems.


 ,
, 
