Article

Variability of Summer Drought and Heatwave Events in Northeast China

School of Chemical and Environmental Engineering, Liaoning University of Technology, Jinzhou 121001, China
*
Author to whom correspondence should be addressed.
Sustainability 2025, 17(14), 6569; https://doi.org/10.3390/su17146569
Submission received: 21 May 2025 / Revised: 12 July 2025 / Accepted: 16 July 2025 / Published: 18 July 2025

Abstract

As global climate change intensifies, extreme climate events are becoming more frequent, presenting significant challenges to socioeconomic systems and ecosystems. Northeast China, a region highly sensitive to climate change, has been profoundly impacted by compound drought and heat extremes (CDHEs), affecting agriculture, society, and the economy. To evaluate the characteristics and evolution of summer CDHEs in this region, this study analyzed observational data from 81 meteorological stations (1961–2020) and developed a Standardized Temperature–Precipitation Index (STPI) using the Copula joint probability method. The STPI’s effectiveness in characterizing compound drought and heat conditions was validated against historical records. Using the constructed STPI, this study conducted a comprehensive analysis of the spatiotemporal distribution of CDHEs. The Theil–Sen median trend analysis, Mann–Kendall trend tests, and the frequency of CDHEs were employed to examine drought and heatwave patterns and their influence on compound events. The findings demonstrated an increase in the severity of compound drought and heat events over time. Although the STPI exhibited a slight interannual decline, its values remained above −2.0, indicating the continued intensification of these events in the study area. Most of the stations showed a non-significant decline in the Standardized Precipitation Index and a significant rise in the Standardized Temperature Index, indicating that rising temperatures primarily drive the increasing severity of compound drought and heat events. The 1990s marked a turning point with a significant increase in the frequency, severity, and spatial extent of these events.

1. Introduction

Amid accelerating climate change, the increasing frequency and cascading impacts of extreme weather events present unprecedented challenges to sustainable development. Among these, compound drought and heat extremes (CDHEs)—synergistic climate phenomena characterized by the simultaneous occurrence of drought and extreme heat—have emerged as critical risk multipliers, exacerbating vulnerabilities across interconnected water, food, and energy systems [1]. The Intergovernmental Panel on Climate Change Sixth Assessment Report highlights that CDHEs are becoming increasingly probable under warming scenarios, thereby intensifying systemic risks that impede progress toward the Sustainable Development Goals (SDGs), particularly SDG 2 (Zero Hunger) and SDG 6 (Clean Water and Sanitation) [2,3,4,5]. China, as a climate-sensitive region, has experienced a warming rate exceeding the global average since the 20th century [6], thereby increasing its vulnerability to compound climate hazards. This trend aligns with the growing emphasis in sustainability science on “compound risks”, wherein interacting extremes strain adaptive capacities and undermine socio-ecological resilience [7]. The socioeconomic consequences of CDHEs in China exemplify this phenomenon, with direct economic losses substantially exceeding global averages and triggering cascading failures across agricultural production, water security, and energy infrastructure [8]. For example, the 2006 Sichuan–Chongqing CDHE resulted in losses amounting to CNY 19.26 billion, 95% of which were in the agricultural sector [9], while the 2022 event in the Yangtze River Basin—the most severe in five decades—led to widespread declines in crop yields and freshwater availability, affecting millions [10]. Addressing such compound challenges requires the integration of risk management frameworks into national climate adaptation strategies. While China’s 2035 Climate Resilience Strategy represents a vital policy milestone, the evolving nature of CDHEs underscores the need for innovative assessment tools [11]. To support the operationalization of sustainability goals, this study proposes a novel Standardized Temperature–Precipitation Index (STPI) to quantify the severity of CDHEs in Northeast China—a major agricultural region increasingly vulnerable to compound climate extremes. Developed through a sustainability lens, the STPI provides a refined metric for evaluating and mitigating compound risks. By integrating climate science with sustainable development objectives, this study aims to explore a novel compound dry heat index to assess the intensity of CDHEs across different regions.
Meteorological drought, often a precursor to other drought types, has been extensively studied [12,13,14,15,16,17]. Drought indices—variables used to characterize meteorological drought—are typically developed within specific spatiotemporal contexts, leading to regional variations. Currently, there are 55 commonly used drought indices. Palmer et al. [18] combined surface precipitation, soil moisture, and potential evapotranspiration to develop the Palmer Drought Severity Index. However, its limitations include computational complexity, challenges in parameter acquisition, and fixed temporal scales. McKee et al. [19] proposed the Standardized Precipitation Index (SPI), which integrates precipitation data across different timescales to assess drought. Nevertheless, it is limited by its reliance on precipitation as the sole variable influencing drought. Additionally, the increasing frequency of heatwave events has prompted the World Meteorological Organization to define heatwaves using absolute temperature thresholds, classifying temperatures ≥ 35 °C or 32 °C as high. Periods exceeding three consecutive days at these temperatures are categorized as heatwaves [20]. In recent years, scholars have begun investigating composite indices that integrate drought and heatwave indicators. For example, Li et al. [21] employed a Copula model to integrate the daily Standardized Antecedent Precipitation Evapotranspiration Index with the Standardized Temperature Index (STI) to develop the Standardized Compound Dry and Heat Index. Hao et al. [22] used empirical distribution theory to develop the Standardized Drought–Heat Index (SDHI) by combining the ratio of SPI to STI. However, much of the current research on CDHEs focuses on national or global scales, with few fine–scale regional studies. Considering the sensitivity of compound drought and heat indices to regional contexts, applying the same methods across different areas may lead to variable conclusions. Thus, CDHEs continue to represent a critical area of research in the study of extreme weather events.
Northeast China, situated in a mid-latitude, arid, and cold climate zone, is particularly vulnerable to climate change. The region frequently experiences droughts and extreme high-temperature events, rendering it a hotspot for CDHEs [23]. As a major grain-producing region in China, Northeast China is especially affected by the increasing frequency of CDHEs, which have caused significant reductions in crop yields. Studies indicate that under CDHE conditions, the likelihood of crop losses increases by 8–11% compared to that of moderate drought conditions [24]. Using daily precipitation and maximum temperature data from 82 meteorological stations across the three northeastern provinces from 1961 to 2020, this study characterizes drought and heatwave intensities through total monthly precipitation and average monthly maximum temperature, respectively. The Copula function is subsequently applied to construct a two-dimensional joint cumulative probability distribution of drought and heatwave intensities at each station, thereby developing the STPI. Alongside the SPI and STI, this study further analyzes the spatiotemporal variation characteristics of CDHEs in Northeast China. This study’s findings contribute a valuable tool for monitoring compound extreme climate events in the region and provide scientific support for the development of climate change adaptation strategies.

2. Materials and Methods

2.1. Study Area and Data Sources

This study focused on Northeast China (38°41′ N–53°33′ N, 118°50′ E–135°4′ E), encompassing the provinces of Heilongjiang, Jilin, and Liaoning. Meteorological data were obtained from the China Meteorological Data Sharing Service (https://data.cma.cn/, accessed on 31 December 2020) and comprised daily observations recorded during the summer months (June, July, and August) from 186 national standard meteorological stations across the region for the period 1961 to 2020. The dataset included daily maximum temperature and monthly precipitation total. During data preprocessing, the continuity of records from each meteorological station was assessed, and stations with cumulative data gaps exceeding one week were excluded. Consequently, 81 stations with complete data were selected from the original 186, comprising 30 in Heilongjiang, 27 in Jilin, and 24 in Liaoning. The spatial distribution of the study area and meteorological stations is shown in Figure 1.

2.2. Methodology for Calculation of SPI and STI
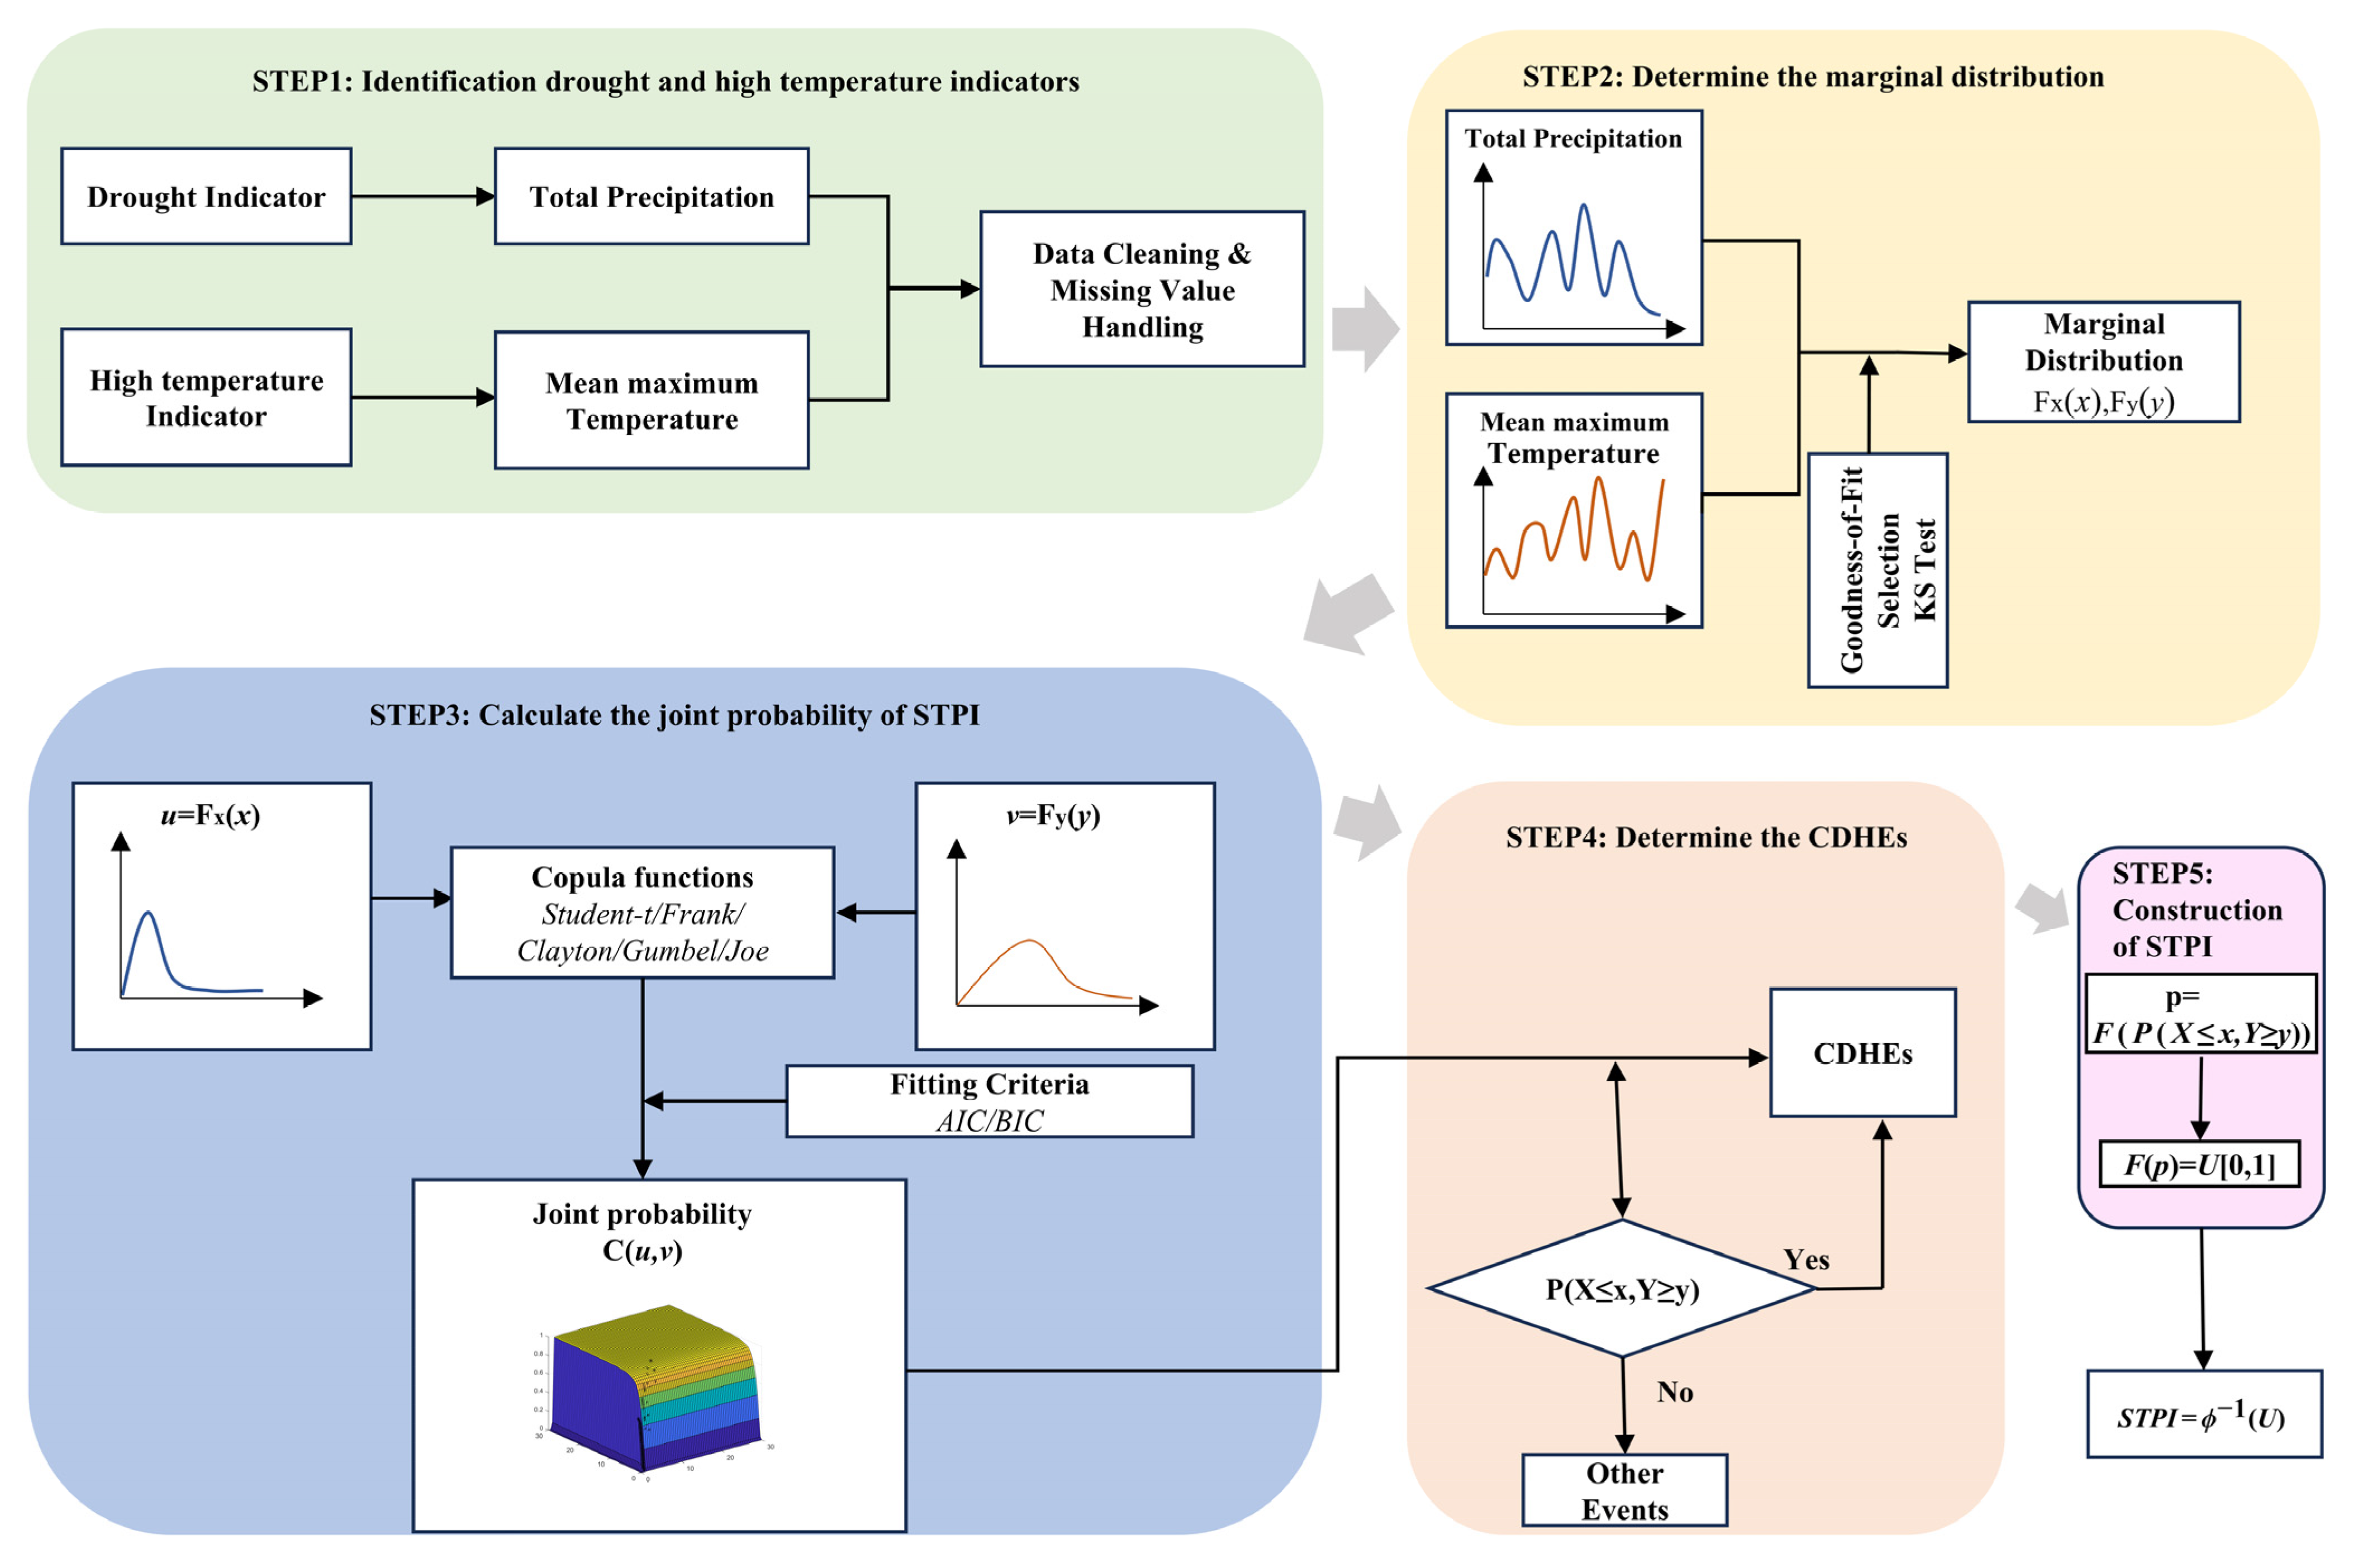
This study employed SPI-3 to investigate drought events in the study area, that is, using the values of SPI-3 in August. SPI is typically calculated using the Gamma distribution [19].
Assuming the summer monthly precipitation for a given time period is denoted by x, the probability density function of the Gamma distribution is [25,26]
g ( x ) = 1 β α Γ ( α ) x α 1 e x β ( x > 0 )
where α is the shape parameter, β is the scale parameter, x is the monthly precipitation, and the Gamma function is
Γ ( α ) = 0 x α 1 e x d x
the maximum likelihood estimates of the parameters α and β are
α = 1 + 1 + 4 A / 3 4 A , β = x 4 A
where A is
A = ln ( x ) 1 n 1 n ln x i
where n represents the sample size, xi denotes the individual monthly precipitation values, and x is the monthly precipitation. The cumulative probability G(x) for a given time scale can thus be calculated as follows:
G ( x ) = 0 x g ( x ) d x = 1 β α Γ ( α ) 0 x α 1 e x β d x
the formula for calculating SPI is as follows:
S P I = ϕ ( G ( x ) )
This study uses the monthly average maximum temperature to calculate the STI, and its calculation process was consistent with that of the SPI. The SPI and STI classes used in this study are presented in Table 1 and Table 2, respectively [27,28].

2.3. STPI

2.3.1. Construction of Indicators for Drought and High Temperatures

Measuring compound events necessitates the development of compound indices. For CDHEs, temperature and precipitation are the primary variables [29]. To identify the most appropriate marginal distributions, this study employed the Kolmogorov–Smirnov (KS) statistic, which assesses the goodness-of-fit between empirical and theoretical distributions [30]. Accordingly, the KS test was applied to evaluate whether the summer high-temperature and drought indices in Northeast China followed a Gamma distribution. The results indicated that all summer precipitation indices passed the KS test (p < 0.05), while only one temperature station failed the test. Based on these findings, the Gamma distribution was adopted as the marginal distribution for both temperature and precipitation. Following the method for constructing the SPI, this study developed a drought indicator as the marginal input for the Copula function. Its construction process is consistent with the process in Section 2.2, Formulas (1)–(5). The construction process for the high-temperature indicators is consistent with that for the drought indicators.

2.3.2. Construction of STPI

With advancements in the study of compound events, scholars have increasingly recognized that single-variable approaches cannot fully capture their complex characteristics. Consequently, a multivariate approach is required to overcome this limitation. However, the stochastic probability distribution functions commonly employed in existing research are typically designed for univariate analyses and are therefore unsuitable for modeling the multivariate nature of CDHEs [31]. The Copula function, based on Sklar’s theorem, enables the combination of multiple one-dimensional marginal distribution functions into a multidimensional joint cumulative probability distribution. This property makes it an effective tool for constructing the cumulative probability distribution function of CDHEs. In this study, the Copula function was applied to model the dependence between the drought and high temperature indicators and to calculate their joint probability distribution. The specific process is illustrated in Figure 2, with the following steps:
(1) Selection of the Optimal Copula Function
To construct a more suitable compound drought and heat index for the study area, five commonly used Copula functions—Student-t, Frank, Clayton, Gumbel, and Symmetrized Joe-Clayton—were selected to establish the bivariate joint probability distribution for each. In selecting the optimal Copula function, information criteria such as the Akaike Information Criterion (AIC) and Bayesian Information Criterion (BIC) offer greater effectiveness than traditional goodness-of-fit tests [32,33]. Accordingly, this study utilized AIC and BIC values to determine the most appropriate Copula function, as summarized in Table 3.
As shown in Table 3, the Student-t Copula distribution function provided the best fit, at 75.6%, followed by the Frank Copula, at 20.3%. Consequently, this study selected the Student-t Copula to construct the STPI.
(2) Determination of the joint distribution function
Let X and Y denote the two random variables corresponding to the SPI and STI, respectively. A CDHE is defined as occurring when one variable X is less than or equal to a threshold x, and, simultaneously, the other variable Y is greater than or equal to a threshold y. The joint cumulative probability p of a CDHE for the two random variables X and Y is expressed as
p = P ( X x , Y y ) = u c ( u , v )
where u and v are the marginal distribution functions of random variables X and Y, respectively, and c(u, v) represents the two-dimensional joint probability distribution. The joint cumulative probability p serves as an indicator, with smaller p values indicating more severe conditions under CDHEs. However, because the marginal distributions typically vary over time and across regions, identical values may not correspond to the same thresholds under compound dry and heat conditions. To address this, the joint probability p was first fitted to the distribution F to eliminate the influence of differences in edge distributions, and was then converted into a uniform distribution. The corresponding formula is as follows [34]:
U = F ( p ) ~ Uniform [ 0 , 1 ]
Subsequently, the uniform distribution was further transformed into a standard normal distribution. This process produced an index that characterizes the CDHEs on a monthly scale. Consequently, the STPI was derived through the inverse–normal transformation of the joint cumulative probability p. The corresponding formula is as follows [35]:
S T P I = ϕ 1 ( U )
where Φ is the standard normal distribution function.
Based on the classification standard of compound dry heat proposed by ULLAH [36], this study defined five types of compound dry heat conditions, including Normal, Slight, Moderate, Severe, and Extreme compound dry heat, as shown in Table 4.

2.4. Mann–Kendall Trend Analysis and Sen’s Slope Estimation

To analyze the temporal distribution of drought and high-temperature events in Northeast China from 1961 to 2020, this study employed the Theil–Sen median trend analysis in conjunction with the Mann–Kendall (MK) test to analyze time series trends. The proposed method does not require the data to follow a specific distribution pattern and is robust against data errors. Additionally, the significance level test enhances the scientific rigor and reliability of the results, increasing their robustness compared to those obtained using other research methods [37].
Theil–Sen median trend analysis is a non-parametric statistical calculation method, and the formula is as follows:
β = M e d i a n ( ( x j x i ) j i ) , j > i
where β represents the median slope of the data; Median refers to the function used to calculate the median values; and x denotes the observation of the dependent variable. In this study, the range satisfies 1961 ≤ ij ≤ 2020, since ij in Equation (9). A value of β > 0 indicates an upward trend in the STPI index, β < 0 indicates a downward trend, and β = 0 signifies a stable trend.
The MK test is a non-parametric statistical method widely used to evaluate the significance of trends in time series data. It is particularly suitable for analyzing non-normally distributed time series, as its testing process is not influenced by data gaps or the underlying distribution. The calculation procedure is outlined below:
S = K = 1 n 1 j = k + 1 n sgn ( x j x k )
sgn ( x j x k ) = 1 x j x k > 0 0 x j x k = 0 1 x j x k < 0
where S is the test statistic used for trend analysis. When the sample size (n) is less than ten, trend determination can directly form S. However, if n exceeds ten, S must be standardized and converted into a Z value [38]. The detailed calculation procedure is presented below:
Z = S 1 var ( S ) S > 0 0 S = 0 S + 1 var ( S ) S < 0
V a r ( S ) = n ( n 1 ) ( 2 n + 5 ) i = 1 m t i ( t i 1 ) ( 2 t i + 5 ) 18
where V a r ( S ) is the standard deviation of S; n is the number of evaluation dates; m is the number of tied groups in the time series; and tᵢ is the number of occurrences of a particular value within a tied group.
If the Z value is positive, it indicates that the STPI exhibits an upward trend. A Z value of zero suggests no significant trend, while a negative Z value indicates a downward trend. In this study, the significance of the MK test statistic (Zc) at the 0.05 confidence level was interpreted as follows: a significant trend change is indicated if |Zc| > 1.96, and no significant trend if |Zc| ≤ 1.96 [39]. The formula for calculating the p-value of a significant trend is as follows:
p = 2 × ( 1 ϕ ( Z ) )
where ϕ is the standard normal cumulative distribution function. If p < 0.05, the trend is considered significant [40].
The UF statistic measures the difference between the numbers of increasing and decreasing extremes in a data series. Based on this, the variable UF(S) is defined as follows:
U F ( s ) = [ S E ( s ) ] V a r ( s )
The UB statistic was used to measure the time interval between extremes. By defining the reverse sequence X′ = {Xn, Xn−1, …, X1}, the calculation process described above was repeated to obtain the trend sequence UF′(S), where UB(S) is
U B ( S ) = U F ( S )
The intersection of UF and UB indicates the mutation point in the time series.

2.5. Hit Rate

The hit rate was initially introduced in machine learning to evaluate recognition efficiency and was subsequently gradually adopted in meteorology. This study applied the hit rate to evaluate the performance of STPI [41,42]. Specifically, for the summers (June, July, and August) of 81 sites in Northeast China, months in which both STI > 0.5 and SPI < −0.5 were satisfied simultaneously were defined as months of CDHEs. These months formed the total sample set. Subsequently, STPI index values for the same summer months at the 81 stations were calculated as classification samples. If the STPI index also identified the occurrence of CDHEs during these months (i.e., STI, SPI, and STPI all indicate the presence of CDHEs), it was considered a successful hit (TN). If the STPI failed to identify the CDHE during the same period, it was classified as a missed identification (FN).
H R = T N T N + F N
A higher hit rate indicates greater effectiveness of the compound dry heat index in identifying CDHEs during the summer months in Northeast China.

2.6. Compound Dry and Heat Frequency

The method was used to evaluate the frequency of CDHEs at each station over a specified time period.
F i = ( n / N ) × 100 %
where subscript i denotes the station number; N is the length of the time series; and n is the number of occurrences of different drought severity levels in the time series. The specific classification criteria are provided in Table 1, Table 2 and Table 4.

3. Results

3.1. Drought Analysis

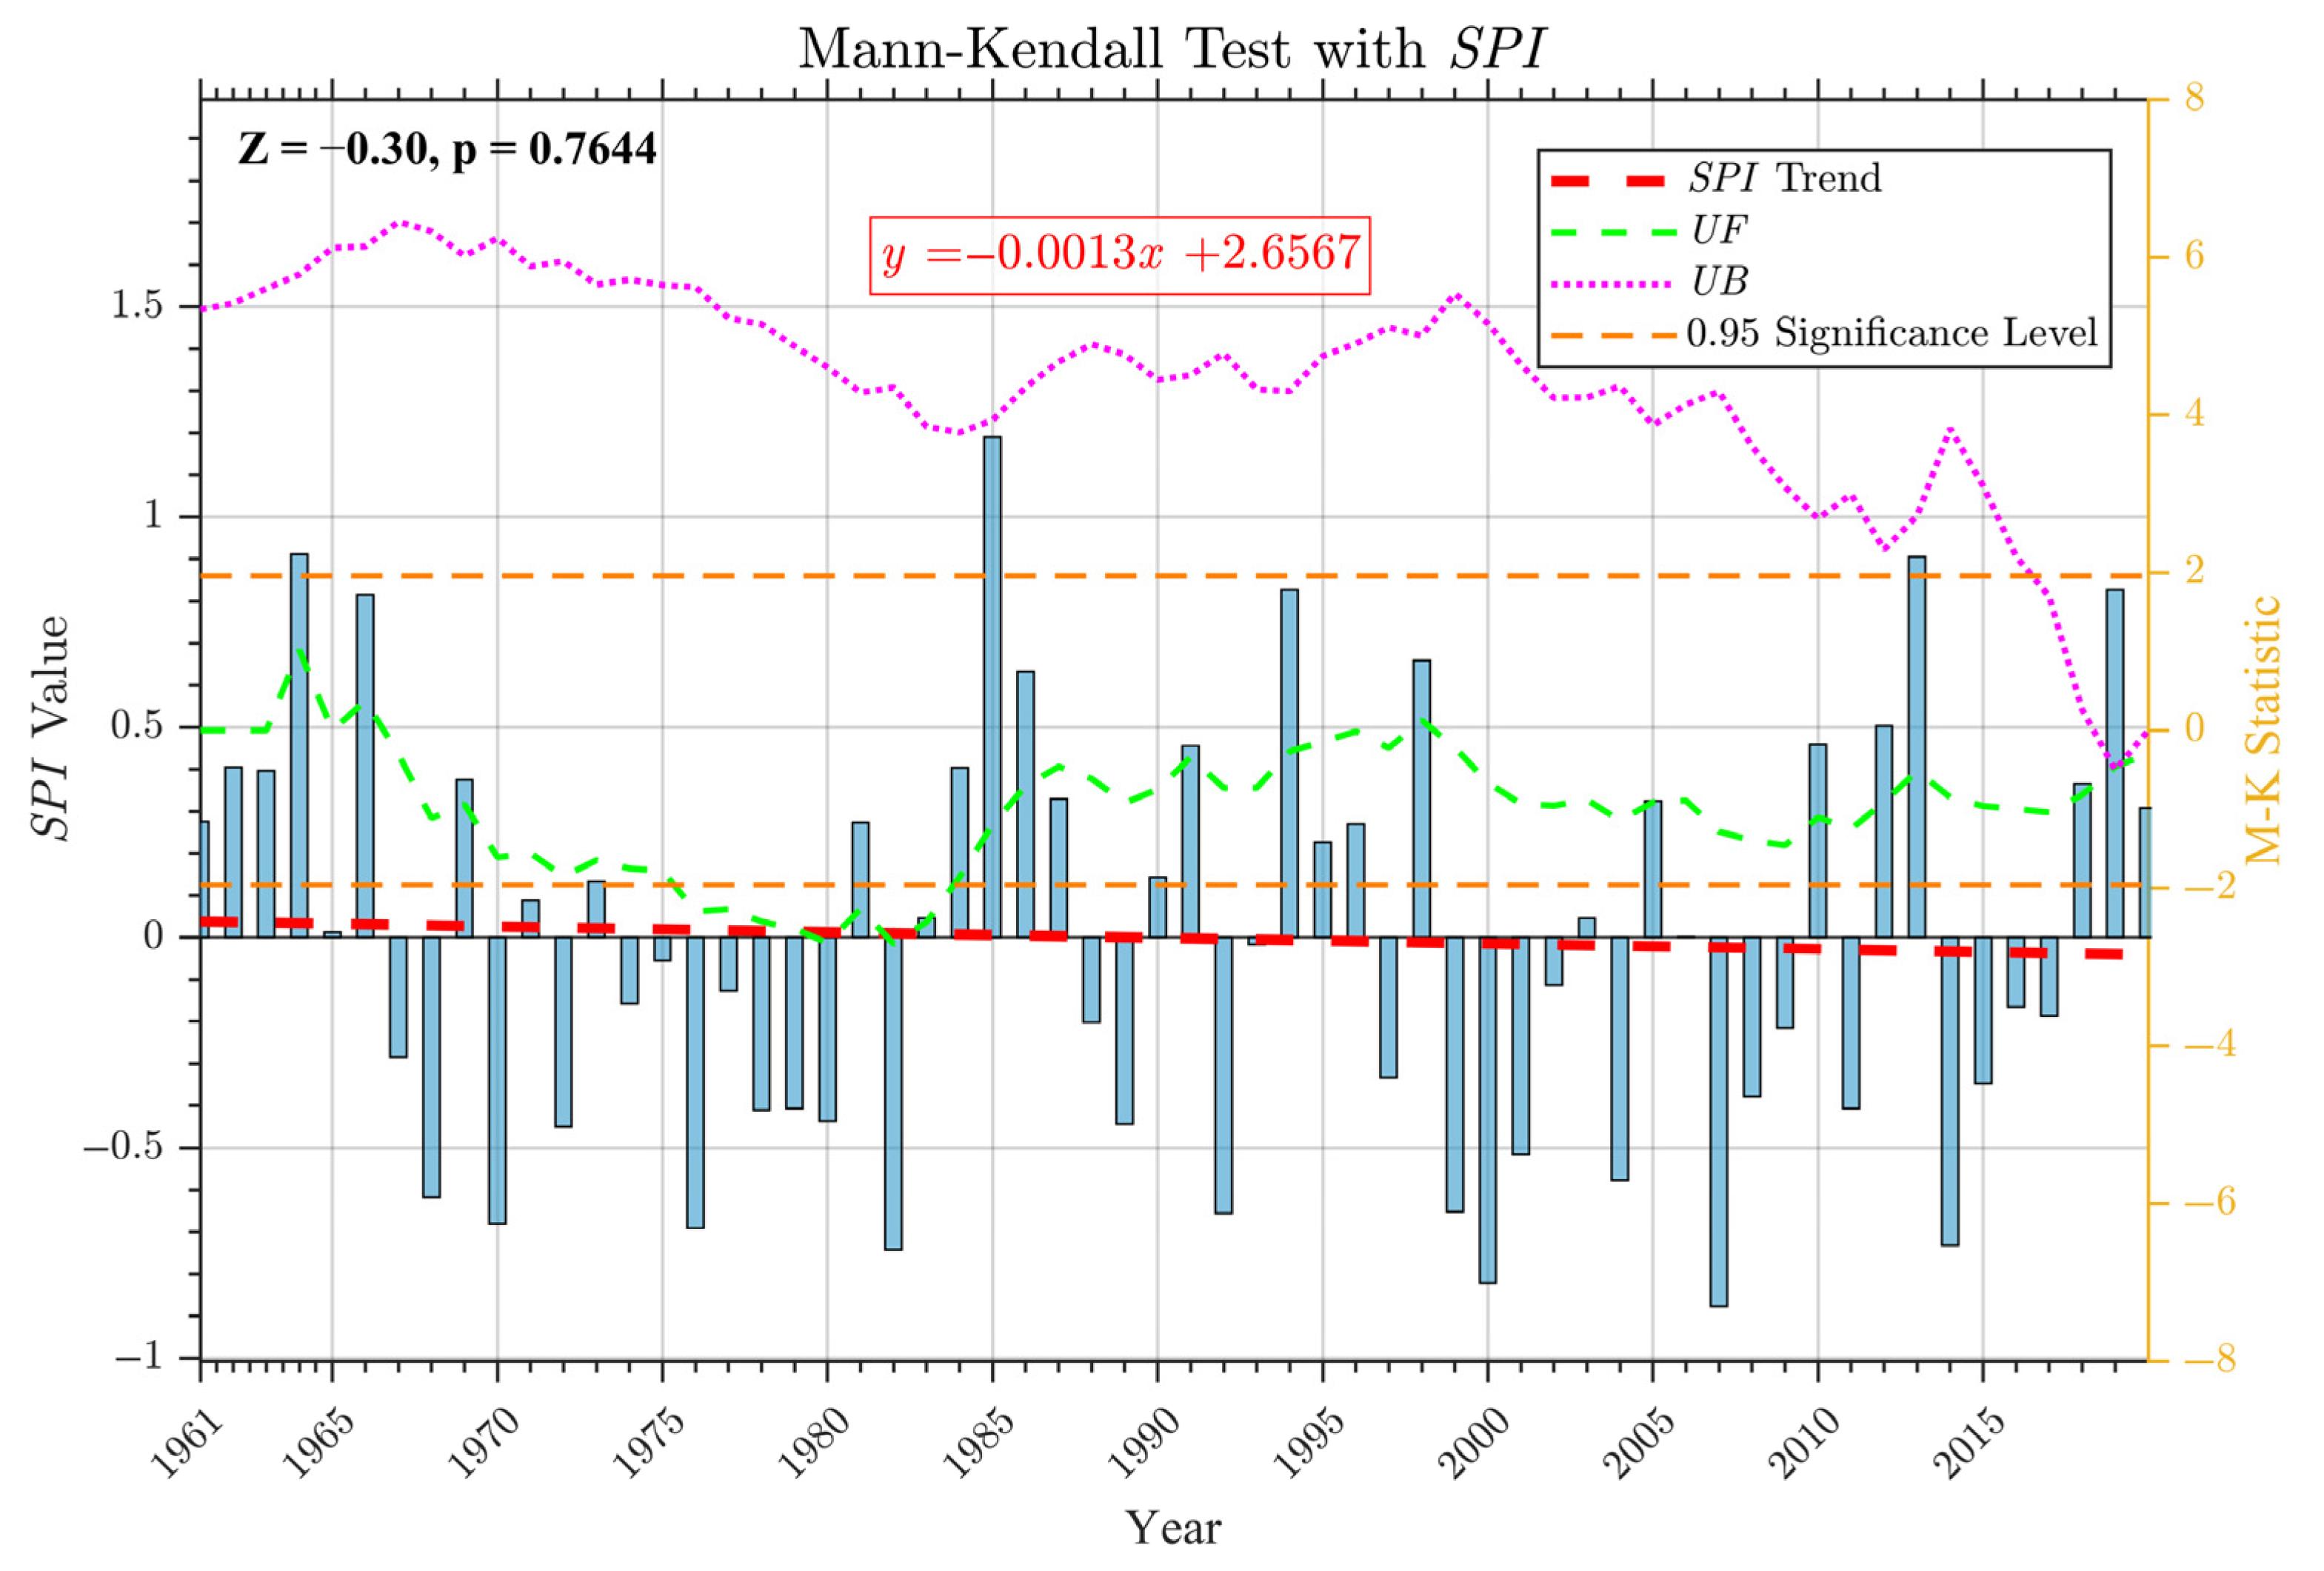
3.1.1. Drought Temporal Trend

This study calculated the summer SPI (SPI-3) for Northeast China from 1961 to 2020 and employed the MK test to analyze temporal trends (Figure 3). The results demonstrated that SPI values in Northeast China remained relatively stable over the study period, with a linear, slight declining trend of 0.0013 per year, fluctuating between −1 and 1.3. Combined with the MK test, the Z-value was −0.3, suggesting a potential downward trend; however, the p-value was 0.76, which failed the significance test (p < 0.05). Taken together, these results indicate that the SPI exhibited a non-significant decreasing trend during the study period. During the periods from 1967 to 1997 and 1999 to 2020, the UF values were consistently below zero, indicating a downward trend in SPI values. However, during the period from 1967 to 1982, the UF value was consistently below zero and showed a slow declining trend, indicating that the aridification process was accelerating during this period; during the period from 1982 to 1997, the UF value remained below zero but showed a slow upward trend, indicating that the aridification process slowed down during this period; during the period from 1999 to 2020, the UF value remained below zero and fluctuated continuously, indicating that the aridification process stabilized during this period. Notably, between 1976 and 1982, the UF value was less than −1.96, indicating a significant decline in SPI during this period. In contrast, between 1961 and 1966, UF values consistently exceeded zero, suggesting an overall increasing trend in SPI values. However, this trend does not imply the absence of drought events. At the critical 0.05 significance level, the UF and UB curves intersected around 2019, indicating abrupt shifts in wet and dry conditions.
To further characterize drought occurrence in Northeast China, this study analyzed the proportion of stations experiencing drought events of varying severity levels from 1961 to 2020 (Figure 4). As shown in Figure 4, the occurrence of drought events across different intensity categories exhibited limited temporal variability over the study period. The proportion of stations experiencing drought events classified as slight fluctuated around 20%, while that of drought events classified as moderate remained close to 10%. In contrast, drought events classified as severe and extreme were relatively rare, with both accounting for approximately 5% of stations. These findings indicate that drought events classified as slight were the most prevalent throughout the region, followed by drought events classified as moderate, whereas drought events classified as severe and extreme occurred sporadically and without a consistent temporal pattern.
Overall, summer droughts in Northeast China from 1961 to 2020 exhibited no significant long-term trend, with the spatial and temporal distribution dominated by slight drought events.

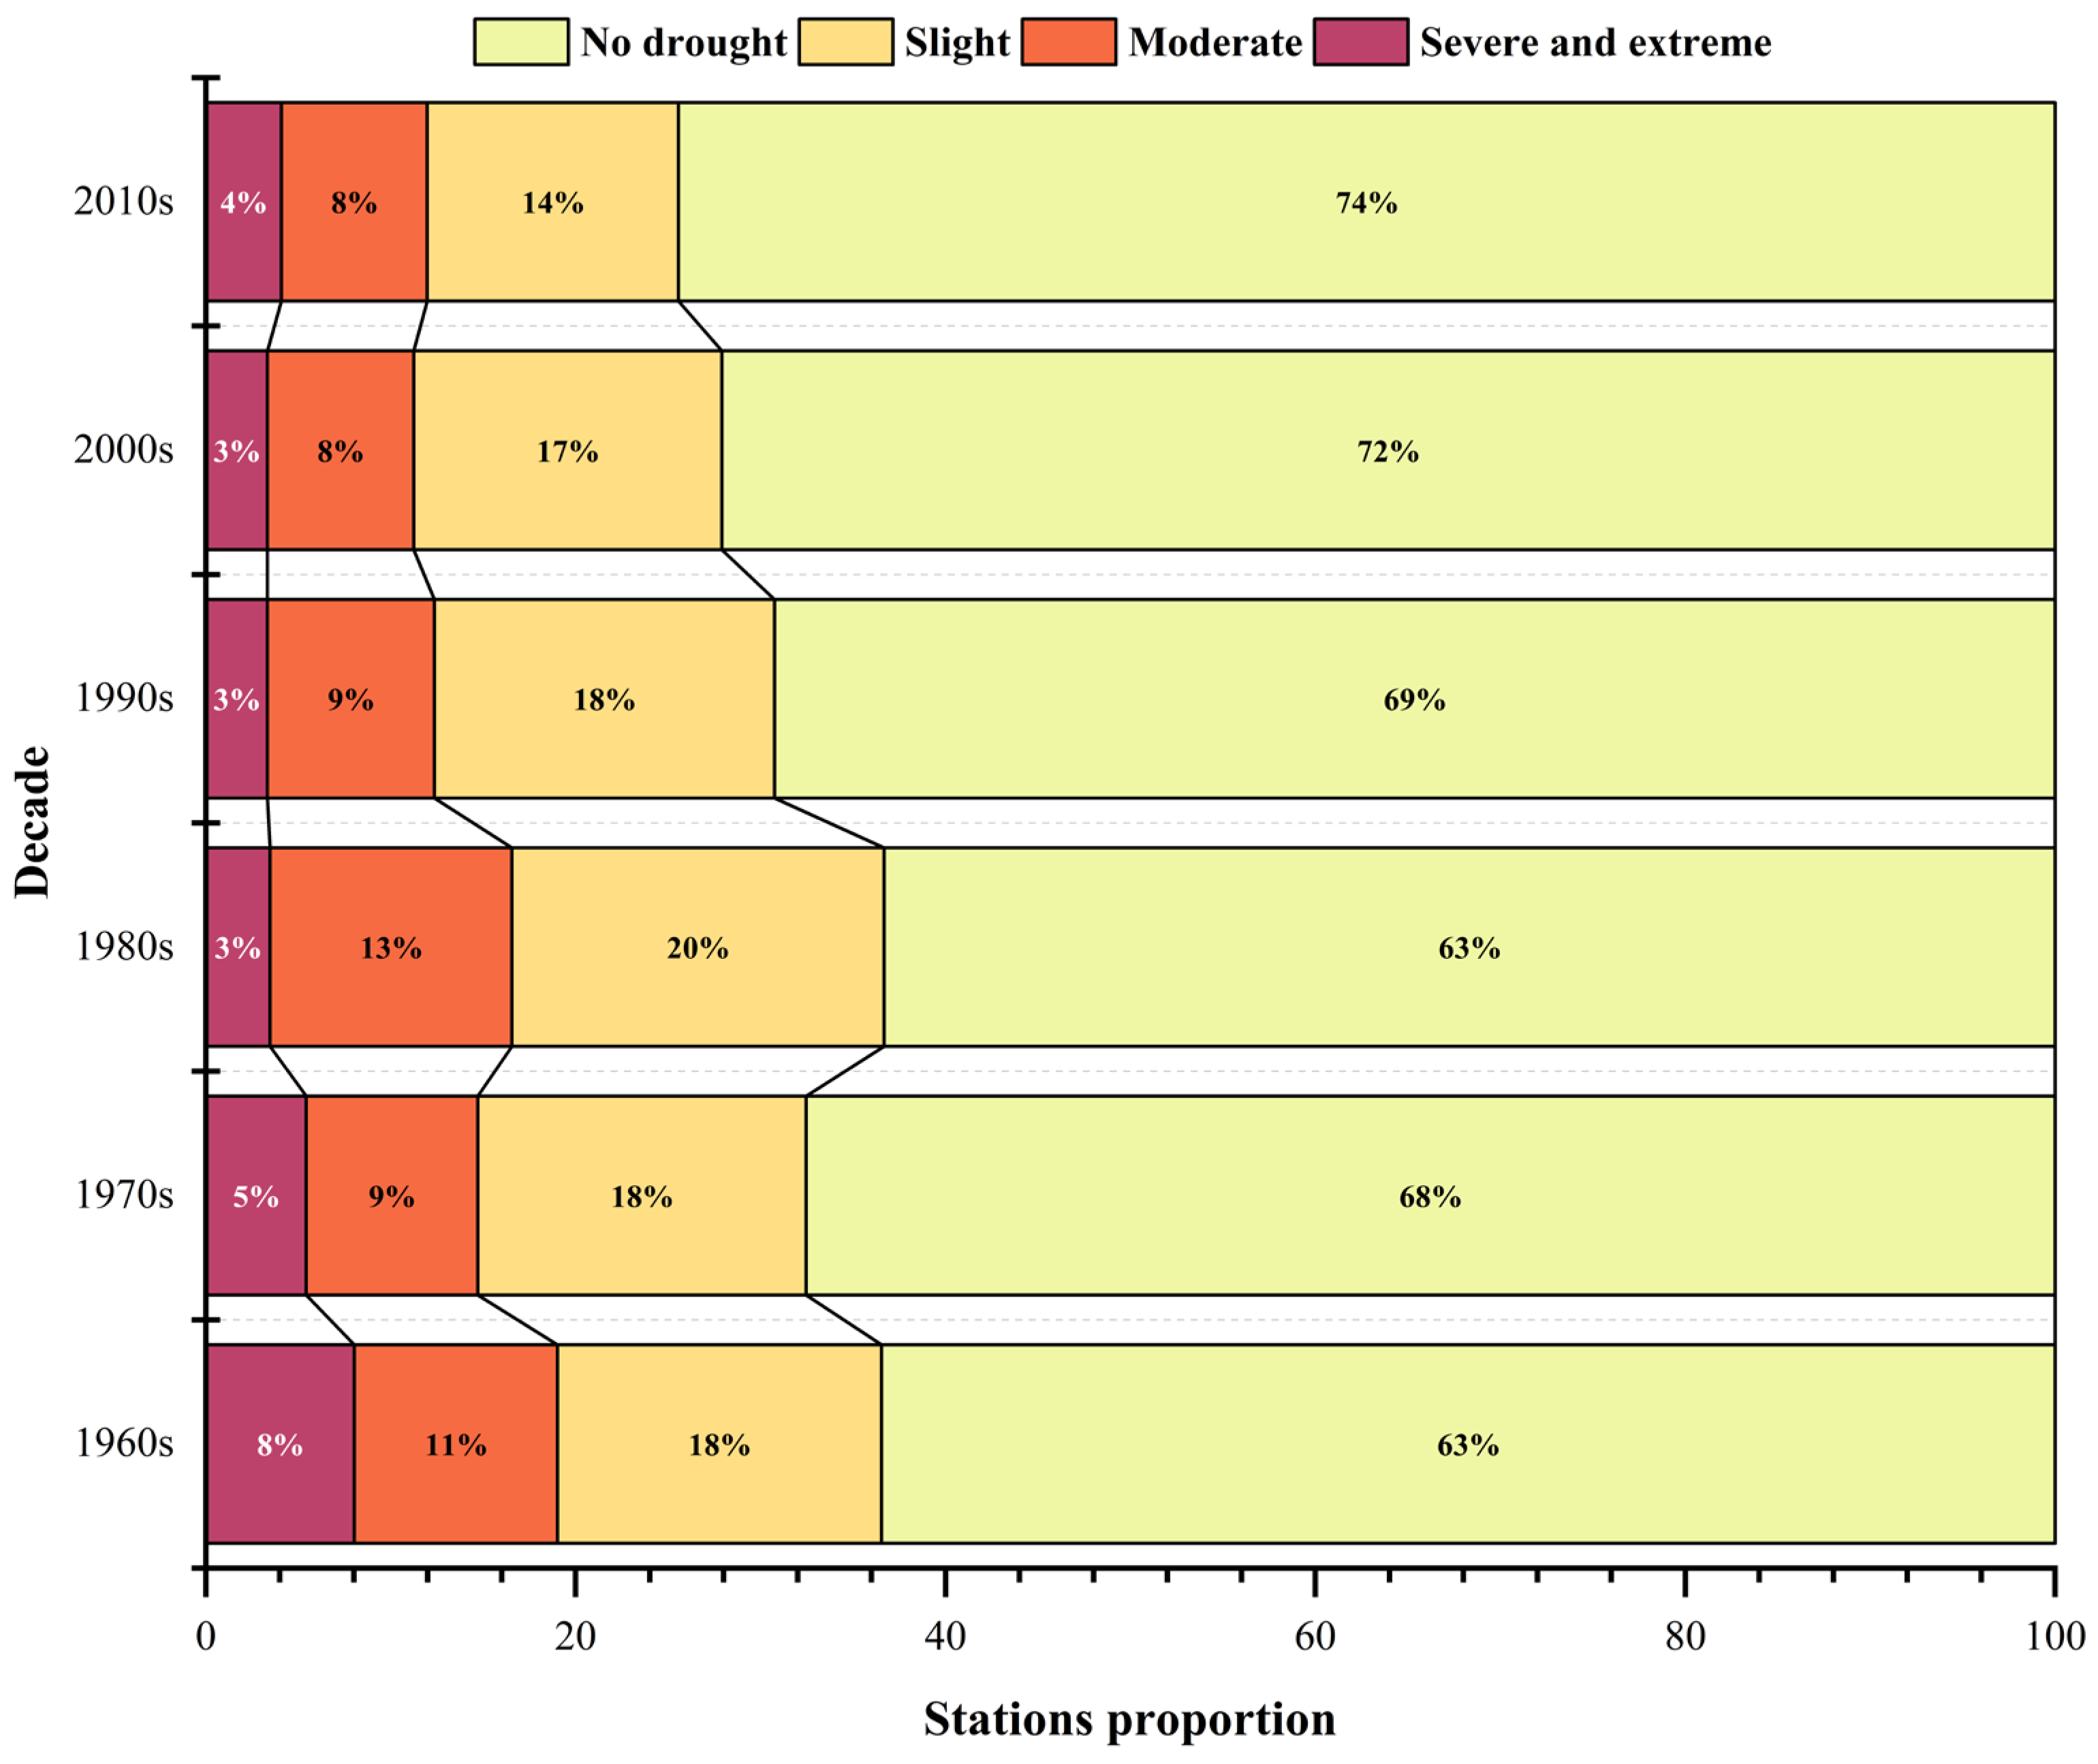
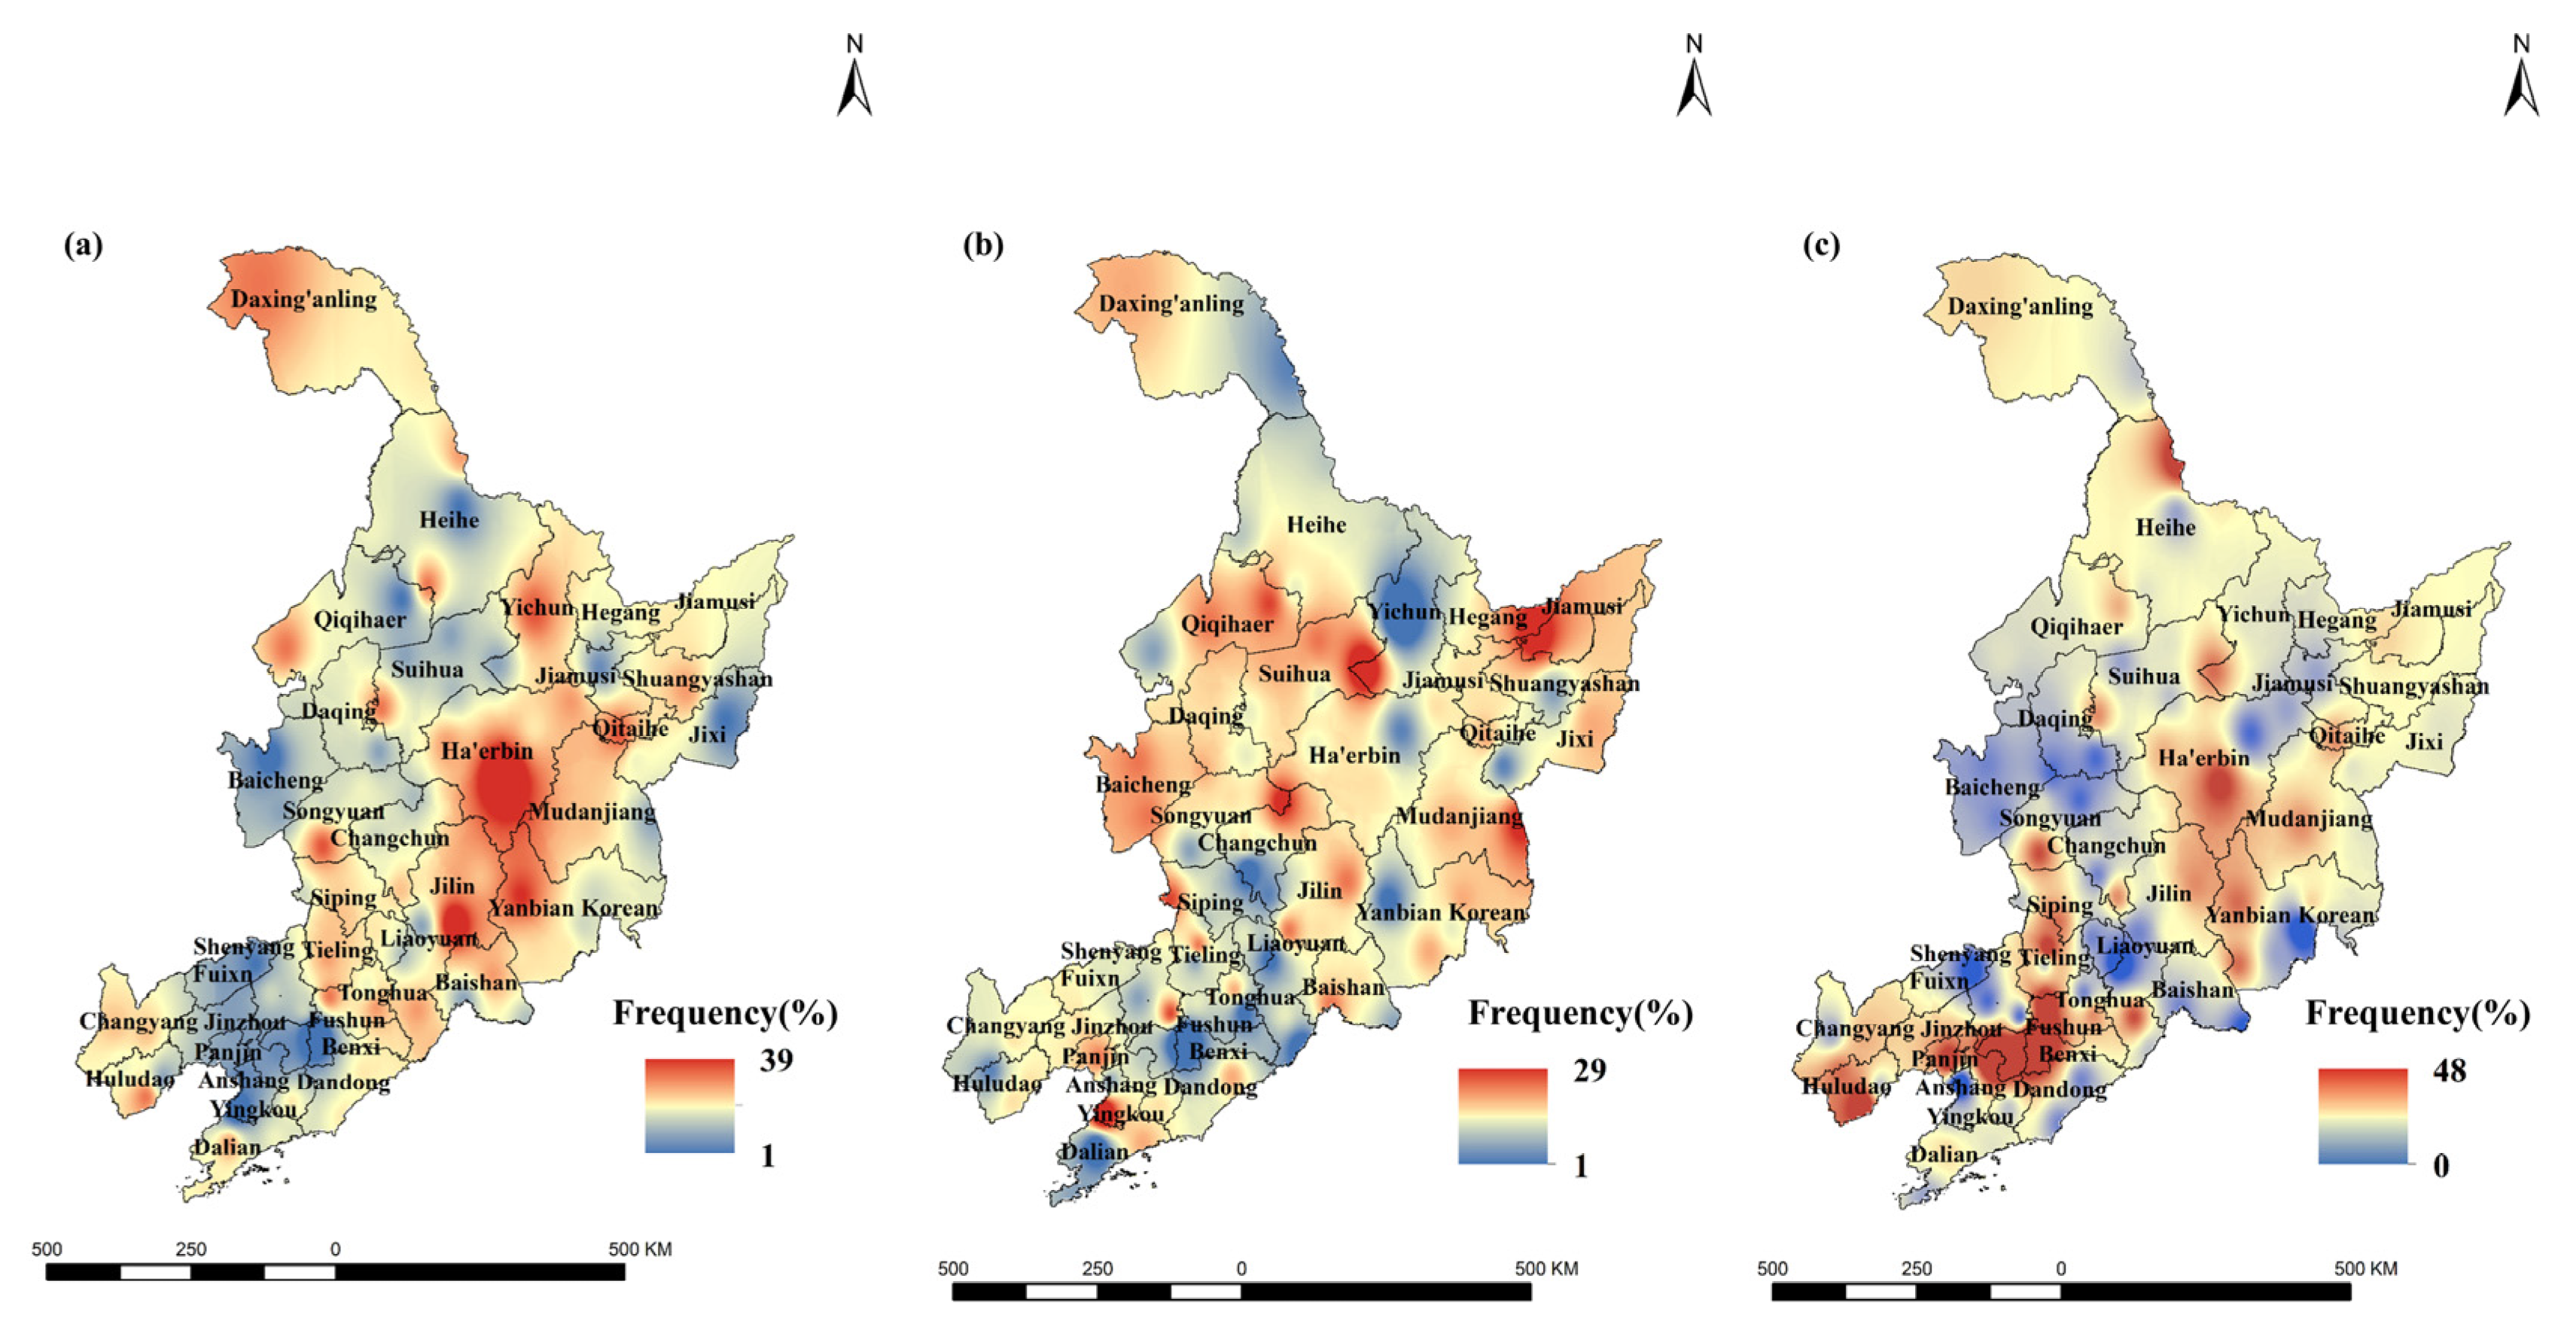
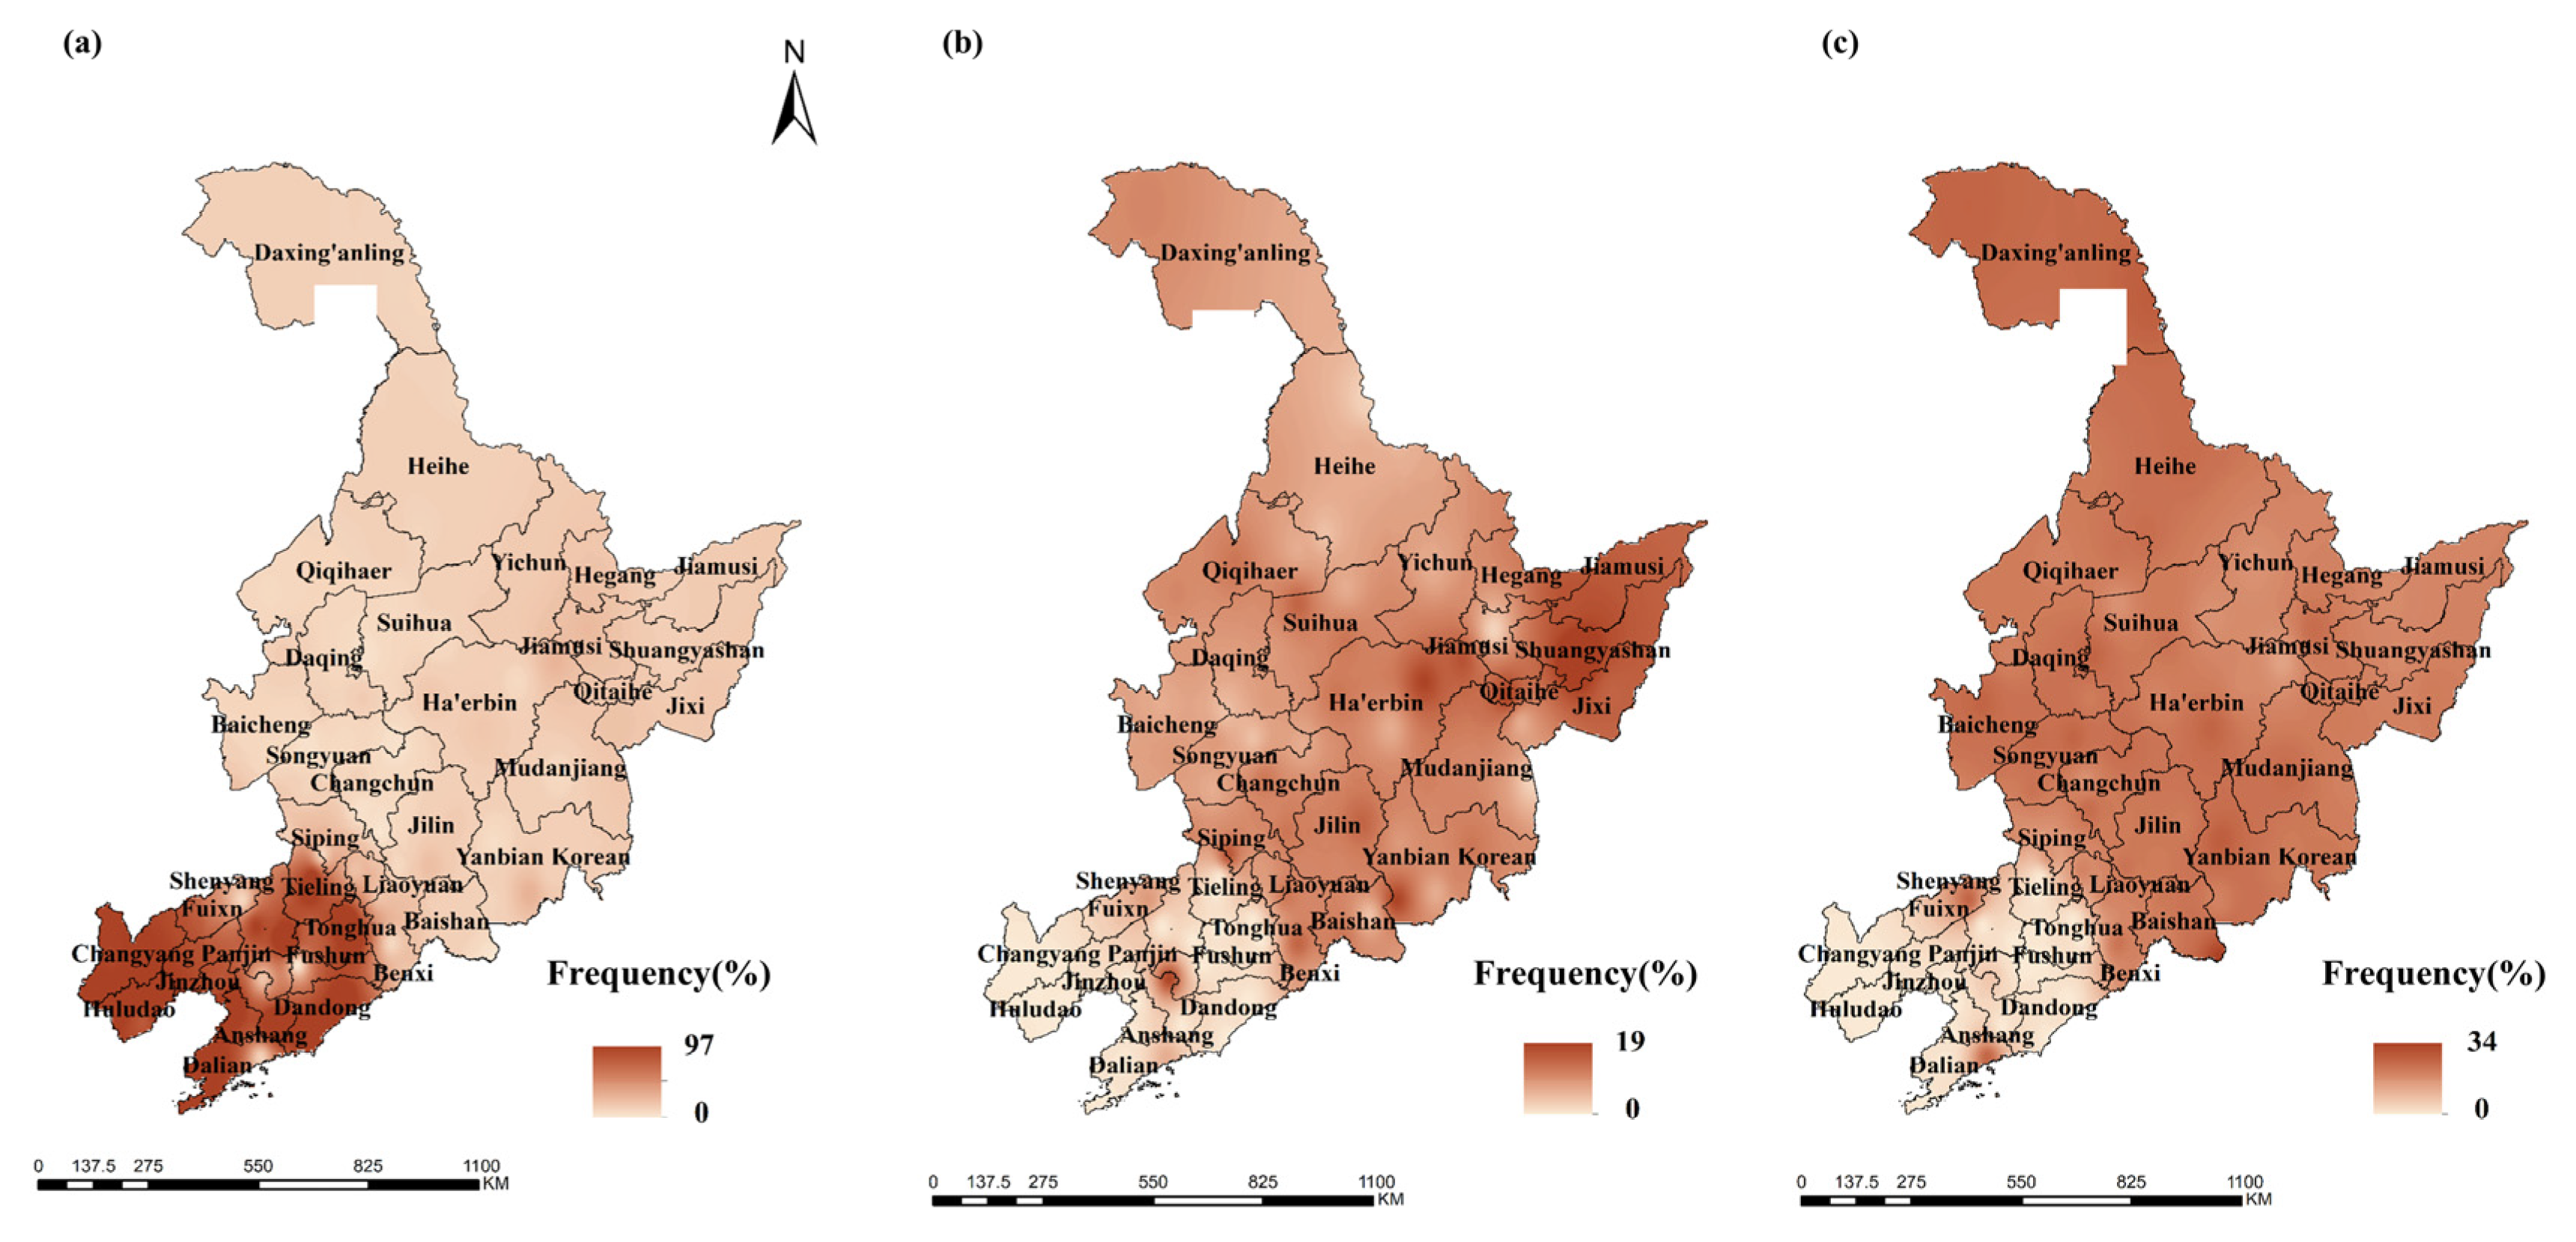
3.1.2. Spatial Distribution of Drought Events

As shown in Figure 4, extreme drought events were relatively rare in Northeast China. Therefore, this study primarily investigated the spatial distribution characteristics of slight, moderate, severe, and extreme drought events in the region. Figure 5a shows that the frequency of drought events classified as slight ranged from 1% to 39%, with the highest frequencies observed in the central and southeastern parts of the region. Conversely, such events occurred less frequently in the central part of Liaoning Province and the northwestern part of Heilongjiang Province. Figure 5b shows that the frequency of drought events classified as moderate ranges from 1% to 29%, with higher frequencies observed in the northern regions than in the southern regions. Notably, the highest frequency of drought events classified as moderate was observed in Baicheng City, Jilin Province, while the lowest frequency was observed in Dandong City, Liaoning Province. Figure 5c shows that drought events classified as extreme were relatively rare, with occurrence rates ranging from 1% to 48%. The central regions of Liaoning Province appeared more prone to such events.
Overall, Figure 5a–c indicate that the frequency of drought events in the Northeast region is relatively low. However, the central region was more prone to severe drought events, while the southern and northern regions experienced lower frequencies. This spatial distribution pattern may be related to regional atmospheric circulation patterns, such as the influence of the Baikal High-Pressure System on descending air currents in the Northeast region [43].

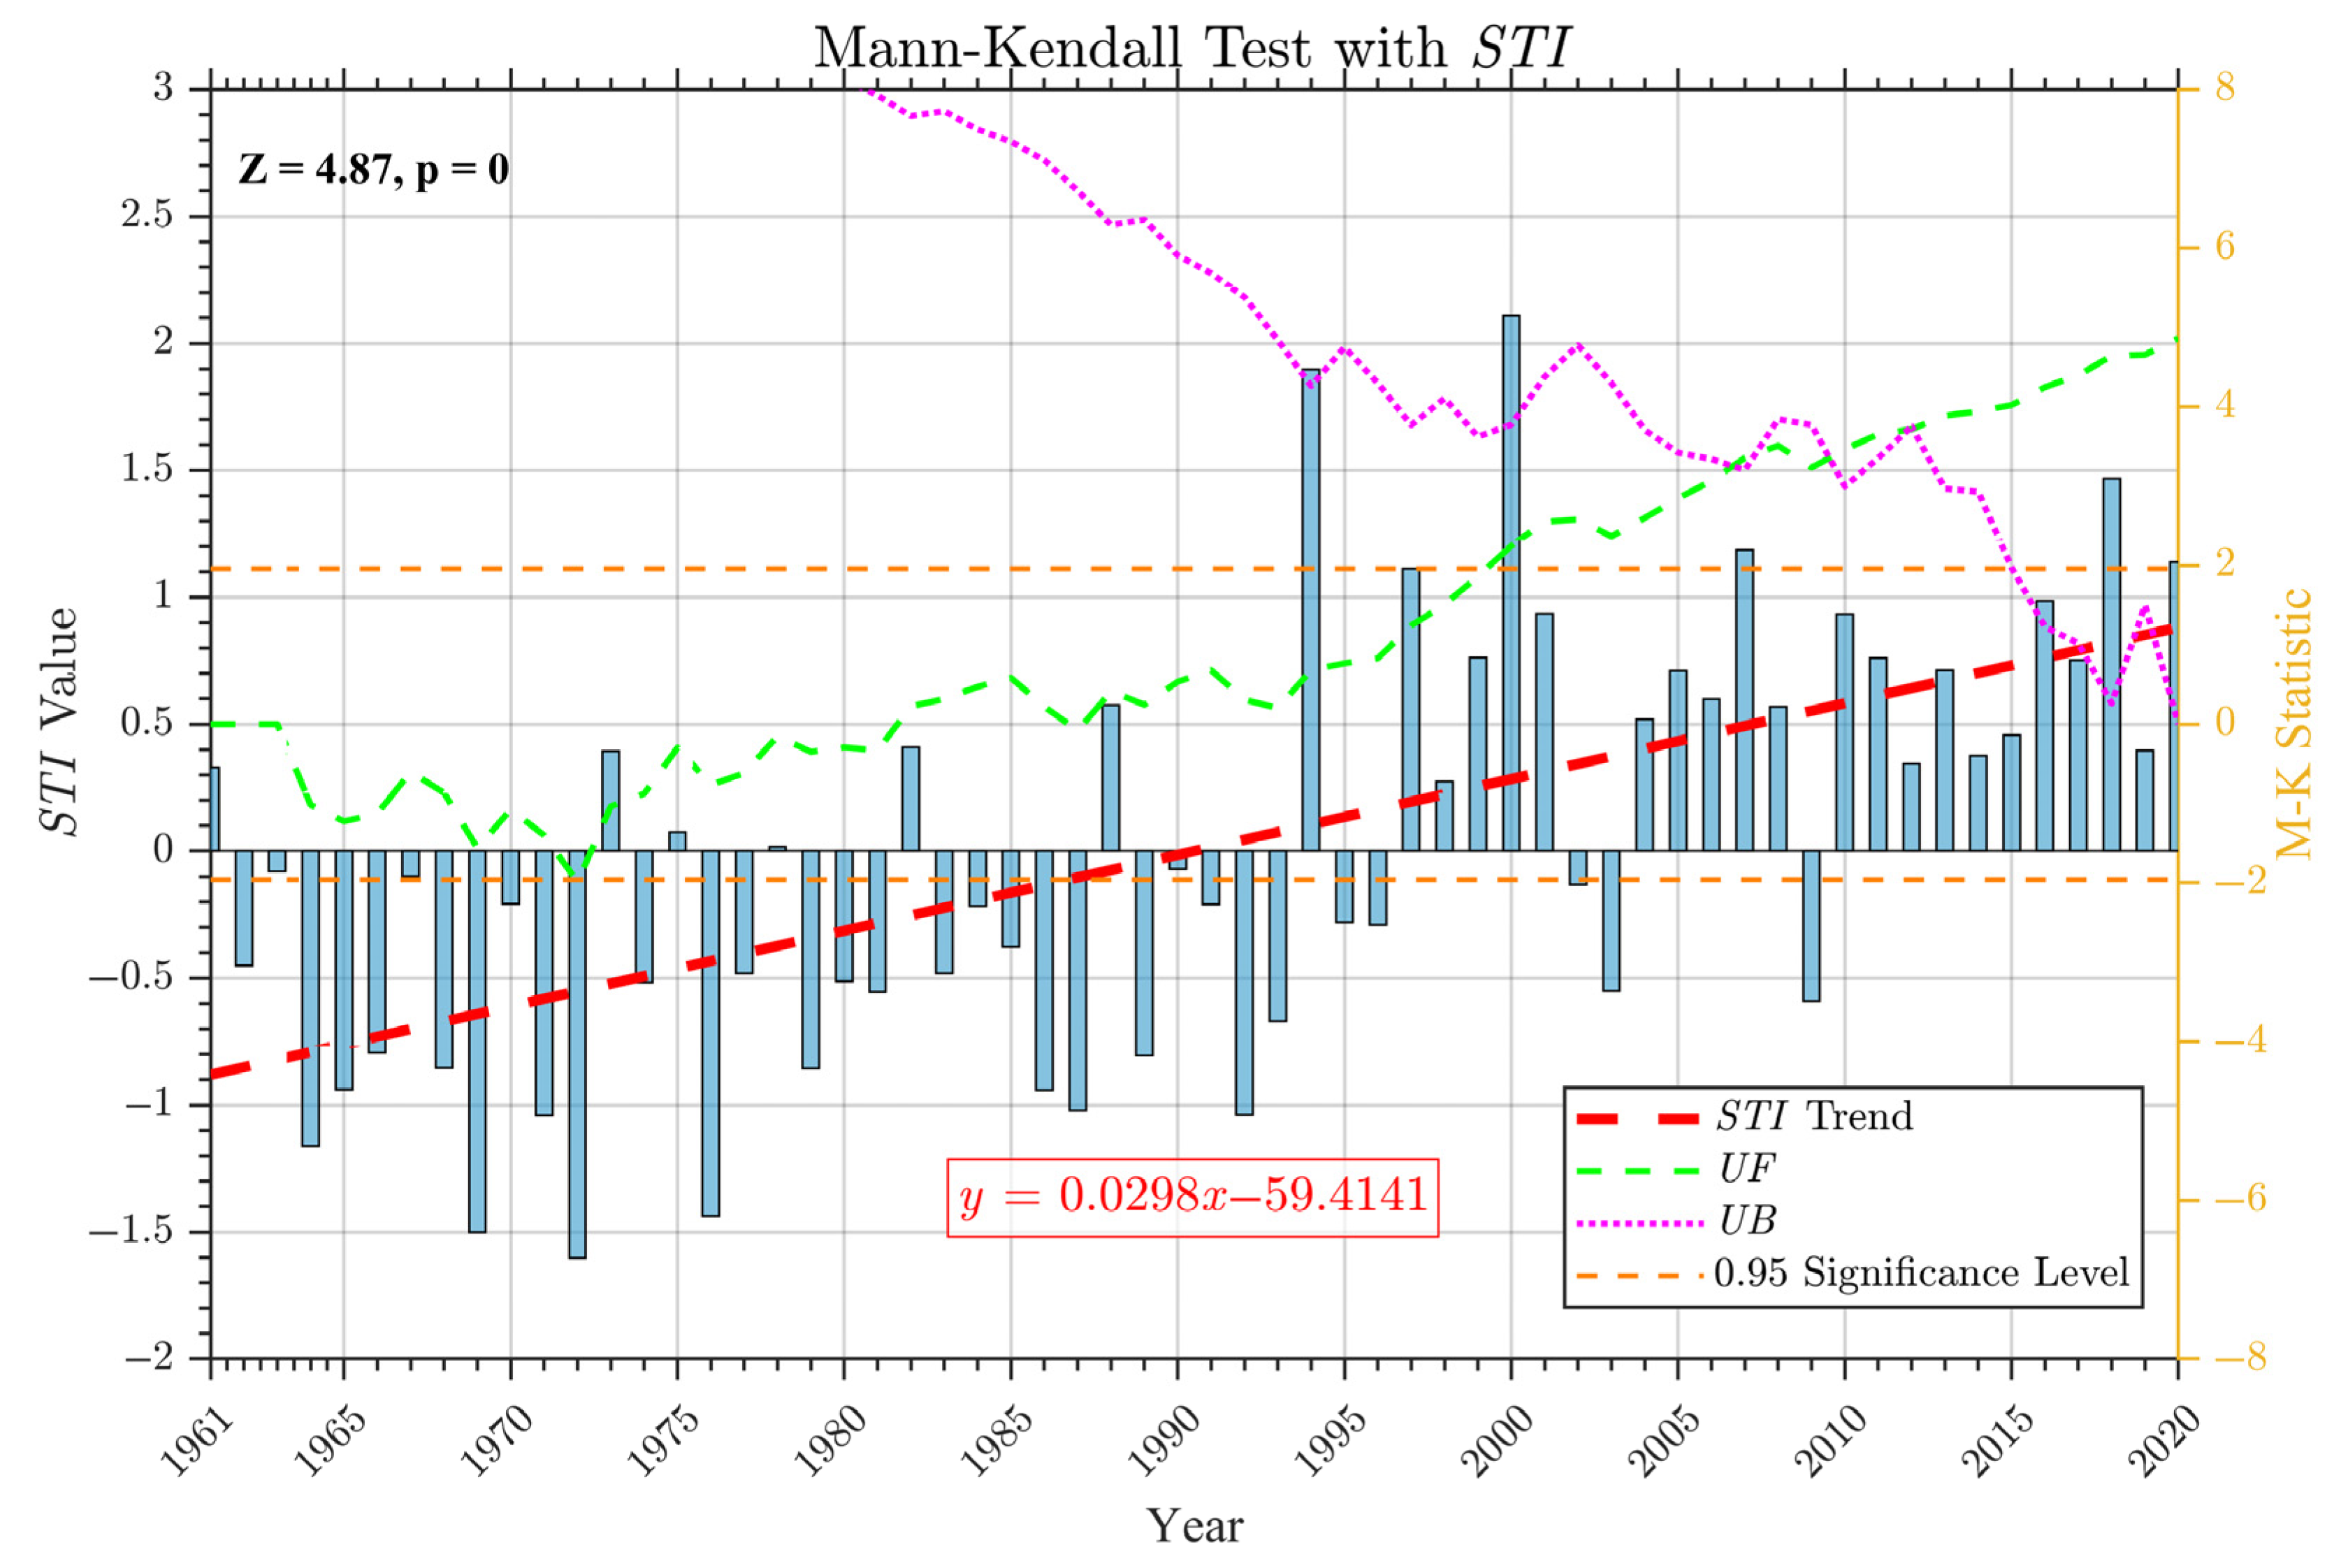
3.2. High-Temperature Analysis

3.2.1. High-Temperature Temporal Trend

As shown in Figure 6, the STI index exhibited an overall upward trend during the study period, with a linear annual growth rate of 0.0298 and fluctuations ranging from −1.7 to 2.3. Combined with the MK test, the Z-value of 4.87 indicates a possible upward trend, and the p-value of zero passed the significance test (p < 0.05), indicating that the STI exhibited a significant upward trend during this period. Between 1963 and 1981, the UF statistic was negative, indicating a downward trend in the STI during this period, suggesting a weakening of high-temperature events in the northeastern region. Between 1983 and 2020, the UF statistic remained positive, indicating that STI values continued to increase from 1983 to 2020. This trend reflects the phenomenon of high-temperature events in the Northeast region gradually intensifying over time between 1983 and 2020. Specifically, between 2007 and 2012, the UF curve intersected with the UB curve four times, indicating that the frequency and intensity of high-temperature events underwent multiple abrupt changes during this period. Notably, around the year 1999, the UF value exceeded the critical threshold of 1.96, confirming statistical significance and a pronounced increase in high-temperature events thereafter.
To further characterize high temperature events in Northeast China, this study analyzed the proportion of stations with different high temperature event severity levels in Northeast China (Figure 7). As shown in Figure 7, the proportion of stations experiencing high-temperature events in Northeast China exhibited a stepwise increase over successive decades. Notably, during the 2010s, the proportion of stations with high-temperature occurrences surpassed that of stations without such events, suggesting that the region had entered a new phase characterized by more frequent high-temperature extremes. From 1961 to 2020, the proportion of stations affected by high-temperature events of all intensity levels showed an upward trend. Specifically, moderate high-temperature events exhibited the most pronounced increase, rising by 11%, followed by slight high-temperature events, with a 10% increase. Although the proportions of severe and extreme high-temperature events also rose, they remained lower in comparison. Despite the significant growth in moderate events, slight high-temperature events continued to be the most prevalent.
Overall, the number of high-temperature events in Northeast China increased significantly from 1961 to 2020, among which the increase in moderate high-temperature events is the most obvious.

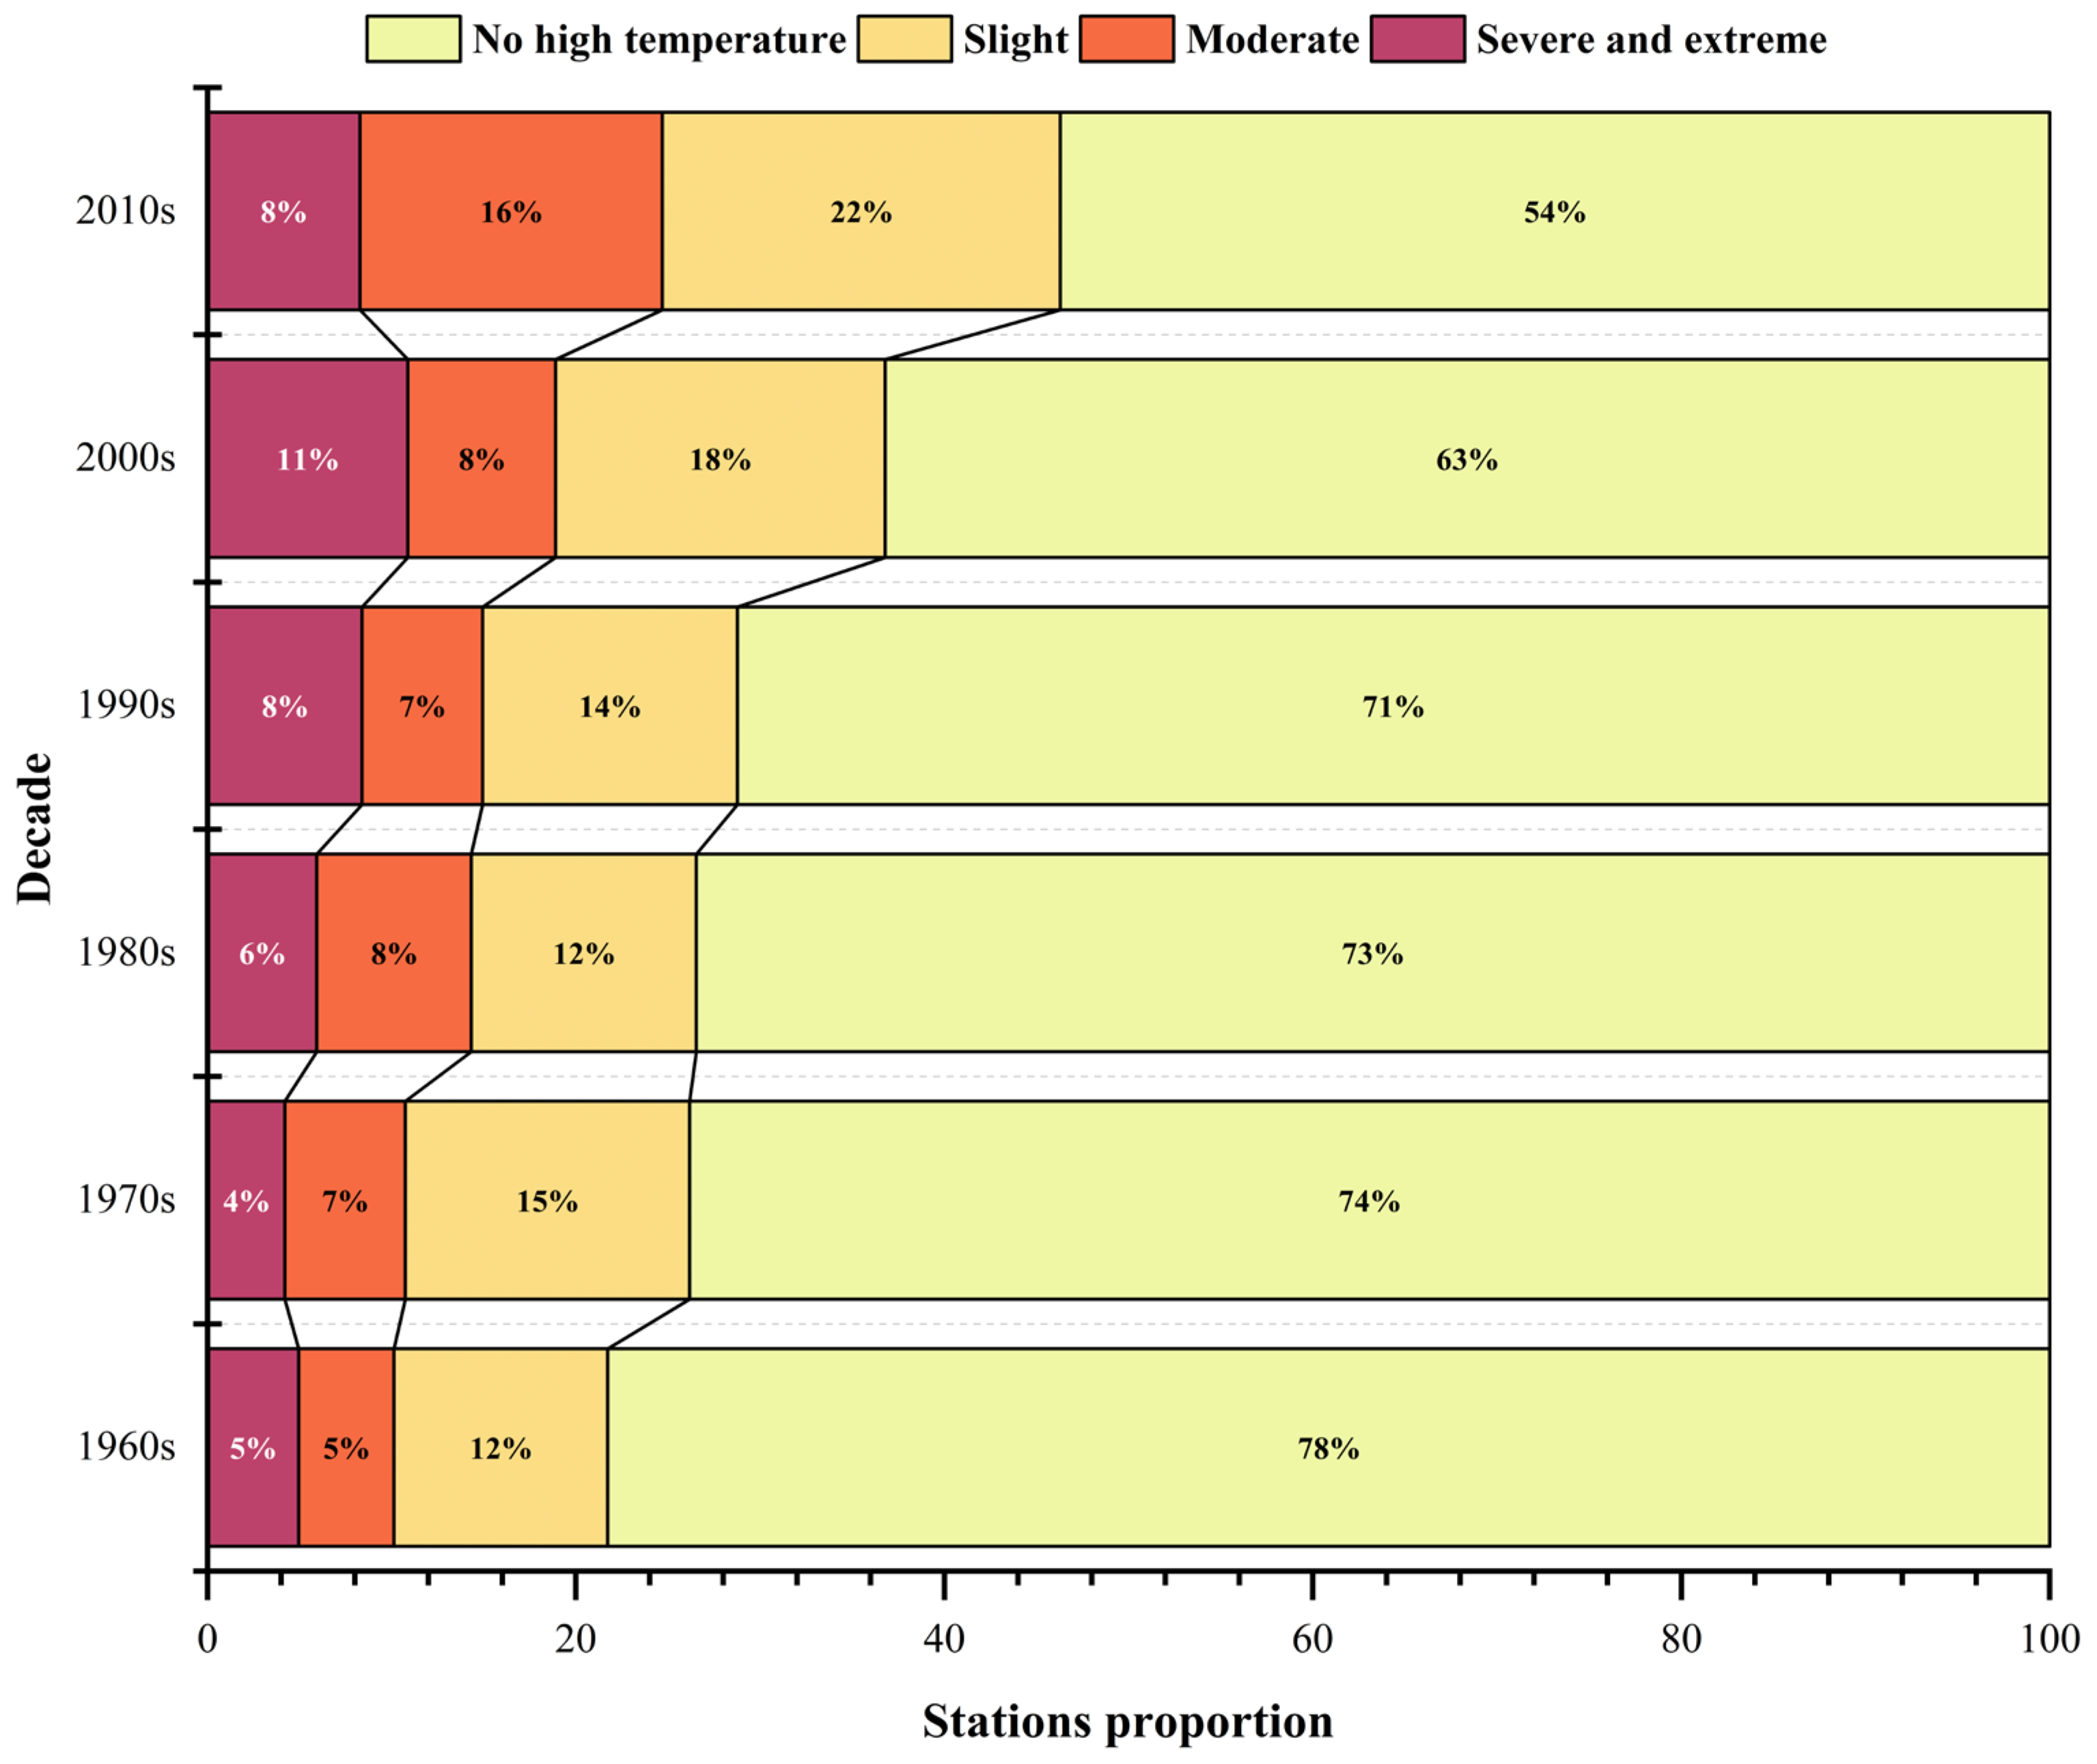
3.2.2. Spatial Distribution of High-Temperature Events

This study analyzed the frequency of slight, moderate, severe, and extreme high-temperature events in the Northeast region to investigate their spatial distribution characteristics, as shown in Figure 8.
Figure 8a shows that the frequency of high-temperature events classified as slight decreased gradually from south to north, ranging from 0% to 97%. Notably, the frequency of drought events classified as slight in Liaoning Province was significantly higher than in Jilin and Heilongjiang Provinces. Figure 8b illustrates that the frequency of high-temperature events classified as moderate ranged from 0% to 19%, with the northeastern part of the region experiencing such events more frequently than other areas. Figure 8c shows that the frequency of extreme high-temperature events ranged from 0% to 34%, with the highest frequencies occurring throughout most of Jilin Province and all of Heilongjiang Province.
In summary, Figure 8a–c show that Liaoning Province is less prone to moderate and severe high-temperature events but more prone to slight drought events, which occur at an extremely high frequency. Heilongjiang Province is more prone to severe high-temperature events than Liaoning and Jilin Provinces, indicating greater vulnerability to the adverse impacts of intense heatwaves. This pattern aligns with the findings of Dai et al. [44], who reported that global warming has led to an increased frequency and intensity of high-temperature events in Northeast China, primarily due to enhanced evapotranspiration.

3.3. STPI Analysis

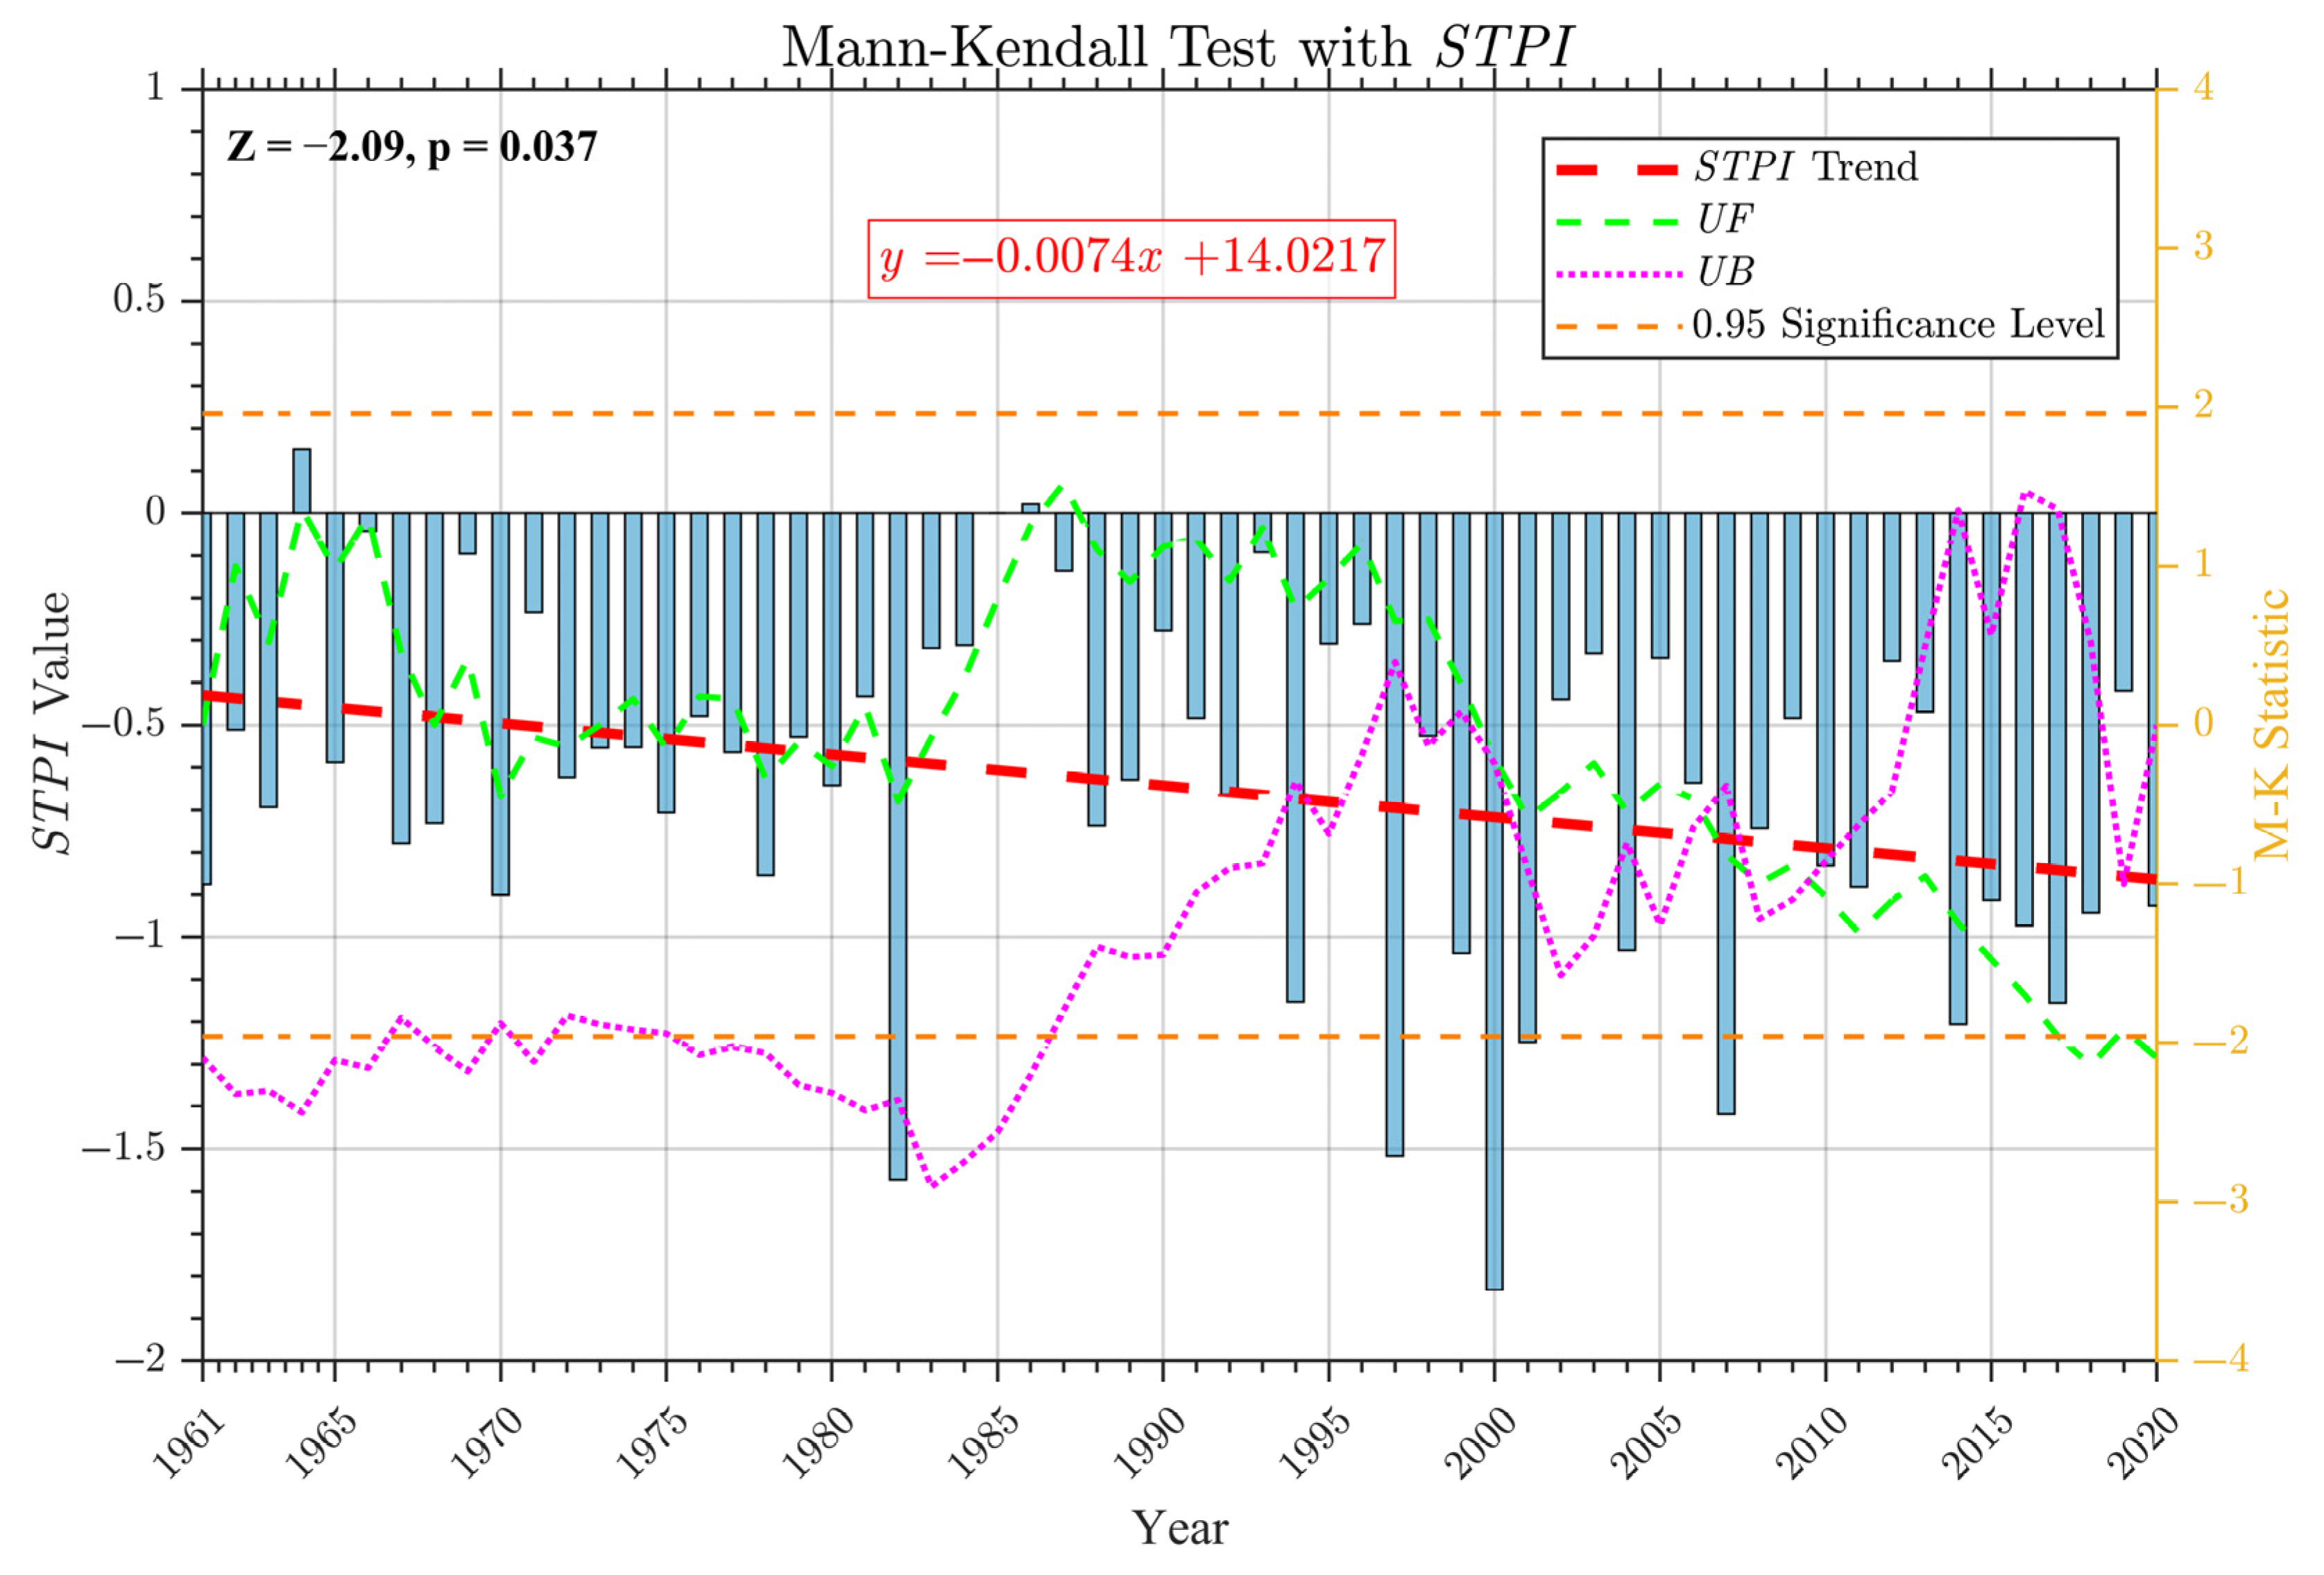
3.3.1. Temporal Trend of STPI

As shown in Figure 9, the STPI in Northeast China exhibited a decreasing trend at a rate of 0.0074 per year; however, its overall value remained higher than −2.0. Combined with the Z-value of −2.09 in the MK test, this indicates a possible downward trend. The p-value of 0.037 passed the significance test (p < 0.05), indicating that the STPI showed a significant downward trend during this period. Between 1970 and 1981, the UF value fluctuated around zero, indicating an unstable trend in the STPI during this period. From 1983 to 2000, the UF values remained predominantly positive, indicating that the STPI showed an upward trend during this period, suggesting a weakening of CDHEs. However, after 2000, the UF values exhibited a marked downward trend, reflecting a significant intensification of CDHEs. By approximately 2018, the UF value reached −1.96, indicating a statistically significant downward trend in the STPI. Specifically, the UF and UB curves first intersected at the end of the 20th century, indicating that the STPI underwent its first mutation during that period. Subsequently, between the mid-2000s and the end of the 2000s, multiple intersections appeared, indicating that the STPI underwent frequent mutations during this period. Notably, around 1982 and 2000, the region experienced consecutive large-scale and severe CDHEs. In 1982, CDHEs predominantly affected extensive areas in Jilin and Heilongjiang Provinces, primarily involving moderate and severe events, with certain regions experiencing extreme conditions. This marked the first occurrence of such large-scale, high-intensity CDHEs in the region since the 1960s. According to the 1949–1995 China Disaster Report, severe precipitation deficits, frequent high temperatures, and strong winds during the summer of 1982 led to significant soil moisture loss and reductions in crop yield. This suggests that the combination of elevated temperatures and low precipitation during this period was a primary factor contributing to the intensification of CDHEs in the region.
Around 2000, the STPI index in Northeast China showed a significant decline. According to the China Meteorological Disaster Almanac, drought events in the region primarily occurred from May to July of that year. Most areas of Liaoning, Jilin, and central and western Heilongjiang experienced dry conditions, with western Liaoning, northwestern Jilin, and southwestern Heilongjiang reaching severe drought levels. Notably, in the late 1990s, Northeast China experienced four to five consecutive years of summer CDHEs, marking the longest continuous occurrence of such events in the region from 1961 to 2020. During this period, all the study stations recorded CDHEs of varying severity, making it the most severe era in the past 60 years and a pivotal turning point for CDHEs in the study period.
The frequency of summer CDHEs in Northeast China generally increased after the 1990s compared to earlier decades. Among the three provinces, Liaoning experienced the highest occurrence frequency, largest impacted area, and greatest severity of CDHEs, surpassing both Jilin and Heilongjiang.
To further characterize the occurrence of compound dry and heat events (CDHEs) in Northeast China, this study analyzed the proportion of meteorological stations affected by CDHEs of varying severity levels over the period of 1961–2020 (Figure 10). As shown in Figure 10, the proportion of stations experiencing CDHEs remained relatively stable during the first three decades of the study period but exhibited a marked increase over the subsequent thirty years. Notably, the most substantial decadal increase occurred between the 1990s and 2000s, with the proportion of affected stations rising by approximately 16%.
Among the different severity categories, the proportions of stations experiencing severe and extreme CDHEs remained consistently low, both under 5%, and showed little variation over time. In contrast, moderate CDHEs showed a notable increase of around 8%, while slight CDHEs exhibited the most pronounced growth, increasing by approximately 16%.
Overall, slight CDHEs were the most prevalent throughout the study period, followed by moderate events, whereas severe and extreme events occurred relatively infrequently. The total number of CDHEs across all severity levels demonstrated a clear upward trend, indicating an overall intensification of compound dry and heat events in Northeast China.

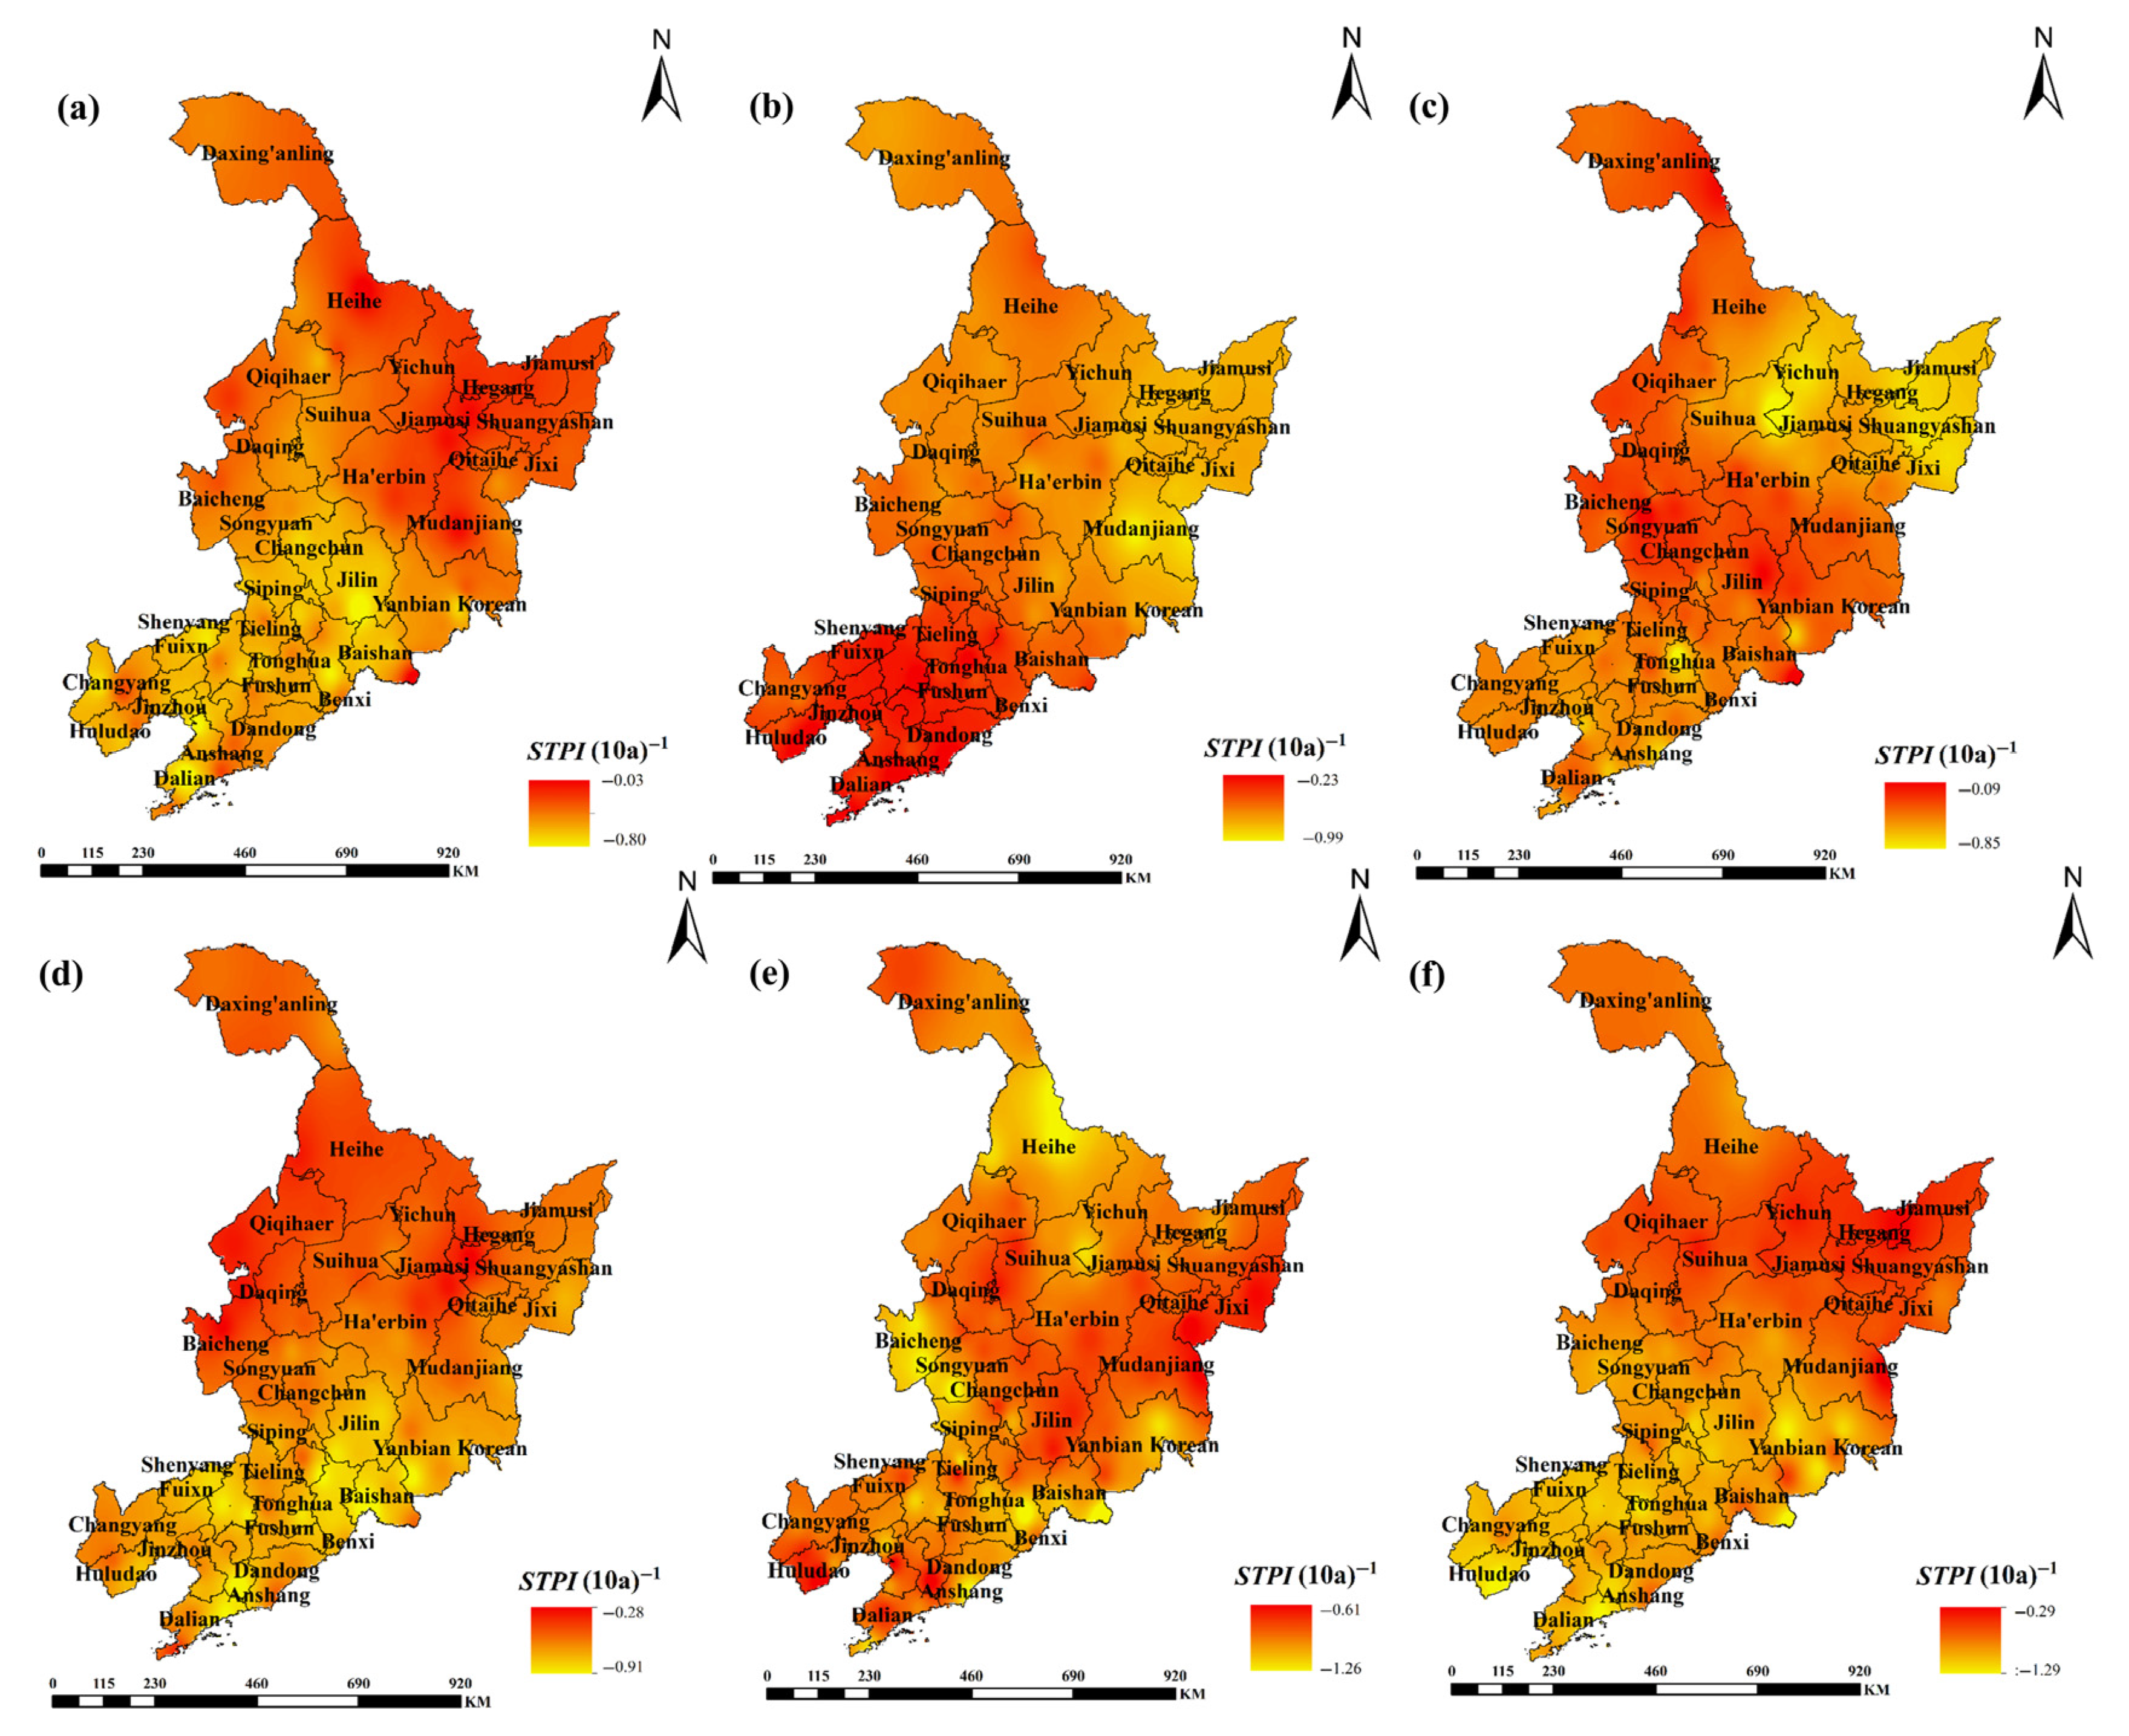
3.3.2. Spatial Distribution of STPI

This study examined the spatiotemporal variation characteristics of the STPI during summer in Northeast China, with the results presented in Figure 11.
As depicted in Figure 11a,f, the STPI index ranged from −0.8 to −0.03 in the 1960s and from −1.29 to −0.29 in the 2000s, exhibiting a general spatial pattern of lower values in the south and higher values in the north. The severity of CDHEs was more pronounced in Liaoning province than in Jilin and Heilongjiang provinces, with low-value areas concentrated in southern Liaoning, including cities such as Dalian, Yingkou, and Fuxin. Southern Liaoning, located on the Liaodong Peninsula and the extended section of the Changbai Mountains, experiences reduced moisture transport, resulting in lower precipitation levels.
Figure 11b illustrates the spatial distribution of the STPI during the summers in the 1970s in Northeast China. The STPI index ranged from −0.99 to −0.23, exhibiting a pattern of lower values in the north and higher values in the south. CDHEs primarily affected northeastern Jilin and Heilongjiang provinces, with low-value areas concentrated in eastern Heilongjiang, including the cities of Mudanjiang and Harbin. The eastern part of Heilongjiang is influenced by westerly airflow from the Eurasian continent, which is disrupted by the northeast–southwest alignment of the Daxing’anling Mountains in northwestern Heilongjiang. This topographic feature leads to significantly lower precipitation in the eastern part compared to other regions. Furthermore, this area experiences more pronounced summer warming compared to that of other parts of Northeast China, which contributes to the low STPI values. Figure 11d shows that in the 1990s, the STPI index ranged from −0.91 to −0.28. The low-value areas were primarily concentrated in northern Liaoning and most parts of Jilin, including cities such as Tieling, Baishan, and Liaoyuan. Baishan recorded the lowest STPI value, of −0.91. Figure 11e indicates that in the 2000s, the STPI ranged from −1.29 to −0.29, displaying an uneven spatial distribution. Overall, it exhibited a north-to-south pattern of alternating low and high values, with the lowest value observed in Baishan, Jilin.
As shown in Figure 11, the STPI in Northeast China ranged from −1.29 to −0.03, exhibiting irregular spatial variation. The most pronounced changes were observed in Baishan, Jilin, where the STPI fluctuated from −1.27 to −0.03. Baishan, located in the southeastern part of Northeast China, is influenced by the windward slopes in the southeast and the West Pacific Subtropical High, leading to significant interannual variability in precipitation [45].
To further analyze the spatial variations in monthly CDHEs and their response to changes in drought and high-temperature events, this study applied Theil–Sen median trend analysis and the MK test to the SPI, STI, and STPI for the summers of 1961–2020 in Northeast China. The results are shown in Figure 12.
The results indicate that the STPI values at more than 96% of the 81 meteorological stations in Northeast China exhibited a downward trend from 1961 to 2020, suggesting that the severity of summer CDHEs in the region has generally increased over the past 60 years. Specifically, 32 stations showed significant decreases, while the remaining stations, primarily located in the cities of Suihua and Mudanjiang, did not exhibit significant changes. Regarding the SPI trend, 52 of the 81 sites in the region showed a downward trend, indicating a worsening of the overall dryness in Northeast China over the past 60 years. Among these sites, 50 showed an insignificant decline in SPI. Conversely, the STI values at 66 of the 81 stations displayed a significant upward trend, signifying a notable increase in temperature across Northeast China during the same period.
Combining the SPI and STI trends, it can be concluded that the increasing severity of summer CDHEs in Northeast China over the past 60 years has been primarily driven by rising temperatures. This conclusion is consistent with the findings of Lu et al. (2014) [46].
To further confirm that rising temperatures primarily drive the intensification of CDHEs in Northeast China, this study employed four widely used attribution analysis methods—LMG, First, Genizi, and CAR—to assess the relative contributions of the SPI and STI to the STPI during the summer season [37]. As shown in Figure 13, all four methods consistently indicated that the STI contributed more to the STPI than the SPI. Notably, the Genizi method revealed the most pronounced difference, with the contribution of the STI exceeding that of the SPI by 11%. Even under the CAR method, where the contributions were relatively similar, the STI still contributed approximately 3% more than the SPI. These results collectively demonstrate that rising temperatures, as captured by the STI, play a dominant role in driving CDHEs in Northeast China.

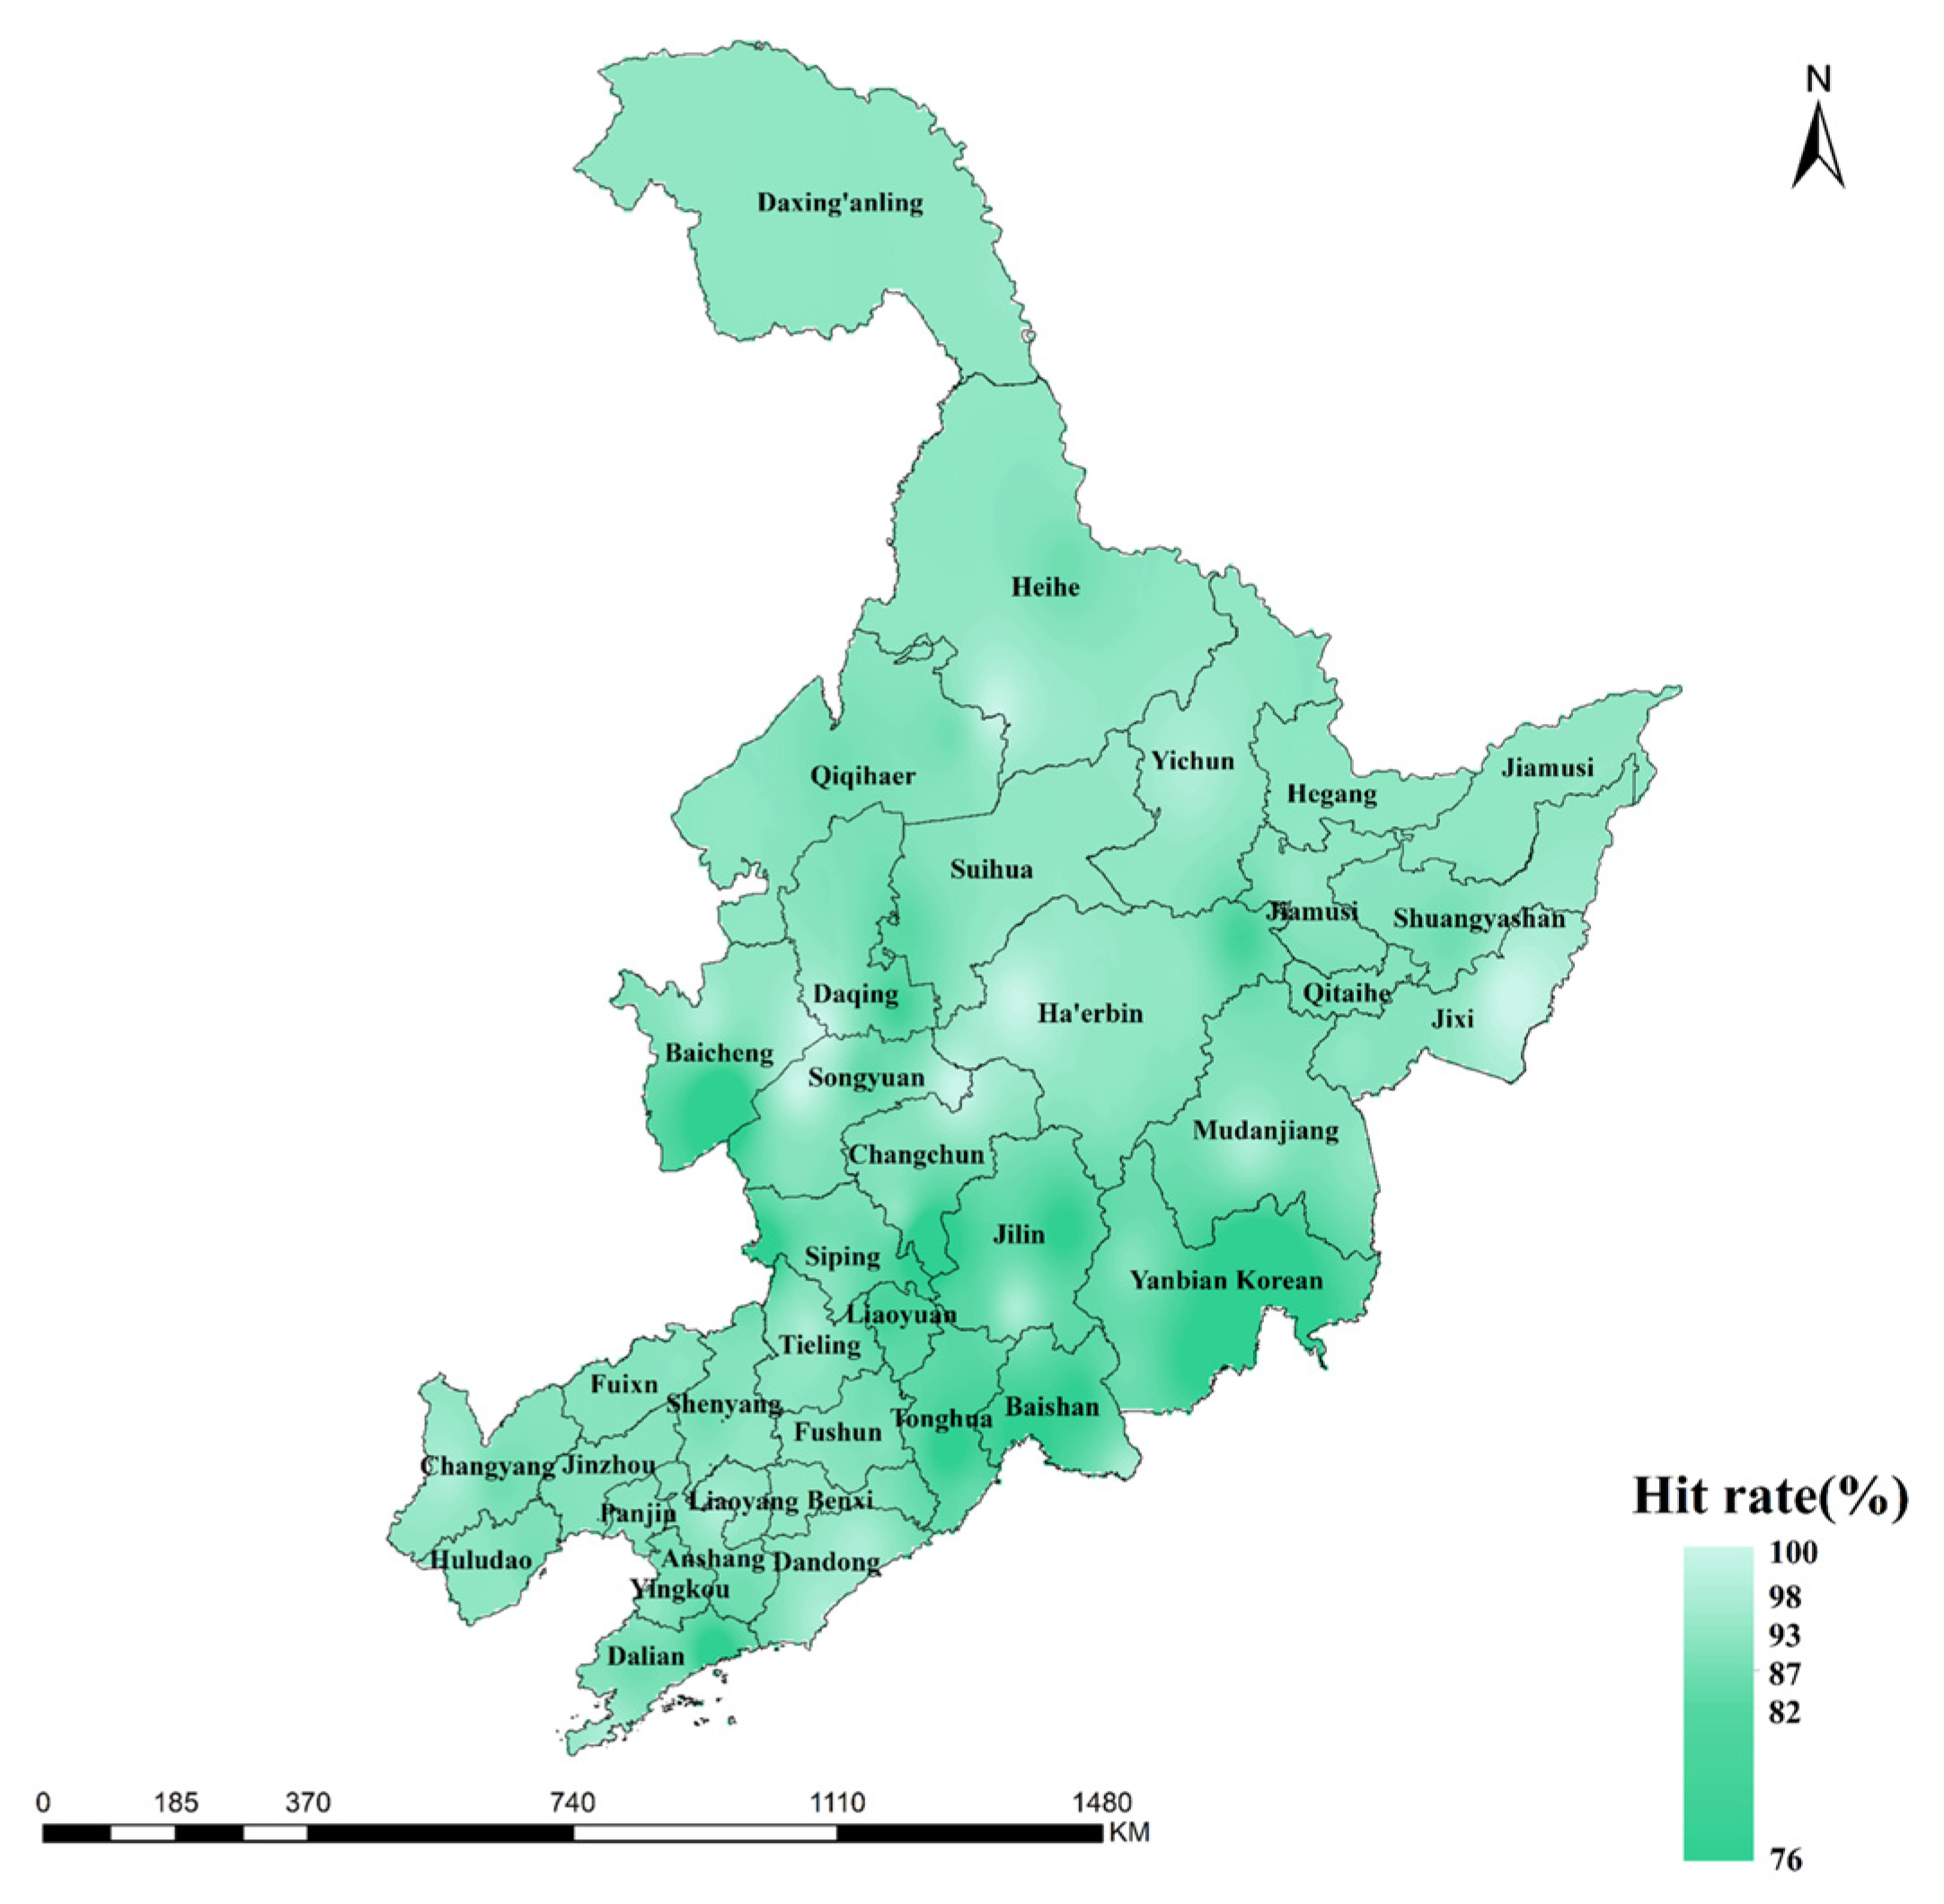
3.4. Hit Rate Analysis of STPI in Northeast China

To further validate the applicability of the STPI in identifying CDHEs in Northeast China, the hit rate method was employed. The sites and data mentioned in the above article were used to calculate the SPI and the STI. Events meeting the criteria for simultaneous dry (SPI < −0.5) and heatwave (STI > 0.5) conditions were selected, totaling 2348 samples, which constituted the total sample set. Subsequently, summer STPI values for the 81 stations were calculated and used as classification samples to determine the hit rate of the constructed compound dry and heat index. The results are shown in Figure 14.
The findings demonstrated that the STPI hit rate generally exhibited a spatial pattern, with high values in the northeast and southwest, and low values in the southeast. Among the three northeastern provinces, Heilongjiang exhibited the highest hit rate, at 96%. Notably, the STPI achieved a 100% hit rate for CDHEs at the Yilan and Mudanjiang stations in Heilongjiang. Liaoning province had the second-highest hit rate, at 95%, with the lowest station-level hit rate, of 82%, recorded at Zhuanghe station. Jilin province showed the lowest overall hit rate, at 91%, with Donggang station recording the lowest station-level hit rate in the region, at 76%. Overall, the average hit rate of the STPI in identifying CDHEs in Northeast China was 94%, indicating a high level of accuracy. This suggests that the STPI is an effective tool for detecting most of the CDHEs in the region.
Based on these results, the STPI has potential applicability in Northeast China, indicating that its use for analyzing the spatiotemporal characteristics of summer CDHEs may be both appropriate and beneficial.

3.5. The Applicability of STPI in Northeast China

To further substantiate the applicability of the STPI in identifying CDHEs in Northeast China, this study cross-referenced historical disaster records from the China Meteorological Disaster Almanac and the China Disaster Report (1949–1995). According to these authoritative sources, major CDHEs in the region were primarily concentrated in the years 1961, 1972, 1982, 1992, 1994, 1997, 2000, 2003, 2004, 2007, 2016, and 2022. Notable discrepancies between the STPI and SDHI were observed in 1982, 1994, 1997, and 2004. To assess the comparative performance of the two indices, this study calculated and examined their values for these years, as detailed in Table 5.
The results in Table 5 clearly demonstrate that the STPI outperforms the SDHI in capturing compound dry-heat conditions in the region. For instance, in 1994 and 1997, although only one of the univariate indices (SPI or STI) indicated an extreme (either drought or heat), the STPI successfully identified these years as experiencing moderate CDHEs. In contrast, the SDHI failed to detect any compound event in 1994 and identified only a slight event in 1997. Supporting this finding, archived reports from the China National Climate Centre (http://cmdp.ncc-cma.net/ (accessed on 20 June 2025)) confirm that Northeast China experienced an anomalously high-temperature summer in 1994. Similarly, in 1997, the region recorded above-normal temperatures and prolonged precipitation deficits, resulting in widespread drought and significant socio-economic impacts.
These findings underscore a key limitation of the SDHI: its restricted sensitivity to asymmetric and nonlinear dependencies between temperature and precipitation extremes, especially when one variable exhibits a dominant influence. In contrast, the Copula-based STPI framework more effectively captures these complex interactions, enhancing its diagnostic capability for compound extremes. Consequently, the STPI demonstrates greater reliability and robustness in characterizing both historical and recent CDHEs in Northeast China, making it a more suitable index for climate risk assessment, disaster preparedness, and early warning applications in this ecologically and socioeconomically vulnerable region.

4. Discussion

This study investigated the spatiotemporal evolution of CDHEs in Northeast China from 1961 to 2020 and yielded three key findings. First, the STI exhibited a statistically significant upward trend (p < 0.05), while the SPI showed minimal interannual variability, indicating that temperature has become the dominant factor in recent climate dynamics. This finding aligns with previous studies reporting that the rate of warming in Northeast China substantially exceeds the standard deviation of interannual variability [47], whereas precipitation trends remain inconspicuous [48], further reinforcing the pronounced intensification of high-temperature events in the region. Second, since the 1990s, the frequency, severity, and spatial extent of regional CDHEs have all increased significantly, indicating that regional composite climate disasters have changed. Wu et al. examined changes in the frequency of CDHEs across China and concluded that increases in frequency and spatial extent were primarily concentrated in southern, northern, and southwestern regions [49]. However, the results of this study highlight that the intensification of CDHEs in Northeast China is also substantial and should not be overlooked. Third, the STPI showed strong regional applicability, with validation accuracy exceeding 90% at most meteorological stations, underscoring its reliability in detecting CDHEs. It is worth noting that existing research has found that the CDHEs occurred in 1994, which is consistent with the findings of this study. However, this year, the climatic characteristics of temperature and precipitation in Northeast China were marked by elevated temperatures [47] and increased precipitation levels [50]. This apparent discrepancy may be attributed to the impact of elevated temperatures accelerating evapotranspiration, thereby reducing soil moisture availability. As a result, even when precipitation remained stable or increased slightly, the pronounced rise in temperature may have intensified drought conditions and contributed to the emergence of a compound event [51].
Although this research has made significant contributions, some limitations should also be acknowledged. Firstly, the study area is located in the mid-latitude region and coastal or semi-coastal areas. CDHEs may be affected by factors such as abnormal sea surface temperature [52], abnormal atmospheric circulation [53], and human activity [54]. Secondly, although the Science and Technology Innovation index effectively identifies joint anomalies, its relationship with specific sectoral impacts (such as agricultural output losses or public health outcomes) has not been fully explored. Future research should focus on addressing these limitations by incorporating atmospheric and oceanic dynamic drivers, such as abnormal sea surface temperatures and land-atmosphere feedback, into composite event analyses. The development of scenario-based or non-stationary STPI models using CMIP6 or other climate projections will enhance the framework’s ability to simulate future compound extremes under different warming scenarios. In addition, calibrating the STPI threshold using datasets related to impact will enhance its utility in real-world climate risk assessment [55].
In summary, the STPI developed in this study offers a robust tool for quantifying and classifying CDHEs. Rather than serving as a replacement for existing monitoring indices, the STPI provides a complementary approach for characterizing the CDHEs. Its capacity to capture compound extremes enhances its utility in climate risk assessment. As such, the STPI can serve as a valuable decision-support instrument, offering policymakers and stakeholders critical insights for designing effective evaluation frameworks, adaptation strategies, and mitigation measures to address the escalating risks associated with compound climate extremes.

5. Conclusions

Using daily precipitation and temperature data from the national meteorological stations in Northeast China (1961–2020), this study developed a novel compound dry-heat index—the STPI—based on a Copula function framework. By analyzing the spatiotemporal distribution of CDHEs through frequency statistics and hit rate evaluation, several key findings emerged. The SPI showed minimal long-term variation, with slight drought events occurring most frequently, particularly in central Northeast China, where Jilin Province experienced the largest spatial extent of summer drought. In contrast, the STI exhibited a significant upward trend over the study period, indicating a notable increase in both the frequency and intensity of high-temperature events, with Heilongjiang Province identified as the most heat-prone region. The STPI constructed in this study was validated using the hit rate method and found to be highly applicable in the Northeast region, with a hit rate of over 90% in most areas. Notably, the STPI demonstrated a marked downward trend beginning in the 1990s, reflecting an overall intensification of CDHEs in terms of frequency, severity, and spatial coverage. Although this downward trend moderated slightly in the early 21st century, the period following the 1990s was characterized by frequent, severe, and widespread compound events, in contrast to the earlier decades, when such events were generally weak, infrequent, and spatially confined. Overall, the analysis indicates that from 1961 to 2020, CDHEs in Northeast China became increasingly frequent, more severe, and geographically expansive, with the most significant growth observed in the occurrence of high-intensity compound events, underscoring the escalating climate risk posed by compound extremes in the region.

Author Contributions

Conceptualization, R.W. and L.C.; methodology, R.W.; software, L.C.; validation, R.W., Y.S., L.C. and X.B.; formal analysis, R.W. and L.C.; investigation, Y.S.; resources, R.W.; data curation, L.C.; writing—original draft preparation, R.W. and L.C.; writing—review and editing, R.W.; visualization, Y.S.; supervision, R.W.; project administration, R.W.; funding acquisition, R.W. and Y.S. All authors have read and agreed to the published version of the manuscript.

Funding

This research was funded by Doctoral Research Initiation Fund (DRIF), grant number (XB2021007) and Liaoning Provincial Department of Education, grant number (LJKZ0615 and LJKQZ2021139).

Institutional Review Board Statement

Not applicable.

Informed Consent Statement

Not applicable.

Data Availability Statement

The data for this study were obtained from the China Meteorological Science Data Sharing Network (https://data.cma.cn/, accessed on 31 December 2020), and the China National Climate Centre (http://cmdp.ncc-cma.net/, accessed on 20 June 2025).

Acknowledgments

The authors extend their appreciation to the anonymous reviewers for their thoughtful comments and valuable advice.

Conflicts of Interest

The authors declare no conflicts of interest.

References

  1. Robinson, A.; Lehmann, J.; Barriopedro, D.; Rahmstorf, S.; Coumou, D. Increasing heat and rainfall extremes now far outside the historical climate. npj Clim. Atmos. Sci. 2021, 4, 45. [Google Scholar] [CrossRef]
  2. Min, R.; Gu, X.; Guan, Y.; Zhang, X. Increasing likelihood of global compound hot-dry extremes from temperature and runoff during the past 120 years. J. Hydrol. 2023, 621, 129553. [Google Scholar] [CrossRef]
  3. Ghanbari, M.; Arabi, M.; Georgescu, M.; Broadbent, A.M. The role of climate change and urban development on compound dry-hot extremes across US cities. Nat. Commun. 2023, 14, 3509. [Google Scholar] [CrossRef] [PubMed]
  4. Han, Z.; Zhang, H.; Fu, J.; Wang, Z.; Duan, L.; Zhang, W.; Li, Z. Dynamic assessment of the impact of compound dry-hot conditions on global terrestrial water storage. Remote Sens. Environ. 2024, 315, 114428. [Google Scholar] [CrossRef]
  5. Fan, X.; Zhang, Y.; Shi, K.; Peng, J.; Liu, Y.; Zhou, Y.; Liu, Y.; Zhu, Q.; Song, C.; Wan, R.; et al. Surging compound drought–heatwaves underrated in global soils. Proc. Natl. Acad. Sci. USA 2024, 121, e2410294121. [Google Scholar] [CrossRef] [PubMed]
  6. Zhao, W. Extreme weather and climate events in China under changing climate. Natl. Sci. Rev. 2020, 7, 938–943. [Google Scholar] [CrossRef] [PubMed]
  7. Pescaroli, G.; Alexander, D. Understanding Compound, Interconnected, Interacting, and Cascading Risks: A Holistic Framework. Risk Anal. 2018, 38, 2245–2257. [Google Scholar] [CrossRef] [PubMed]
  8. Sun, Y.; Zhang, X.; Shi, X.; Zhang, P. The economic impact of climate risks in China: Evidence from 47-sector panel data, 2000–2014. Nat. Hazards 2019, 95, 289–308. [Google Scholar] [CrossRef]
  9. Wu, X.; Yang, Y.; Jiang, D. Dramatic increase in the probability of 2006-like compound dry and hot events over Southwest China under future global warming. Weather Clim. Extrem. 2023, 41, 100592. [Google Scholar] [CrossRef]
  10. Wu, X.; Hao, Z.; Hao, F.; Singh, V.P.; Zhang, X. Dry-hot magnitude index: A joint indicator for compound event analysis. Environ. Res. Lett. 2019, 14, 064017. [Google Scholar] [CrossRef]
  11. Van den Hurk, B.J.J.M.; Baldissera Pacchetti, M.; Boere, E.; Ciullo, A.; Coulter, L.; Dessai, S.; Ercin, E.; Goulart, H.M.D.; Hamed, R.; Hochrainer-Stigler, S.; et al. Climate impact storylines for assessing socio-economic responses to remote events. Clim. Risk Manag. 2023, 40, 100500. [Google Scholar] [CrossRef]
  12. Sun, H.; Sun, X.; Chen, J.; Deng, X.; Yang, Y.; Qin, H.; Chen, F.; Zhang, W. Different types of meteorological drought and their impact on agriculture in Central China. J. Hydrol. 2023, 627, 130423. [Google Scholar] [CrossRef]
  13. Sattar, M.N.; Lee, J.; Shin, J.; Kim, T. Probabilistic Characteristics of Drought Propagation from Meteorological to Hydrological Drought in South Korea. Water Resour. Manag. 2019, 33, 2439–2452. [Google Scholar] [CrossRef]
  14. Shiau, J. Causality-based drought propagation analyses among meteorological drought, hydrologic drought, and water shortage. Sci. Total Environ. 2023, 888, 164216. [Google Scholar] [CrossRef] [PubMed]
  15. Wilhite, D.A.; Glantz, M.H. Understanding the Drought Phenomenon: The Role of Definitions. Water Int. 1985, 10, 111–120. [Google Scholar] [CrossRef]
  16. Mishra, A.K.; Singh, V.P. A review of drought concepts. J. Hydrol. 2010, 391, 202–216. [Google Scholar] [CrossRef]
  17. Tabari, H.; Willems, P. Global risk assessment of compound hot-dry events in the context of future climate change and socioeconomic factors. npj Clim. Atmos. Sci. 2023, 6, 74. [Google Scholar] [CrossRef]
  18. Palmer, W.C. Meteorological Drought; US Weather Bureau: Washington, DC, USA, 1965; Volume 58, Research Paper No. 45.
  19. Mckee, T.B.; Doesken, N.J.; Kleist, J. The relationship of drought frequency and duration of time scales. In Proceedings of the 8th Conference on Applied Climatology, Anaheim, CA, USA, 17–23 January 1993. [Google Scholar]
  20. Hua, Y.; Qi, H.; Shu, Y.; Jin, Y.; Xue, B.; Zhi, H.; Jing, W. Analysis of Spatio-Temporal Evolution of the Boundary Temperature of Chimonophilous/Thermophilic Crops in Chinese Mainland Based on Site Data. Chin. J. Agrometeorol. 2023, 44, 85–95. [Google Scholar] [CrossRef]
  21. Li, J.; Wang, Z.; Wu, X.; Zscheischler, J.; Guo, S.; Chen, X. A standardized index for assessing sub-monthly compound dry and hot conditions with application in China. Hydrol. Earth Syst. Sci. 2021, 25, 1587–1601. [Google Scholar] [CrossRef]
  22. Wu, X.; Hao, Z.; Zhang, X.; Li, C.; Hao, F. Evaluation of severity changes of compound dry and hot events in China based on a multivariate multi-index approach. J. Hydrol. 2020, 583, 124508. [Google Scholar] [CrossRef]
  23. Xiao, H.; Zhuo, Y.; Pang, K.; Sun, H.; An, Z.; Zhang, X. Evaluation of Extreme Climate Indices over the Three Northeastern Provinces of China Based on CMIP6 Models Outputs. Water 2023, 15, 3895. [Google Scholar] [CrossRef]
  24. Ribeiro, A.F.S.; Russo, A.; Gouveia, C.M.; Páscoa, P.; Zscheischler, J. Risk of crop failure due to compound dry and hot extremes estimated with nested copulas. Biogeosciences 2020, 17, 4815–4830. [Google Scholar] [CrossRef]
  25. Zuo, D.; Hou, W.; Wu, H.; Yan, P.; Zhang, Q. Feasibility of Calculating Standardized Precipitation Index with Short-Term Precipitation Data in China. Atmosphere 2021, 12, 603. [Google Scholar] [CrossRef]
  26. Stagge, J.H.; Tallaksen, L.M.; Gudmundsson, L.; Van Loon, A.F.; Stahl, K. Candidate Distributions for Climatological Drought Indices (SPI and SPEI). Int. J. Climatol. 2015, 35, 4027–4040. [Google Scholar] [CrossRef]
  27. Zscheischler, J.; Michalak, A.M.; Schwalm, C.; Mahecha, M.D.; Huntzinger, D.N.; Reichstein, M.; Berthier, G.; Ciais, P.; Cook, R.B.; El-Masri, B.; et al. Impact of large-scale climate extremes on biospheric carbon fluxes: An intercomparison based on MsTMIP data. Glob. Biogeochem. Cycles 2014, 28, 585–600. [Google Scholar] [CrossRef]
  28. McKee, T.B.; Doesken, N.J.; Kleist, J. Drought Monitoring with Multiple Time Scales. In Proceedings of the 9th Conference on Applied Climatology, Dallas, TX, USA, 15–20 January 1995; pp. 233–236. [Google Scholar]
  29. Hosseinzadehtalaei, P.; Termonia, P.; Tabari, H. Projected changes in compound hot-dry events depend on the dry indicator considered. Commun. Earth Environ. 2024, 5, 220. [Google Scholar] [CrossRef]
  30. Zscheischler, J.; Seneviratne, S. Dependence of drivers affects risks associated with compound events. Sci. Adv. 2017, 3, e1700263. [Google Scholar] [CrossRef] [PubMed]
  31. Zhang, Q.; Yu, X.; Qiu, R.; Liu, Z.; Yang, Z. Evolution, severity, and spatial extent of compound drought and heat events in north China based on copula model. Agric. Water Manag. 2022, 273, 107918. [Google Scholar] [CrossRef]
  32. Hussain, B.; Qureshi, N.A.; Buriro, R.A.; Qureshi, S.S.; Pirzado, A.A.; Saleh, T.A. Interdependence between temperature and precipitation: Modeling using copula method toward climate protection. Model. Earth Syst. Environ. 2022, 8, 2753–2766. [Google Scholar] [CrossRef]
  33. Lazoglou, G.; Anagnostopoulou, C. Joint distribution of temperature and precipitation in the Mediterranean, using the Copula method. Theor. Appl. Climatol. 2019, 135, 1399–1411. [Google Scholar] [CrossRef]
  34. Nelsen, R.B. An Introduction to Copulas; Springer: New York, NY, USA, 2000. [Google Scholar]
  35. Yeo, I.K.; Johnson, R.A. A new family of power transformations to improve normality or symmetry. Biometrika 2000, 87, 954–959. [Google Scholar] [CrossRef]
  36. Ullah, H.; Akbar, M.; Khan, F.; Amjad, M. Performance evaluation of Standardized Copula-based Drought Index with Reconnaissance Drought Index and Standardized Precipitation Temperature Index using severity—Duration frequency curves over Balochistan, Pakistan. Int. J. Climatol. 2023, 43, 2465–2480. [Google Scholar] [CrossRef]
  37. Kang, Y.; Guo, E.; Wang, Y.; Bao, Y.; Bao, Y.; Naren, M.; Runa, A.; Gu, X.; Jin, L. Characterisation of compound dry and hot events in Inner Mongolia and their relationship with large-scale circulation patterns. J. Hydrol. 2022, 612, 128296. [Google Scholar] [CrossRef]
  38. Agbo, E.P.; Nkajoe, U.; Edet, C.O. Comparison of Mann–Kendall and Şen’s innovative trend method for climatic parameters over Nigeria’s climatic zones. Clim. Dyn. 2022, 60, 3385–3401. [Google Scholar] [CrossRef]
  39. Ahmad, I.; Tang, D.; Wang, T.; Wang, M.; Wagan, B. Precipitation Trends over Time Using Mann-Kendall and Spearman’s rho Tests in Swat River Basin, Pakistan. Adv. Meteorol. 2015, 2015, 431860. [Google Scholar] [CrossRef]
  40. Kendall, M.G.; Stuart, A.; Ord, J.K. The Advanced Theory of Statistics, Vol. 3. Technometrics 1947, 5, 525–528. [Google Scholar] [CrossRef]
  41. Brushett, B.A.; King, B.A.; Lemckert, C.J. Assessment of ocean forecast models for search area prediction in the eastern Indian Ocean. Ocean Modell. 2016, 97, 1–15. [Google Scholar] [CrossRef]
  42. Jang, J.; Yu, P.; Yeh, S.; Fu, J.; Huang, C. A probabilistic model for real-time flood warning based on deterministic flood inundation mapping. Hydrol. Process. 2012, 26, 1079–1089. [Google Scholar] [CrossRef]
  43. Ma, F.; Yuan, X.; Li, H. Dominant atmospheric circulation patterns associated with the rapid intensification of summer flash droughts in Eastern China. Sci. Total Environ. 2024, 957, 177416. [Google Scholar] [CrossRef] [PubMed]
  44. Dai, A. Increasing drought under global warming in observations and models. Nat. Clim. Change 2013, 3, 52–58. [Google Scholar] [CrossRef]
  45. He, X.; Gong, D. Interdecadal change in Western Pacific Subtropical High and climatic effects. J. Geog. Sci. 2002, 12, 202–209. [Google Scholar] [CrossRef]
  46. Lu, E.; Zeng, Y.; Luo, Y.; Ding, Y.; Zhao, W.; Liu, S.; Gong, L.; Jiang, Y.; Jiang, Z.; Chen, H. Changes of summer precipitation in China: The dominance of frequency and intensity and linkage with changes in moisture and air temperature. J Geophys. Res. Atmos. 2014, 119, 12575–12587. [Google Scholar] [CrossRef]
  47. Chen, W.; Lu, R. A decadal shift of summer surface air temperature over Northeast Asia around the mid-1990s. Adv. Atmos. Sci. 2014, 31, 735–742. [Google Scholar] [CrossRef]
  48. Han, D.; Yang, G.; Yan, D.; Fang, H. Spatial-temporal Feature Analysis of Drought and Flood in Northeast China in Recent 50 Years. Water Resour. Power 2014, 32, 5–8. [Google Scholar]
  49. Wu, X.; Hao, Z.; Hao, F.; Li, C.; Zhang, X. Spatial and Temporal Variations of Compound Droughts and Hot Extremes in China. Atmosphere 2019, 10, 95. [Google Scholar] [CrossRef]
  50. Gao, X.; Jiang, S.; Wang, S.; Tian, L.; Zhou, M. The division of precipitation change and its regional characteristics in Northeast China during 1961–2014. Chin. J. Ecol. 2016, 35, 1301–1307. [Google Scholar]
  51. Wang, W.; Zhang, Y.; Guo, B.; Ji, M.; Xu, Y. Compound Droughts and Heat Waves over the Huai River Basin of China: From a Perspective of the Magnitude Index. J. Hydrometeorol. 2021, 22, 3107–3119. [Google Scholar] [CrossRef]
  52. Hu, K.; Huang, G.; Qu, X.; Huang, R. The impact of Indian Ocean variability on high temperature extremes across the southern Yangtze River valley in late summer. Adv. Atmos. Sci. 2012, 29, 91–100. [Google Scholar] [CrossRef]
  53. Zhang, H.; Zhang, Q.; Yue, P.; Zhang, L.; Liu, Q.; Qiao, S.; Yan, P. Aridity over a semiarid zone in northern China and responses to the East Asian summer monsoon. J. Geophys. Res. Atmos. 2016, 121, 13901–13918. [Google Scholar] [CrossRef]
  54. Wang, L.; Chen, W.; Chen, Z.; Huang, G. Drought in Southwest China: A Review. Atmos. Oceanic Sci. Lett. 2015, 8, 339–344. [Google Scholar]
  55. Khedun, C.P.; Sohoulande, C.D.D. Probabilistic estimates of drought-induced yield loss in the Southeastern United States. Agric. Syst. 2025, 229, 104418. [Google Scholar] [CrossRef]
Figure 1. Study area of Northeast China showing meteorological station locations and elevation.
Sustainability 17 06569 g001
Figure 2. STPI construction process. KS, Kolmogorov–Smirnov; AIC, Akaike Information Criterion; BIC, Bayesian Information Criterion.
Sustainability 17 06569 g002
Figure 3. Mann–Kendall trends in summer drought based on the SPI index in Northeast China from 1961 to 2020.
Sustainability 17 06569 g003
Figure 4. Proportion of stations experiencing summer drought events by severity class in Northeast China from 1961 to 2020.
Sustainability 17 06569 g004
Figure 5. Frequency of summer drought events by class in Northeast China from 1961 to 2020: (a) slight drought; (b) moderate drought; and (c) severe and extreme droughts.
Sustainability 17 06569 g005
Figure 6. Mann–Kendall trends in summer high temperatures based on the STI index in Northeast China from 1961 to 2020.
Sustainability 17 06569 g006
Figure 7. Proportion of stations with summer high-temperature events by class in Northeast China from 1961 to 2020.
Sustainability 17 06569 g007
Figure 8. Frequency of summer high-temperature events by class in Northeast China from 1961 to 2020: (a) slight high temperature; (b) moderate high temperature; and (c) severe and extreme high temperatures.
Sustainability 17 06569 g008
Figure 9. Mann–Kendall trends in summer compound drought and heat extremes (CDHEs) based on the STPI index in Northeast China from 1961 to 2020.
Sustainability 17 06569 g009
Figure 10. Proportion of stations with summer CDHEs by class in Northeast China from 1961 to 2020.
Sustainability 17 06569 g010
Figure 11. Spatial distribution map of summer STPI variation in Northeast China from 1961 to 2020: (a) 1961 to 1970; (b) 1971 to 1980; (c) 1981 to 1990; (d) 1991 to 2000; (e) 2001 to 2010; (f) 2011 to 2020.
Sustainability 17 06569 g011
Figure 12. Trend distribution of summer SPI, STI, and STPI in Northeast China from 1961 to 2020: (a) SPI; (b) STI; and (c) STPI.
Sustainability 17 06569 g012
Figure 13. The relative contribution of SPI and STI to the trend of the severity of compound events based on STPI in Northeast China during the summer of 1961 to 2020.
Sustainability 17 06569 g013
Figure 14. Spatial distribution of STPI index hit rate in Northeast China in summer.
Sustainability 17 06569 g014
Table 1. Classification of heat conditions based on the Standardized Temperature Index (STI).
STICategory
2.0 ≤ STIExtreme heat
1.5 ≤ STI < 2.0Severe heat
1.0 ≤ STI < 1.5Moderate heat
0.5 ≤ STI < 1.0Slight heat
Table 2. Classification of drought conditions based on the Standardized Precipitation Index (SPI).
SPICategory
−1.0 ≤ SPI < −0.5Slight drought
−1.5 < SPI ≤ −1.0Moderate drought
−2.0 < SPI ≤ −1.5Severe drought
SPI ≤ −2.0Extreme drought
Table 3. Test results of 5 Copula distribution functions for summer drought–heat characteristic variables at 81 sites.
Copula Distribution FunctionStatistical Proportion of Goodness of Fit %
Student-t75.6
Frank20.3
Clayton0
Gumbel4.1
Symmetrized Joe-Clayton0
Table 4. Classification of compound dry heat conditions based on the Standardized Temperature–Precipitation Index (STPI).
STPICategory
−1 ≤ STPINormal
−1.5 ≤ STPI < −1Slight dry heat event
−2 ≤ STPI < −1.5Moderate dry heat event
−2.5 ≤ STPI < −2Severe dry heat event
STPI < −2.5Extreme dry heat event
Table 5. Years of compound dry–heat events in Northeast China with corresponding STI, SPI, STPI, and Standardized Drought–Heat Index (SDHI) values and grades.
YearSTPIGradesSDHIGradesSTISPI
1982−1.57Moderate dry heat event−0.74Slight dry heat event0.41−0.74
1994−1.15Slight dry heat event−0.43No dry heat event1.890.82
1997−1.51Moderate dry heat event−0.77Slight dry heat event1.11−0.33
2004−1.03Slight dry heat event−0.44No dry heat event0.51−0.57
Disclaimer/Publisher’s Note: The statements, opinions and data contained in all publications are solely those of the individual author(s) and contributor(s) and not of MDPI and/or the editor(s). MDPI and/or the editor(s) disclaim responsibility for any injury to people or property resulting from any ideas, methods, instructions or products referred to in the content.

