Article

Efficiency Enhancement of Photovoltaic Panels via Air, Water, and Porous Media Cooling Methods: Thermal–Electrical Modeling

1
Laboratoire des Systèmes Complexe (LSC), Ecole Supérieure en Génie Electrique et Energétique ESGEE Oran, Chemin Vicinal N9, Oran 31000, Algeria
2
Department of Mechanics and Advanced Materials, School of Engineering and Sciences, Campus Monterrey, Tecnológico de Monterrey, Av. Eugenio Garza Sada 2501 Sur, Tecnológico, Monterrey 64849, Mexico
3
Mechanical Engineering Department, College of Engineering and Architecture, Umm Al-Qura University, P.O. Box 5555, Makkah 24382, Saudi Arabia
4
Engineering Doctoral Program, Universidad de La Frontera, Francisco Salazar 01145, Temuco 4780000, Chile
5
Department of Mechanical Engineering, Universidad de La Frontera, Temuco 4811230, Chile
*
Author to whom correspondence should be addressed.
Sustainability 2025, 17(14), 6559; https://doi.org/10.3390/su17146559
Submission received: 16 May 2025 / Revised: 14 July 2025 / Accepted: 14 July 2025 / Published: 18 July 2025

Abstract

Improving photovoltaic (PV) panel performance under extreme climatic conditions is critical for advancing sustainable energy systems. In hyper-arid regions, elevated operating temperatures significantly reduce panel efficiency. This study investigates and compares three cooling techniques—air cooling, water cooling, and porous media cooling—using thermal and electrical modeling based on CFD simulations in ANSYS. The numerical model replicates a PV system operating under peak solar irradiance (900 W/m2) and realistic ambient conditions in Adrar, Algeria. Simulation results show that air cooling leads to a modest temperature reduction of 6 °C and a marginal efficiency gain of 0.25%. Water cooling, employing a top-down laminar flow, reduces cell temperature by over 35 °C and improves net electrical output by 30.9%, despite pump energy consumption. Porous media cooling, leveraging passive evaporation through gravel, decreases panel temperature by around 30 °C and achieves a net output gain of 26.3%. Mesh sensitivity and validation against experimental data support the accuracy of the model. These findings highlight the significant potential of water and porous material cooling strategies to enhance PV performance in hyper-arid environments. The study also demonstrates that porous media can deliver high thermal effectiveness with minimal energy input, making it a suitable low-cost option for off-grid applications. Future work will integrate long-term climate data, real diffuser geometries, and experimental validation to further refine these models.

1. Introduction

Evaluating the efficiency of solar systems is crucial for optimizing the integration of renewable energy sources. However, climatic fluctuations such as changes in ambient temperature, wind speed, and solar irradiance significantly influence the performance of photovoltaic (PV) panels [1]. To mitigate these effects, various cooling techniques have been proposed and investigated in the literature [2]. These strategies can be grouped into several categories: evaporative cooling, water immersion, fluid circulation through channels or pipes, spraying, impingement jets, geothermal cooling, and natural convection.
Numerous studies have examined the effectiveness of these approaches. Abou Akrouch et al. [2] conducted a comprehensive review of PV panel cooling techniques. Their study proposed a new classification of cooling methods including passive, active, geothermal, and nanofluid-based systems, emphasizing the importance of selecting the right technology based on climatic and economic conditions. Wassie et al. [3] examined how climate fluctuations affect PV panel efficiency. Their analysis showed that increases in both ambient and module temperatures significantly reduce energy output, highlighting the importance of cooling, particularly in hot climates. Kumar et al. [4] reviewed recent progress in passive PV cooling techniques, demonstrating that such simple and low-cost methods can meaningfully reduce surface temperatures and enhance efficiency without relying on external energy. Abou Akrouch et al. [5] experimentally compared different panel cooling techniques. They measured thermal and electrical performance, providing a ranking based on the energy efficiency-to-cost ratio.
Sharaf et al. [6] identified major environmental factors affecting PV module performance, including wind speed, solar irradiance, ambient temperature, and dust accumulation. Their study recommended adapting cooling strategies to these variables. Ibrahim et al. [7] conducted a comparative analysis of cooling techniques, factoring in economic and environmental aspects. They concluded that thermoelectric cooling offers an optimal trade-off between thermal performance and operational cost. Muhe et al. [8] developed a solution integrating phase change materials (PCMs) and water jackets in two configurations. Their experimental results showed a clear improvement in thermal regulation and significant increases in output power. Abdel-Aziz et al. [9] reviewed several innovations aimed at improving PV module performance, focusing on thermal coatings, specialized fluids, and nanomaterials, achieving thermal efficiency gains of up to 16.5%. Sathyamurthy et al. [10] conducted experiments using hybrid CNT/Al2O3 nanofluids for PV panel cooling. They reported a substantial drop in surface temperature and a direct improvement in electrical output. Mustafa Ghazali Ali et al. [11] investigated the use of porous clay as an evaporative cooling material. Applied to building-integrated PV modules, this system reduced the temperature by 19.1 °C and increased efficiency by 9.8%. Ahmed Ameen Ali et al. [12] conducted experiments combining metal waste (iron filings) with PCMs. The results showed significant improvements in thermal efficiency and power output leveraging industrial recycling. H. Zuriegat et al. [13] studied the effect of cooling methods on the productivity of PV modules in Jordan through experimental and simulation investigations using TRNSYS software. It was found that the proposed cooling method resulted in an average temperature reduction of 4.62 °C (9.55%), an average power enhancement of 8.08%, and an efficiency improvement of 10.41%.
Agyekum et al. [14] experimented with dual-surface cooling of PV panels, increasing power output by 30% through enhanced heat transfer on both panel surfaces. Kumari et al. [15] investigated heat-harvesting technologies to recover thermal energy from PV modules. Their findings demonstrated simultaneous improvements in both thermal and electrical performance. Al Miaari et al. [16] studied the use of stabilized phase change materials in PV modules. Their tests showed a 9.02% increase in power output due to sustained and environmentally friendly thermal regulation. Chanphavong et al. [17] conducted an experimental and exergy-based study on water-cooled PV panels in Laos. They reported a 2.91% improvement in exergy efficiency, supporting the value of low-complexity active cooling. Zabihi Sheshpoli et al. [18] optimized a hybrid PV/T system by inserting metal spirals into the cooling tubes, achieving gains of 2.29% in electrical efficiency and 16.87% in thermal efficiency. Saada et al. [19] used CFD simulations in ANSYS 17 to evaluate a geothermal cooling system in Kirkuk (Iraq). The results confirmed a significant reduction in module temperature, validating the effectiveness of underground cold sources. Bulat et al. [20] found that active cooling, particularly using nanofluids, significantly improves the performance of photovoltaic–thermoelectric hybrid systems by up to 9.45%. Yamini et al. [21] developed an Arduino-based solar tracking system with integrated cooling. Their study showed that combining tracking and active cooling significantly boosts panel efficiency, especially under high solar exposure.
Wongwuttanasatian et al. [22] evaluated a passive cooling system using PCMs embedded in finned heat sinks. The results showed a 5.3% efficiency gain, highlighting the potential of low-energy passive solutions. Dhokane and Ramesh [23] developed an electromechanical mechanism aimed at enhancing PV panel reliability by limiting overheating. This approach demonstrated clear benefits in maintaining stable energy production. Hosseinghorbani et al. [24] enhanced a CPVT (concentrated photovoltaic thermal) system using a variable-width wavy (VWW) fin. The optimized geometry increased fluid turbulence, improving heat transfer and overall system efficiency. Popovici et al. [25] studied air-based heat sinks on PV modules. Their experiments showed that these passive exchangers significantly reduce panel operating temperatures and improve efficiency. Sargunanathan et al. [26] conducted a comprehensive review of effective PV cell cooling methods, comparing passive and active approaches and identifying the most suitable technologies based on climate and economics. Metwally et al. [27] conducted a numerical study on a hybrid system combining a thermoelectric generator (TEG) with a PCM (RT25). The results showed dual energy recovery: thermal management and electrical efficiency improvement. Javidan and Moghadam [28] tested a water jet cooling system applied to PV modules. Their method achieved a dramatic temperature drop from 63.95 °C to 33.68 °C, significantly improving panel efficiency. Saeed et al. [29] used PCMs combined with rectangular fins for enhanced heat dissipation. Their system increased output power by 16 W, demonstrating its effectiveness for high-solar-irradiation environments. Prakash et al. [30] reviewed the combined use of PCMs and nanofluids in PV cooling. Their study found that hybrid technologies can improve energy efficiency by up to 35%, depending on operating conditions.
Kaneesamkandi and Rehman [31] employed a multi-criteria decision analysis to evaluate and select the most suitable PV cooling technique. Their model considered performance, cost, complexity, and environmental impact. Faheem et al. [32] evaluated a hybrid system combining thermoelectric generation and PV cooling. The results showed an overall efficiency increase of 15%, underscoring the potential of integrated PV+TE systems. Hudișteanu et al. [33] conducted an in-depth experimental analysis of temperature effects on mono- and polycrystalline PV modules. They showed that back-side ventilation is an effective solution for minimizing overheating losses. Hajjaj et al. [34] presented a review focused on next-generation materials, especially cellulose nanocrystals (CNCs), used to improve the thermal properties of PV modules. They concluded that CNCs offer high potential for sustainable cooling with low environmental impact.
From the discussions above, it is clear that there is a research gap in the use of ANSYS for the simulation and performance evaluation of solar panel cooling techniques under real environmental conditions. This study addresses that gap by numerically analyzing and comparing three distinct cooling strategies—air, water, and porous media cooling—within a hyper-arid climatic context, specifically that of Adrar, Algeria. The goal is to evaluate the thermal and electrical performance of each method using CFD simulations, assess their practical efficiency, and identify the most effective and energy-efficient solution. Special emphasis is placed on porous media cooling, which remains underexplored in the literature despite its promising passive performance. By linking simulation results to performance metrics such as temperature reduction, energy output, and net efficiency, this work provides a comprehensive basis for selecting suitable PV cooling strategies in harsh desert environments.
This study distinguishes itself by comparing three different cooling methods—air, water, and porous media—within a hyper-arid climatic context (Adrar, Algeria). Unlike previous works that focus mainly on temperate or humid climates, our study justifies the use of these three methods based on their respective applicability to harsh, off-grid environments. Porous media cooling, in particular, remains underexplored despite its promising potential for passive heat exchange under low-resource conditions.
This work is divided into four parts. Section 2 discusses various techniques to quantify the performance of solar PV cells. Section 3 discusses the results of various parameters of these cells, like power, current, voltage, and temperature performance. Section 4 presents conclusions and future recommendations.

2. Materials and Methods

This section outlines the simulation steps taken and metrics considered to address the research questions, specifically evaluating the thermal and electrical performance of different cooling strategies for photovoltaic panels in hyper-arid conditions.

2.1. PV System Performance Indices

The effectiveness and efficiency of photovoltaic (PV) systems can be defined by the following parameters:
Fill factor: This represents the conversion efficiency of solar cells. It is the ratio of the maximum power output of the cell ( P max ) and the product of its open-circuit voltage ( V o c ) and short-circuit current ( I s c ) [21]:
F F = P max V o c I s c
System Efficiency: This is defined as the ratio of the output energy of the PV system to the energy of the incoming solar irradiation incident on the same PV panel’s area [26]:
η s y s = E p v I r i
with E p v being the generated energy from the PV system in kWh. I r i is the irradiation incident on the PV array’s area in kWh.
The effect of temperature is taken into account in the equation below [31]:
η m p = η m p , s t c ( 1 + μ p ( T c T c , s t c ) )
where η m p , s t c is the system efficiency of the PV system at maximum power under standard test conditions [29]:
η m p , s t c = V m p × I m p G T × A p v
where V m p is the maximum output voltage [V], I m p is the maximum output current [A], P max is the rated maximum power output [W], A p v is the PV module area [m2], G T is the solar radiation on the PV module [kW/m2], μ p is the temperature coefficient [%/°C], T c is the temperature of the PV system under operating conditions, and T c , s t c is the standard test condition temperature.

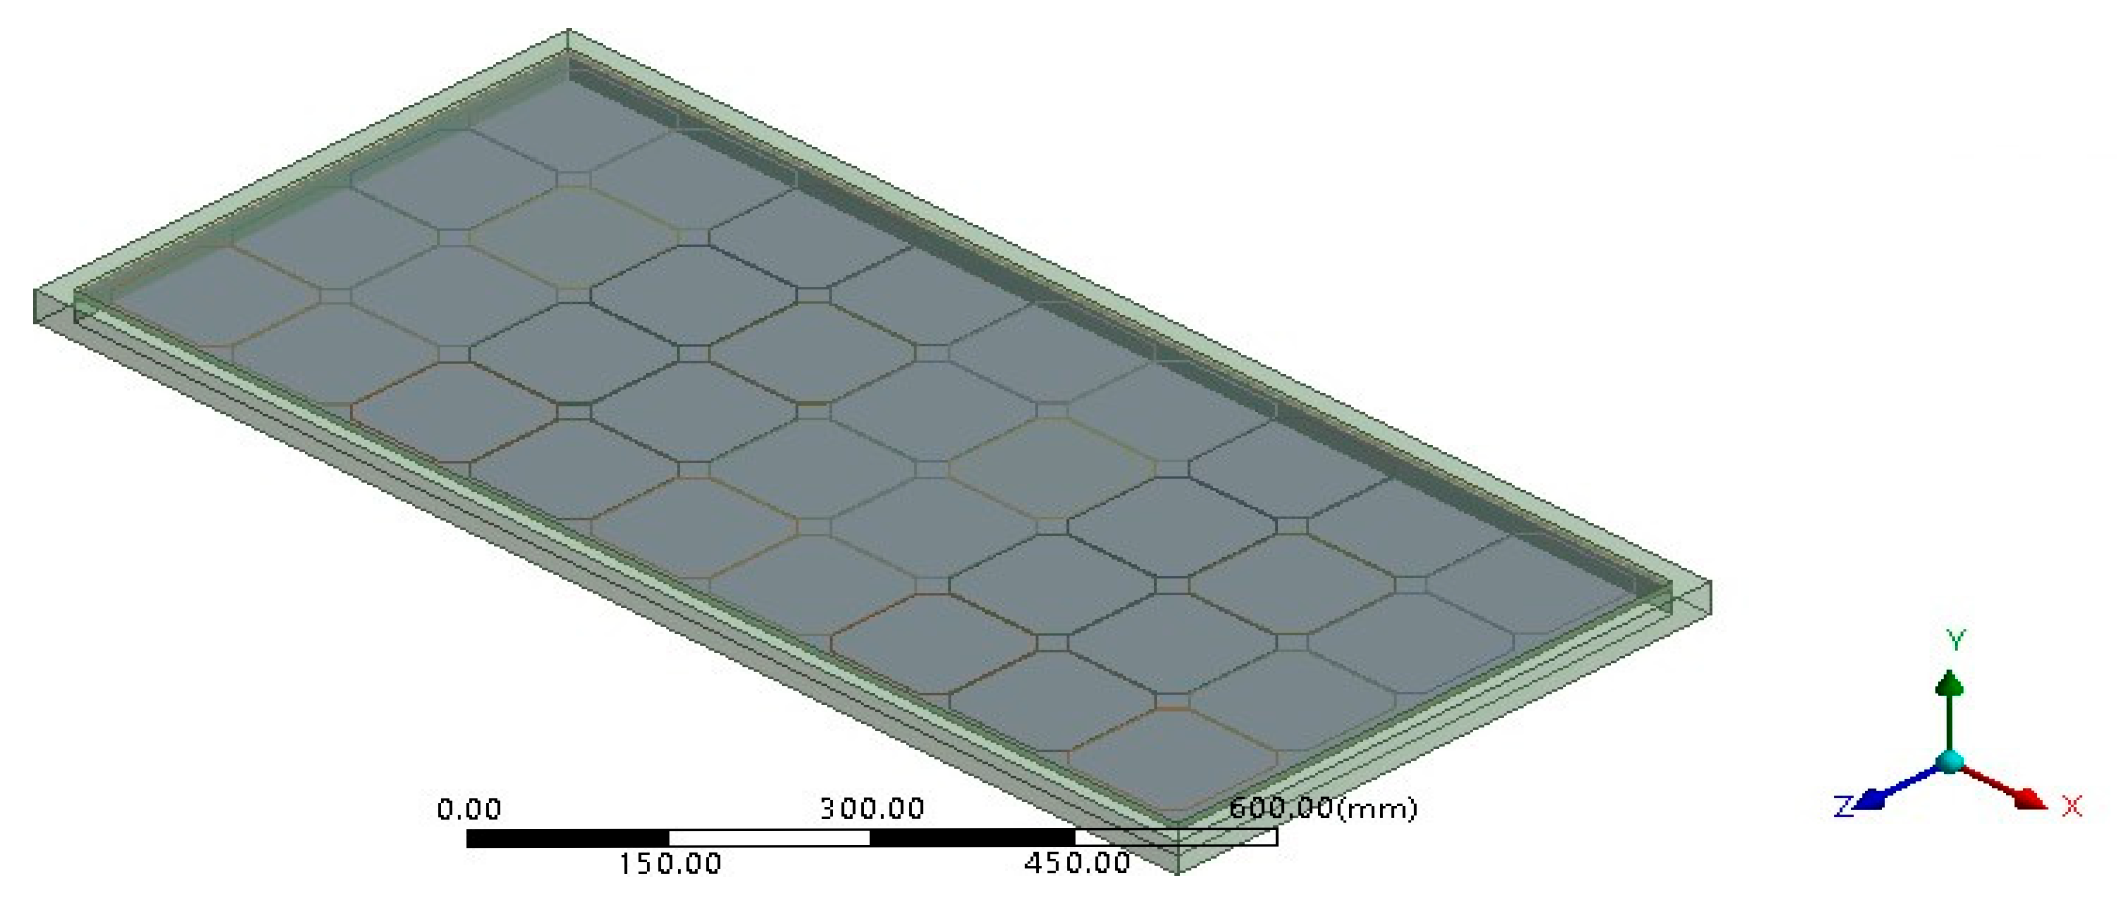
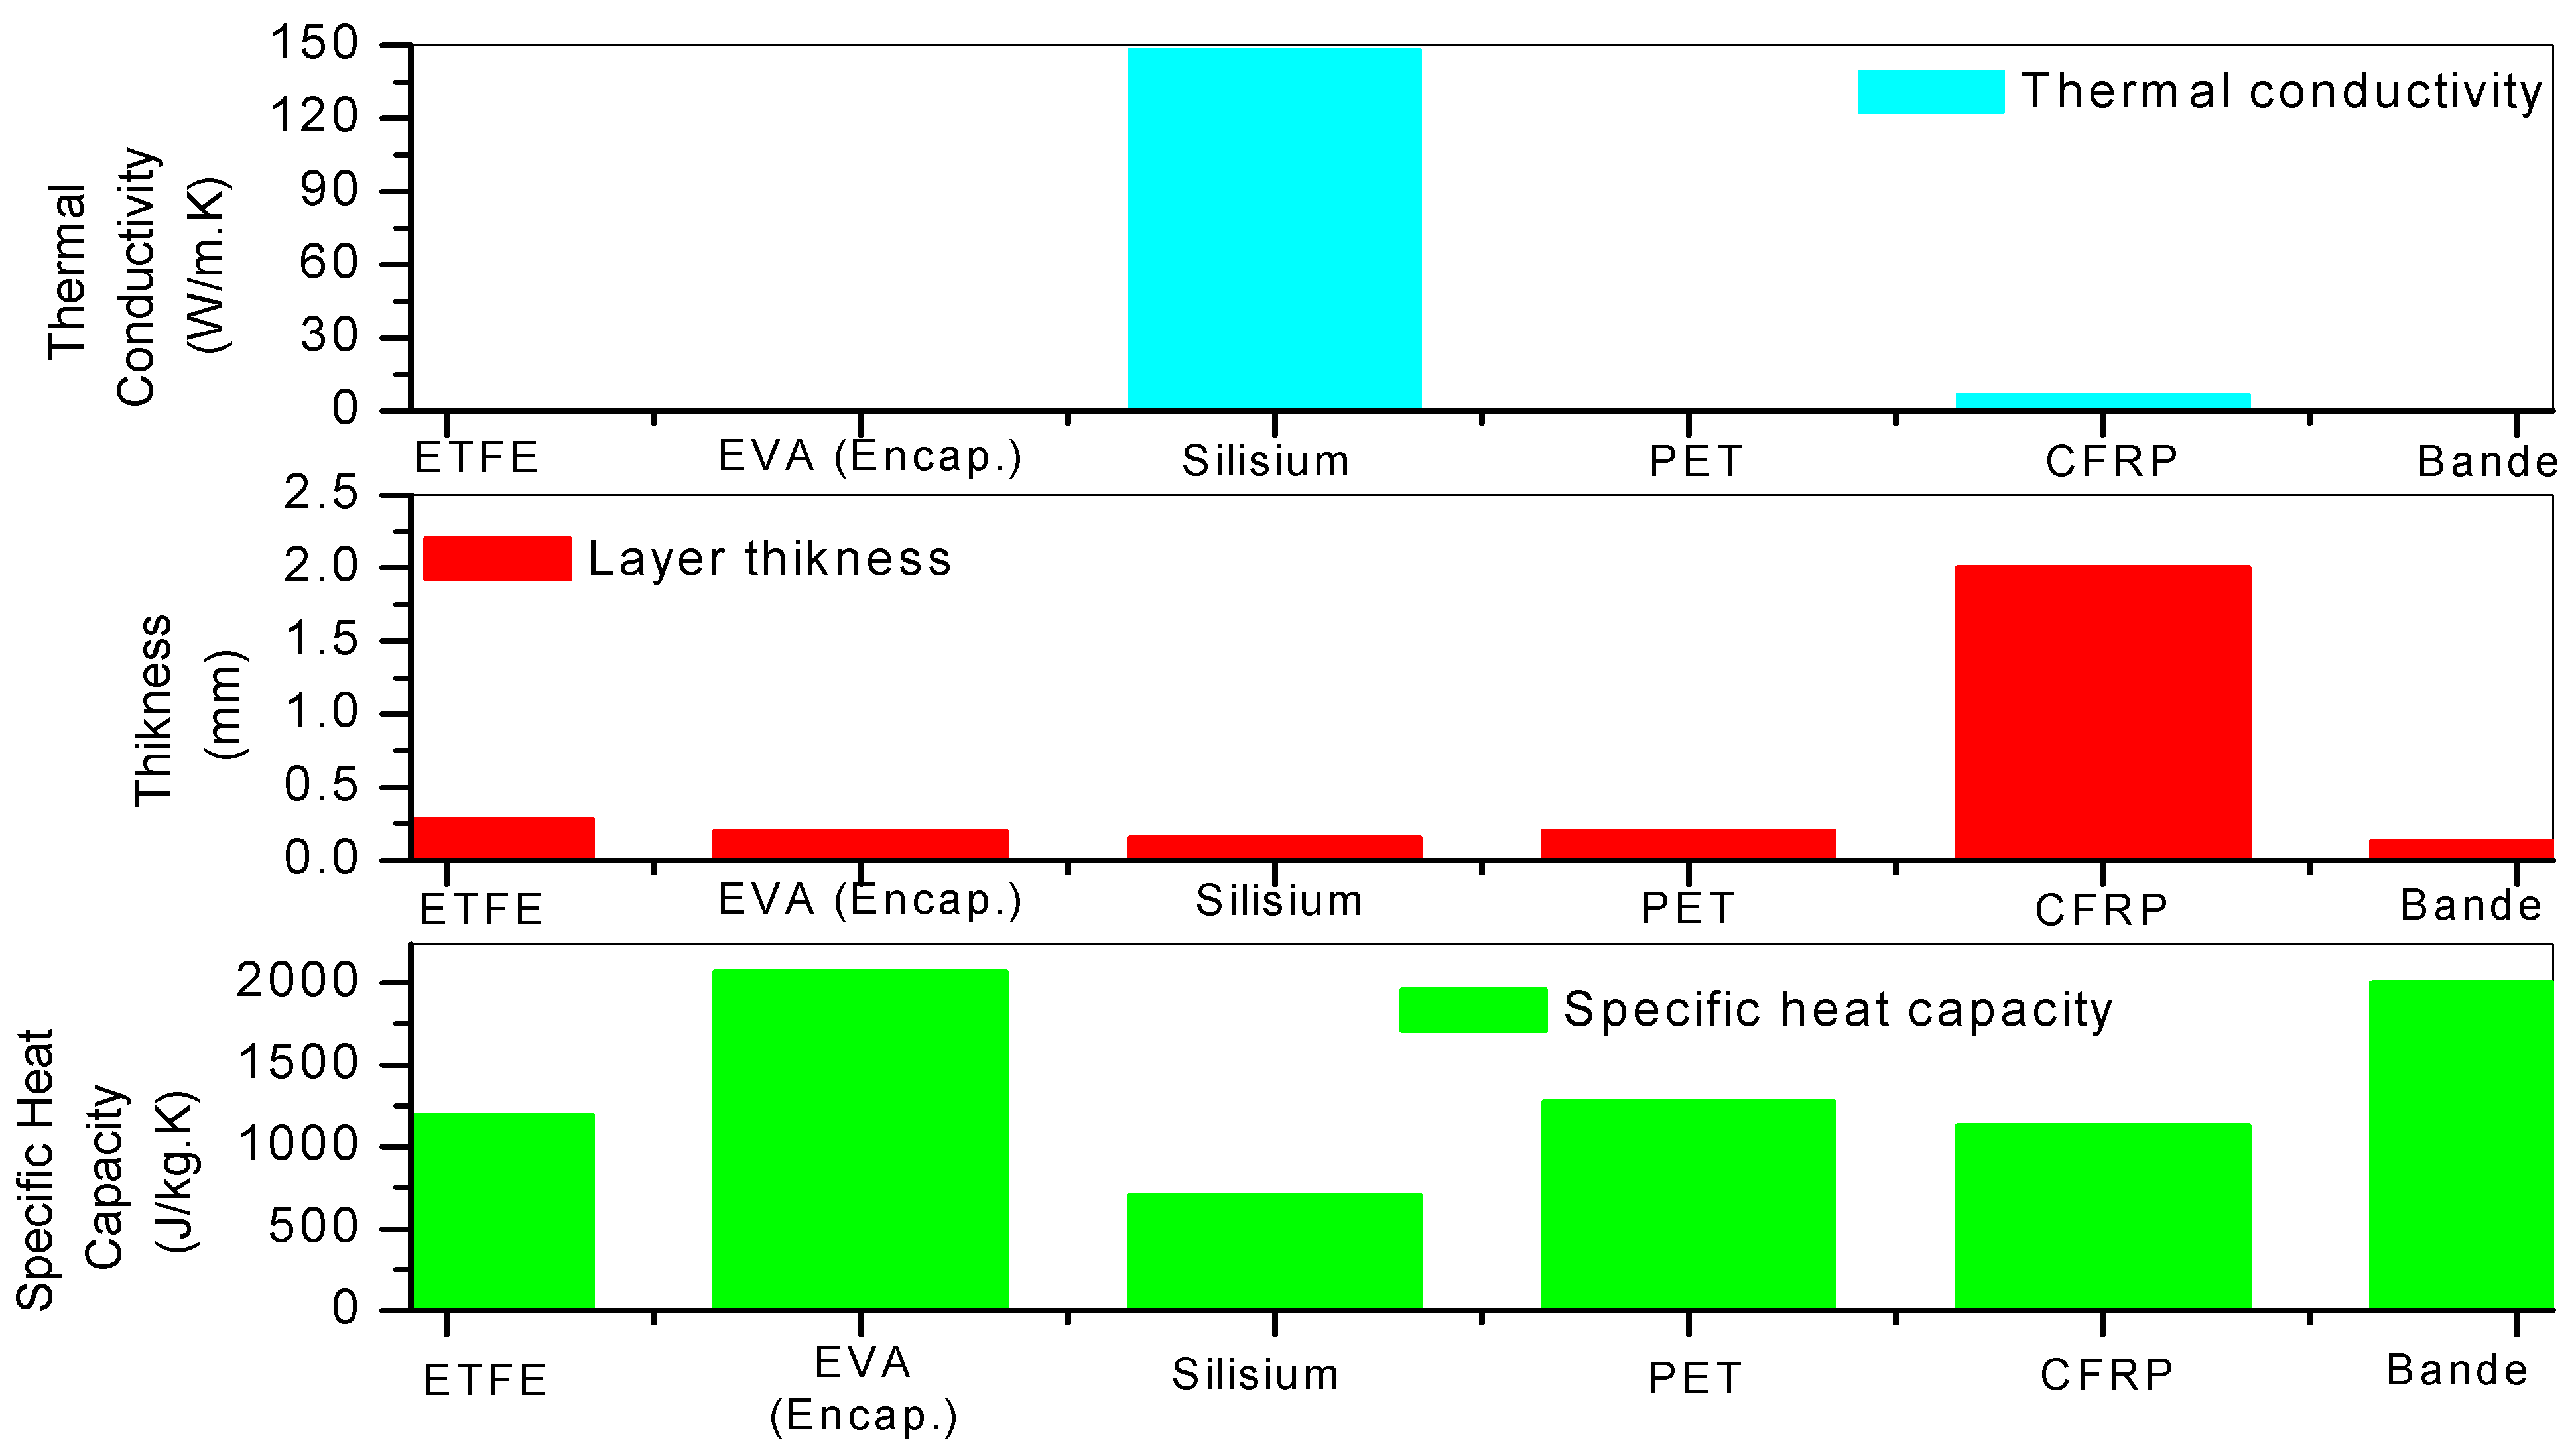
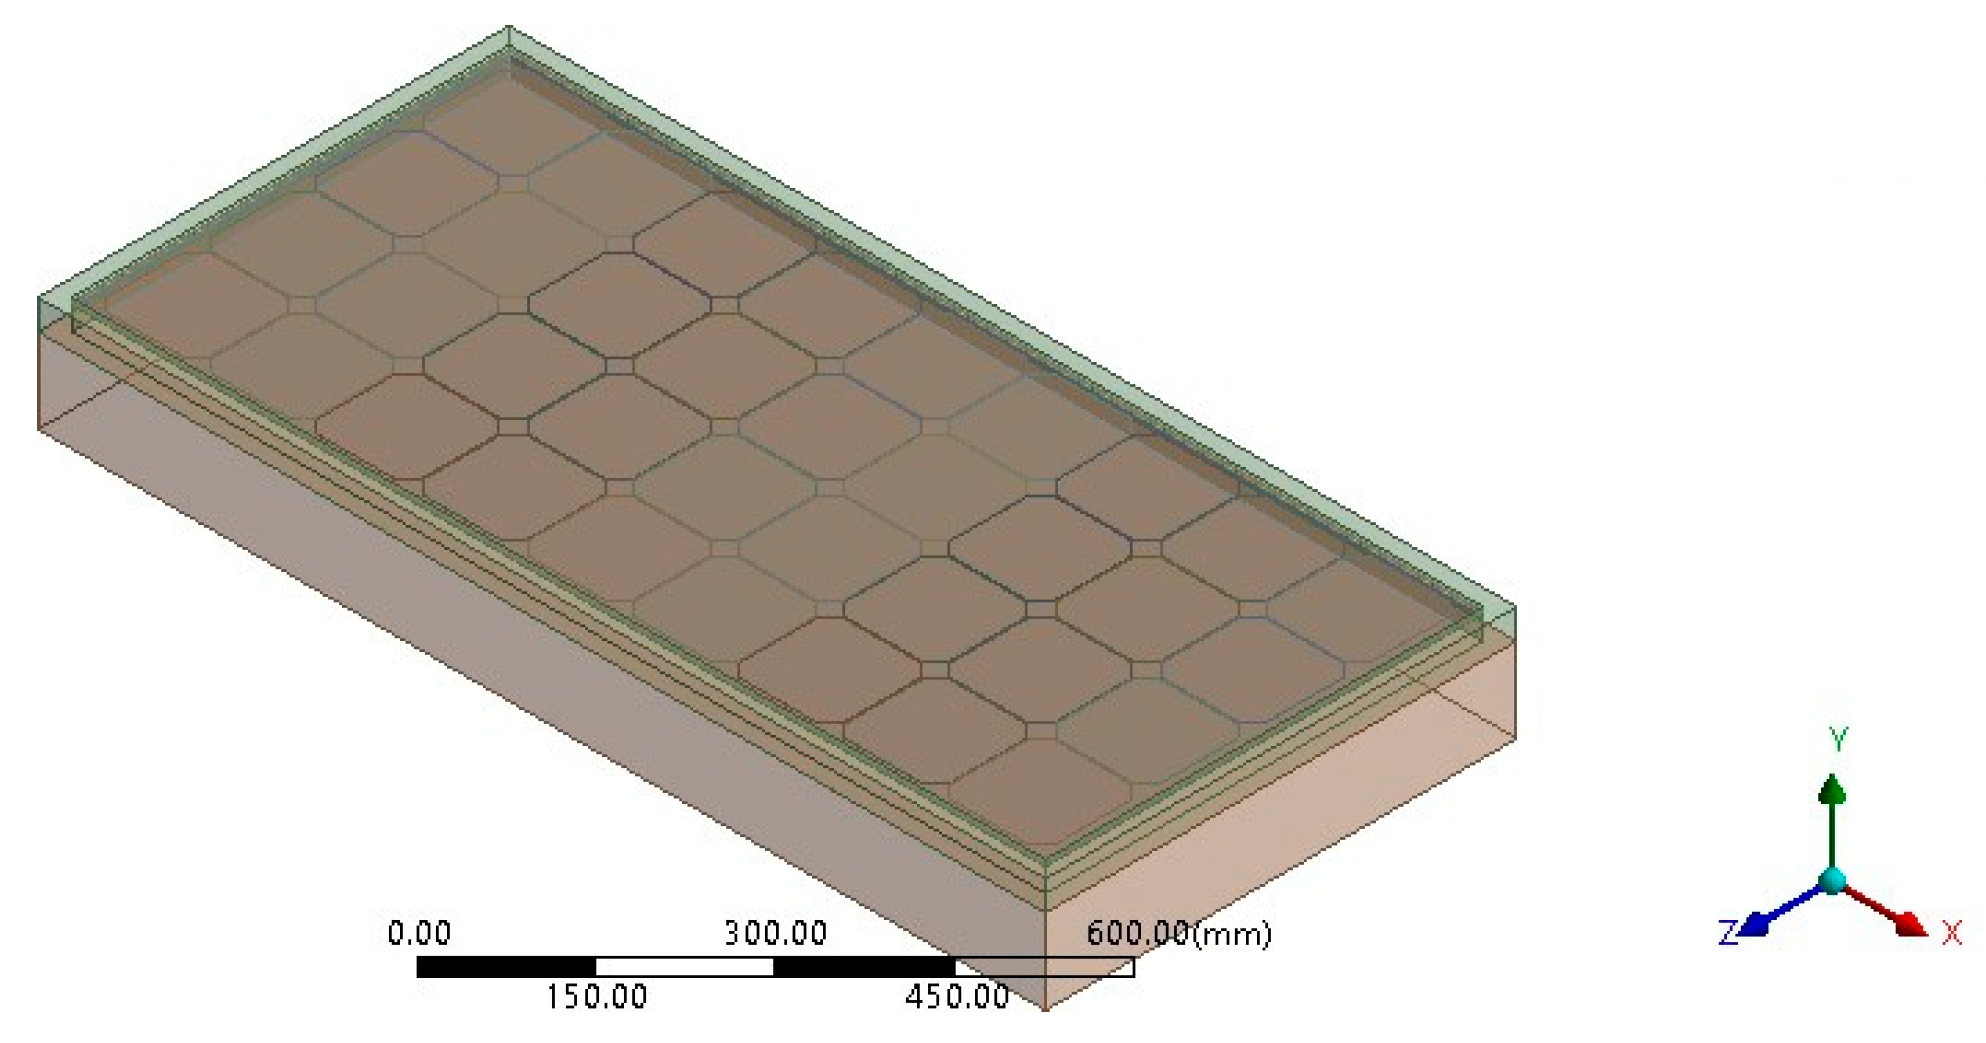
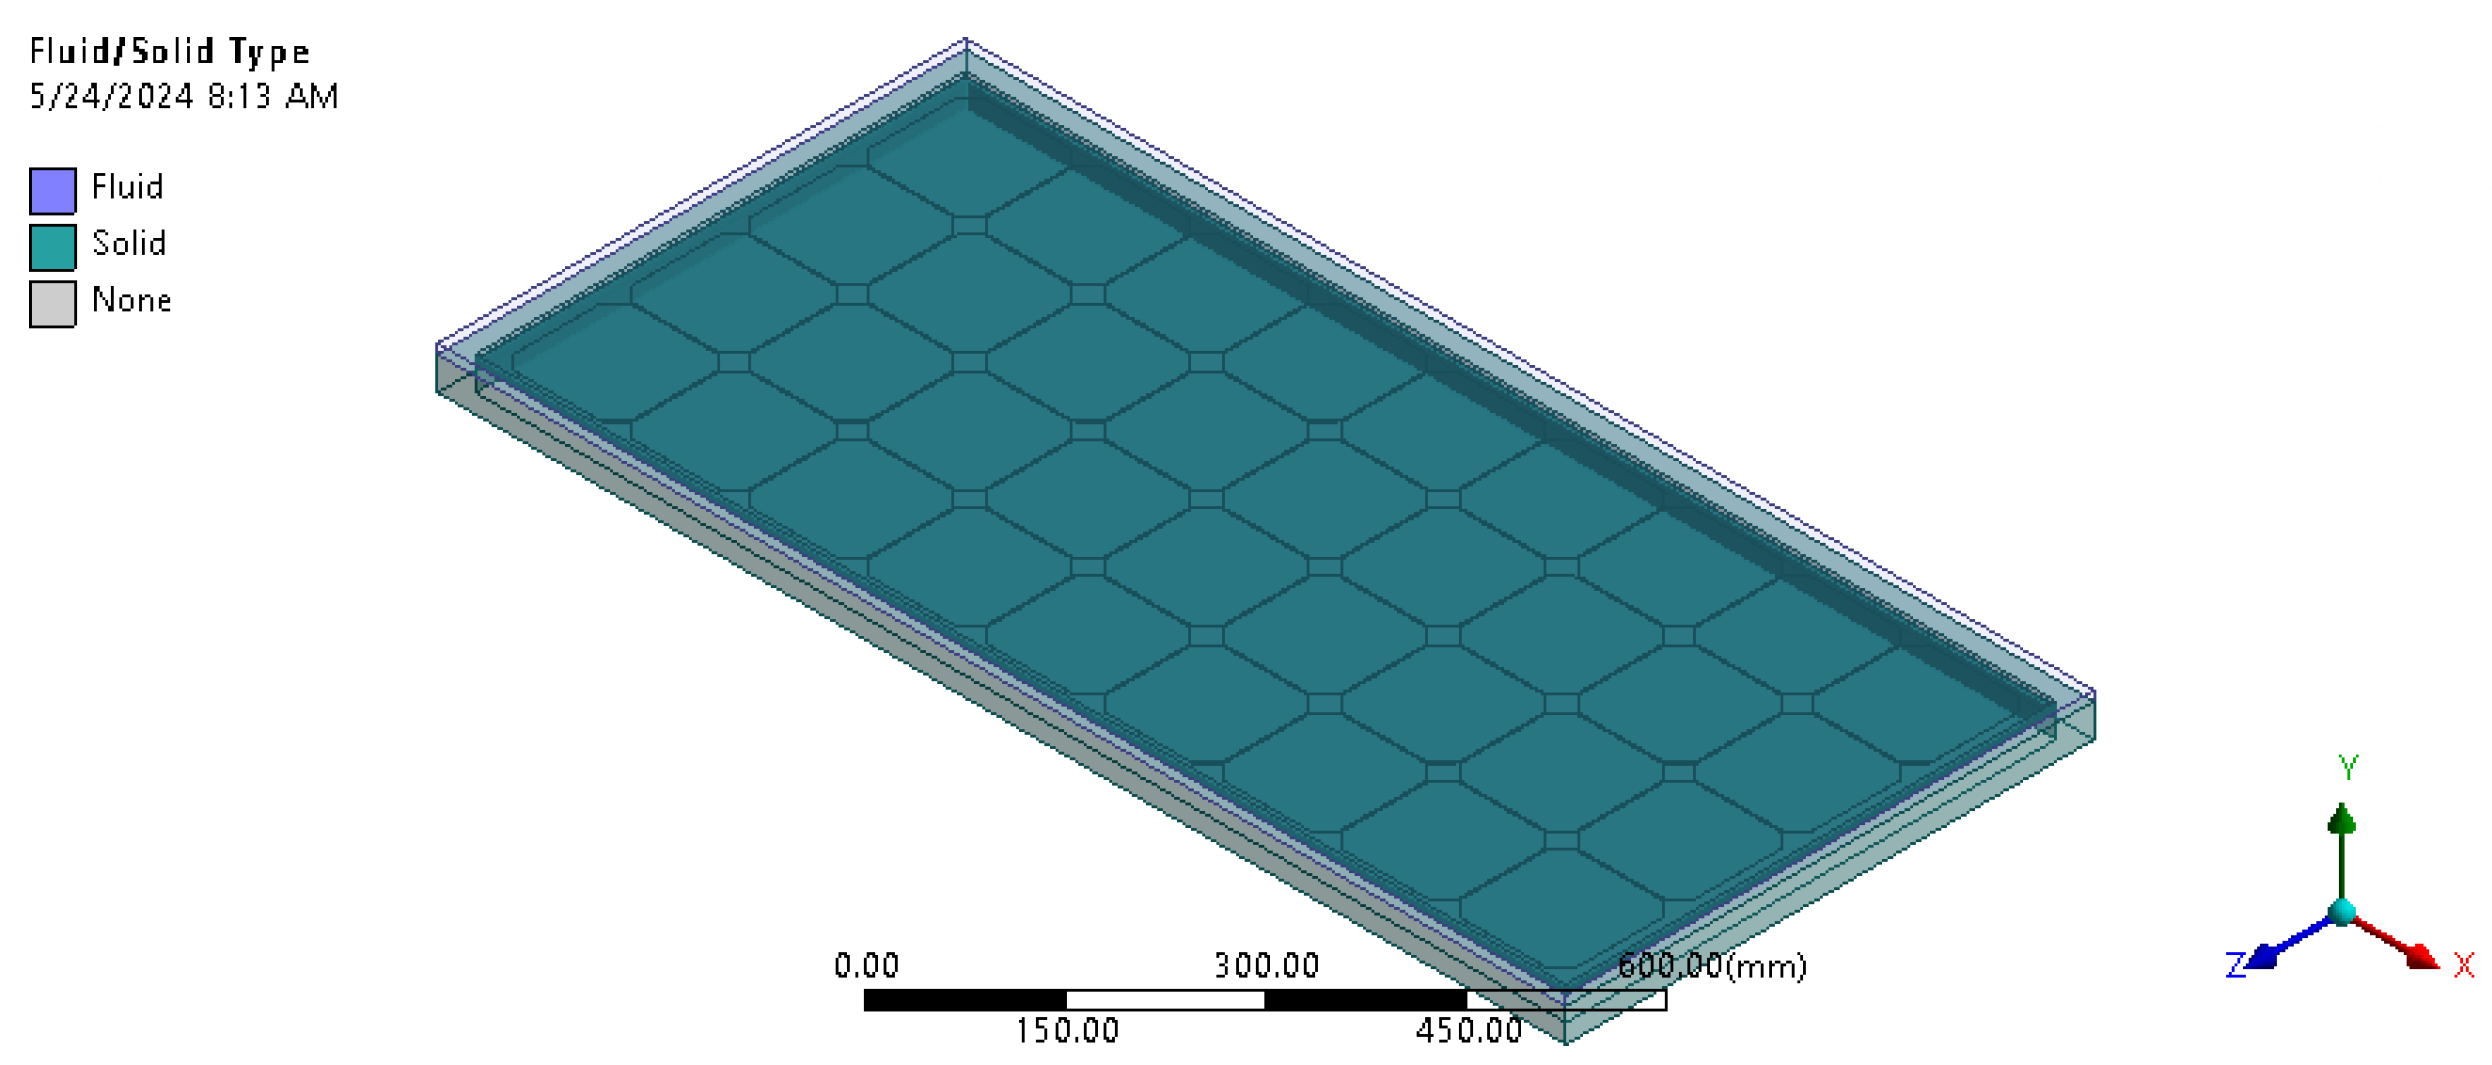
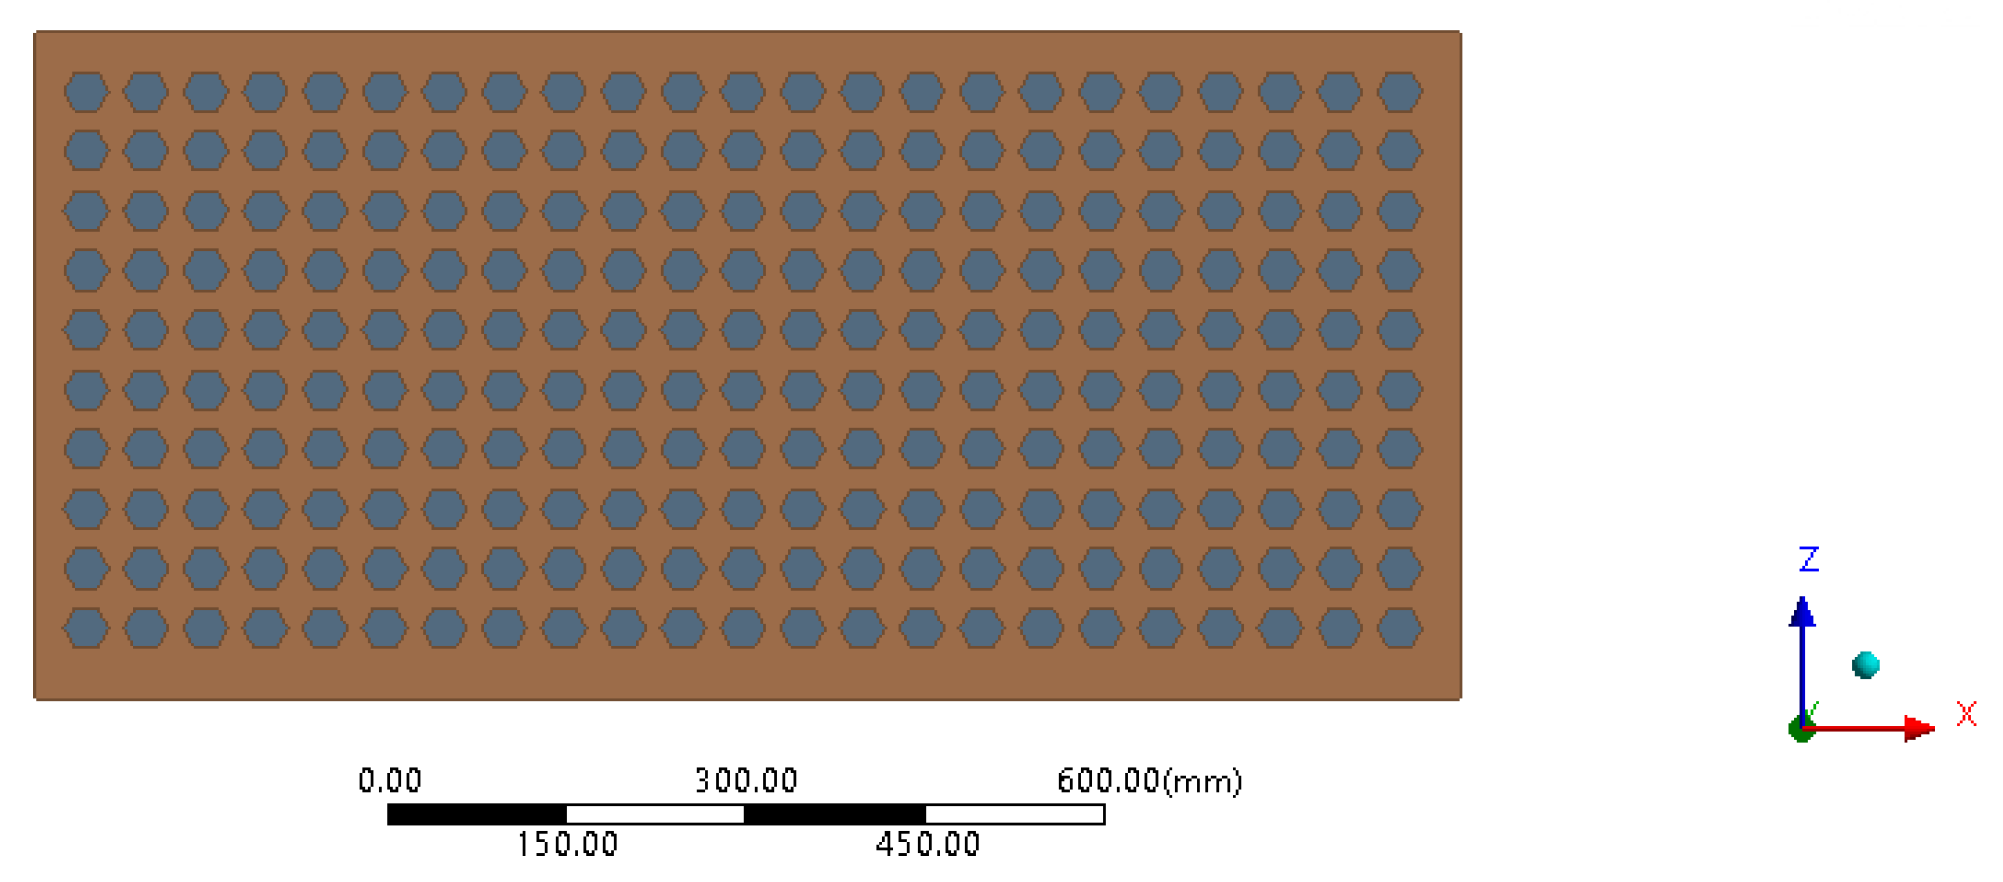
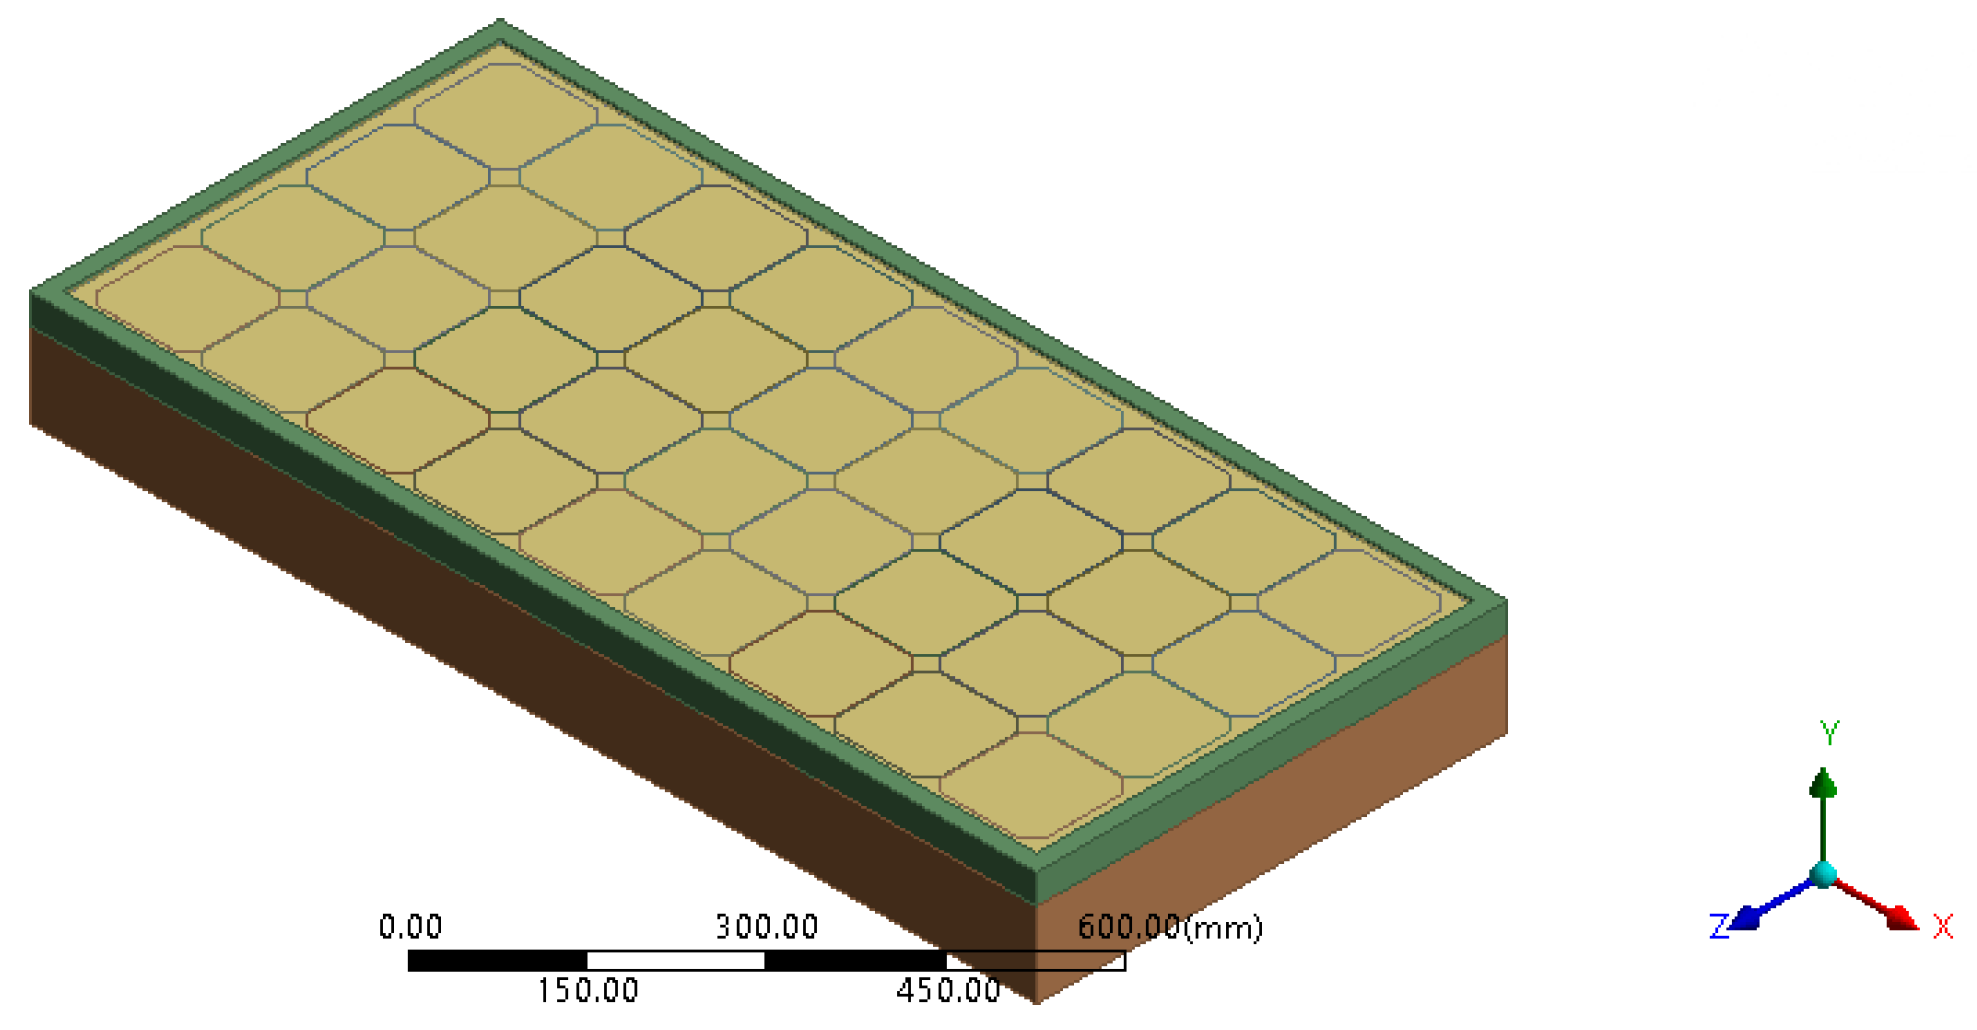
2.2. Numerical Modeling

Cooling systems play a critical role in enhancing the performance of photovoltaic (PV) panels by mitigating temperature-induced efficiency losses. This section outlines the numerical simulation approach used to evaluate and compare three distinct cooling methods—air cooling, water cooling, and porous media cooling—with respect to both efficiency and cost-effectiveness [23].
The simulations were conducted using various modules within the ANSYS suite, including Design Modeler, Fluent, and Mechanical. Design Modeler was used to create the geometries of the PV panel, air-cooling ducts, and porous media casing. ANSYS Fluent was employed to simulate fluid flow and heat transfer associated with the air and water cooling systems. Additionally, the Mechanical module (both Steady-State and Transient Thermal environments) was used to evaluate the thermal response of the system materials and to model heat conduction through the panel structure [16]. The mesh size was set to 1 mm.
The simulation setup included the modeling of solar panel geometry, assignment of boundary conditions, specification of material properties, and configuration of each cooling strategy.
The first step involved creating the geometry of the solar panel to mimic a real-life mono-crystalline solar panel configuration, as seen in Figure 1. The panel consisted of 36 silicon cells sandwiched between two layers of ethylene–vinyl acetate (EVA). The panels had a front-sheet layer made of ethylene tetra-fluoro-ethylene (ETFE) and a back-sheet layer of polyethylene terephthalate. Furthermore, the layer of carbon fiber reinforced polymer (CFRP) served as a support, along with an adhesive layer to secure all the components [19]. Figure 1 provides a comprehensive overview of each layer.
The following step was to detail the physical and thermal characteristics of each layer and the materials they comprised. This careful mapping guaranteed that our simulation would produce accurate results. Figure 2 illustrates the various thermal and physical properties associated with each layer and its respective material.
The specifications of the solar panel used in this research are detailed in Table 1.
With a total of 330,060 nodes and 90,000 elements, the mesh size was set to 10−2 for mesh generation, as shown in Figure 3, with a skewness rate of 0.85 or lower and maintaining a low aspect ratio [36].
Initially, a Steady-State Thermal analysis was conducted to establish a stable thermal state. Subsequently, a Transient Thermal analysis was performed using the results from the Steady-State analysis. For this analysis, boundary conditions were set based on temperature data corresponding to 21 July 2023, for the region of Adrar, Algeria, ensuring the simulation captured realistic environmental conditions as shown in Table 2.
The considered constant irradiance of 900 W/m2 was applied to replicate solar radiation, although a heat flux of 900 W/m2 was applied as a boundary condition to represent peak solar radiation We acknowledge that for an inclined panel (30°), the effective flux would be approximately 779.4 W/m2. This simplification is commonly adopted in CFD modeling to represent worst-case thermal conditions. Various boundary conditions play a critical role in simulating the behavior of a solar panel, particularly in terms of heat transfer. In this simulation, boundary conditions were defined to emulate the impact of solar radiation, convective heat transfer, and environmental temperatures on the panel’s exterior surfaces, as shown in Table 3.
Boundary conditions were defined to emulate the impact of solar radiation, convective heat transfer, and environmental temperatures on the panel’s exterior surfaces, as shown in Table 4. These were based on actual climate data for Adrar, Algeria (21 July 2023), with a constant solar irradiance of 900 W/m2 applied to replicate peak radiation. The simulated temperature distributions revealed clear differences across the three cooling strategies. Under air cooling, the panel surface reached high temperatures due to the low thermal capacity and heat transfer capability of air, with maximum surface temperatures approaching 47 °C on the ETFE layer and around 44 °C on the CFRP base. For water cooling, the convective interaction with flowing water significantly reduced the temperature: the ETFE layer averaged 23 °C, and the CFRP was around 27 °C. In the porous material cooling configuration, the temperature was moderately controlled through conduction and evaporation; ETFE reached approximately 31 °C and CFRP was around 34 °C. These conditions were applied uniformly in all cases to ensure result comparability.

2.3. Cooling Scenarios

To evaluate how well different cooling methods perform, we set up three distinct scenarios for comparison. Our goal was to find the most effective strategy in terms of cost efficiency, power generation, and conserving energy and resources. We ran simulations of each scenario using ANSYS Fluent software, which allowed for precise modeling of fluid–solid interactions. Depending on their specific behaviors, we employed various fluid models while ensuring all simulations adhered to Fluent’s energy conservation model for both fluids and solids, to provide a thorough analysis.

2.3.1. Cooling Solar Panels with Air

The simulation of the air cooling system involved modeling an additional structure beneath the solar panel to simulate an aluminum duct through which air could flow. This structure, depicted in Figure 3, functions as an air-cooling chamber powered by a fan at its base. The fan facilitates airflow from one end of the chamber to the other, effectively cooling the solar panel from below [38].
For modeling purposes, the standard k-Omega model [39] was utilized to account for the turbulent flow of air, characterized by a Reynolds number exceeding 2200. The airflow was specified as a boundary condition at the inlet of the air duct, with a velocity corresponding to the fan’s power, set at 3.07 m/s with a temperature of 25 °C.
The simulation solution converged satisfactorily, meeting a convergence criterion of 10−4 for a total of 5000 iterations, as shown in Figure 4. The PV panel with the integrated air cooling system comprised 322,068 nodes and 90,000 elements. The model conforms to a maximum skewness of 0.85 and has a low aspect ratio.

2.3.2. Cooling Solar Panels with Water

The simulation for the water cooling system employed a straightforward model. In this setup, a thin jet of water was directed over the surface of the solar panel to cool it from the front, as illustrated in Figure 5. This approach facilitates faster and more efficient heat dissipation since the cooling effect of the water is directly in contact with the solar cells, allowing for quicker temperature reduction and maintenance of lower operating temperatures [40].
Similar to the air cooling system, the water cooling system requires an external power source, in this case, a pump. A 2.16W-rated pump was used to provide a water flow with a mass flow rate of 0.0556 kg/s, maintained at a temperature of approximately 25 °C.
For modeling purposes, a laminar flow model was chosen since water exhibits laminar flow characteristics with a Reynolds number below 2200. The simulation achieved convergence with a criterion of 10−4 after 5000 iterations. The PV panel, integrated with the water cooling system, consisted of 98,265 elements and 402,933 nodes, adhering to the 0.85 skewness rule and maintaining a low aspect ratio [41].

2.3.3. Cooling Solar Panels with Porous Media

In the simulation of the porous material cooling system, a different approach was taken to dissipate heat from the solar panel. Instead of employing a direct flow of air or water, a chamber containing a porous material was situated beneath the solar panel. This porous material facilitated the distribution of water within the structure below the solar panel, creating a cooling effect through convection. A similar methodology was used in the air cooling system, as a 2.16 W-rated pump is employed to pump water through the chamber containing the porous media [42].
For modeling purposes, the simulation employed a detailed representation of the porous material, which can be seen in Figure 6.
Gravel was selected as the porous material for its widespread availability, high permeability, and porosity ranging from 0.25 to 0.44, with the specific porosity chosen for this case being 0.3.
This required a comprehensive mesh to accurately capture the complex fluid dynamics within the porous structure. The mesh developed was comprised of 46,503 nodes and 330,348 elements.
After convergence was achieved within the simulation, the results conformed to the same criteria as the other two simulations: a skewness of 0.85 and a low aspect ratio after 5000 iterations, all performed with a 10−4 convergence criterion as seen in Figure 7.

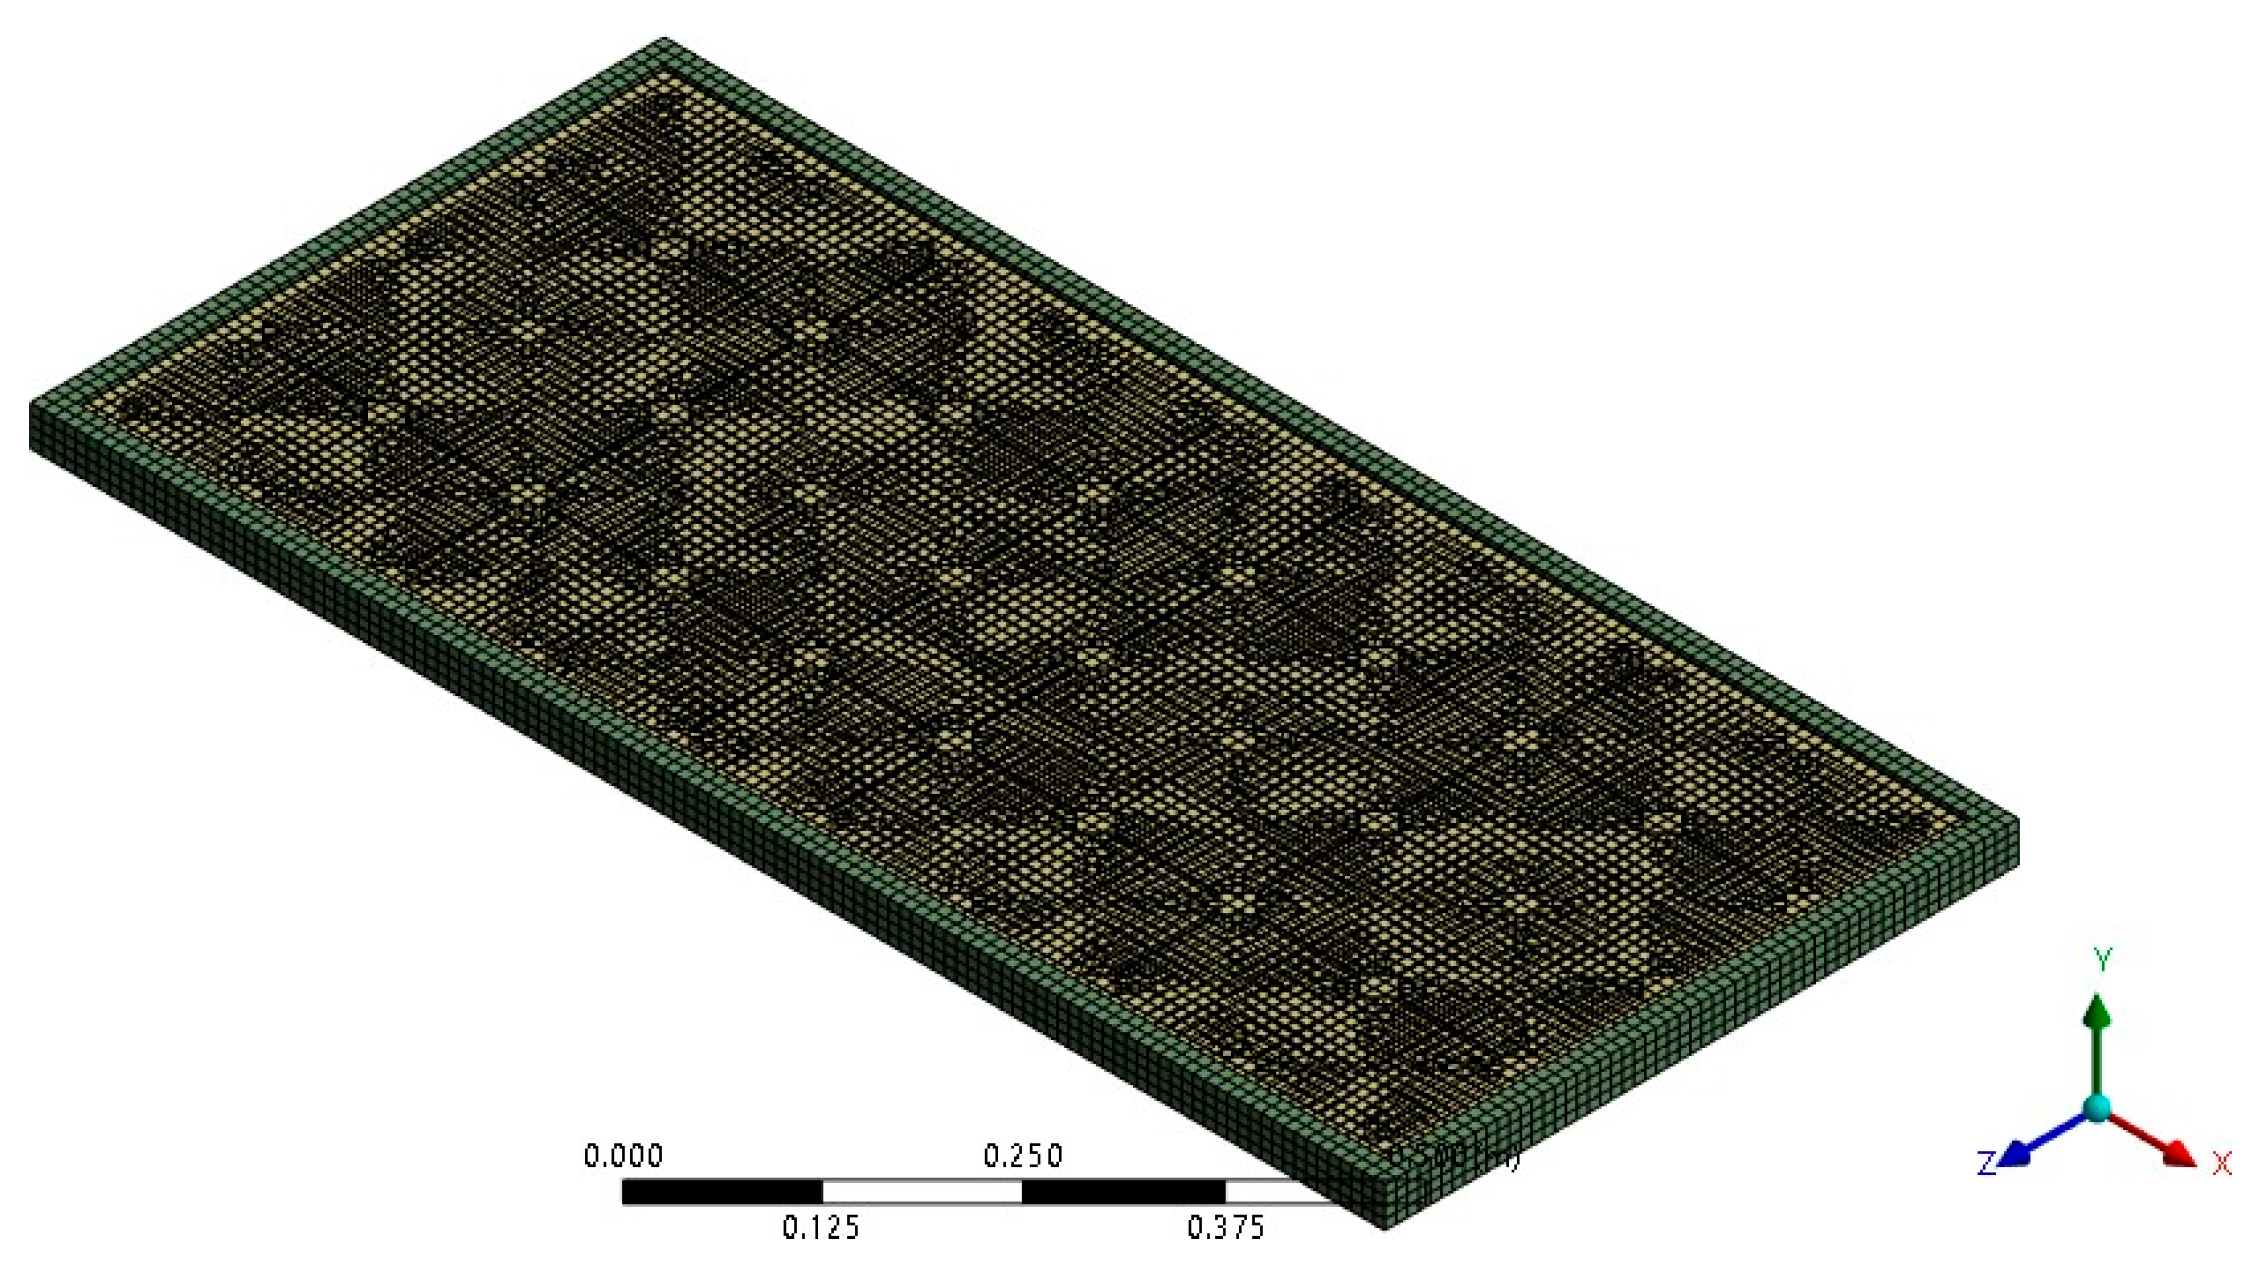
2.4. Mesh Independence Study

To ensure the reliability of the simulation results, a mesh independence study was conducted. There were three mesh configurations for the case of the air cooling system: coarse (45,000 elements), medium (90,000 elements), and fine (180,000 elements) were evaluated based on the maximum cell temperature and output power.
The results showed less than 1% variation between the medium and fine meshes. Therefore, the medium-density mesh was adopted for all simulations to balance accuracy and computational cost.

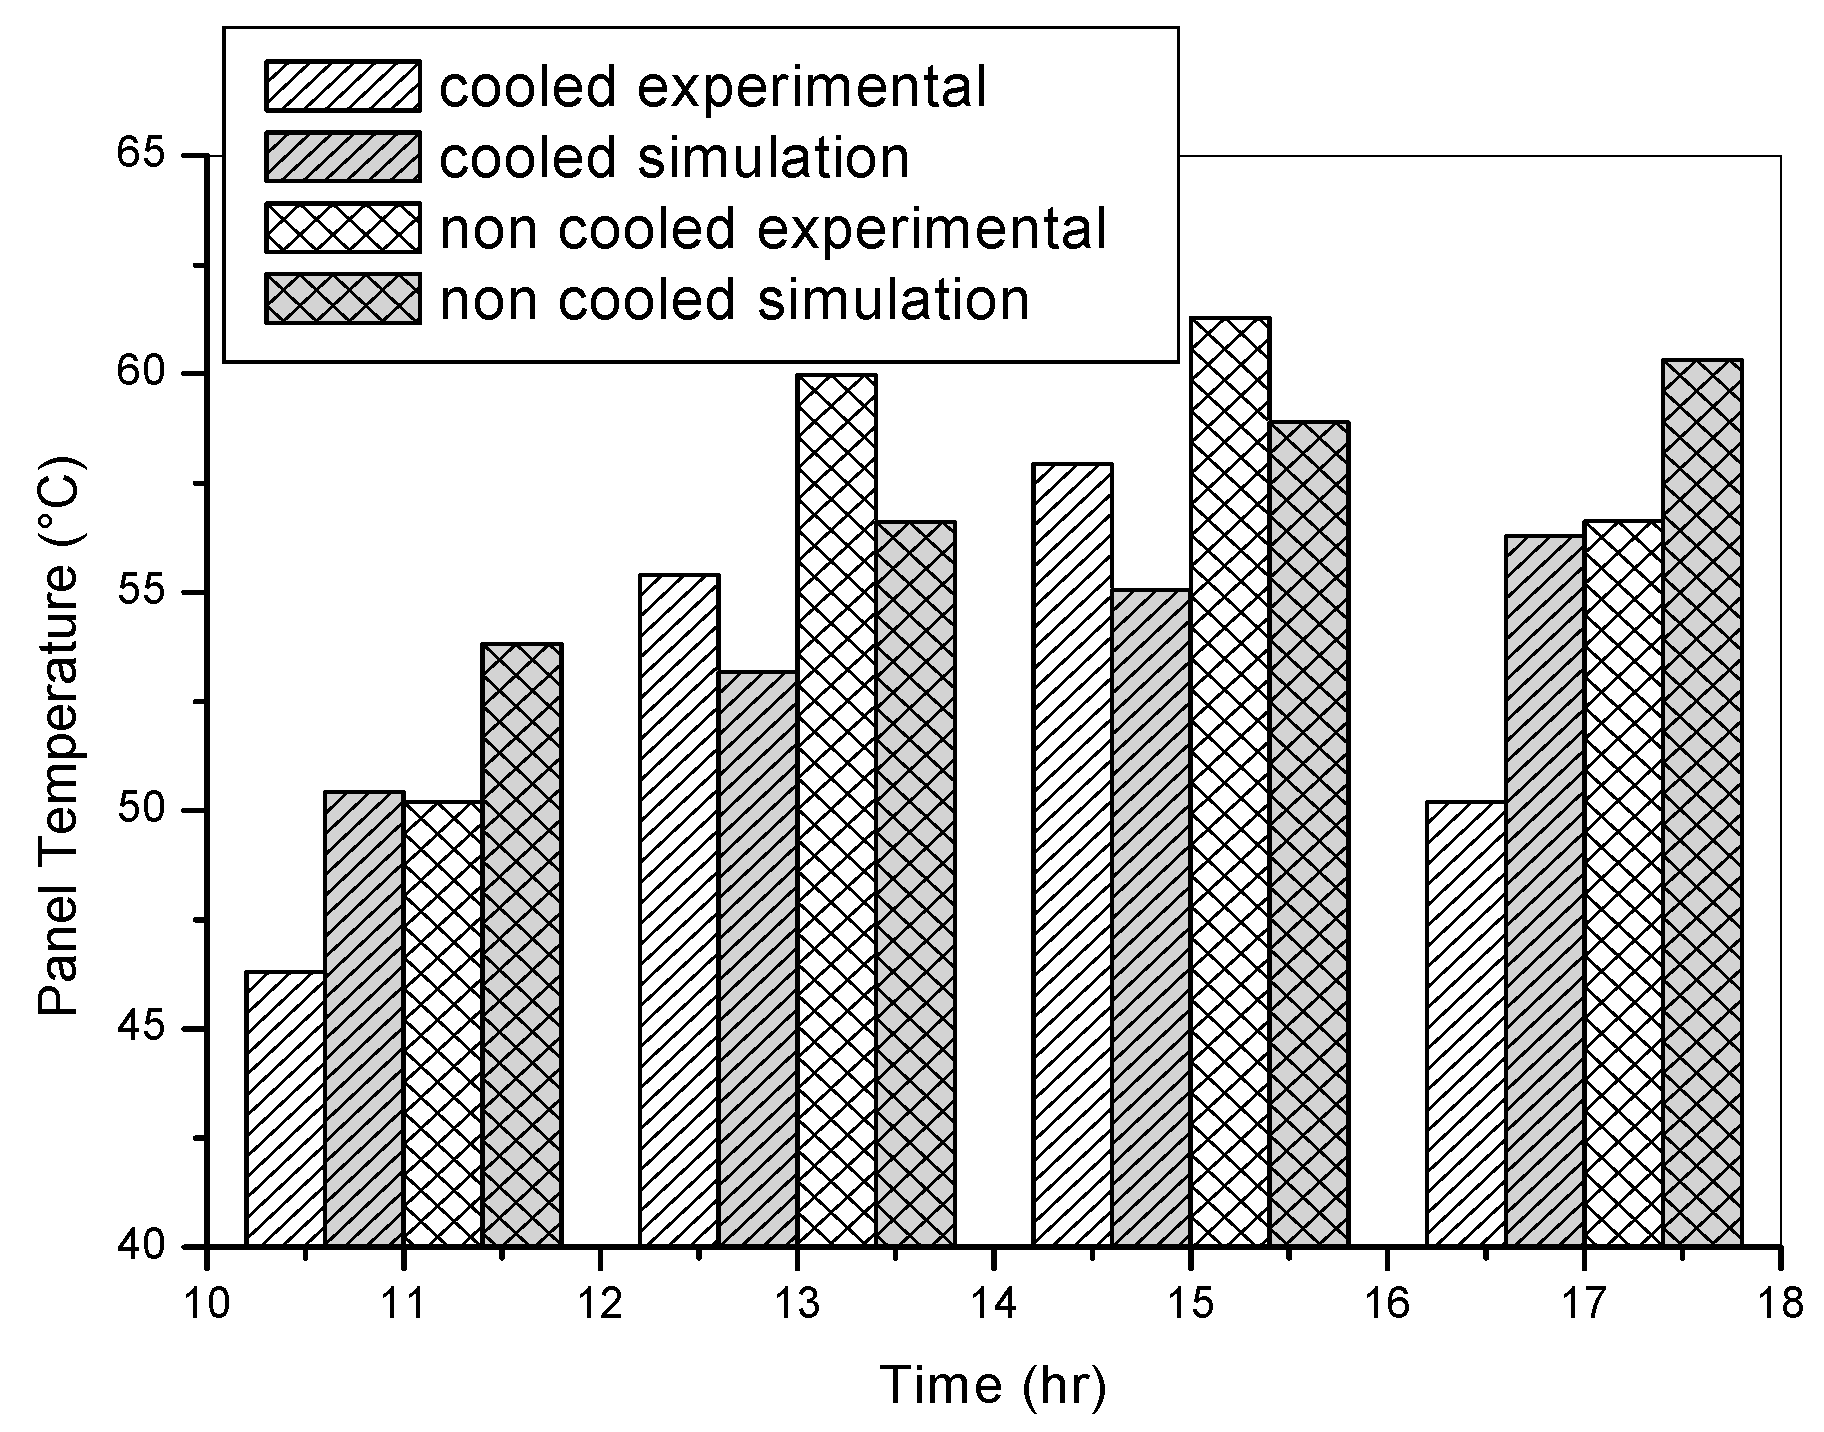
2.5. Model Validation

The simulation was validated by comparing the thermal behavior of the air-cooled panel to experimental data from Jyani et al. (2024) [43]. Temperatures were compared at four different time points (11:00, 13:00, 15:00, and 17:00). Figure 8 presents the comparison, demonstrating good agreement between simulated and measured panel temperatures, with deviations ±2.5 °C. This supports the credibility of the boundary conditions, material properties, and solver settings used in the CFD model.
In summary, water cooling achieves the best thermal performance, followed by porous media cooling, while air cooling offers minimal improvement. These findings reinforce the thermal gradient’s direct impact on electrical efficiency under hyper-arid conditions.

3. Simulation Results

This section presents the simulation results that directly address the research questions by evaluating how each cooling method impacts the thermal behavior, electrical output, and overall efficiency of the PV system. In this section, we present the results of our simulation on solar panel cooling systems, focusing on how different cooling techniques can effectively reduce the panel temperature across various environmental scenarios. This analysis sheds light on the thermal performance of each cooling method and its potential impact on overall efficiency. The findings will support our decision-making process of choosing the most effective cooling strategy to maximize power generation and extend the lifespan of the solar panels.

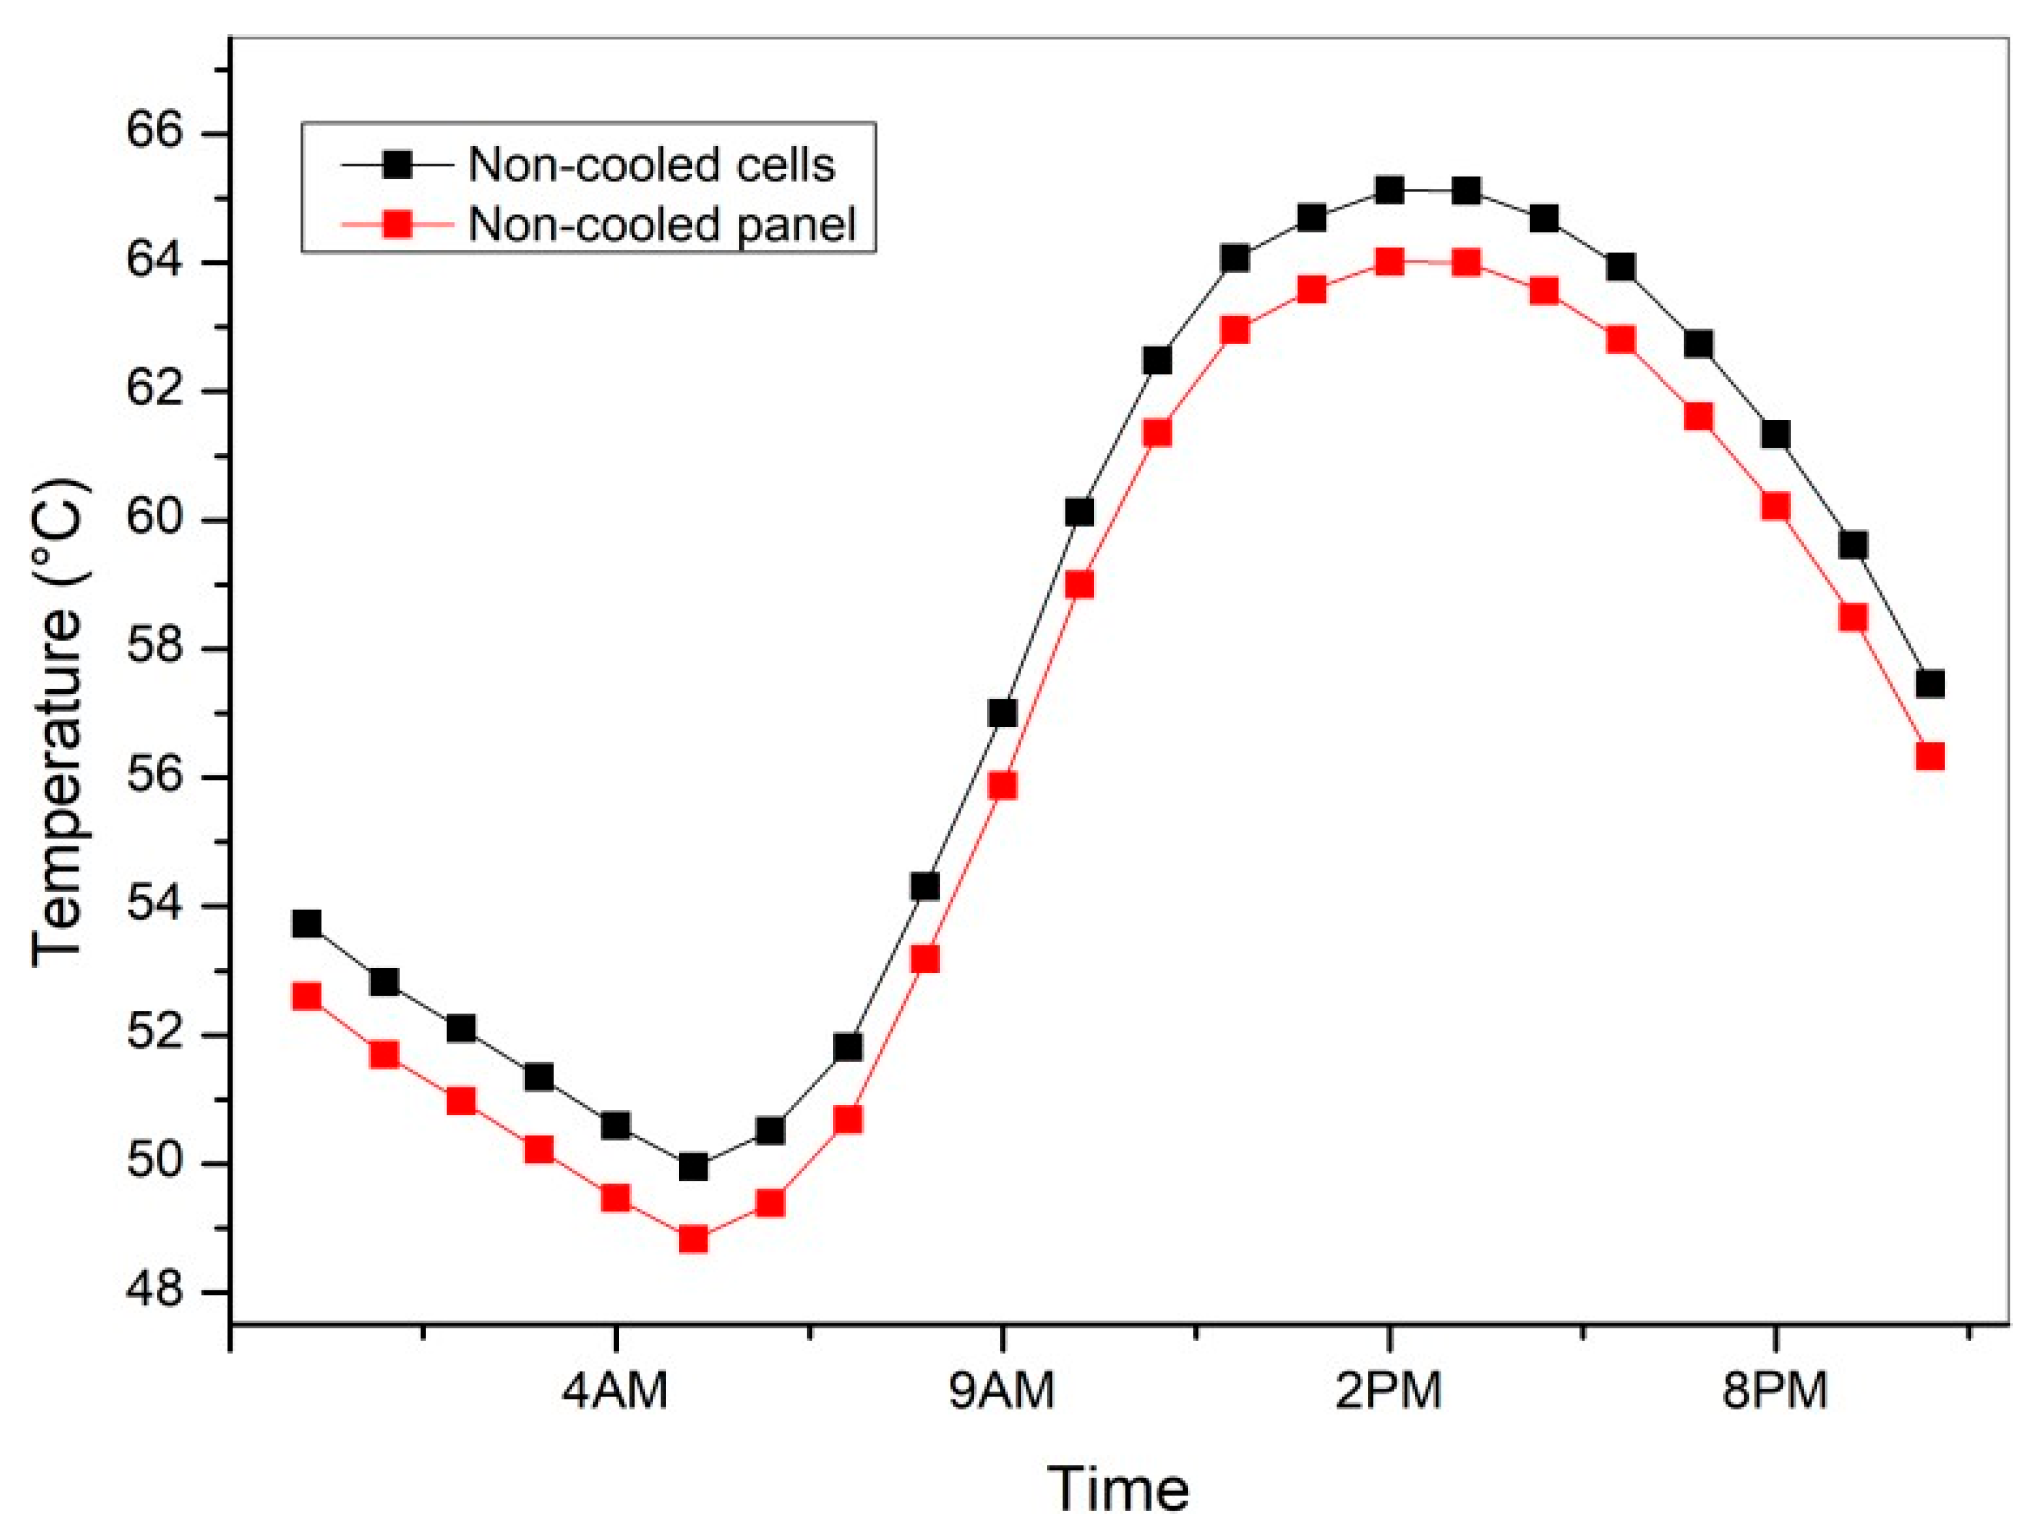
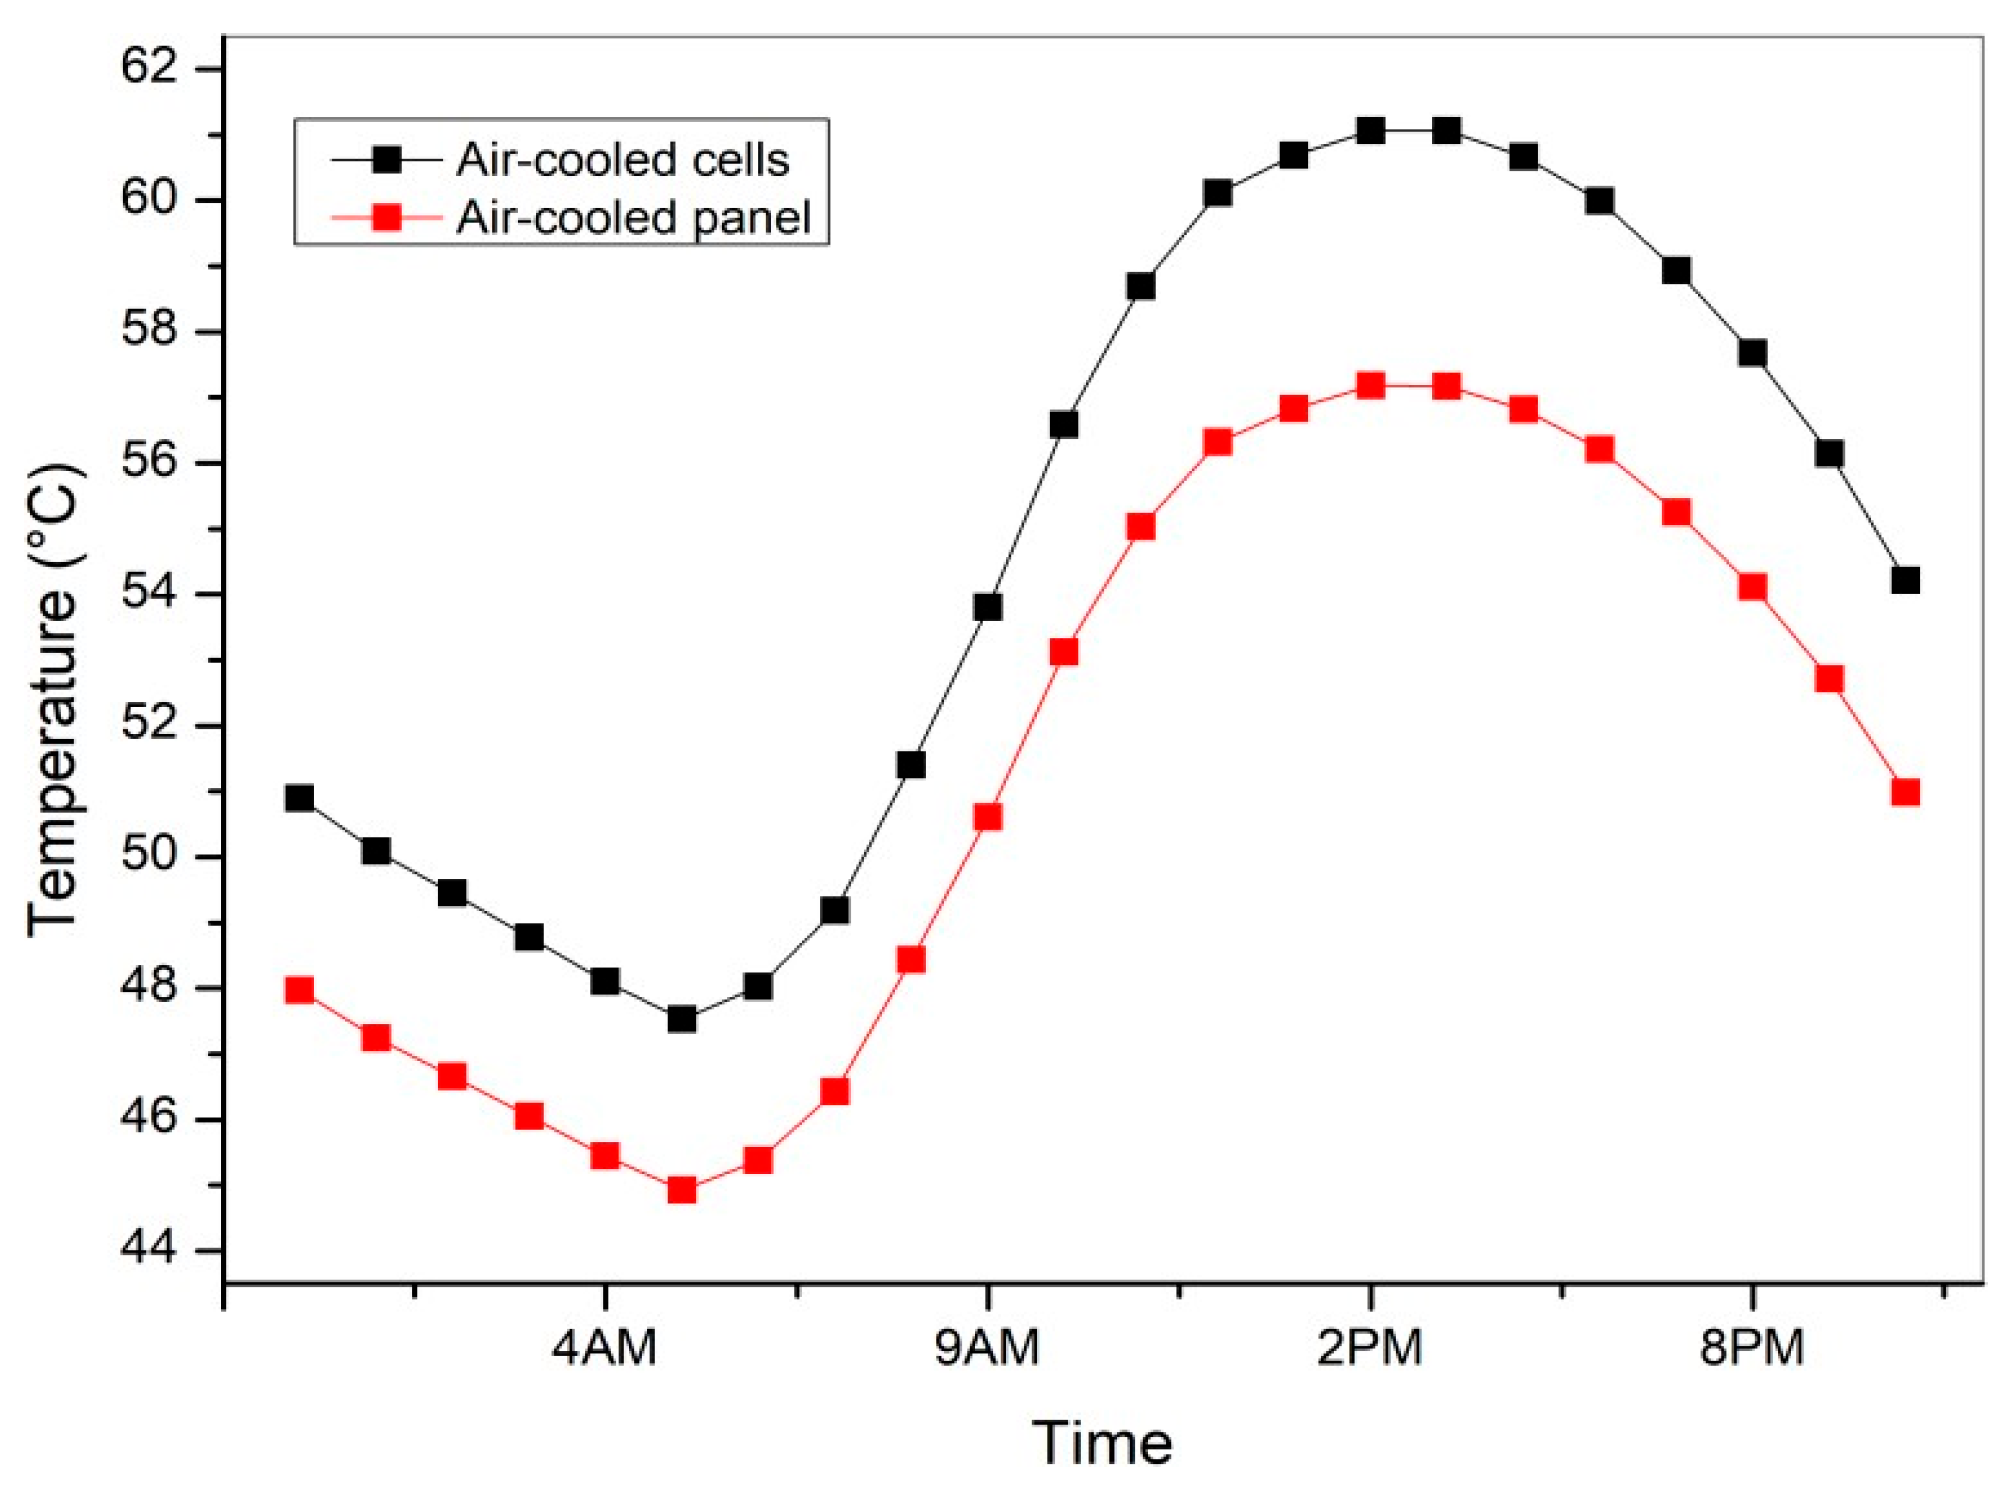
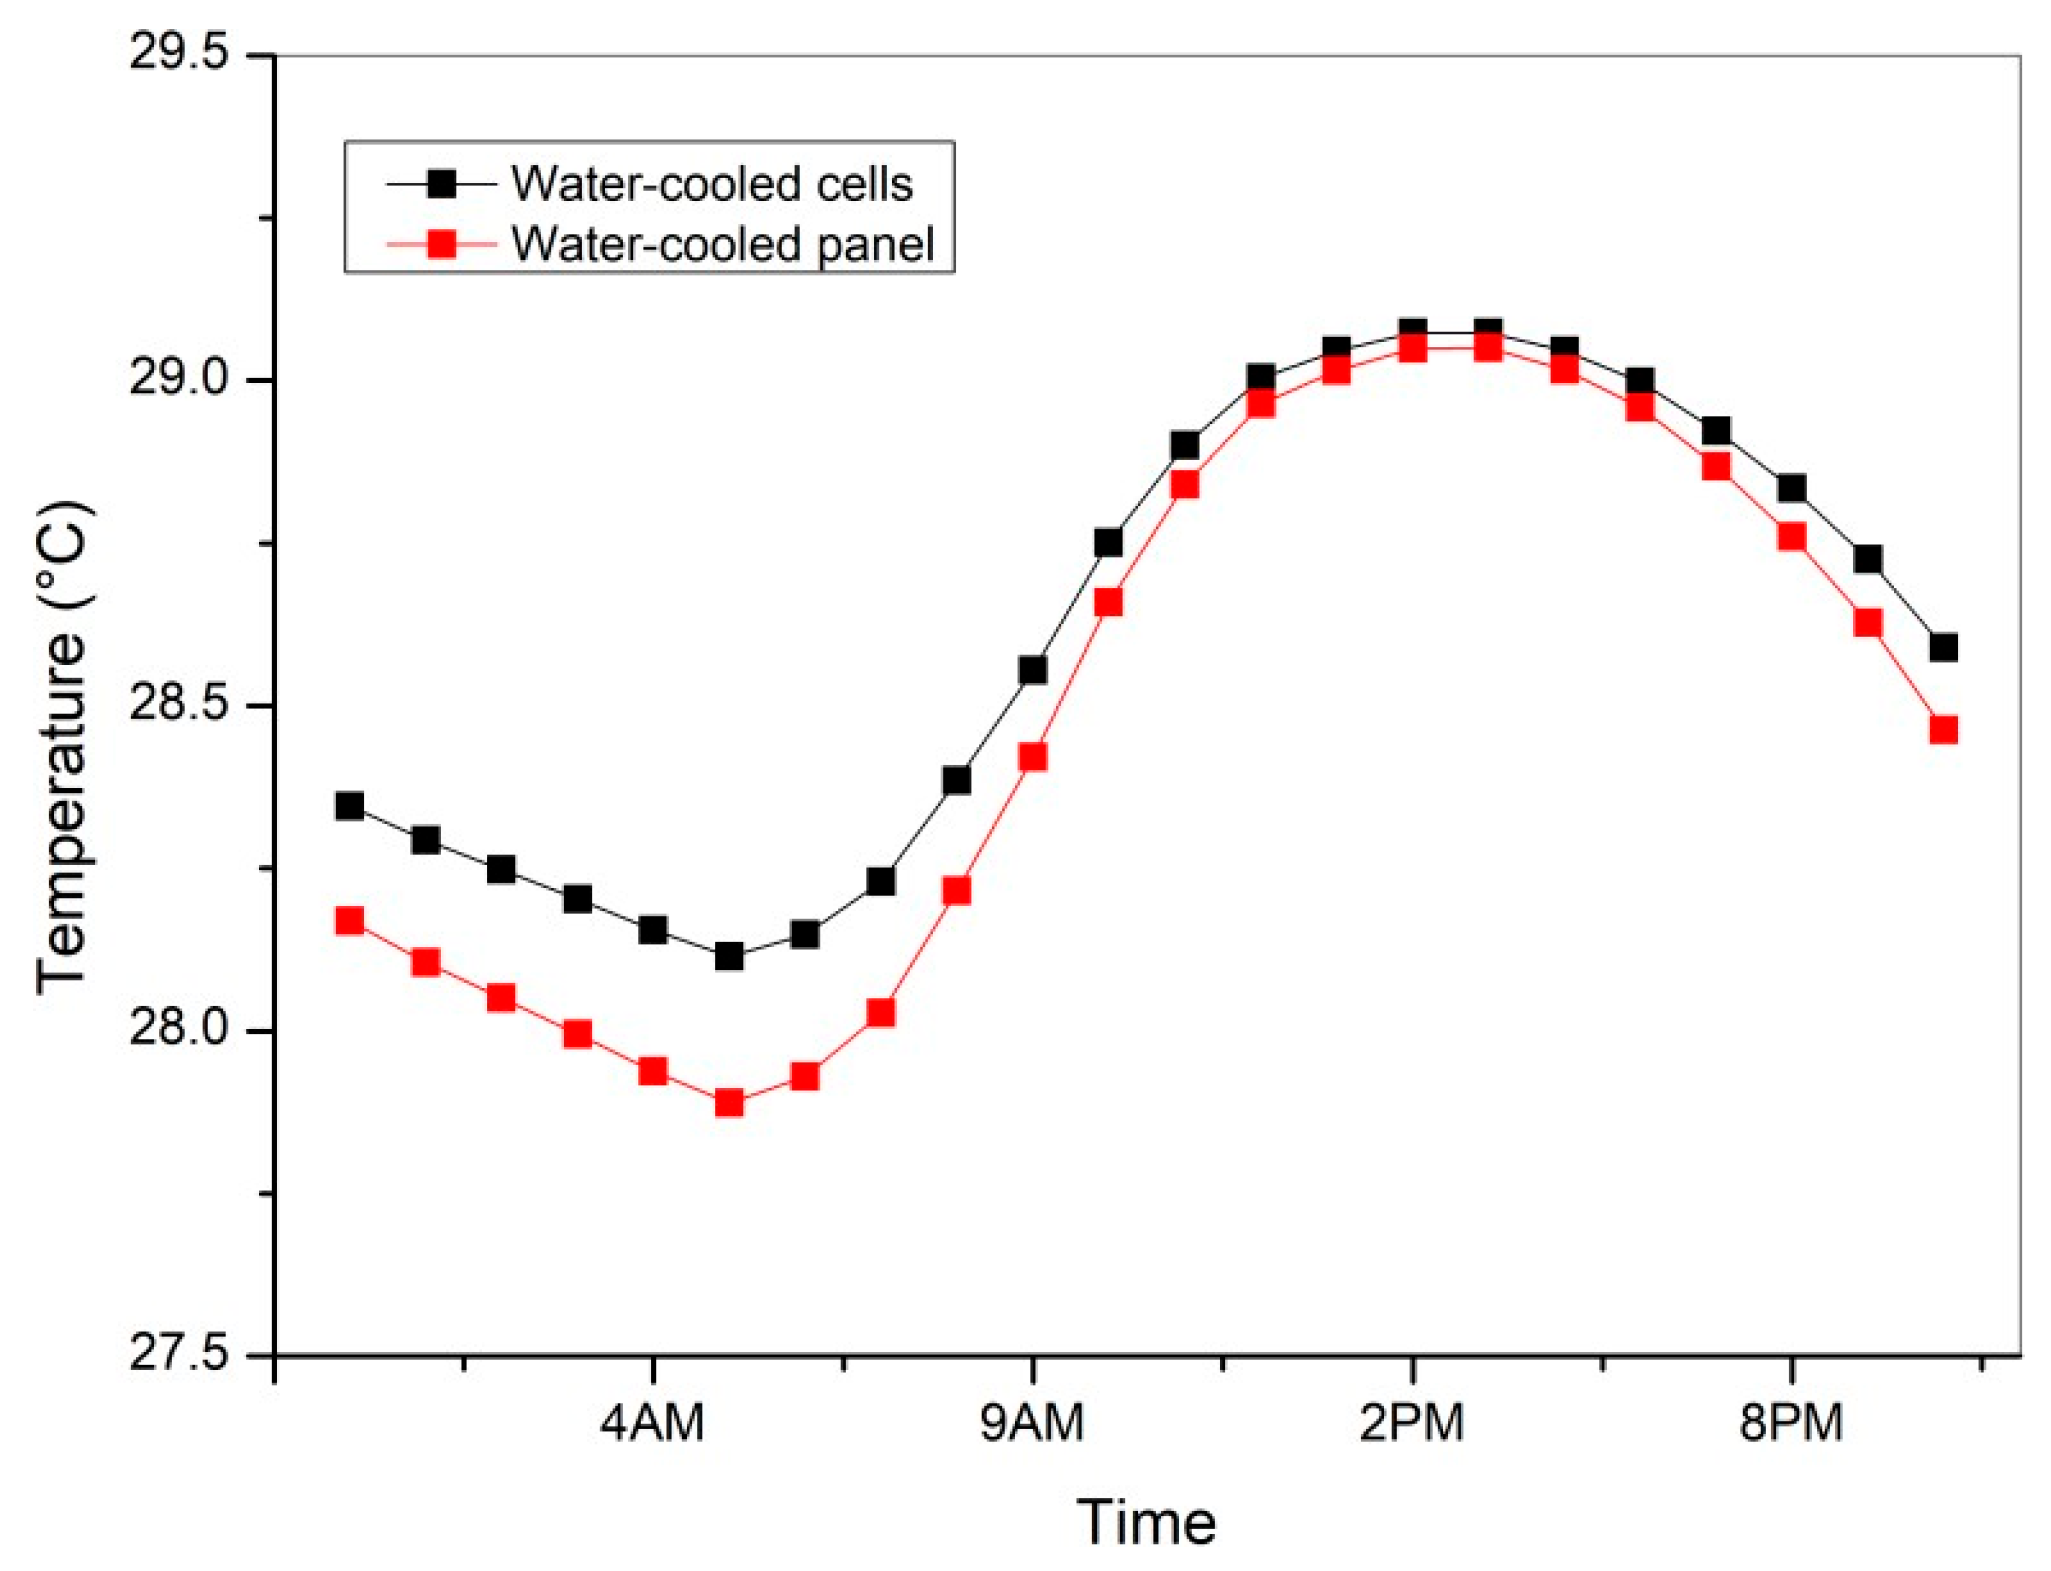
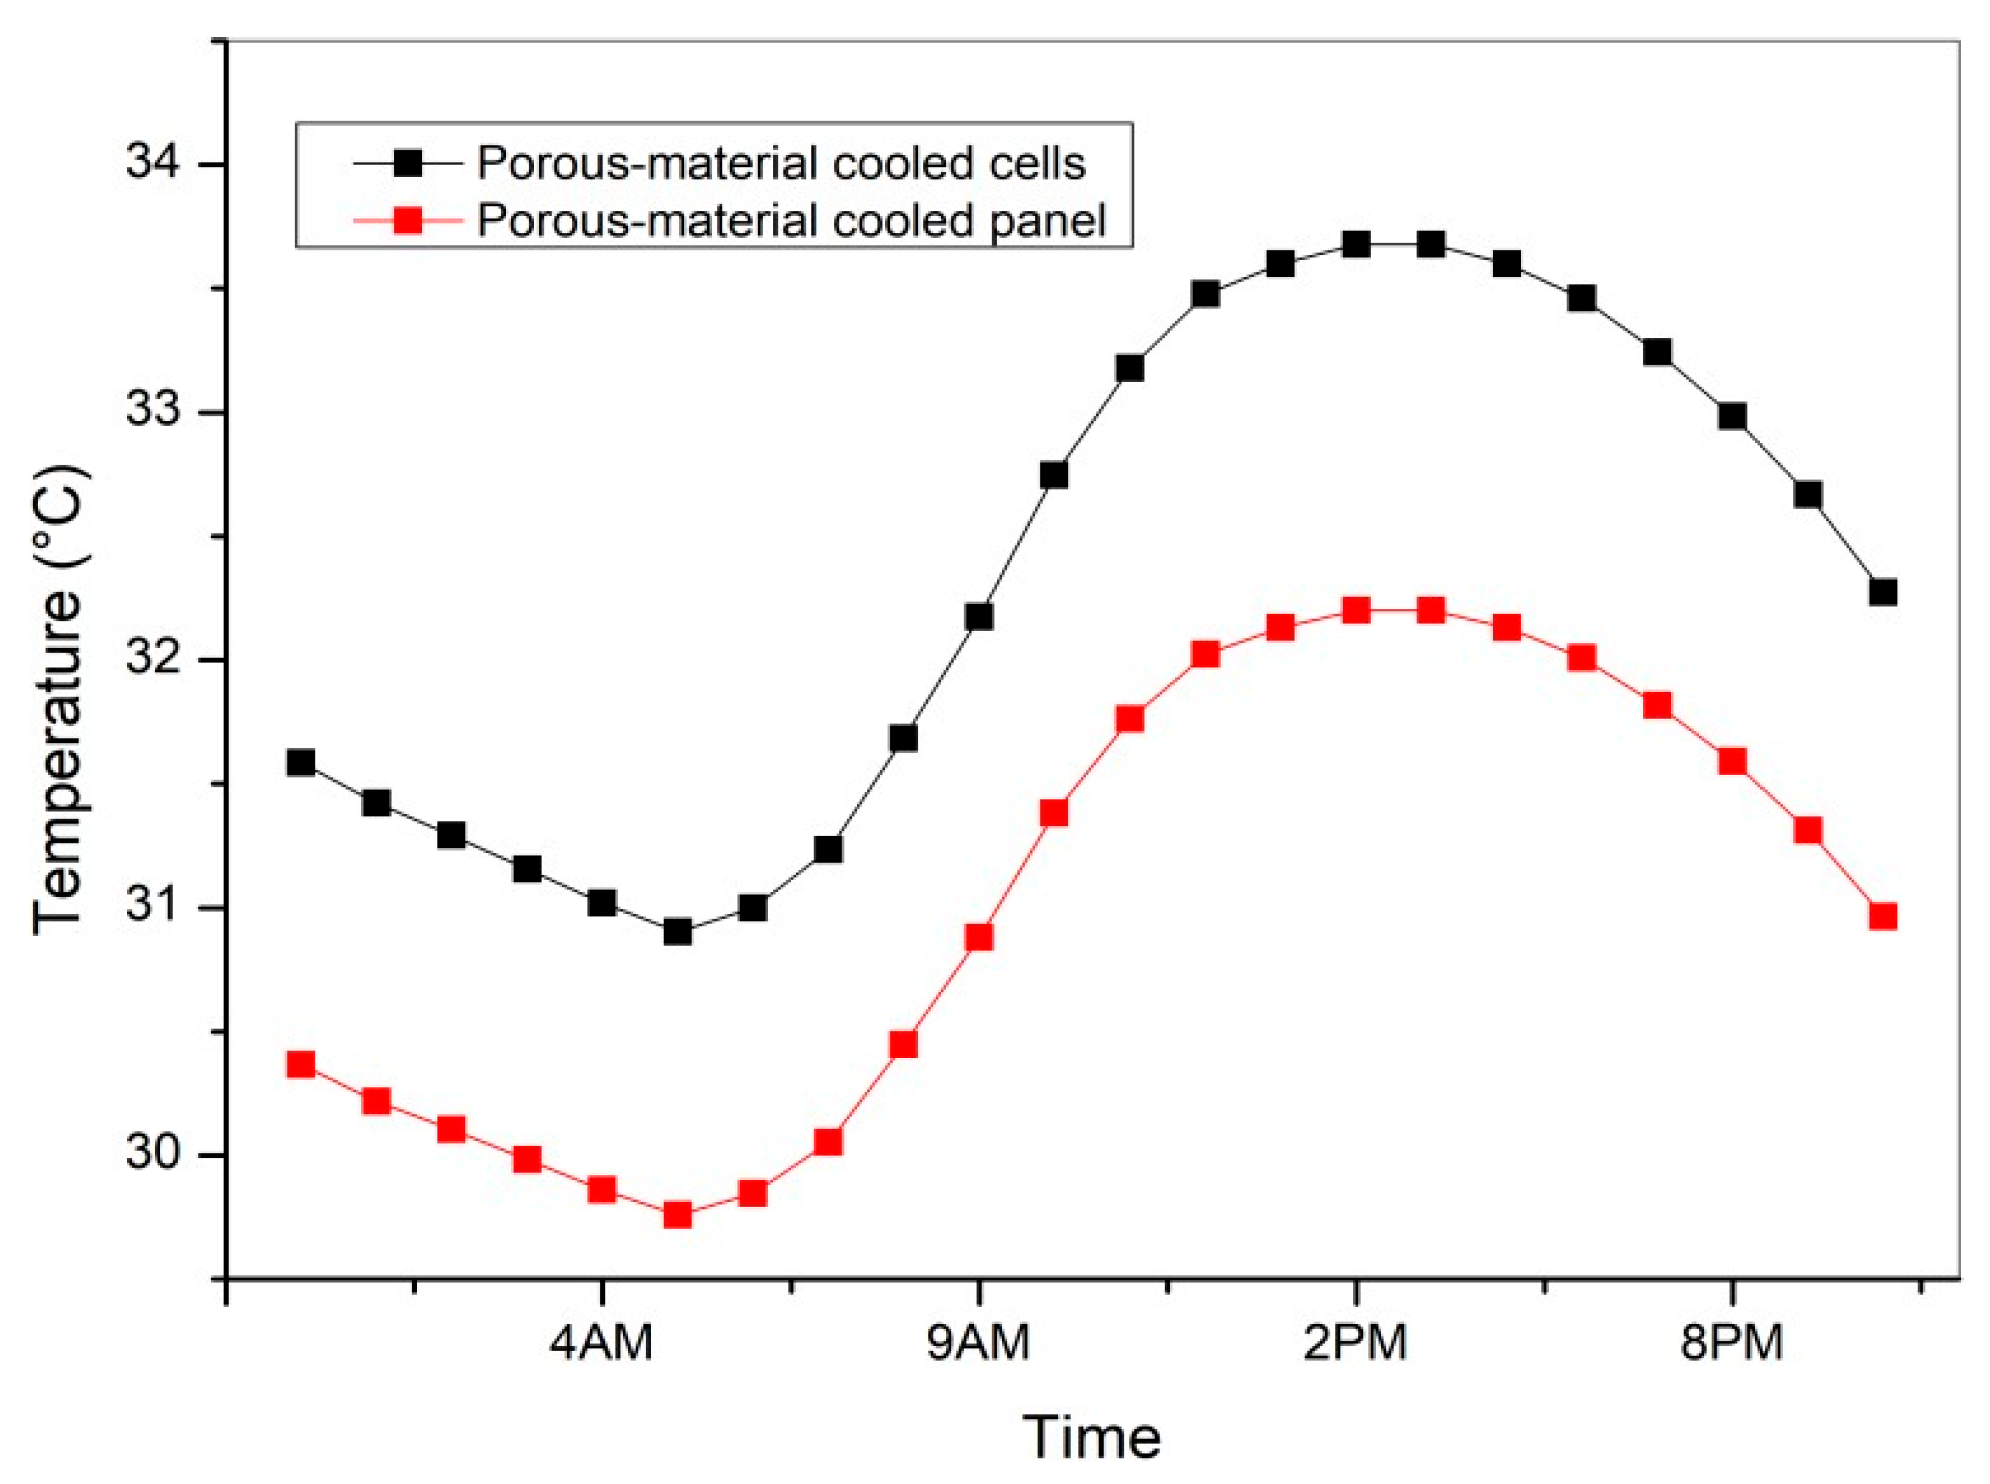
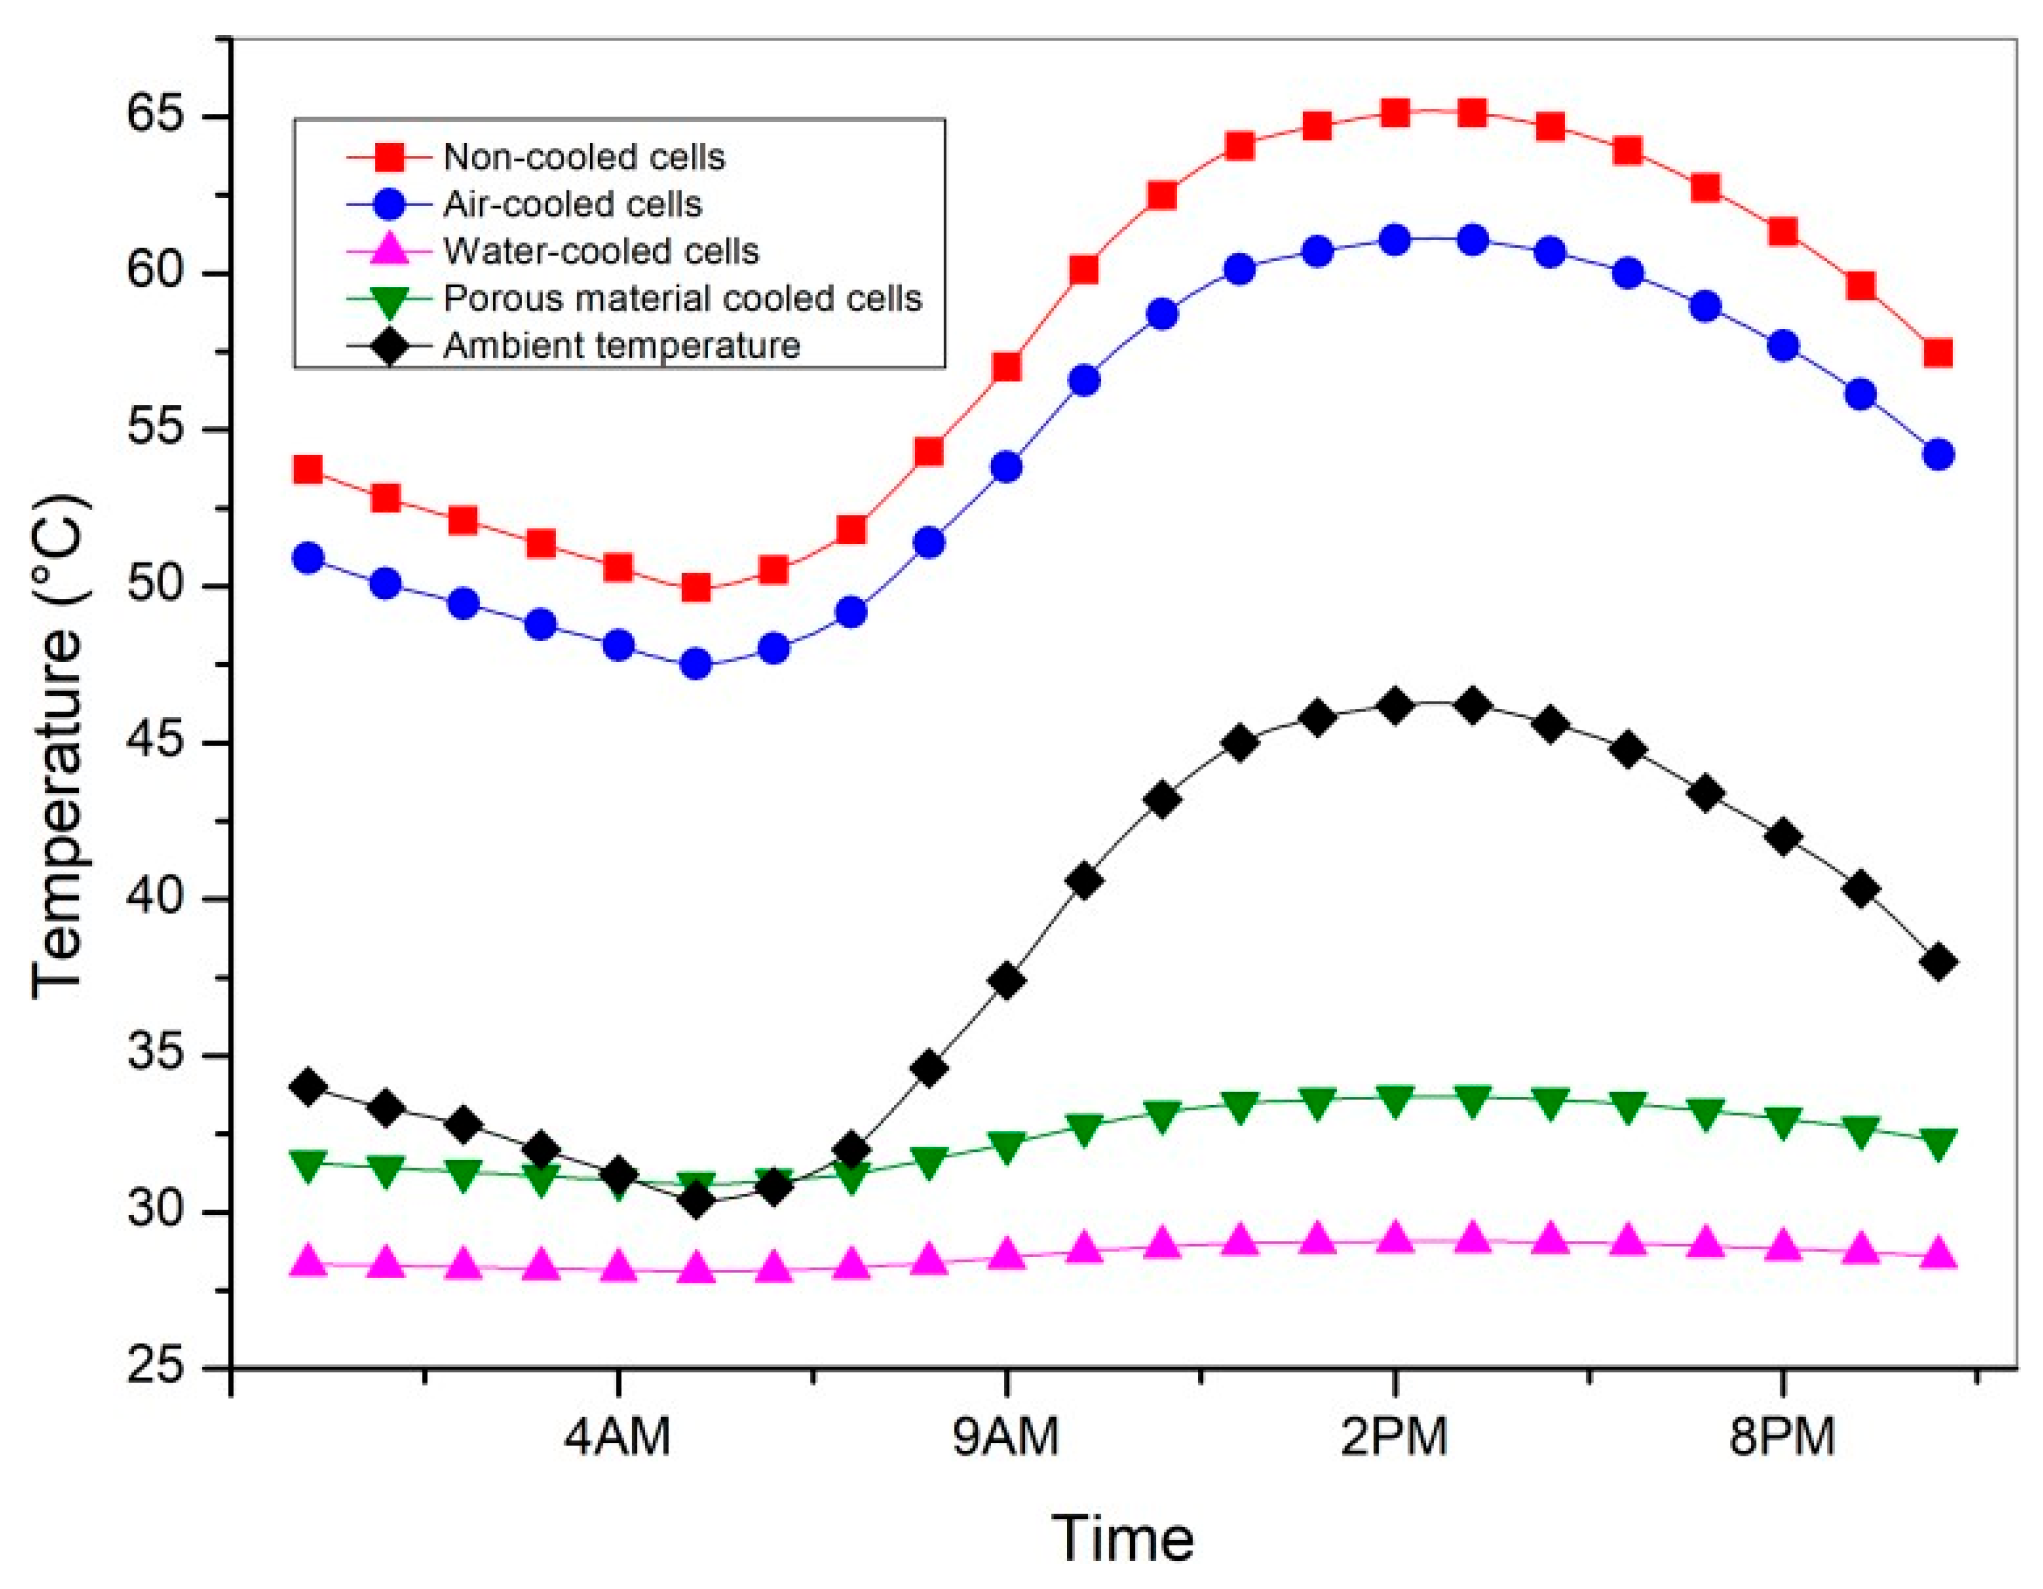
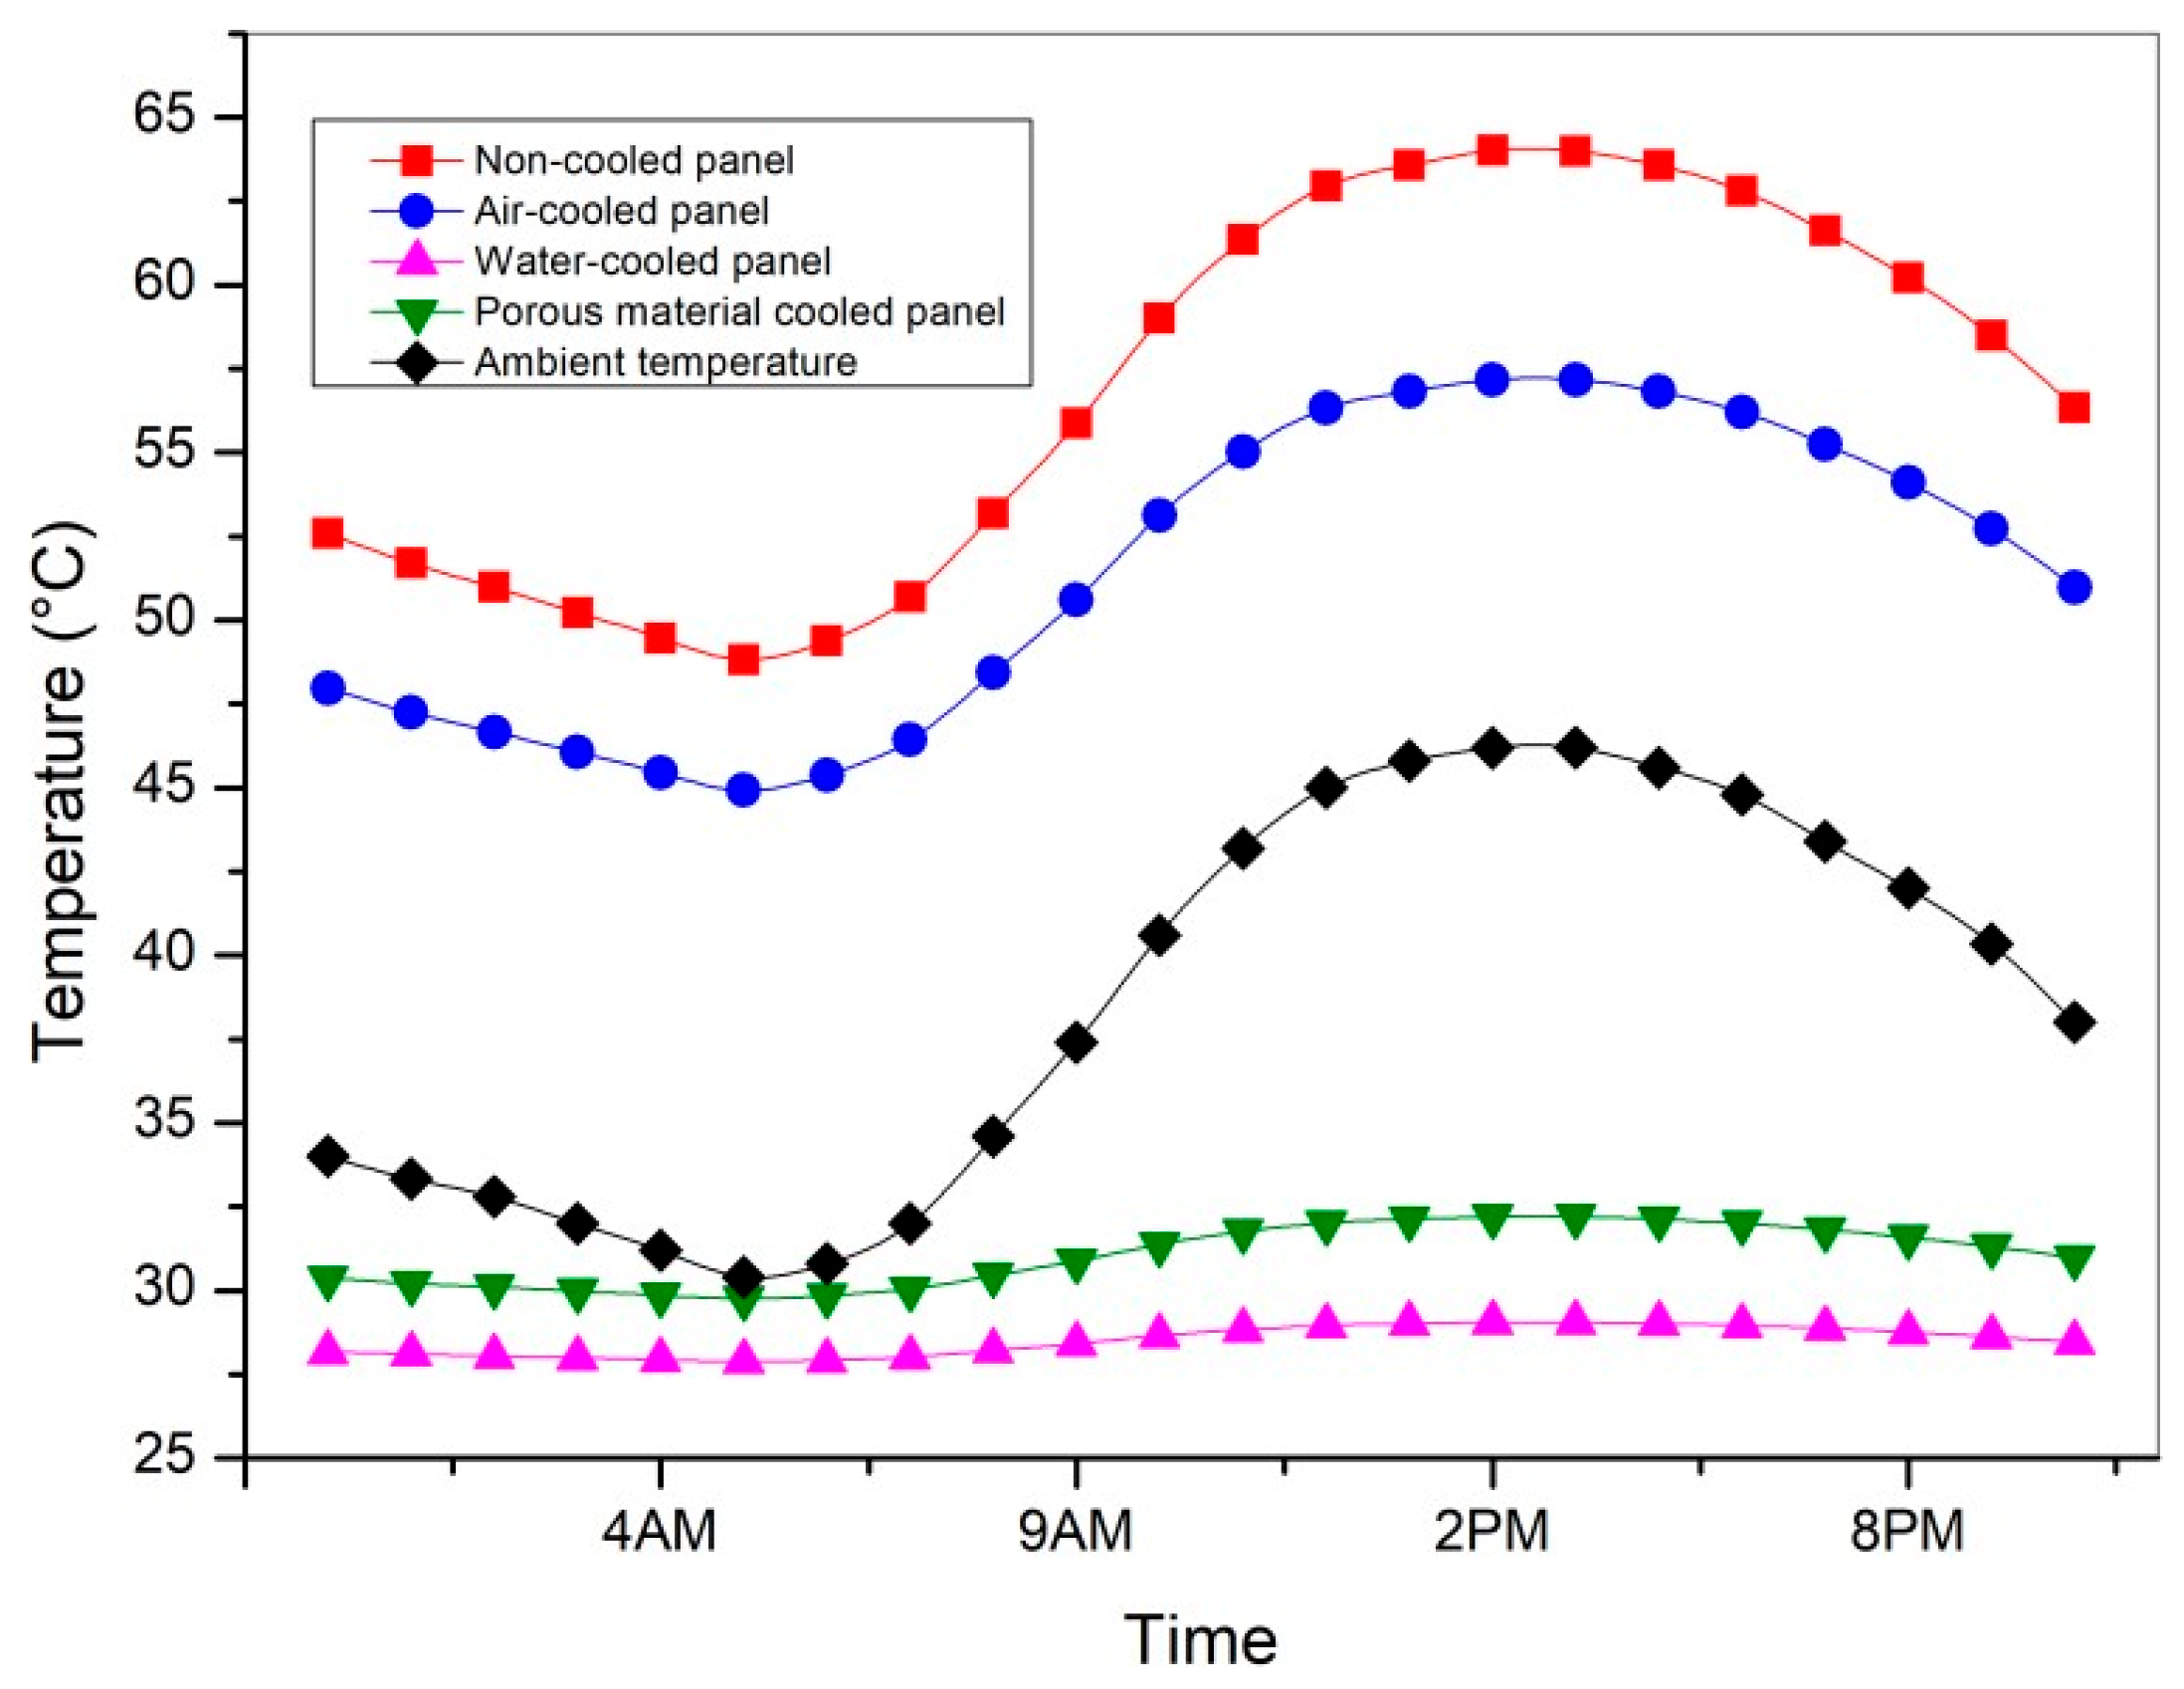
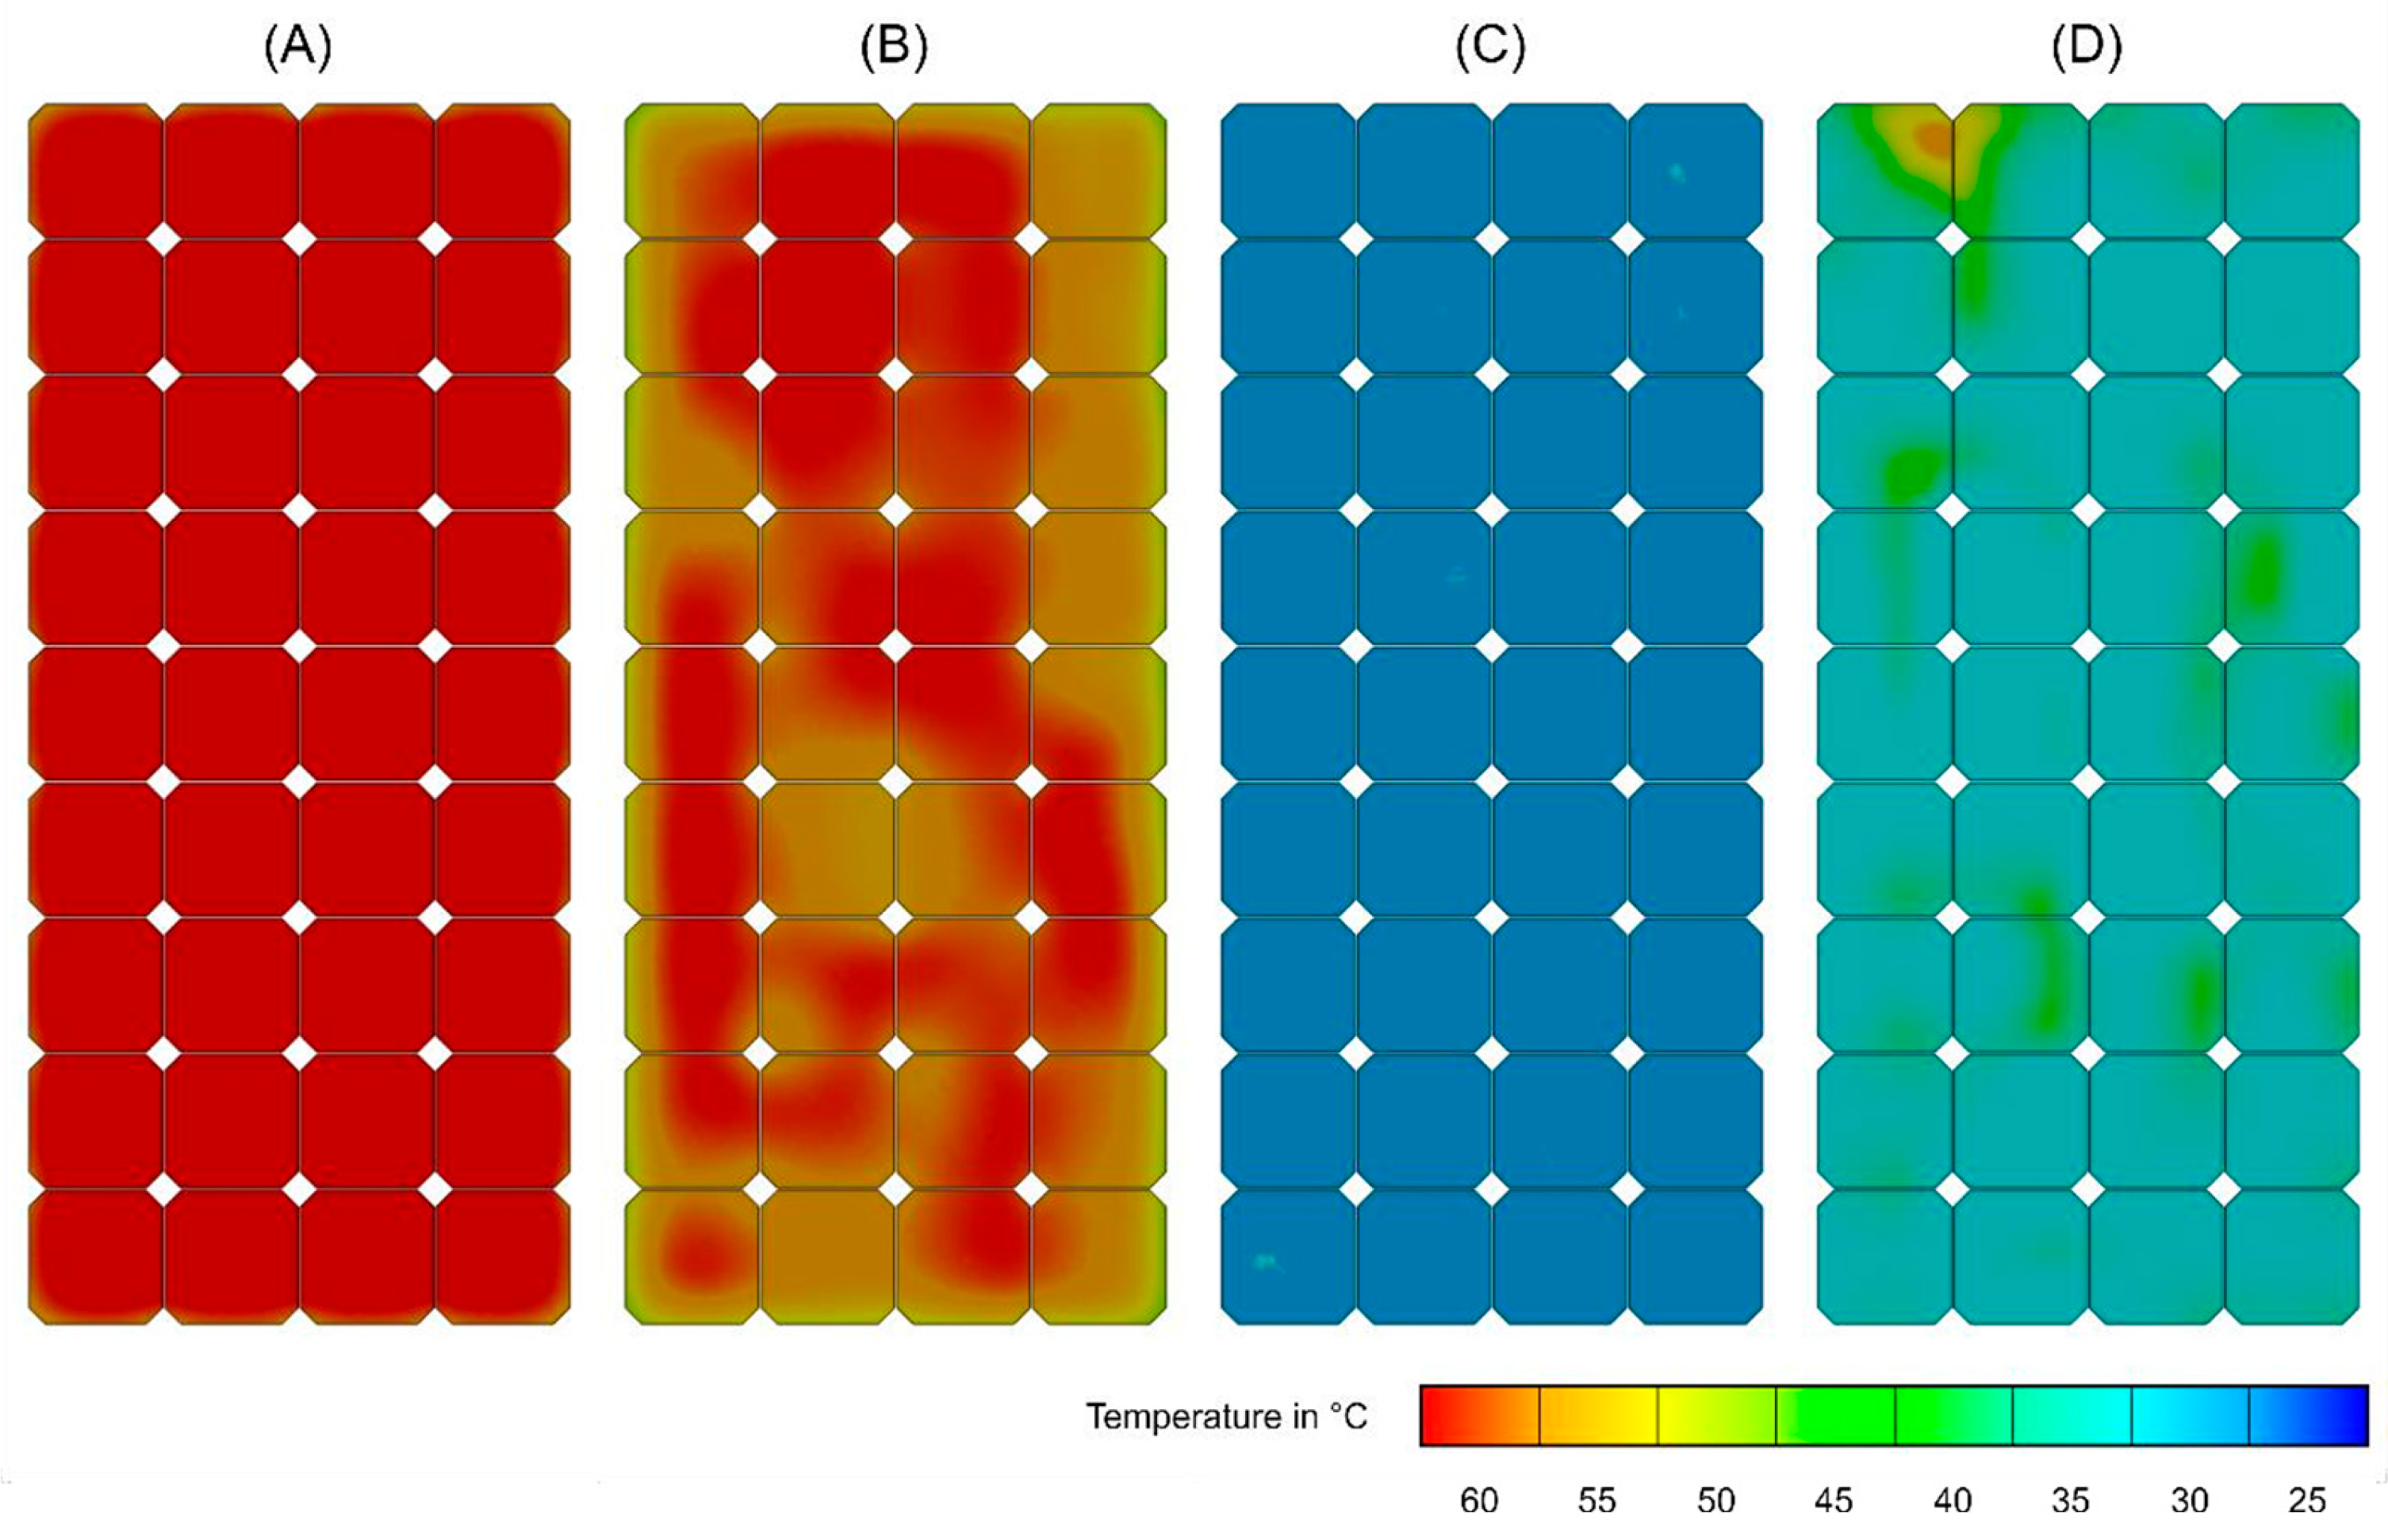
3.1. Temperature Results

In reviewing the temperature results, we took into account both the overall temperature of the panel and that of the individual photovoltaic (PV) cells. Two sets of curves highlight the temperature variations among uncooled, air-cooled, water-cooled, and porous material-cooled panels and PV cells.
Figure 9 and Figure 10 illustrate the temperature changes over time for an uncooled PV panel compared to one that is cooled by air, clearly showing the temperature distinctions between the PV cells and the panel surface.
For the uncooled panel (Figure 8), we observe a gradual temperature increase that aligns closely with rising solar irradiance. The highest temperature recorded for the cells reaches 63 °C, while the surface of the panel reaches 57 °C. The relatively small difference of about 6 °C indicates a considerable heat buildup within the cells, attributed to minimal heat dissipation into the environment. This thermal behavior significantly impacts the module’s electrical efficiency, as higher temperatures lead to decreased cell performance.
On the other hand, implementing air cooling (Figure 10) results has a moderate yet noticeable enhancement. Here, the maximum temperature for the cells is reduced to 61 °C, with the panel surface reaching 56 °C. The temperature difference of approximately 5 °C suggests improved heat transfer from the core of the module to the outside. This positive change is likely a result of better natural or forced convection.
Figure 11 showcases the findings from the water cooling system, while Figure 12 highlights the thermal performance of the porous material cooling system. Both techniques are designed to prevent overheating of photovoltaic (PV) modules, a crucial factor influencing electrical performance degradation.
Among the methods examined, water cooling stands out as the most effective. The cells reach a maximum temperature of just 29.1 °C, and the panel only hits 29.07 °C. This close thermal balance between the two components indicates exceptional heat extraction capability, likely due to either direct contact or a regulated water flow that enhances forced convection. When compared to the uncooled panel, which sees a temperature drop exceeding 36 °C, this technique demonstrates its significant ability to stabilize PV system temperatures, thereby improving both energy efficiency and the system’s overall lifespan.
The porous material cooling system, illustrated in Figure 12, ranks second in effectiveness. The highest recorded temperatures for the cells and panel are 33.68 °C and 32.20 °C, respectively. While these figures are higher than those recorded for the water cooling system, the thermal reduction is still substantial compared to the uncooled and air-cooled scenarios. The thermal performance suggests that the porous material facilitates passive heat exchange through evaporation and conduction within a moist, permeable structure.
Though not as uniform as in the water-cooled set-up, the temperature difference between the cell and panel is approximately 1.48 °C, indicating a fair distribution of heat. Nevertheless, this system offers the practical benefits of straightforward installation and zero energy consumption, making it an attractive option for arid or remote areas where active cooling circuits are impractical.
Figure 13 and Figure 14 present a comprehensive overview of the temperature changes in PV cells (Figure 13) and full panels (Figure 14) across four different cooling strategies: no cooling, air cooling, water cooling, and cooling with porous materials. To give context, these temperature profiles are compared with ambient temperature.
A closer look at the data reveals that the various cooling methods significantly mitigate heat buildup in the PV components, particularly during the peak hours of solar exposure from 12 p.m. to 3 p.m. Water cooling emerges as the superior method, managing to keep both cell and panel temperatures around 29 °C, which is closely aligned with the ambient temperature. This level of thermal regulation highlights its effectiveness in dissipating heat and minimizing efficiency losses.
In second place, porous material cooling shows promising results as well. While the cell temperatures reach around 33.7 °C, this is still considerably lower than those recorded without any cooling. The temperature profile exhibits fewer fluctuations throughout the day, suggesting that the porous material’s properties contribute to thermal stabilization through inertia and evaporation processes. Air cooling, though better than no cooling, proves less effective overall. Peak cell temperatures still rise above 60 °C, indicating that this method offers only limited improvement during intense sunlight exposure. In contrast, the uncooled setup records the highest temperatures, with cell temperatures soaring up to 65 °C. This signifies significant heat accumulation and considerable thermal strain on the components.
While the temperature curves clearly show how the cooling systems benefited the solar panels, a closer look at the temperature contours for the solar cells highlights these findings even further. In Figure 14, you can see the temperature contours for each scenario within a defined temperature range.
For the non-cooled cells, the temperature remains high across the entire panel, peaking at 62.5 °C at the center, creating a significant hot spot. The air-cooled cells display improved temperature distribution, with a marked reduction in temperature across the cell surfaces. Here, the hot spot is concentrated at the center of the panel, while the edges remain cooler. This uneven cooling results from the turbulent airflow, where the maximum temperature reaches 66.329 °C. While air cooling does alleviate some heat issues, the improvement is not substantial.
On the other hand, the water-cooled cells yield the best results. They feature a consistent temperature distribution across the cells, thanks to the laminar flow of water and the design of the water cooling system that cools the panels from above. This technique enables the water to dissipate heat quickly and evenly, leading to a maximum cell surface temperature of 29.503 °C—a significant reduction compared to previous methods. The porous media cooling method is particularly noteworthy, providing effective cooling in a passive manner. The porous media used in this scenario allows for even heat dissipation, akin to the water cooling method but without needing direct water contact. This media is highly conductive, facilitating swift and even heat release from the panel. As heat moves from the panel to the porous media and then to the water, the water quickly evaporates the heat, cooling both the panel and itself. In this case, the highest temperature recorded on the cell surface is 59.1 °C, located at one hot spot in the top left corner of the solar cells. Nevertheless, the average cell temperature remains stable around 33 °C. Overall, the temperature curves illustrate that the cooling systems have effectively facilitated cooling for the solar panels, and these conclusions are further reinforced when we analyze the temperature contours for the solar cells, as depicted in Figure 15.
For the non-cooled cells, the entire panel experiences elevated temperatures, peaking at 66.638 °C in the center, resulting in a pronounced hot spot. In contrast, the air-cooled cells exhibit improved temperature distribution, showcasing a notable decrease across the cell surfaces. The hot spot remains localized in the center, while the edges are cooler, a result of the turbulent airflow that leads to uneven cooling. The maximum recorded temperature here is 66.329 °C, indicating that while air cooling helps alleviate heat effects, the impact is limited. On the other hand, the water-cooled cells deliver the most favorable results, achieving a uniform temperature distribution. This consistent cooling is attributed to the laminar flow of water and the effective design of the cooling system, which delivers cooling directly above the panel. This method allows for rapid, efficient, and balanced heat mitigation, resulting in a maximum cell surface temperature of just 29.5 °C, representing a significant improvement over the previous cooling methods. The porous media cooling technique is particularly noteworthy, as it provides effective cooling through passive means. In this setup, the porous media enables even heat dissipation similar to water cooling, but without the need for direct water contact. The high thermal conductivity of the porous media facilitates quick and uniform heat release from the panel. Heat transfers from the panel to the porous media and subsequently to the water, which swiftly expels the heat as vapor, cooling both the panel and the water in the process. In this case, the highest temperature observed on the cell surface reaches 59.1 °C at a single hot spot in the top left corner, while the average cell temperature is maintained around 32.4 °C.

3.2. Electrical Output

This section delves into the analysis of power, voltage, and current outputs from solar panels subjected to various cooling methods: non-cooled, air-cooled, water-cooled, and cooled with porous materials. The goal is to assess how each cooling strategy influences the electrical performance of the photovoltaic panels. We will compare key performance metrics such as the power–voltage (P–V) curves and current–voltage (I–V) curves to evaluate the effectiveness of each cooling technique. The findings will shed light on the relationship between effective thermal management and electrical efficiency in solar panels, underscoring the advantages of integrating advanced cooling solutions in photovoltaic systems.

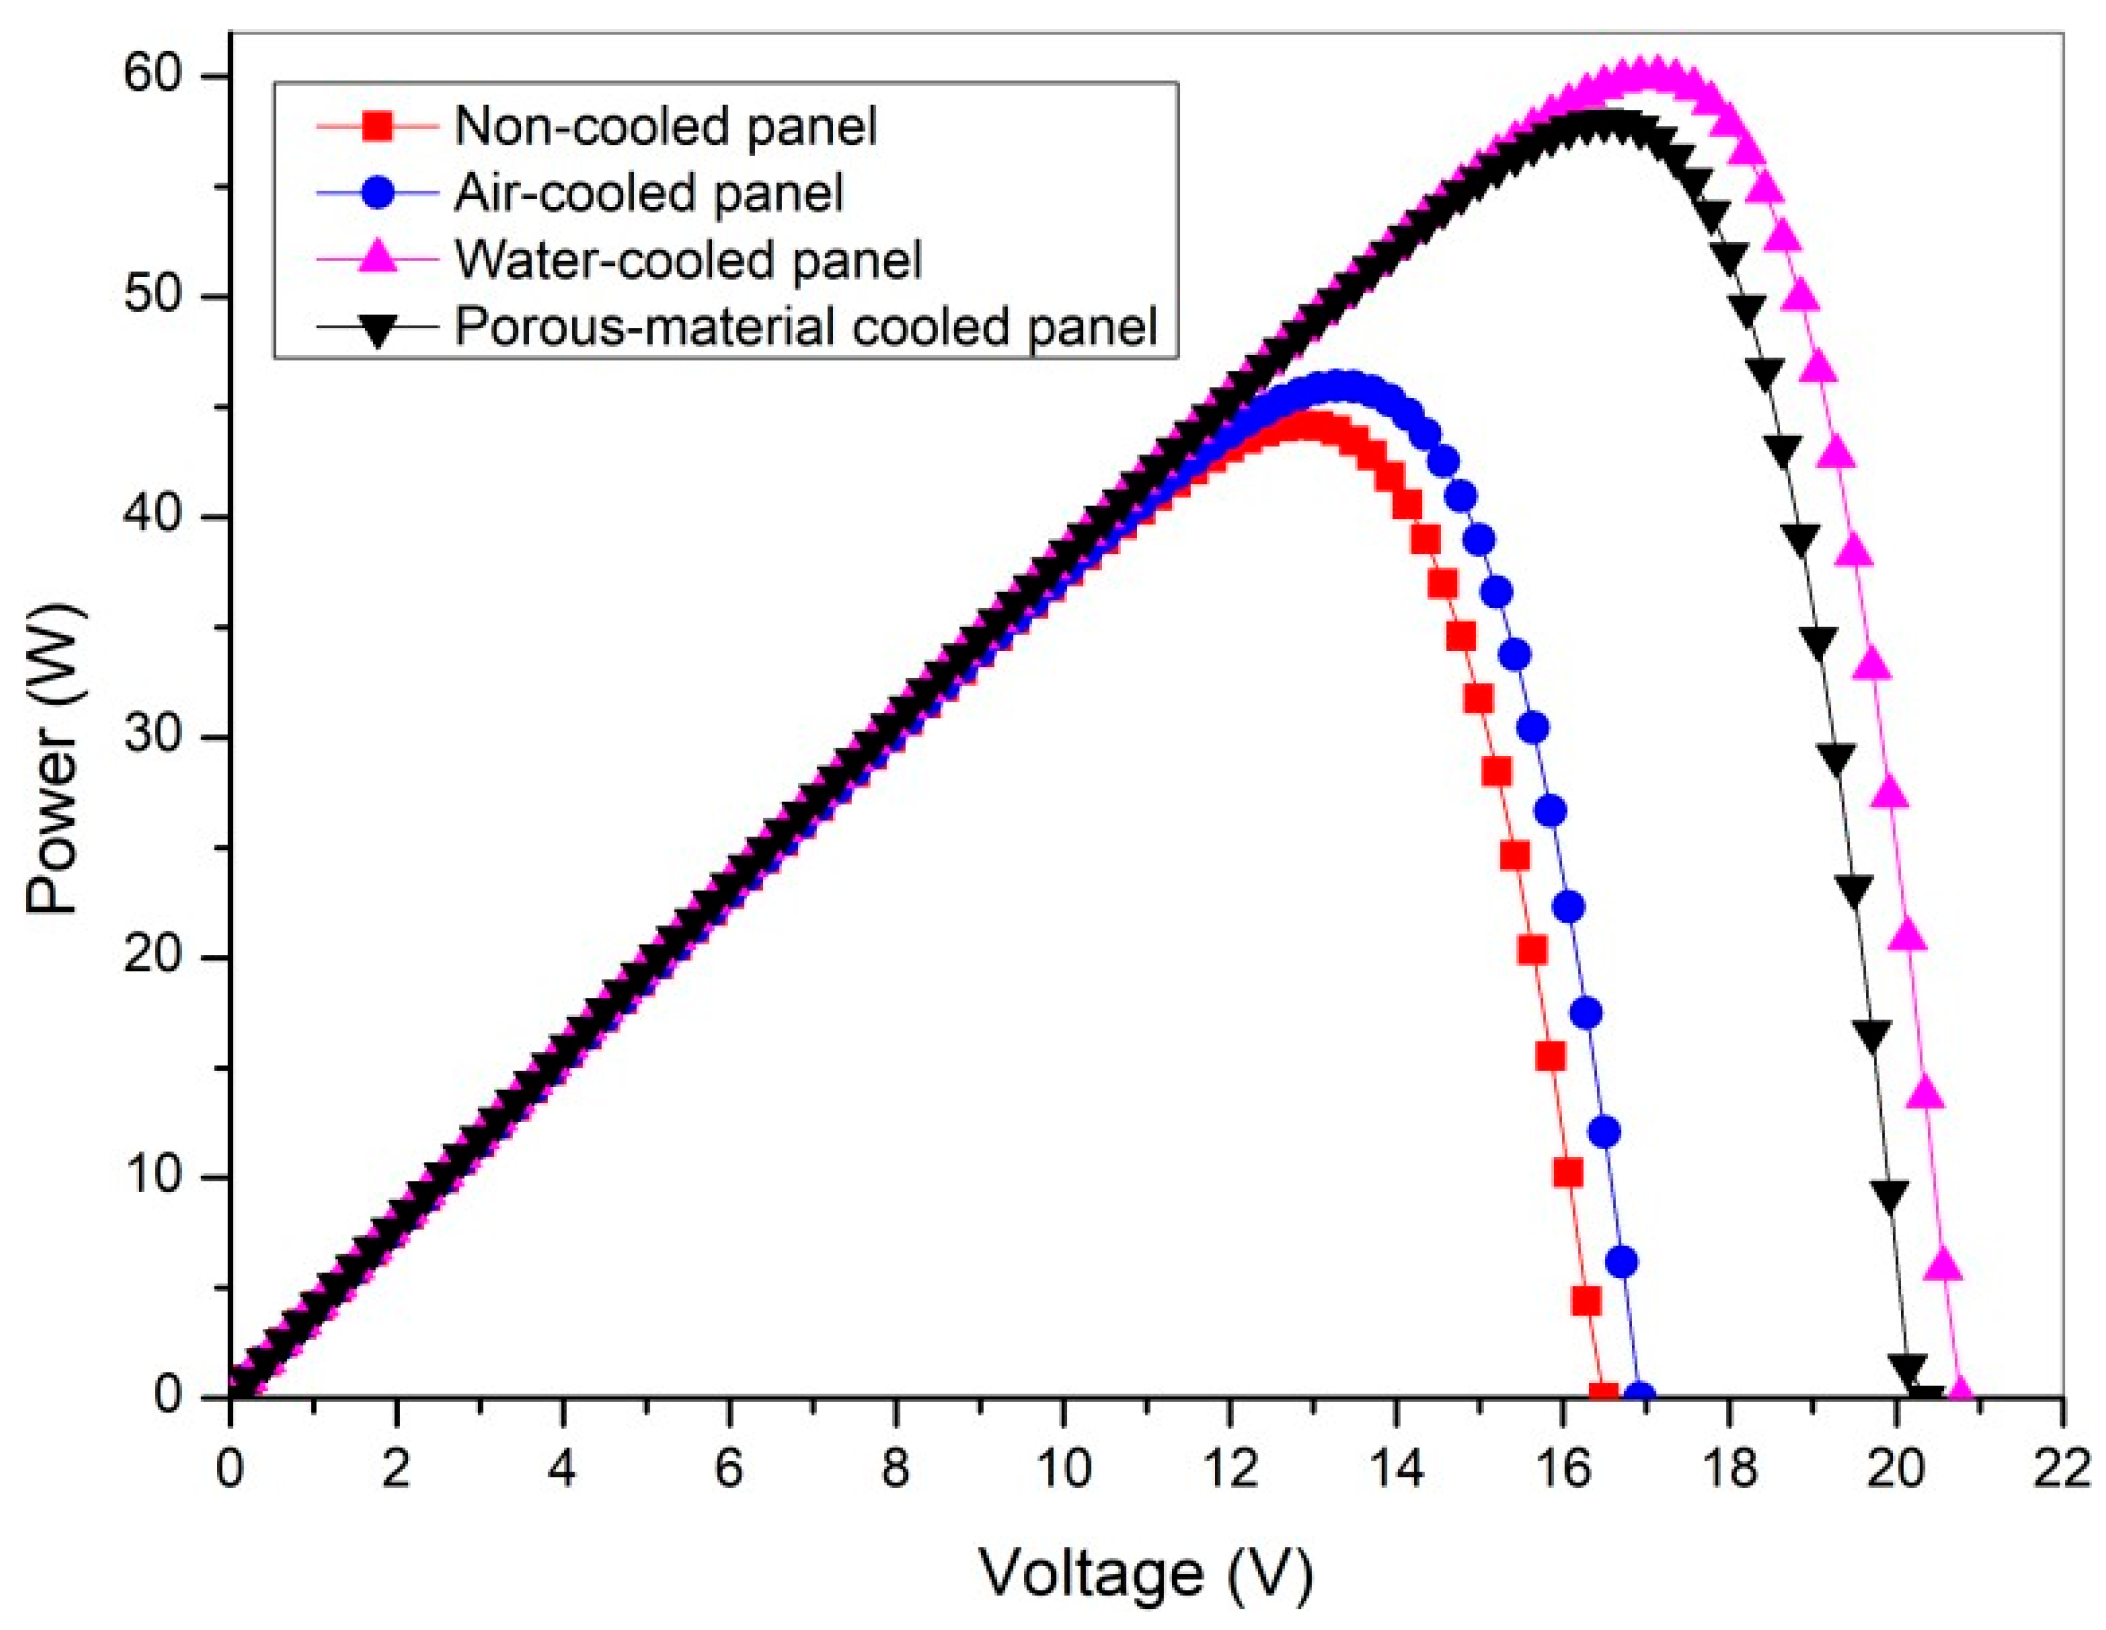
3.2.1. P–V Curve of the Solar Panel

The power–voltage (P–V) curve created under a constant irradiance of 900 W/m2 clearly illustrates how temperature affects the electrical performance of solar panels (see Figure 16). These curves result from the average temperature of each thermal configuration, employing the single-diode model that accurately reflects efficiency losses due to cell heating. Without any cooling system, the panel exhibits its lowest performance, producing a maximum voltage of 16.5 V and a maximum power of 44.2 W. This limitation stems from the elevated cell temperature, which negatively impacts the fill factor and the open-circuit voltage.
When air cooling is implemented, there is a slight improvement, with performance reaching 16.9 V and 46.0 W. While this increase indicates that the system partially mitigates temperature issues, it is not enough to make a significant difference in electrical performance. On the other hand, utilizing water and porous material cooling systems results in considerable enhancements. Water cooling achieves 20.8 V and a power output of 60.0 W, marking a significant increase of +35.8% in power compared to the uncooled scenario. This improvement is attributed to the considerable reduction in average cell temperature, which boosts the open-circuit voltage and minimizes recombination losses. The porous material cooling system, though completely passive, also delivers impressive results with 20.3 V and 58.0 W, corresponding to a +31.2% gain over the baseline. This demonstrates that even in the absence of active circulation, effective thermal management can significantly enhance efficiency.

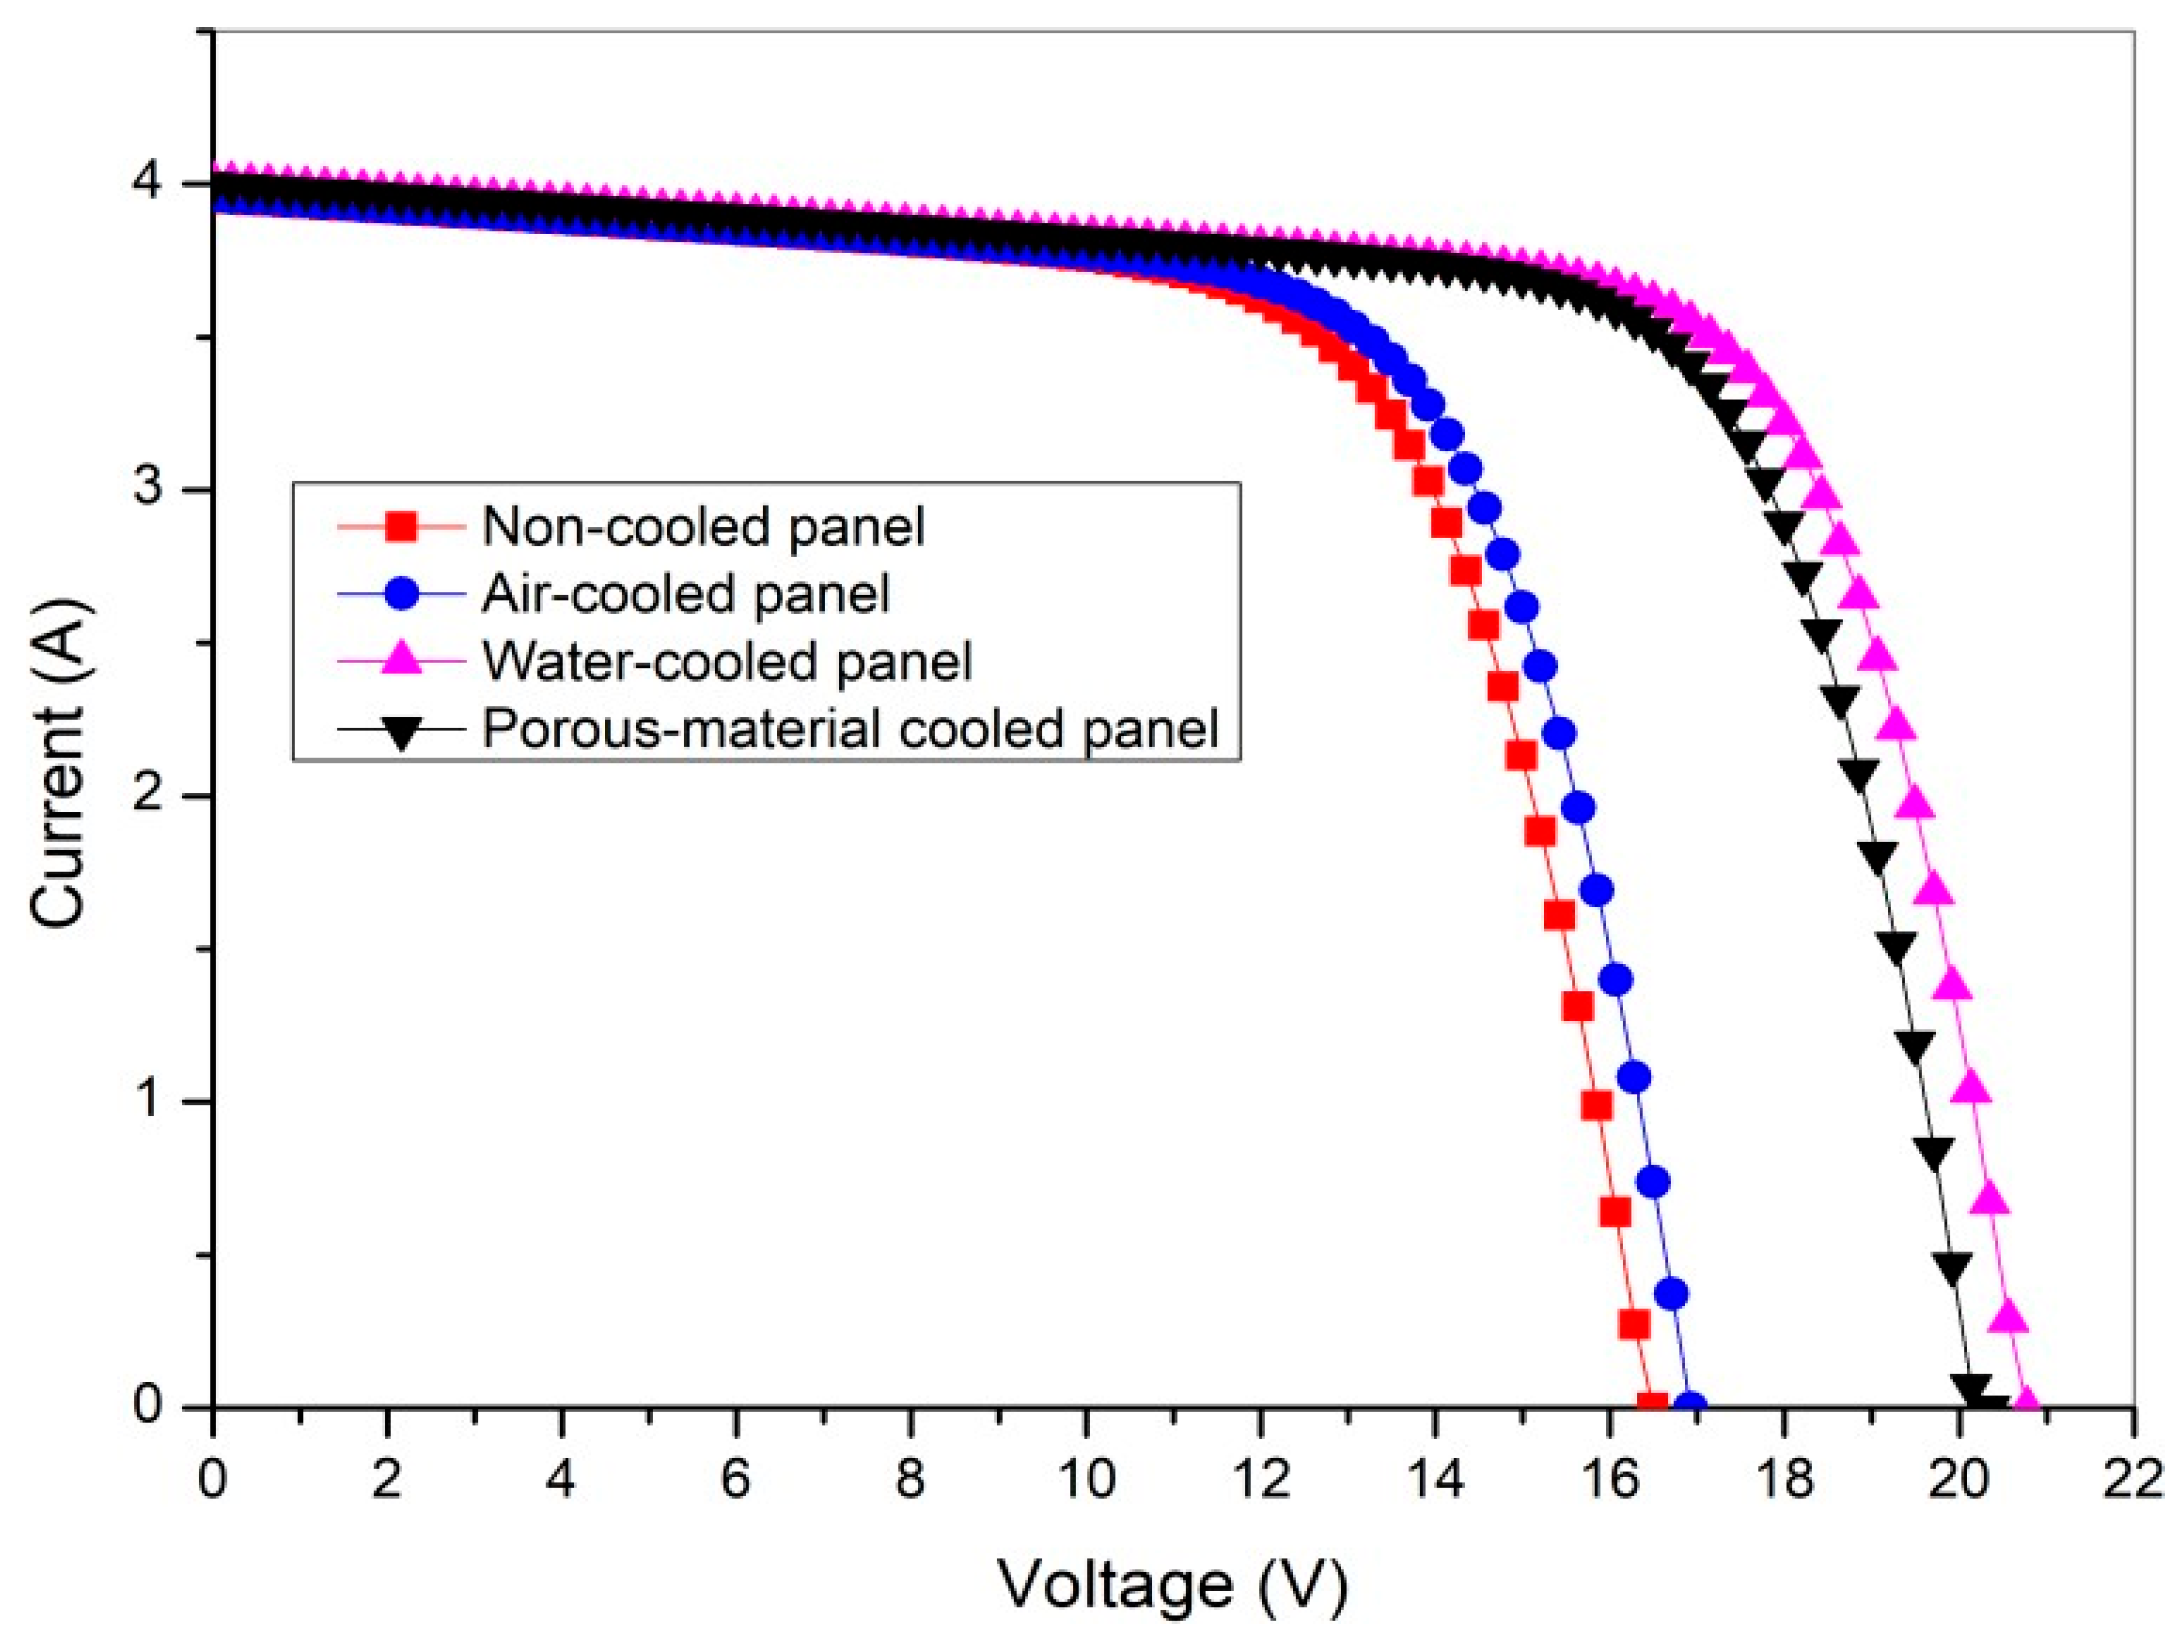
3.2.2. I–V Curve of the Solar Panel

Figure 17 displays the current–voltage (I–V) curve for the PV panel under various tested thermal configurations. Similar to the P–V curve, these results underscore how cooling systems directly affect the module’s electrical performance, particularly impacting voltage levels.
The analysis indicates a notable increase in output voltage with the application of cooling, especially with the water and porous material systems. This enhancement aligns with the established understanding that the output voltage of PV cells is sensitive to temperature; as temperatures rise, the voltage tends to decrease. Therefore, effective cooling helps to restore operating voltage, leading to improved overall performance.
In contrast, the output current remains fairly consistent across different setups. This stability can be attributed to the fact that, under constant irradiance, current generation largely depends on the number of incident photons, or the intensity of sunlight, and is only minimally influenced by temperature changes. The slight fluctuations observed can be explained by secondary effects, including reduced internal losses or minor improvements in the fill factor.

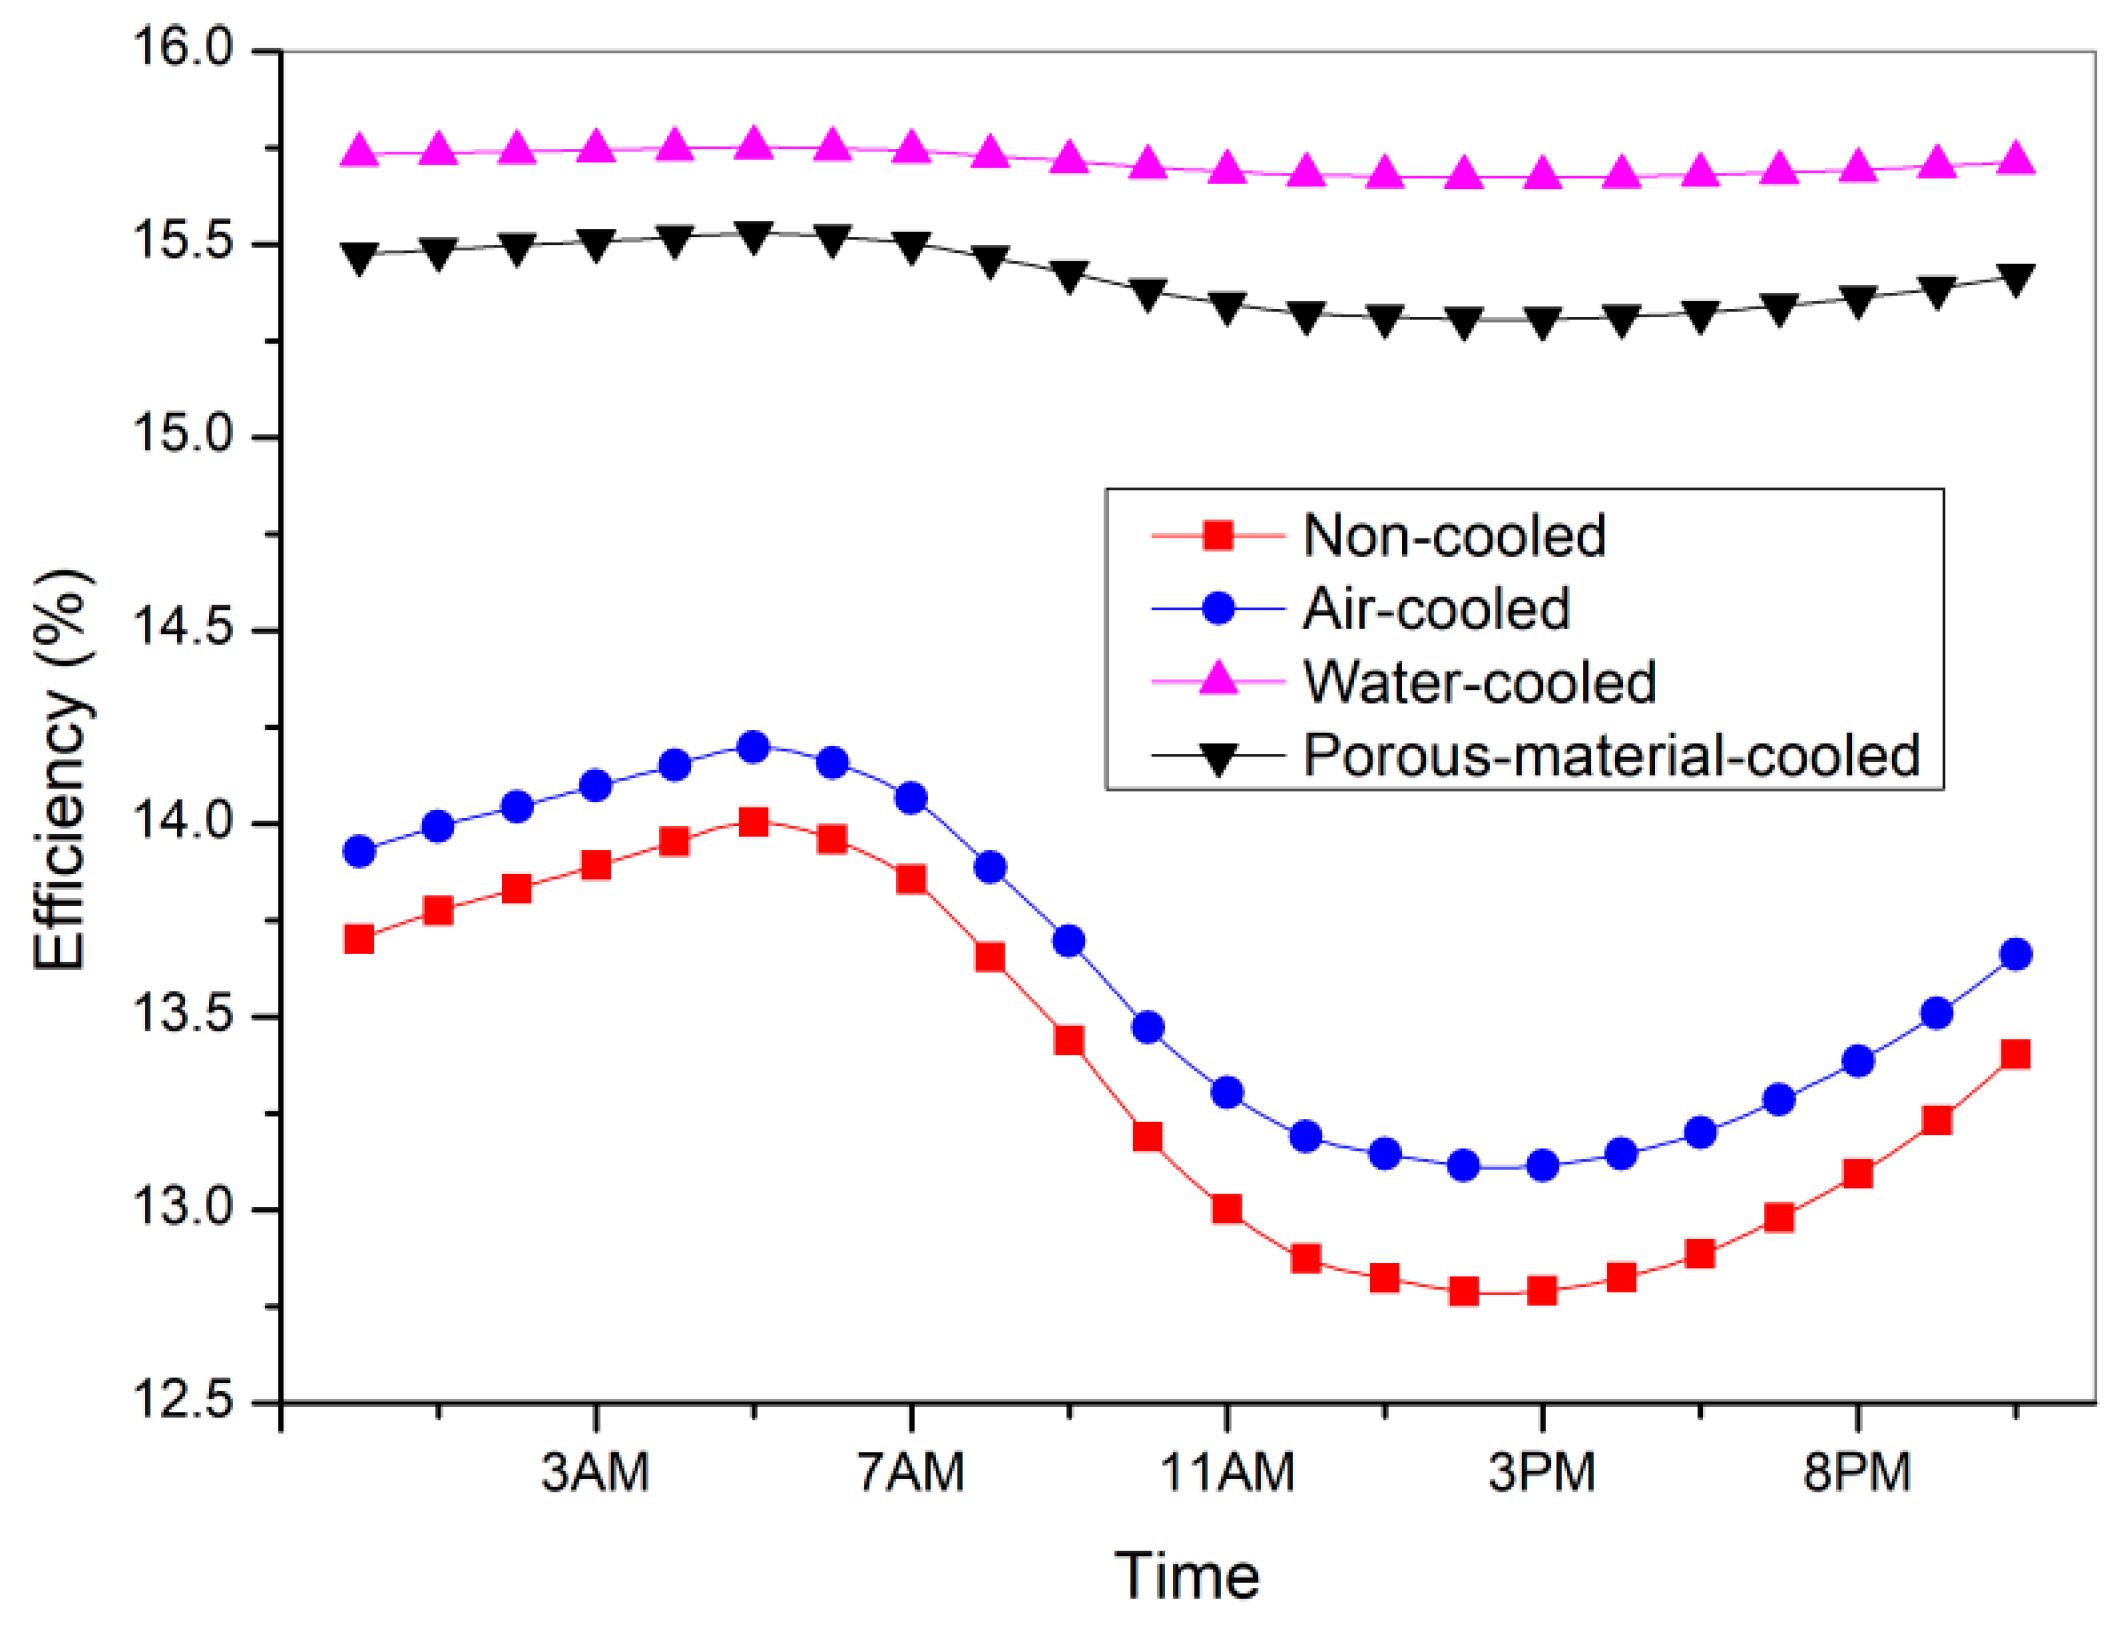
3.3. Efficiency Results

Figure 18 showcases how the energy efficiency of solar panels changes over time with different cooling strategies. This chart not only looks at their performance at specific moments but also assesses how consistent their efficiency is throughout the day. The panel without any cooling shows the lowest average efficiency, sitting at around 12.75%. This highlights how rising cell temperatures adversely affect conversion efficiency, mainly because of reduced open-circuit voltage and heightened internal losses.
Using air cooling offers only a slight enhancement, achieving an average efficiency of 13%. This minimal gain aligns with earlier thermal and electrical findings: both natural and forced air convection fail to effectively counteract the heating of the modules, especially during peak solar hours. On the flip side, cooling systems utilizing water and porous materials demonstrate significant improvements, hitting maximum efficiencies of 15.75% and 15.5%, respectively. These figures are indicative of far superior thermal management, maintaining operating temperatures much closer to their ideal settings.

3.4. Power Balance Analysis

Implementing a cooling system for photovoltaic (PV) panels necessitates a thorough evaluation of the overall energy balance. Simply boosting the gross power output is insufficient; we must ensure that the energy costs associated with the cooling system do not negate any benefits gained. Table 5 outlines the net power output for each configuration after accounting for the energy consumption of active systems. The uncooled panel acts as our baseline, with both gross and net output standing at 44.190 W. The air cooling system, while generating a gross output of 46.0 W, requires 2.71 W to operate its fan, bringing the net power down to 43.2 W—less than what we observe from the uncooled configuration. This outcome indicates that the energy cost of cooling surpasses the thermal gains, rendering this system ineffective or even disadvantageous under the conditions tested.
On the other hand, both water and porous material cooling systems, despite their active components (2.160 W for pumps), demonstrate substantial net gains. The water-cooled panel achieves a net power output of 57.84 W—13.65 W higher than our reference point. The porous system yields 55.8 W, translating to a net gain of 11.6 W. Therefore, both systems not only compensate for their energy usage but also significantly enhance overall energy production.

3.5. Uncertainty and Sensitivity Analysis

A sensitivity analysis was conducted on key input parameters (see Table 6) considering the following:
  • Convective heat transfer coefficient (h ± 20%)
  • Solar flux intensity (±10%)
  • Ambient temperature (±5 °C)
Table 6. Sensitivity analysis results.
Parameter Varied Change in Efficiency (%)Change in Output Power (W)
h + 20% +0.42+0.95
h − 20% –0.35–0.85
Solar flux + 10% +0.53+1.65
Solar flux − 10%–0.48–1.58
Ambient Temp + 5 °C–0.27–0.74
Ambient Temp − 5 °C+0.31+0.81
The sensitivity analysis highlights how variations in key input parameters influence the system’s efficiency and output power. Among the tested parameters, solar flux intensity showed the greatest impact, with a ±10% change resulting in efficiency variations of ±0.53% and output power shifts up to ±1.65 W. The convective heat transfer coefficient also had a moderate effect, with ±20% changes leading to efficiency fluctuations of ±0.42% and output changes of ±0.95 W. Ambient temperature exhibited the least sensitivity, causing output variations under ±0.81 W for ±5 °C changes. These results indicate that while the system is sensitive to changes in solar flux, overall performance remains stable within the realistic bounds of environmental and design uncertainties. The narrow range of efficiency and power deviations confirms the model’s robustness. Furthermore, the porous media and water cooling configurations remained the most resilient across all tested conditions.
The present study is limited by several factors, including the simulation of a single-day condition, the use of idealized boundary assumptions, and the lack of full-scale experimental validation. These constraints should be taken into account when generalizing the results to different climatic or operational conditions.

4. Conclusions

This study evaluated the impact of three cooling strategies, air, water, and porous media, on the thermal and electrical performance of photovoltaic panels under hyper-arid climatic conditions. Using CFD simulations in ANSYS Fluent and validated against experimental data, the analysis focused on thermal behavior, electrical efficiency, and net energy output.
The results demonstrate that water cooling is the most effective approach, reducing cell temperatures by over 35 °C and increasing electrical power output by more than 30% compared to the non-cooled case. Porous media cooling, which operates passively via evaporation through gravel, also achieves significant gains (26%), while air cooling produces only marginal improvements.
Electrical enhancements are primarily attributed to reductions in panel temperature, which increased the open-circuit voltage. Sensitivity and uncertainty analyses confirm that the model is robust with respect to variations in ambient temperature, convection coefficients, and solar irradiance. Additionally, mesh independence tests and comparison with experimental benchmarks support the numerical consistency and credibility of the results.
The porous material cooling method stands out as a viable low-energy alternative in remote or resource-scarce environments, making it especially suitable for applications in desert and off-grid conditions. Its performance, though slightly below that of active water cooling, offers a compelling compromise between efficiency, simplicity, and sustainability.
The primary objective of this study—assessing and comparing the thermal and electrical performance of air, water, and porous media cooling strategies—was successfully achieved, with clear identification of the most effective solution (water cooling), and the validation of porous media cooling as a viable passive alternative.
Nevertheless, the conclusions drawn are subject to the limitations of the study, including the one-day simulation scope, simplified geometry assumptions, and absence of experimental prototyping. Future work should focus on long-term validation and real-scale implementation.
Looking ahead, several research directions are worth exploring. These include evaluating the long-term effectiveness of the cooling methods under different climate conditions to ensure practical reliability, developing experimental prototypes for porous and water-based systems, incorporating diffuser geometries and turbulence models, conducting techno-economic and lifecycle assessments for each cooling approach, and implementing adaptive AI-driven control systems for real-time thermal management.

Author Contributions

Conceptualization, B.M.; Methodology, B.M. and M.A.-l.; Software, B.M.; Formal analysis, N.E.H.B. and L.O.; Writing—original draft, B.M. and S.N.; Writing—review & editing, V.T. All authors have read and agreed to the published version of the manuscript.

Funding

No funding was obtained for this work.

Institutional Review Board Statement

Not applicable.

Informed Consent Statement

Not applicable.

Data Availability Statement

Data will be made available upon request from the corresponding author.

Acknowledgments

During the preparation of this manuscript, author(s) used Grammarly for language editing and rephrasing of sentences.

Conflicts of Interest

The authors declare no conflict of interest.

References

  1. Osorio, L.; Moreno, M.; Rivera, M.; Tuninetti, V.; Chavarria, G.R.; Duchêne, L.; Wheeler, P. A Metaheuristic-Based Method for Photovoltaic Temperature Computation under Tropical Conditions. Sol. Energy 2024, 271, 112414. [Google Scholar] [CrossRef]
  2. Akrouch, M.A.; Chahine, K.; Faraj, J.; Hachem, F.; Castelain, C.; Khaled, M. Advancements in cooling techniques for enhanced efficiency of solar photovoltaic panels: A detailed comprehensive review and innovative classification. Energy Built Environ. 2025, 6, 248–276. [Google Scholar] [CrossRef]
  3. Wassie, H.M.; Kassie, K.E.; Getie, M.Z. A Comprehensive Review on the Photovoltaic Panel Cooling Technique for Improved Efficiency. In Sustainable Development Research in Materials and Renewable Energy Engineering. Green Energy and Technology; Getie, M.Z., Mequanint, K., Alemu, M.A., Ashebir, G.Y., Tigabu, M.T., Eds.; Springer: Cham, Switzerland, 2025. [Google Scholar] [CrossRef]
  4. Kumar, V.; Gupta, N.; Yadav, A.; Kumar, N.; Verma, A.; Kumar, A.; Dhasmana, H.; Jain, V.K. Enhancing Solar Photovoltaic System Efficiency: Recent Progress on Its Cooling Techniques. Int. J. Thermophys. 2024, 45, 113. [Google Scholar] [CrossRef]
  5. Akrouch, M.A.; Faraj, J.; Hachem, F.; Castelain, C.; Khaled, M. A comprehensive review and comparison of cooling techniques for photovoltaic panels: An emphasis on experimental setup and energy efficiency ratios. Int. J. Thermofluids 2024, 23, 100774. [Google Scholar] [CrossRef]
  6. Sharaf, M.; Yousef, M.S.; Huzayyin, A.S. Review of cooling techniques used to enhance the efficiency of photovoltaic power systems. Environ. Sci. Pollut. Res. 2022, 29, 26131–26159. [Google Scholar] [CrossRef]
  7. Ibrahim, T.; Abou Akrouch, M.; Hachem, F.; Ramadan, M.; Ramadan, H.S.; Khaled, M. Cooling Techniques for Enhanced Efficiency of Photovoltaic Panels—Comparative Analysis with Environmental and Economic Insights. Energies 2024, 17, 713. [Google Scholar] [CrossRef]
  8. Muhe, A.J.; Hasan, I.A.; Hussein, A.A. Optimizing solar panel performance with advanced cooling techniques: An investigation of phase change materials and water jackets integration with two different designs. AIP Conf. Proc. 2025, 3169, 040100. [Google Scholar] [CrossRef]
  9. Abdel-Aziz, M.M.; ElBahloul, A.A. Innovations in improving photovoltaic efficiency: A review of performance enhancement techniques. Energy Convers. Manag. 2025, 327, 119589. [Google Scholar] [CrossRef]
  10. Sathyamurthy, R.; Kabeel, A.E.; Chamkha, A.; Karthick, A.; Manokar, A.M.; Sumithra, M.G. Experimental investigation on cooling the photovoltaic panel using hybrid nanofluids. Appl. Nanosci. 2021, 11, 363–374. [Google Scholar] [CrossRef]
  11. Ali, M.G.; Hassan, H.; Ookawara, S.; Nada, S.A. Investigation of the performance enhancement of building-integrated photovoltaic systems using evaporative porous clay applied in different building directions. J. Build. Eng. 2024, 82, 108292. [Google Scholar] [CrossRef]
  12. Ali, A.A.; Lafta, D.A.; Noori, S.W.; Abdulamir, F.; Rashid, F.L. Innovative materials integrated with PCM for enhancing photovoltaic panel efficiency: An experimental investigation. J. Energy Storage 2024, 102, 114258. [Google Scholar] [CrossRef]
  13. Zureigat, H.M.; Qawasmeh, B.R. Enhancing the productivity of PV module using cooling method: Experimental and simulation investigation in Jordan. Sol. Energy 2025, 287, 113238. [Google Scholar] [CrossRef]
  14. Agyekum, E.B.; PraveenKumar, S.; Alwan, N.T.; Velkin, V.I.; Shcheklein, S.E. Effect of dual surface cooling of a solar photovoltaic panel on the efficiency of the module: An experimental investigation. Heliyon 2021, 7, e07920. [Google Scholar] [CrossRef]
  15. Kumari, S.; Bhende, A.; Pandit, A.; Rayalu, S. Efficiency enhancement of photovoltaic panel by heat harvesting techniques. Energy Sustain. Dev. 2023, 73, 303–314. [Google Scholar] [CrossRef]
  16. Al Miaari, A.; Mohaisen, K.O.; Al-Ahmed, A.; Ali, H.M. Experimental investigation on thermal management and performance enhancement of photovoltaic panel cooled by a sustainable shape stabilized phase change material. Case Stud. Therm. Eng. 2025, 67, 105763. [Google Scholar] [CrossRef]
  17. Chanphavong, L.; Chanthaboune, V.; Phommachanh, S.; Vilaida, X.; Bounyanite, P. Enhancement of performance and exergy analysis of a water-cooling solar photovoltaic panel. Total. Environ. Res. Themes 2022, 3–4, 100018. [Google Scholar] [CrossRef]
  18. Zabihi Sheshpoli, A.; Jahanian, O.; Nikzadfar, K. Performance enhancement of a hybrid photovoltaic/thermal system using wire coils inside the cooling tube: Numerical and experimental case. Environ. Sci. Pollut. Res. 2024, 31, 18260–18280. [Google Scholar] [CrossRef] [PubMed]
  19. Saada, S.A.; Nebbali, R.; Kecili, I.; Zembri-Nebbali, D.; Rahim, M.; Nguyen, D.M. Operating temperature and electrical efficiency of a photovoltaic panel cooled by laminar water film flowing on its front face: Experimental and numerical approach. Mater. Today Sustain. 2025, 30, 101093. [Google Scholar] [CrossRef]
  20. Bulat, S.; Büyükbicakci, E.; Erkovan, M. Efficiency Enhancement in Photovoltaic–Thermoelectric Hybrid Systems through Cooling Strategies. Energies 2024, 17, 430. [Google Scholar] [CrossRef]
  21. Yamini, D.; Rao, G.S.; Tejaswi, M.; Vishal, M.G.; Vennela, M. Enhancement of Solar Panel Efficiency. In Innovations in Energy Management and Renewable Resources; Lecture Notes in Electrical Engineering; Pal, M., Guerrero, J.M., Siano, P., Das, D., Chowdhuri, S., Eds.; Springer: Singapore, 2023; p. 1239. [Google Scholar] [CrossRef]
  22. Wongwuttanasatian, T.; Sarikarin, T.; Suksri, A. Performance enhancement of a photovoltaic module by passive cooling using phase change material in a finned container heat sink. Sol. Energy 2020, 195, 47–53. [Google Scholar] [CrossRef]
  23. Dhokane, N.; Ramesh, S. Enhancement of Reliability and Efficiency of Solar Panel Using Cooling Methods. In Techno-Societal; Pawar, P.M., Balasubramaniam, R., Ronge, B.P., Salunkhe, S.B., Vibhute, A.S., Melinamath, B., Eds.; Springer: Cham, Switzerland, 2020. [Google Scholar] [CrossRef]
  24. Hosseinghorbani, A.; Rivera-Solorio, C.I.; Gijón-Rivera, M. Performance improvement of concentrated photovoltaic thermal (CPVT) system using a novel insert. Energy 2025, 316, 134505. [Google Scholar] [CrossRef]
  25. Popovici, C.G.; Hudişteanu, S.V.; Mateescu, T.D.; Cherecheş, N.-C. Efficiency Improvement of Photovoltaic Panels by Using Air Cooled Heat Sinks. Energy Procedia 2016, 85, 425–432. [Google Scholar] [CrossRef]
  26. Sargunanathan, S.; Elango, A.; Tharves Mohideen, S. Performance enhancement of solar photovoltaic cells using effective cooling methods: A review. Renew. Sustain. Energy Rev. 2016, 64, 382–393. [Google Scholar] [CrossRef]
  27. Metwally, H.; Mahmoud, N.A.; Ezzat, M.; Aboelsoud, W. Numerical investigation of photovoltaic hybrid cooling system performance using the thermoelectric generator and RT25 Phase change material. J. Energy Storage 2021, 42, 103031. [Google Scholar] [CrossRef]
  28. Javidan, M.; Moghadam, A.J. Experimental investigation on thermal management of a photovoltaic module using water-jet impingement cooling. Energy Convers. Manag. 2021, 228, 113686. [Google Scholar] [CrossRef]
  29. Saeed, S.; Hussain, A.; Ali, I.; Shahid, H.; Anwar, M.; Ali, H.M. Photovoltaic module efficiency enhancement system by novel cooling techniques: Effect of phase change material and fins. Process. Saf. Environ. Prot. 2025, 194, 1056–1066. [Google Scholar] [CrossRef]
  30. Prakash, A.; Kukreja, R.; Kumar, P. Cooling of PV panel by using PCM and nanofluid-review. Mater. Today Proc. 2024. [Google Scholar] [CrossRef]
  31. Kaneesamkandi, Z.; Rehman, A.U. Selection of a Photovoltaic Panel Cooling Technique Using Multi-Criteria Decision Analysis. Appl. Sci. 2023, 13, 1949. [Google Scholar] [CrossRef]
  32. Faheem, M.; Abu Bakr, M.; Ali, M.; Majeed, M.A.; Haider, Z.M.; Khan, M.O. Evaluation of Efficiency Enhancement in Photovoltaic Panels via Integrated Thermoelectric Cooling and Power Generation. Energies 2024, 17, 2590. [Google Scholar] [CrossRef]
  33. Hudișteanu, V.-S.; Cherecheș, N.-C.; Țurcanu, F.-E.; Hudișteanu, I.; Romila, C. Impact of Temperature on the Efficiency of Monocrystalline and Polycrystalline Photovoltaic Panels: A Comprehensive Experimental Analysis for Sustainable Energy Solutions. Sustainability 2024, 16, 10566. [Google Scholar] [CrossRef]
  34. Hajjaj, S.S.H.; Aqeel, A.A.K.A.; Sultan, M.T.H.; Shahar, F.S.; Shah, A.U.M. Review of Recent Efforts in Cooling Photovoltaic Panels (PVs) for Enhanced Performance and Better Impact on the Environment. Nanomaterials 2022, 12, 1664. [Google Scholar] [CrossRef] [PubMed]
  35. Masalha, I.; Masuri, S.U.; Badran, O.; Alahmer, A. A multi-method approach to investigating porous media cooling for enhanced thermal performance of photovoltaic panels: Exploring the effects of porosity, flow rates, channel design, and coolant types. Int. J. Thermofluids 2025, 27, 101165. [Google Scholar] [CrossRef]
  36. Venegas, I.; Oñate, A.; Pierart, F.G.; Valenzuela, M.; Narayan, S.; Tuninetti, V. Efficient Mako Shark-Inspired Aerodynamic Design for Concept Car Bodies in Underground Road Tunnel Conditions. Biomimetics 2024, 9, 448. [Google Scholar] [CrossRef] [PubMed]
  37. Adrar. Algeria Weather Historystar_Ratehome. Available online: https://www.wunderground.com/history/daily/dz/adrar/DAUA/date/2023-7-21 (accessed on 5 June 2025).
  38. Yesildal, F.; Ozakin, A.N.; Yakut, K. Optimization of operational parameters for a photovoltaic panel cooled by spray cooling. Eng. Sci. Technol. Int. J. 2022, 25, 100983. [Google Scholar] [CrossRef]
  39. Tuninetti, V.; Ales, B.; Chandía, T.M. Numerical and Experimental Analysis of Thermal Stratification in Locally Heated Residential Spaces. Buildings 2025, 15, 2417. [Google Scholar] [CrossRef]
  40. Mahdi, E.J.; Algburi, S.; Al-Abadi, N.; Ahmed, O.K.; Ahmed, A.K. Photovoltaic panel cooling using ground source energy: CFD simulation. Results Eng. 2024, 22, 102144. [Google Scholar] [CrossRef]
  41. Bukar, A.M.; Almerbati, A.; Shuja, S.Z.; Zubair, S.M. Enhancing solar PV panel performance through active and passive cooling techniques: A comprehensive review. Renew. Sustain. Energy Rev. 2025, 216, 115611. [Google Scholar] [CrossRef]
  42. Sheikh, Y.; Jasim, M.; Qasim, M.; Qaisieh, A.; Hamdan, M.O.; Abed, F. Enhancing PV solar panel efficiency through integration with a passive Multi-layered PCMs cooling system: A numerical study. Int. J. Thermofluids 2024, 23, 100748. [Google Scholar] [CrossRef]
  43. Jyani, L.; Sankhala, S.; Chaudhary, K.; Purohit, K. Experimental Investigation of Flexible Solar Cells Using Passive Cooling Technique in Hot and Dry Climate of Jodhpur. J. Sol. Energy Res. 2024, 9, 1854–1869. [Google Scholar] [CrossRef]
Figure 1. Model of the solar panel in the Design Modeler environment.
Sustainability 17 06559 g001
Figure 2. Thermo-physical properties of solar panel layer materials [35].
Sustainability 17 06559 g002
Figure 3. Mesh generated on the solar panel model.
Sustainability 17 06559 g003
Figure 4. Model for the air cooling scenario.
Sustainability 17 06559 g004
Figure 5. Model for the water cooling scenario.
Sustainability 17 06559 g005
Figure 6. Model for the porous material layer below the solar panel.
Sustainability 17 06559 g006
Figure 7. Model for the porous material cooling scenario.
Sustainability 17 06559 g007
Figure 8. Comparison of temperature panel results between simulation and experimental data for air-cooled panel.
Sustainability 17 06559 g008
Figure 9. Temperature curve for the non-cooled solar panel and solar cells.
Sustainability 17 06559 g009
Figure 10. Temperature curve for the air-cooled solar panel and solar cells.
Sustainability 17 06559 g010
Figure 11. Temperature results for the water-cooled solar panel and solar cells.
Sustainability 17 06559 g011
Figure 12. Temperature results for the porous material-cooled solar panel and solar cells.
Sustainability 17 06559 g012
Figure 13. Temperature profiles for the solar cells with and without a cooling system.
Sustainability 17 06559 g013
Figure 14. Temperature profiles for the solar panel with and without a cooling system.
Sustainability 17 06559 g014
Figure 15. Temperature contours of solar cells with various cooling systems: (A) Non-cooled cells, (B) Air-cooled cells, (C) Water-cooled cells, (D) Porous material-cooled cells.
Sustainability 17 06559 g015
Figure 16. The P–V curve for the solar panel with and without cooling.
Sustainability 17 06559 g016
Figure 17. I–V curve for the solar panel with and without cooling.
Sustainability 17 06559 g017
Figure 18. Efficiency-over-time curves for solar panels with and without a cooling system.
Sustainability 17 06559 g018
Table 1. Model specifications of solar panels [29].
ParameterValue
Rated power70 W
Rated efficiency16%
Number of cells36
Cell typeMono-crystalline
Cell dimensions125 × 125 mm
Panel dimensions (W × L × H)500 × 1125 × 3 mm
Cell configurationPseudo-square with rounded corners
Diameter of rounded corners150 mm
Voltage temperature coefficient 0.5%/°C
Current temperature coefficient0.02%/°C
Standard test conditions1000 W/m2, °C
Short circuit current (Isc)4.48 A
Open circuit voltage (Voc)21.42 V
Rated voltage17.64 V
Rated current3.97 A
Table 2. The weather data for 21 July 2023 for the region of Adrar, Algeria [37].
TimeTemperature (°C)Wind Speed (m/s)Wind Gust (m/s)Conditions
12:00 a.m.33.94.50Fair
02:00 a.m32.26.30Fair
03:00 a.m31.15.40Fair
04:00 a.m.31.16.30Fair
05:00 a.m.30.06.70Fair
06:00 a.m.28.96.30Fair
07:00 a.m.28.95.80Fair
08:00 a.m.33.96.70Fair
09:00 a.m.37.810.70Low Drift
10:00 a.m.42.811.20Low Drift
11:00 a.m.42.810.70Low Drift
12:00 p.m.45.09.40Low Drift
1:00 p.m.46.112.50Low Drift
2:00 p.m.46.19.40Low Drift
3:00 p.m.46.18.90Low Drift
4:00 p.m.45.08.90Low Drift
6:00 p.m.45.08.90Low Drift
7:00 p.m.43.99.80Low Drift
8:00 p.m.42.26.30Fair
9:00 p.m.40.05.80Fair
10:00 p.m.37.85.80Fair
11:00 p.m.36.16.30Fair
Table 3. Boundary conditions applied to the solar panel [29].
SurfaceBoundary ConditionBoundary Condition Value
ETFERadiation, convection, heat fluxHeat transfer coefficient (h) = 32 W/m2K,
Heat flux magnitude = 900 W/m2,
Temperatures of 47 °C for air, 23 °C for water, and 31 °C for porous
CFRPRadiation, convectionTemperatures of 44 °C for air, 27 °C for water, and 34 °C for porous
EVA1Heat fluxHeat flux magnitude = 25 W/m2
Silicon cellsHeat fluxHeat flux magnitude = 673 W/m2
Table 4. Mesh independence results.
Mesh DensityMax Cell Temp (°C)Power Output (W)
Coarse (45k)33.7857.1
Medium (90k)33.6757.8
Fine (180k)33.6557.9
Table 5. Net output power saving for PV panel without and with cooling system.
Non-Cooled PanelAir-Cooled PanelWater-Cooled PanelPorous Material-Cooled Panel
PV panel output power generated (W)44.2466058
Power consumption (W)02.712.162.16
Net output power (W)44.243.257.855.8
Net output power saving (W)--−0.95313.611.6
Percentage of net output power saving (%)-−2.15630.926.3
Disclaimer/Publisher’s Note: The statements, opinions and data contained in all publications are solely those of the individual author(s) and contributor(s) and not of MDPI and/or the editor(s). MDPI and/or the editor(s) disclaim responsibility for any injury to people or property resulting from any ideas, methods, instructions or products referred to in the content.

