

The Digital Transformation of the Manufacturing Industry, the Double-Factor Allocation Efficiency of the Manufacturing Industry, and Carbon Emissions: Evidence from China


Abstract
1. Introduction
2. Literature Review
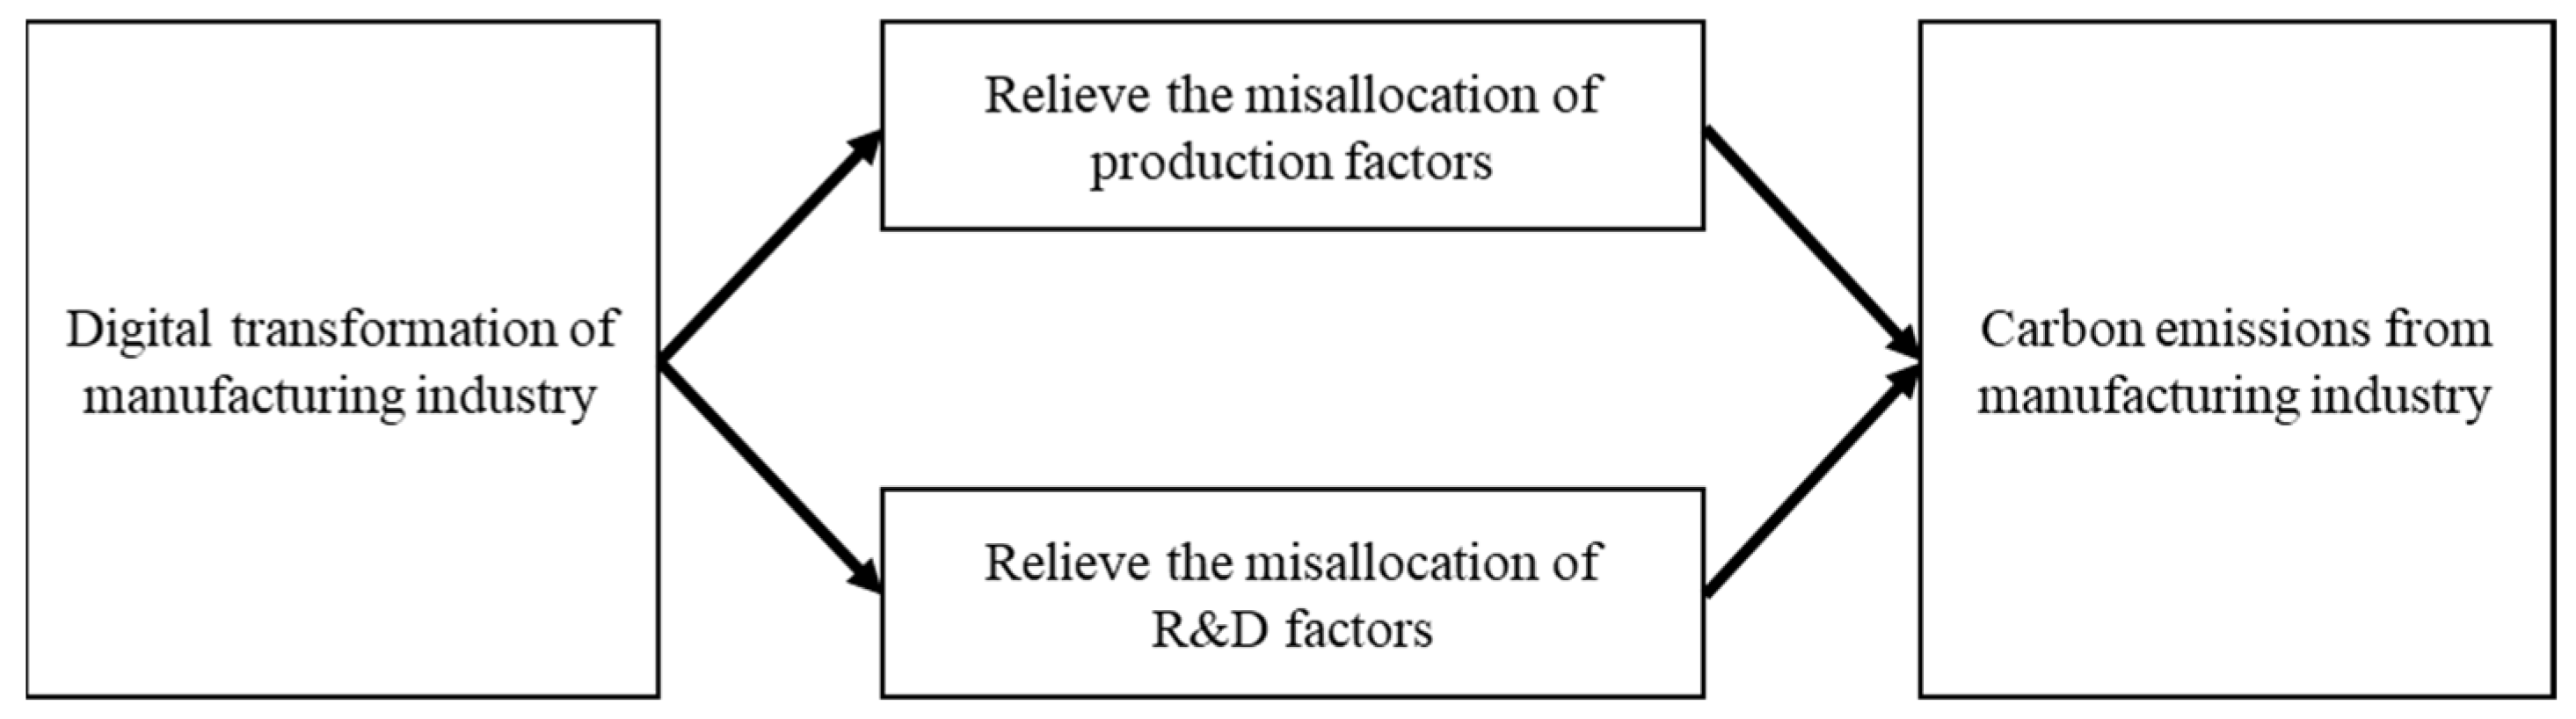
3. Theoretical Analysis
4. Data Description and Construction of Main Variable Indicators
4.1. Data Selection and Source Description
4.2. Construction of Main Variable Indicators
4.3. Characteristic Facts
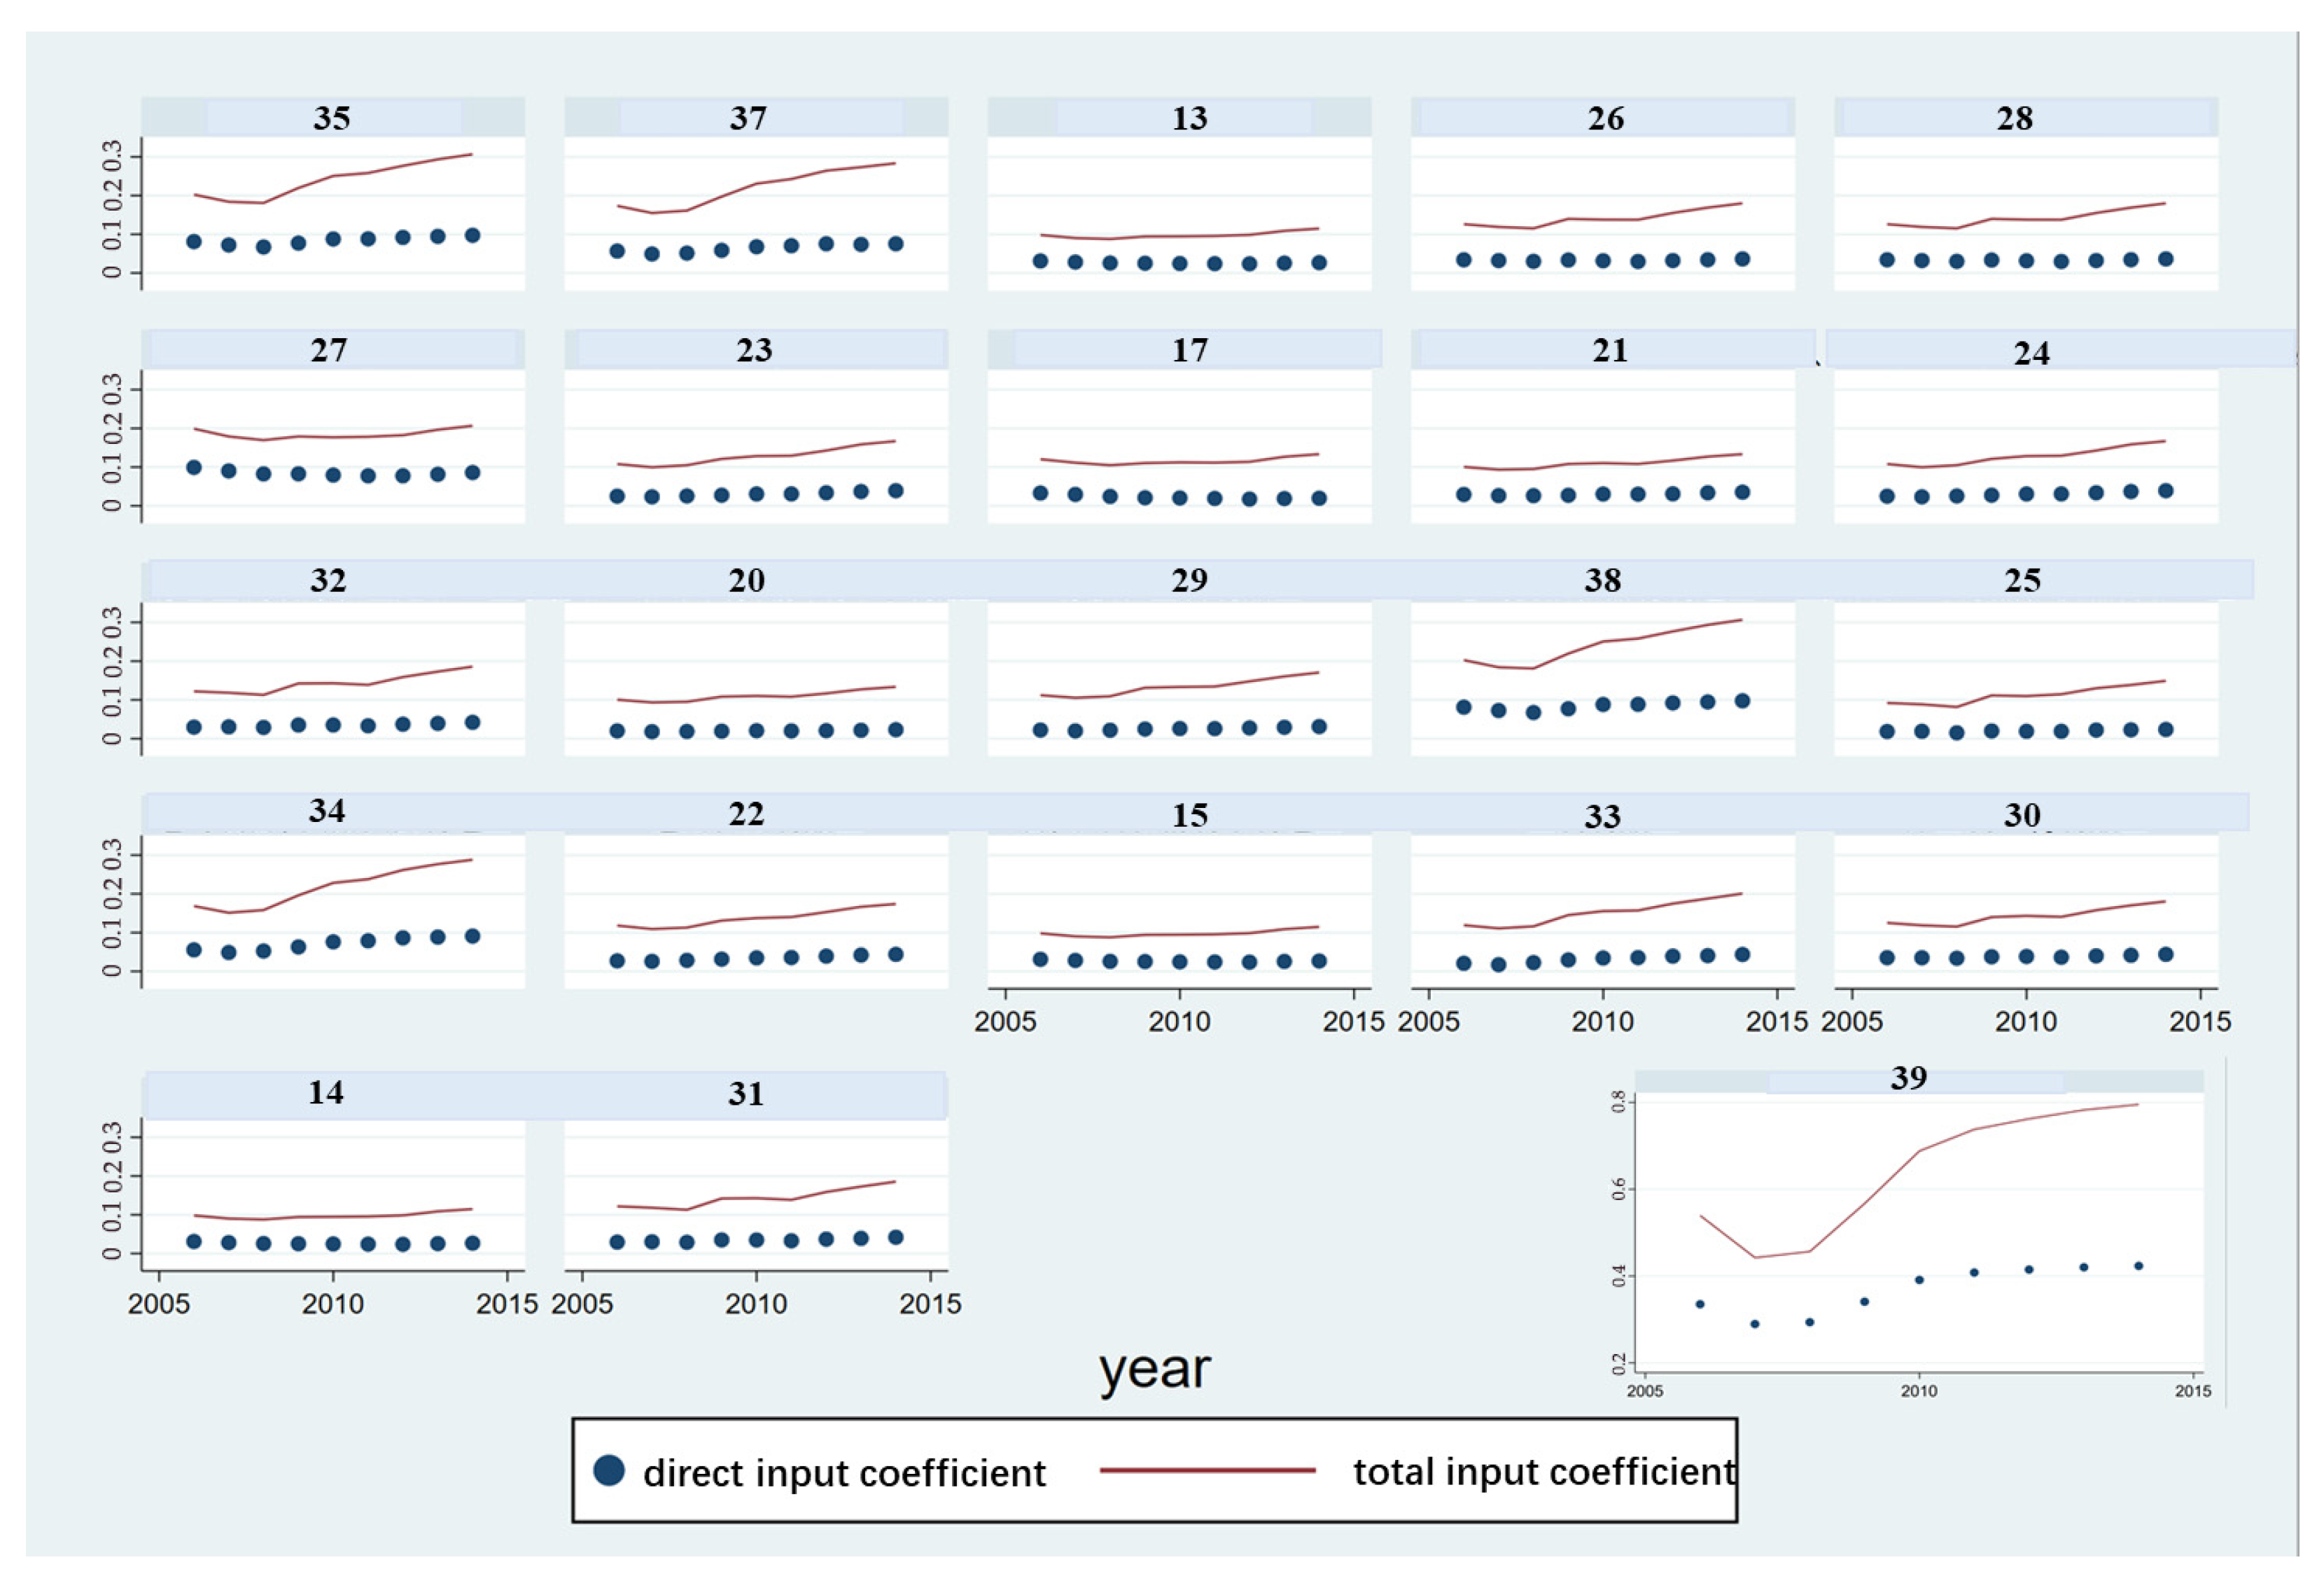
4.3.1. The Level of Digitalization of Manufacturing Sub-Industries
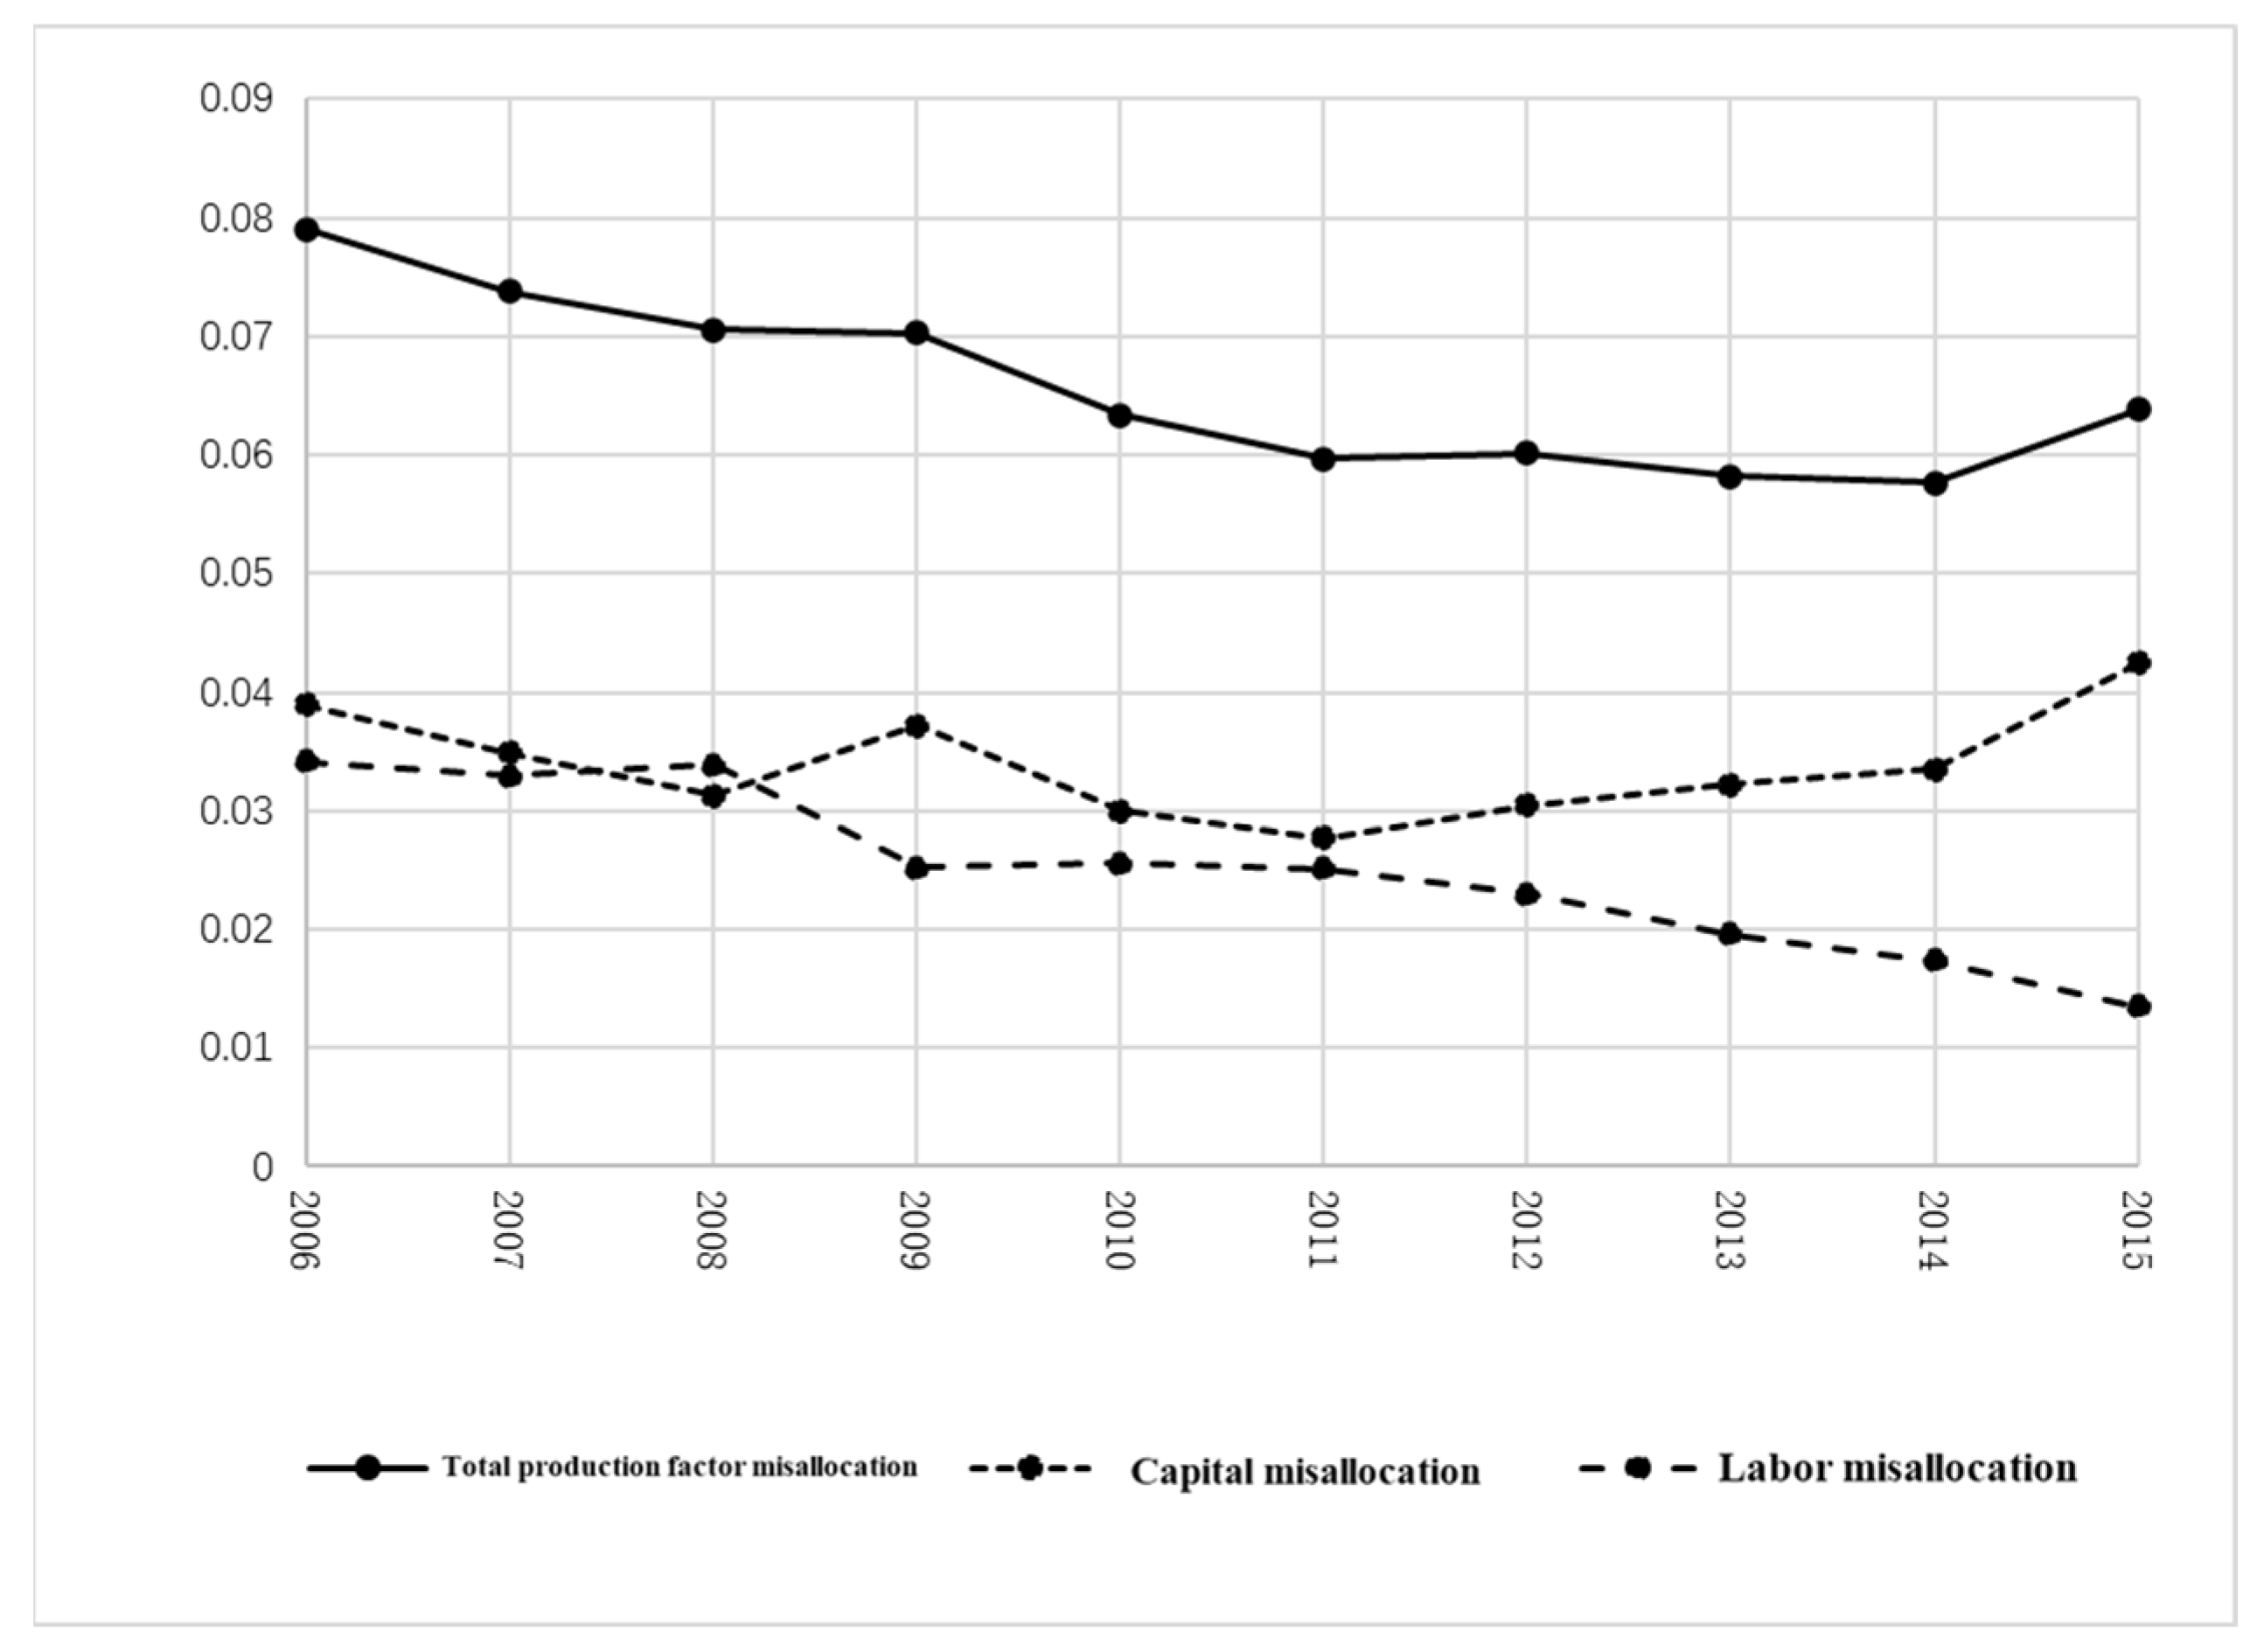
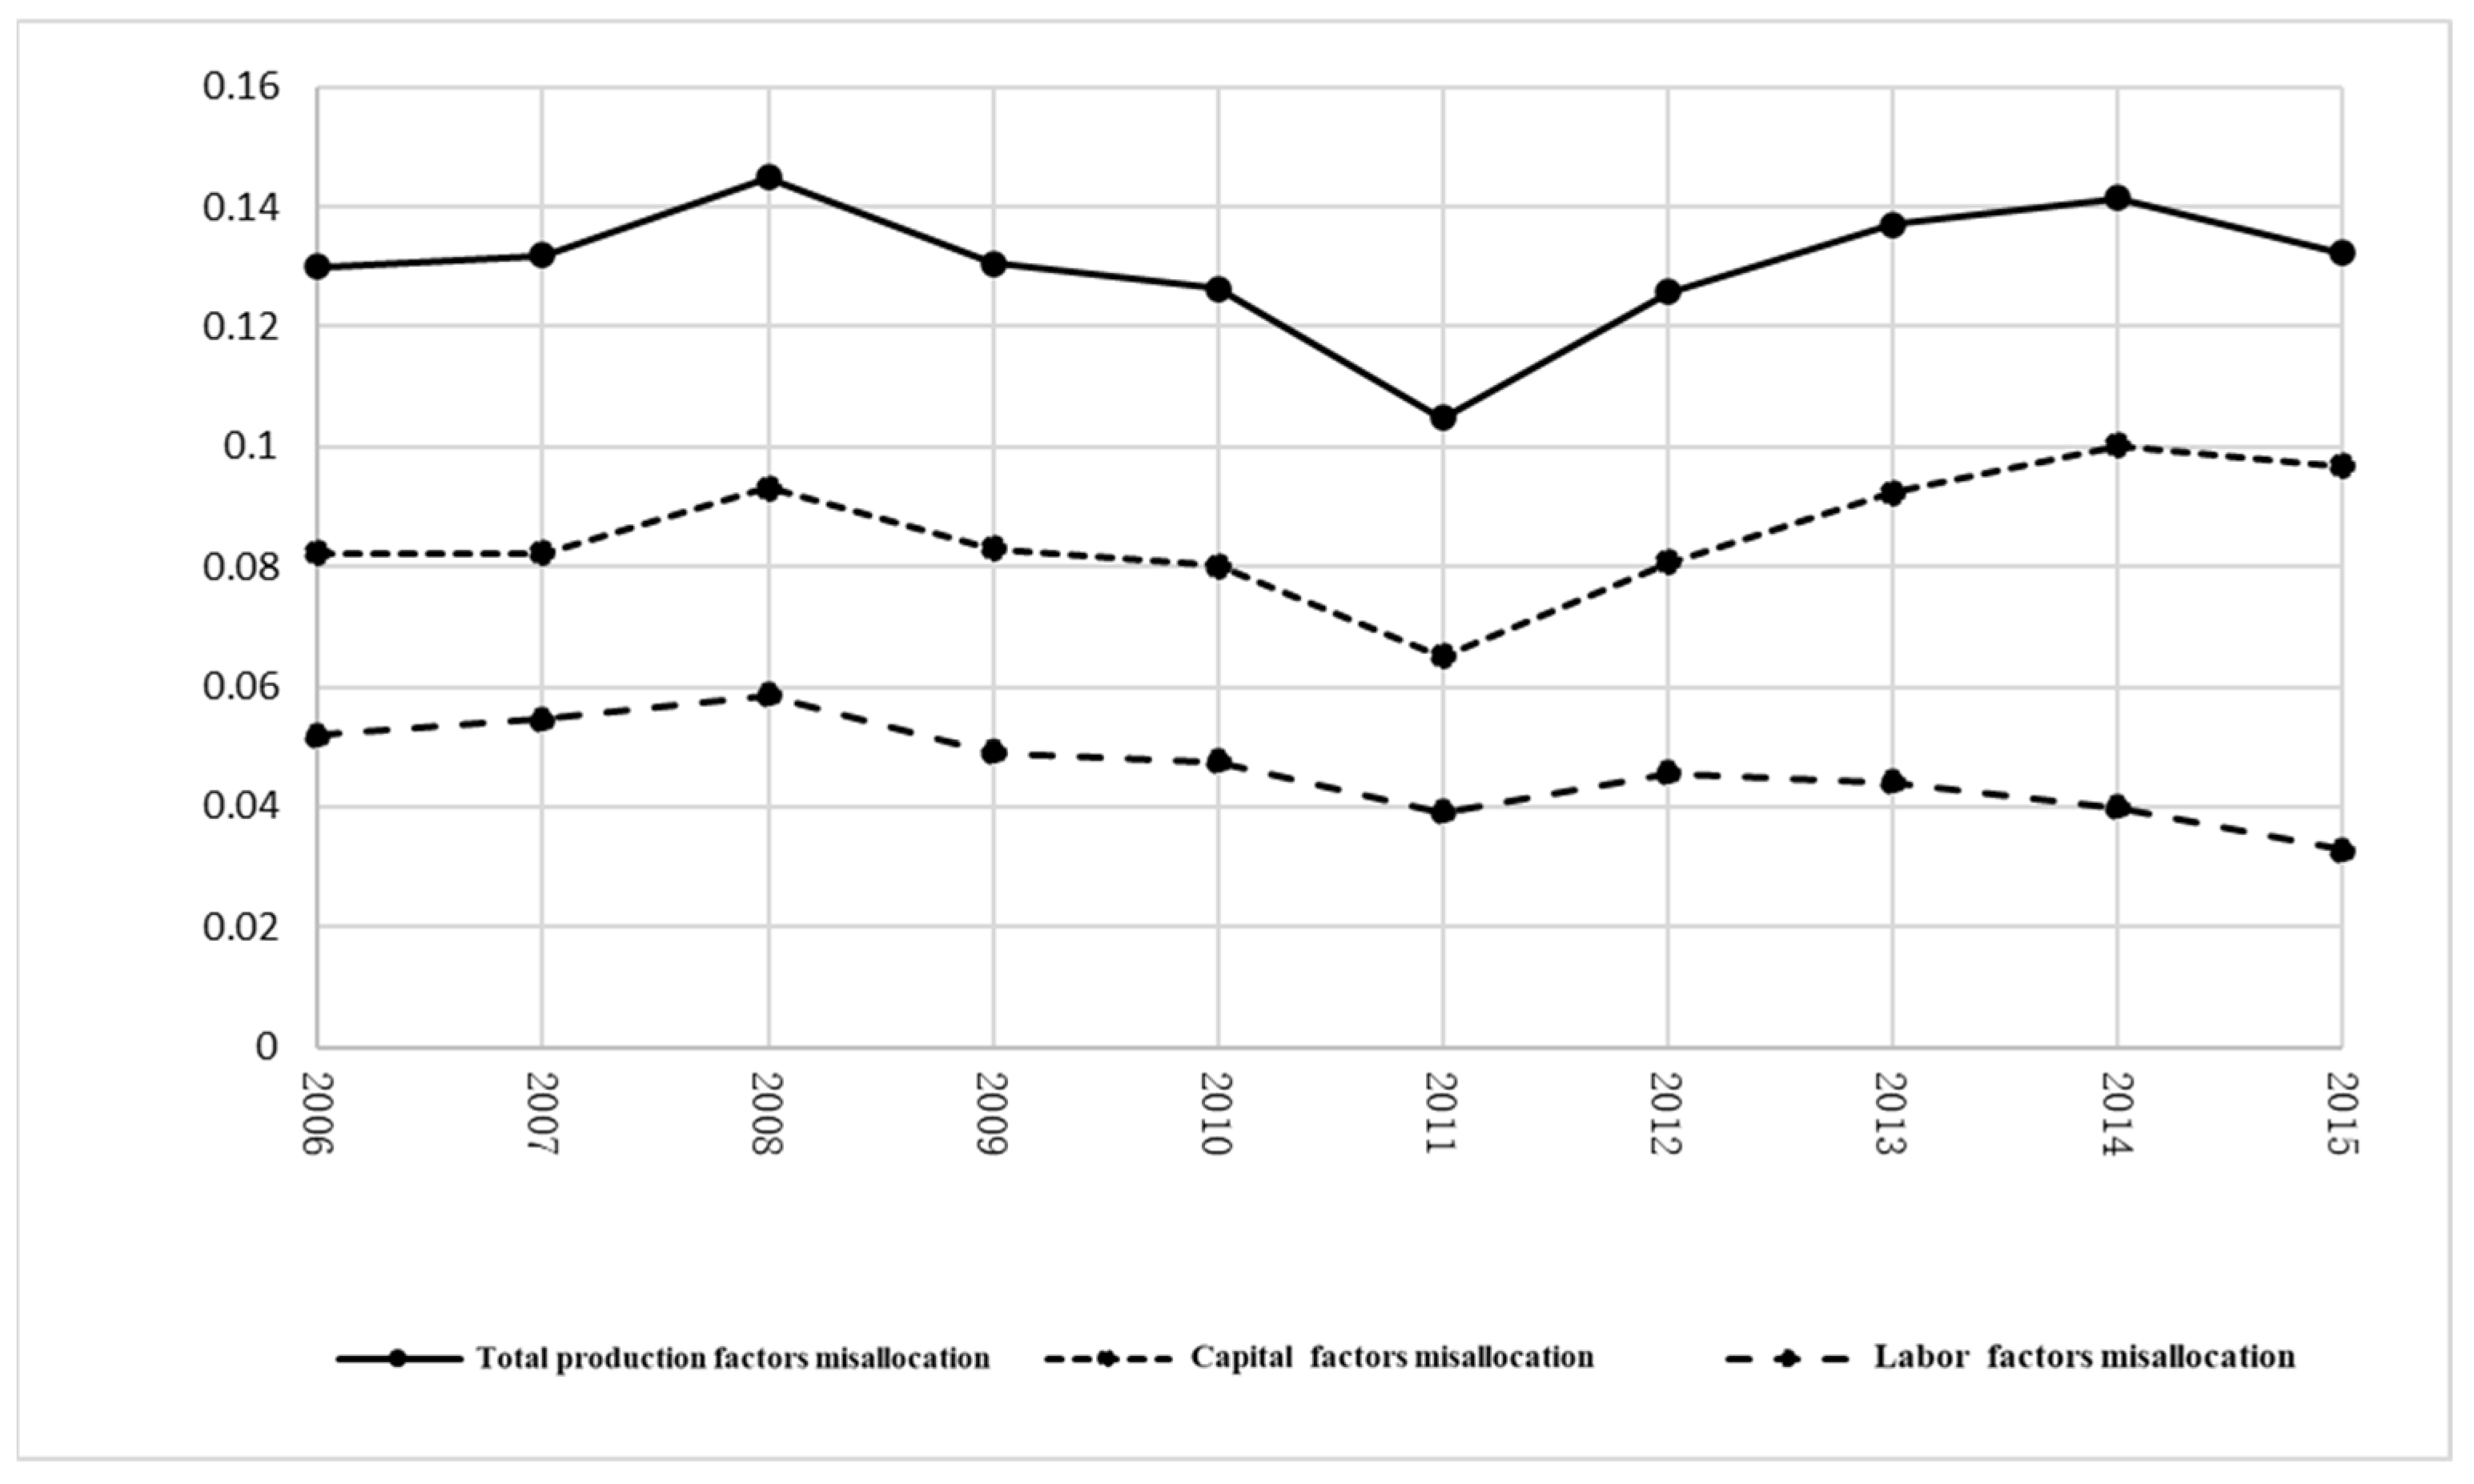
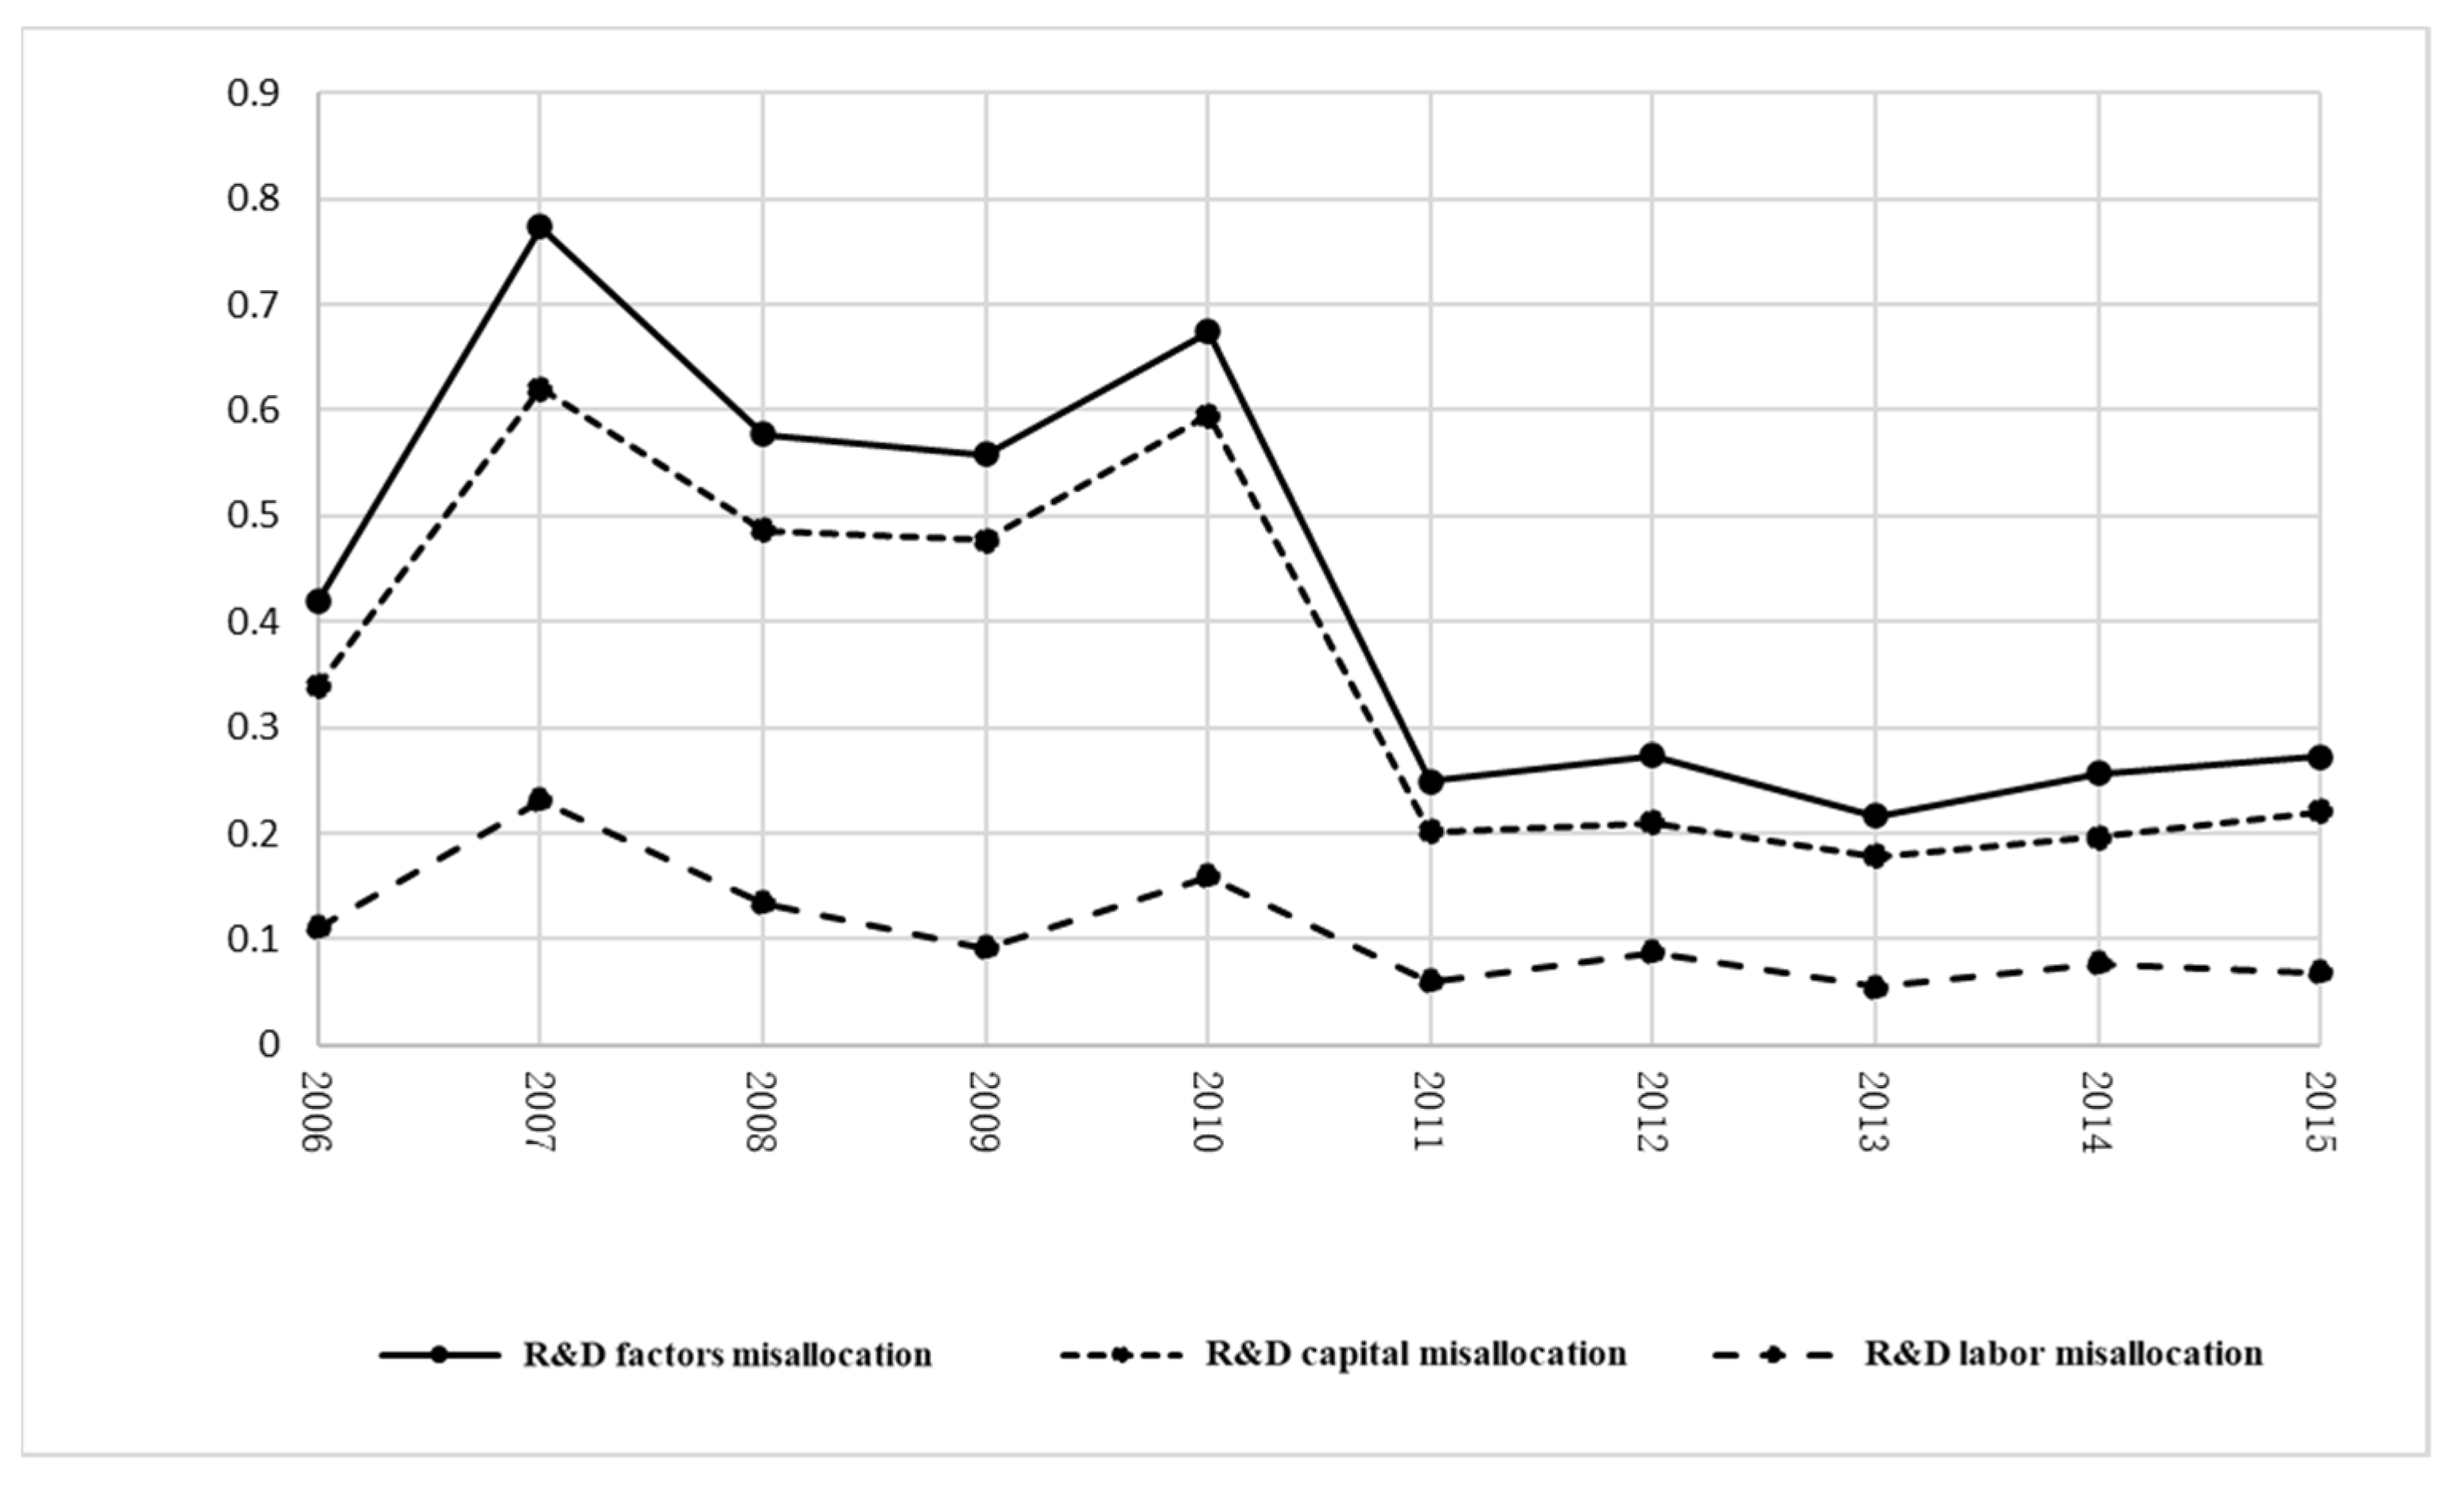
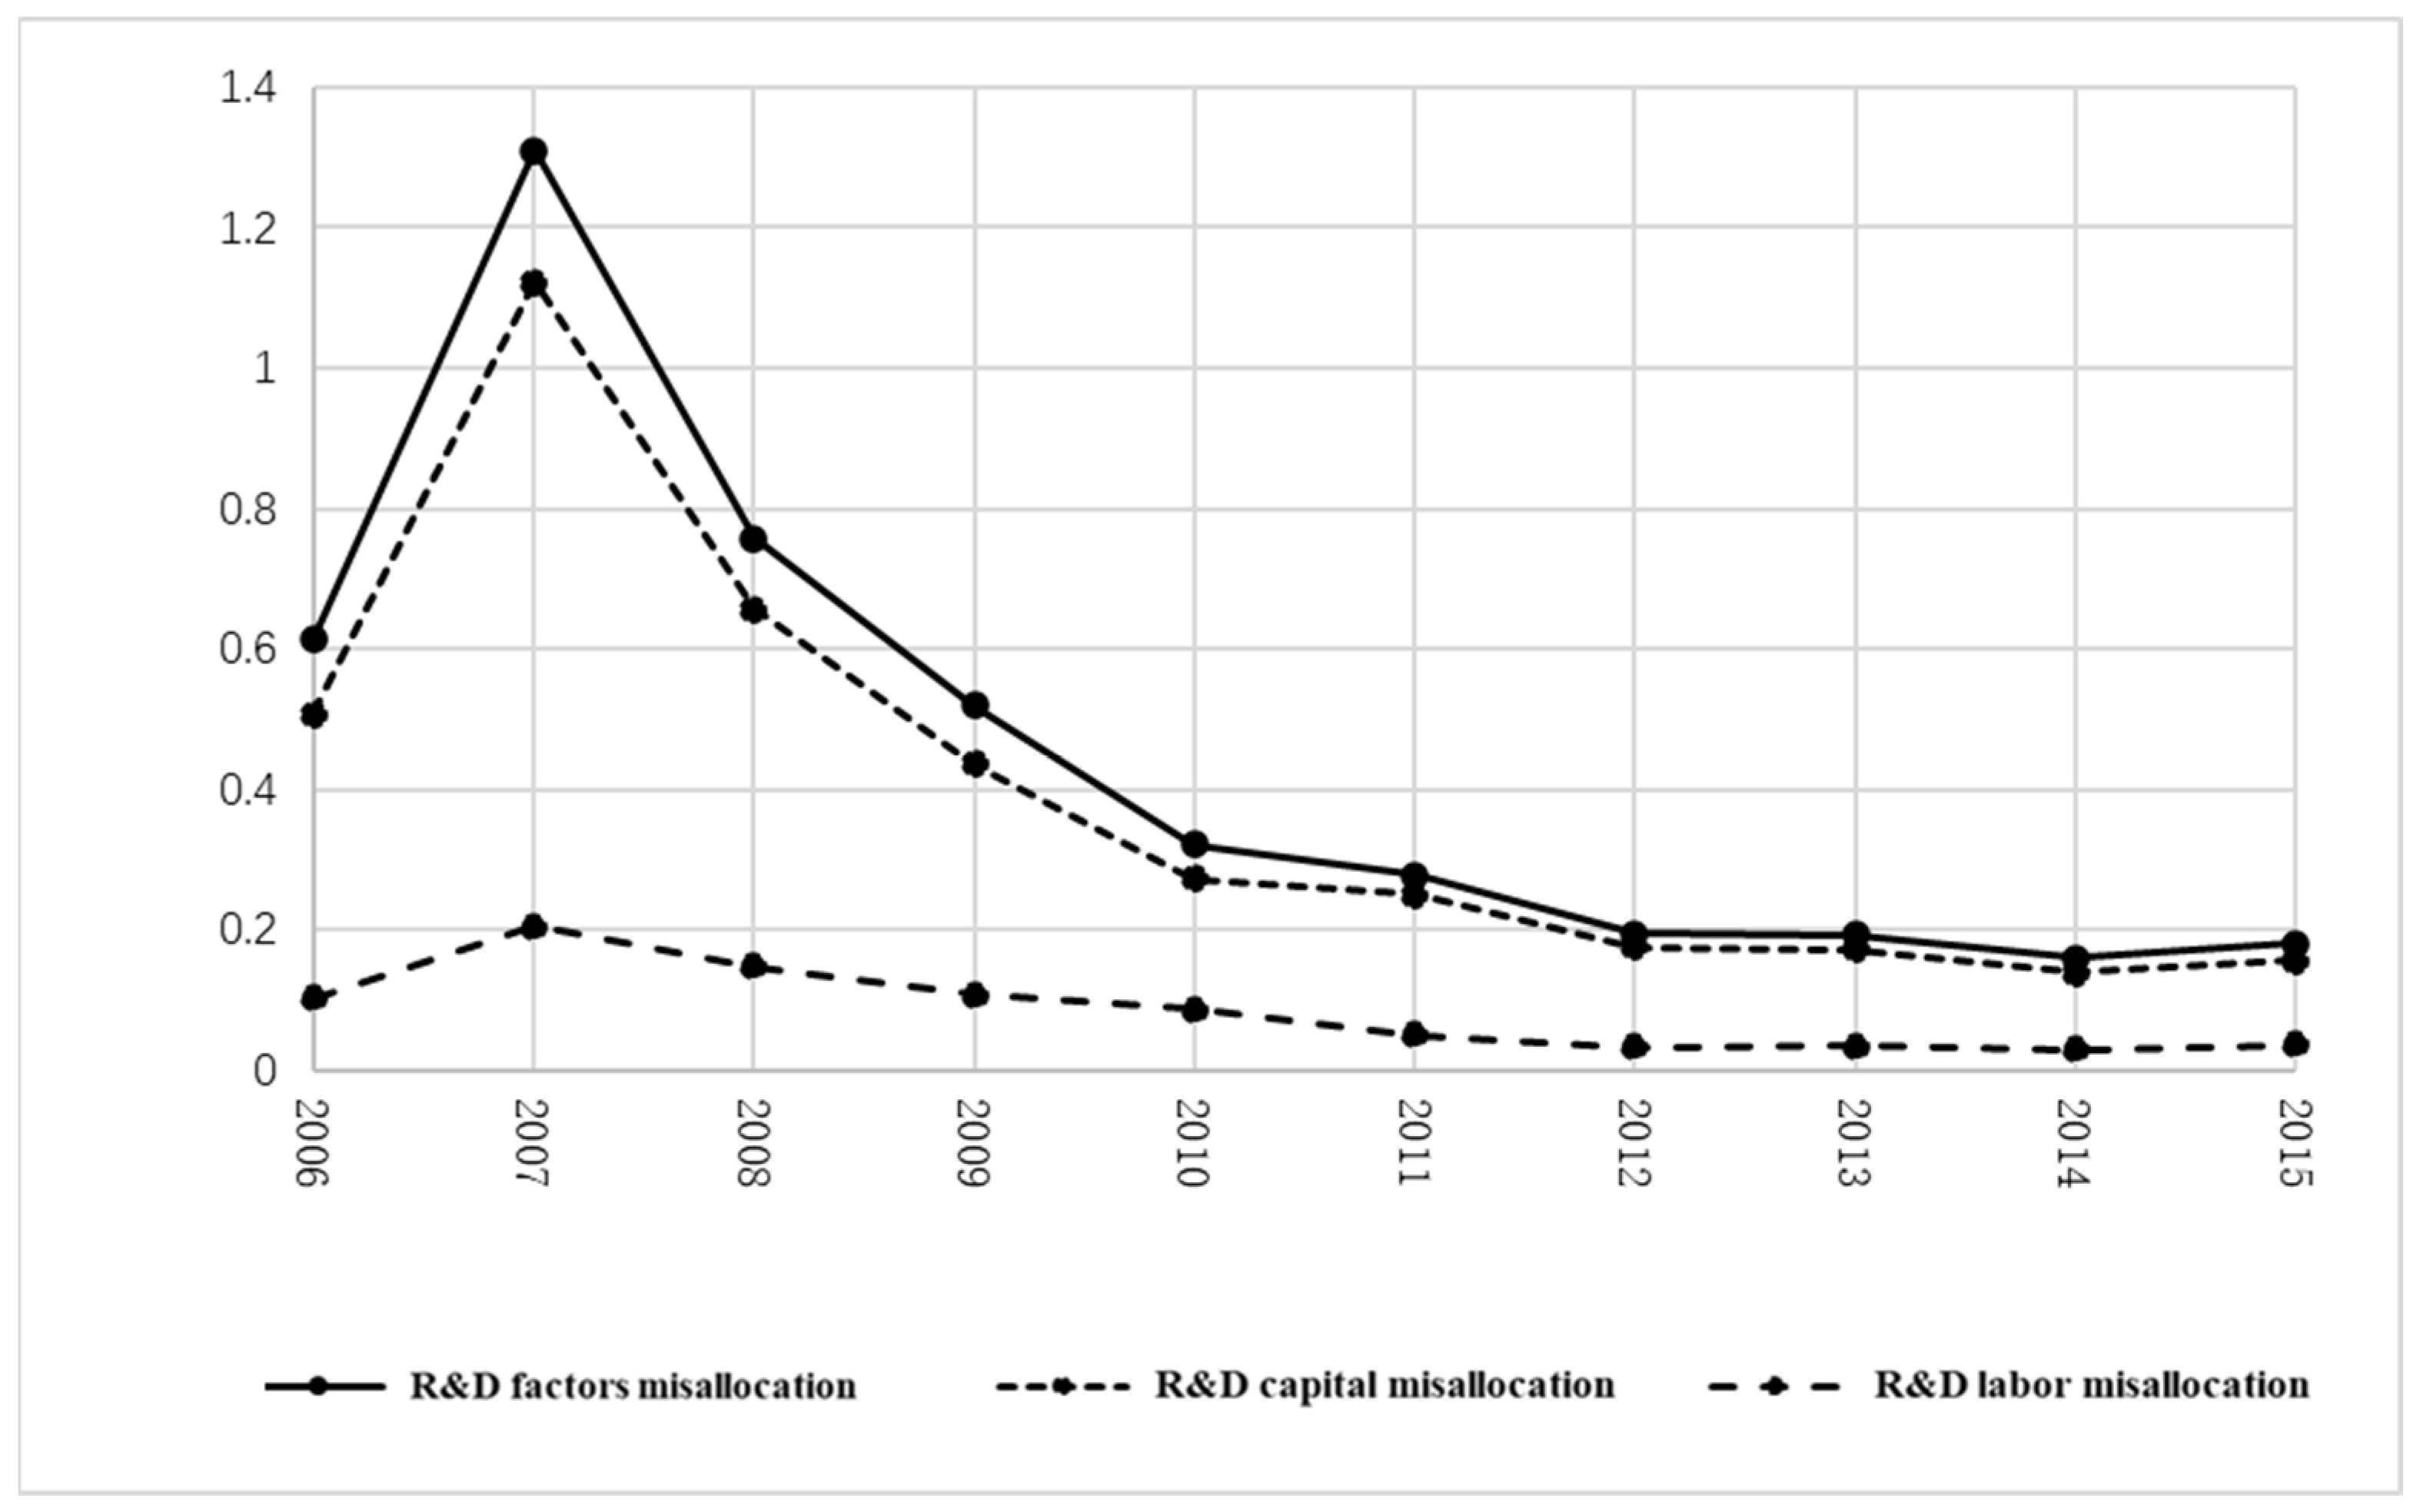
4.3.2. Double-Factor Allocation Efficiency in the Manufacturing Industry
5. Empirical Strategies and Empirical Results Analysis
5.1. Model Settings
5.2. Endogenous Problem Handling
5.3. Analysis of Empirical Results
5.4. Robustness Test
5.5. Further Analysis of Ownership Heterogeneity Analysis
6. Conclusions and Implications
Author Contributions
Funding
Institutional Review Board Statement
Informed Consent Statement
Data Availability Statement
Conflicts of Interest
References
- Xu, W.X.; Zhou, J.P.; Liu, C.J. The Impact of Digital Economy on Urban Carbon Emissions: Based on the Analysis of Spatial Effects. Geogr. Res. 2022, 1, 111–129. [Google Scholar]
- Deng, R.R.; Zhang, A.X. Research on the Impact of Urban Digital Economy Development on Environmental Pollution and Its Mechanism. South China J. Econ. 2022, 2, 18–37. [Google Scholar]
- Bai, P.W.; Zhang, Y. Digital Economy, Declining Demographic Dividends and the Rights and Interests of Low-and Medium-skilled Labor. Econ. Res. J. 2021, 5, 91–108. [Google Scholar]
- Bai, P.W. Effects of Labor Allocation Distortion and Distortion-Free Scenarios on Industrial Output in China—An Empirical Study Based on Data of Production Industry Sectors. China Econ. 2014, 9, 99–113. [Google Scholar]
- Zhao, C.Y.; Wang, W.C.; Li, X.S. How Does Digital Transformation Affect the Total Factor Productivity of Enterprises? Financ. Trade Econ. 2021, 7, 114–129. [Google Scholar]
- Du, C.Z.; Zhang, Y. The Research on the Impact Mechanism of the Development of Digital Economy on the Growth of Enterprise Productivity. Secur. Mark. Her. 2021, 2, 41–51. [Google Scholar]
- Bai, P.W.; Yu, L. Digital Economy Development and Firms’ Markup: Theoretical Mechanisms and Empirical Facts. China Ind. Econ. 2021, 11, 59–77. [Google Scholar]
- Goldfarb, A.; Tucker, C. Digital Economics. J. Econ. Lit. 2019, 1, 3–43. [Google Scholar] [CrossRef]
- Yuan, C.; Xiao, T.S.; Geng, C.X.; Sheng, Y. Digital Transformation and Division of Labor Between Enterprises: Vertical Specialization or Vertical Integration. China Ind. Econ. 2021, 9, 137–155. [Google Scholar]
- Tu, X.Y.; Yan, X.L. Digital Transformation, Knowledge Spillover, and Enterprise Total Factor Productivity: Empirical Evidence from Listed Manufacturing Companies. Ind. Econ. Res. 2022, 2, 43–56. [Google Scholar]
- Wu, X.X.; Ren, B.P. The Path and Policy Adjustment of the Reconstruction of Resource Allocation Mechanism under the Background of Digital Economy. Reform Econ. Syst. 2022, 2, 5–10. [Google Scholar]
- Wei, Z.Y. Research on the Impact of the Development of Digital Economy on the Efficiency of Resource Allocation in Manufacturing Enterprises. J. Quant. Technol. Econ. 2022, 3, 66–85. [Google Scholar]
- Cong, Y.; Yu, B.Y. The Influence of Digital Economy on the Efficiency of Chinese Labor Force Resource Allocation. Theory Pract. Financ. Econ. 2020, 2, 108–114. [Google Scholar]
- Wang, Y.; Zhang, Z.B. Digital Economy, Factor Allocation and Regional Integration. Southeast Acad. Res. 2021, 5, 129–138. [Google Scholar]
- Yi, C.; Zhao, X. Does Digital Transformation Improve the Efficiency of Chinese Multinational Enterprises’ Overseas Investment. China Ind. Econ. 2024, 1, 150–169. [Google Scholar]
- Guo, J.; Wang, Z. The Impact of Digital Transformation on Corporate Capital Allocation Efficiency: Empirical Evidence from Listed Manufacturing Enterprises. J. Nanjing Univ. Financ. Econ. 2023, 3, 67–76. [Google Scholar]
- Liu, J.L.; Chen, Y.Y. Digital Technology Development, Temporal and Spatial Effects, Regional Carbon Emissions. Stud. Sci. Sci. 2023, 5, 841–853. [Google Scholar]
- Wu, C.X.; Gao, Y. The Research on the Mechanism and Effect of Digital Economy Driving the Development of Low-carbon Industries. Guizhou Soc. Sci. 2020, 11, 155–161. [Google Scholar]
- Xie, Y.F. The Effect and Mechanism of Digital Economy on Regional Carbon Emission Intensity. Contemp. Econ. Manag. 2022, 2, 68–78. [Google Scholar]
- Wang, L.H.; Yuan, L. Directed Technical Change, Industrial Structural Transformation and Factor Shares in China. Econ. Res. J. 2018, 11, 115–131. [Google Scholar]
- Agrawal, A.; Gans, J.S.; Goldfarb, A. Artificial Intelligence: The Ambiguous Labor Market Impact of Automating Prediction. J. Econ. Perspect. 2019, 2, 31–49. [Google Scholar] [CrossRef]
- Zhang, B.; Dong, W.; Yao, J.; Cheng, X. Digital Economy, Factor Allocation Efficiency of Dual-Economy and Urban-Rural Income Gap. Sustainability 2023, 15, 13514. [Google Scholar] [CrossRef]
- Zhang, X.W. Research on Evolution of Innovation Model under the Condition of Digital Economy. Economist 2019, 7, 32–39. [Google Scholar]
- He, D.A.; Ren, X. Evolution and Prospect of Resource Allocation Mechanism in the Internet Era. Economist 2018, 10, 63–71. [Google Scholar]
- He, X.; Chu, D. The digital transformation of government governance and the increase in urban entrepreneurial activity. Shanghai J. Econ. 2023, 9, 41–53. [Google Scholar]
- Jin, L.Q. Analysis of the Paradox between High R&D Investment and Low Productivity in China: From the Perspective of Distorted R&D Factor Allocation. Mod. Econ. Res. 2022, 6, 22–32. [Google Scholar]
- Bai, P.W. Estimating the Degree of Distortion of Labor Resources Allocation in China. China Ind. Econ. 2012, 10, 19–31. [Google Scholar]
- Brandt, L.; Tombe, T.; Zhu, X. Factor Market Distortions Across Time, Space and Sectors in China. Rev. Econ. Dyn. 2013, 1, 39–58. [Google Scholar] [CrossRef]
- Yang, R.D. Study on the Total Factor Productivity of Chinese Manufacturing Enterprises. Econ. Res. J. 2015, 2, 61–74. [Google Scholar]


| Variable Meaning | Variable Symbol | Calculation Steps, Procedures, and Functions |
|---|---|---|
| Digital direct consumption factor | digi1 | |
| Digital total consumption factor | digi2 | |
| Total misallocation of production factors | mis | |
| Capital misallocation | misk | |
| Labor misallocation | misl | |
| Total misallocation of R&D factors | Rmis | RY represents the output level of research and development activities |
| R&D capital misallocation | Rmisk | |
| R&D labor misallocation | Rmisl | |
| CO2 emissions | lnco2 | Ln(co2) |
| Whether it is a state-supported industry | g | g = 1 if it is a state-supported industry, g = 0 if it is not a state-supported industry |
| Industry monopoly power | mono | Measured by the ratio of the industry’s main business income to the main business cost |
| R&D density in the industry | rd | Measured by the proportion of the output value of new products in the industry to the total output value |
| The capital intensity of the industry | rcap | Measured by the proportion of the industry’s net fixed assets in the total output value |
| Ownership structure | own | Expressed by the proportion of the total output value of state-owned enterprises in the industry to the total output value of the industry |
| Industry Code | ||||
|---|---|---|---|---|
| 13 | 0.5922 | 0.5582 | 1.1128 | 1.0653 |
| 14 | 0.8580 | 0.7553 | 0.9130 | 1.0135 |
| 15 | 0.6707 | 0.7061 | 1.7137 | 1.4754 |
| 17 | 1.6821 | 0.7167 | 0.4270 | 0.6006 |
| 20 | 0.9012 | 0.5878 | 0.5055 | 0.8023 |
| 21 | 1.6891 | 0.8082 | --- | --- |
| 22 | 1.1618 | 1.6623 | 1.3856 | 1.3023 |
| 23 | 1.1480 | 0.8110 | 0.4313 | 0.6638 |
| 24 | 1.5006 | 0.5684 | 0.1602 | 0.3016 |
| 25 | 0.5480 | 2.1491 | --- | --- |
| 26 | 0.6789 | 1.4661 | 1.6927 | 1.6597 |
| 27 | 0.6480 | 0.6972 | 1.6253 | 2.1973 |
| 28 | 1.1737 | 2.0710 | 2.6033 | 2.1855 |
| 29 | 1.2247 | 0.9577 | 0.6523 | 0.7655 |
| 30 | 0.9552 | 1.1332 | 0.7672 | 0.9761 |
| 31 | 0.7164 | 1.8281 | 4.7258 | 2.3508 |
| 32 | 0.4932 | 1.1144 | 2.5744 | 1.8233 |
| 33 | 1.1149 | 0.8504 | 0.5281 | 0.7464 |
| 34 | 1.0685 | 0.8298 | 0.5090 | 0.6980 |
| 35 | 0.9734 | 0.8906 | 0.5123 | 0.5956 |
| 37 | 0.8372 | 0.9096 | --- | --- |
| 38 | 0.9620 | 0.6629 | 0.4417 | 0.4817 |
| 39 | 1.4010 | 0.8091 | 0.7731 | 0.8467 |
| Variable Meaning | Variable Symbol | N | Mean | sd | p50 | p75 | p90 |
|---|---|---|---|---|---|---|---|
| Digital direct consumption factor | digi1 | 207 | 0.0544 | 0.0714 | 0.0323 | 0.0515 | 0.0884 |
| Digital total consumption factor | digi2 | 207 | 0.1691 | 0.1161 | 0.1377 | 0.1791 | 0.2617 |
| Total misallocation of production factors | mis | 230 | 0.2696 | 0.2003 | 0.2177 | 0.3449 | 0.5132 |
| Capital misallocation | misk | 230 | 0.1373 | 0.0876 | 0.1228 | 0.1887 | 0.2796 |
| Labor misallocation | misl | 230 | 0.2153 | 0.1974 | 0.1727 | 0.2903 | 0.4987 |
| Total misallocation of R&D factors | Rmis | 200 | 0.7897 | 1.0121 | 0.5142 | 0.7942 | 1.9953 |
| R&D capital misallocation | Rmisk | 200 | 0.3670 | 0.3304 | 0.2822 | 0.4842 | 0.7759 |
| R&D labor misallocation | Rmisl | 200 | 0.3057 | 0.3063 | 0.2342 | 0.4048 | 0.6746 |
| CO2 emissions | lnco2 | 230 | 10.1383 | 1.7186 | 9.9408 | 10.8664 | 12.4805 |
| Whether it is a state-supported industry | g | 230 | 0.3478 | 0.4773 | 0 | 1 | 1 |
| Industry monopoly power | mono | 230 | 1.1886 | 0.0836 | 1.1724 | 1.2012 | 1.2763 |
| R&D density in the industry | rd | 230 | 47.3592 | 32.1686 | 39.2250 | 68.5965 | 98.8301 |
| The capital intensity of the industry | rcap | 230 | 0.2333 | 0.0699 | 0.2128 | 0.2786 | 0.3405 |
| Ownership structure | own | 230 | 0.1542 | 0.1595 | 0.0890 | 0.1866 | 0.3933 |
| Explained Variable | mis | misk | misl | |||
|---|---|---|---|---|---|---|
| digi1 | −1.3800 *** (−9.96) | −0.2361 *** (−7.61) | −1.1925 *** (−9.08) | |||
| digi2 | −1.0773 *** (−10.12) | −0.1919 *** (−7.88) | −0.8932 ** (−9.48) | |||
| Control variables | √ | √ | √ | √ | √ | √ |
| Time effect | √ | √ | √ | √ | √ | √ |
| Adjusted R2 | 0.2498 | 0.2801 | 0.7841 | 0.7842 | 0.1854 | 0.2109 |
| N | 320 | 320 | 320 | 320 | 320 | 320 |
| Explained Variable | Rmis | Rmisk | Rmisl | |||
|---|---|---|---|---|---|---|
| digi1 | −0.4423 *** (−2.78) | −1.9508 *** (−3.98) | −0.9985 *** (−3.10) | |||
| digi2 | −0.4631 ** (−2.55) | −2.2332 *** (−3.58) | −1.0656 *** (−2.58) | |||
| Control variables | √ | √ | √ | √ | √ | √ |
| Time effect | √ | √ | √ | √ | √ | √ |
| Adjusted R2 | 0.4576 | 0.4485 | 0.5684 | 0.5594 | 0.4118 | 0.4016 |
| N | 160 | 160 | 160 | 160 | 160 | 160 |
| Explained Variable | lnCO2 | |||||
|---|---|---|---|---|---|---|
| Mis | 3.0156 *** (10.48) | |||||
| Misk | 9.6422 *** (11.75) | |||||
| Misl | 3.8147 *** (9.27) | |||||
| Rmis | 0.0764 *** (3.08) | |||||
| Rmisk | 0.1916 *** (2.92) | |||||
| Rmisl | 0.2401 *** (2.73) | |||||
| Control variables | √ | √ | √ | √ | √ | √ |
| Time effect | √ | √ | √ | √ | √ | √ |
| Adjusted R2 | 0.5598 | 0.5008 | 0.5549 | 0.4410 | 0.4464 | 0.4371 |
| N | 207 | 207 | 207 | 180 | 180 | 180 |
| Explained variable | Mis | Misk | Misl | |||
| digi1 | −0.5789 *** (−4.40) | −0.2660 *** (−7.87) | −0.4136 *** (−3.41) | |||
| digi2 | −0.6764 *** (−3.33) | −0.3716 *** (−8.04) | −0.3797 ** (−2.10) | |||
| Control variables | √ | √ | √ | √ | √ | √ |
| Time effect | √ | √ | √ | √ | √ | √ |
| Adjusted R2 | 0.4076 | 0.3753 | 0.8402 | 0.8358 | 0.5884 | 0.5713 |
| N | 184 | 184 | 184 | 184 | 184 | 184 |
| Explained variable | Rmis | Rmisk | Rmisl | |||
| digi1 | −0.3123 ** (−2.55) | −1.5063 *** (−3.66) | −0.7187 *** (−2.63) | |||
| digi2 | −0.6751 *** (−2.78) | −2.9773 *** (−3.91) | −1.5240 *** (−3.06) | |||
| Control variables | √ | √ | √ | √ | √ | √ |
| Time effect | √ | √ | √ | √ | √ | √ |
| Adjusted R2 | 0.4558 | 0.4472 | 0.5671 | 0.5584 | 0.4099 | 0.4002 |
| N | 160 | 160 | 160 | 160 | 160 | 160 |
| Explained variable | lnCO2 | |||||
| Mis | 3.6618 *** (4.05) | |||||
| Misk | 2.0741 *** (6.75) | |||||
| Misl | 0.4058 *** (3.54) | |||||
| Rmis | 0.0819 *** (2.76) | |||||
| Rmisk | 0.1981 *** (3.21) | |||||
| Rmisl | 0.2674 *** (3.07) | |||||
| Control variables | √ | √ | √ | √ | √ | √ |
| Time effect | √ | √ | √ | √ | √ | √ |
| Adjusted R2 | 0.4033 | 0.4726 | 0.3885 | 0.4390 | 0.4459 | 0.4330 |
| N | 207 | 207 | 207 | 180 | 180 | 180 |
| Explained Variable | lnCo2 | Mis | lnCo2 | Rmis | lnCo2 |
|---|---|---|---|---|---|
| Method | IV-2SLS | IV-2SLS | IV-2SLS | IV-2SLS | IV-2SLS |
| digi1 | −0.4260 ** (−2.15) | −0.7413 *** (−5.28) | −0.1644 (−1.00) | −0.4423 *** (−2.78) | −0.1041 (−0.65) |
| Mis | 0.3528 *** (3.79) | ||||
| Rmis | 0.0762 *** (2.82) | ||||
| Control variables | √ | √ | √ | √ | √ |
| Time effect | √ | √ | √ | √ | √ |
| Adjusted R2 | 0.3517 | 0.4564 | 0.3978 | 0.4576 | 0.4376 |
| N | 184 | 184 | 184 | 160 | 160 |
| Explained variable | mis | misk | misl | |||
| digi1 | 0.1933 (0.87) | −0.0556 (−0.56) | 0.3358 *** (2.65) | |||
| digi2 | 0.2963 (0.88) | −0.0853 (−0.56) | 0.6977 *** (3.79) | |||
| Control variables | √ | √ | √ | √ | √ | √ |
| Time effect | √ | √ | √ | √ | √ | √ |
| Adjusted R2 | 0.6100 | 0.6116 | 0.6137 | 0.6131 | 0.7387 | 0.7443 |
| N | 184 | 184 | 184 | 184 | 184 | 184 |
| Explained variable | Rmis | Rmisk | Rmisl | |||
| digi1 | 4.8103 *** (5.34) | 1.0515 *** (5.19) | 2.2603 *** (6.50) | |||
| digi2 | 8.1947 *** (5.17) | 1.6624 *** (5.05) | 3.6570 *** (6.37) | |||
| Control variables | √ | √ | √ | √ | √ | √ |
| Time effect | √ | √ | √ | √ | √ | √ |
| Adjusted R2 | 0.3095 | 0.3285 | 0.3587 | 0.3536 | 0.2994 | 0.2992 |
| N | 160 | 160 | 160 | 160 | 160 | 160 |
| Explained variable | mis | misk | misl | |||
| digi1 | −0.8841 *** (−5.56) | −0.3142 *** (−6.79) | −0.5313 *** (−4.27) | |||
| digi2 | −0.9450 *** (−4.24) | −0.4354 *** (−7.28) | −0.4721 *** (−2.56) | |||
| Control variables | √ | √ | √ | √ | √ | √ |
| Time effect | √ | √ | √ | √ | √ | √ |
| Adjusted R2 | 0.4492 | 0.4234 | 0.7091 | 0.7017 | 0.5562 | 0.5385 |
| N | 184 | 184 | 184 | 184 | 184 | 184 |
| Explained variable | Rmis | Rmisk | Rmisl | |||
| digi1 | −1.4125 ** (−2.04) | −2.5233 *** (−3.03) | −1.2153 *** (−2.29) | |||
| digi2 | −2.2212 ** (−2.06) | −3.4068 *** (−2.85) | −1.5688 ** (−2.05) | |||
| Control variables | √ | √ | √ | √ | √ | √ |
| Time effect | √ | √ | √ | √ | √ | √ |
| Adjusted R2 | 0.1788 | 0.1806 | 0.4890 | 0.4853 | 0.4080 | 0.4051 |
| N | 160 | 160 | 160 | 160 | 160 | 160 |
Disclaimer/Publisher’s Note: The statements, opinions and data contained in all publications are solely those of the individual author(s) and contributor(s) and not of MDPI and/or the editor(s). MDPI and/or the editor(s) disclaim responsibility for any injury to people or property resulting from any ideas, methods, instructions or products referred to in the content. |
© 2025 by the authors. Licensee MDPI, Basel, Switzerland. This article is an open access article distributed under the terms and conditions of the Creative Commons Attribution (CC BY) license (https://creativecommons.org/licenses/by/4.0/).
Share and Cite
Zhang, B.; Dong, W.; Yao, J. The Digital Transformation of the Manufacturing Industry, the Double-Factor Allocation Efficiency of the Manufacturing Industry, and Carbon Emissions: Evidence from China. Sustainability 2025, 17, 6564. https://doi.org/10.3390/su17146564
Zhang B, Dong W, Yao J. The Digital Transformation of the Manufacturing Industry, the Double-Factor Allocation Efficiency of the Manufacturing Industry, and Carbon Emissions: Evidence from China. Sustainability. 2025; 17(14):6564. https://doi.org/10.3390/su17146564
Chicago/Turabian StyleZhang, Bochao, Wanhao Dong, and Jin Yao. 2025. "The Digital Transformation of the Manufacturing Industry, the Double-Factor Allocation Efficiency of the Manufacturing Industry, and Carbon Emissions: Evidence from China" Sustainability 17, no. 14: 6564. https://doi.org/10.3390/su17146564
APA StyleZhang, B., Dong, W., & Yao, J. (2025). The Digital Transformation of the Manufacturing Industry, the Double-Factor Allocation Efficiency of the Manufacturing Industry, and Carbon Emissions: Evidence from China. Sustainability, 17(14), 6564. https://doi.org/10.3390/su17146564