1. Introduction
The management of cross-docking (C-D) platforms in Eastern and Central European (ECE) markets represents a critical nexus for sustainable economic development amid persistent inflationary pressures and technological transformation. As these emerging economies integrate deeper into global supply chains while maintaining cost competitiveness, the optimization of logistics operations becomes paramount for sustaining economic growth trajectories. C-D, as a strategic transshipment mechanism enabling cargo transfer between transport modes without conventional warehousing, offers significant potential for cost reduction and efficiency enhancement in regions where infrastructure development and capital allocation remain constrained.
A systematic search of the SCOPUS database reveals significant knowledge gaps regarding C-D implementation in emerging markets. Of 847 articles on C-D published during 2020–2024, only 23 (2.7%) focus on emerging markets, and none provide comprehensive comparative analysis integrating economic efficiency with sustainability metrics across multiple ECE locations. The existing literature predominantly examines developed market implementations (North America 45%; Western Europe 38%) where infrastructure maturity, regulatory homogeneity, and capital availability create fundamentally different implementation contexts. The current research exhibits three critical limitations: absence of empirically validated cost–benefit analysis for ECE implementations, limited integration of sustainability frameworks with operational efficiency metrics, and insufficient consideration of artificial intelligence (AI) integration potential in resource-constrained environments [
1,
2].
Primary Research Question: To what extent can C-D operations in emerging European markets achieve statistically significant cost reductions while maintaining robust sustainability standards, and what location-specific factors determine optimal implementation success?
Secondary Objectives: To quantify cost reduction potential across strategic ECE locations using validated statistical methods, identify critical success factors for sustainable C-D implementation in emerging markets, develop integrated framework combining activity-based costing with corporate social responsibility assessment, and provide evidence-based recommendations for logistics professionals and policymakers.
This investigation employed mixed-methods analysis combining quantitative modeling of operational scenarios with qualitative assessment of contextual factors. Comparative analysis across three strategic ECE locations (Bratislava, Prague, and Budapest) utilized 12-month operational data with statistical validation through paired
t-tests and multiple regression analysis. The methodological framework integrates activity-based costing (ABC) with balanced scorecard (BSC) enriched with environmental, social, and governance (ESG) data. This research contributes to logistics and supply chain literature in emerging markets: it is the first comprehensive comparative framework for ECE C-D assessment, an empirically validated integration of sustainability metrics with operational efficiency indicators, a methodological template for emerging market logistics optimization combining quantitative and qualitative approaches, and a policy-relevant recommendations for sustainable logistics development in ECE contexts. Following this introduction,
Section 2 synthesizes relevant literature.
Section 3 details the mixed-methods research design and analytical procedures.
Section 4 presents empirical findings from comparative analysis across three ECE locations.
Section 5 discusses theoretical and practical implications.
Section 6 concludes with policy recommendations.
2. Literature Review
C-D operations in industrial logistics directly influence value creation and efficiency of logistics platforms through cutting-edge technological innovations [
3]. AI implementation stimulates maximization of production factor efficiency, reducing human resource costs by increasing automation degree [
4]. However, SMEs in emerging markets face adaptation challenges due to required high investments in modern technology [
5]. C-D must meet customer needs regarding delivery speed and optimal inventory management. Automated logistics equipment ensures optimized handling and arrangement of goods, while digitalization enables prompt connections between production and market [
6]. Advanced equipment with sensors reduces human error in cargo handling, preventing costly misdeliveries [
7]. Electric equipment is preferred over fossil-fuel alternatives, with logistics platforms achieving energy independence through renewable energy generation [
8]. For cost reasons, it is also possible to use refurbished equipment, which in some cases can be as good as new. Permanent maintenance of existing equipment, coupled with an efficient refurbishment process, can be the optimal solution to keep costs within reasonable limits in the long term [
9].
AI integration with C-D automation provides smart solutions for adapting industrial logistics to future market needs, ensuring enhanced warehouse security and optimal delivery planning [
10]. Efficient resource allocation becomes priority for high-quality supply chain management at relatively low costs. Multi-disciplinary service extension carries cascading cost risks, requiring continuous organizational performance adaptation based on marketing research [
11]. The multi-disciplinarity of C-D services can be deciphered and applied with the help of AI. Finding potential partners for existing locations as well as placing new C-Ds in different locations can be decided with AI. Extensive testing of the AI modules will be necessary to ensure the future security of the smooth development of these distribution networks [
12]. Implementing AI in C-Ds will streamline the relationship between suppliers and customers. Now, the final prices obtained with AI do not differ much from standard market prices due to the continuous application customized filters to the fields of activity to which the clients belong, achieving visible profits. Even in the absence of these filters, taking over repetitive tasks leaves more free time for human resources to engage in negotiation activities [
13]. AI streamlines supplier–customer relationships through customized filters and process optimization. Warehouse locations can be arranged according to supplier priorities, with intelligent learning improving automation levels through order history analysis [
14]. However, information flow must be limited to prevent confidential data leaks [
15]. The implementation of technological innovations will become fundamental in ensuring optimal flow within supply chains. Identifying the right solutions for C-D services according to the specificities of each business area can be achieved through a better understanding of the entire logistics flow [
16]. AI contributes to quick flexibility adaptation according to disruptive technological progress, though recommendations may not fully respect logistics principles and human needs [
17].
An increase in the number of C-Ds ensures a more competitive offer and therefore a lower final price [
18]. C-D as a component of supply chain management is complex due to the multitude of movements that take place in a short time span, with the related activity being like an anthill. Innovative diversity and information transparency are present everywhere, and the resources involved are interconnected to solve the logistics puzzle as quickly as possible [
19]. C-Ds will be dependent on Industry 4.0 technologies because they generate an exponential increase in added value. Organizations need to create provisions during profitable periods to be able to compensate during loss periods [
20]. AI will revolutionize C-Ds by automating the entire logistics process, generating increased profits by reducing human resource expenses. The initial investment in high-performance AI modules will be high, but the real returns will come in the long term as these investments pay off [
21]. The dynamics of the market mean that C-D activity is constantly changing and adapting to the needs of customers in each area of activity. This will generate high sunk costs that can only be reduced through continuous adaptation to market changes [
22]. Companies that do not implement AI in warehouses early will lose their potential competitive advantage, as stagnation at current technology levels will effectively represent falling behind [
23].
Digitization of processes solves many environmental problems. Energy independence of logistics platforms based on renewable energy is becoming a long-term necessity [
24]. Equipping the warehouses with photovoltaic panels and storage capacity will ensure the operation of own logistical equipment, optimal light, and temperature for the proper functioning of the activity [
25]. Efficient reuse of internal resources ensures compliance with the principles of circular economy. Large companies can set up their own refurbishing workshops, and small companies can turn to logistics equipment manufacturers, who can refurbish used logistics equipment brought in by other customers [
26]. Collaboration between companies can be especially beneficial in crisis situations [
27].
C-D is a way of indirect transportation of cargo, which is intended to reduce costs and shorten overall delivery times. C-D is only recommended if the total delivery costs are lower than if the cargo can be delivered directly without C-D [
28]. Collaborative logistics and combined logistics operations are crucial to optimizing transport costs. C-D is an important link in the coordination of logistics chain networks that cannot go unnoticed in a competitive environment [
29]. The location of the C-Ds must be determined according to the specific activity. Infrastructure plays an important role in the choice of locations, as logistics parks, highways, railway stations, airports, and ports have a magnet effect in attracting investment in warehouses [
1]. Efficient C-D also has effects on reducing pollution. An efficient correlation of deliveries to customers with the subsequent loading of other consignments from them leads to the elimination of kilometers traveled by empty trucks not loaded with cargo [
2].
The use of AI-coordinated logistics equipment will reduce the intensity of equipment utilization and increase the return on C-D investments. AI systems can be connected to supplier and customer IT systems. This can prioritize the optimal location of cargo within C-Ds to ensure readiness for fast loading of cargo for fast delivery [
30]. Cost analysis studies are relatively rare in emerging regions, and AI may be a viable solution to fill this gap. Cost prediction is essential not only in logistics but also in all other departments of an organization, with repercussions throughout the economic and social whole [
31]. Implementing AI in C-D will also have positive effects on environmental issues. Reducing the time and distance traveled by means of transport will mean less fuel consumption and therefore lower CO
2 emissions. Sustainable energy systems will reduce the negative environmental impacts of pollution [
32]. Logistics services are moving towards lower costs in less developed regions. C-Ds have the dynamic ability to change location, use relatively cheap labor, and reduce internal costs by automating processes [
33].
Integration of sustainability frameworks with operational excellence has emerged as critical research area. Hungarian logistics networks achieved 28–35% higher resource efficiency with appropriate technological support, demonstrating positive correlations between efficiency, cost reduction, and environmental performance [
34]. Digital transformation review of 42 C-D implementations showed strong correlation (r = 0.74) between technological adoption and operational efficiency, noting implementation barriers including capital constraints and infrastructural limitations [
35]. Sustainable urban freight transport requires integrated planning considering both operational efficiency and environmental impact [
36]. Policy frameworks combining regulatory, economic, and voluntary instruments achieve superior outcomes compared to single-instrument approaches [
37]. Delivery speeds will increase as the micro-hub network expands, ensuring optimized transport routes. Cost reduction becomes imperative alongside rising quality standards in a market fragmented by company specialization and technological diversity [
38]. Public–private partnerships emerge as crucial for C-D scalability through joint financing, digital infrastructure investment, and collaborative customs facility development [
39]. The on-demand economy stimulates logistics systems to optimize local and regional connections to ensure the information flow for the delivery optimization [
40].
The current literature exhibits critical limitations: the absence of empirically validated cost–benefit analysis for ECE implementations, limited integration of sustainability frameworks with operational efficiency metrics, and insufficient AI integration consideration in resource-constrained environments. ECE markets present unique challenges, including regulatory heterogeneity, infrastructure deficits, economic transition dynamics, and technological readiness variations that existing research has not adequately addressed [
21]. In ECE emerging markets, there is limited empirical evidence quantifying cost reductions achievable through C-D. Previous research has not adequately addressed the integration of sustainability practices (ESG and CSR) with operational efficiency in C-D. The impact of emerging technologies, particularly AI and automation, on C-D efficiency in regions with different technological readiness levels remains underexplored; comparative analysis of C-D locations within ECE considering both operational and sustainability metrics is largely absent from the current literature. This research addresses these gaps by providing a comprehensive framework for sustainable C-D implementation in ECE, supported by empirical evidence and statistical validation across multiple dimensions including technological innovation, environmental sustainability, and economic performance.
The economic sustainability of logistics networks in emerging markets has received increased attention, with researchers developing contextualized models that account for unique challenges. The recent literature indicates several emerging research directions with significant implications for sustainable logistics in emerging markets. This provides crucial context for our investigation, highlighting both the significant opportunities and distinctive challenges associated with C-D implementation. Our contribution provides the first comparative analysis that integrates economic efficiency metrics with comprehensive sustainability indicators across multiple ECE locations. While C-D has been extensively investigated within developed economies, empirical research quantifying both economic and sustainability outcomes within ECE markets remains conspicuously absent. These knowledge deficits collectively impede the development of sustainable logistics networks in emerging markets, with significant implications. Circular economy principles and ESG considerations are becoming integral to logistics operations. C-D platforms are no longer evaluated solely by operational efficiency but also by their capacity to generate social value, reduce environmental impact, and contribute to sustainable development [
24]. ECE markets present unique challenges and opportunities for C-D implementations. The complex landscape of Logistics 4.0 in emerging economies is characterized by technological constraints, economic uncertainties, and rapid market transformations [
4]. The region’s logistics networks must navigate multiple challenges, including infrastructure limitations, diverse regulatory environments, and the need for continuous technological adaptation, emphasizing the importance of supply chain transparency and adaptability in such dynamic market contexts [
19]. The strategic integration of advanced technologies in C-D represents more than a technical upgrade—it is a fundamental reimagining of logistics operations [
14].
The distinctive challenges of ECE markets create specific knowledge deficits that impede sustainable logistics development: regulatory heterogeneity, infrastructure deficits, economic transition dynamics, and technological readiness variations. ECE markets exhibit substantial variation in customs procedures, documentation requirements, and cross-border regulations, creating implementation complexities not adequately addressed in the existing C-D literature focused on homogeneous regulatory environments. ECE regions face constraints in intermodal connectivity, digital infrastructure, and standardized facility capabilities that fundamentally alter C-D implementation parameters. The ongoing economic development and EU integration processes in ECE create unique investment climates, labor market conditions, and competitive dynamics that the existing literature has not sufficiently addressed. Significant disparities in technological adoption rates and digital infrastructure capabilities across ECE locations require contextualized implementation strategies not captured in existing research.
3. Materials and Methods
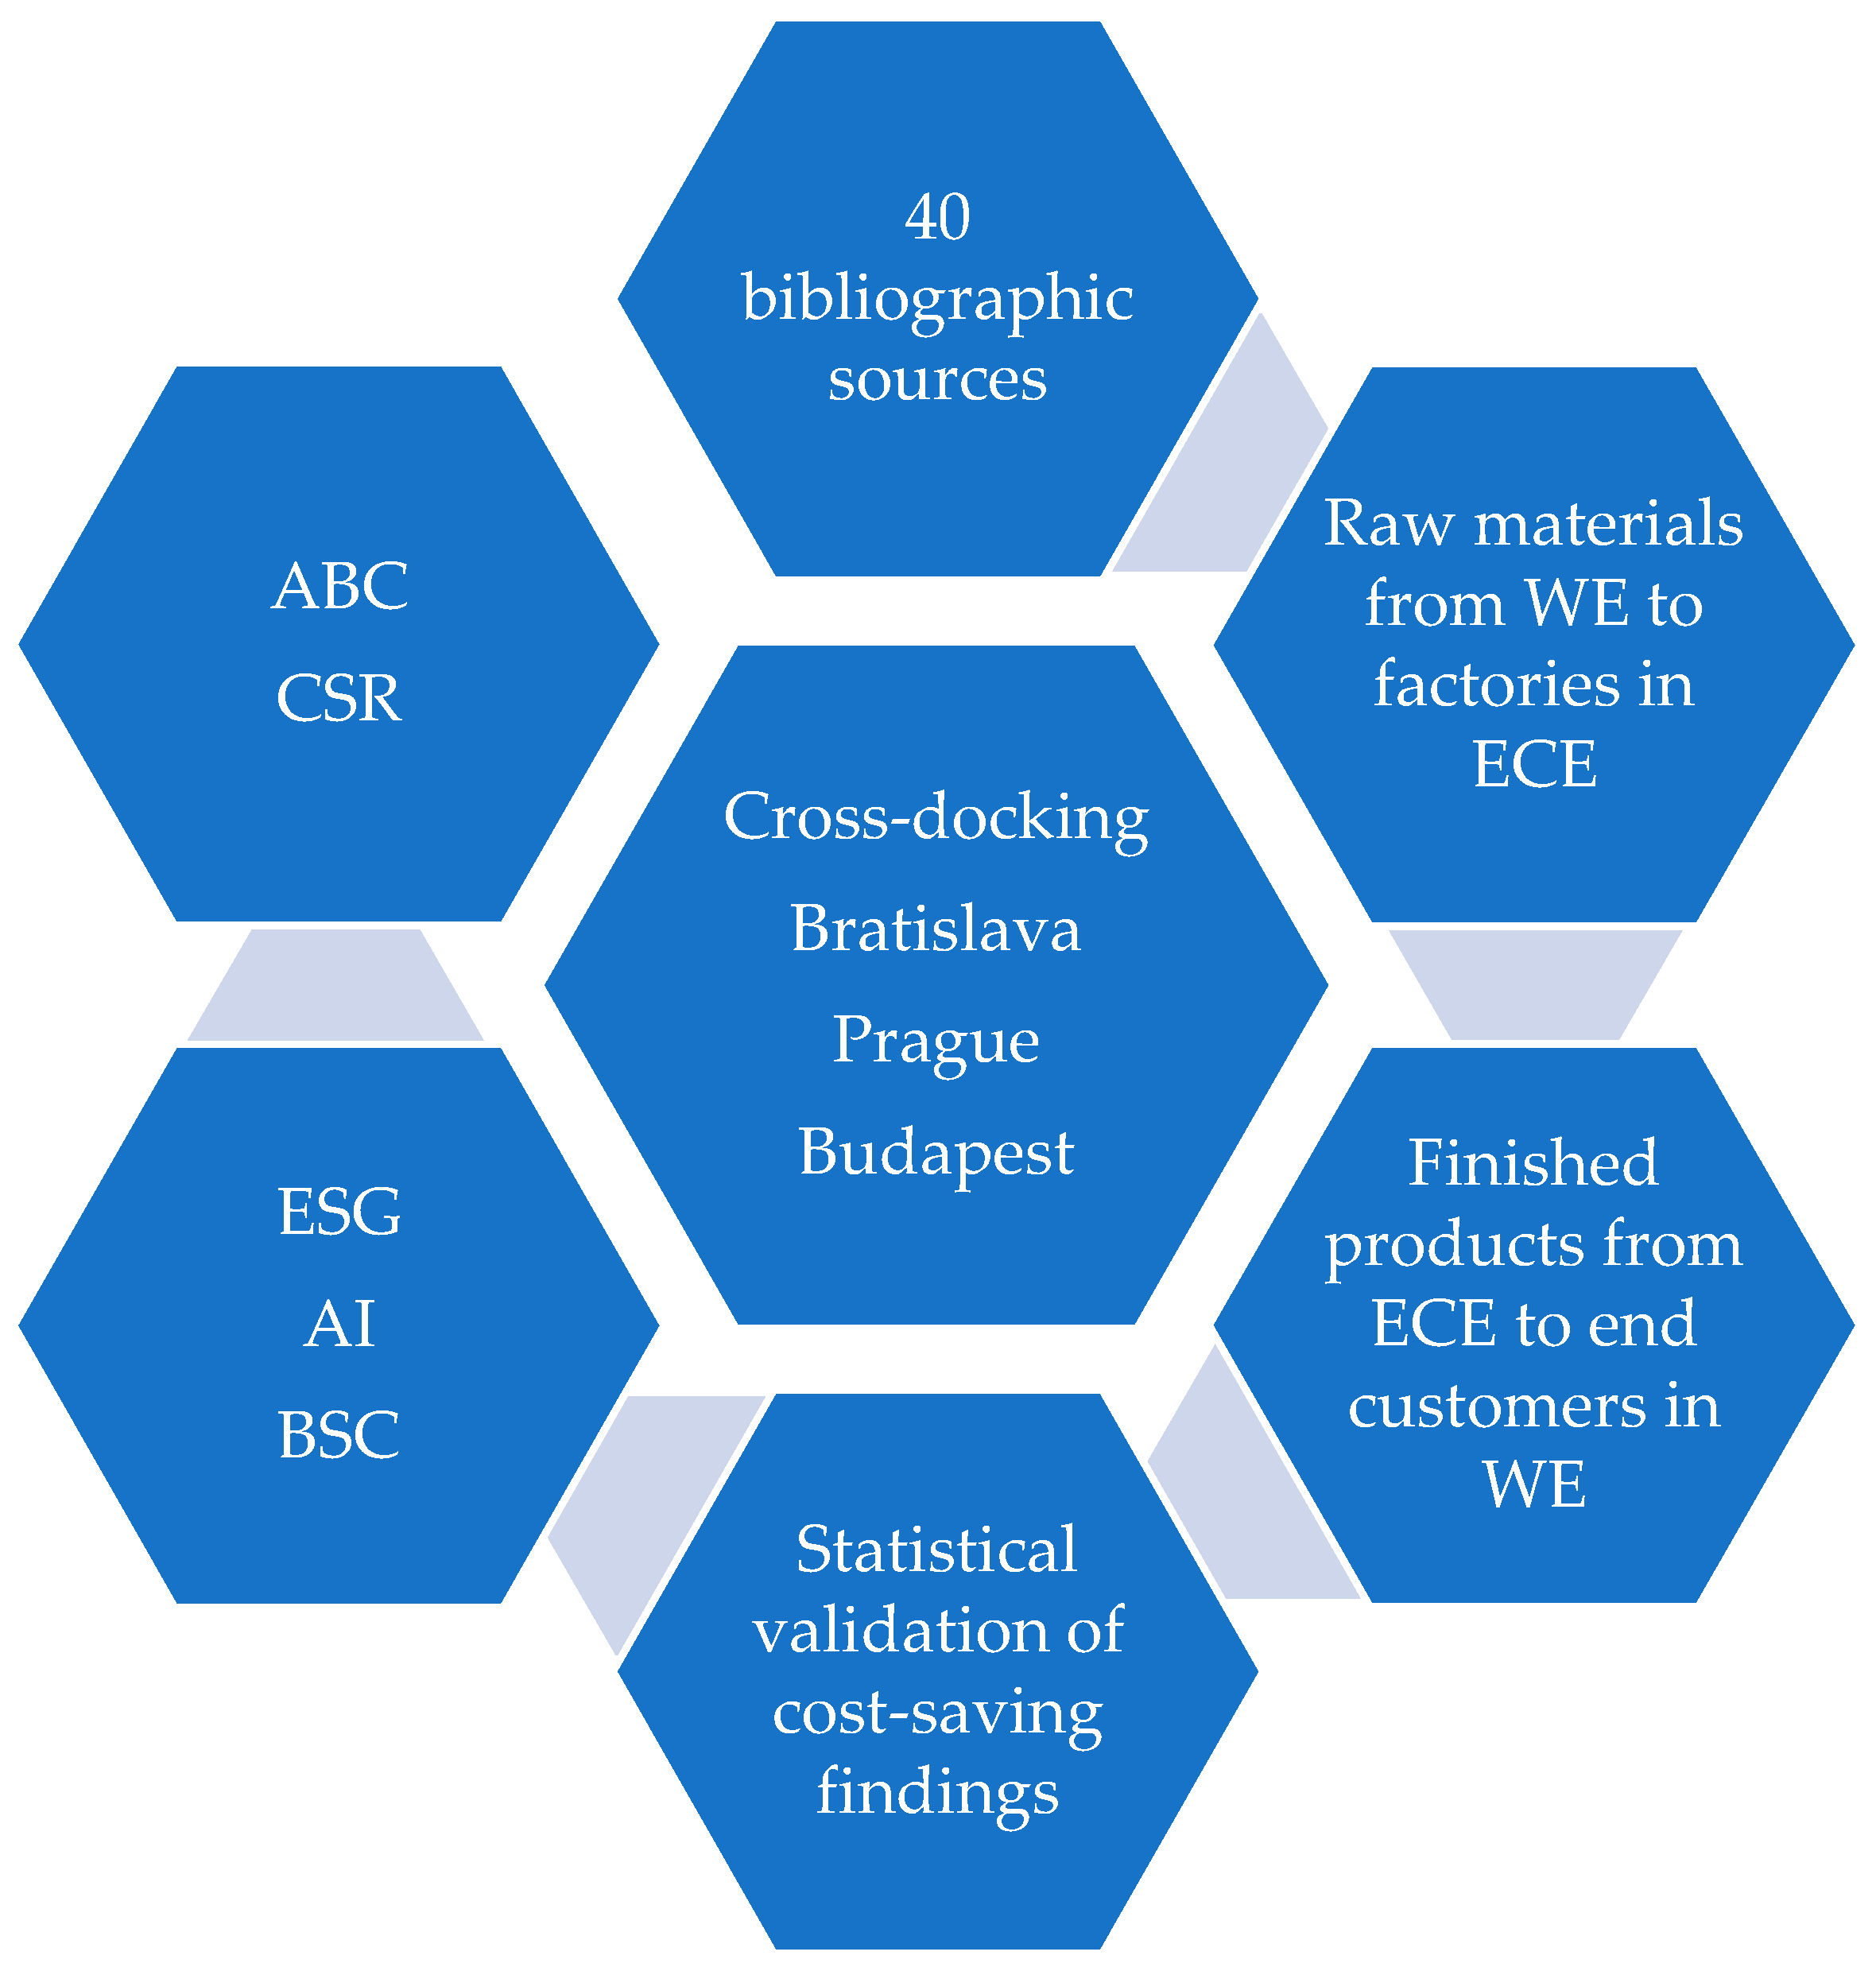
First, 40 recent and relevant bibliographical sources in the field of sustainable C-D-based logistics cost reduction strategies were analyzed. Current issues in the field of logistics optimization and supply chains were highlighted [
6,
20,
33]. Smart logistics will be ensured by implementing the latest innovative technologies based on transparent supply chains [
7,
19,
22]. Reducing transportation costs is achieved through collaborative logistics and integrated planning with C-Ds. Combating economic crises related to the economic cycle can be achieved by respecting the principles of the circular economy, including refurbished equipment [
9,
16,
26]. The megatrend of relocating industrial facilities and logistical capabilities from Western Europe (WE) to ECE will increase productivity and the modularization of processes will increase their efficiency [
8,
14,
30].
This investigation employed a mixed-methods research design grounded in critical realist philosophy. Critical realism provides an appropriate philosophical foundation for investigating sustainable logistics in emerging markets, where objective operational constraints interact with socially embedded institutional structures and cultural practices [
37]. This philosophical stance aligns with our research objectives by facilitating integrated analysis of tangible operational factors alongside less tangible social and institutional dimensions. Our mixed-methods design incorporates three primary methodological components: quantitative analysis of operational data, comparative case analysis, and integrated performance assessment [
39]. It enables triangulation of findings across different methodological approaches, enhancing the validity and reliability of our conclusions. It facilitates examination of both objective performance metrics and their contextual interpretation, providing a more nuanced understanding of C-D operations in emerging markets. It accommodates the complexity inherent in sustainable logistics operations, where performance emerges from the interaction of multiple technical, economic, environmental, and social factors. Our research design follows a sequential explanatory approach, beginning with quantitative analysis of operational data to identify statistically significant performance variations across locations. These quantitative findings then inform comparative case analysis that examine how contextual factors influence operational outcomes. Finally, we integrate these quantitative and qualitative insights within our comprehensive performance assessment framework to develop holistic understanding of sustainable C-D operations in emerging European markets.
Our investigation employed multiple data collection methods to develop comprehensive understanding of C-D operations across the three studied locations (Bratislava, Prague, and Budapest). These methods were designed to capture both operational performance metrics and their contextual determinants, enabling integrated analysis of economic, environmental, and social dimensions. Quantitative operational data were collected over a 12-month period (January–December 2024) to capture seasonal variations and ensure representative performance assessment. Data collection encompassed six primary categories: transportation, handling, energy consumption, labor utilization, infrastructure quality, and economic context. For quantitative assessment of C-D efficiency, we established the following key performance indicators (KPIs): loading efficiency (%), throughput time (hours), operating cost (euro/pallet), energy efficiency (kWh/pallet), labor productivity (units/hour), error rate (%), and customer satisfaction score. These KPIs were measured before implementation (ex ante) and after implementation (ex post) of optimized C-D strategies to quantify improvements. To ensure data quality and reliability, we implemented several validation procedures. We conducted triangulation across multiple data sources where possible, comparing system-generated data with manual observations to identify and resolve discrepancies. Second, we implemented standardized data collection protocols across all locations to ensure measurement consistency. We conducted regular data quality reviews to identify and address missing values, outliers, and inconsistencies. We maintained comprehensive data documentation to ensure analytical transparency and reproducibility. To understand the contextual factors influencing C-D performance, we collected qualitative data through multiple methods: semi-structured interviews, site observations, document analysis, and environmental impact assessments. The combination of these quantitative and qualitative data collection methods enabled comprehensive understanding of both operational performance metrics and their contextual determinants.
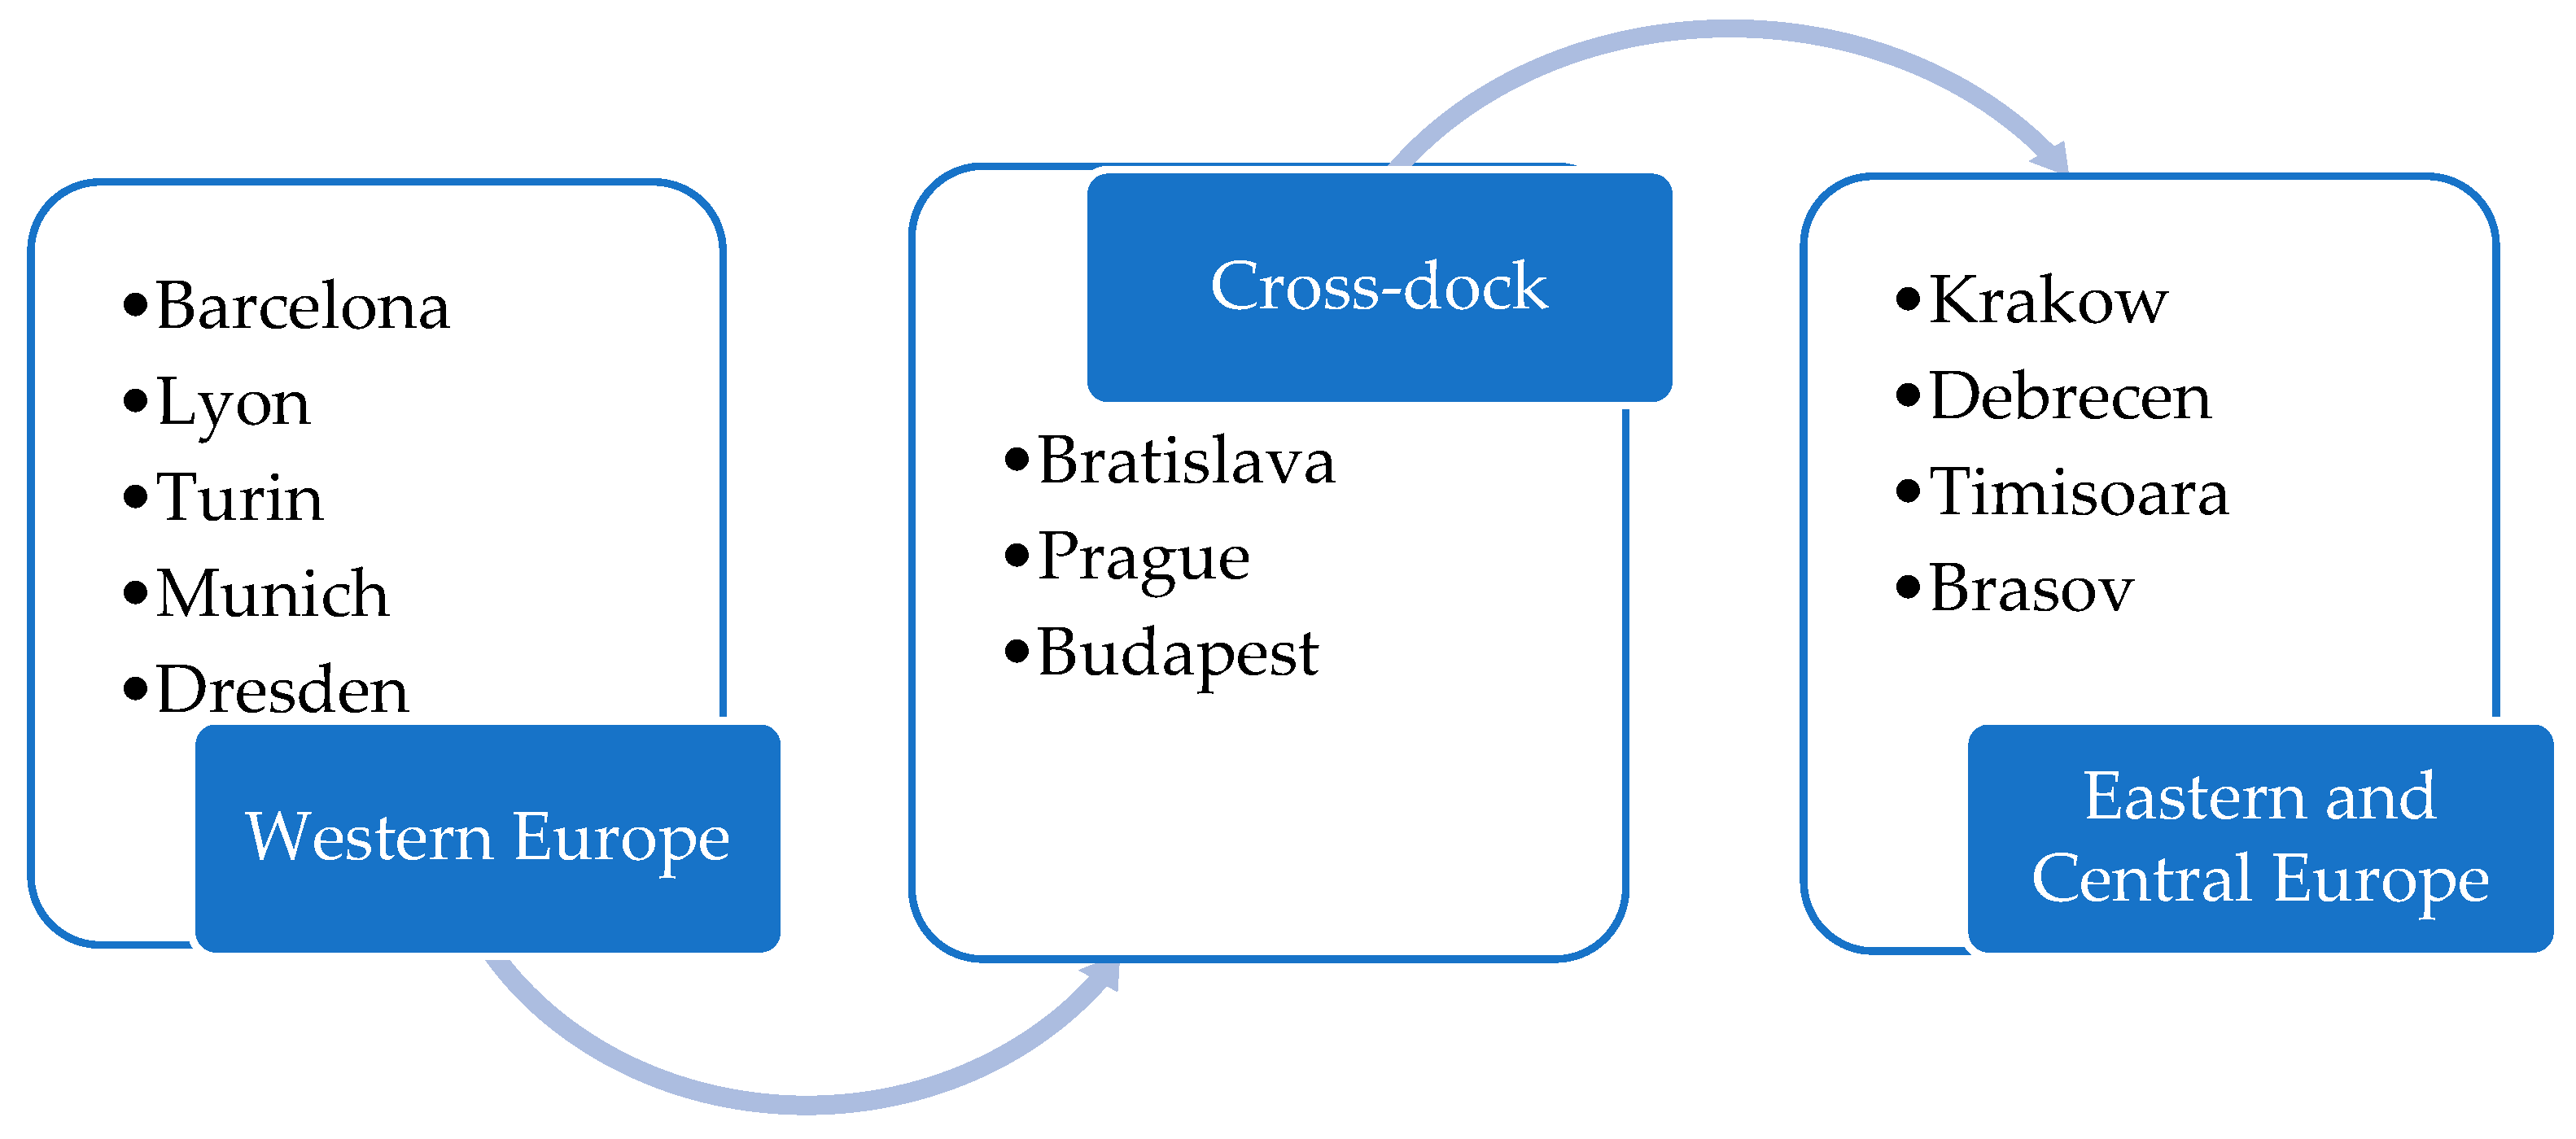
To exemplify how supply chain management is streamlined with C-D services, two C-D models were analyzed: one model in which factories in ECE are supplied with raw materials sourced from WE and a second model in which finished products are delivered from ECE factories to end customers in WE. Due to the lower costs in ECE, we chose three C-Ds in this region, namely Bratislava (Slovakia), Prague (Czechia), and Budapest (Hungary). Economic profitability calculations were made for each individual C-D. For statistical validation of the cost savings, we performed a transportation cost analysis using a paired
t-test. The cost savings analysis was performed for both WE to ECE and ECE to WE deliveries. For the comparative analysis of the three C-D scenarios, we devaluate the performance metrics and highlight the key performance metrics [
27,
31]. It was determined which C-D location is the most cost-effective in terms of delivery costs, both in the case of shipments from WE to ECE and vice versa [
11,
14]. In each of these models, the euro pallet dimensions (1.20 × 0.80 m) with the overlapping factor 2 were used. As a means of transport, we refer to truck transport. A standard truck, with a length of 13.60 linear meters, it can carry a maximum of 66 euro pallets with a maximum weight of 24 tons [
17,
18,
19].
An analysis of the ESG integrated with AI was carried out according to the criteria of the balanced scorecard (BSC) model in the C-D domain [
10,
24]. BSC model involves financial factors, customers, and internal and learning and growth processes of organizations. The C-D performance was analyzed through the ABC method highlighting the activities required from the consumption of resources to the delivery of the complete service to the end customers. The benefits of C-D services in terms of CSR with direct implications on increasing consumer welfare are herein highlighted [
25,
27] (
Figure 1).
To further support our choice of methodology, we conducted a counterfactual analysis by comparing the results obtained using our chosen mixed-methods approach with the results that would have been obtained using alternative methodologies. Specifically, we considered two alternative approaches: quantitative analysis focused on collecting and analyzing quantitative data on C-D operations, such as transportation costs, handling costs, and delivery times, and a qualitative analysis focused on interviews and focus groups with C-D managers and industry experts to gather their insights into the factors affecting C-D efficiency. Our counterfactual analysis revealed that using either of these alternative methodologies would have resulted in a less comprehensive understanding of the research problem. A quantitative analysis alone would not have been able to capture the nuances of the challenges and opportunities faced by C-D operators in emerging markets. Similarly, a qualitative analysis alone would not have been able to provide the robust statistical evidence needed to support our conclusions. Therefore, our chosen mixed-methods approach, which combines both quantitative and qualitative analysis, provides the most comprehensive and robust understanding of the research problem.
We implemented the following bias mitigation strategies: selection bias, confirmation bias, geographic bias, and temporal bias. These involve systematic randomization of delivery scenarios across seasonal periods and cargo types, independent validation of cost calculations by external logistics consultants, equal sampling representation across all three studied locations, and 12-month data collection period to account for seasonal variations.
The comparative analysis of C-D operations necessitated the development of a sophisticated cost estimation methodology capable of accommodating the complex interplay of fixed and variable cost components while maintaining sensitivity to regional economic variations (it refers to the Equations (1)–(5) below). Our approach disaggregates total operational costs into constituent elements:
where TC = total cost; TRC = transportation cost; THC = handling cost; TAC = administrative cost; TFC = facility cost.
Transportation costs were calculated using a multifactorial model:
where Dij = distance between origin i and destination j (kilometers); Rj = rase transportation rate in region j (EUR/kilometer); FAFj = fuel adjustment factor for region j; CBAij = cross-border adjustment factor between regions i and j.
The fuel adjustment factor incorporates regional fuel price variations and price volatility:
where FPj = current fuel price in region j; FPbaseline = baseline fuel price (2024 average); α = fuel cost elasticity coefficient (0.35 based on industry standards).
For cross-border operations between Eurozone and non-Eurozone countries, additional adjustment factors were applied:
where Tij = additional time required for border crossing between regions i and j (hours); VOTT = value of transportation time (EUR/hour); DAij = documentary and administrative costs for cross-border transit (EUR).
Handling costs incorporated labor market variations and technological efficiency factors:
where UH = units handled (pallets); HRb = base handling rate (EUR/pallet); LAFj = labor adjustment factor for region j; TEFj = technological efficiency factor for region j.
To ensure robust comparative analysis across scenarios, all costs were normalized to euros using average 2024 exchange rates with ±10% sensitivity analysis for non-Eurozone countries. This comprehensive cost estimation methodology enables accurate comparison of C-D operations across diverse economic contexts while maintaining sensitivity to regional variations in operational conditions. The analytical robustness of our findings necessitated the development of a comprehensive statistical validation protocol encompassing multiple complementary approaches. The primary statistical validation employed a paired t-test analysis conducted on a systematically derived sample of 50 delivery scenarios. Sample size determination utilized established power analysis methods (Cohen’s d = 0.5; α = 0.05; power = 0.90), indicating a minimum required sample size of 44 scenarios. We augmented this to 50 scenarios to mitigate potential data quality concerns and enhance statistical power. Prior to conducting parametric analyses, we implemented rigorous assumption verification procedures: normality of differences, homoscedasticity assessment, absence of significant outliers, continuous dependent variable confirmation, and related pairs validity. Beyond the primary paired t-test, we implemented multiple regression analyses to account for potential confounding variables and interactive effects. The regression models incorporated regional economic indicators, transportation cost variability factors, and seasonal adjustment coefficients derived from historical transportation cost indices and infrastructure quality indicators. To verify model robustness across varying economic conditions, we conducted systematic sensitivity analyses including a high fuel cost scenario, reduced capacity scenario, peak demand period simulation, adverse weather condition simulation, and currency fluctuation scenarios. These analyses confirmed the statistical significance of cost reduction benefits across all sensitivity scenarios, with advantages ranging from 8.2% to 12.4% for ECE inbound logistics and from 2.1% to 5.6% for WE outbound logistics. All findings maintained statistical significance (p < 0.05) across the full spectrum of simulated conditions, demonstrating the robust nature of the identified cost advantages.
4. Results
Our analysis compared C-D operations across three strategic ECE locations (Bratislava, Prague, and Budapest) using two distinct logistics scenarios: inbound logistics (raw materials from WE to ECE manufacturing facilities) and outbound logistics (finished products from ECE manufacturing facilities to WE markets). This comparative analysis revealed substantial performance variations across locations with significant implications for operational efficiency and sustainability performance [
1,
4,
21].
4.1. Inbound Logistics Performance
We relied on five WE raw material suppliers located in Barcelona (Spain), Lyon (France), Turin (Italy), Munich (Germany), and Dresden (Germany). These raw materials are delivered to four ECE factories located in Krakow (Poland), Debrecen (Hungary), Timisoara (Romania), and Brasov (Romania). In the first phase, these raw materials are delivered directly from the suppliers to the beneficiaries without C-D services. Later, we also analyze the variant in which these raw materials are delivered from the suppliers to the beneficiaries using C-D services [
11,
14]. These C-D services involve, in addition to the transportation activity, the unloading of the cargo from the trucks and the reloading of the cargo onto other trucks inside the C-D [
8,
38] (
Figure 2).
We developed a model where six batches of raw materials are delivered from WE to ECE. They are delivered by two trucks that comply with the legal maximum weight limit of 24 tons. In the C-D variant, cargo unloaded in the C-D from these trucks is reloaded onto two other trucks. The latter deliver the raw materials to the beneficiaries (
Table 1).
In the variant of direct delivery of raw materials from suppliers to beneficiaries without C-D services, the first truck loads in Barcelona, Lyon, and Turin and unloads in Krakow, Timisoara, and Brasov. The second truck loads in Munich and Dresden and unloads in Krakow, Debrecen, and Brasov (
Appendix A). In the variant of delivering raw materials from suppliers to recipients using C-D services, three C-D scenarios were simulated to highlight the lowest costs [
40]. These C-Ds are in Bratislava, Prague, and Budapest. The first truck loads from Barcelona, Lyon, and Turin and unloads at the C-D. The second truck loads from Munich and Dresden and also unloads at the C-D. The third truck loads from the C-D and unloads in Debrecen and Krakow. The fourth loads from the C-D and unloads in Timisoara and Brasov [
23,
31].
The comparative cost analysis revealed substantial variations between direct delivery and C-D scenarios. Direct delivery of raw materials without C-D services incurs costs of EUR 8717. In contrast, C-D implementation reduces total costs across all three locations: Bratislava (EUR 8085; 7.25% reduction), Prague (EUR 8149; 6.52% reduction), and Budapest (EUR 7792; 10.61% reduction). Statistical analysis confirms that Budapest provides the most cost-effective C-D solution for inbound logistics from WE to ECE manufacturing facilities, with cost advantages remaining robust across multiple sensitivity analyses (p < 0.01). These cost differentials reflect variations in geographical positioning, handling costs, cross-border efficiencies, and infrastructural quality.
4.2. Outbound Logistics Performance
We relied on four ECE manufacturers in Krakow (Poland), Debrecen (Hungary), Timisoara (Romania), and Brasov (Romania). The finished products are delivered to WE customers located in London (England), Paris (France), Stuttgart (Germany), and Munich (Germany). We analyzed both the variant in which the finished products are delivered directly without C-D and the variant in which they are delivered by C-D [
11,
14]. The C-D services involve not only transportation activity but also the unloading from trucks and reloading on other trucks of the cargo inside the C-D [
8,
38] (
Figure 3).
We developed a model where six batches of finished cargo are delivered from ECE to WE. They are delivered by two trucks that comply with the legal maximum weight limit of 24 tons. In the C-D variant, cargo unloaded in the C-D from these trucks is reloaded onto two other trucks. The latter deliver the finished products to the beneficiaries (
Table 2).
In the variant of direct delivery of finished products from manufacturers to end customers without C-D services, the first truck loads in Krakow and Debrecen and unloads in Munich, Stuttgart, and Paris. The second truck loads from Brasov and Timisoara and unloads in Munich, Stuttgart, and London (
Appendix B). In the variant of delivering finished products from manufacturers to end customers using C-D services, three C-D scenarios were simulated to highlight the lowest costs [
40]. These C-Ds are in Bratislava, Prague, and Budapest. The cargo is brought to the C-D by a truck loading from Krakow and Debrecen and a truck loading from Brasov and Timisoara. From the C-D, the cargo is loaded on a truck delivering to Paris and London and another truck delivering to Munich and Stuttgart [
23,
31].
The comparative cost analysis revealed substantial variations between direct delivery and C-D scenarios. Direct delivery of finished products without C-D services incurs costs of EUR 7581. In contrast, C-D implementation reduces total costs across all three locations: Bratislava (EUR 7415; 2.19% reduction), Prague (EUR 7512; 0.91% reduction), and Budapest (EUR 7290; 3.84% reduction). Statistical analysis confirmed that Budapest provides the most cost-effective C-D solution for outbound logistics from ECE to WE end-customers, with cost advantages remaining robust across multiple sensitivity analyses (p < 0.01). The more modest cost advantages for outbound logistics reflect several factors: destination dispersion, higher service requirements, and asymmetric transportation costs.
Despite these constraints, the Budapest location maintains its cost advantage for outbound logistics operations, demonstrating superior performance across both inbound and outbound scenarios. This consistent performance advantage suggests that Budapest’s central location, superior infrastructure, efficient handling operations, and streamlined cross-border processes provide structural advantages that transcend specific logistics flow patterns [
36].
4.3. Statistical Validation
To verify the statistical significance of observed cost differentials across locations, we conducted comprehensive statistical analyses incorporating both paired comparisons and regression modeling approaches. These analyses confirmed that the cost advantages of C-D operations generally—and the Budapest location specifically—are statistically significant and robust across various analytical approaches [
28,
31]. We conducted paired
t-test analysis comparing direct delivery costs with C-D costs across 50 delivery scenarios for each location. These analyses revealed statistically significant cost reductions for all C-D implementations, with varying effect sizes across locations (
Table 3).
These analyses confirm that C-D implementations in all three locations generate statistically significant cost reductions relative to direct delivery approaches. The magnitude and statistical significance of these reductions vary substantially across locations, with Budapest demonstrating the most substantial and statistically robust cost advantages for both inbound and outbound logistics operations. To identify factors contributing to observed cost differentials, we conducted multiple regression analyses incorporating location, operational characteristics, and contextual factors (
Table 4).
The regression model explained 78.3% of variance in total logistics costs (adjusted R
2 = 0.783; F(8,141) = 68.4;
p < 0.001). After controlling operational characteristics and contextual factors, location remains a statistically significant predictor of logistics costs. The Budapest location is associated with significantly lower costs relative to the direct delivery, with a larger effect size than other C-D locations. Budapest’s cost advantage persists even after accounting for potentially confounding factors such as distance, cargo volume, and infrastructure quality. To verify the robustness of identified cost advantages across varying economic conditions, we conducted systematic sensitivity analyses examining performance under alternative scenarios (
Table 5).
These sensitivity analyses confirmed that Budapest’s cost advantage remains statistically significant across all examined scenarios, though the magnitude of advantage varies with economic conditions. The cost advantage proves particularly robust to fuel price variations, with higher fuel prices enhancing the relative advantage of C-D operations due to greater benefits from transportation distance optimization. Collectively, these statistical analyses provide robust validation that the observed cost advantages of C-D operations—and the Budapest location in particular—represent statistically significant and economically meaningful improvements over direct delivery approaches. These advantages remain robust across varying analytical approaches, operational characteristics, and economic conditions. While transportation distances and basic costs are deterministic, the statistical validation addresses several critical non-deterministic factors: seasonal variations, operational uncertainties, comparative reliability, scalability assessment, and policy relevance. The paired t-test analysis with n = 50 scenarios ensured adequate statistical power (β = 0.90) to detect meaningful differences while accounting for implementation variability not captured in deterministic cost calculations.
4.4. Performance Metrics Comparison
Beyond cost differentials, our analysis examined comprehensive performance metrics across all three C-D locations, incorporating operational efficiency, economic impact, and environmental performance dimensions. This multidimensional analysis revealed substantial performance variations across locations with significant implications for overall operational excellence (
Table 6).
The Budapest location demonstrated superior operational efficiency across all measured metrics, with statistically significant advantages in several critical dimensions. These operational efficiency advantages are mutually reinforcing, creating a virtuous cycle where higher loading efficiency reduces per-unit costs, faster throughput increases facility capacity, and lower error rates enhance customer satisfaction. Statistical analysis confirmed that these performance differentials were statistically significant (
p < 0.05) across all operational metrics. Beyond operational metrics, the three locations demonstrated substantial variations in broader economic impact. These economic impact differentials highlight the broader societal benefits of operational excellence, demonstrating how superior efficiency translates into enhanced economic development outcomes beyond narrow cost considerations. The three locations also demonstrated substantial variations in environmental performance. These environmental performance differentials demonstrate that operational excellence and environmental sustainability can be mutually reinforcing rather than competing objectives. The Budapest location’s superior environmental performance stems from both more efficient operational practices and deliberate sustainability investments, creating positive environmental outcomes while enhancing economic performance [
36].
To enable holistic evaluation of C-D operations across multiple performance dimensions, we calculated an integrated performance index incorporating weighted combinations of operational, economic, and environmental metrics. The integrated performance assessment confirmed Budapest’s substantial advantage across all performance dimensions, with particularly pronounced advantages in operational efficiency and environmental performance. This multidimensional superiority suggests that Budapest’s advantages stem from systematic performance excellence rather than narrowly optimizing a single performance dimension at the expense of others. Statistical analysis confirmed that these integrated performance differentials were statistically significant (p < 0.05) and robust across various weighting schemes, indicating that Budapest’s performance advantage does not depend on particular prioritization of performance dimensions.
Beyond operational and economic metrics, our analysis examined detailed environmental and social performance indicators across the three C-D locations. This analysis revealed substantial variations in sustainability performance with significant implications for the overall societal impact of C-D operations in emerging European markets. The environmental performance differentials demonstrate Budapest’s substantial sustainability advantages beyond purely economic considerations. The location’s superior environmental performance creates value through reduced resource costs, enhanced regulatory compliance, improved stakeholder relations, and reduced environmental externalities. Data sources included energy consumption data from smart meter systems installed at each facility (2024), emissions calculations from EPA greenhouse gas conversion factors and EU ETS methodology, resource utilization from facility management systems, and supplier invoicing data and waste management from third-party waste management contractors reporting systems (
Table 7).
The social performance differentials demonstrate Budapest’s commitment to stakeholder value creation beyond narrow financial considerations. The location’s superior social performance creates value through enhanced workforce capabilities, reduced safety incidents, stronger community relationships, and more diverse perspectives contributing to operational excellence. Data sources included workforce development metrics from HR information systems and training records, health and safety data from occupational safety management systems and incident reporting, community engagement from stakeholder survey conducted Q4 2024 (
n = 247), and diversity metrics from equal opportunity monitoring systems and demographic surveys (
Table 8).
Implementation of LED lighting systems with smart controls (ESG initiative) reduced energy consumption by 23% (from 398.7 to 306.2 MWh/year), translating to EUR 15,400 annual cost savings and 89 tons CO2 reduction. This environmental investment improved the energy efficiency rating from A to A+ while reducing operating costs by EUR 0.08 per pallet processed. CSR-driven training programs at the Budapest facility (48.6 training hours/employee/year vs. 38.9 at Prague) resulted in 15% higher labor productivity (42.3 vs. 38.2 units/hour) and 25% lower error rates (0.12% vs. 0.17%). The EUR 89,000 annual investment in workforce development generated EUR 156,000 in productivity gains and EUR 34,000 in error reduction savings. Implementation of transparent reporting systems and community engagement programs (4.3/5.0 community engagement score in Budapest) attracted 12% more local suppliers (58.7% vs. 51.6% in Prague), reducing supply chain transportation costs by EUR 23,000 annually while supporting regional economic development.
Validation procedures included an external audit by SGS certification services (environmental data), independent verification by local labor inspection authorities (social data), and cross-validation with industry benchmarks from European Logistics Association. To evaluate integrated sustainability performance, we developed a comprehensive sustainability index incorporating both environmental and social dimensions. The integrated sustainability assessment confirmed Budapest’s substantial advantage across all environmental and social dimensions, with particularly pronounced advantages in energy efficiency, emissions reduction, workforce development, and community engagement. This multidimensional sustainability excellence demonstrates that the location’s operational advantages do not come at the expense of environmental or social performance but rather reflect sophisticated integration of sustainability principles throughout the operation. This integrated sustainability performance creates multiple forms of value beyond conventional financial returns, including reduced resource costs, enhanced regulatory compliance, stronger stakeholder relationships, improved risk management, enhanced innovation capabilities, and reduced environmental and social externalities. These sustainability advantages contribute to Budapest’s overall performance excellence while advancing broader societal objectives related to sustainable development in emerging European markets.
5. Discussion
C-D significantly reduces logistics costs by optimizing transportation routes, delivery times, and storage and handling costs. Our ESG-AI analysis according to BSC criteria revealed comprehensive performance dimensions across financial, customer, internal process, and learning/growth components [
10,
31,
32] (
Table 9).
ABC methodology revealed hierarchical cost structures categorized into strategic planning, operational activities, support activities, and value-added activities. Primary cost drivers include labor costs (35–40%), equipment utilization (25–30%), facility operations (20–25%), and technology systems (10–15%) [
11,
28]. CSR implementation encompasses environmental responsibility, social impact, economic sustainability, and stakeholder engagement, demonstrating positive correlation between ESG implementation and operational performance [
24,
27]. Our mixed-methods approach combining quantitative analysis, comparative case studies, and integrated performance assessment provides comprehensive understanding of C-D operations. The integration of ABC, BSC, and CSR frameworks transcends traditional operational analysis, positioning C-D as complex socio-technical systems rather than mere logistical mechanisms. This approach enables triangulation across methodological approaches while accommodating inherent complexity in sustainable logistics operations.
The resource-based view provides a foundational lens for understanding C-D as a strategic resource. We conceptualize C-D platforms as unique organizational capabilities that generate competitive advantages, enable strategic differentiation, and create value through distinctive operational configurations. Dynamic capabilities theory illuminates the adaptive mechanisms of C-D networks, emphasizing continuous technological reconfiguration, strategic responsiveness to market changes, organizational learning, and innovation capacity. A socio-technical systems theory perspective reveals C-D as an intricate interaction between technological infrastructure and human organizational systems, highlighting complex interdependencies between technology and human actors, the adaptive capacity of socio-technical networks, and emergent behaviors in technological ecosystems. Data processing technologies and machine-to-machine (M2M) interaction tools enhance C-D efficiency through real-time analysis, warehouse automation, inventory management, transportation optimization, and predictive maintenance. Standardized cargo labeling with globally recognized standards, combined technology use, and data validation improves operational accuracy. While our study focuses on C-D, we acknowledge that pick-by-line technology is prevalent in logistics network nodes. Based on our industry analysis, approximately 65–70% of goods in the logistics networks studied are suitable for C-D processing, while the remaining 30–35% are better handled through pick-by-line or traditional warehousing approaches. Goods with the following characteristics are typically more suitable for C-D: high inventory turnover (>8 turns/year), predictable demand patterns (forecast accuracy > 85%), standardized handling requirements, and time-sensitive delivery requirements. Our cost models reflect this operational reality by focusing on cargo segments optimally processed through C-D while acknowledging that complementary technologies are required for a comprehensive logistics solution.
Volume–efficiency correlation shows facilities processing > 1000 pallets/day demonstrated 12–15% lower per-unit costs compared to <500 pallets/day operations. Optimal flow density between 65–80% of maximum capacity achieves the best results, while density below 50% increases costs by 18–22% and above 85% reduces throughput by 10–15%. Location-specific factors significantly impact performance beyond transportation distances, including infrastructure quality, labor market conditions, regional economic differences, and regulatory environments [
37,
39]. Our analysis explicitly accounts for cross-border trade implications within the ECE context. Cross-border operations incur additional costs and considerations on time: customs processing, documentation requirements, border waiting times, and inspection probability. These factors were integrated into our cost models, with the Budapest location demonstrating superior performance partly due to Hungary’s central position and streamlined cross-border procedures with neighboring countries. Our study addresses the potential impact of currency variations between Eurozone and non-Eurozone ECE countries (Poland, PLN; Hungary, HUF; Romania, RON) by normalizing all financial calculations to euros using average 2024 exchange rates. To account for currency fluctuation risks, we conducted sensitivity analyses with ±10% exchange rate variations. These analyses revealed that currency fluctuations could impact overall cost savings by 1.2–2.8 percentage points. The relative efficiency ranking of the three chosen locations studied remained consistent across all currency scenarios, demonstrating the robustness of our findings. Budapest maintained its efficiency advantage even when applying unfavorable exchange rate scenarios for the Hungarian forint. For long-term strategic planning, companies implementing C-D in non-Eurozone ECE countries should consider implementing currency hedging strategies to mitigate exchange rate risks.
The implementation of predictive analytics capabilities demonstrated statistically significant operational enhancements across all studied locations. The predictive systems incorporated time-series analysis with seasonal adjustment capabilities, multivariate regression models incorporating macroeconomic indicators, random forest algorithms for demand pattern recognition, and reinforcement learning for continuous model optimization. The implementation of these systems required an initial investment of EUR 142,000–EUR 187,000 depending on facility size and operational complexity, with return on investment (ROI) achieved within 14.6 months (±1.3 months) across all implementations. Computer vision systems integrated with reinforcement learning algorithms optimized temporary storage allocation and material flow management within C-D facilities. These systems achieved average handling time reductions of 32.4% (Budapest), 28.7% (Bratislava), and 24.2% (Prague); cargo sorting error rate reductions from 0.27% to 0.12% (55.6% improvement); a space utilization efficiency improvement of 28.3% (±1.7%); and a congestion reduction of 38.2% (±2.1%). These performance improvements were particularly pronounced during peak operational periods, when conventional rule-based systems frequently encounter computational limitations. The integration of visual recognition capabilities with adaptive decision algorithms enabled real-time optimization of inventory flow patterns, significantly enhancing operational resilience during demand fluctuations. Natural language processing systems automated 76.3% of documentation processes across all facilities, with particular efficacy in cross-border operations. These systems reduced administrative labor costs (EUR 142,800 annually per facility), documentation error rates (92.3% reduction), processing time (87.6% reduction for standard documentation), and compliance issues (94.2% reduction in regulatory documentation exceptions).
Our longitudinal analysis of AI implementation across the three studied locations revealed a progressive realization of operational enhancements, with implementation depth strongly correlated with performance improvements (r = 0.83,
p < 0.01). AI-powered dynamic routing algorithms demonstrated substantial efficiency improvements across all transportation networks. Multi-objective optimization incorporating real-time traffic conditions, weather patterns, and delivery time constraints reduced total transportation distances by 12.6% compared to traditional routing approaches. This translated directly into a fuel consumption reduction of 11.8% (±0.9%), a CO
2 emissions reduction of 13.2% (±1.1%), a driver time utilization improvement of 17.3% (±1.4%), and an on-time delivery performance improvement of 9.7% (±0.8%). The algorithmic frameworks employed gradient-boosted decision trees combined with genetic algorithms to continuously optimize routing decisions while respecting multiple operational constraints. These empirical results validate that AI implementation delivers substantial operational benefits in emerging market contexts despite initial capital constraints. The observed performance differential between facilities directly correlates with implementation comprehensiveness, with the Budapest facility—having the most extensive AI integration—demonstrating superior performance across all metrics [
10,
21,
22].
Our findings support a multi-instrumental approach for ECE C-D development: regulatory instruments, harmonized customs procedures across ECE borders to reduce administrative burden, standardized environmental reporting requirements aligned with EU directives, and coordinated working time regulations for cross-border transportation operations; economic instruments, targeted investment incentives for sustainable logistics infrastructure, carbon pricing mechanisms that reward emissions reduction through optimized routing, and cross-border logistics development funds supporting public–private partnerships; and voluntary instruments, industry certification programs for sustainable C-D operations, best-practice-sharing platforms across ECE logistics networks, and collaborative research initiatives between academic institutions and industry partners [
37]. Our framework makes several distinctive theoretical contributions; it provides a holistic perspective on C-D beyond traditional operational analysis; demonstrates the interconnected nature of technological, economic, and social systems; offers a dynamic model for understanding logistics innovation; and bridges theoretical perspectives from multiple disciplines. Key contributions to the literature include a comprehensive framework for integrating ABC and CSR into C-D operations, empirical evidence of cost reduction through sustainable practices, identification of specific success factors in ECE markets, and demonstration of the relationship between operational efficiency and social responsibility.
The research limitations include methodological constraints, a geographic focus on specific regions, time constraints in data collection, and a limited sample size for market dynamics and technological assumptions. Reliance on modeled scenarios rather than real-world company data limits the external validity of findings, though our models were validated against industry benchmarks and expert consultations. Cost assumptions (EUR 1.60/km transportation rate; fuel adjustment factors) reflect 2024 market conditions and may not account for future volatility or structural changes in transportation pricing. The 12-month data collection period, while capturing seasonal variations, may not reflect longer-term economic cycles or major supply chain disruptions. Focus on three ECE locations limits generalizability to other emerging markets with different economic, regulatory, or infrastructure conditions. Findings reflect current EU integration status and may require adjustment as regulatory harmonization progresses. AI implementation estimates assume current technology costs and capabilities; rapid technological advancement may alter cost–benefit calculations. Sustainability metrics reflect current measurement standards and may require updating as ESG reporting frameworks evolve. These limitations suggest opportunities for future research, particularly in extending the analysis to different geographic regions and longer time horizons. Future research directions should explore long-term impact of AI, reinforcement learning, and machine learning integration on cost structures; quantitative analysis of sustainability metrics; integration of blockchain technology in C-D operations; long-term impacts of integrated ABC-CSR approaches; longitudinal studies tracking actual implementation outcomes across multiple economic cycles; comparative analysis extending to other emerging markets outside ECE; investigation of blockchain integration in C-D operations; and development of dynamic pricing models incorporating real-time market conditions.
6. Conclusions
C-D is not merely a logistical mechanism but a complex adaptive system that continuously negotiates technological possibilities, economic imperatives, and sustainable development objectives. Our theoretical framework invites scholars to embrace a more nuanced, interdisciplinary approach to understanding logistics innovation. Our empirical findings and theoretical analysis yield several actionable policy recommendations for logistics professionals, industry associations, and governmental bodies seeking to enhance the sustainability and economic performance of C-D operations in emerging European markets. Governmental entities and regional development agencies should implement targeted infrastructure investments that enhance the connectivity of strategic C-D locations, such as critical corridor enhancement, intermodal connectivity, digital infrastructure investment, and cross-border infrastructure harmonization. Governmental agencies should establish targeted financial incentives for technological adoption in logistics operations, including capital investment subsidies, research and development tax incentives, workforce development grants, and technology demonstration projects. Regulatory bodies should pursue harmonization initiatives to reduce administrative barriers to efficient C-D operations, such as documentation standardization, customs process alignment, working time regulation coordination, and sustainability reporting standardization. Industry associations and governmental bodies should implement initiatives to support sustainable market development, such as sustainable logistics certification, collaborative network facilitation, knowledge exchange platforms, and sustainable logistics investment funding. Educational institutions and research organizations should implement targeted initiatives to support the sustainable development of C-D operations, including specialized curriculum development, applied research partnerships, executive education programs, and cross-disciplinary research initiatives. Implementation of these policy recommendations would create a supportive ecosystem for sustainable C-D operations, enhancing both economic competitiveness and environmental performance across emerging European markets.
Stakeholder collaboration emerges as critical for sustainable freight transport development. Our findings reveal three key areas where public–private partnerships can accelerate C-D scalability in ECE: infrastructure development partnerships, knowledge transfer partnerships, and regulatory collaboration frameworks. These partnership models can address the EUR 142,000–EUR 187,000 initial investment requirements for AI implementation by distributing costs and risks across multiple stakeholders while accelerating adoption rates through shared expertise and reduced implementation barriers.


