Abstract
Grounded in coupling theory, this study investigates the interplay among three key elements of economic growth, namely the digital economy, carbon emissions efficiency, and high-quality economic development. Drawing on data from 30 Chinese provinces from 2000 to 2023, we employ exploratory spatiotemporal data analysis and the GeoDetector model to examine the spatial–temporal evolution and underlying driving forces of coupling coordination. This research enriches the theoretical framework of multi-system synergistic development in a green transition context and offers empirical insights and policy recommendations for fostering regional coordination and sustainable development. The results reveal that (1) both the digital economy and high-quality economic development show a steady upward trend, while carbon emissions efficiency has a “U-shaped” curve pattern; (2) at the national level, the degree of coupling coordination has evolved over time from “mild disorder” to “on the verge of disorder” to “barely coordinated,” while at the regional level, this pattern of coupling coordination shifts over time from “Eastern–Northeastern–Central–Western” to “Eastern–Central–Northeastern–Western”; (3) although spatial polarization in coupling coordination has improved, disparities fluctuate in a “decline–rise” pattern, with interregional differences being the main source of that variation; (4) the degree of coupling coordination has a positive spatial correlation, but with a declining trend with fluctuations; and (5) improvements in the level of economic development, human capital, industrial structure, green technological innovation, and market development capacity all contribute positively to coupling coordination. Among them, green technological innovation and market development capacity are the most influential drivers, and the interactions among all driving factors further enhance their collective impact.
1. Introduction
Since the beginning of the 21st century, a new wave of technological revolution has brought China into a new era in terms of its digital economy. The deep integration of digital technologies across various sectors of society has promoted high-quality economic development and accelerated the transition toward a green and low-carbon economy [1]. At the same time, the dual carbon goals of carbon peaking and carbon neutrality are important levers for China in promoting green, low-carbon, and high-quality development. Enhancing carbon emissions efficiency serves as a key path to achieving the dual carbon goals and is closely related to the goal of achieving high-quality economic development [2]. The reports of the 20th National Congress of the Communist Party of China and the Third Plenary Session of the 20th Central Committee both emphasize the need to accelerate the development of the digital economy, promote green and low-carbon development, and achieve high-quality development. Therefore, exploring coupling coordination among the digital economy, carbon emissions efficiency, and high-quality economic development, as well as their driving factors, holds significant practical importance for building a Beautiful China and advancing the strategies of digitalization and high-quality development.
To investigate the spatiotemporal evolution and driving mechanisms of the coupling coordination among the digital economy, carbon emissions efficiency, and high-quality economic development, we first analyze the interrelationships among these three systems based on coupling theory. Using panel data from 30 Chinese provinces spanning 2000 to 2023, we assess the development levels of each system and measure their coupling co-ordination degree by applying the entropy weight method, the super-efficiency SBM model, and the coupling coordination degree model. We then employ exploratory spatiotemporal data analysis and the geographical detector method to examine the spatial-temporal evolution and influencing factors of coupling coordination, providing scientific support for regional green development. Our results indicate that although the coupling coordination degree has generally increased over time, pronounced regional disparities remain. Factors such as economic development level, human capital, industrial structure, green technological innovation, and market development capacity significantly promote higher levels of coupling coordination.
The remainder of this study is organized as follows: Section 2 presents the literature review; Section 3 focuses on the coupling relationship, analyzing the interaction among the digital economy, carbon emission efficiency, and high-quality economic development; Section 4 explains the research design, including indicator construction, research methods, and data sources; Section 5 presents the results of our analysis of the degree of coupling coordination, focusing on temporal and spatial variations; Section 6 analyzes the driving factors; and lastly, Section 7 presents conclusions and policy implications.
2. Literature Review
The existing literature explores the relationships between the digital economy, carbon emissions efficiency, and high-quality economic development across three dimensions.
(1) Research on the relationship between the digital economy and carbon emissions efficiency examines the unidirectional impact that the digital economy has on carbon emissions efficiency and explores the coupling relationship between the two. Regarding the unidirectional relationship, most studies show that the digital economy can improve carbon emissions efficiency [3,4,5]. Huang et al. (2025) found that the digital economy could promote carbon reduction through industrial coagglomeration and exhibited significant spatial spillover effects [6]. Xia et al. (2025) found that the digital economy primarily exerts a positive influence on carbon emission performance through green technology innovation and optimization of industrial structure [7]. Some scholars have explored this issue from the perspective of policy evaluation. Yu and Hu (2024) and Xiao et al. (2024) treated the “Broadband China” policy as a quasi-natural experiment, using a difference-in-differences model to show that digital infrastructure can improve carbon emissions efficiency [8,9]. In studies on the coupling relationship, some scholars explored the coupling between the digital economy and carbon emissions efficiency in both the agricultural and industrial sectors [10,11]. In addition, Li et al. (2023) used a spatial geography model to analyze the spatiotemporal evolution of the coupling coordination between the digital economy and carbon emissions efficiency, finding that spatial disparities exist in the degree of coupling coordination and that relative differences are the main source of overall variation [12]. Using the technology, organization, and environment framework, Zhou et al. (2023) employed a fuzzy-set qualitative comparative analysis to explore the driving factors behind the coupling coordination between China’s digital economy and carbon emissions efficiency [13].
(2) Research on the relationship between the digital economy and high-quality economic development examines the unidirectional impact that the digital economy has on high-quality economic development and explores the coupling relationship between the two. Regarding the unidirectional relationship, most studies show that the digital economy can empower high-quality economic development by facilitating technological innovation [14], encouraging entrepreneurship [15], enhancing human capital [16], and enabling industrial upgrading [17]. Yang et al. (2024) found that the digital economy promotes the high-quality development of new urbanization in the Yellow River Basin in a nonlinear pattern [18]. Zhang and Li (2024), using static and dynamic spatial Durbin models, showed that the digital economy promotes high-quality development in the marine economy [19]. Similarly, Song et al. (2025) highlighted the digital economy’s role in promoting intelligent and automated agricultural production, which increases labor efficiency and entrepreneurial opportunities in rural areas [20]. Studies on coupling relationships generally indicate an upward trend in coordination between the digital economy and high-quality economic development [21,22]. Liu et al. (2023) observed a steady rise in coordination between the digital and marine economies in China, accompanied by decreasing regional disparities [23], while Liu et al. (2024) found similar upward trends and spatial clustering in the Yangtze River Economic Belt [24]. Other research has extended these findings to sectors such as agriculture [25], manufacturing [26], tourism [27], and construction [28].
(3) In the literature on the relationship between carbon emissions efficiency and high-quality economic development, most studies explore the coupling coordination between the two [29]. Wu et al. (2023), for example, applied a Tobit panel model to assess the spatial–temporal dynamics and influencing factors in the Yangtze River Delta urban agglomeration [30]. Their findings indicated a general upward trend in coordination, but with persistent spatial heterogeneity. Yan et al. (2024) reported that the coupling coordination degree between carbon emissions efficiency and high-quality economic development has improved over time, exhibiting a spatial pattern of “high in the east, low in the west” [31]. Investigating the Yangtze River Delta urban agglomeration, Gong et al. (2024) found that the synchronous resonance between carbon emissions efficiency and high-quality development has become a key driver of low-carbon growth in the region [32]. From the perspective of high-quality development in the financial sector, Shen and Fan (2023) used a spatial kernel density analysis to examine the spatiotemporal evolution of the degree of coupling coordination between carbon emissions efficiency and financial development, finding a spatial correlation between the two when considering spatiotemporal factors [33]. In the tourism sector, Li et al. (2022) identified a parasitic relationship between tourism carbon emissions efficiency and high-quality tourism development [34]. Additionally, based on the extended Environmental Kuznets Curve, Wang et al. (2018) found a significant inverted U-shaped relationship between carbon emissions and economic growth [35]. Xu et al. (2021) argued that the dual goals of carbon peaking and carbon neutrality can serve as catalysts for high-quality economic development [36].
A review of the existing literature indicates that most studies have focused either on unidirectional relationships among the digital economy, carbon emissions efficiency, and high-quality economic development or on the coupling coordination between two of these systems. However, few studies have considered all three systems simultaneously to assess their integrated coupling coordination effects. Moreover, in studies examining two-way couplings, the emphasis has largely been on spatial and temporal evolution, with limited attention on the underlying driving factors. Against this backdrop, our study offers several potential marginal contributions. First, guided by the principle of coupling coordination, we examine the interactive relationship between China’s digital economy, carbon emissions efficiency, and high-quality economic development from a spatiotemporal perspective. Second, recognizing the potential for spatial heterogeneity, we analyze regional disparities in coupling coordination and identify their sources. Third, we employ the Geodetector model to identify the driving factors behind this coordination, aiming to provide actionable insights for advancing digital innovation, quality-oriented growth, and green, low-carbon development.
3. Coupling Relationship
Coupling refers to the dynamic interdependence and mutual influence among multiple systems [37]. According to coupling theory, the digital economy, carbon emissions efficiency, and high-quality economic development represent three relatively autonomous subsystems that interact through inter-system constraints and mutual reinforcement, forming a new coupled symbiotic structure [22].
(1) The digital economy contributes to both enhanced carbon emissions efficiency and high-quality economic development. It reduces market transaction costs and mitigates information asymmetries [38], thereby minimizing resource waste and energy consumption while improving environmental performance [39]. Furthermore, it fosters innovative models such as the sharing and platform economies [40], which optimize resource allocation and eliminate redundant capacity, further boosting carbon emissions efficiency [5]. The digital economy also amplifies the productivity of other factors through digital multipliers, increases total factor productivity, and stimulates high-quality economic growth [14]. In addition, the development of the digital economy effectively promotes the digital transformation of industries [16], enriches its connotation and extension, and expands its development space, thus providing new opportunities and pathways for high-quality economic development [41].
(2) Improvements in carbon emissions efficiency can, in turn, stimulate the digital economy and promote high-quality development. By compelling upgrades in digital technologies and infrastructure, it accelerates both industrial digitalization and digital industrialization [42]. This enhances the sustainability of digital economic development, reduces infrastructure costs, and facilitates broader digital transformation across enterprises [43]. From an economic standpoint, gains in carbon emissions efficiency often yield higher regional economic returns, which in turn support high-quality growth [32]. Additionally, enhanced efficiency in resource utilization addresses ecological deficits associated with extensive, low-efficiency economic models [33], supporting green, low-carbon development and injecting momentum into sustainable production and economic advancement [30].
(3) High-quality economic development not only promotes the digital economy but also enhances carbon emissions efficiency. First, it provides both a material foundation and broader platform for digital economic growth [22], while simultaneously advancing the legal and regulatory frameworks necessary for the development of digital technologies, thereby facilitating the construction of a robust digital economic ecosystem [44]. Additionally, by promoting industrial restructuring, fostering new economic forms and business models, and transforming regional development paradigms, it drives digital economy expansion [45]. Second, high-quality development reflects progress in industrial upgrading, green technological innovation, and the optimization of human capital [30]. These advancements inherently prioritize resource and energy efficiency as well as the development of clean technologies [32]. Through technological innovation and structural optimization, high-quality development promotes coordinated emissions reductions across sectors, supports the decoupling of economic growth from environmental degradation, and ultimately improves carbon emissions efficiency and environmental protection [29].
4. Research Design
4.1. Selection and Construction of Indicators
4.1.1. Digital Economy
Drawing on Ma et al. (2024), we construct a digital economy evaluation system based on three dimensions: digital infrastructure, digital industrialization, and industrial digitalization [46]. Digital infrastructure, as the foundational layer, captures the coverage, usage, and user penetration of basic network services. It includes four indicators: the length of long-distance optical cable lines, the number of mobile phone users, the number of internet users, and the number of internet broadband access ports [47]. Digital industrialization provides the technological backbone for the digital economy, reflecting the market presence of digital products, services, and technologies. It is measured by the number of express delivery transactions, the revenue from software business, and the number of enterprises in the electronic information manufacturing industry [48]. Industrial digitalization reflects the degree to which traditional industries adopt digital technologies, indicating the penetration and depth of digital application. It is assessed using three indicators: rural broadband access users, the number of computers per 100 people, and the number of websites owned by every 100 enterprises [49]. We use the entropy weight method to measure the level of digital economic development based on the above three aspects, using the 10 indicators shown in Table 1.

Table 1.
Evaluation indicator system for the digital economy.
4.1.2. Carbon Emissions Efficiency
Based on existing research [50,51], we select the fixed capital stock, annual electricity consumption, and annual employment in each province as our capital, energy, and labor input factors, respectively. Actual GDP growth based on the year 2000 is the measure of economic activity, and carbon emission is the undesirable output from economic growth. Referring to the studies of Wang et al. (2020), Xu et al. (2023), and Wu et al. (2025), we use the super-efficient SBM model to measure carbon emissions efficiency under the assumption of constant returns to scale (CRS) [52,53,54], which under this assumption is a trade-off for the comprehensive efficiency of carbon emissions [55].
4.1.3. High-Quality Economic Development
Following Wu et al. (2023), we construct a high-quality economic development evaluation system across six dimensions: economic vitality, innovative development, coordinated development, green development, open development, and shared development [30]. Economic vitality emphasizes the quality of growth and factor productivity, assessed through indicators of economic level, economic efficiency, labor efficiency, and capital efficiency [56]. Innovation development is the “engine system” of high-quality growth, measured through innovation input, output, and environment. Innovation input captures the resource allocation capacity of government and market; output reflects the transformation of innovation into achievements, intellectual property production, and scientific competitiveness; and the environment measures the reserve of innovative talent [57]. Coordinated development functions as a “balancing system,” assessed through urban–rural integration, industrial upgrading, and domestic demand stimulation. Urban–rural coordination gauges integrated development, industrial coordination reflects structural transformation, and demand coordination captures the driving force of internal consumption [58]. Green development represents the “constraint system” focused on ecological preservation, measured by environmental pollution and governance. Pollution reflects environmental cost per unit of output, while governance evaluates governmental investment willingness and pollution control efforts [59]. Open development acts as the “linking system” for global integration, assessed via international tourism and trade openness. Tourism reflects market openness and cultural soft power; trade openness indicates economic external orientation [60]. Shared development is the “social system” emphasizing equity and inclusiveness, measured through living security and public services. The former indicates the level of social protection, while the latter reflects access to basic public services [61]. We use the entropy weight method to measure the level of high-quality economic development based on the above six aspects, using the 33 indicators shown in Table 2.
Table 2.
Evaluation indicator system for the high-quality economic development.
4.2. Research Method
4.2.1. Entropy Weight Method
(1) Data standardization. To eliminate the impact of dimensional differences and ensure data comparability, we standardize the original indicator data used to measure the digital economy and high-quality economic development. Selecting n regions and m indicators, the standardization formula is as follows:
(2) Comprehensive index measurement. We use the entropy weight method to separately calculate the weights ωaj and ωbj for each indicator in the two systems for the digital economy and high-quality economic development [62], thereby obtaining the comprehensive index Ki for these systems. The formula is as follows:
4.2.2. Super-Efficiency SBM Model
The super-efficiency SBM model is a derivative model based on data envelopment analysis (DEA) [63]. In traditional DEA models, while all outputs are expected to increase in practice, some may involve costs or other undesirable effects that an organization or system wants to minimize. The super-efficiency SBM model for such undesired outputs measures the deviation of decision-making units (DMUs) in terms of various inputs and outputs through slack variables and allows penalty factors to be specified for undesired outputs so that the model not only maximizes expected outputs but also minimizes undesired outputs. Compared to traditional DEA models, this approach not only avoids biases caused by radial and angular measurements but also considers the impact of undesired output factors. It can also distinguish subtle differences between multiple DMUs with efficiency values of 1, compare and rank DMU efficiency values, and provide more accurate efficiency evaluations that reflect the essence of efficiency evaluations. The model is given as follows:
Here, ρ is the carbon emissions efficiency value, n is the DMU, and xia, yqad, and ysab are the i-th input factor, the q-th expected output, and the s-th undesired output of the a-th province, respectively. m, u1, and u2 represent the number of these input and output factors, respectively, and θ is the weight vector.
4.2.3. Coupling Coordination Degree Model
To explore the interaction between the three systems, we use the coupling coordination degree model to measure and analyze the coupling coordination relationship among the three systems in 30 provinces in China from 2000 to 2023 [29]. The model expression is
where η1, η2, and η3 represent the digital economy system, the carbon emissions efficiency system, and the high-quality economic development system, respectively; C is the coupling degree of the three systems; T is the comprehensive coordination index; D is the degree of coupling coordination; α, β, and γ are the contribution shares of the three systems, namely the digital economy, carbon emissions efficiency, and high-quality economic development, respectively. Considering the equal importance of the three systems, we set α = β = γ = 1/3. Based on relevant studies [33], we classify the coupling coordination degree D as shown in Table 3.
Table 3.
Classification standard for coupling coordination degree.
4.2.4. Kernel Density Estimation
Kernel density estimation (KDE) is a non-parametric statistical method used to estimate the probability density function of random variables. With this method, it is possible to describe the overall distribution pattern of the degree of coupling coordination among three systems and estimate their dynamic distribution characteristics over time [64]. The model expression is
where N is the number of observations, h is the bandwidth, which determines the width and smoothness of the kernel function, x is the mean value, and K is a kernel function. Common kernel functions include the uniform kernel, quadratic kernel, Gaussian kernel, triangular kernel, and gamma kernel, among others. We use the Gaussian kernel function for our estimation, given by
4.2.5. Dagum Gini Coefficient
Using the Dagum Gini coefficient method of measuring regional income inequality, we analyze the spatial differences in the degree of coupling coordination among the three systems and their sources. This method can address the overlapping phenomenon that exists in survey data and decomposes overall differences into regional contribution differences, inter-regional contribution differences, and hypervariable density contributions, thereby more accurately identifying the source of overall regional differences [65]. The model expression is
where G is the overall difference, Gw is the regional difference, Gnb is the inter-regional difference, Gt is the density of hyper variation, Gaa is the Gini coefficient for region a; Gab is the Gini coefficient between regions a and b, n is the number of provinces, and q is the number of regions. Following the classification set by the National Bureau of Statistics of China, we divide the 30 provinces into four regions: Eastern, Central, Western, and Northeastern China. na and nb are the number of provinces in regions a and b, respectively, yac and ybd are the degree of three-system coupling coordination of any province in regions a and b, respectively, ȳ is the average value of the coupling coordination degree among the three systems, Mab is the difference in the degree of coupling coordination between regions, representing the absolute impact of the coupling coordination degree for regions a and b, which is the mathematical expectation of the sum of all sample values that satisfy yac − ybd > 0 for regions a and b, Nab is the first-order moment of the hypervariable, which is the mathematical expectation of all sample values that satisfy yac − ybd < 0, and functions Fa and Fb represent the cumulative density distribution functions of regions a and b, respectively.
4.2.6. Spatial Autocorrelation Model
Based on the First Law of Geography, we use global Moran’s I to examine the spatial correlation of the coupling coordination degree. The model is as follows:
Here, GMoran’s is the global Moran’s I index, n is the number of samples, xi and xj are the sample observations of province i and province j, respectively, is the sample mean, s2 is the sample variance, ωij is the spatial weight matrix, and the value range of the Moran index is [−1, 1]. If the Moran index is greater than 0, it indicates a positive spatial autocorrelation in the coupling coordination degree among three systems, whereas a Moran index value less than 0 indicates a negative spatial autocorrelation in the coupling coordination degree, and a Moran index value of 0 indicates that the coupling coordination degree is randomly distributed.
To more accurately account for spatial effects, we construct an economic–geographic nested weight matrix that captures both geographic proximity and economic differentiation [66]. Drawing on existing studies [67,68], the matrix is formulated by multiplying the inverse distance matrix with a diagonal matrix reflecting the average per capita GDP of each region. This integrated approach enhances the precision of analyzing spatial correlations in the coupling coordination degree. To ensure the robustness of our findings, we also employ the inverse distance matrix for comparison. The expression for calculating the weights is as follows:
where ω1 is the economic geography nested weight matrix, ω2 is the inverse distance weight matrix, i and j represent two different provinces, d is the straight-line distance between the capital city of province i and that of province j, is the average per capita GDP of province i from 2000 to 2023, and is the average value of total per capita GDP in 30 provinces from 2000 to 2023.
4.2.7. GeoDetector
GeoDetector can effectively overcome the limitations of traditional statistical analysis methods in handling categorical variables and can also reveal the interactive effects of two factors on a dependent variable [69]. Therefore, drawing on existing studies [70,71], we employ GeoDetector to investigate the driving factors behind the coupling coordination degree. The model is as follows:
Here, q is the influence coefficient of the driving factor; h = 1, …, L is the strata of the independent variable; Nh and N are the number of samples in stratum h and in the entire region, respectively; σh2 and σ2 are the variance of the dependent variable within stratum h and across the entire region, respectively; and the q-value ranges from 0 to 1, with larger values indicating a stronger explanatory power of the driving factor.
4.3. Data Description and Source
To ensure data completeness, we select 30 provinces in China (excluding Hong Kong, Macao, Taiwan, and Xizang) from 2000 to 2023 as our research sample. The data are sourced from the China Statistical Yearbook on Science and Technology, China Statistical Yearbook, China Environmental Statistical Yearbook, China Energy Statistical Yearbook, the CSMAR database, the CNRDS database, and various provincial statistical yearbooks. Missing data are supplemented via linear interpolation.
5. Analysis of Spatiotemporal Evolution Characteristics
5.1. Index Analysis
As shown in Figure 1, from 2000 to 2023, the levels of the digital economy and high-quality economic development in China’s 30 provinces show a gradual upward trend. The level of high-quality economic development is higher than that of the digital economy over this period. Specifically, the level of the digital economy increased from 0.018 in 2000 to 0.221 in 2023, while the level of high-quality economic development rose from 0.160 in 2000 to 0.421 in 2023. Carbon emissions efficiency showed a downward trend from 2000 to 2012 and an upward trend from 2012 to 2023. The possible explanation for this pattern is that in the early stage of economic development, the level of technology was low, and the industrial structure tended towards heavy industry with high energy consumption, high pollution, and high emissions, with relatively high carbon emissions per unit of output, and thus low carbon emissions efficiency. However, with sustained economic growth, continuous technological progress, and upgrades to China’s industrial structure, the economy shifted from heavy industry and manufacturing toward service and high-tech industries, which are less carbon intensive. At the same time, energy efficiency has been continuously improving, clean and renewable energies have come into widespread use, and carbon emissions intensity has gradually decreased [72]. In addition, the Chinese government has also intensified environmental protection efforts, introducing numerous policies and regulations aimed at reducing emissions and fostering green development. Notable examples include the 12th Five-Year Plan for Energy Conservation and Emission Reduction issued by the State Council in 2012 and the Air Pollution Prevention and Control Action Plan launched in 2013. According to the Environmental Kuznets Curve, pollution levels rise during early industrialization but decline as per capita GDP continues to grow in the post-industrial stage [73]. The observed trend of carbon emissions efficiency—initially decreasing and later improving—aligns with this economic principle.

Figure 1.
Digital economy, carbon emissions efficiency, and high-quality development indices.
5.2. Analysis of the Spatiotemporal Evolution of Coupling Coordination
5.2.1. Temporal Changes
Based on the formula for the coupling coordination degree model, the average degree of coupling coordination among our three systems over the study period is shown in Figure 2.
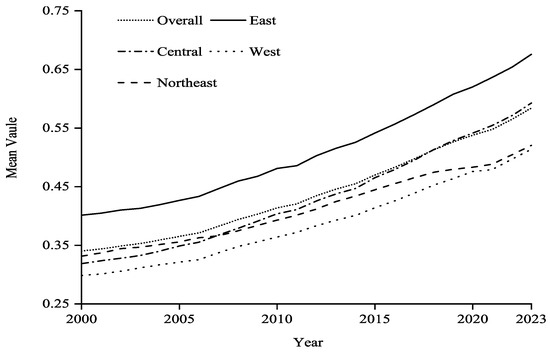
Figure 2.
Average coupling coordination degree.
Overall, the coupling coordination degree in China increased steadily over the study period, and the type of coupling coordination shifted from a disordered decline to transitional development. However, the level of coupling coordination for China remained relatively low. During the sub-periods from 2000 to 2008 and 2009–2017, coordination levels were classified as slightly unbalanced and on the verge of imbalance, respectively. From 2018 to 2023, the national coupling coordination level improved from being on the verge of imbalance to being barely coordinated. The average annual growth rate of the coupling coordination degree was 2.17% during 2000–2015, 2.88% during 2015–2019, and 2.64% during 2019–2023. A pivotal moment occurred in 2015 when the Chinese Government first incorporated the “Internet Plus” strategy into its work report and issued the Guiding Opinions of the State Council on Actively Promoting the ‘Internet Plus’ Action. This marked a clear governmental commitment to digital transformation and served as a key inflection point for the rapid rise in coupling coordination. However, the COVID-19 pandemic constrained the real economy and hindered high-quality economic development. Simultaneously, it catalyzed a surge in digital applications such as remote work, e-commerce, and telemedicine, accelerating the digital economy’s growth [42]. Moreover, the announcement of China’s “carbon peaking and carbon neutrality” goals in 2020 elevated the strategic importance of low-carbon development. As a result, despite a slight decline in the post-2019 growth rate of the coupling coordination degree, it has continued to grow at a relatively rapid pace.
From a regional perspective, all four major regions in China show an upward trend in the degree of coupling coordination over the period studied. The Eastern region, benefiting from its location-driven advantages, has developed a relatively well-established digital economy-based industrial chain that has injected new momentum into high-quality economic development. By actively responding to the national priorities of innovation-driven and green development, the Eastern region has achieved the highest level of coupling coordination. The Western region has a relatively narrow industrial structure, lags infrastructure development, and has limited resources and energy supplies [74]. As a result, it relies heavily on traditional energy industries, leading to the lowest level of coupling coordination. From 2000 to 2006, the Northeastern region had a higher degree of coupling coordination than the Central region; however, from 2007 to 2023 the Central region surpassed the Northeast in this regard. In the early stages of the study period, the Northeast, with its traditional industrial base, had a relatively well-developed industrial system and infrastructure. That created favorable conditions for the digital economy to develop, resulting in a higher degree of coupling coordination than the Central region. However, the growth of heavy industries in the Northeast led to a decline in carbon emissions efficiency. Meanwhile, the steady advancement of the Central China Rising Strategy contributed to the Central region’s improved performance, causing its coupling coordination degree to exceed that of the Northeast.
In terms of the types and levels of coupling coordination, the Eastern region is in the transitional development stage, and its level of coordination increased from “on the verge of imbalance” during the period 2000–2011 to “barely coordinated” from 2012 to 2018 to “primary coordination” in 2018–2023. For the Western, Central, and Northeastern regions, coupling coordination transitioned from “disordered decline” to “transitional development” during the study period. The Western region’s coordination level shifted from “moderately unbalanced” in 2000 to “slightly unbalanced” in 2001–2013, then to “on the verge of imbalance” in 2014–2022, and finally to “barely coordinated” in 2023. The Central region’s coordination level improved from “slightly unbalanced” in 2000–2009 to “on the verge of imbalance” in 2010–2017 and then to “barely coordinated” in 2018–2023. The Northeastern region’s coordination level changed from “slightly unbalanced” in 2000–2010 to “on the verge of imbalance” in 2011–2021 and finally to “barely coordinated” in 2022.
5.2.2. Spatial Distribution Characteristics
(1) Overall kernel density analysis. To gain deeper insights into the dynamic distribution characteristics of the degree of coupling coordination among China’s digital economy, carbon emissions efficiency, and high-quality economic development and analyze its evolution over time, we use the Gaussian kernel function to depict the kernel density estimation curves of the coupling coordination degree for the years 2000, 2005, 2010, 2015, and 2023 (Figure 3).
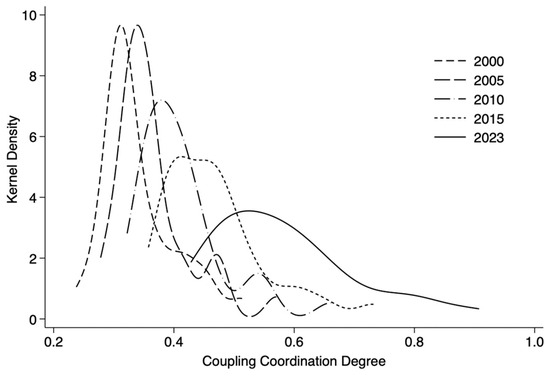
Figure 3.
Kernel density estimation of the coupling coordination degree in China.
First, we can see that the peak of the coupling coordination degree shifts to the right, indicating a continuous increase in the overall level of coordination. Second, we note the peak height gradually decreases while the width of the kernel density curve increases, suggesting that the degree of disparity in coupling coordination is expanding, with a trend toward greater absolute differences. Third, in terms of the number of peaks, two peaks appear in 2005 and 2010, indicating polarization in coupling coordination, with significant fluctuations and disparities. This highlights the need to address spatial imbalance. In contrast, the curves for 2015 and 2023 are unimodal, suggesting that the polarization trend has weakened and spatial imbalance has been alleviated. This is mainly because China’s 13th Five-Year Plan emphasizes optimizing regional development through initiatives such as Western Development, Northeast Revitalization, and the Rise of Central China. These strategies aim to promote integrated, balanced, and inclusive regional growth while reducing development disparities. Finally, looking at the fluctuations in the right tail of the curve, we see the right tail of the kernel density curve gradually extends, indicating an increasing spread in distribution.
(2) Regional kernel density analysis. The kernel density estimation results of the coupling coordination degree for the Eastern region are shown in Figure 4a. The kernel density curve displays a unimodal distribution with no tailing, with the main peak shifting to the right, indicating a continuous rise in the coupling coordination level. The decreasing height and increasing width of the main peak suggest a widening trend in absolute differences within the Eastern region. Figure 4b shows that the main peak in the Central region also shifts to the right, reflecting an overall improvement in the coupling coordination level. The peak height exhibits a fluctuating “increase–decrease” pattern, indicating that while the absolute differences in coupling coordination narrowed in 2005 and 2015, overall, they show a widening trend. Figure 4c presents the results for the Western region. The main peak shifts to the right, indicating a rising coupling coordination level. Although the peak height increases slightly in 2005, it then declines, accompanied by an increase in curve width, suggesting greater absolute differences in coupling coordination. As seen in Figure 4d, the kernel density curve for the Northeastern region shows a unimodal distribution without tailing. The main peak shifts to the right, indicating a continuous rise in coupling coordination levels. While the overall peak height declines, it rises in 2023, indicating that although absolute differences have generally increased in the Northeast, there are signs of narrowing in the most recent period.
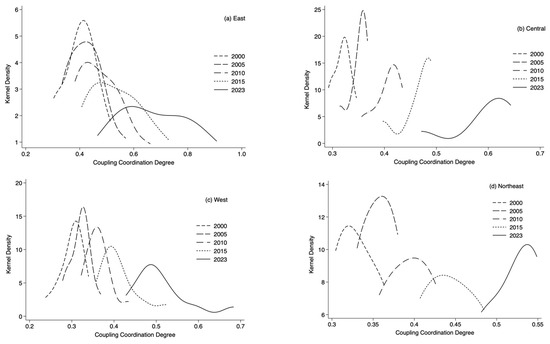
Figure 4.
Kernel density estimation of coupling coordination degree in the four major regions.
5.2.3. Spatial Difference Decomposition
Here, we use the Dagum Gini coefficient model to further explore spatial differences in the degree of coupling coordination and their sources (Table 4).
Table 4.
Gini coefficients of coupling coordination degree.
First, in terms of overall differences, the spatial disparity in the degree of coupling coordination fluctuates from 2000 to 2023, rising from 0.094 in 2000 to 0.108 in 2023, an increase of 14.9%. This indicates a significant level of regional imbalance or heterogeneity in coupling coordination. Second, regarding intra-regional differences, we see that the Gini coefficient within the Eastern region continued to rise over the study period, while the Central and Western regions’ Gini coefficients declined and then rose. Results for the Northeastern region show a “decline–rise–decline” pattern. The increases in the Eastern, Central, and Western regions were 26.1%, 66.7%, and 38.0%, respectively, whereas the Northeastern region’s Gini coefficient decreased by 25.6% from 2000 to 2023. This highlights the need to continuously promote coordinated regional development strategies. Third, in terms of inter-regional differences, the largest disparity was observed between the East and West (average value of 0.144), while the smallest was between the Central and Northeast regions (average value of 0.047). Fourth, regarding the sources of spatial differences and their contributions, we find inter-regional differences to be the primary contributor (average contribution of 68.517%), indicating that most of the spatial disparities in coupling coordination can be explained by differences between regions. This is followed by intra-regional differences (average of 21.594%), and finally by hypervariable density (average of 9.889%). The combined contribution of intra-regional differences and hypervariable density is less than half that of inter-regional differences, suggesting that the latter two are not the core drivers of spatial disparities in coupling coordination. The main reasons are as follows: (1) Resource endowment disparities: Structural differences in natural, economic, and infrastructural resources are the fundamental cause of regional variations in coordination. (2) Governance quality: The Eastern region benefits from stronger institutional frameworks, stricter environmental regulation, and more effective policy implementation. In contrast, other regions often lack the administrative capacity and enforcement mechanism. (3) Fiscal investment intensity: Public investment is a crucial driver of both digital transformation and low-carbon development. Economically advanced Eastern provinces, with higher fiscal revenues, are better equipped to support environmental governance and digital infrastructure. Meanwhile, limited fiscal capacity in other regions hinders progress and exacerbates regional disparities. Therefore, to effectively address spatial imbalances among the digital economy, carbon emissions efficiency, and high-quality economic development, efforts should focus on narrowing regional disparities through targeted strategies and coordinated development policies.
5.2.4. Spatial Association Characteristics
Using the global Moran’s I value, we explore the overall spatial correlation of the degree of coupling coordination for China’s digital economy, carbon emissions efficiency, and high-quality economic development (Table 5). During the study period, global Moran’s I is positive under both the economic–geographic nested weight matrix (ω1) and the inverse distance weight matrix (ω2), and all values pass the 10% significance test. This indicates a positive spatial autocorrelation in the coupling coordination degree, meaning that similar attribute values tend to cluster together. In terms of global Moran’s I, both types of spatial weight matrices show a fluctuating downward trend, with the values under the ω1 weight matrix generally higher than those under the ω2 matrix.
Table 5.
Global Moran’s I of coupling coordination degree.
6. Driving Factors of Coupling Coordination
6.1. Selection of Driving Factors
In this section, we analyze the key factors driving changes in the degree of coupling coordination from both internal and external perspectives.
From an internal perspective, the level of economic development (X1) serves as an important foundation for the digital economy and high-quality economic growth. It also maintains a stable inverted U-shaped relationship with carbon emissions over the long term. Human capital (X2) is both an input and an output of the digital economy [75], and its dynamic accumulation has a positive and sustained growth effect that promotes reductions in carbon emissions. Upgrading the industrial structure (X3) can promote “soft” rather than “hard” industries and enhance green total factor productivity, thereby accelerating the process of achieving high-quality economic development [76]. Moreover, adjusting the industrial structure can optimize resource allocation and improve resource utilization efficiency, generating a “structural dividend” effect on carbon emissions efficiency [77].
From the external perspective, green technological innovation (X4) provides new momentum for the development of the digital economy and, through its “technological dividend” effect, helps improve carbon emissions efficiency and promotes high-quality economic development by enhancing energy conservation and emissions reduction [78]. Second, considering the market development degree (X5), a highly developed market typically features more sound and mature market mechanisms and a more effective competitive environment, which not only enhances resource allocation efficiency and drives the transition of economic growth toward higher quality [79] but also promotes the application and innovation of digital technologies, thereby advancing the development of the digital economy. Moreover, in a highly developed market, the “agglomeration effect” outweighs the “congestion effect” [80], encouraging businesses and consumers to place greater emphasis on environmental protection and low-carbon development, thus steering the economy toward a more environmentally friendly and sustainable path. Therefore, we propose Hypothesis 1.
Hypothesis 1.
The level of economic development, human capital, industrial structure upgrading, green technological innovation, and market development degree can promote the coupling development of digital economy, carbon emissions efficiency, and high-quality economic development.
Specifically, the level of economic development (X1) is measured by the logarithm of per capita GDP; human capital (X2) is measured by the number of students enrolled in regular higher education institutions; industrial structure upgrading (X3) is measured by the ratio of the added value of the tertiary industry to that of the secondary industry; green technological innovation (X4), following the study by Wurlod and Noailly (2018), is measured by the number of green invention patent applications [81]; and the market development degree (X5), following the methodology of Zhao et al. (2019), is measured by collecting the total marketization index from the “China Marketization Index Report by Fan Gang” for the period from 2000 to 2023 [82].
6.2. Analysis of Driving Factors
Following the approach of Xu and Ci (2023) [42], we discretized the driving factors using the natural breakpoint method and input them into the GeoDetector model to calculate their q-values for the years 2000, 2005, 2010, 2015, and 2023 (Table 6). All q-values passed the 1% significance test, indicating that each factor contributes positively to the coupling coordination among the digital economy, carbon emissions efficiency, and high-quality economic development, thereby supporting Hypothesis 1. On average, the influence of each driving factor over the study period ranked as follows: green technological innovation (0.716) > market development degree (0.708) > the level of economic development (0.639) > human capital (0.507) > industrial structure upgrading (0.336). Although their relative influence varied over time, green technological innovation and market development degree emerged as the most significant drivers.
Table 6.
Single-factor detection results.
Specifically, the driving force of the level of economic development declined from 0.737 in 2000 to 0.456 in 2023, reflecting China’s transition from a growth model centered on speed to one emphasizing quality. Consequently, the marginal contribution of traditional economic expansion to system coupling coordination has diminished. The influence of human capital increased from 0.406 to 0.569 during the same period, underscoring the digital economy’s growing reliance on high-skilled labor, particularly in fields such as ICT, data analytics, and artificial intelligence. The contribution of industrial structure upgrading rose modestly from 0.248 to 0.315, driven by the growth of services, digital sectors, and clean energy industries that support the shift toward greener, more efficient production models. Green technological innovation exhibited the most significant increase, from 0.371 in 2000 to 0.882 in 2023, as it not only enhances carbon emissions efficiency but also enables the transformation of traditional industries and promotes digital production, thereby establishing a multidimensional coupling mechanism. Market development degree increased from 0.703 to 0.779, largely due to institutional reforms such as “streamlining administration, delegating power, and improving services,” which strengthened market mechanisms as a key force for high-quality development.
Based on Zhang et al. (2023) [83], we further examined interactions among the driving factors by averaging their values for 2000, 2005, 2010, 2015, and 2023 and inputting them into GeoDetector (Table 7). Overall, the interactions between all driving factors exhibit a two-factor enhancement effect, suggesting that the interaction of the drivers can produce a stronger driving force than any factor by itself. For instance, although industrial structure upgrading has limited influence when assessed alone, it becomes a strong driver when combined with other factors. This indicates that the coupling coordination among the digital economy, carbon emissions efficiency, and high-quality economic development results from the synergistic interaction of multiple drivers.
Table 7.
Interaction factor detection results.
7. Conclusions and Implications
7.1. Conclusions
We use spatiotemporal geography models and a geographical detector to explore the spatiotemporal evolution characteristics and driving factors of the degree of coupling coordination among the digital economy, carbon emissions efficiency, and high-quality economic development across 30 provinces in China from 2000 to 2023. Our conclusions are as follows:
(1) The index levels for the three systems show both the digital economy and high-quality economic development gradually trending upward during the study period, although their overall levels remain relatively low. Carbon emissions efficiency exhibits a “U-shaped” curve pattern.
(2) Regarding coupling coordination among the three systems, at the national level, the degree of coupling coordination evolved from “mild disorder” to “on the verge of disorder” to “barely coordinated” over the study period. At the regional level, coupling coordination evolved from “Eastern–Northeastern–Central–Western” to “Eastern–Central–Northeastern–Western”, in descending order. Spatially, both absolute and overall disparities in the degree coupling coordination across China and its four major regions expanded over the study period, with interregional differences being the main source of the overall disparities. The degree of coupling coordination shows a positive spatial correlation, although this correlation also shows a downward trend.
(3) In terms of driving factors, improvements in the level of economic development, human capital, industrial structure, green technological innovation, and market development capacity all contribute positively to coupling coordination. Among them, green technological innovation and market development capacity are the most influential drivers, and the interactions among all driving factors further enhance their collective impact.
7.2. Implications
In view of the above findings, we propose the following recommendations:
(1) Internal resources among the three systems should be optimally allocated to enhance their individual development levels, thereby improving the overall degree of coupling coordination. New types of computing infrastructure should be developed, implementing the “Data Elements ×” action plan, cultivating new drivers for the digital economy. The new development philosophy of “innovation, coordination, green development, openness, and sharing” should be thoroughly implemented to accelerate development of new, high-quality productive forces, promote industrial innovation through technological innovation, and transform scientific and technological achievements into real productive forces to increase the vitality of high-quality economic development; accelerate the cultivation and expansion of green and low-carbon industries; and build a green, low-carbon, circular economic system.
(2) Differentiated regional development policies should be implemented to optimize regional development. Cross-regional cooperation and exchanges should be strengthened to promote the flow of resources, technology, and talent across regions, narrow regional development gaps, and achieve resource sharing and complementary advantages among regions. The Eastern region should facilitate the orderly transfer of industries to the Central, Western, And Northeastern regions to promote interregional industrial synergy. The Central region should optimize its industrial layout while undertaking transfers, promote data sharing, and enhance ecological coordination across urban agglomerations. The Western region should boost investment in digital infrastructure and green energy projects and implement talent attraction and training initiatives. The Northeastern region should leverage its industrial foundation to transform traditional manufacturing bases into green and intelligent manufacturing hubs.
(3) Policymakers should emphasize top-level design optimization, stronger policy coordination, and integrated actions. Accelerating the optimization and upgrading of industrial structures to fully unleash the contribution capacity of economic development and industrial structure would increase coupling coordination while enhancing economic strength. At the same time, the government should deepen the comprehensive reform of education technology talents, increase investment in education research, vigorously develop digital education, and strengthen the employment promotion services for college graduates. In addition, enterprises should be encouraged to invest in green technological innovation to guide industries toward high-value-added and low-carbon development. Finally, policies should support deepening the reform of market-oriented allocation of production factors to promote the rational cross-regional flow and optimal allocation of various productive elements and advancing the construction of a unified national market.
7.3. Limitations and Future Research
Limitations of this paper: First, although the indicator system is constructed based on the connotations of the digital economy, low-carbon development, and high-quality development, it is still not comprehensive enough due to data availability. Second, the range of driving factors influencing the coupling coordination among the digital economy, carbon emissions efficiency, and high-quality economic development requires further expansion. Third, our analysis is confined to the provincial level and does not investigate the coupling coordination relationships among the three systems at the prefecture-level city scale. Therefore, in the future, we will further strengthen our team’s research capacity to improve the comprehensive evaluation index system for the digital economy, carbon emissions efficiency, and high-quality development, expand the analysis of driving factors, and explore the coupling coordination relationships among the three systems at the prefecture level.
Author Contributions
Conceptualization, F.L.; methodology, F.L.; software, F.L.; writing—original draft, F.L.; formal analysis, F.C.; supervision, F.C. All authors have read and agreed to the published version of the manuscript.
Funding
This research was funded by the Shandong Provincial Social Science Planning Research Key Project, grant number 23BJJJ09.
Institutional Review Board Statement
Not applicable.
Informed Consent Statement
Not applicable.
Data Availability Statement
The data presented in this study are available on request from the corresponding author. The data are not publicly available because research is ongoing.
Conflicts of Interest
The authors declare no conflicts of interest.
References
- Feng, L.; Yang, W.; Wang, Z.; Fan, X. Digital economy and urban carbon emission intensity in China: Spatio-temporal evolution and mechanisms. China Popul. Resour. Environ. 2023, 33, 150–160. [Google Scholar]
- Gao, P.; Yue, S.; Chen, H. Carbon emission efficiency of China’s industry sectors: From the perspective of embodied carbon emissions. J. Clean. Prod. 2021, 283, 124655. [Google Scholar] [CrossRef]
- Han, J.; Jiang, T. Does the development of the digital economy improve carbon emission efficiency? Front. Ecol. Evol. 2022, 10, 1031722. [Google Scholar] [CrossRef]
- Wang, J.; Dong, K.; Sha, Y.; Yan, C. Envisaging the carbon emissions efficiency of digitalization: The case of the internet economy for China. Technol. Forecast. Soc. Change 2022, 184, 121965. [Google Scholar] [CrossRef]
- Liu, X.; Chen, L.; Lu, Y.; Chang, M.; Xiao, L.; Yang, H.; Kong, D.; Zhang, L. Research on the impact of the digital economy on carbon emissions based on the dual perspectives of carbon emission reduction and carbon efficiency. Sci. Rep. 2025, 15, 3416. [Google Scholar] [CrossRef] [PubMed]
- Huang, J.; Zheng, B.; Du, M. How digital economy mitigates urban carbon emissions: The green facilitative power of industrial coagglomeration. Appl. Econ. 2025, 1–19. [Google Scholar] [CrossRef]
- Xia, W.; Ruan, Z.; Ma, S.; Zhao, J.; Yan, J. Can the digital economy enhance carbon emission efficiency? Evidence from 269 cities in China. Int. Rev. Econ. Financ. 2025, 97, 103815. [Google Scholar] [CrossRef]
- Yu, J.; Hu, W. The impact of digital infrastructure construction on carbon emission efficiency: Considering the role of central cities. J. Clean. Prod. 2024, 448, 141687. [Google Scholar] [CrossRef]
- Xiao, X.; Liu, C.; Li, S. How the digital infrastructure construction affects urban carbon emissions—A quasi-natural experiment from the “Broadband China” policy. Sci. Total Environ. 2024, 912, 169284. [Google Scholar] [CrossRef]
- Wang, H.; Wu, Y.; Zhu, N. Measurement and spatio-temporal heterogeneity analysis of coupling coordination between development of digital economy and agricultural carbon emission performance. PLoS ONE 2024, 19, e0305231. [Google Scholar] [CrossRef]
- Xia, R.; Wei, D.; Jiang, H.; Ding, Y.; Luo, X.; Zhang, B.; Yin, J. Study on the coupling coordination development of China’s multidimensional digital economy and industrial carbon emission efficiency. Environ. Sci. Pollut. Res. 2023, 30, 114201–114221. [Google Scholar] [CrossRef]
- Li, Y.; Lin, Y.; Zhu, J.; Yang, K. Dynamic coupling coordination and spatial–temporal analysis of digital economy and carbon environment governance from provinces in China. Ecol. Indic. 2023, 156, 111091. [Google Scholar]
- Zhou, L.; Chen, X.; Mi, Y.; Yang, G. Coupling coordination evaluation and driving path of digital economy and carbon emission efficiency in China: A fuzzy-set qualitative comparative analysis based on 30 provinces. PLoS ONE 2023, 18, e0287819. [Google Scholar]
- Ding, C.; Liu, C.; Zheng, C.; Li, F. Digital economy, technological innovation and high-quality economic development: Based on spatial effect and mediation effect. Sustainability 2021, 14, 216. [Google Scholar] [CrossRef]
- Chen, W.; Du, X.; Lan, W.; Wu, W.; Zhao, M. How can digital economy development empower high-quality economic development? Technol. Econ. Dev. Econ. 2023, 29, 1168–1194. [Google Scholar] [CrossRef]
- Guo, B.; Wang, Y.; Zhang, H.; Liang, C.; Feng, Y.; Hu, F. Impact of the digital economy on high-quality urban economic development: Evidence from Chinese cities. Econ. Model. 2023, 120, 106194. [Google Scholar] [CrossRef]
- Ma, D.; Zhu, Q. Innovation in emerging economies: Research on the digital economy driving high-quality green development. J. Bus. Res. 2022, 145, 801–813. [Google Scholar] [CrossRef]
- Yang, P.; Zhang, Y.; Yin, Y. Research Investigating the Influence of the Digital Economy on the High-Quality Advancement of New Urbanization in the Yellow River Basin. Sustainability 2024, 16, 5887. [Google Scholar] [CrossRef]
- Zhang, Y.; Li, X. Digital Economy, Marine Industrial Structure Upgrading, and the High-Quality Development of Marine Economy Based on the Static and Dynamic Spatial Durbin Model. Sustainability 2024, 16, 9677. [Google Scholar] [CrossRef]
- Song, Y.; Zhang, R.; Hao, Y. Digital economy, labor force transfer, and high-quality agricultural development. Financ. Res. Lett. 2025, 74, 106692. [Google Scholar] [CrossRef]
- Liu, L.; Gu, T.; Wang, H. The coupling coordination between digital economy and industrial green high-quality development: Spatio-temporal characteristics, differences and convergence. Sustainability 2022, 14, 16260. [Google Scholar] [CrossRef]
- Shen, W.; Xia, W.; Li, S. Dynamic coupling trajectory and spatial-temporal characteristics of high-quality economic development and the digital economy. Sustainability 2022, 14, 4543. [Google Scholar] [CrossRef]
- Liu, Y.; Jiang, Y.; Pei, Z.; Xia, N.; Wang, A. Evolution of the coupling coordination between the marine economy and digital economy. Sustainability 2023, 15, 5600. [Google Scholar] [CrossRef]
- Liu, L.; Wang, H.; Wang, Z.; Ding, T.; Wu, M. The Coupling Coordination between Digital Economy and Green High-Quality Development of Industries in China’s the Yangtze River Economic Belt. Pol. J. Environ. Stud. 2024, 33, 3799–3812. [Google Scholar] [CrossRef]
- Wang, X.; Wang, R.; Li, H.; Qiao, M.; Li, Y. A study on the coupling coordination of China’s digital economy and high-quality development of rural industries and its influencing factors: From the perspective of knowledge economy theory. J. Knowl. Econ. 2025, 1–30. [Google Scholar] [CrossRef]
- Yan, P.; Zhou, W.; Wang, R.; Jin, H. Spatial-temporal evolution and influencing factors of the coupling coordination of digital economy and high-quality development of manufacturing industry in the Yangtze River delta urban agglomeration. Econ. Geogr. 2024, 44, 87–95. [Google Scholar]
- Ye, X.; Wang, J.; Sun, R. The coupling and coordination relationship of the digital economy and tourism industry from the perspective of industrial integration. Eur. J. Innov. Manag. 2024, 27, 1182–1205. [Google Scholar] [CrossRef]
- Bai, W.; Wang, J.; Yu, X. Spatiotemporal characteristics and obstacle factors of coupling coordination degree between the digital economy and the high-quality development of the construction industry: Evidence from China. Eng. Constr. Archit. Manag. 2025. [Google Scholar] [CrossRef]
- Ding, X.; Wu, Q.; Liu, X.; Tan, L.; Wang, J. Coupling and coordination degree of land use, high-quality economic development, and carbon emissions and influencing factors in China: An empirical study of 282 prefecture-level cities. Resour. Sci. 2022, 44, 2233–2246. [Google Scholar] [CrossRef]
- Wu, X.; Guan, W.; Zhang, H.; Wu, L. Spatio-temporal coupling characteristics and driving factors of carbon emission efficiency and high-quality development in Yangtze River delta urban agglomeration. Resour. Environ. Yangtze Basin 2023, 32, 2273–2284. [Google Scholar]
- Yan, M.; Zhao, J.; Yan, M.; Wang, L.; Zhou, S.; Zhang, M. Coupling coordination relationship between high-quality economic development and carbon emission performance in China: Degree measurement, spatio-temporal evolution, and driving factors. Environ. Dev. Sustain. 2024, 1–21. [Google Scholar] [CrossRef]
- Gong, Y.; Zhang, Y.; Luo, T. Coupling coordination between carbon emission efficiency and high-quality economic development in the Yangtze River delta urban agglomeration. Resour. Environ. Yangtze Basin 2025, 34, 295–308. [Google Scholar]
- Shen, L.; Fan, W. Spatio-temporal coupling coordination between carbon emission efficiency and financial industry high-quality development in China. China Popul. Resour. Environ. 2023, 33, 13–26. [Google Scholar]
- Li, S.; Cheng, Z.; Tong, Y.; He, B. The interaction mechanism of tourism carbon emission efficiency and tourism economy high-quality development in the Yellow River Basin. Energies 2022, 15, 6975. [Google Scholar] [CrossRef]
- Wang, K.; Shao, H.; Zhou, T.; Deng, C. Analysis of the impact of tourism development on regional carbon emissions based on the EKC framework: Based on inter provincial panel data in China from 1995 to 2015. Geogr. Res. 2018, 37, 742–750. [Google Scholar]
- Xu, Z.; Zhao, C.; Ding, S. Carbon peak, carbon neutrality empowers high-quality development: Internal logic and realization path. Economist 2021, 11, 62–71. [Google Scholar]
- Huang, Y.; Zhang, S.; Zhang, J.; Fan, F.; Zheng, H. Exploration of ecosystem asset-economy coupling coordination and its endogenous and exogenous drivers in mountainous regions. J. Clean. Prod. 2025, 486, 144460. [Google Scholar] [CrossRef]
- Lau, L.J. The benefits and potential costs of a digital economy. Telecommun. Policy 2023, 47, 102594. [Google Scholar] [CrossRef]
- Wang, S.; Li, J. Nonlinear spatial impacts of the digital economy on urban ecological welfare performance: Evidence from China. Front. Ecol. Evol. 2024, 12, 1361741. [Google Scholar] [CrossRef]
- Pouri, M.; Hilty, L. The digital sharing economy: A confluence of technical and social sharing. Environ. Innov. Soc. Transit. 2021, 38, 127–139. [Google Scholar] [CrossRef]
- Pang, J.; Jiao, F.; Zhang, Y. An analysis of the impact of the digital economy on high-quality economic development in China—A study based on the effects of supply and demand. Sustainability 2022, 14, 16991. [Google Scholar] [CrossRef]
- Xu, Z.; Ci, F. Spatial-temporal characteristics and driving factors of coupling coordination between the digital economy and low-carbon development in the Yellow River Basin. Sustainability 2023, 15, 2731. [Google Scholar] [CrossRef]
- Li, N.; Shi, B.; Kang, R. Analysis of the coupling effect and space-time difference between China’s digital economy development and carbon emissions reduction. Int. J. Environ. Res. Public Health 2023, 20, 872. [Google Scholar] [CrossRef]
- Liu, H.; Tan, Z.; Xia, Z. The Coupling Coordination Relationship and Driving Factors of the Digital Economy and High-Quality Development of Rural Tourism: Insights from Chinese Experience Data. Land 2024, 13, 1734. [Google Scholar] [CrossRef]
- Zheng, Z.; Zhu, Y.; Wang, Y.; Yang, Y.; Fang, Z. Spatio-temporal heterogeneity of the coupling between digital economy and green total factor productivity and its influencing factors in China. Environ. Sci. Pollut. Res. 2023, 30, 82326–82340. [Google Scholar] [CrossRef] [PubMed]
- Ma, X.; Feng, X.; Fu, D.; Tong, J.; Ji, M. How does the digital economy impact sustainable development? —An empirical study from China. J. Clean. Prod. 2024, 434, 140079. [Google Scholar] [CrossRef]
- Feng, X.; Ma, X.; Lu, J.; Tang, Q.; Chen, Z. Assessing the impact of the digital economy on sustainable development in the underdeveloped regions of western China. Cities 2025, 156, 105552. [Google Scholar] [CrossRef]
- Dian, J.; Song, T.; Li, S. Facilitating or inhibiting? Spatial effects of the digital economy affecting urban green technology innovation. Energy Econ. 2024, 129, 107223. [Google Scholar] [CrossRef]
- Hao, X.; Liang, Y.; Yang, C.; Wu, H.; Hao, Y. Can industrial digitalization promote regional green technology innovation? J. Innov. Knowl. 2024, 9, 100463. [Google Scholar] [CrossRef]
- Wang, G.; Deng, X.; Wang, J.; Zhang, F.; Liang, S. Carbon emission efficiency in China: A spatial panel data analysis. China Econ. Rev. 2019, 56, 101313. [Google Scholar] [CrossRef]
- Sun, W.; Huang, C. How does urbanization affect carbon emission efficiency? Evidence from China. J. Clean. Prod. 2020, 272, 122828. [Google Scholar] [CrossRef]
- He, Y.; Song, W. Analysis of the impact of carbon trading policies on carbon emission and carbon emission efficiency. Sustainability 2022, 14, 10216. [Google Scholar] [CrossRef]
- Chai, J.; Tian, L.; Jia, R. New energy demonstration city, spatial spillover and carbon emission efficiency: Evidence from China’s quasi-natural experiment. Energy Policy 2023, 173, 113389. [Google Scholar] [CrossRef]
- Wu, C.; Deng, H.; Zhao, H.; Xia, Q. Spatiotemporal evolution and convergence patterns of urban carbon emission efficiency in China. Humanit. Soc. Sci. Commun. 2025, 12, 1–13. [Google Scholar] [CrossRef]
- Ji, T.; Deng, H.; Zhang, T. Impact of producer services agglomeration on carbon emission efficiency: An analysis based on the data of enterprises in 108 cities of the Yangtze River Economic Belt. Resour. Sci. 2023, 45, 31–47. [Google Scholar] [CrossRef]
- Ma, X.; Xu, J. Impact of environmental regulation on high-quality economic development. Front. Environ. Sci. 2022, 10, 896892. [Google Scholar] [CrossRef]
- Chen, L.; Huo, C. The measurement and influencing factors of high-quality economic development in China. Sustainability 2022, 14, 9293. [Google Scholar] [CrossRef]
- Guo, J.; Sun, Z. How does manufacturing agglomeration affect high-quality economic development in China? Econ. Anal. Policy 2023, 78, 673–691. [Google Scholar] [CrossRef]
- Zheng, H.; He, Y. How does industrial co-agglomeration affect high-quality economic development? Evidence from Chengdu-Chongqing Economic Circle in China. J. Clean. Prod. 2022, 371, 133485. [Google Scholar] [CrossRef]
- Zhou, B.; Wang, N.; Zhang, Z.; Liu, W.; Lu, W.; Xu, R.; Li, L. Research on the Spatial-temporal differentiation and path analysis of China’s provincial regions’ high-quality economic development. Sustainability 2022, 14, 6348. [Google Scholar] [CrossRef]
- Wu, X.; Wang, C.; Jin, Z.; Qi, G. Spatio-Temporal Evolution and Identification of Obstacles to High-Quality Economic Development in the Yellow River Basin. Sustainability 2025, 17, 4811. [Google Scholar] [CrossRef]
- Chen, P. Effects of normalization on the entropy-based TOPSIS method. Expert Syst. Appl. 2019, 136, 33–41. [Google Scholar] [CrossRef]
- Tone, K. A slacks-based measure of efficiency in data envelopment analysis. Eur. J. Oper. Res. 2001, 130, 498–509. [Google Scholar] [CrossRef]
- Cao, X.; Ci, F. Study on the Coupling Development of Industry, City and Population in the Yellow River Basin from the Perspective of Green Economy. Sustainability 2023, 15, 10029. [Google Scholar] [CrossRef]
- Peng, G.; Zhang, X.; Liu, F.; Ruan, L.; Tian, K. Spatial–temporal evolution and regional difference decomposition of urban environmental governance efficiency in China. Environ. Dev. Sustain. 2021, 23, 8974–8990. [Google Scholar] [CrossRef]
- Chen, Y.; Xu, S.; Lyulyov, O.; Pimonenko, T. China’s digital economy development: Incentives and challenges. Technol. Econ. Dev. Econ. 2023, 29, 518–538. [Google Scholar] [CrossRef]
- Xue, L.; Shen, Y.; Xu, C. A research on spillover effects of agricultural agglomeration on agricultural green development efficiency. Econ. Surv. 2020, 37, 45–53. [Google Scholar]
- Xue, L.; Liao, Z.; Wang, L. Urbanization and the improvement of agricultural non-point source pollution: A spatial heterogeneity analysis based on the moderating effect of farmers’ income structure. Rural Econ. 2019, 7, 55–63. [Google Scholar]
- Yu, H.; Liu, D.; Zhang, C.; Yu, L.; Yang, B.; Qiao, S.; Wang, X. Research on spatial–temporal characteristics and driving factors of urban development intensity for pearl river delta region based on geodetector. Land 2023, 12, 1673. [Google Scholar] [CrossRef]
- Zhang, L.; Zhou, X. Exploring the spatiotemporal structure and driving mechanism of digital village construction in China based on social network analysis and Geodetector. PLoS ONE 2024, 19, e0310846. [Google Scholar] [CrossRef]
- Zhang, X.; Ding, R.; Yang, W. Study on Spatial Differentiation of Digital Economy and It’s Driving Factors in China: Based on Geodetector. Sustainability 2024, 16, 10472. [Google Scholar] [CrossRef]
- Zhang, Y. The dynamic evolution, regional differences, and spatial convergence of urban carbon emission efficiency in China. Urban Probl. 2023, 7, 33–42+83. [Google Scholar]
- Wang, P.; Yu, X.; Haron, N.A. Relative improvements between roads and railways and transport carbon dioxide emissions: An environmental Kuznets curve hypothesis test in China. Sustain. Futures 2025, 9, 100520. [Google Scholar]
- Cheng, Y.; Zhang, Y.; Wang, J. Spatial-temporal evolution of provincial carbon emission performance and driving force of technological innovation in China. Geogr. Sci. 2023, 43, 313–323. [Google Scholar]
- Li, Z.; Liu, Y. Research on the spatial distribution pattern and influencing factors of digital economy development in China. IEEE Access 2021, 9, 63094–63106. [Google Scholar] [CrossRef]
- Tian, X.; Zhang, H. Analysis of the impact factors of industrial structure upgrading on green total factor productivity from the perspective of spatial spillover effects. Heliyon 2024, 10, e28660. [Google Scholar] [CrossRef]
- Fan, G.; Zhu, A.; Xu, H. Analysis of the impact of industrial structure upgrading and energy structure optimization on carbon emission reduction. Sustainability 2023, 15, 3489. [Google Scholar] [CrossRef]
- Li, H.; Liu, J.; Wang, H. Impact of green technology innovation on the quality of regional economic development. Int. Rev. Econ. Financ. 2024, 93, 463–476. [Google Scholar] [CrossRef]
- Duan, Z.; Li, M.; Wu, P. High-Quality Regional Economic Development Paths in China—QCA-Based Linkage Effect. Sustainability 2023, 15, 6325. [Google Scholar] [CrossRef]
- Li, X. An empirical analysis based on marketization, industrial agglomeration and environmental pollution. Stat. Res. 2014, 31, 39–45. [Google Scholar]
- Wurlod, J.D.; Noailly, J. The impact of green innovation on energy intensity: An empirical analysis for 14 industrial sectors in OECD countries. Energy Econ. 2018, 71, 47–61. [Google Scholar] [CrossRef]
- Zhao, Y.; Zhang, Z.; Feng, T.; Tao, K. Big data development, institutional environment, and government governance efficiency. J. Manag. World 2019, 35, 119–132. [Google Scholar]
- Zhang, J.; Xu, Z.; Ci, F. Spatio–Temporal Evolutionary Features and Drivers of Green Competitiveness of Cities Surrounding the Yellow River. Sustainability 2023, 15, 14127. [Google Scholar] [CrossRef]
Disclaimer/Publisher’s Note: The statements, opinions and data contained in all publications are solely those of the individual author(s) and contributor(s) and not of MDPI and/or the editor(s). MDPI and/or the editor(s) disclaim responsibility for any injury to people or property resulting from any ideas, methods, instructions or products referred to in the content. |
© 2025 by the authors. Licensee MDPI, Basel, Switzerland. This article is an open access article distributed under the terms and conditions of the Creative Commons Attribution (CC BY) license (https://creativecommons.org/licenses/by/4.0/).