Abstract
Located on the northern side of the China–Pakistan Highway in the Pamir Plateau, Laqi Gully represents a typical rainfall–meltwater coupled debris flow gully. During 2020–2024, seven debris flow events occurred in this area, four of which disrupted traffic and posed significant threats to the China–Pakistan Economic Corridor (CPEC). The hazard assessment of debris flows constitutes a crucial component in disaster prevention and mitigation. However, current research presents two critical limitations: traditional models primarily focus on single precipitation-driven debris flows, while low-resolution digital elevation models (DEMs) inadequately characterize the topographic features of alpine narrow valleys. Addressing these issues, this study employed GF-7 satellite stereo image pairs to construct a 1 m resolution DEM and systematically simulated debris flow propagation processes under 10–100-year recurrence intervals using a coupled rainfall–meltwater model. The results show the following: (1) The mudslide develops rapidly in the gully section, and the flow velocity decays when it reaches the highway. (2) At highway cross-sections, maximum velocities corresponding to 10-, 20-, 50-, and 100-year recurrence intervals measure 2.57 m/s, 2.75 m/s, 3.02 m/s, and 3.36 m/s, respectively, with maximum flow depths of 1.56 m, 1.78 m, 2.06 m, and 2.52 m. (3) Based on the hazard classification model of mudslide intensity and return period, the high-, medium-, and low-hazard sections along the highway were 58.65 m, 27.36 m, and 24.1 m, respectively. This research establishes a novel hazard assessment methodology for rainfall–meltwater coupled debris flows in narrow valleys, providing technical support for debris flow mitigation along the CPEC. The outcomes demonstrate significant practical value for advancing infrastructure sustainability under the United Nations Sustainable Development Goals (SDGs).
1. Introduction
Roads, as the core infrastructure of modern transport networks, play a key role in the economic, social, cultural, and political spheres at the interregional and international levels [1]. However, the construction and operation of such linear projects in complex terrain areas are often threatened by a variety of geological hazards, among which debris flows are of particular concern due to their suddenness and destructive nature [2]. Studies have shown that debris flow events are usually accompanied by a huge release of kinetic energy, and this huge energy transformation process can lead to structural damage to buildings, the breakage of road systems, the paralysis of town functions, and the irreversible degradation of agricultural land, as well as causing significant human casualties [3]. Especially along highways, debris flow disasters pose a continuous threat to the construction and operation of infrastructure, and roads in the mountainous regions of western China are often disrupted by debris flow disasters, which endanger personal safety and cause economic losses [4,5]. This realistic dilemma highlights the important value of debris flow hazard assessment research: by establishing a scientific evaluation system, it can not only provide theoretical support for disaster prevention and control engineering, but also effectively reduce the operational risk factor of the highway system, which in turn safeguards the reliability and continuity of the regional transport network [6]. Therefore, it is of great theoretical and practical value to carry out research on debris flow hazard assessment along the highway.
As an international corridor connecting China and Pakistan, the China–Pakistan Highway (CPH), with its Pamir Plateau section, traverses the core area of the Cenozoic orogenic belt, including the western part of the Kunlun Mountains, the Karakorum Mountains, the Hindu Kush Mountains, and the Himalayas [7]. The section is dotted with vast glaciers along the route and has complex highland alpine landforms and geological conditions [8]. Due to the difficult terrain, frequent geological activities, and special highland alpine climate, debris flows have become a frequent and destructive natural disaster along the China–Pakistan Highway [9]. Sixty-eight debris flow disasters occurred along the China section of the China–Pakistan Highway between 2020 and 2023, which accounted for 49.28% of the total number of debris flow disasters along the highway in the entire Xinjiang region [10]. Such disaster events not only damage the integrity of the roadbed structure and road facilities, but also lead to an average annual disruption of the road section of more than 160 h [10], which seriously affects the safety and smoothness of the highway.
As the core link of the disaster prevention and mitigation system [11], the core task of debris flow risk assessment is to provide a scientific basis for risk prevention and control by quantitatively analyzing the disaster dynamics parameters (including the total amount of material transport, the average flow rate, and the distance of movement, etc.) as well as determining the probability of the occurrence of the disaster for a specific watershed [12,13]. The current assessment of debris flow risk can be divided into two technical paths: a traditional model and numerical simulation. Traditional methods mainly rely on grey system theory [14], the hierarchical analysis method (AHP) [15], the fuzzy comprehensive evaluation method [16], and neural networks [17] and other mathematical methods to build the assessment system, focusing on the multi-factor comprehensive evaluation and risk classification. With the development of computational fluid dynamics and the in-depth study of disaster dynamics mechanisms, numerical simulation technology based on physical processes has developed into an important technical means for modern debris flow research [18]. Compared with the traditional statistical analysis method, numerical simulation can accurately reproduce the characteristics of debris flow evolution by constructing the equations of fluid motion under three-dimensional terrain conditions. Currently, the mainstream simulation platforms include professional software such as FLO-2D, RAMMS, and MASSFLOW [19], among which FLO-2D has been widely used in the field of international disaster prevention engineering by virtue of its user-friendly operation interface and reliable simulation accuracy [20]. The core advantage of numerical simulation lies in dynamic simulation: through hydrodynamic solving, it realizes the visual reconstruction of material transport trajectories in three-dimensional terrain, and accurately reveals the spatial and temporal evolution of parameters such as the distribution of flow depths, flow velocity vectors, and accumulation ranges [21]. The dynamic simulation of the whole process provides technical support for the analysis of the mechanisms of the disaster chain and the design of disaster prevention engineering, and significantly improves the precision of early warnings and the effectiveness of the emergency response.
In recent years, the FLO-2D numerical model has been widely used in debris flow disaster assessment research [22,23,24]. Zheng H et al. used the Shiyangou Valley in China as an example and combined the HEC-HMS hydrological model with FLO-2D to analyze how accumulated rainfall, precipitation intensity, and the range of rainfall affect debris flow disasters. They also explored the use of digital simulations in early warnings for debris flow disasters [25]. Zhuang JQ et al. comprehensively used high-resolution remote sensing images, drone aerial photography, field surveys, and FLO-2D simulation to study the formation mechanism and dynamic process of earthquake-triggered loess debris flows, focusing on the liquefaction characteristics of saturated loess under seismic loads [26]. Zhang S et al. used FLO-2D software to comparatively simulate the debris flow processes in both scenarios with and without buildings, and obtained the debris flow intensity parameters. The results show that it is very important to consider the existence of buildings in the simulation for an accurate assessment of debris flow intensity and deposit distribution [27]. Chaeyeon Oh et al. used FLO-2D to simulate the evolution of debris flows under different return periods based on actual rainfall data from historical debris flow events and design rainfall scenarios corresponding to 30-, 50-, and 100-year return periods, and compared and analyzed key parameters such as flow depth, flow velocity, and diffusion range [28]. Xiamin Jia et al., with the help of FLO-2D software, evaluated the debris flow risk of Dashilinggou in Beijing under the rainfall return periods of 30, 50, and 100 years. The simulation results well reproduced the dynamic characteristics such as the flow velocity and accumulation depth of debris flows [29].
Taken together, the research techniques for debris flow hazard assessment using FLO-2D are relatively mature. However, most of the studies on the numerical modelling of debris flows are focused on rainfall-induced debris flows [25,28,29,30,31,32], and there are fewer studies on this type of rainfall–meltwater coupled debris flow along the China–Pakistan Highway, which involves the problem of how to calculate the flow rate of different types of debris flows. In addition, most of the DEMs used in the numerical modelling of debris flows are obtained from open sources [25,33,34], which have lower accuracy and can be used in large-scale, valley-wide debris flow basins. However, the debris flows along China–Pakistan Highway are mostly slope-type gully debris flows, with a small catchment area, narrow and deep gully, and V shape, so the open-source DEMs are not enough to support simulation accuracy, and it is necessary to obtain higher accuracy DEMs to ensure the scientific rationality of the simulation.
In response to the above issues, this study assessed debris flow disasters in Laqi Gully on the Chinese section of the China–Pakistan Highway (Figure 1). First, the maximum debris flow discharge under different return periods was calculated based on the rainfall–runoff coupling formula. Then, using the FLO-2D model and high-precision digital elevation model (DEM) data extracted from GF-7 satellite stereo images, a numerical simulations of debris flow movement processes under different return period conditions was conducted. The simulation focused on analyzing the activity characteristics of debris flows in Laqi Gully under 10-, 20-, 50-, and 100-year return periods, and simultaneously assessed the intensity of debris flows under each scenario.
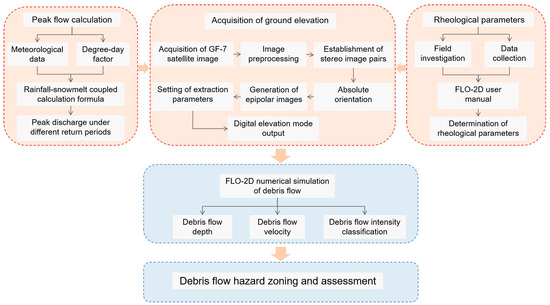
Figure 1.
Hazard assessment framework for the Laqi Gully debris flow.
This study aims to provide a scientific reference for debris flow risk prevention and monitoring in the China–Pakistan Economic Corridor (CPEC) through the numerical simulation of this debris flow, and to provide a case study for the numerical simulation and risk assessment of similar rainfall–meltwater coupled debris flows in high mountainous areas, so as to promote the sustainability of infrastructure in the United Nations Sustainable Development Goals (SDGs).
2. Data Sources and Study Area
2.1. Data Sources
In this paper, three main types of data were collected: meteorological data used to calculate the peak flow of debris flow, GF-7 satellite image data to obtain high-precision ground elevation, and field research data.
1. Meteorological data. Meteorological data were obtained from the National Meteorological Information Centre of China “https://data.cma.cn/ (accessed on 16 December 2024)”, and the data contained monthly temperature and precipitation from 1995 to 2024. In addition, snow area and snow depth data were obtained from the National Scientific Data Centre for the Tibetan Plateau “https://data.tpdc.ac.cn/ (accessed on 22 December 2024)”.
2. Gaofen7 satellite image data. The Gaofen7 satellite image data were purchased by the research team from Xinjiang North Star Zhongxing Space Science and Technology Co., Ltd., Urumqi, China and mainly include two panchromatic stereo images with better than 0.8 m resolution, two front-view and rear-view images, and multispectral images with 3.2 m resolution, as well as satellite attitude data.
3. Field research data. 2024 Field research was carried out in Laqi Gully to collect information related to the vegetation and geomorphology, topography and terrain, and the characteristics of the accumulation area of Laqi Gully. In addition, with the help of the road maintenance management department of the section of the China–Pakistan Highway where Laqi Gully is located, we successfully obtained information about the debris flow disasters that occurred in Laqi Gully in recent years, including the time of occurrence, the weather conditions, the scale of occurrence, and the blockage of traffic.
2.2. Overview of the Study Area
Laqi Gully (38°44′50″–38°46’14″ N, 75°8′35″–75°9’19″ E), is a typical rainfall–meltwater coupled debris flow gully. It is located on the Pamir Plateau in the westernmost part of China, on the north side of the China–Pakistan Highway and Gaizi River, belonging to the Kizilsu Kyrgyz Autonomous Prefecture of the Xinjiang Uygur Autonomous Region (XUAR), and is about 1130 km away from Urumqi, the capital of the XUAR (Figure 2). The watershed of Laqi Gully covers an area of 1.53 km2, the length of the main gully is 2.02 km, the altitude ranges between 5600 and 2900 m, the overall drop of the watershed is 2.09 km, and the average slope of the gully is 37.44°.
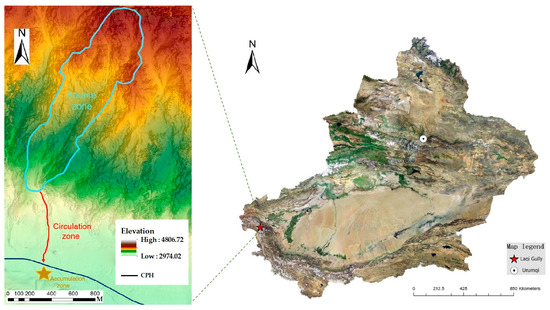
Figure 2.
Geographic location of the debris flow in Laqi Gully.
The study area is dominated by the westerly wind circulation system and belongs to a continental high-altitude cold climate zone. The national meteorological station nearest to the study area with long-term observational records is the Tashkurgan Station (37.77° N, 75.23° E, elevation 3090 m), located approximately 114 km southeast of the study area. Based on the observation data from this station from 1995 to 2024 (Figure 3), the climate characteristics of the study area are as follows: the annual average temperature is 4.1°C, the annual average precipitation is 82.6 mm, and precipitation is primarily concentrated in the summer (accounting for approximately 52% of the annual total). The average temperature in summer (June–August) can reach 15.8 °C, causing seasonal snow and glaciers to melt faster. The concentrated meltwater produced during periods of high temperature may trigger short-term meltwater floods, which in turn increases the risk of debris flow disasters.
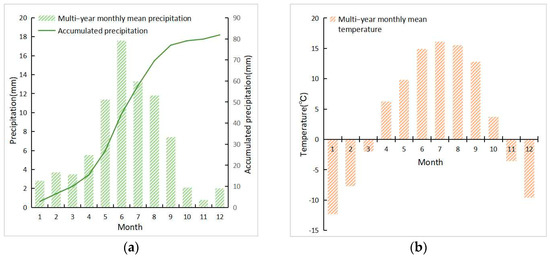
Figure 3.
Laqi Gully multi-year average meteorological data: (a) multi-year average precipitation and (b) multi-year average temperature.
Laqi Gully is located in the collision zone between the Indian Ocean Plate and the Eurasian Plate, with complex geological structure and significant fault development. The region’s geomorphology shows vertical differentiation: the upper part is covered by glaciers, the middle part is exposed rock layers, and the lower part is dominated by sparse plateau meadows. Due to the ablation and retreat of the glacier, a large number of moraine deposits in this gully have been exposed. Poor climatic conditions, large day and night temperature changes and a constantly alternating freeze-thaw cycle led to Laqi Gully in the middle of the exposed ancient near-period and quaternary rock layer of strong weathering. In addition, Laqi Gully is located in the West Kunlun-Pamir seismic zone, and earthquakes have a long-term impact on slope stability, often leading to large-scale landslides and rockfalls. Under the combined effect of multiple factors, the glacial moraine released by the melting of glaciers, the debris from the weathering of rock strata, and the loose and collapsed rocks disturbed by earthquakes keep accumulating, providing a rich material source for the debris flow disaster in Laqi Gully.
In April 2024, we conducted a field survey of Laqi Gully. The investigation showed that the slope angle of the debris flow source area is mostly between 40 and 45°, with a local maximum of 72.6°, and the vegetation is sparse, and the rocks are severely weathered and fragmented, resulting in a large amount of fragmented rock (Figure 4A). The channel of Laqi Gully is narrow and deep, in the shape of a V (Figure 4B). We found that a large amount of material and sediment had been accumulated in the channel, which was relatively loose and of low strength, and could be easily carried away by the water flow or mudflow. This not only reduced the flood discharge capacity of the channel, but also enlarged the scale of debris flow when it passed through the channel (Figure 4C,D).
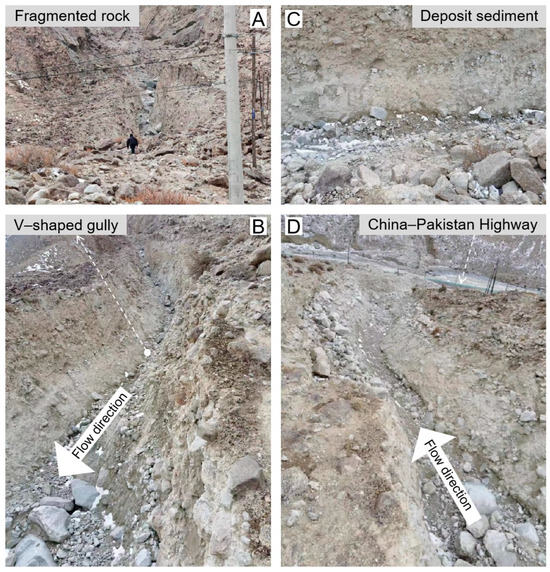
Figure 4.
Laqi Gully features: (A) fragmented rock; (B) V-shaped gully; (C) deposit sediment; and (D) the position of the China–Pakistan Highway relative to Laqi Gully.
The China–Pakistan Highway crosses the debris flow accumulation fan in Laqi Gully, which spans about 300 m. According to the records of the Kashgar Highway Management Bureau of the Xinjiang Uygur Autonomous Region (XUAR), the debris flows in Laqi Gully are very active, usually occurring one or more times in a year and are concentrated in the period from May to September of each year. Between 2020 and 2024, Laqi Gully experienced seven debris flow disasters, of which four disrupted traffic [10]. Since this debris flow ditch has frequent debris flows and often obstructs traffic, it is of great practical significance and reference value to study it.
In summary, Laqi Gully is a typical rainfall–meltwater coupled debris flow gully, with steep terrain, rock fragmentation, harsh climatic and geological conditions, and frequent debris flows, which poses a direct threat to the safety and effectiveness of the China–Pakistan Highway.
3. Method and Data Preprocessing
3.1. FLO-2D Model
FLO-2D (version 2009) is a software developed by American scholar O’Brien for simulating urban flooding [35], which was later optimized and upgraded to simulate mudslides and achieved good application results. It is essentially a numerical simulation method based on the central finite difference value method and the non-Newtonian body model to solve the kinematic characteristics of the fluid.
In this study, FLO-2D numerical simulation software is used to simulate the accumulation range, flow depth, and flow velocity of the debris flow, etc. In the calculation, two control equations are mainly considered:
(1) Continuity equation:
In the equation, is the duration of a debris flow, is the depth of the debris flow, and are the average flow velocity of the debris flow in the X- and Y-axis directions, respectively, and is the intensity of rainfall for the outbreak of the debris flow.
Equations of Motion:
where g denotes the acceleration of gravity; and represent the friction gradient; and represent the bedrock gradient; Equations (2) and (3) are the momentum equations in the X- and Y-directions, respectively, which indicate that the forces in both directions are always in equilibrium, and the main body of the momentum equations is the dynamical wave model, which is mainly concerned with the effect of acceleration on the movement of the mudslide.
O’Brien proposed a rheological equation applied to high sand content and debris flows, where the total shear stress of a highly concentrated sandy water flow or debris flow is composed of five separate shear stresses:
where is the total debris flow shear stress, is the molar Coulomb shear stress, is the cohesion, is the turbulent shear stress, is the viscous shear stress, and is the discrete shear stress.
The FLO-2D model uses a quadratic friction model to comprehensively express all shear stress terms, whose dimensionless form is as follows:
where is the total friction slope, is the yield stress, is the coefficient of viscosity, is the specific gravity of the sediment in a mixture of water and sediment, is the drag parameter for laminar flow, and is the equivalent Manning’s coefficient, which is a combination of turbulent and discrete shear stresses.
The yield stress () and viscosity coefficient () can be determined using the following empirical relationship:
where, , , , and are empirical coefficients, which are obtained by testing or checking the table. is Manning’s coefficient, and is the sediment concentration in the mudslide.
3.2. Selection of Simulation Parameters
3.2.1. Manning’s Coefficient (n)
Manning’s coefficient (n) characterizes the roughness of the ground surface and its resistance to fluid movement. Its value has a significant impact on the results of debris flow simulations and is constrained by regional surface characteristics (such as vegetation cover). The Flo-2D manual provides recommended ranges for Manning’s coefficient for different surface conditions, with a recommended value of 0.05–0.13 for areas with sparse vegetation. Field surveys show that the study area has sparse vegetation and debris accumulated in the debris flow channel. Taking into consideration the recommendations in the Flo-2D manual, the field characteristics of the study area (sparse vegetation and debris accumulation in the channel), and existing debris flow simulation literature in the area, Manning’s coefficient in this study was finally set to 0.1.
3.2.2. Volume Concentration ()
Volume concentration () is defined as the ratio of the volume of solid matter in the debris flow fluid to the total volume of the debris flow. The higher the volume concentration, the more solid particles the debris flow contains, the greater the resistance it encounters during movement, and the lower the flow velocity. Conversely, the lower the volume concentration, the fewer solid particles there are, the less resistance there is to movement, and the higher the flow velocity. Based on the analysis of historical debris flow event records, the Laqi Gully debris flow exhibits typical viscous (mixed) flow characteristics. According to the FLO-2D manual recommendations, the volume concentration range for debris flows with such viscous flow characteristics is 0.55–0.65. Therefore, the final value of the debris flow volume concentration in this simulation study is 0.57.
3.2.3. Bingham’s Yield Stress and Bingham’s Viscosity Coefficient
The calculation of debris flow friction slope requires the introduction of two key rheological parameters: yield stress () and viscosity coefficient (). These parameters characterize the force deformation and flow characteristics during debris flow movement, and therefore directly affect the movement and accumulation process of debris flows. From Formulas (7) and (8), it can be seen that the values of these two parameters are related to the volume concentration of the debris flow fluid, and their values increase exponentially when the volume concentration increases. In Equations (6) and (7), , , , and are empirical coefficients obtained through experiments or by consulting tables. In this study, the values are taken from previous research: = 0.5, = 0.004, = 13.7, and = 11.2.
3.2.4. Laminar Resistance Coefficient (K)
The laminar friction coefficient (K) characterizes the interlayer friction force during the stratified flow process of debris flows. The Laqi Gully basin has sparse vegetation, and the Flo-2D user manual recommends a laminar friction coefficient range of 1000–4000 for areas with sparse vegetation. Taking into account the recommendations in the manual and relevant research literature on the area, the laminar friction coefficient in this simulation study was finally determined to be 2280.
3.2.5. Simulation Time
Based on field survey data, recollections of debris flows by road maintenance and management staff, and data such as debris flow discharge rates for different return periods, the simulation time for debris flows in Laqi Gully was determined to be 0.7 h for several return periods.
According to the above process for determining debris flow numerical simulation parameters, a set of reasonable simulation parameters applicable to the Laqi Gully debris flow can be obtained (see Table 1).

Table 1.
Numerical simulation parameters for debris flow in Laqi Gully.
3.3. Peak Flow Calculations for Debris Flows
The calculation method for rainfall–meltwater debris flow under rain–heat coupling conditions should consider the rainfall of the whole basin and the water equivalent of snow and ice melt of the snow and ice basin, respectively.
This study superimposes meltwater volume and rainfall to calculate the flood peak flow Q for the entire basin under coupled rainfall–meltwater conditions. This method has been fully verified in multiple rainfall–meltwater debris flow discharge calculations in similar areas [36]. The formula is as follows:
where represents the peak flood discharge, m3/s; denotes the total rainfall over the entire basin, using statistical values for 24 h rainfall, mm; represents the 24 h snowmelt volume, mm; is the rainfall parameter, with a value of 0.62; and denotes the basin runoff concentration time, h. Among these, ; is the main channel degree; is the average slope of the main channel; and the calculated value of is 6.76. is the average infiltration intensity, mm/h; is the total basin area, km2.
The meltwater equivalent of snow and ice in the whole basin within 24 h, , is calculated according to the degree day model established by the relationship between snow and ice melt and air temperature:
In the formula, is the average air temperature of a day, ℃; is the area of snow and ice melt, km2; and is the degree day factor of glacier or snow, mm/(d·℃).
Since the melting of snow and ice is closely related to its contact area with air, the contact area between snow and ice area and air is different under the projection area of different slopes; taking into account the influence of slope, the degree day factor DDF can be obtained by the following formula:
where stands for elevation, m; stands for latitude, (°); and is the average slope of the range above the area of snow and ice melt water, (°). Based on the reality of Lazi Gully, the value of its DDF was calculated to be 4.5 mm/(d·℃).
Based on the above rainfall–snowmelt coupling model, the peak discharge of clear water flow within the watershed can be calculated for a specific event. This peak clear water discharge can then be used to compute the peak debris flow discharge through the bulking method, with the calculation formula expressed as follows:
is the peak flow rate of debris flow, m3/s; is the correction coefficient of the peak flow rate of debris flow; is the blockage coefficient, with a value of 2.65; is the specific gravity of debris flow, t/m3; is the specific gravity of clean water, t/m3; and is the specific gravity of solid matter in debris flow, t/m3, where = 18.32 t/m3 and = 25.41 t/m3, and therefore = 1.17.
Through calculations, we obtained the peak flow rate of debris flows in Laqi Gully under four different return periods of 10 years, 20 years, 50 years, and 100 years. Then, we used the pentagonal generalization method to draw the flow process lines of debris flows under different return periods (Figure 5).
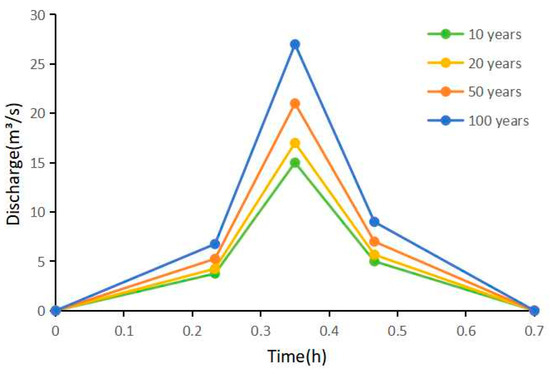
Figure 5.
Flow process lines of debris flow under different return periods.
3.4. DEM Acquisition of the Study Area
As one of the key satellites for promoting spatial geographic informatization, GF-7 is having a far-reaching impact on the development of the surveying and mapping industry [37]. GF-7 image data are not only stable and reliable, but their stereoscopic surveying and mapping capability also effectively reduces the occlusion effect in areas with large height differences, and the rear-view image is capable of producing high-quality orthophotos. The satellite carries a panchromatic camera with a forward-looking resolution of better than 0.8 m and an even better backward-looking resolution of 0.65 m [38]. In addition, it also carries a multispectral camera covering four bands of blue, green, red, and near-infrared, with a resolution of better than 2.6 m. The GF-7 satellite provides strong data support for natural resource management, and in high-precision three-dimensional mapping and resource surveys, it is able to provide important information, including data on the current status of natural resources, three-dimensional image data, and auxiliary data.
In photogrammetry, to construct a three-dimensional model of the same object, two photos need to be taken from different directions. Similarly, based on the principle of the artificial stereo effect, the construction of stereo image pairs is achieved by obtaining a pair of images with overlapping images from two ends of the photographic baseline. Usually, the overlap degree of the photos needs to be greater than 60% to enhance the interpretation effect. The principle of extracting a digital elevation model (DEM) based on stereo image pairs is shown in Figure 6a: Two sensors located at different positions are used to capture the same target on the ground, forming an angle. After determining the position of the sensor in the air, the smaller the included angle, the lower the ground object point being captured. Conversely, the larger the included angle, the higher the ground feature point. After calculating the elevation values of all points on the ground, the ground elevation model can be obtained. This study adopted a pair of forward and backward stereo panchromatic images (Figure 6b) of GF-7 taken in September 2024 covering the Laqi Gully area. It can be seen from Figure 6b that this stereo image pair has a high degree of overlap, and the overlap degree of the forward and backward images is approximately 96%, meeting the requirements of the DEM extraction experiment.
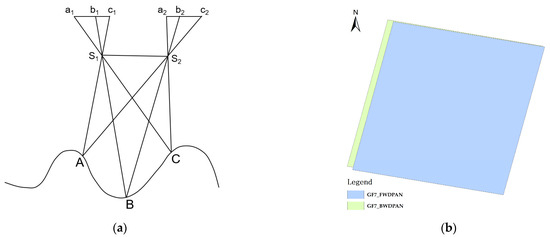
Figure 6.
GF-7 stereo image pair features: (a) stereo image pair extraction DEM principle and (b) GF-7 stereo image pair.
We mainly used ENVI (version 6.0) software to extract the DEM of the study area. The technical route of extracting DEM from stereo image pairs mainly includes reading front-view and back-view images, choosing whether to define control points and the number of defined control points, selecting the connection points of homonymous points in stereo image pairs, generating kernel line images, and extracting the DEM and other steps. Through these steps, we extracted a DEM covering Laqi Gully and its surrounding areas with a horizontal accuracy of 1 m. In terms of elevation data accuracy, the highest point of Laqi Gully has a measured elevation of 4795.62 m. Based on the DEM extracted from GF-7 imagery, the highest point of the watershed has an elevation of 4806.72 m, while the corresponding elevation value in the open-source DEM is 4729.39 m. The measured altitude of the roadbed of the China–Pakistan Highway in the Laqi Gully section is 2973.89 m, while the altitude of the roadbed in this section in the DEM extracted from GF-7 images is 2974.02 m, and the corresponding value in the open-source DEM is 2973.19 m. In addition, the DEM extracted from GF-7 images has a smaller grid size and a more detailed depiction of vertical geographical features. The comparison shows that the DEM extracted from GF-7 images has higher vertical resolution. In summary, the DEM extracted from GF-7 data shows significant advantages in both horizontal and vertical resolution and can accurately characterize the narrow valley terrain features of Laqi Gully. The comparison results with the open source 30 m accuracy DEM are shown in Figure 7.
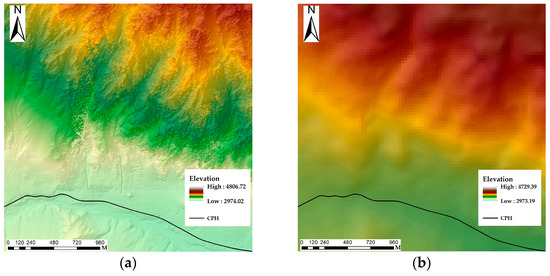
Figure 7.
Comparison of different precision DEMs: (a) GF-7 stereo relative extraction 1 m level DEM and (b) ASTGTM 30 m DEM.
4. Hazard Assessment of Debris Flow
4.1. Analysis of Simulation Results
As can be observed in Figure 8, the maximum flow velocities of the debris flow under different return periods of 10, 20, 50, and 100 years occurred in the areas with significant topographic changes in the channel. Specifically, in the narrow and straight channel, the peak debris flow velocity at the 100-year return period reaches 8.12 m/s. In contrast, the average flow velocity of debris flows under a 100-year return period is only 1.97 m/s, which shows a huge difference from the maximum flow velocity. This phenomenon is mainly attributed to the narrow channel cross-section (resulting in a reduced cross-sectional area) and the large longitudinal drop (resulting in a significant hydraulic gradient), which together contribute to the significant increase in flow velocity. After the debris flow exited the ditch, the flow velocity showed a rapid decay trend, but remained in the range of 0–3.36 m/s when it reached the highway area. However, when the debris flow was into the Gaizi River, by the double influence of topographic widening effect and the increase in basal friction resistance, the flow velocity appeared to decline in a stepwise manner, and the final form of motion was transformed into a non-Newtonian fluid motion dominated by the accumulation effect.
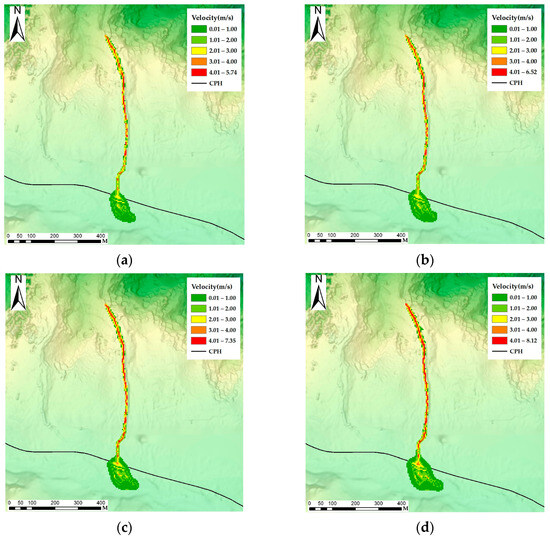
Figure 8.
Debris flow velocity by return period: (a) 10-year; (b) 20-year; (c) 50-year; and (d) 100-year return periods.
As shown in Figure 9, the depth of debris flow on the road pavement at the mouth of Laqi Gully ranged from 0.1 to 1.68 m under 10-year return period conditions. With the increase in the return period (20, 50, and 100 years), the depth of debris flow on the road pavement in this area shows a gradual increase and its depositional extent also expands. Under the 100-year return period condition, the maximum flow depth of debris flow on the highway could reach 2.56 m, while the length of the highway affected by the debris flow increased from 72.29 m to 110.11 m. Once the debris flow passes the road, it enters the Gaizi River channel and silts up in the channel, i.e., the maximum flow depth of the debris flow in Figure 8. In contrast, the average deposition depth of the debris flow in the channel is generally low, which is mainly attributed to the narrow channel cross-section and large topographic drop, resulting in a limited deposition of debris flow material in the channel, and most of the fluids flowed out of the channel under the effect of gravity. On 17 August 2024, a debris flow event with a return period of approximately 10 years occurred in Laqi Gully. Debris flow material rushed out of the gully and caused a large-scale siltation on the associated highway section. On-site investigations measured an average debris flow accumulation depth of approximately 1.36 m on the highway surface, causing traffic disruptions for several hours and seriously affecting traffic safety and transportation (Figure 10). Numerical simulation under a 10-year return period condition yielded an average debris flow depth of 1.12 m on the road surface, with a relative error of approximately 17.64% compared to the measured value. The simulation results were highly consistent with the measured data, indicating that the model had good accuracy in this scenario.
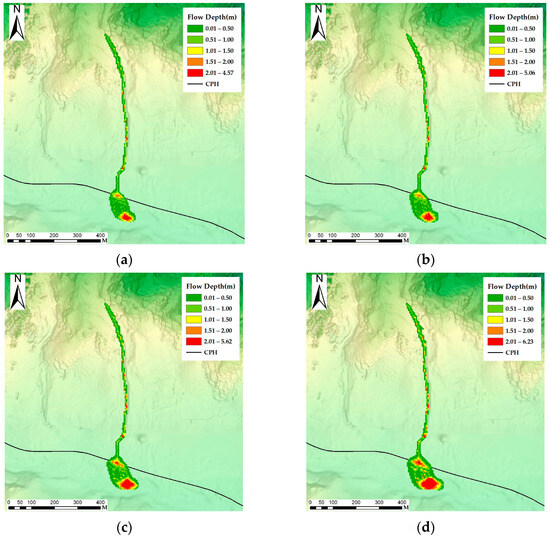
Figure 9.
Debris flow depth by return period: (a) 10-year; (b) 20-year; (c) 50-year; and (d) 100-year return periods.
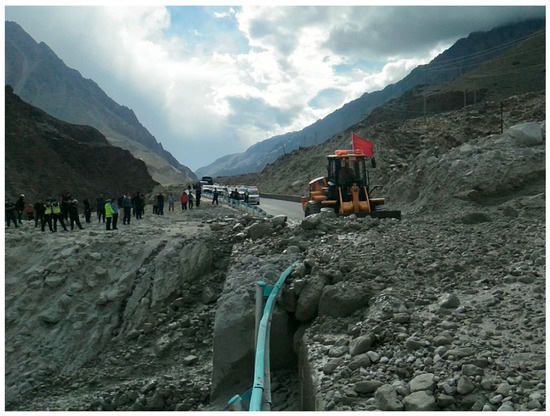
Figure 10.
Laqi Gully debris flow site conditions.
Within ArcGIS, the debris flow depositional extent was mapped using FLO-2D simulation outputs. An analysis of these results determined characteristic values for the Laqi Gully debris deposits across varying return periods (Table 2). The analysis indicates that flow velocity, depositional area, flow depth, and average deposit thickness all exhibit a progressive increase with higher return periods.
Table 2.
Depositional characteristics by return period.
4.2. Hazard Assessment
In this study, the intensity of debris flow characterizes the degree to which the area is affected by debris flow. It is quantified jointly by the flow depth H (m) and the product of flow depth and flow velocity HV (H× V, where V is the flow velocity, unit m/s). The larger the values of both, the more significantly the area is affected by debris flow, and the higher the corresponding intensity grade. During the simulation process, HV (H × V) was calculated based on the flow depth H (m) and flow velocity V (m/s). According to the combined characteristics of H and hv, the intensity of the Laqi Gully debris flow was classified into multiple grades (Table 3) [39]. According to the classification criteria in Table 3, the classification results of debris flow intensity under different return periods were finally obtained (Figure 11).
Table 3.
Classification of debris flow intensity.
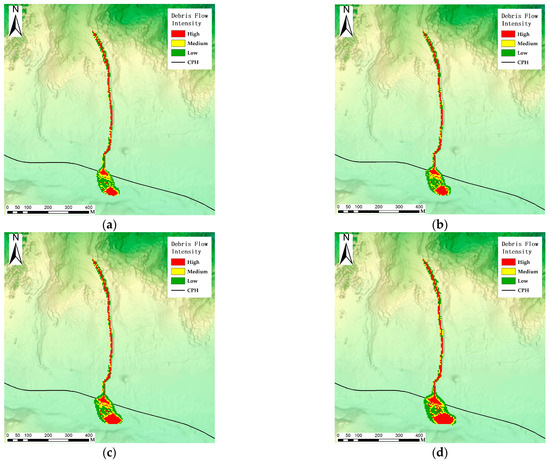
Figure 11.
Debris flow intensity by return period: (a) 10-year; (b) 20-year; (c) 50-year; and (d) 100-year return periods.
Currently, the most commonly used method in the numerical simulation of debris flows is to combine the intensity of debris flows and the recurrence period of debris flows to evaluate the hazard zoning of debris flows. In this study, the hazard level of debris flow in Laqi Gully was classified as low, medium, and high by combining the intensity and recurrence period of the debris flow according to the Swiss and Austrian standards (Figure 12), and the debris flow hazard zoning map was produced accordingly.
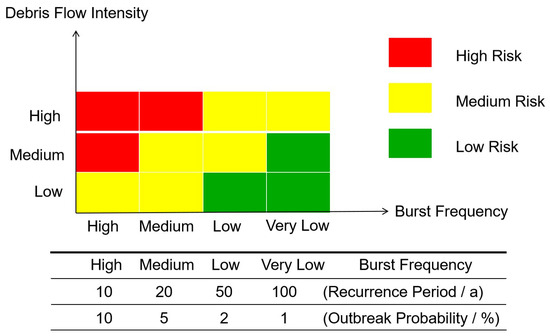
Figure 12.
Hazard classifications for debris flows in Laqi Gully.
As shown in Figure 13, the Laqi Gully debris flow high-risk area accounts for 44.55 per cent of the total area of deposition, which is the largest proportion of the area in each risk class. This area is mainly concentrated within the highway, debris flow channel, and Gaizi River channel, and the impact of debris flow in this area causes particularly serious damage to the highway pavement and isolation facilities on both sides, which is mainly attributed to the geographic characteristics of the debris flow channel being narrow and the terrain being steep. In addition, the relatively deep and large debris flow deposits in the high-hazard area can significantly impede traffic, and given the high risk of traffic disruption resulting from future debris flows, it is critical to be prepared for the timely removal of silt deposits to prevent further blockage of traffic. The medium-hazard area accounts for 36.34 per cent of the total area, and its distribution is mainly located on both sides of the high-risk area of the highway and on the slopes of the river on the Gaizi River side. Although the hazard level of this area is relatively low, its potential harm to roadbed and other infrastructure should not be ignored due to its wide coverage and the scouring ability of debris flow here. Therefore, the implementation of effective monitoring, early warnings, and risk management measures for the medium-hazard area is necessary to mitigate the potential damage caused by debris flows. The low-hazard area, which accounts for 19.11 per cent of the total area, is mainly located at the fringe of the debris flow accumulation area and poses relatively little hazard to road traffic. However, vigilance and continuous monitoring and assessment of the area are still required to ensure safety.
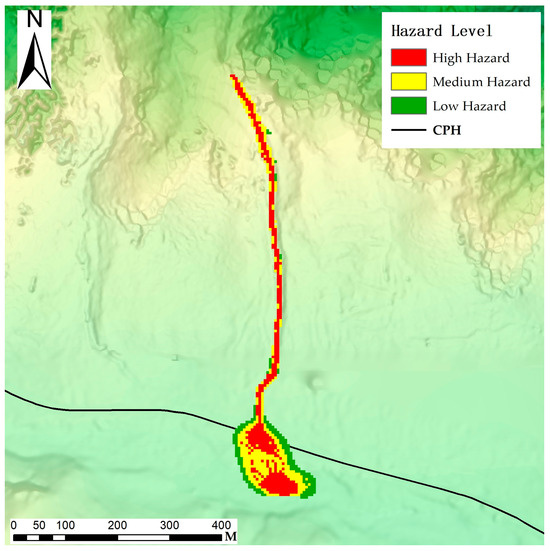
Figure 13.
Hazard zones of the Laqi Gully debris flow.
Based on this classification of danger levels, we have constructed the danger line zoning map of the section of the China–Pakistan Highway located at the alluvial fan of the Laqi Gully debris flow (Figure 14). Among them, the high-risk section is the longest, which is 58.65 m long. It is mainly located in the accumulation area at the mouth of the Laqi Gully and poses the most serious threat to the safety of pedestrians and vehicles as well as threatening road facilities. The medium- and low-risk sections are 27.36 m and 24.1 m, respectively. They are located at both ends of the high-risk section in sequence and still pose certain dangers to traffic. Therefore, when a mudslide occurs, it is very necessary to promptly prevent pedestrians and vehicles from entering the dangerous area of this section of the road.
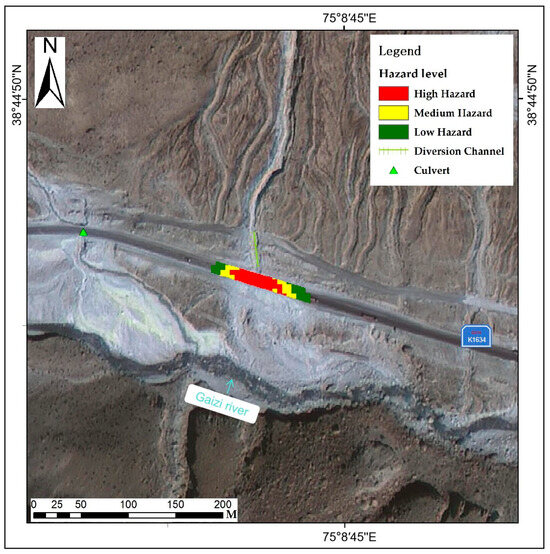
Figure 14.
Hazard zoning map at the Laqi Gully crossing of the China–Pakistan Highway.
5. Discussion
5.1. The Impact of Climate Change on Debris Flows in Laqi Gully
The world is currently facing the severe challenge of global warming, with precipitation and temperature patterns exhibiting significant changes of varying degrees across regions. Assessing historical climate change and predicting future trends are critical measures for addressing climate change challenges, mitigating associated risks, and implementing proactive management strategies. Laqi Gully is located in the Karakoram Mountains in the eastern Pamir Plateau, which has abundant sources of debris and frequent debris flow disasters. As debris flow events in this region are often driven by the combined effects of precipitation and meltwater, their future activity will inevitably be affected by climate change.
Observation data (1995–2023) show that the Laqi Gully region has experienced a trend of increasing high temperatures and decreasing low temperatures. The rate of decline in minimum temperature is about 0.3 °C·(10a)−1, while the increase in maximum temperature is particularly significant, exceeding 1.0 °C·(10a)−1. In terms of precipitation, the annual total precipitation has not changed significantly, but the daily maximum precipitation and the maximum precipitation over five consecutive days have both shown a significant upward trend, with increases of 0.9 mm·(10a)−1 and 1.3 mm·(10a)−1, respectively. Overall, the daily temperature range in the region has increased, while annual precipitation remains stable, but short-duration heavy precipitation and prolonged heavy rainfall events have significantly increased [40]. Regarding future climate change trends in the Laqi Gully area, relevant studies have estimated changes in the Karakoram Mountains in the 21st century based on the CMIP6 model ensemble [41]. Compared with the reference period (1995–2014), under the SSP1-2.6, SSP2-4.5, and SSP5-8.5 scenarios, the annual average temperature increase trends for the period 2015–2099 are 0.1 °C·(10a)−1, 0.3 °C·(10a)−1, and 0.7 °C·(10a)−1, respectively, while the annual precipitation increases are 0.2%·(10a)−1, 2.0%·(10a)−1, and 4.0%·(10a)−1, respectively. It is worth noting that before 2050, both temperature and precipitation show a slow upward trend across different scenarios, with relatively small differences in projections. After that, as time passes, the differences and uncertainties in the estimates under different scenarios will increase significantly.
In summary, whether it is historical assessment or future estimates, the average annual temperature and annual precipitation in the Laqi Gully area will show a slow upward trend. Given that debris flow activity in this area is significantly affected by the coupled effects of temperature and precipitation, it is expected that the scale and frequency of debris flow events in the future may be higher than the current level. In addition, considering that the estimated changes in temperature and precipitation are relatively limited, it is likely that the triggering mechanism of debris flows in this area will continue to be dominated by the coupling of precipitation and meltwater. In the future, we will continue to monitor climate change in the Laqi Gully area to continuously update and evaluate its evolution trends.
5.2. Methodological Framework, Limitations, and Practical Implications
In this study, the hazard of rainfall–meltwater coupled debris flow in Laqi Gully was systematically assessed by combining high-precision DEM and FLO-2D modelling. The simulation results showed that the debris flow velocity was significantly elevated in the narrow gully (up to 8.12 m/s), while the flow velocity decreased after flowing through the road (0–3.36 m/s), and the flow depth showed the opposite trend. This phenomenon is consistent with the study of Chen, J. et al. [42], indicating that the change in topographic gradient has a decisive influence on the kinetic energy distribution of debris flow. However, despite the low flow depth (up to 2.56 m) in the highway section, the risk of damage to transport facilities cannot be ignored, highlighting the complex relationship between local topographic features and engineering vulnerability [43].
In this study, a high-precision DEM was constructed using Gaofen-7 satellite data. Compared with the traditional open-source DEM, the high-resolution terrain data more accurately depicted the V-shaped valley characteristics of Laqi Gully, thus reducing the deviation of the spreading range of the debris flow in the simulation from the real situation. This technical improvement provides a methodological reference for the study of debris flows in similar alpine narrow valleys. In addition, the peak flow of debris flow under different recurrence periods was obtained by the rainfall–meltwater coupling model in this study, and the final simulation results differed less from the real disaster situation, which demonstrated the high accuracy of the model. However, there are still some limitations in this study: Firstly, key parameters (such as the Manning coefficient and volume concentration) are primarily set based on recommended values from the user manual and empirical values from literature, which may introduce errors due to regional differences. Secondly, GF-7 satellite data is not publicly available, and its acquisition requires specific channels and costs, constituting limitations in data sources, with room for improvement in scalability. Furthermore, as this study requires long-term meteorological observation data, we compared the meteorological data of Laqi Gully and the nearest Tashkurgan meteorological station for the past three years and found that the average annual temperature difference between the two was 1.56 degrees Celsius, and the average annual precipitation difference was 27 mm, which are relatively small errors. Therefore, the meteorological data used in this study is sourced from the Tashkurgan station, which is 114 km away, and does not account for the impact of local microclimate differences on the rainfall–meltwater coupling process, which may result in some deviation in the final results. Future studies can optimize the model inputs through field hydrological monitoring and parameter inversion, and improve the spatial and temporal resolution of the coupled rainfall–meltwater equations by combining them with climate models.
From the perspective of disaster prevention practice, the three-level hazard zoning (high, medium, and low) proposed in this study provides a scientific basis for the risk management of Laqi Gully section. The high-risk zone (58.65 m) needs to prioritize the implementation of engineering measures, such as reinforcing the roadbed and setting up barrier structures; the medium-risk zone (27.36 m) can reduce the risk through the early warning system and regular dredging; and the low-risk zone (24.1 m) needs to strengthen the monitoring and emergency response drills. In addition, the Gaizi River has the protective function of a natural sedimentary zone, and in the future, a composite prevention and control strategy that combines ecological engineering (e.g., slope stabilization by vegetation) and river dredging can be explored.
6. Conclusions
In this study, a rainfall–meltwater coupled debris flow hazard assessment system based on a high-precision DEM and FLO-2D model was constructed using the Laqi Gully of the China–Pakistan Highway as a typical case, and the main conclusions are as follows:
(1) The debris flow velocity increased significantly (up to 8.12 m/s) with the steepness of the terrain in the gully, and decelerated to below 3.36 m/s in the highway section due to the widening of the terrain. The flow depth of the debris flow shows the distribution pattern of shallow in the channel and deep in the highway and depositional area, which reveals the double role of topographic gradient on the transformation of the kinetic energy of debris flow: the steep channel accelerates the flow, and the flat area promotes the deposition, which provides the theoretical basis for the differentiated design of engineering protection.
(2) Based on the intensity–probability coupling classification model, the high-, medium-, and low-danger zones of the Laqi Gully road section account for 58.65 m, 27.36 m, and 24.1 m, respectively. The high-danger zones are concentrated in the confluence of the gully highway and Gaizi River, which need to be protected in a key way, while the medium- and low-danger zones need to be strengthened in terms of monitoring and early warning.
(3) The 1 m level high-precision ground elevation model was acquired by GF-7 stereo image pairs, which accurately portrayed the V-shaped valley characteristics of Laqi Gully. The combination of Gaofen-7 satellite data and the FLO-2D model solves the problem of the insufficient accuracy of open-source DEMs in narrow valley terrain, and provides a generalizable technical framework for the numerical simulation of narrow valley-type debris flows.
(4) In this study, the synergistic driving effect of precipitation and snow and ice meltwater on debris flow was quantified by integrating the degree day factor model with rainstorm parameters. The results show that the contribution of flood flow to debris flow magnitude increases with longer return periods under different return periods (10, 20, 50, and 100 years), and the simulation error rate (17.64%) verifies the reliability of the model.
The results of this study can directly serve disaster prevention and control for the China–Pakistan Highway, optimize resource allocation through accurate risk zoning, reduce the risk of highway operation disruption, and contribute to the realization of ‘sustainable infrastructure’ in the United Nations Sustainable Development Goal (SDG 9). To address the shortcomings of this study, future research can further integrate real-time meteorological monitoring and multi-scenario climate prediction to improve the model’s response to extreme events, and explore the integration of artificial intelligence technology into debris flow early warning systems to enhance the resilience of regional disaster prevention.
Author Contributions
Conceptualization, X.D. and Q.L.; methodology, X.D. and Q.L.; formal analysis, X.D.; investigation, Q.L., Z.L., and X.W.; data curation, Q.L. and Z.L.; writing—original draft preparation, Q.L.; writing—review and editing, X.D.; supervision, X.W. All authors have read and agreed to the published version of the manuscript.
Funding
This study was funded by Xinjiang Key R&D Program Projects (grant numbers 2022B03033-1).
Institutional Review Board Statement
Not applicable.
Informed Consent Statement
Not applicable.
Data Availability Statement
The original contributions presented in the study are included in the article; further inquiries can be directed to the corresponding author.
Conflicts of Interest
Author Xincheng Wu was employed by the company Xinjiang Transportation Construction Group Co. The remaining authors declare that the research was conducted in the absence of any commercial or financial relationships that could be construed as a potential conflict of interest.
References
- Wang, C.; Lim, M.K.; Zhang, X.; Zhao, L.; Lee, P.T.-W. Railway and Road Infrastructure in the Belt and Road Initiative Countries: Estimating the Impact of Transport Infrastructure on Economic Growth. Transp. Res. Part A Policy Pract. 2020, 134, 288–307. [Google Scholar] [CrossRef]
- Ali, S.; Haider, R.; Abbas, W.; Basharat, M.; Reicherter, K. Empirical Assessment of Rockfall and Debris Flow Risk along the Karakoram Highway, Pakistan. Nat. Hazards 2021, 106, 2437–2460. [Google Scholar] [CrossRef]
- Petrova, E. Investigation of Accidents in the Infrastructure Triggered by Debris Flows in Russia. Nat. Hazards 2022, 114, 3293–3308. [Google Scholar] [CrossRef]
- He, N.; Song, Y.; Hu, G.; Yang, Z.; Fu, Q.; Gurkalo, F. The Distribution Law and Coupling Factors of Debris Flows in the G318 Linzhi–Lhasa Section of the Sichuan–Tibet Traffic Corridor. Front. Ecol. Evol. 2023, 11, 1166239. [Google Scholar] [CrossRef]
- Li, Y.; Wang, Y.; Wang, X.; Qi, J.; Zhang, X.; Lin, Q. Risk Assessment of Glacial Debris Flow on Highway under Warming Climate: A Case Study of Tianmo Gully in the Southeastern Tibetan Plateau. Ecol. Indic. 2024, 167, 112606. [Google Scholar] [CrossRef]
- Cui, P.; Xiang, L.; Zou, Q. Risk Assessment of Highways Affected by Debris Flows in Wenchuan Earthquake Area. J. Mt. Sci. 2013, 10, 173–189. [Google Scholar] [CrossRef]
- Ali, S.; Biermanns, P.; Haider, R.; Reicherter, K. Landslide Susceptibility Mapping by Using a Geographic Information System (GIS) along the China–Pakistan Economic Corridor (Karakoram Highway), Pakistan. Nat. Hazards Earth Syst. Sci. 2019, 19, 999–1022. [Google Scholar] [CrossRef]
- Zheng, Y.; Du, W.; Li, Y.; Chai, H.; Banerjee, A. Glacier Mass Variations in the China-Pakistan Highway Regions from Multi-Source Altimetric Remote Sensing Data. Geocarto Int. 2025, 40, 2491649. [Google Scholar] [CrossRef]
- Qing, F.; Zhao, Y.; Meng, X.; Su, X.; Qi, T.; Yue, D. Application of Machine Learning to Debris Flow Susceptibility Mapping along the China–Pakistan Karakoram Highway. Remote Sens. 2020, 12, 2933. [Google Scholar] [CrossRef]
- Special Subsystem for Road Maintenance at the Autonomous Region Road Business Development Centre. Available online: http://117.190.86.45:8089/a/login (accessed on 20 September 2024).
- Chiou, I.-J.; Chen, C.-H.; Liu, W.-L.; Huang, S.-M.; Chang, Y.-M. Methodology of Disaster Risk Assessment for Debris Flows in a River Basin. Stoch. Environ. Res. Risk Assess. 2015, 29, 775–792. [Google Scholar] [CrossRef]
- Li, Y.; Zheng, B.; Guo, S.; Zou, Y.; Zhang, Y.; Han, X.; Zada, K.; Waqar, M.F.; Qi, S.; Chen, J. Assessment of Debris Flow Risk in Mentougou District, Beijing, Based on Runout of Potential Debris Flow. Front. Earth Sci. 2024, 12, 1426980. [Google Scholar] [CrossRef]
- Le, M.; Han, Q.; Fang, C.; Guan, J.A. Framework for Hazard Assessment of Debris Flow Accumulation Areas. Appl. Ecol. Environ. Res. 2019, 17, 6255–6267. [Google Scholar] [CrossRef]
- Zhang, X.-J.; Gu, X.-B. The Application of Gray System-Variable Fuzzy Sets Coupling Theory on the Susceptibility Assessment of Debris Flow Hazards. Front. Earth Sci. 2023, 11, 1291454. [Google Scholar] [CrossRef]
- Niu, C.; Wang, Q.; Chen, J.; Zhang, W.; Xu, L.; Wang, K. Hazard Assessment of Debris Flows in the Reservoir Region of Wudongde Hydropower Station in China. Sustainability 2015, 7, 15099–15118. [Google Scholar] [CrossRef]
- Shen, S.; Xie, H.; Xu, Y.; Zhang, M.; Niu, X.; Li, G. Fuzzy Comprehensive Evaluation of Debris Flow in Matun Village, Laomao Mountain Area, Dalian City. Arab. J. Geosci. 2020, 13, 49. [Google Scholar]
- Liu, Y.; Guo, H.C.; Zou, R.; Wang, L.J. Neural Network Modeling for Regional Hazard Assessment of Debris Flow in Lake Qionghai Watershed, China. Environ. Geol. 2006, 49, 968–976. [Google Scholar] [CrossRef]
- Uchida, T.; Nishiguchi, Y.; McArdell, B.W.; Satofuka, Y. The Role of the Phase Shift of Fine Particles on Debris Flow Behavior: An Numerical Simulation for a Debris Flow in Illgraben, Switzerland. Can. Geotech. J. 2021, 58, 23–34. [Google Scholar] [CrossRef]
- Barnhart, K.R.; Miller, C.R.; Rengers, F.K.; Kean, J.W. Evaluation of Debris-Flow Building Damage Forecasts. Nat. Hazards Earth Syst. Sci. 2024, 24, 1459–1483. [Google Scholar] [CrossRef]
- Kurovskaia, V.; Chernomorets, S.S.; Krylenko, I.N.; Vinogradova, T.A.; Dokukin, M.D.; Zaporozhchenko, E.V. Buzulgan Rockslide: Simulation of Debris Flows along Gerkhozhan-Su River and Scenarios of Their Impact on Tyrnyauz Town after Changes in 2020. Water Resour. 2022, 49, 58–68. [Google Scholar] [CrossRef]
- Ding, X.; Hu, W.; Liu, F.; Yang, X. Risk Assessment of Debris Flow Disaster in Mountainous Area of Northern Yunnan Province Based on FLO-2D under the Influence of Extreme Rainfall. Front. Environ. Sci. 2023, 11, 1252206. [Google Scholar] [CrossRef]
- Chang, M.; Tang, C.; Van Asch, T.W.J.; Cai, F. Hazard Assessment of Debris Flows in the Wenchuan Earthquake-Stricken Area, South West China. Landslides 2017, 14, 1783–1792. [Google Scholar] [CrossRef]
- Zhang, S.; Zhang, L.; Li, X.; Xu, Q. Physical Vulnerability Models for Assessing Building Damage by Debris Flows. Eng. Geol. 2018, 247, 145–158. [Google Scholar] [CrossRef]
- Lin, J.; Yang, M.; Lin, B.; Lin, P. Risk Assessment of Debris Flows in Songhe Stream, Taiwan. Eng. Geol. 2011, 123, 100–112. [Google Scholar] [CrossRef]
- Zheng, H.; Guo, L.; Liu, J.; Chen, B.; Liu, L. The Application of Numerical Simulation in Debris Flow Disaster Early Warning: A Case Study of Shiyang Gully, China. Land. 2025, 14, 181. [Google Scholar] [CrossRef]
- Zhuang, J.; Ma, P.; Chang, L.; Ma, Z.; Zhan, J.; Zhu, Y.; Kong, J.; Chen, S.; Peng, J. Mudflows Due to Liquefaction Triggered by Earthquakes in Terrains with Gentle Lower Slopes: A Case Study. Landslides 2025, 22, 95–108. [Google Scholar] [CrossRef]
- Zhang, S.; Fang, Z.; Dai, C.; Wang, S.; Peng, J.; Zhou, Y.; Shen, P. Debris Flow Runout Behaviors Considering the Influences of Densely Populated Buildings. J. Mt. Sci. 2024, 21, 2696–2712. [Google Scholar] [CrossRef]
- Oh, C.; Jun, K. Analysis of Debris Flow Damage Using High-Resolution Topographical Data. Water 2023, 15, 3454. [Google Scholar] [CrossRef]
- Jia, X.; Lv, J.; Luo, Y. Simulation and Management Impact Evaluation of Debris Flow in Dashiling Gully Based on FLO-2D Modeling. Appl. Sci. 2024, 14, 4216. [Google Scholar] [CrossRef]
- Peng, S.; Lu, S. FLO-2D Simulation of Mudflow Caused by Large Landslide Due to Extremely Heavy Rainfall in Southeastern Taiwan during Typhoon Morakot. J. Mt. Sci. 2013, 10, 207–218. [Google Scholar] [CrossRef]
- Zhang, P.; Liu, X.; Shu, H. Hazard Assessment of Debris Flow by Using FLO-2D and Hazard Matrix: A Case Study of Qingshui Gully in the Southern Gansu Province, China. Desalination Water Treat. 2023, 315, 650–662. [Google Scholar] [CrossRef]
- Wang, Z.; Zhang, X.; Zhang, X.; Wu, M.; Wu, B. Hazard Assessment of Potential Debris Flow: A Case Study of Shaling Gully, Lingshou County, Hebei Province, China. Front. Earth Sci. 2023, 11, 1089510. [Google Scholar] [CrossRef]
- Abraham, M.T.; Satyam, N.; Pradhan, B.; Tian, H. Debris Flow Simulation 2D (DFS 2D): Numerical Modelling of Debris Flows and Calibration of Friction Parameters. J. Rock. Mech. Geotech. Eng. 2022, 14, 1747–1760. [Google Scholar] [CrossRef]
- Ye, Z.; Tian, Y.; Li, H.; Shao, C.; Gao, Y.; Wang, G. Risk Assessment and Control for Geohazards at Multiple Scales: An Insight from the West Han River of Gansu Province in China. Water 2024, 16, 1764. [Google Scholar] [CrossRef]
- O’Brien, J.S.; Julien, P.Y. Laboratory analysis of mud flow properties. J. Hydraul. Eng. 1988, 8, 877–887. [Google Scholar] [CrossRef]
- Yang, Z.; Fu, X.; You, Y. Discharge Prediction Method for Rainfall-Melting Water Triggered Glacial Debris Flows Under Climate Change Scenarios. Yangtze River 2021, 52, 34–39. [Google Scholar] [CrossRef]
- Zhou, P.; Tang, X. Geometric Accuracy Verification of GF-7 Satellite Stereo Imagery Without GCPs. IEEE Geosci. Remote Sens. Lett. 2022, 19, 1–5. [Google Scholar] [CrossRef]
- Tang, H.; Xie, J.; Tang, X.; Chen, W.; Li, Q. On-Orbit Radiometric Performance of GF-7 Satellite Multispectral Imagery. Remote Sens. 2022, 14, 886. [Google Scholar] [CrossRef]
- Fiebiger, G. Hazard mapping in Austria. J. Torrent Avalanche Landslide Rockfall Eng. 1997, 134, 93–104. [Google Scholar]
- Chen, S.; Meng, Q.; Dai, Y.; Li, W.; Yang, L. Hazard Assessment of Rockfall and Landslide on the Karakoram Highway Under the Influence of Extreme Climate. J. Eng. Geol. 2024, 32, 1010–1019. [Google Scholar] [CrossRef]
- Zhang, X.; Wang, X.; Hua, L.; Jiang, D. Projections of Temperature and Precipitation over Xinjiang Based on CMIP6 Models. Chin. J. Atmos. Sci. 2023, 47, 387–398. [Google Scholar] [CrossRef]
- Chen, J.; Chen, X.; Li, Y.; Wang, F. An Experimental Study of Dilute Debris Flow Characteristics in a Drainage Channel with an Energy Dissipation Structure. Eng. Geol. 2015, 193, 224–230. [Google Scholar] [CrossRef]
- Ouyang, C.; Wang, Z.; An, H.; Liu, X.; Wang, D. An Example of a Hazard and Risk Assessment for Debris Flows—A Case Study of Niwan Gully, Wudu, China. Eng. Geol. 2019, 263, 105351. [Google Scholar] [CrossRef]
Disclaimer/Publisher’s Note: The statements, opinions and data contained in all publications are solely those of the individual author(s) and contributor(s) and not of MDPI and/or the editor(s). MDPI and/or the editor(s) disclaim responsibility for any injury to people or property resulting from any ideas, methods, instructions or products referred to in the content. |
© 2025 by the authors. Licensee MDPI, Basel, Switzerland. This article is an open access article distributed under the terms and conditions of the Creative Commons Attribution (CC BY) license (https://creativecommons.org/licenses/by/4.0/).