Article

Transformation of Arable Lands in Russia over Last Half Century—Analysis Based on Detailed Mapping and Retrospective Monitoring of Soil–Land Cover and Decipherment of Big Remote Sensing Data

by
Dmitry I. Rukhovich
1,
Polina V. Koroleva
1,*,
Dmitry A. Shapovalov
2,
Mikhail A. Komissarov
3 and
Tung Gia Pham
4
1
Laboratory of Soil Informatics, V.V. Dokuchaev Soil Science Institute, Pyzhevskiy Pereulok 7, 119017 Moscow, Russia
2
Faculty of Land Management and Land Use Management, State University of Land Use Planning, Kazakova 15, 105064 Moscow, Russia
3
Laboratory of Soil Science, Ufa Institute of Biology UFRC RAS, Pr. Oktyabrya 69, 450054 Ufa, Russia
4
International School, Hue University, Hue City 53000, Vietnam
*
Author to whom correspondence should be addressed.
Sustainability 2025, 17(13), 6203; https://doi.org/10.3390/su17136203
Submission received: 28 April 2025 / Revised: 2 July 2025 / Accepted: 3 July 2025 / Published: 7 July 2025

Abstract

The change in the socio-political formation of Russia from a socialist planned system to a capitalist market system significantly influenced agriculture and one of its components—arable land. The loss of the sustainability of land management for arable land led to a reduction in sown areas by 38% (from 119.7 to 74.7 million ha) and a synchronous drop in gross harvests of grain and leguminous crops by 48% (from 117 to 61 million tons). The situation stabilized in 2020, with a sowing area of 80.2 million ha and gross harvests of grain and leguminous crops of 120–150 million tons. This process was not formalized legally, and the official (legal) area of arable land decreased by only 8% from 132.8 to 122.3 million ha. Legal conflict arose for 35 million ha for unused arable land, for which there was no classification of its condition categories and no monitoring of the withdrawal time of the arable land from actual agricultural use. The aim of this study was to resolve the challenges in the method of retrospective monitoring of soil–land cover, which allowed for the achievement of the aims of the investigation—to elucidate the history of land use on arable lands from 1985 to 2025 with a time step of 5 years and to obtain a detailed classification of the arable lands’ abandonment degrees. It was also established that on most of the abandoned arable land, carbon sequestration occurs in the form of secondary forests. In the course of this work, it was shown that the reasons for the formation of an array of abandoned arable land and the stabilization of agricultural production turned out to be interrelated. The abandonment of arable land occurred proportionally to changes in the soil’s natural fertility and the degree of land degradation. Economically unprofitable lands spontaneously (without centralized planning) left the sowing zone. The efficiency of land use on the remaining lands has increased and has allowed for the mass application of modern farming systems (smart, precise, landscape-adaptive, differentiated, no-till, strip-till, etc.), which has further increased the profitability of crop production. The prospect of using abandoned lands as a carbon sequestration zone in areas of forest overgrowth has arisen.

1. Introduction

Since 1985, Russian agriculture has been losing its stability and sustainability. This has occurred due to the collapse of the USSR, i.e., against the backdrop of a change in the socio-political formation from a socialist planned one to a capitalist market one [1]. In the short period from 1987 to 1991, the transition to a market economy was carried out [2,3]. Russia’s sown area rapidly reduced from 119.7 to 74.7 million ha [4], and the gross harvest of grain and leguminous crops has fell synchronously from 117 to 61 million tons [5]. At the same time, the statistical arable land area reduced much more slowly, from 132.7 to 122.3 million ha [6]. By 2020, the situation had stabilized, with a sown area of 80 million ha and a gross harvest of grain and leguminous crops of 120–150 million tons. In other words, stabilization occurred when more than 35 million ha of arable lands were withdrawn from agricultural use, or the arable area of Russia was reduced by more than 26% and the sown area by more than 30%. Cartographic knowledge of this phenomenon is extremely low [7].
There was no cartographic monitoring of the reduction in arable land. There are no up-to-date large-scale maps of agricultural lands in Russia for 2025. The latest calculations of the carbon balance of arable land in Russia for the FAO [8] were based on raster maps (grid) of arable land constructed using automated methods of decoding remote sensing data (RSD) [9]. The accuracy of these maps is not high, which introduces significant errors in calculations based on them [10]. The imperfection of raster maps of arable lands leads to multiple methods for their creation by different organizations [11,12,13,14]. The producers point out that, despite all their shortcomings, these maps are significantly better than official resources—the remote monitoring system of lands of the Ministry of Agriculture of the Russian Federation [15] and the Unified Federal Information System on Agricultural Lands [16].
The monitoring of arable lands was stopped between 1985 and 1992, when large-scale soil maps [17] and intra-farm land management schemes [18] ceased to be updated. Before 1985, land management and soil maps covered all croplands in Russia at scales of 1:10,000 or 1:25,000 [19].
The lack of detailed cartographic monitoring of arable lands led to a reliance solely on statistical information, the quality of which began to decline [20,21]. As a result, several decrees of the Russian government with different directions were adopted. In pursuance of the Decree of the President of the Russian Federation of November 4, 2020 № 666 “On the reduction of greenhouse gas emissions” [22], the Resolution of the Russian Federation Government of September 21, 2020 № 1509 “On the specifics of the use, protection, conservation, and reproduction of forests located on agricultural lands” was adopted [23]. The resolution takes into account the stabilization of agricultural production and provides declarative permission to leave abandoned arable land for carbon sequestration in the form of forests. A year later, the Russian Government Resolution of 14 May 2021 № 731 “On the state program for the effective involvement of agricultural lands into circulation and the development of the land reclamation complex of the Russian Federation” was adopted [24]. This resolution provides a basis for the deforestation of arable land and an increase in sown areas by 13 million ha. Without an up-to-date cartographic basis, this resolution led to a short-term increase in sown areas from 80.4 million ha in 2021 to 82.3 million ha in 2022, and then to a drop in sown areas to 80.2 million ha by 2025 [25].
The diversity of legislation is primarily due to Russia’s participation in the Paris Agreements [26] and the Kyoto Protocol [27] on the one hand and attempts to increase the tax base at the expense of arable land on the other. In the first case, low-fertility lands could be used to accumulate carbon in woody vegetation. The European Green Deal [28] supports the sequestration of atmospheric carbon in forest plantations. A plan is envisaged to plant 3 billion trees by 2030. Since 1984, Russia has been experiencing a spontaneous process of forest formation on abandoned arable land [29,30], but part of this unused arable land forms fallow land without forest vegetation [31,32]. In the second case, with the involvement of abandoned arable land, the planned plowing of 13 million ha should increase agricultural production.
The loss of large-scale soil and land management mapping in Russia is taking place against the backdrop of the development of precision farming systems worldwide since 1989 [33,34], which are based on high-precision mapping of arable land. The first precision farming breakthrough experiment, conducted in 1985 at the Minnesota Experimental Agricultural Station [35,36,37,38], was based on detailed mapping of soil cover.
A question arises about the restoration of the monitoring and detailed mapping system of arable lands in Russia in the period from 1985 to 2025 with a new special classification of abandoned lands [39]. And also, based on the reconstructed monitoring and detailed mapping, a system should be created for describing the condition of lands that will allow for informed decisions to be made on the cost-effective involvement of abandoned arable land in agricultural circulation or the creation of carbon sequestration sites.
The choice of the investigation period 1985–2025 is due to the end of the permanence of arable land areas in Russia by 1985 and the entry into a new plateau of its stability by 2020. This period is also characterized by the formation of a new component of big data [40]—big RSD [41]—which made it possible to develop a new methodology for monitoring arable land [39] and increase the accuracy of research [10].
The choice of the problem addressed in this work is determined by two global factors: the impact of changes in the use of arable land in Russia on the global stability of the food market and the accumulation of carbon in secondary forests on former arable land. In the period from 1984 to 2024, Russia went from being a net importer of grain and legumes to an exporter, reaching export volumes of 71.3 million tons in 2024 [42]. At the same time, secondary forests were formed on 32 million ha of arable land [12] and carbon was deposited. Changes in the arable land area may be accompanied by growth in export potential with an increase in carbon emissions from arable land. The legitimacy of decisions made in the form of assessing the growth in exports and carbon emissions requires the restoration (retrospection) of detailed monitoring of arable land use and the land’s condition.
Retrospective monitoring of soil and land (or soil–land) cover was chosen as it is the only method at the present time that ensures the restoration of monitoring of arable lands in Russia with a time step of 5 years and cartographic accuracy exceeding a scale of 1:10,000.
The aim of this study is to present a system for detailed cartographic description of the dynamics of arable land in Russia for the period from 1985 to 2025 based on the methodology of retrospective monitoring of soil–land cover with the use of RSD.

2. Materials and Methods
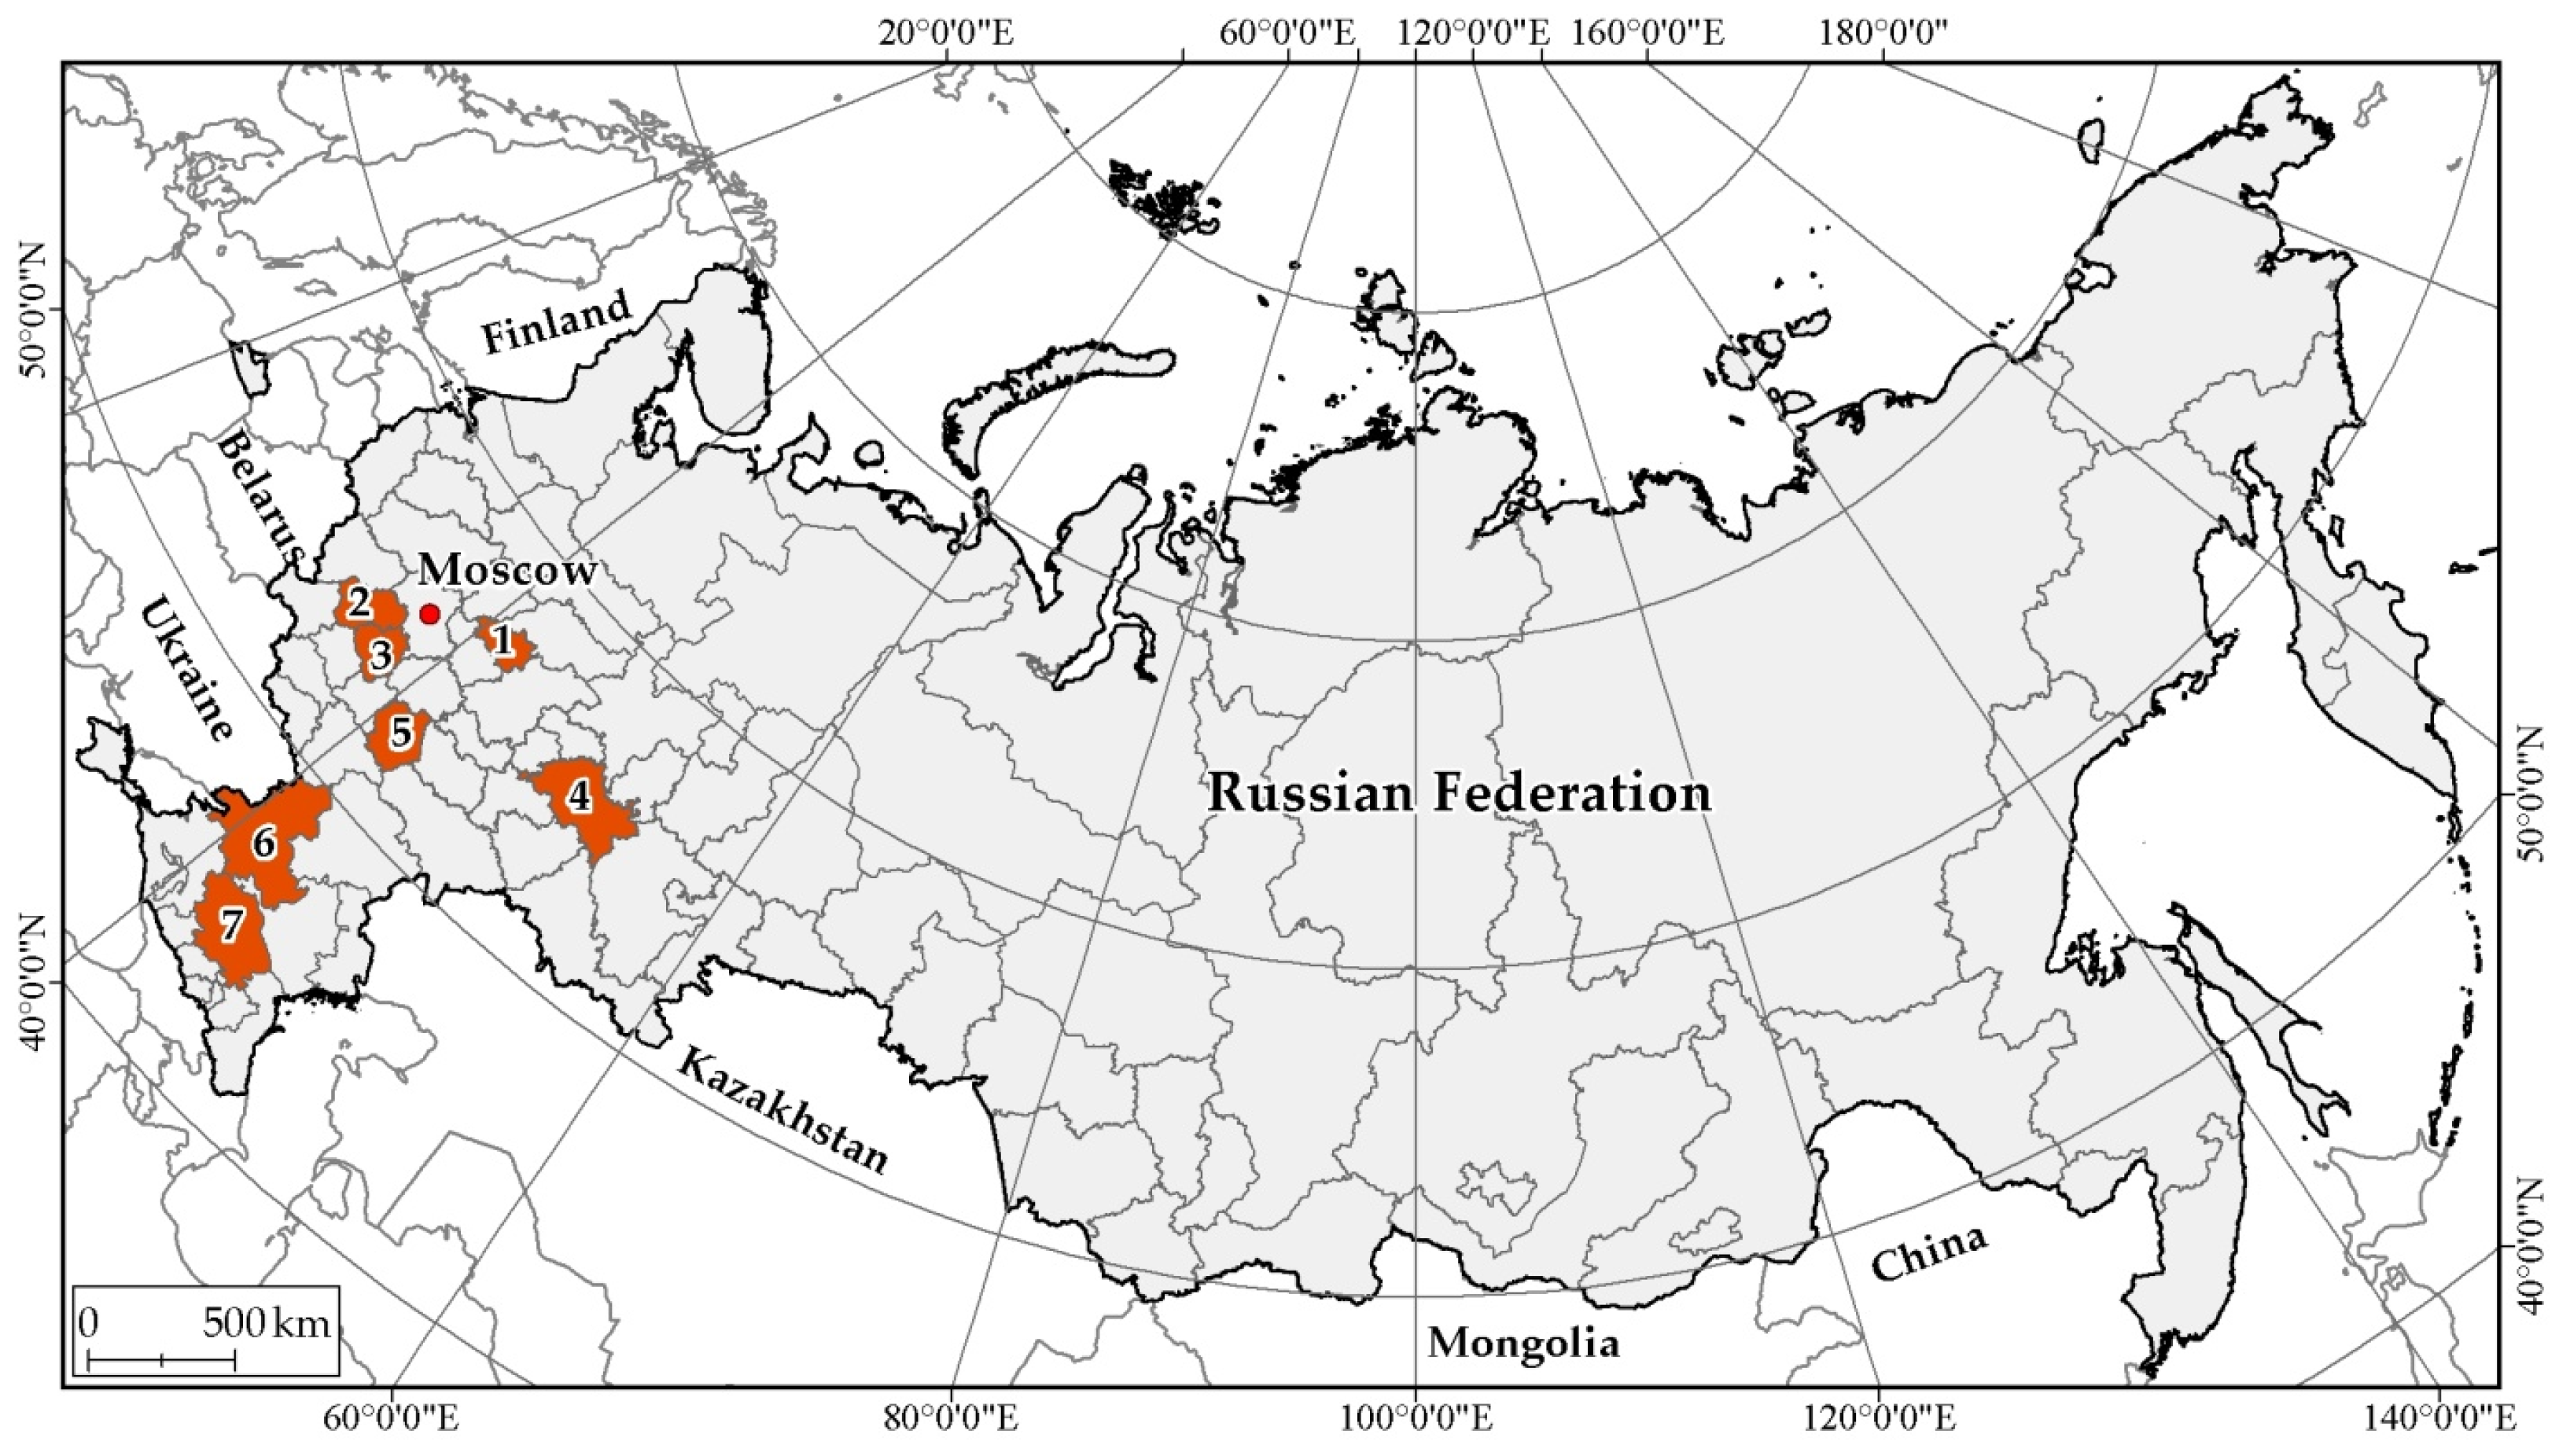
2.1. Study Area

The official decrease in the area of arable land in Russia is insignificant [6] and cannot serve as a justification for the choice of the object of research. The decrease in sown areas varies across different federal subjects of the country [4]. More intensive dynamics of sown areas are noted in the natural–agricultural zones [43] of the taiga and forest-steppe, with less intensity in the dry steppe zone and even less in the steppe. Examining the difference between the non-decreasing arable land area and the sharply declining sown area is the task of this study. The object of the study is arable lands in the European part of Russia along a transect from Stavropol Krai in the south to Ivanovo Oblast in the north (Figure 1) in four main natural–agricultural zones of Russia [43] (dry steppe, steppe, forest–steppe and southern taiga). Palekhsky District of Ivanovo Oblast was chosen as an example of the implementation of the main research technology/methodological approach (retrospective monitoring of soil–land cover).
The choice of basing this study on the transect is due to the lack of data on the monitoring of all arable lands of Russia in the investigation period. The transect selectively covers all natural and agricultural zones of Russia, i.e., allows for a spatial analysis of the problem in various natural conditions, which implies the possibility of extrapolating the results within each zone. The choice of Palekhsky District of Ivanovo Oblast as an example of the technology implementation is due to it having the most complex dynamics of arable lands among all transect objects, which allows for a demonstration of the most developed legend for retrospective monitoring of soil–land cover.
Palekhsky District of Ivanovo Oblast (56°41′52″–56°57′44″ N, 41°37′11″–42°18′06″ E) is located in the southern taiga forest zone, Central Russian province, western subprovince [43], on sod–podzolic soils [44] in the transition zone of soil-forming rocks from loamy to sandy. The moisture coefficient (according to Vysotsky-Ivanov [45]) is varied from 1.00 to 1.33, and the sum of active temperatures is 2000 °C. The sown areas of the district fluctuated in different directions from 2012 to 2024 from 4984 to 7200 ha according to the database of municipalities [46]. Before 2012, the database was not maintained. The sown areas of Ivanovo Oblast gradually decreased from 609.1 to 194.1 thousand ha from 1990 to 2024.

2.2. Materials

(1)
For task of developing decoding features:
-
Topographic maps at a scale of 1:25,000, GOSGISTSENTR 2007 [47];
-
Schemes of intra-farm land management at a scale of 1:25,000 from 1960 to 1980 [18];
-
Soil maps at a scale of 1:25,000 from 1960 to 1992 [17].
(2)
Decipherable materials:
-
High-spatial-resolution satellite imagery from open sources of 2017–2025 [48,49,50,51];
-
Medium-spatial-resolution satellite imagery, at 30 m, from Landsat 4, 5, 7, 8 and 9 of 1984–2025 [52];
-
Medium-spatial-resolution satellite imagery, at 10–20 m, from Sentinel from 2016 to 2025 [53].
(3)
Reference materials:
-
Topographic maps at a scale of 1:100,000 [54];
-
Topographic maps at a scale of 1:200,000 [55];
-
Cadastral maps [56];
-
DEM SRTM [57];
-
DEM COPERNICUS [58].

2.3. Methods

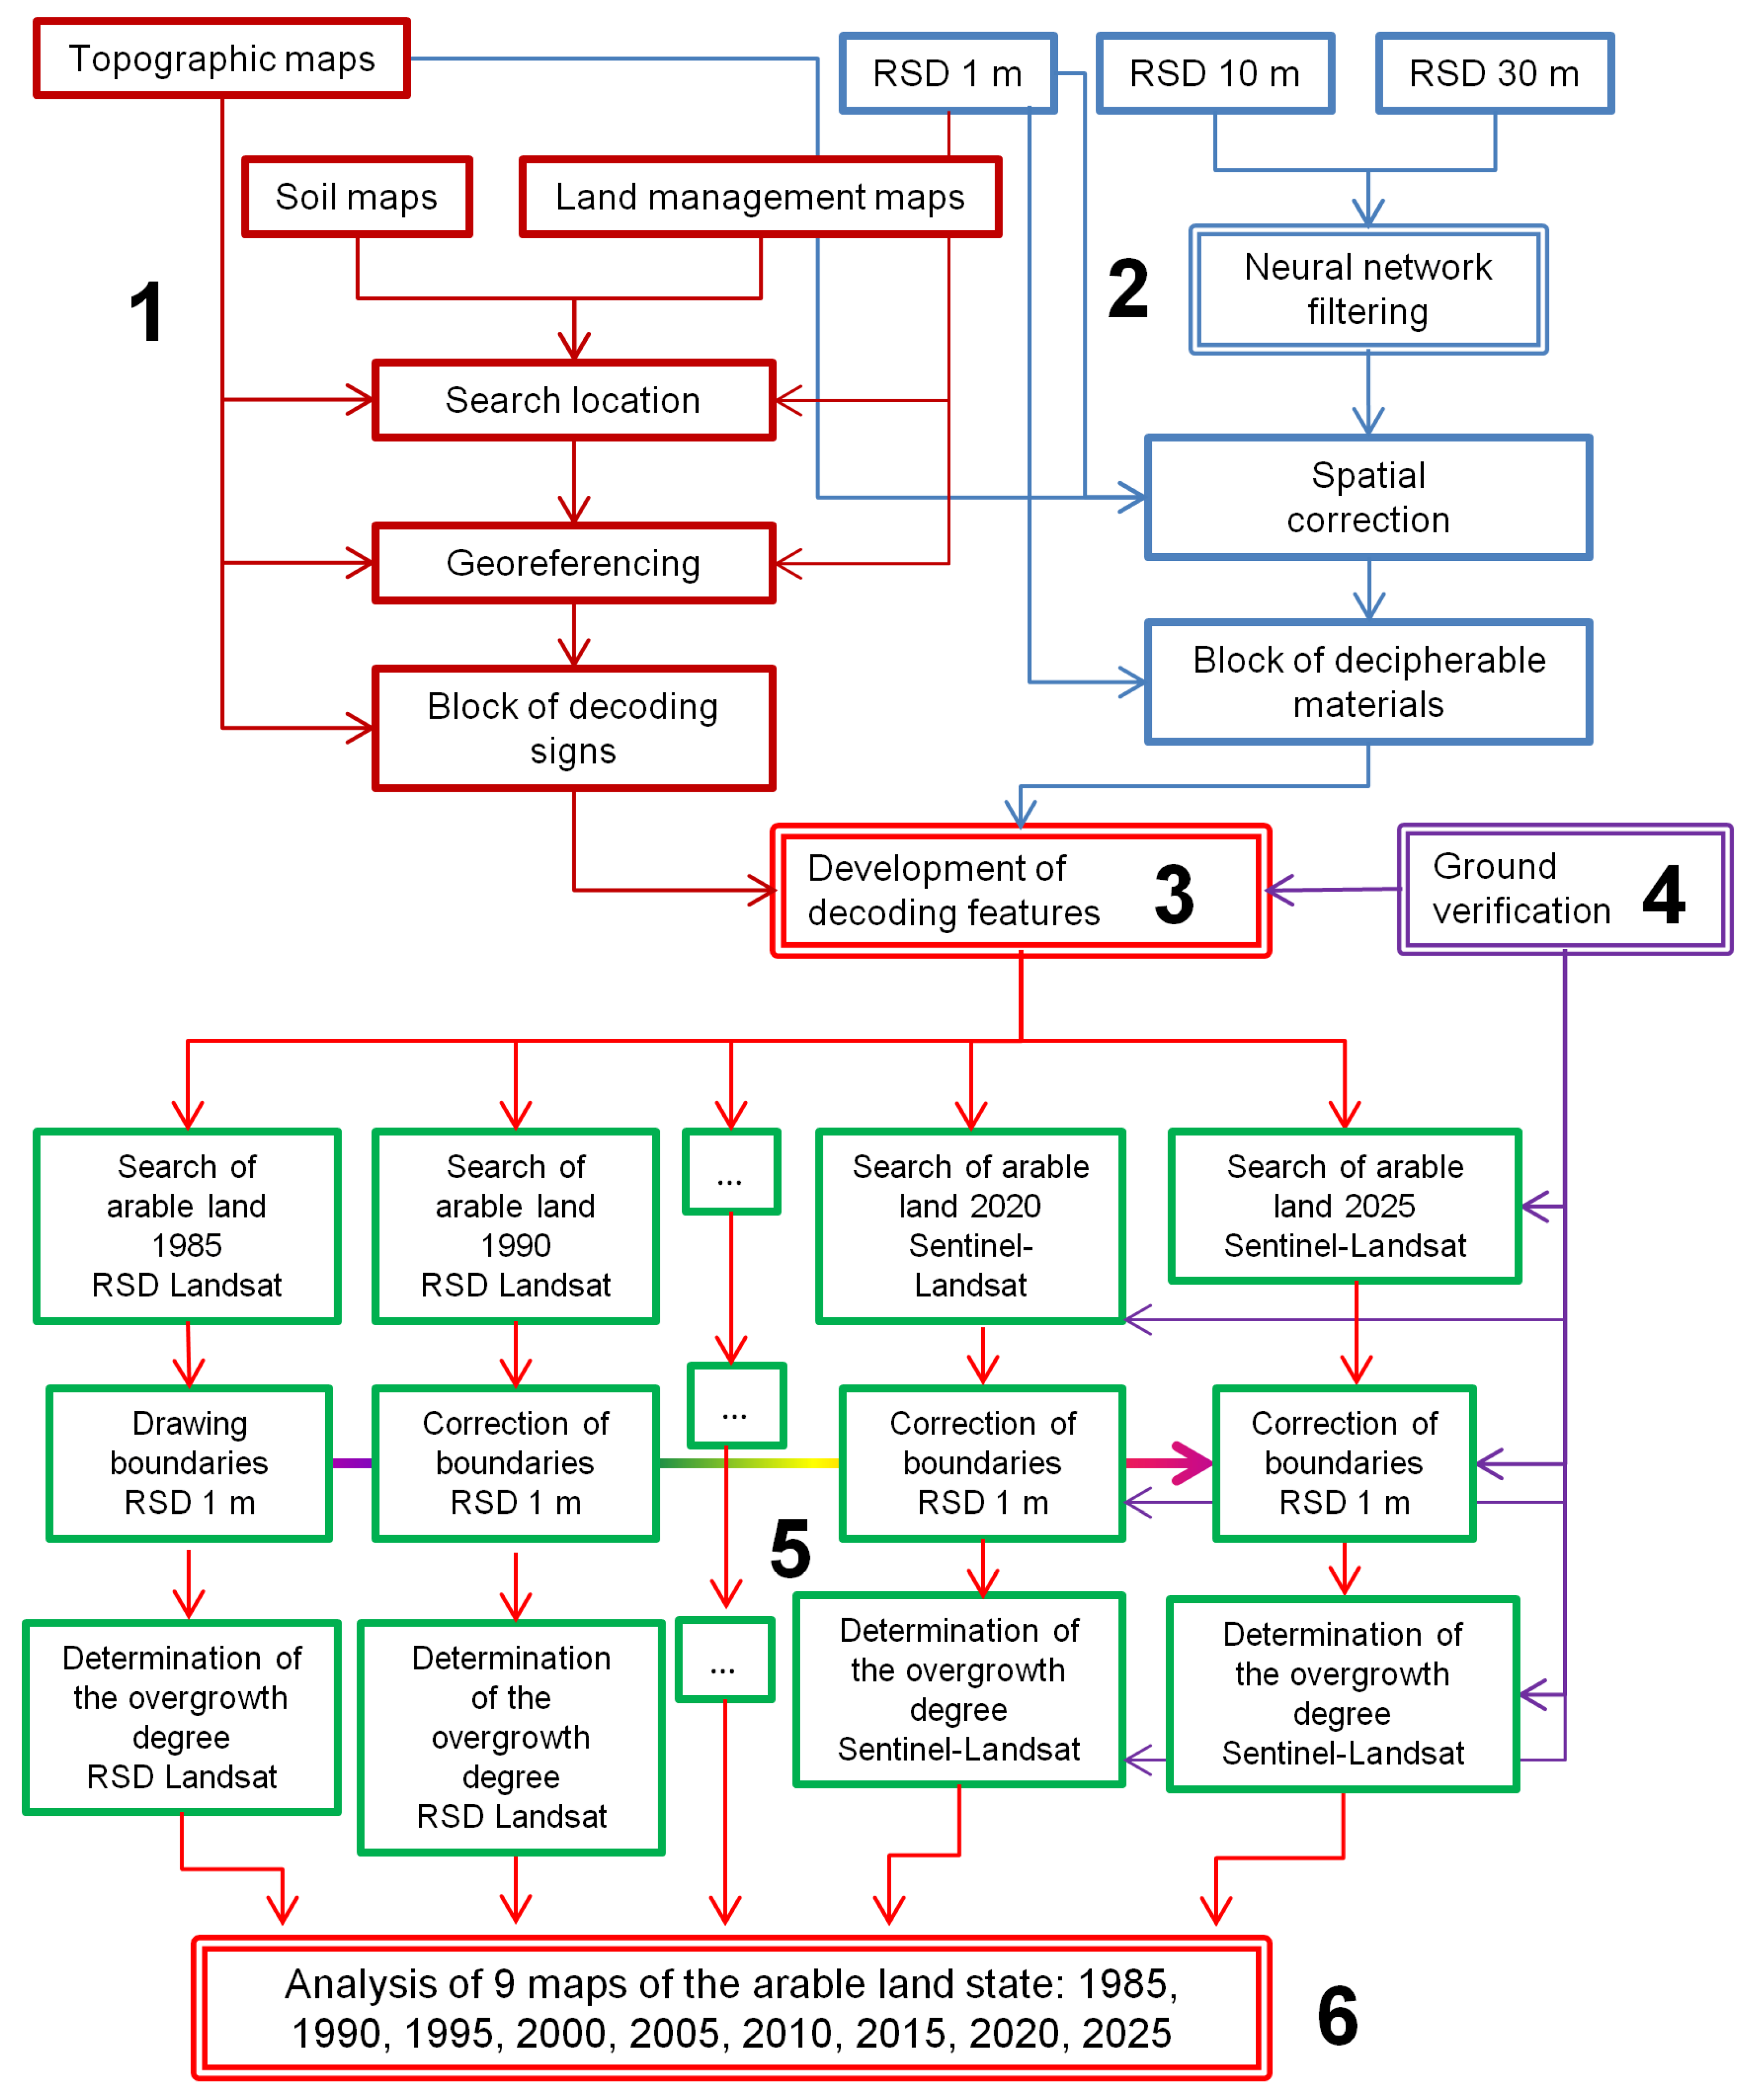
2.3.1. Cartographic Analysis

An analysis was conducted in this study to intersect various cartographic materials with each other to obtain electronic tables. ArcGIS 10.5 was used [59].

2.3.2. Geographic Information System (GIS) Technologies

For providing spatial compatibility of heterogeneous information, we applied the following procedures:
(1)
Transformation of archival land management, soil and agrochemical materials on distorted (deformed) paper media to the accuracy of topographic maps at a scale of 1:10,000 [39,60] (Figure 2).
For this, the GIS project must contain a block for searching the geographic location of archival information, since the archival materials themselves do not contain such data. Topographic maps act as such a block. The second block consists of high-resolution remote sensing materials, which allow for the georeferencing of archival materials by an already determined location.
(2)
Vectorization of georeferenced archival materials to support cartographic analysis.
(3)
Georeferencing of multi-temporal archives of RSD with a spatial resolution of 10 and 30 m to subpixel accuracy. This is carried out when the geographic location of RSD scenes differs by more than one resolution element (pixel) relative to cartographic materials at a scale of 1:10,000. ArcGIS was used [59].
(4)
Atmospheric correction was carried out using the ATCOR module of the ERDAS Imagine 15 software package [61]. Piecewise linear approximation of the spectral neighborhood of the soil line was used to normalize spectral characteristics [62].
(5)
Downloadable online remote sensing resources (Yandex, Google, Esri, Bing) were implemented in the GIS shells ArcGIS [59] and QGIS 3.16 [63].
Figure 2. Raster scheme of on-farm land management: (a)—1985 Landsat satellite image (the black lines are the boundaries of agricultural land, the digits indicate the numbers and areas of fields); (c)—high-resolution RSD of 2018 (the black lines are the boundaries of agricultural land); (b)—a soil map at a scale of 1:10,000 on the 1985 Landsat satellite image (the black lines are the boundaries of agricultural land and soil contours, the captions are soil nomenclature indices); (d)—2020 Sentinel satellite image (the black lines are the boundaries of agricultural land and soil contours).
Sustainability 17 06203 g002

2.3.3. Neural Networks

Deep machine learning (convolutional neural networks [64]) was used in this work for the sifting (data mining [65]) of multi-temporal archives of RSD [51,53]. With more than 2000 scenes for each point on the planet with a resolution of 10–30 m for the period from 1984 to 2025, it was necessary to select scenes suitable for deciphering the state of arable land, that is, without clouds, snow, not flooded by floods, etc. Several architectures were used: gradient boosting [66], CatBoost [67], and a convolutional neural network for a binary classification problem [68,69]. A more complete description of the training and application of neural networks for retrospective monitoring is presented in a previous work [70].
The quality of machine learning was assessed using traditional methods:
(1)
Test sample. A set of objects not used in training.
(2)
Acceptance sample. A set of objects not used in development.
(3)
Cross-validation (CV) [71,72]. The training sample is divided into N parts and training is performed N times on N-1 parts (without repetitions).

2.3.4. Principles of Interpretation

Retrospective monitoring is based on the visual, cameral and logical image-reference method of interpreting RSD based on the pattern and brightness of the image using land management materials and topographic and soil maps as standards (according to Konstantinovskaya [73]). The method involves some underestimation of the dynamics, since doubts about the interpretation of the monitoring event are interpreted in favor of recognizing its absence.
Maps created by the retrospective monitoring method correspond to the basic principles of their creation:
(1)
The map must be topological.
(2)
The map must be georeferenced.
(3)
The map must not contradict RSD.
(4)
The map must not contradict the DEM (digital elevation model).
(5)
The map must not contradict the topographic bases, if they in turn do not contradict the RSD.
(6)
A map may contradict previously created maps if and only if there is a justification for the changes being made.
(7)
Different thematic maps may have contours that do not coincide with each other if and only if this is caused by the difference in the ground location of thematic loads.
The methods of interpretation are described in more detail in a series of works [39,60,74,75,76].

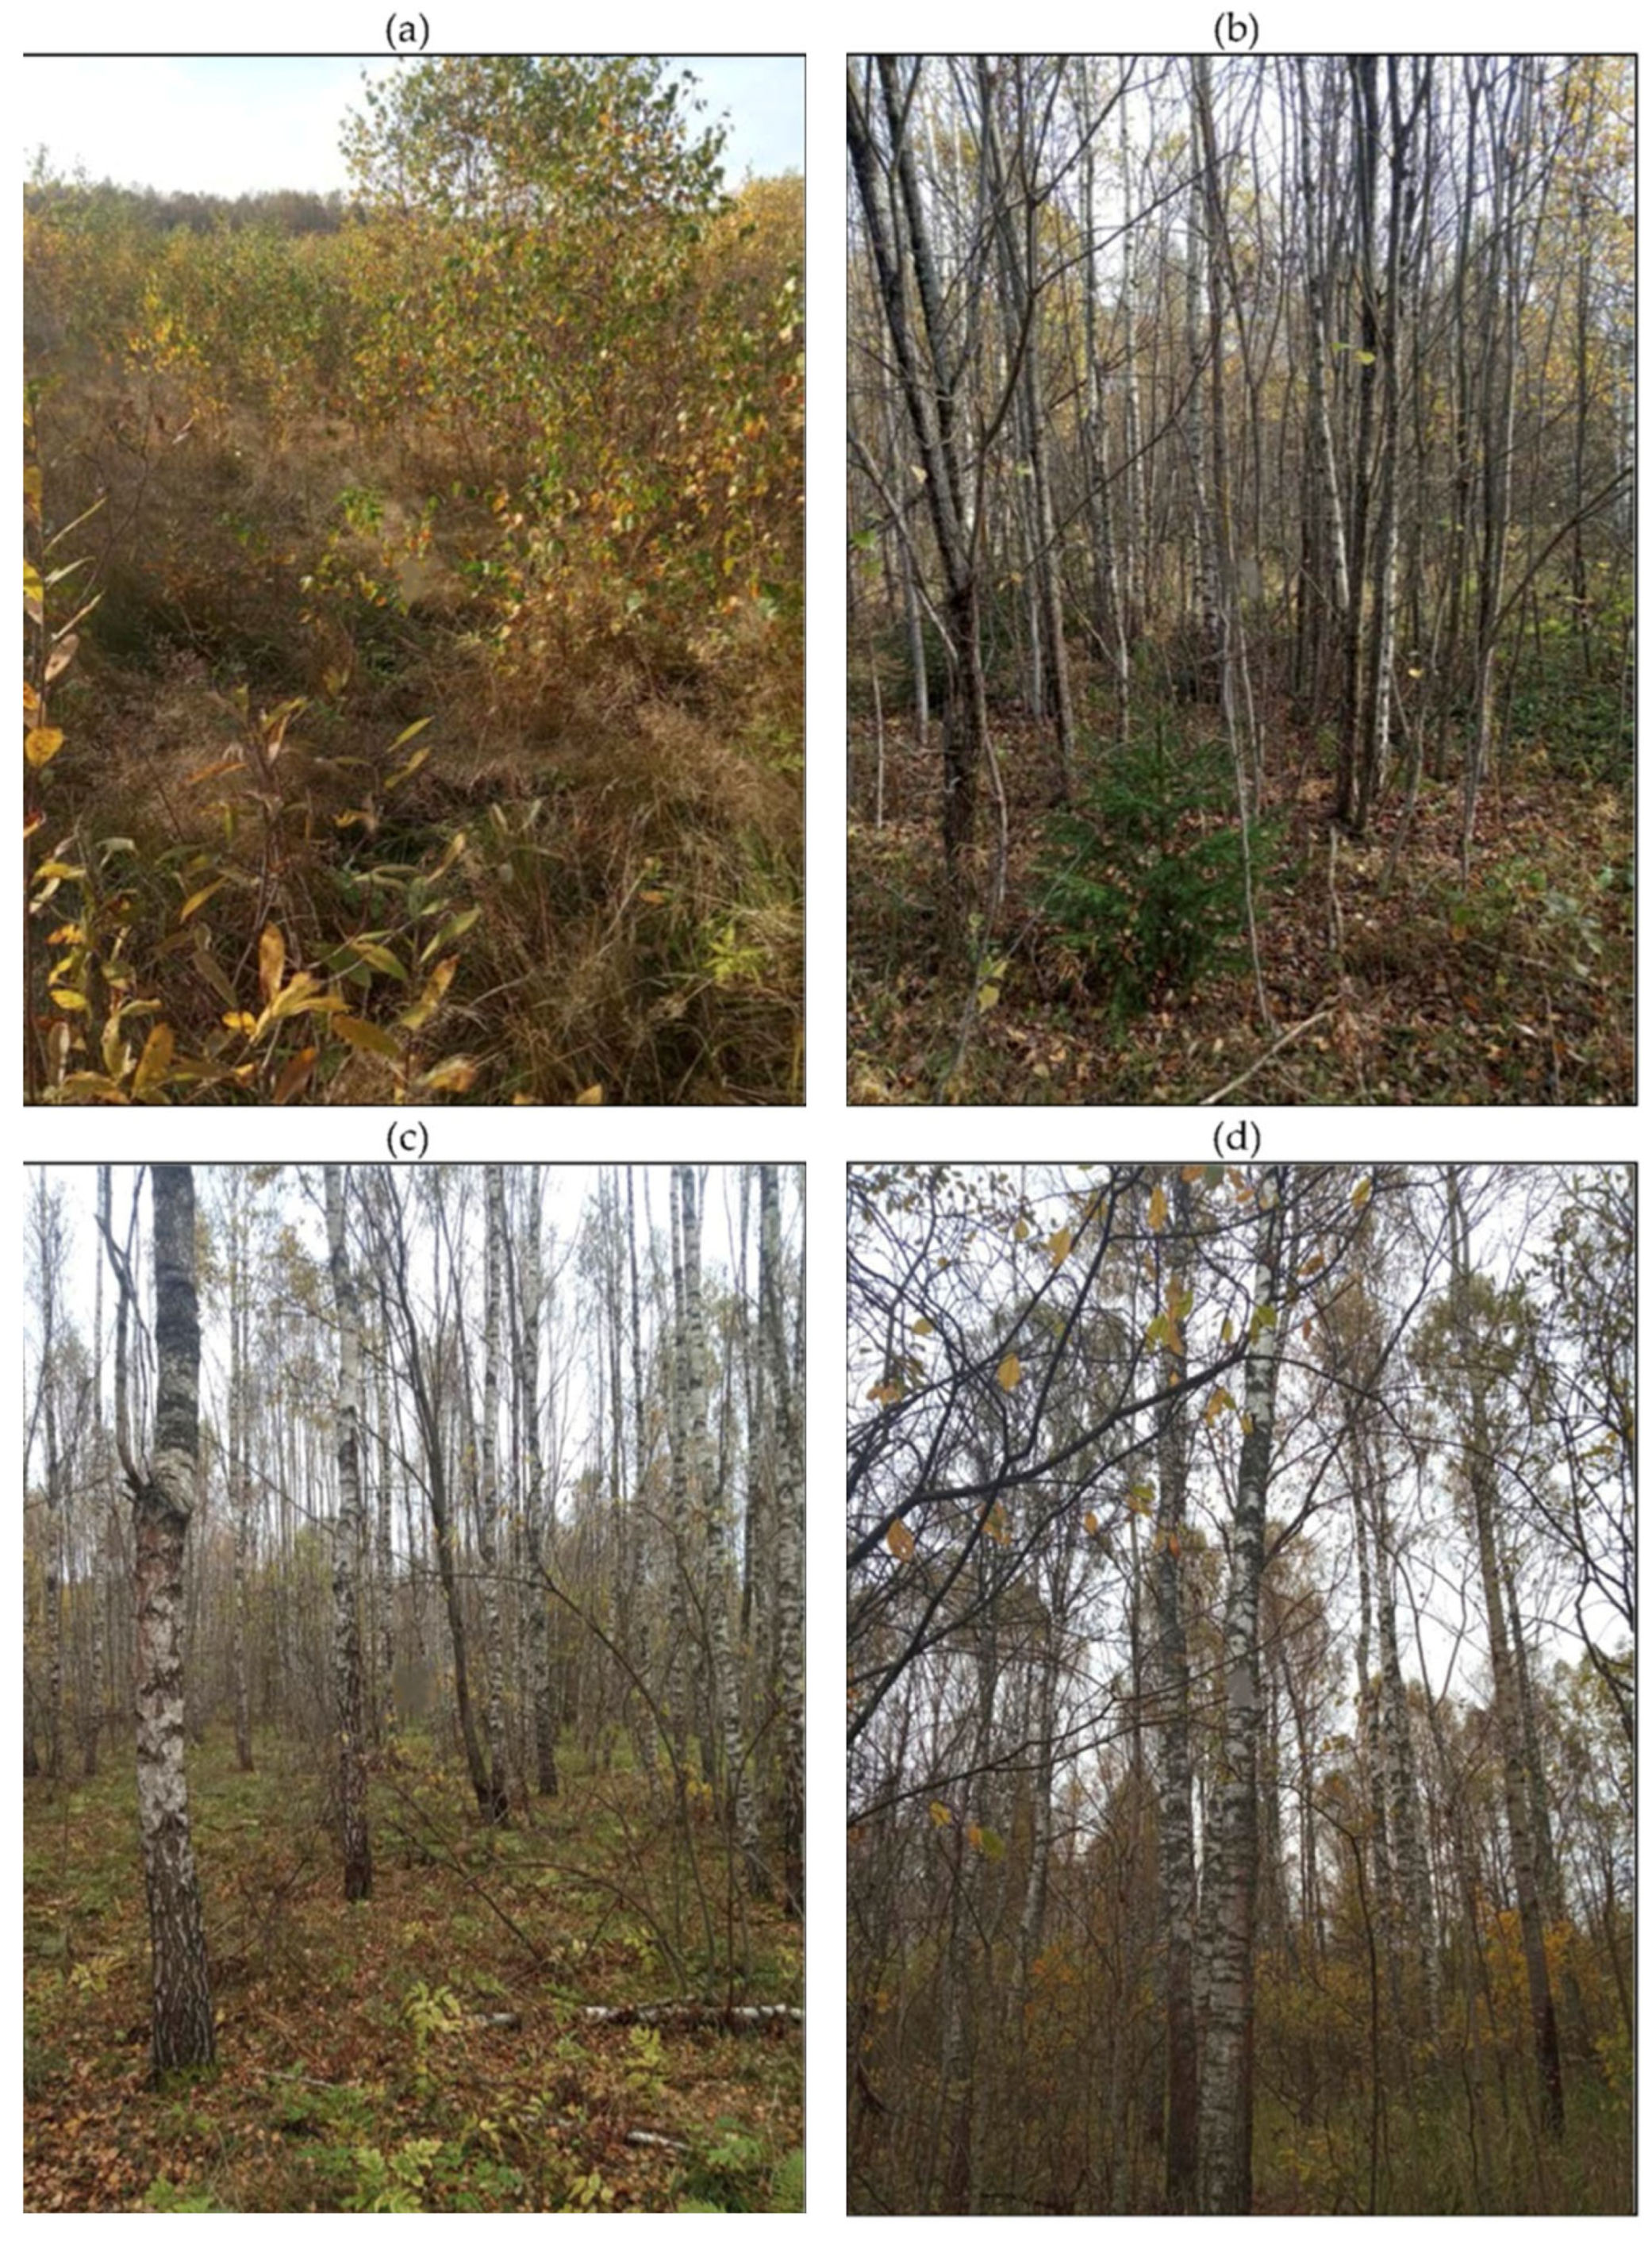
2.3.5. Ground Verification

The condition of woody and shrub vegetation (WSV) is based on the principles of vegetation taxation [77,78]. To verify the results of interpretation, forest taxation is carried out on the selected arable fields. A complete description of vegetation on an area of 1 ha and determination of timber reserves are carried out.

2.3.6. Block Diagram of This Work’s Technology

The methods used in this work are combined into a single sequence of actions (technology)—retrospective monitoring of the soil–land cover. The technology can be conditionally divided into 6 blocks, although most of the blocks intersect (Figure 3).
Block 1. Creation of a GIS project of topographic information for the development of interpretation features.
Topographic maps at the scales 1:100,000 and 1:200,000 are used mainly for searching for the location of soil maps and maps of intra-farm land management, since these maps do not have any geographic references. Topographic maps at a scale of 1:25,000 allow the georeferencing of soil and land management materials. High-spatial-resolution RSD are also used for georeferencing.
On topographic maps, arable land is not designated by specialized symbols, but meadows, bushes, forests (including young ones) and other natural objects are marked. On soil and land management materials, everything that is on topographic maps is marked, and arable land is also shown. In general, a georeferenced block of the main agricultural lands is formed with the dates of their application on maps.
Block 2. Supplementation of the GIS project with annual groups of remote sensing layers.
The block includes neural network filtering, which allows for the selection of several hundred remote sensing scenes suitable for interpretation from thousands stored in cloud archives. Unlike high-spatial-resolution remote sensing, Landsat level 1 and Sentinel remote sensing can be shifted by 15, 30 or more meters from the geographic location. In this regard, georeferencing has been added to the block. The resulting georeferenced remote sensing layers are grouped by year and spatial resolution.
Block 3. Formation of interpretation features.
Interpretation features are developed by comparing synchronous remote sensing and cartographic materials, as well as ground observations.
Block 4. Ground survey.
This process is carried out in two cases:
(1)
Objects may appear on the arable land that are not indicated on the cartographic materials. During the field survey, the state of the object is photographically recorded with georeferencing. Forest taxation is carried out on the objects. The photographs are added to the GIS project as a georeferenced layer.
(2)
Verification of the interpretation results. Taxation is carried out selectively and compared with the interpretation results.
Block 5. Interpretation of the boundaries and state of arable lands. This is the main block in which vector layers of the GIS for detailed mapping of arable land are created with a given period.
At the beginning, a layer of arable land for 1985 is created, since during this period, the area of arable land was maximal according to all known documents. Arable land is detected by RSD of 1984–1986, but the boundaries are applied only by high-resolution RSD, usually modern data. This is possible due to the fact that the ploughing impact is so powerful that the boundaries of arable land continue to remain visible even after the land has been out of agricultural circulation for 40 years. That is, the thematic decoding and application of boundaries are carried out according to different RSD.
The layer of arable land for 1985 is the basic (main) one. The boundaries of this layer and the legends of the contours are subsequently changed only on the principles of decoding (see method 2.2.4). Then a correction is made for the next period (in our case, for 1990). The decoding of the state of arable land is carried out according to RSD of 1988–1992. The boundaries can be adjusted both by high-resolution RSD (as in 1985) and by synchronous RSD if the field is not overgrown with WSV or grass evenly. For example, half of the field is cultivated, and the other half is not. A layer of arable land for 1990 is created.
The adjustment procedure is sequentially repeated with a period of 5 years from 1990 to the present. The result of block 5 is 9 layers of arable land conditions for 1985, 1990, 1995, 2000, 2005, 2010, 2015, 2020 and 2025.
Block 6. Combination and analysis of arable land condition maps.
Eight of the nine maps of the arable land condition are created by correcting the map of the maximum plowed land in 1985. In this regard, most of the arable land boundaries on all maps are identical. The maps differ in the boundaries of the contours only in significant cases. The database (legend) of the map contours may differ significantly more. In this regard, the 9 maps can be combined into a single map (Figure 4) with a single database of contours. The database of the single map will have different records for each year (Table 1), but with a single classifier (Table 2). The database is much easier to analyze for calculating the areas of dynamic or unchangeable contours. The result of the block’s work is a single map with a single database and analytical calculations.

3. Results

3.1. Primary Results

The following GIS project was assembled for the territory of Palekhsky District of Ivanovo Oblast: topographic maps at scales of 1:25,000, 1:100,000 and 1:200,000, DEM SRTM, DEM COPERNICUS, cadastral and soil maps at a scale of 1:25,000, and schemes of intra-farm land management at a scale of 1:25,000.
The GIS project was supplemented with high-resolution mosaics of RSD from open sources (Yandex, Bing, Google, ArcGIS). A total of 1304 Landsat scenes and 2912 Sentinel tiles were found for the study area. Most of them were unsuitable for deciphering the state of arable land due to cloudiness, snowiness, standing water, etc. Neural networks made it possible to select 272 Landsat scenes and 228 Sentinel tiles for interpretation. The selected scenes were grouped by year and added to the GIS project. In 2020 and 2025, ground surveys were conducted on arable lands in Palekhsky District. Photographic recording of the lands’ state with georeferencing was carried out (Figure 5), and two point layers with the taxation results were added to the GIS.
In total, a GIS project was formulated containing 52 layers, 40 of which are group layers. Based on the GIS project, a preliminary analysis of the state of arable land for 40 years was carried out, and it was established that the following six degrees of arable land overgrowth could be identified with manual interpretation: 1—active arable land; 2—abandoned at the stage of weed fallow or the formation of meadow vegetation; 3—slight overgrowth with WSV; 4—moderate overgrowth with WSV; 5—severe overgrowth with WSV; 6—very intensive overgrowth with WSV.

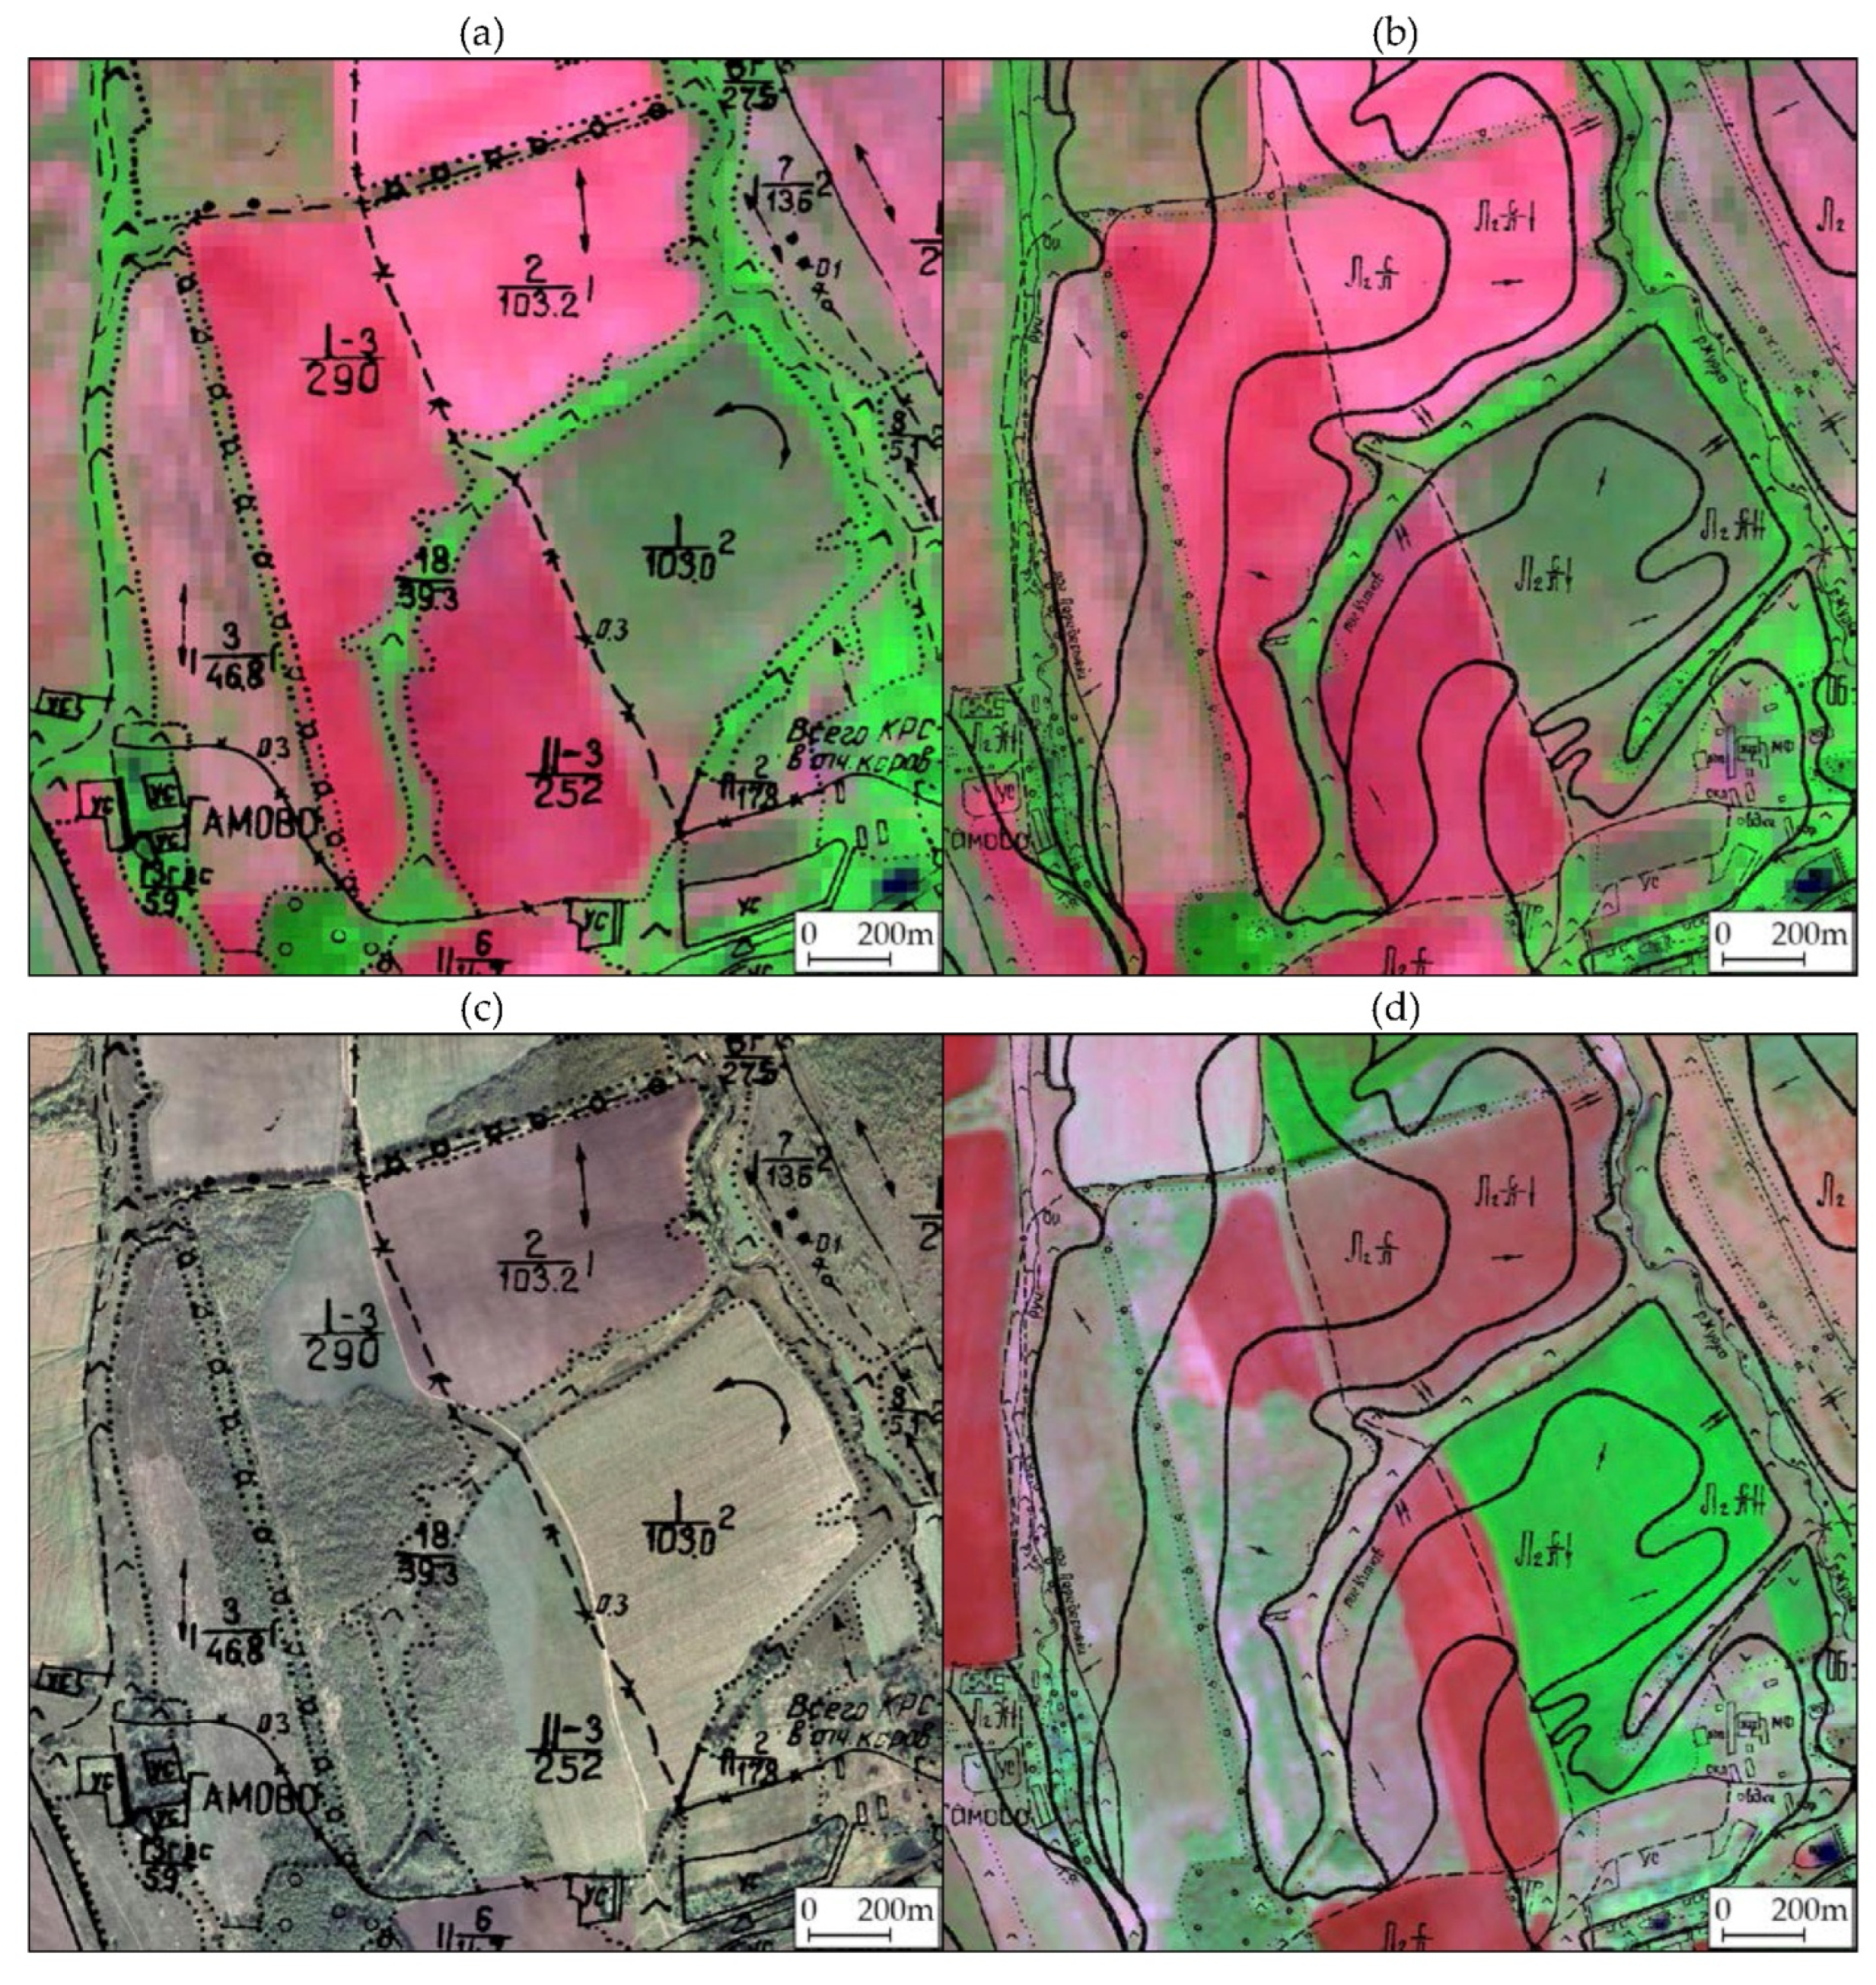
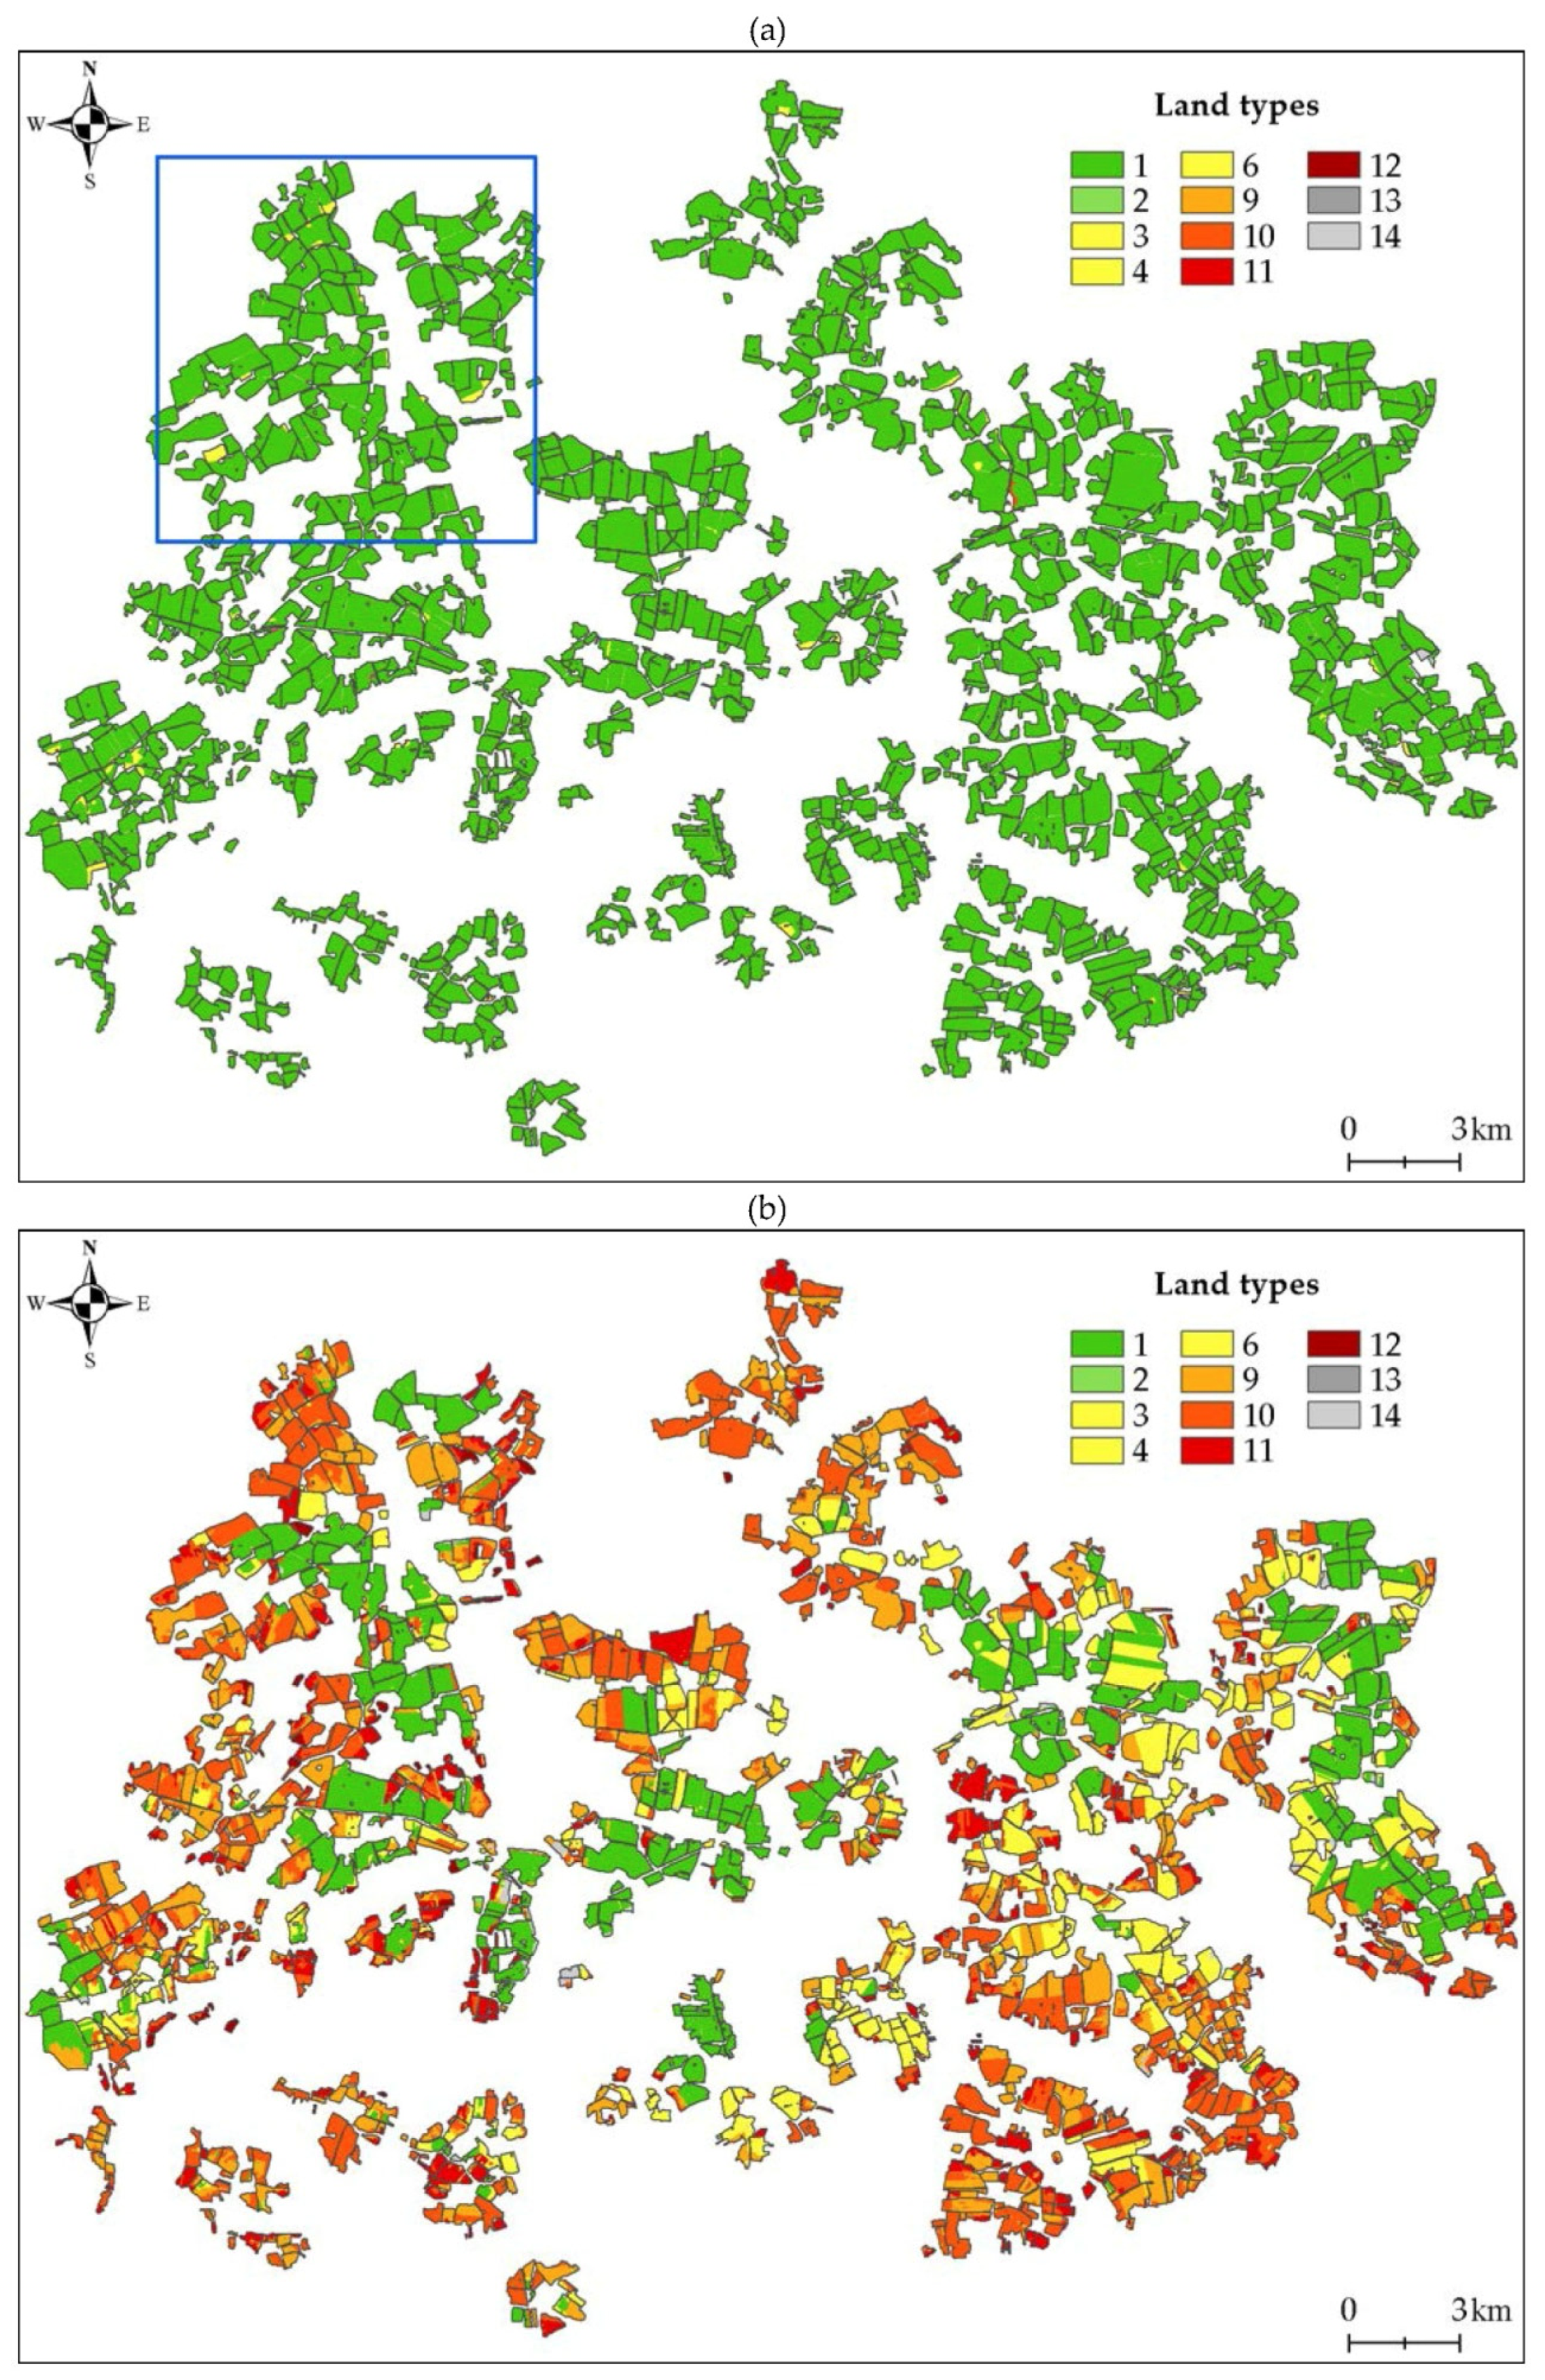
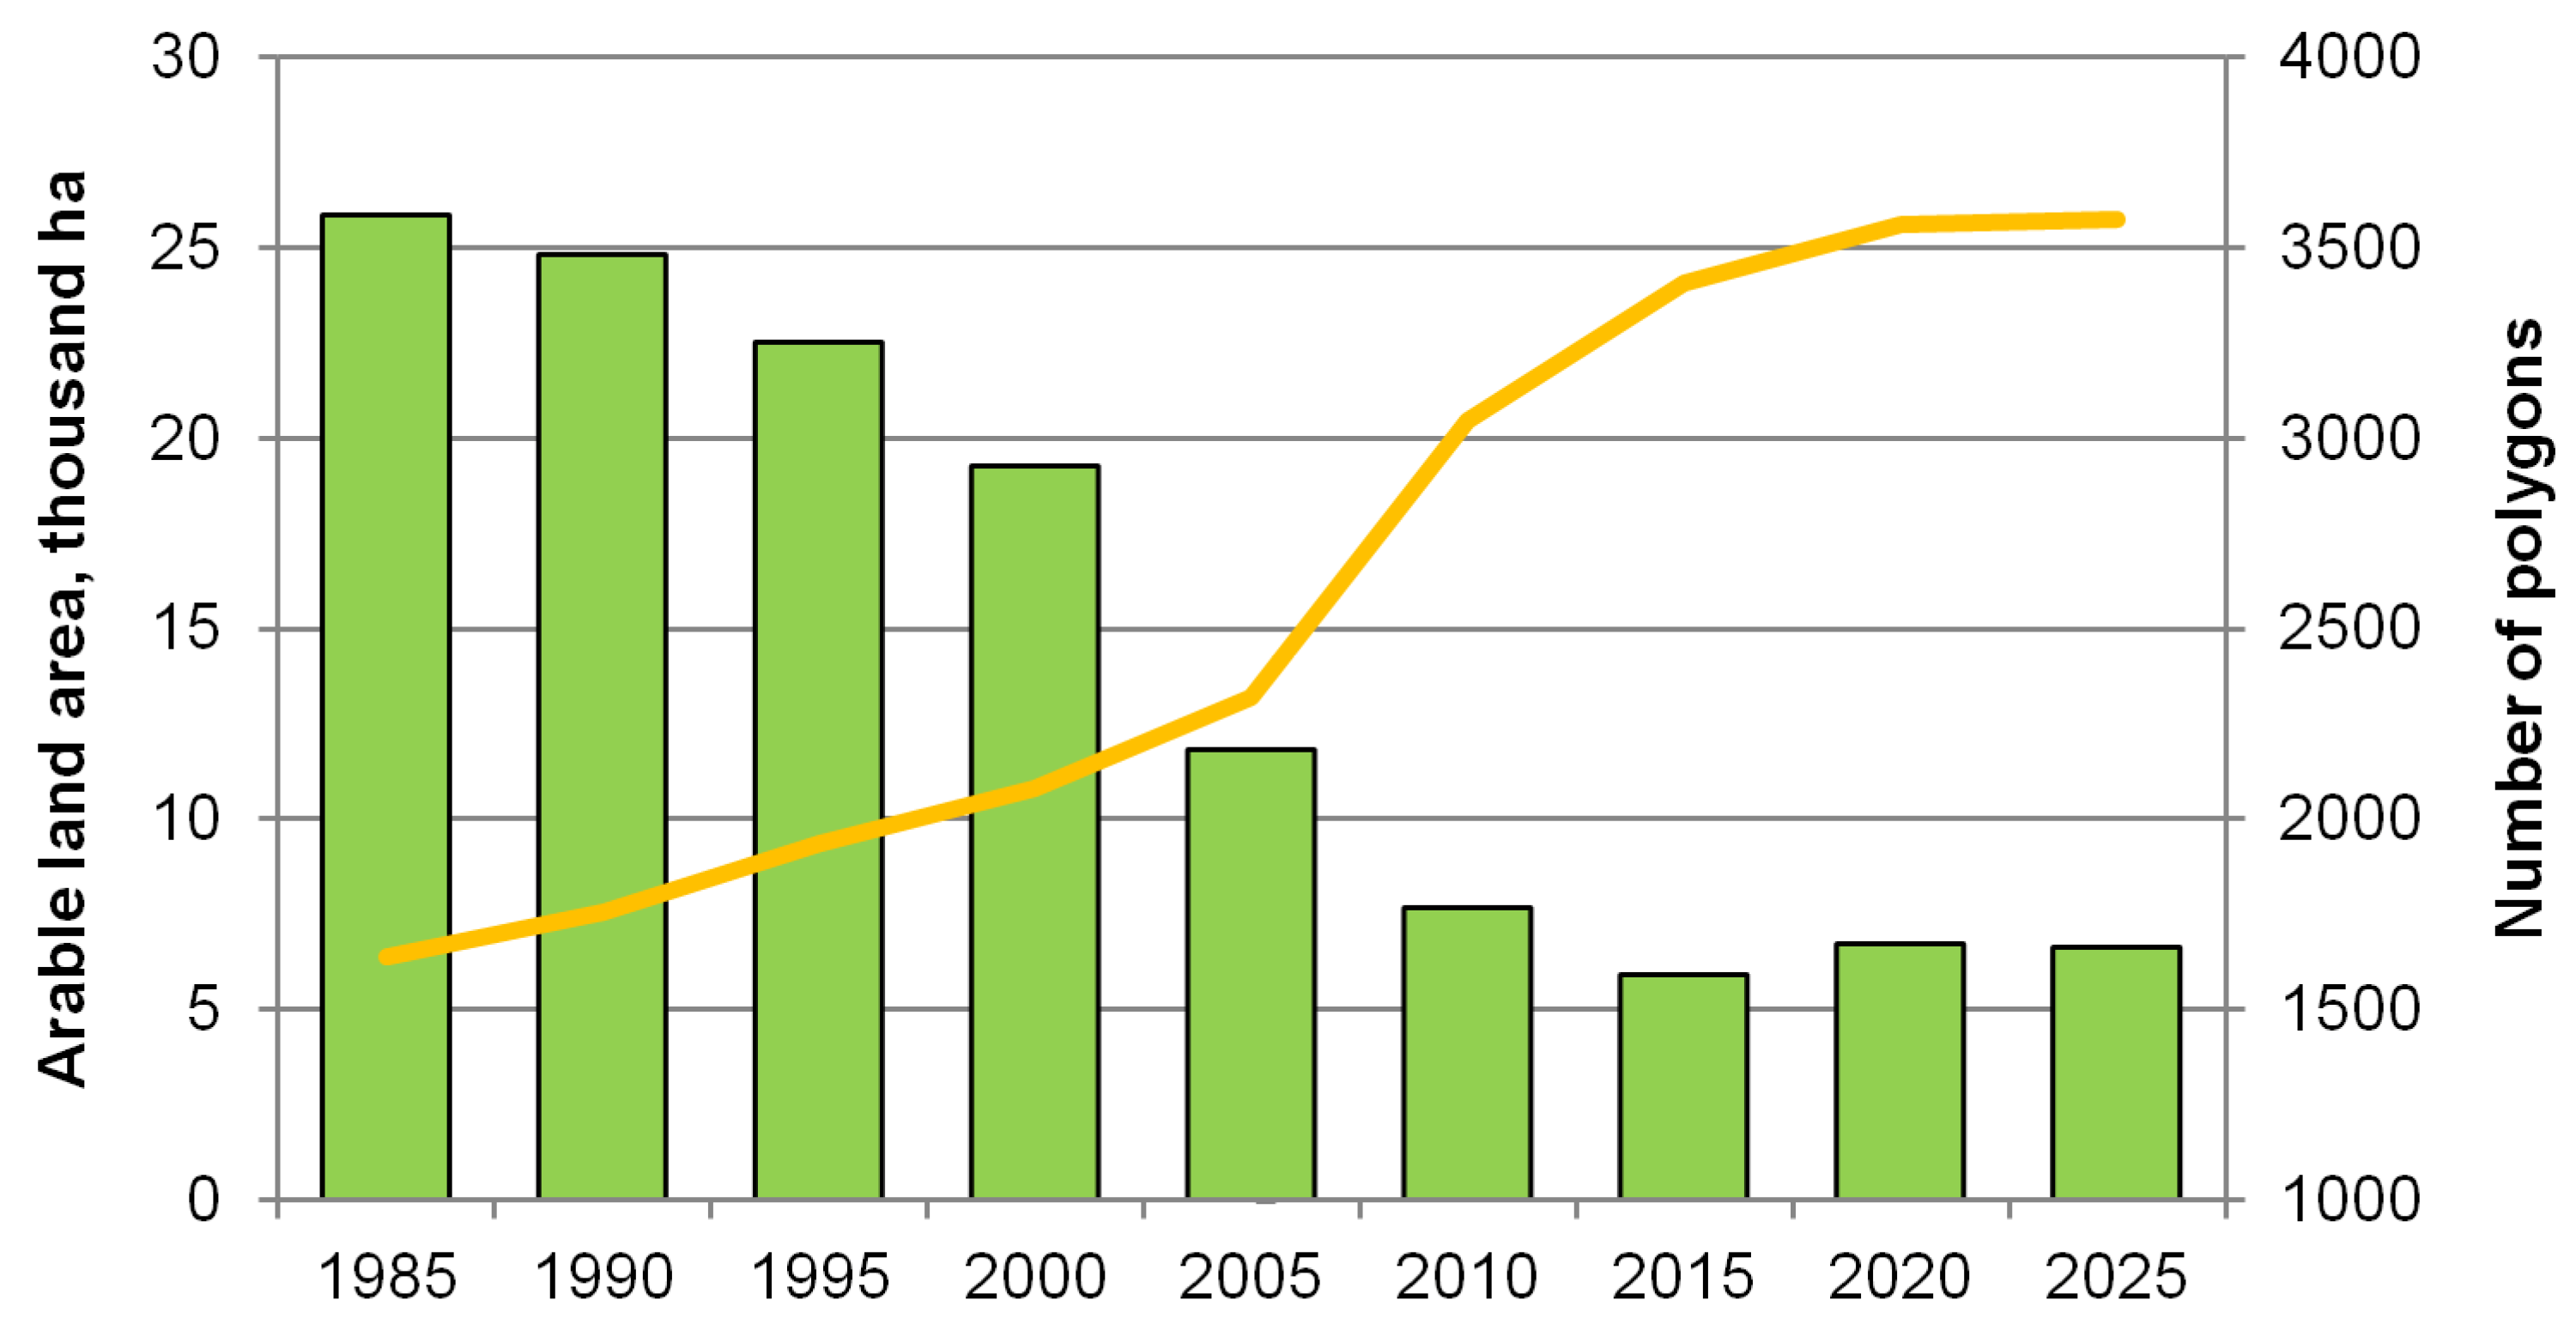
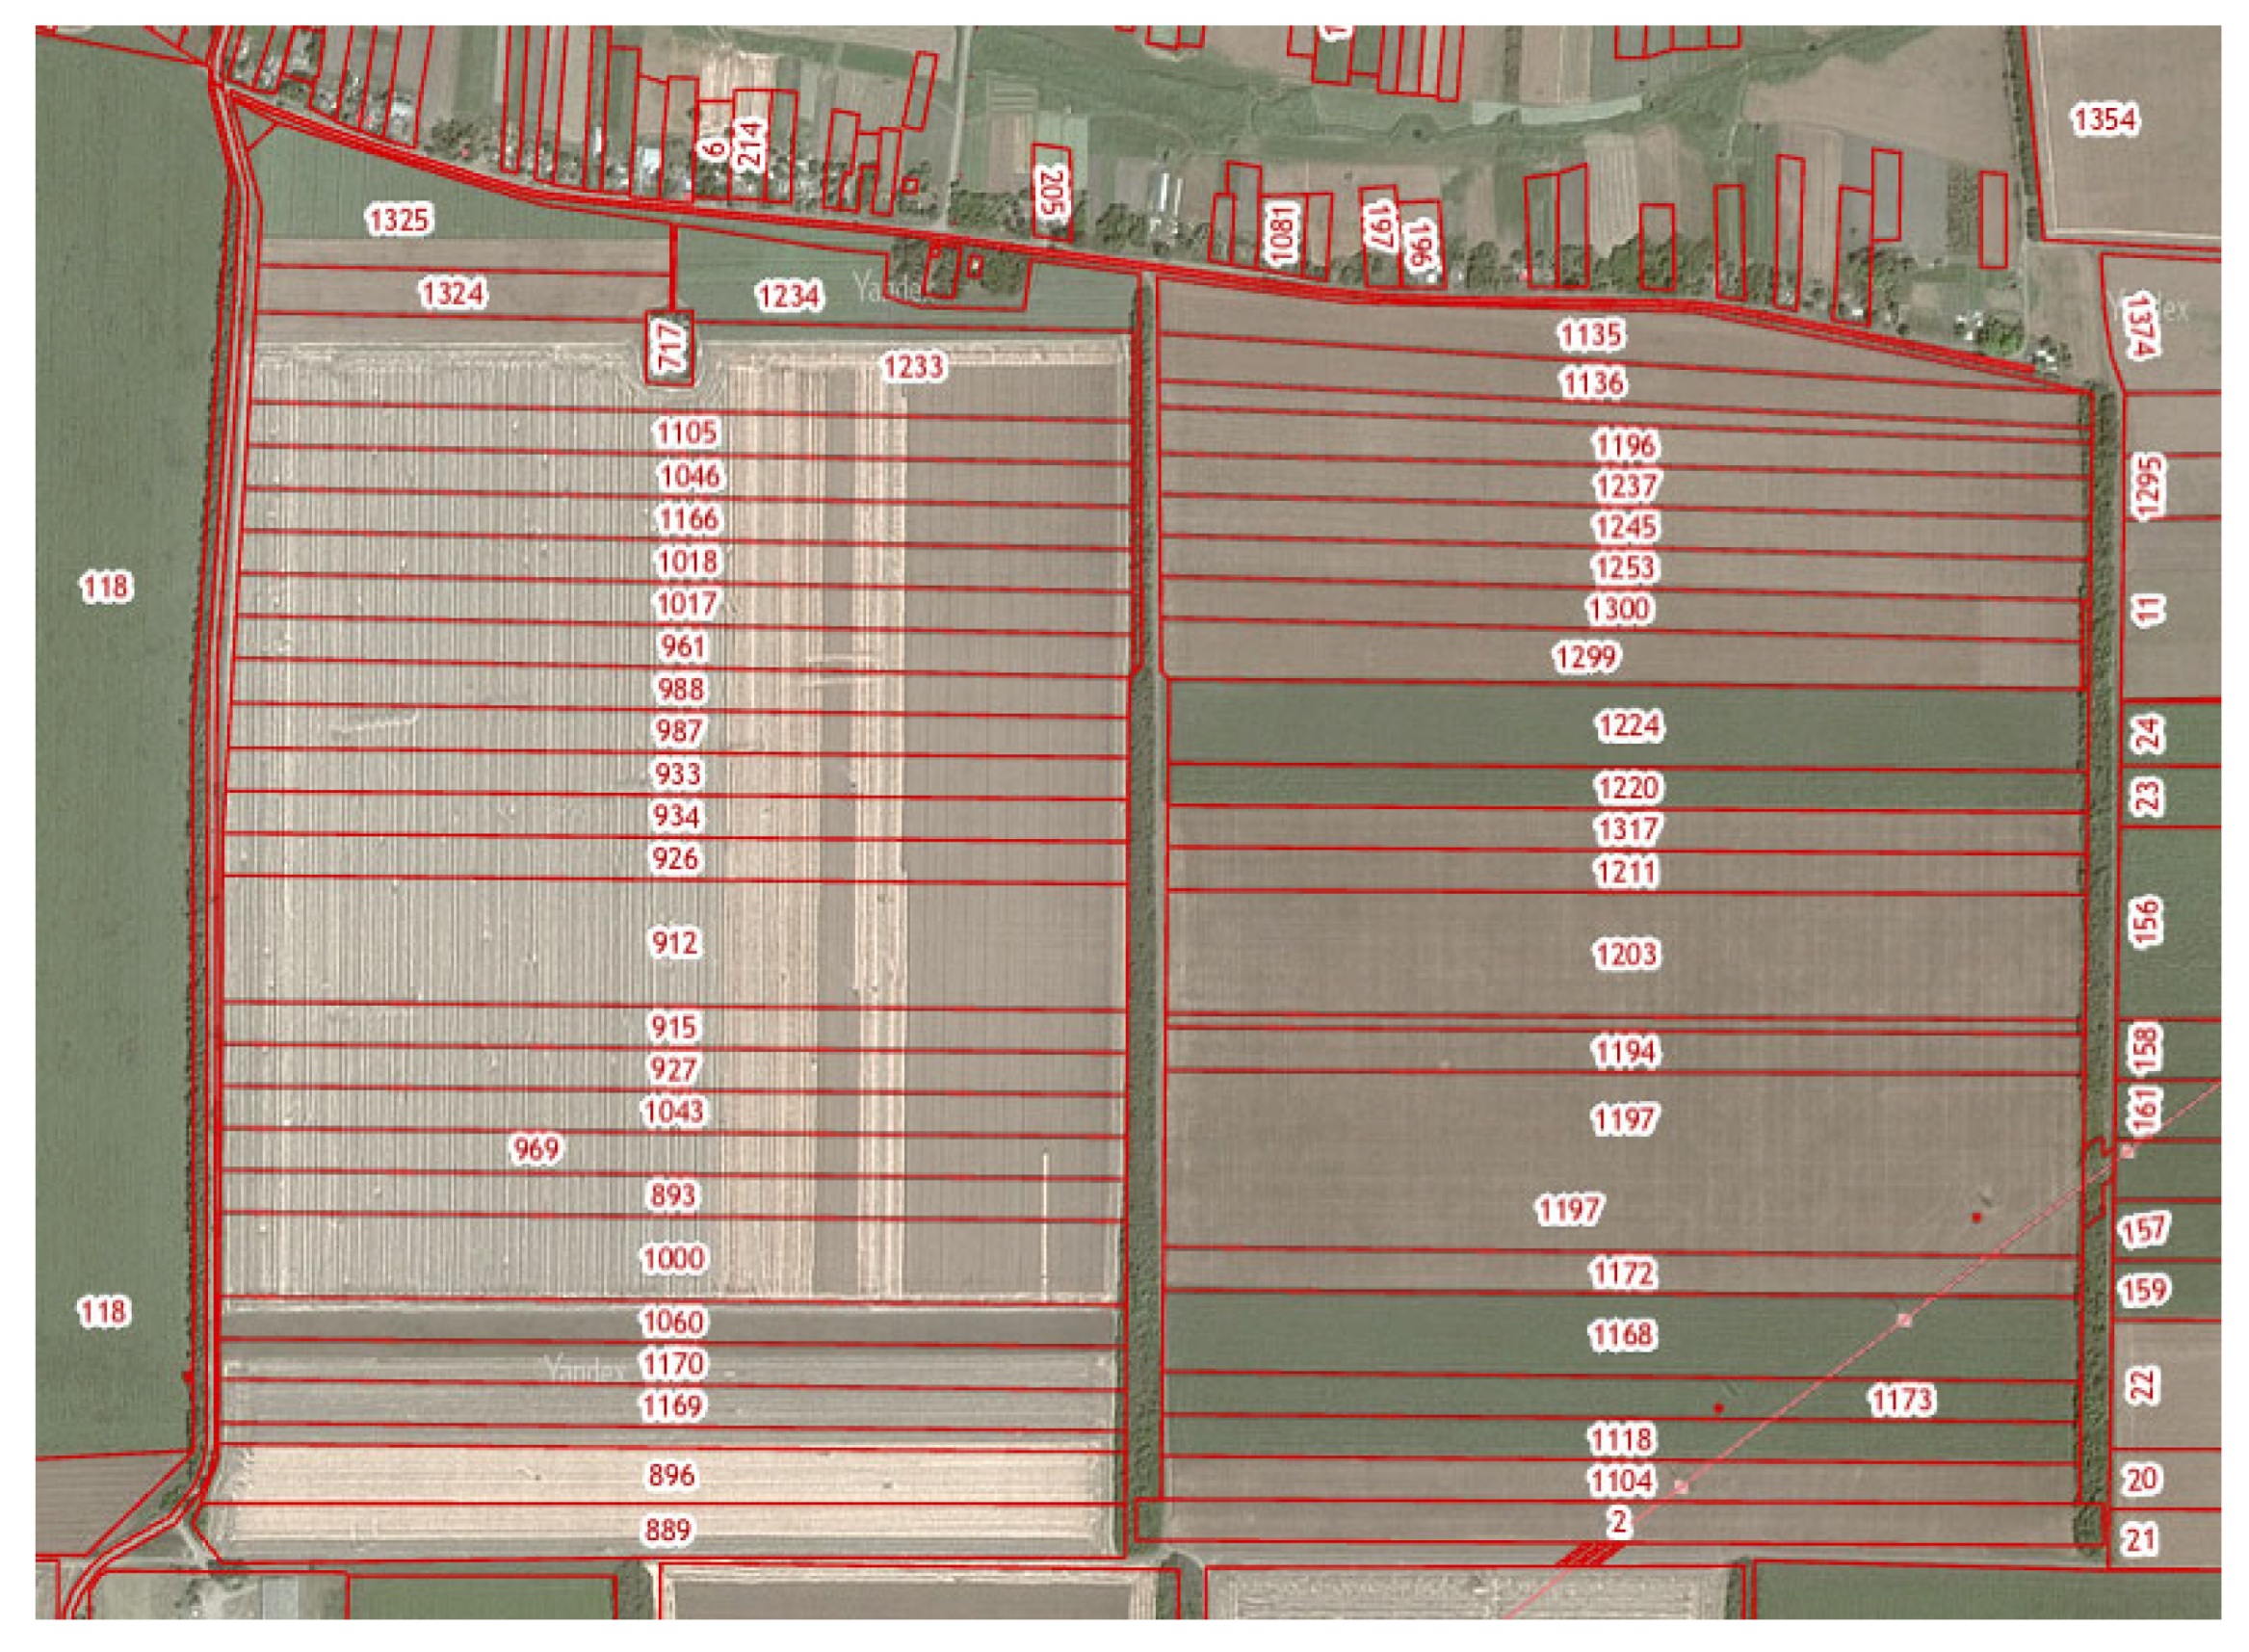
3.2. Results of Retrospective Monitoring of Arable Lands in Palekhsky District

Based on the GIS project and the developed decoding features and legends, nine maps of the state of arable lands in Palekhsky District of Ivanovo Oblast were constructed for the following years: 1985, 1990, 1995, 2000, 2005, 2010, 2015, 2020 and 2025. Examples of maps are shown in Figure 6 and Figure 7. The location of the fragment is given on the arable land map in Figure 6a. Legends to the arable land state maps are converted into the volume of wood accumulated on arable land during the overgrowing period. Arable land areas and wood volumes are given in Table 3 and Table 4.

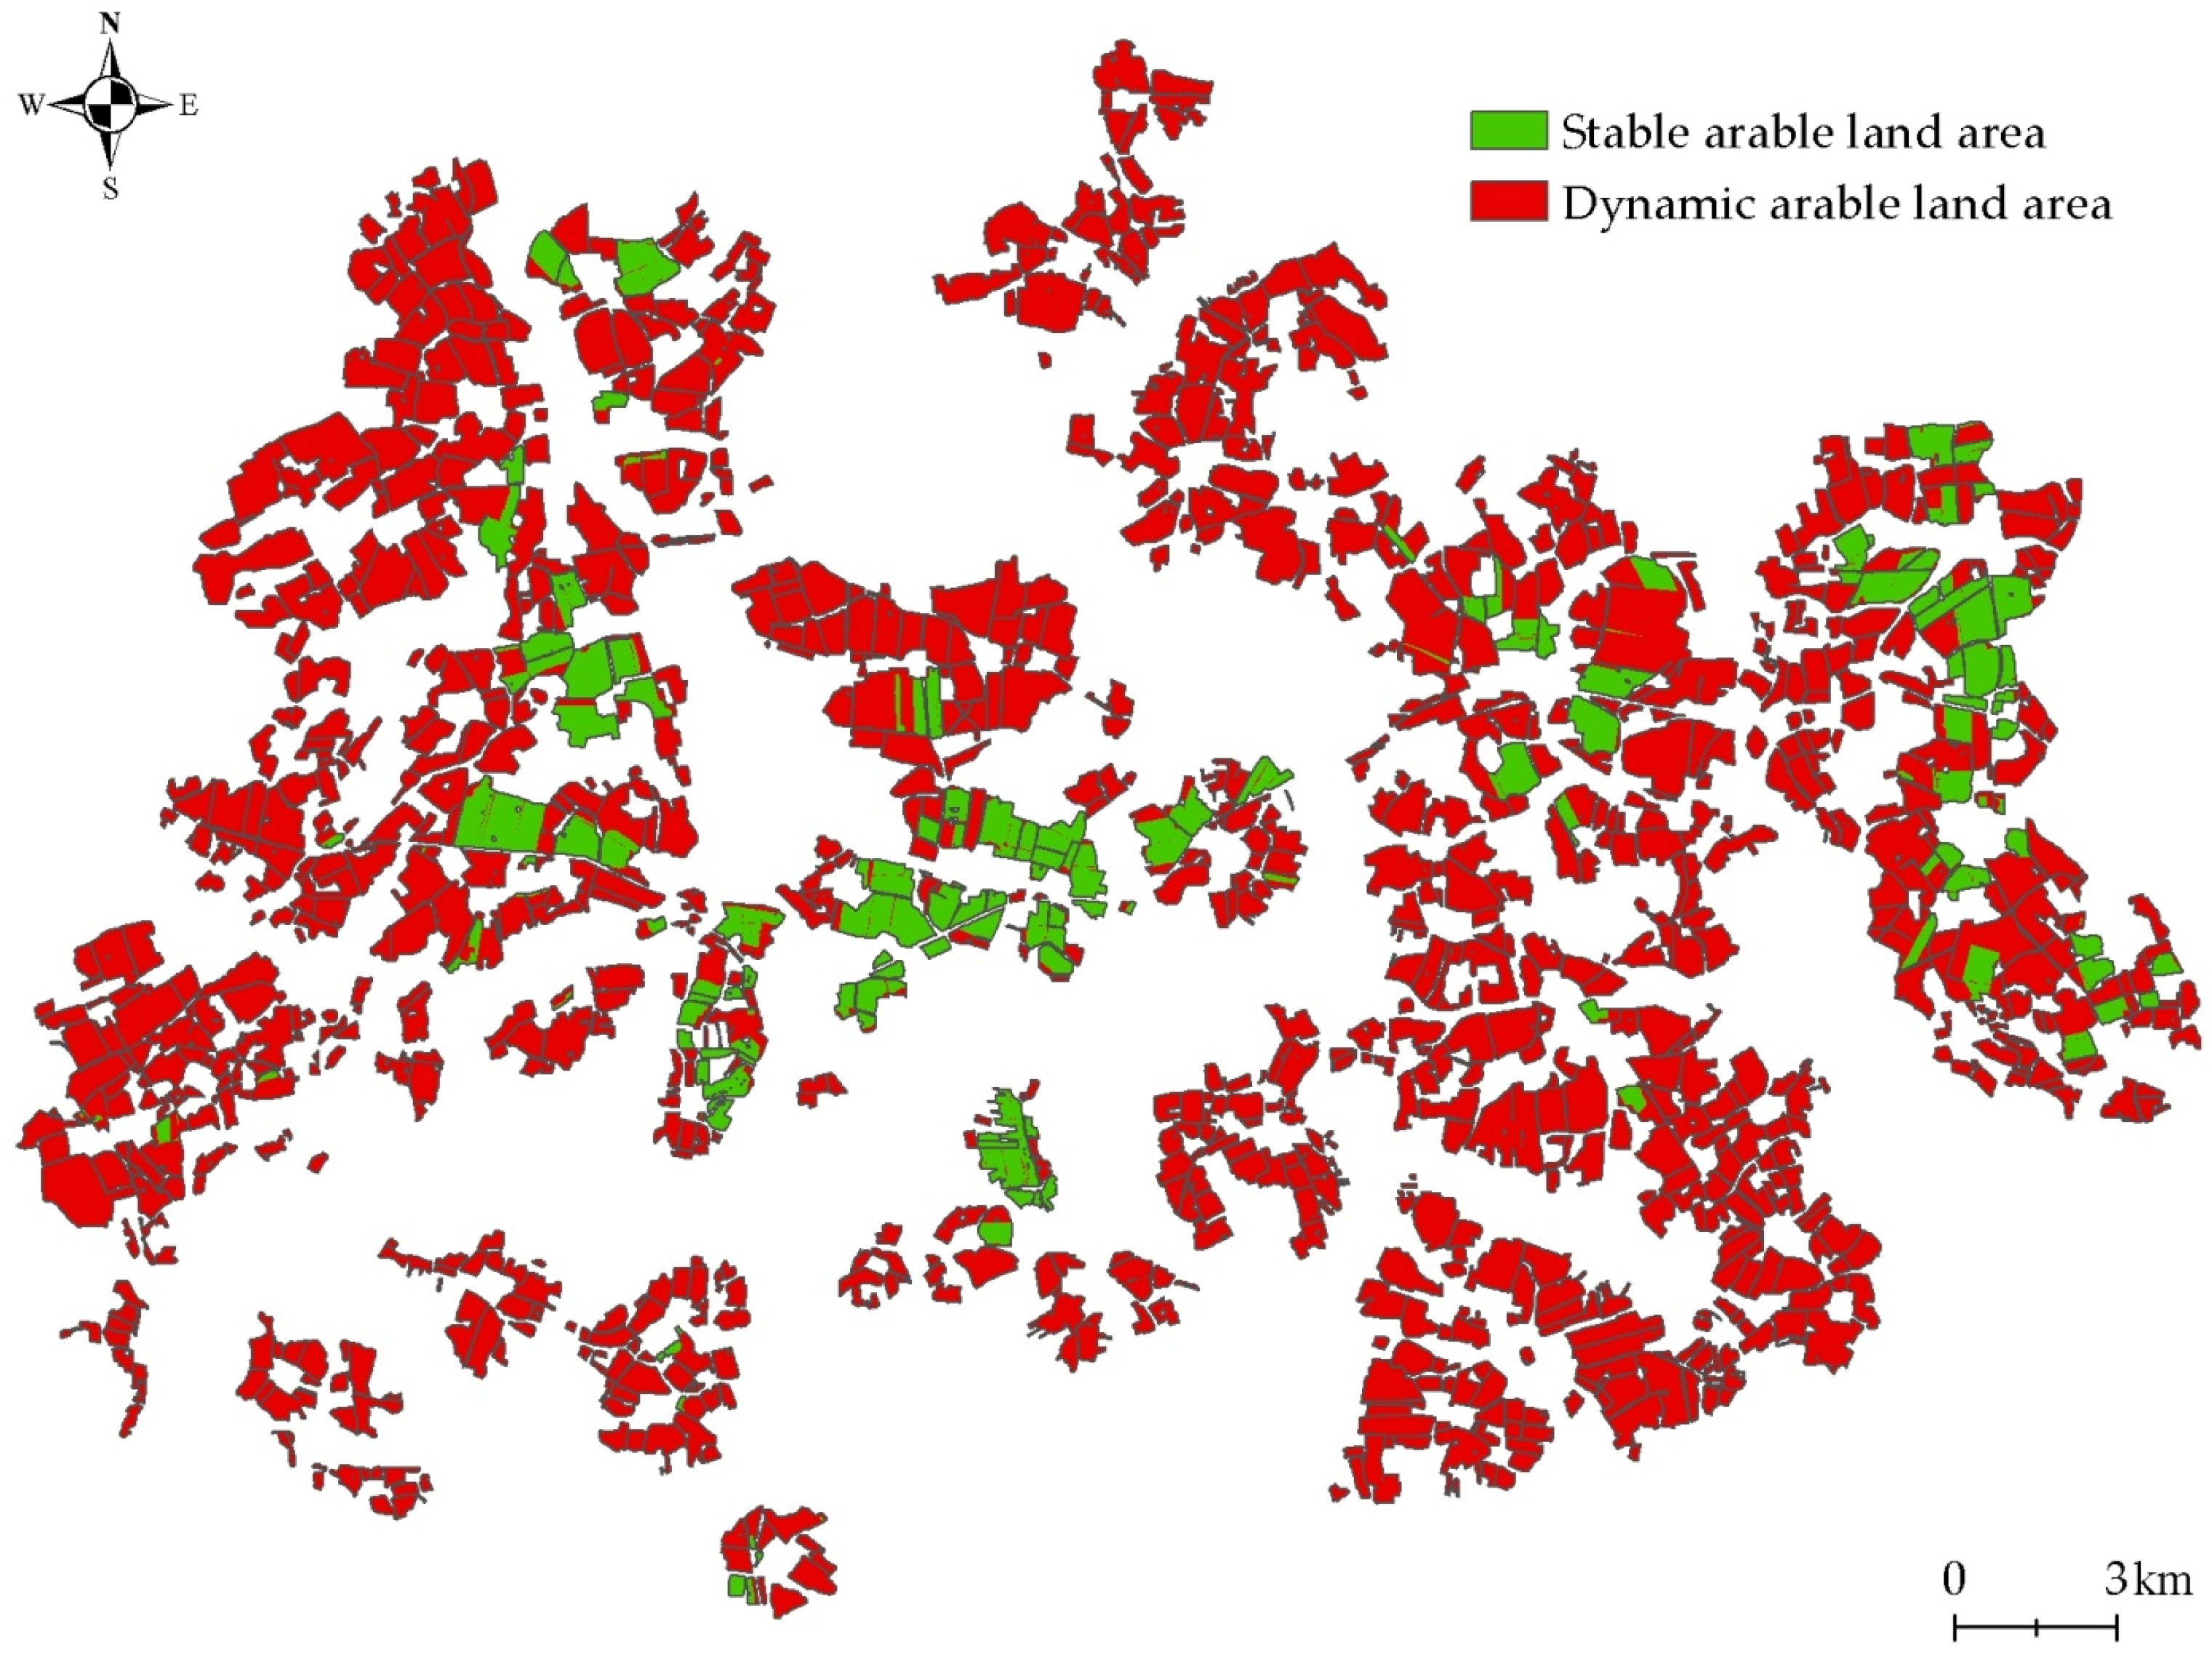
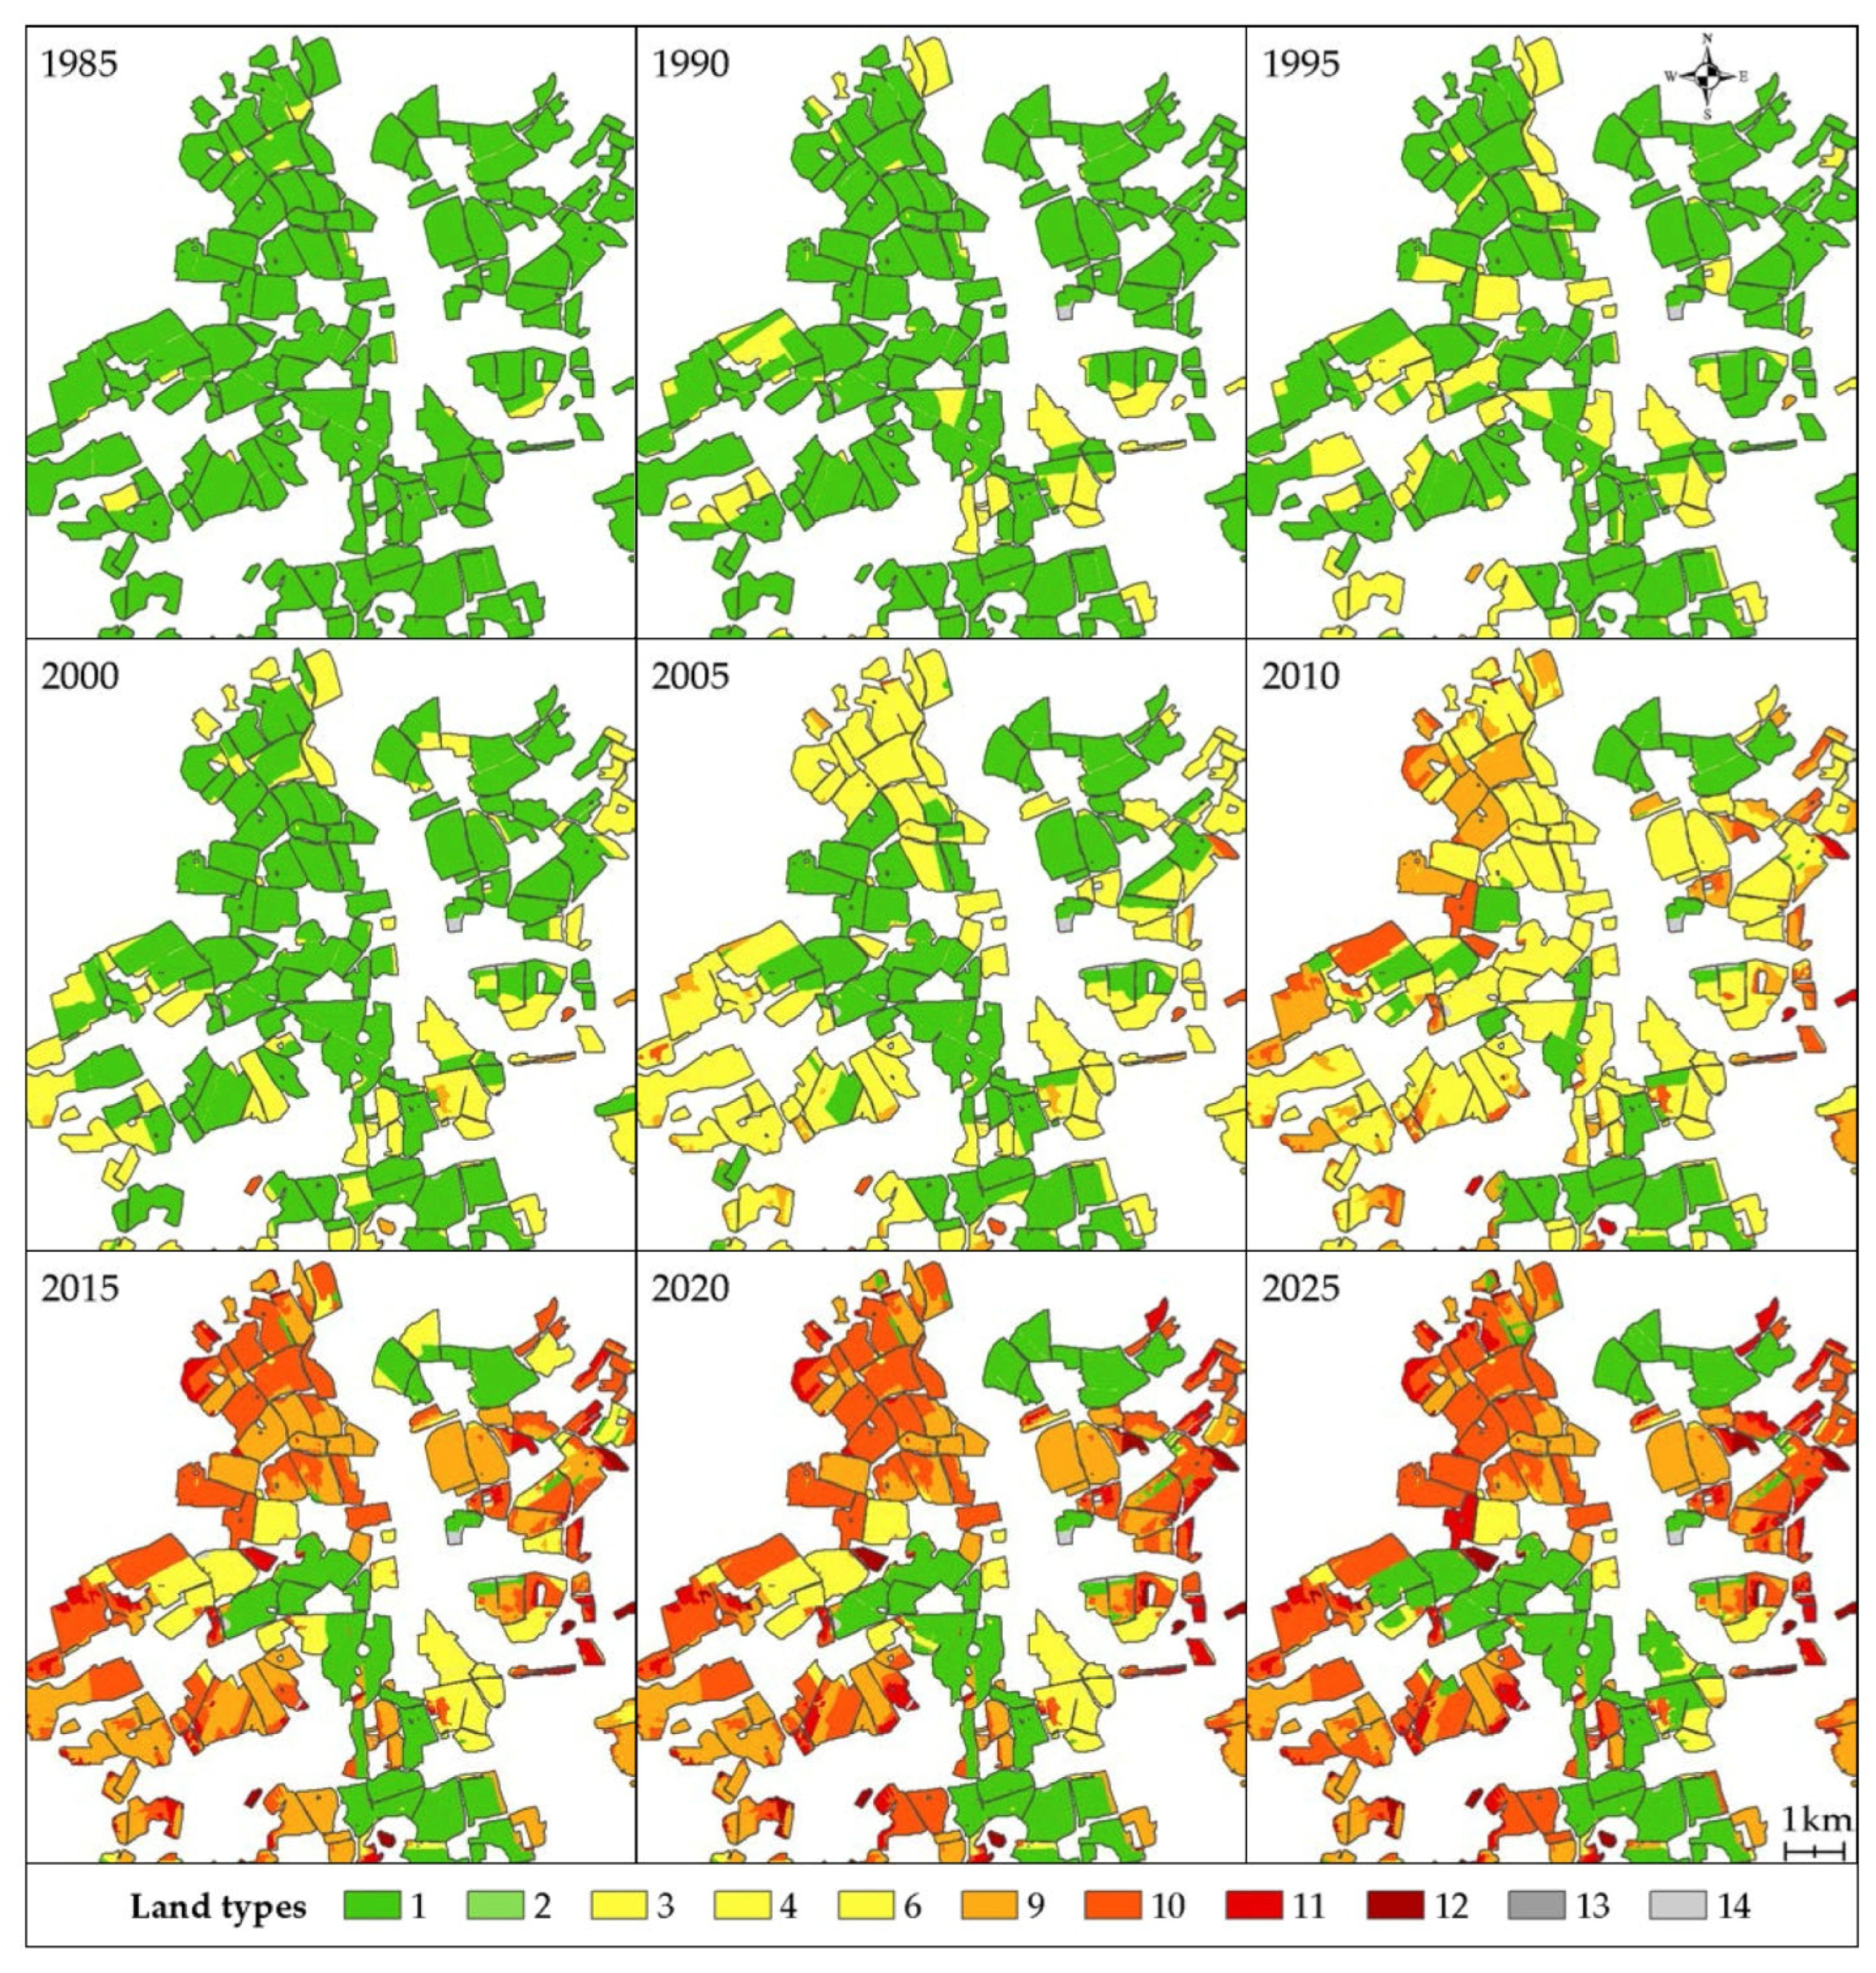
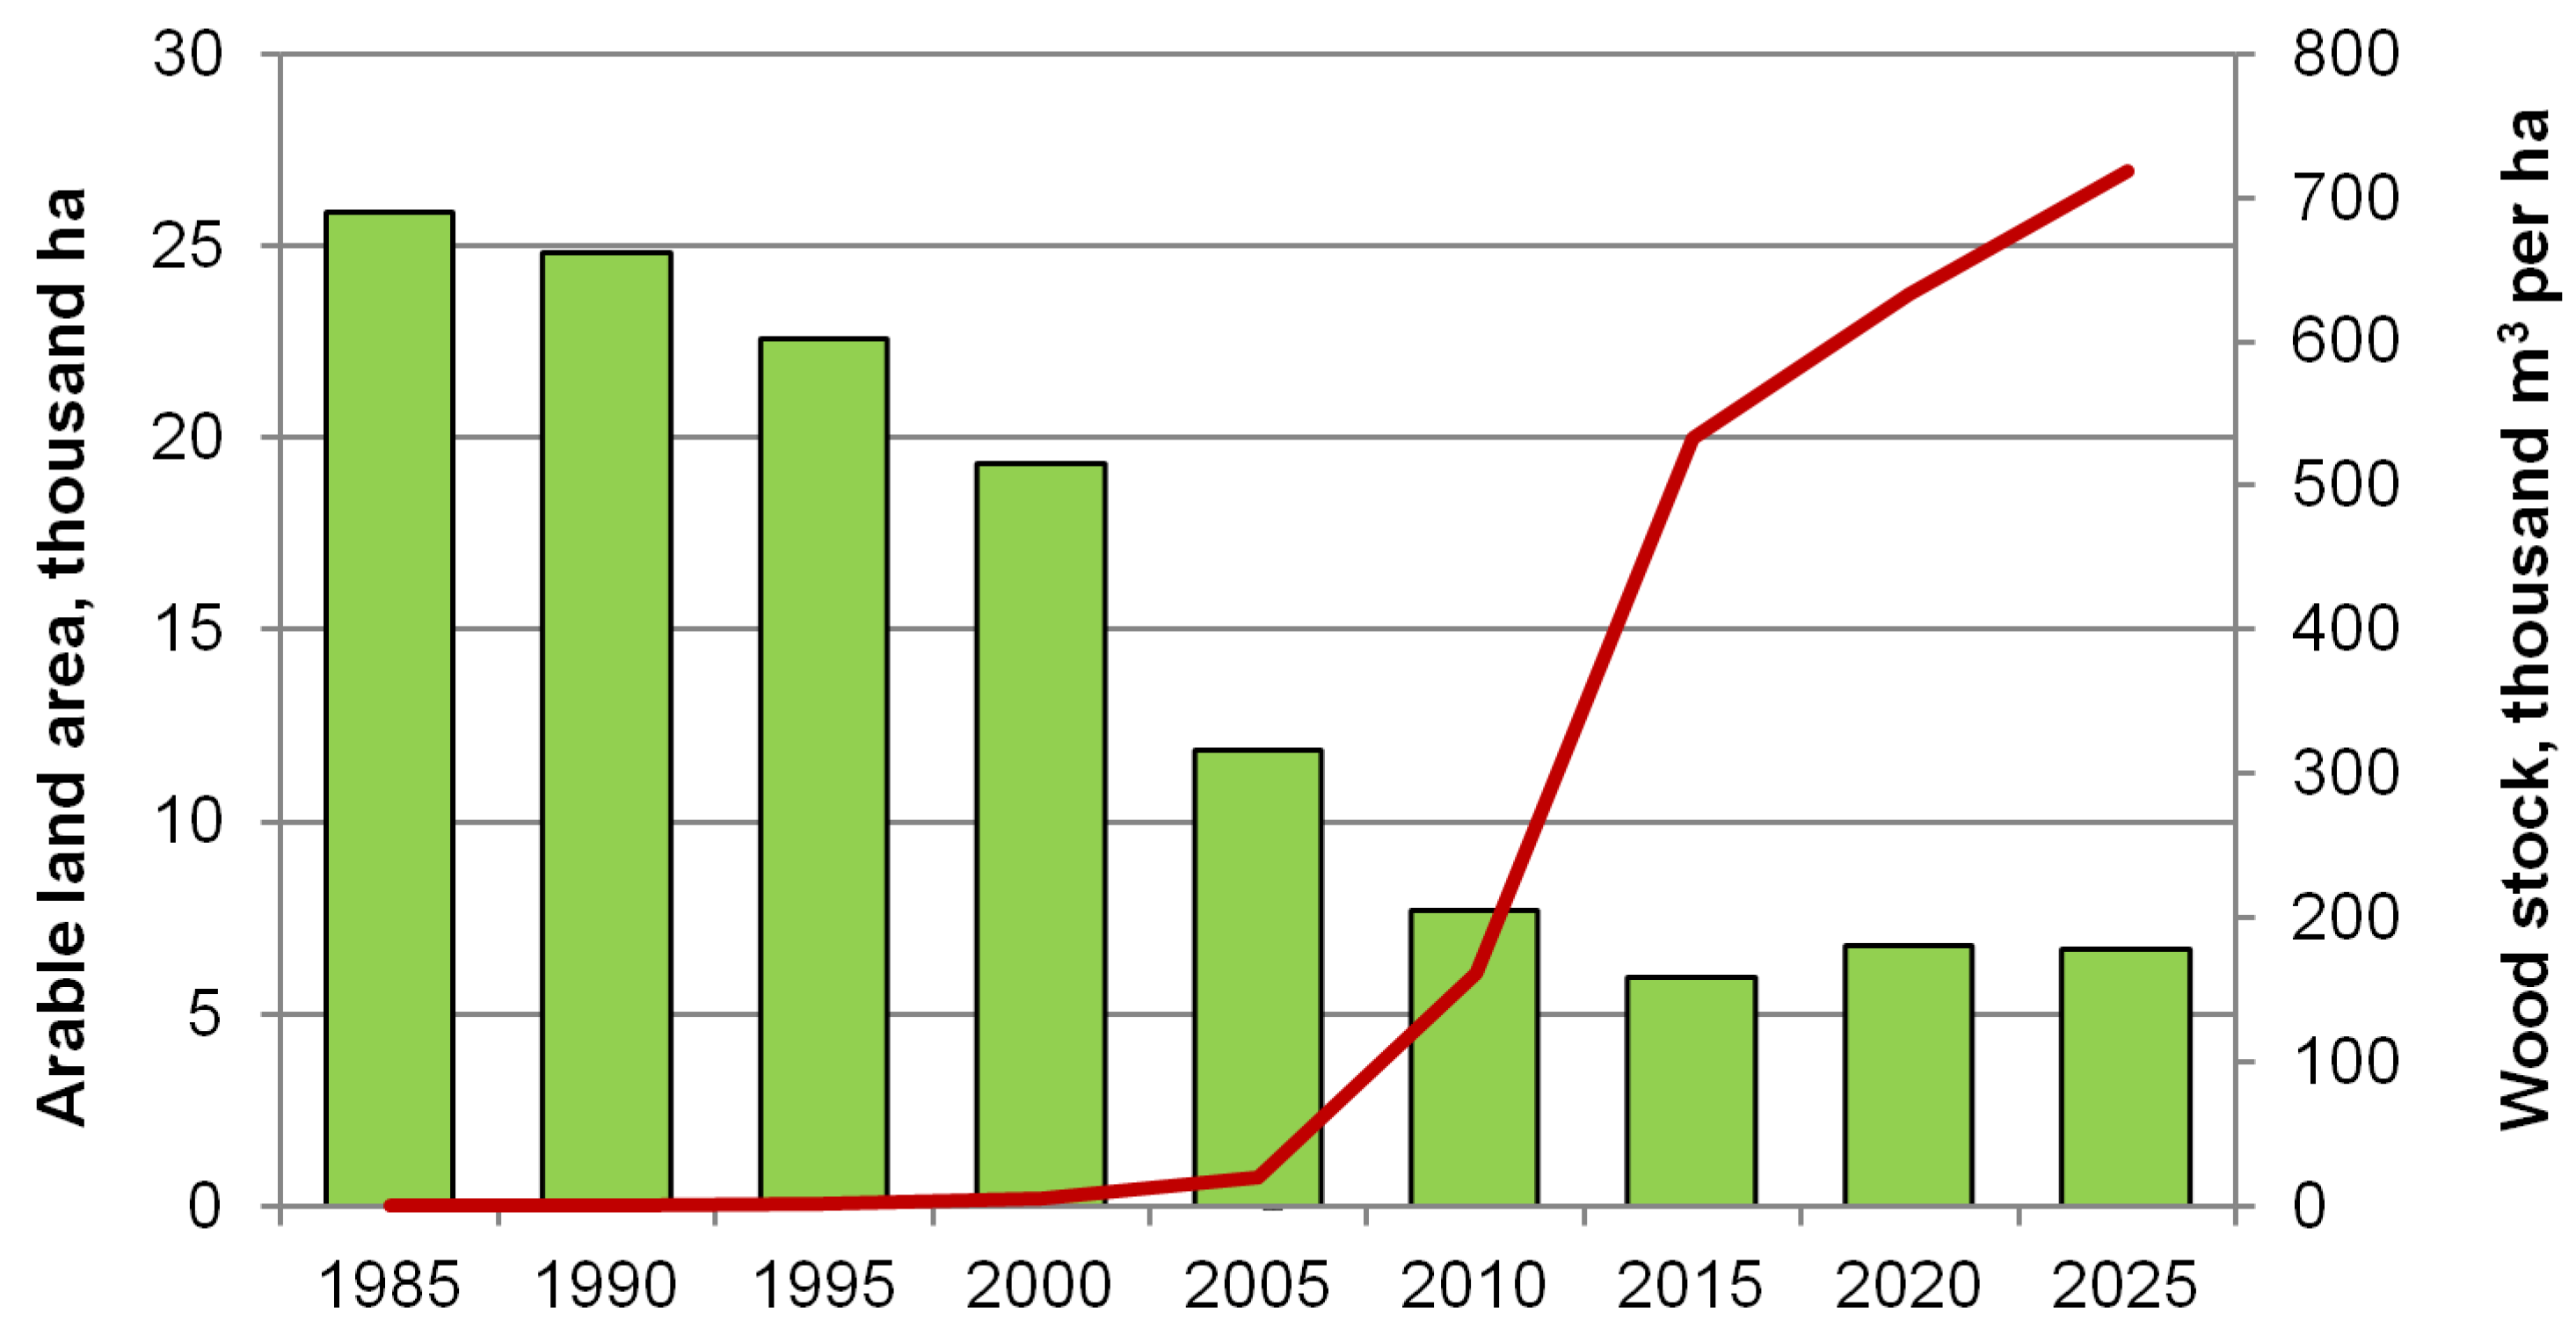
3.3. Description of the Dynamics of Arable Land in Palekhsky District

The total area of arable land in Palekhsky District, where the land was cultivated at least once during the entire study period, was 26,193 ha. During the same period, the permanently cultivated arable land area was 3,361 ha, i.e., 12.8%. Figure 7 clearly shows that before 2000, arable land was abandoned several times, but then attempts were made to return it to agricultural circulation. This process formed areas of dynamic land use, where arable land ceased to be cultivated at least during one of the five-year periods (Figure 4). If arable land was not cultivated for 1–3 years, this area was not considered abandoned. Since 1995, a steady increase in the area of arable land covered with trees and shrubs has been noted (Table 3). Since 2005, the volume of accumulated timber on the arable land of the region has reached significant values of more than 20 thousand m3 (Table 4). Figure 8 shows the process of the reduction in arable land and increase in timber stocks graphically. The total volume of timber accumulated on arable land by 2025 amounted to 719,060 m3.
Since the exit of land from arable land zones is spontaneous, various new lands (Table 2) are not formed on the entire agricultural field (Figure 7). The fragmentation of agricultural fields occurs, where part of the field can still be cultivated, and on the other part, significant reserves of biomass in WSV have already accumulated. The fragmentation of agricultural lands is graphically presented in Figure 9. In 1985, there were 1639 arable fields in Palekhsky District of Ivanovo Oblast. By 2025, 3576 contours (polygons) with various lands were formed.
The maximum area of arable land plowed in one year was 25,876 ha in 1985. The maximum reduction in arable land was achieved in 2015. In this year, the area of arable land was 5924 ha—22.9% of the area of arable land in 1985. Against the background of the general reduction in arable land in the region, about 316 ha of land was plowed for the first time. In addition, arable lands with secondary herbaceous and WSV were repeatedly plowed and abandoned again. One way or another, the area of cleared forest during this period is estimated at 93 ha.

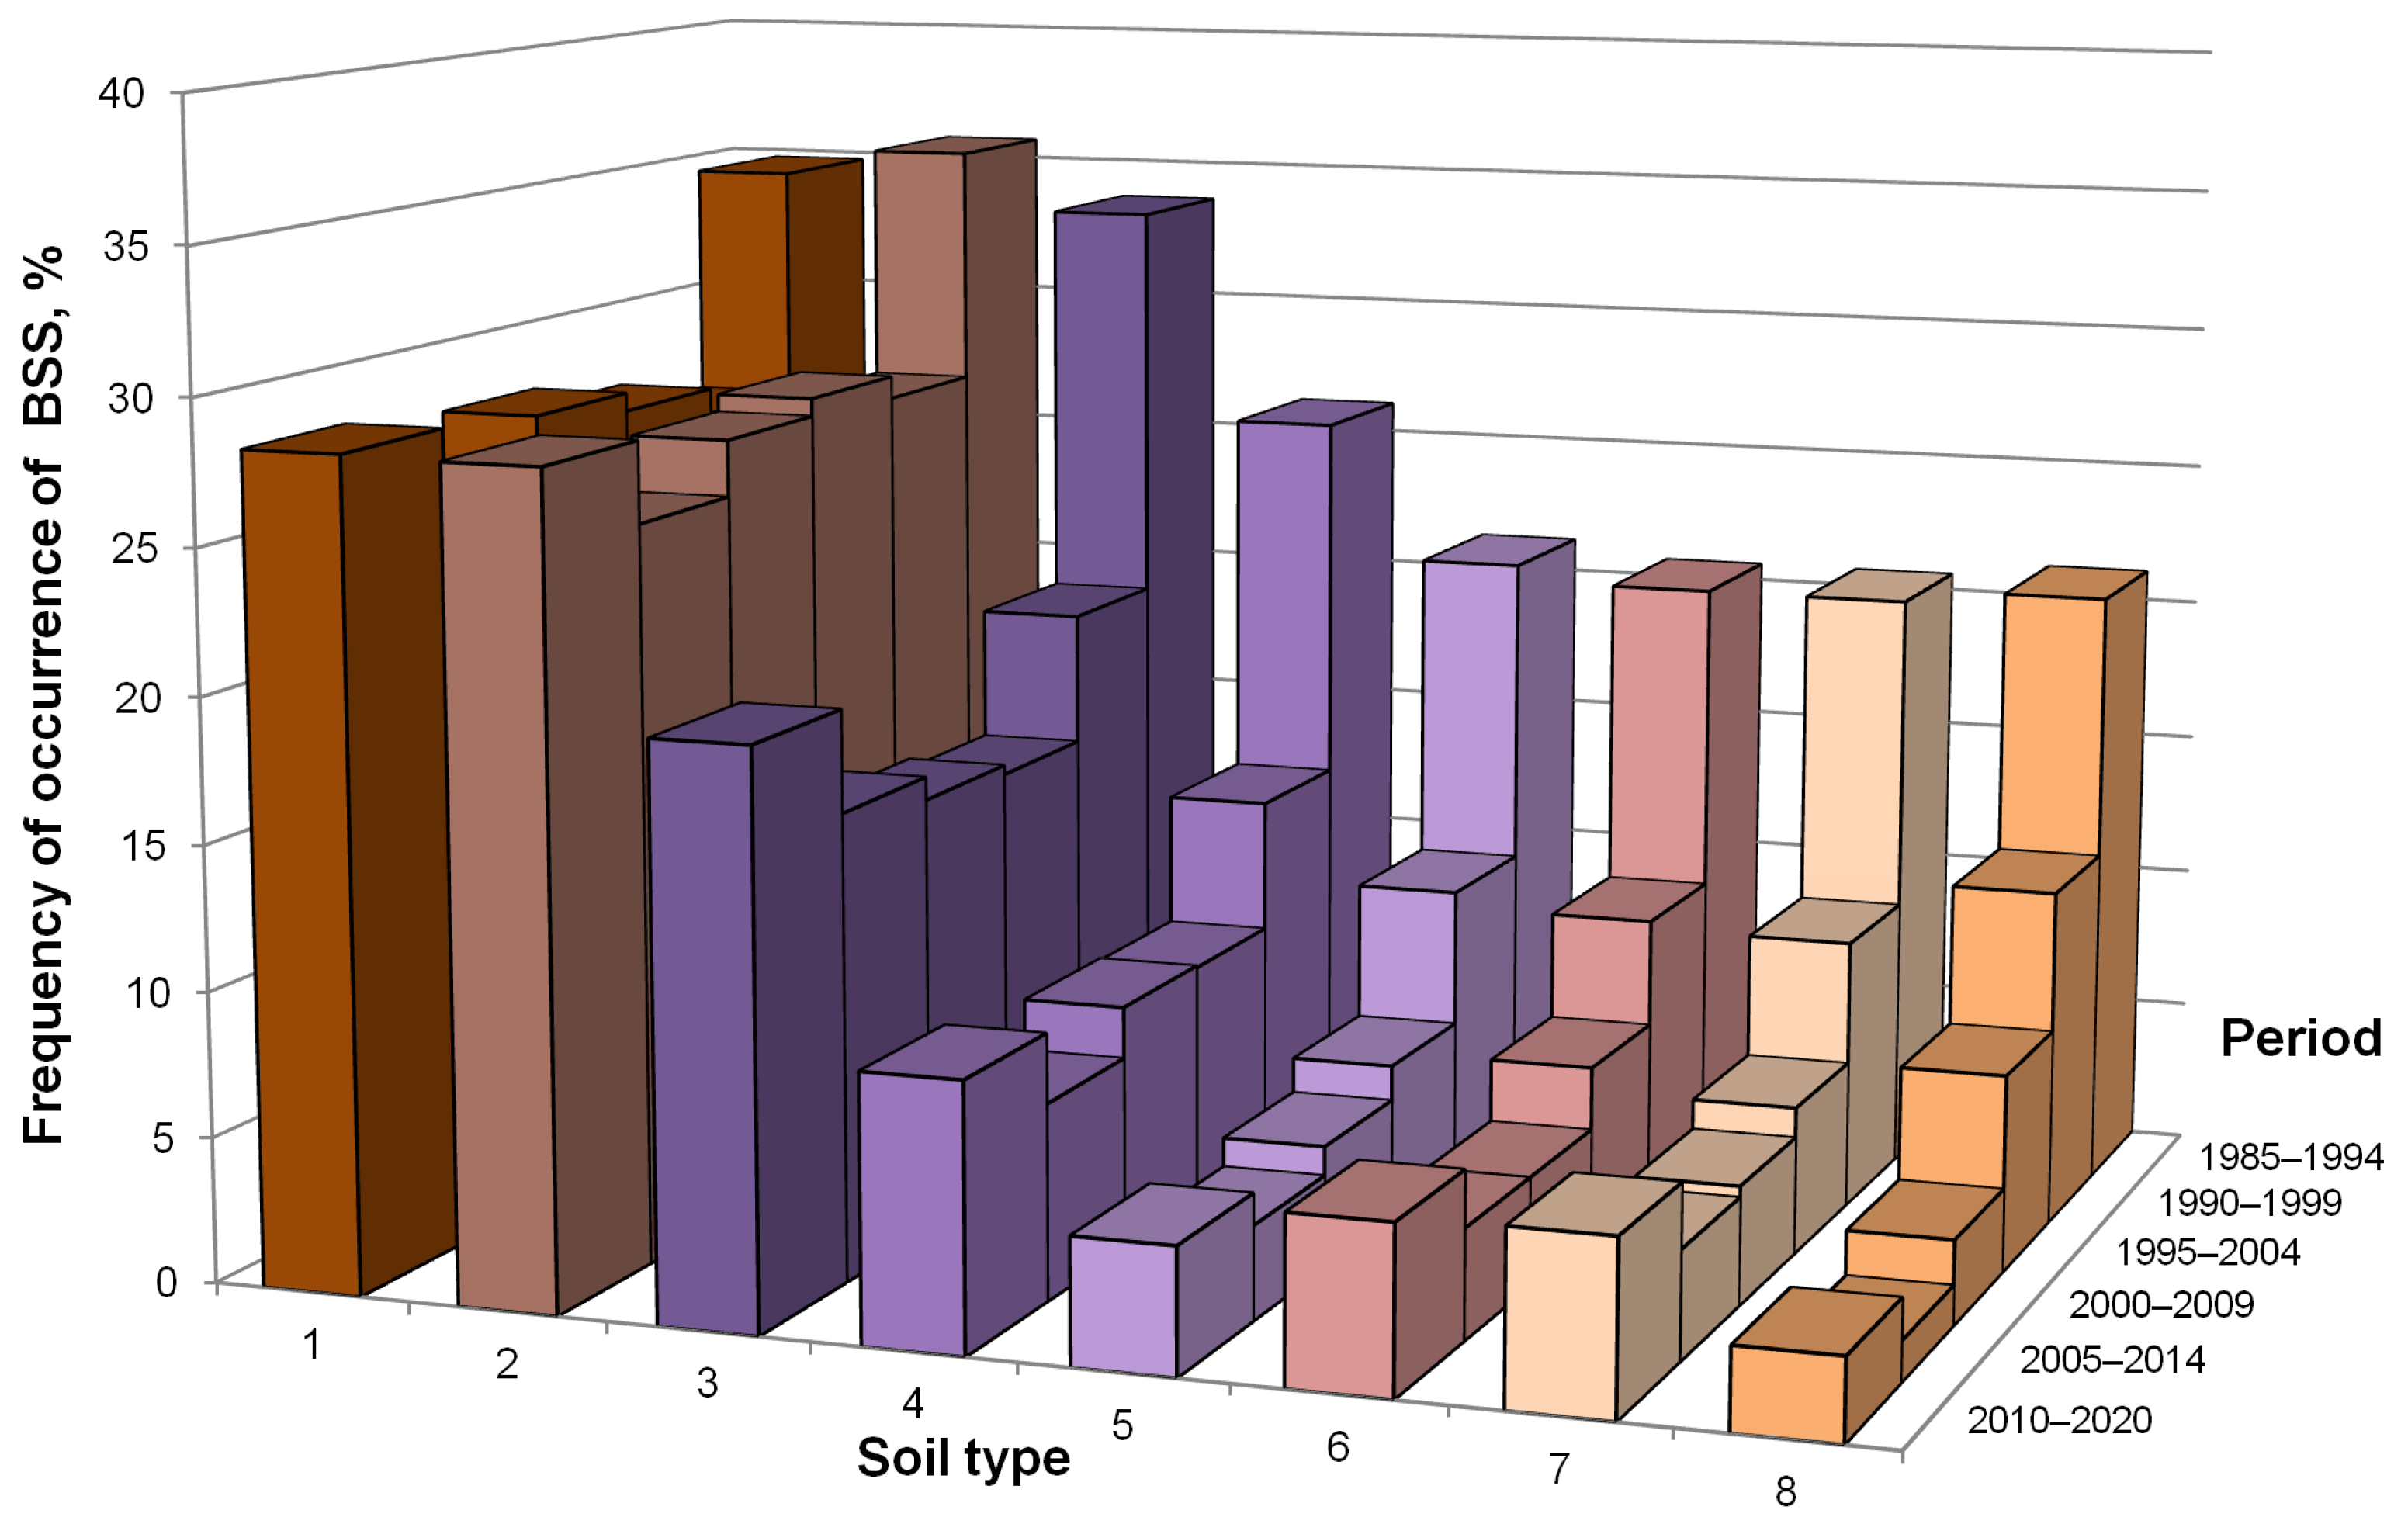
3.4. Implementation of the Retrospective Monitoring of Soil–Land Cover

The technology of retrospective monitoring of soil–land cover, demonstrated for the example of Palekhsky District of Ivanovo Oblast, in this study is uniformly applied for seven federal subjects of the Russian Federation (Table 5): the Ivanovo, Kaluga and Tula Oblasts, the Republic of Tatarstan, the Tambov and Rostov Oblasts and Stavropol Krai.
Analysis. In 1917, private ownership of land was abolished in the territory of the former Russian Empire and the future USSR [79]. The introduction and withdrawal of land from agricultural circulation became the exclusive prerogative of the government. The arable land area of the RSFSR (Russian Soviet Federative Socialist Republic—corresponds to the territory of Russia) reached a maximum of 133.9 million ha [80] in 1976. Part of the land was designated for arable farming without taking into account the economic efficiency of cultivating agricultural crops, and by 1989, the arable land area was reduced as planned to 132.8 million ha. In 1990, land ownership returned to Russia [81] and somewhat later was enshrined in the constitution [82]. The administrative code was not modified, and new rules for land use control were not introduced. A reduction in sown areas from 117.7 to 74.7 million ha, associated with the market economy, began. In 2002, the law on land circulation was introduced [83] and the laws of 1990 were terminated. Amendments were made to the administrative code on punishment for improper use of land [84]. In fact, punishment was introduced for owners of arable land in non-chernozem regions [85,86,87]. Despite the possibility of punishment, sown areas reached a minimum in 2005–2012 [4]. In 2011, a system of retrospective monitoring of soil–land cover began to be developed to analyze the reasons for the reduction in sown areas [39]. In March 2020, a pilot carbon polygon [88] was launched in Kaluga Oblast on the territory of the Ugra National Nature Park [89] to study the carbon state of arable lands overgrown with WSV, determined by the method of retrospective monitoring of soil–land cover. The Ministry of Education and Science’s project to create carbon testing sites on the territory of the Russian Federation was launched in early 2021 [90].
Retrospective monitoring of soil–land cover was conducted in a number of federal subjects of the Russian Federation; works on the Rostov [39,60,74,75,76,91], Tambov [92], Tula [93] and Kaluga [94] Oblasts and the Republic of Tatarstan [95] (Figure 1) are available in open access format. Two more federal subjects (Ivanovo Oblast and Stavropol Krai) were described in the reports of the “V.V. Dokuchaev Soil Science Institute” [96]. These works cover the following zonal series of soils: sod–strongly podzolic, sod–podzolic, sod–weakly podzolic, light-gray forest, gray forest, dark-gray forest, podzolized chernozem, leached chernozem, typical chernozem, dark-chestnut, chestnut and light-chestnut soils. The seven studied regions are located in four natural–agricultural zones: dry steppe, steppe, forest–steppe and southern taiga. These are the main zones of Russia, in which the main share of arable lands of Russia is concentrated. By agreement with the funders of the works, information on the withdrawal of lands from agricultural circulation in other regions is not currently published.
Table 5 provides statistical information on the dynamics of the sown areas of the seven listed federal subjects of Russia from 1990 to 2025 and the area of legally registered arable land. To clarify and correct statistical information, the law on the agricultural census of 2005 was adopted [97]. It should be noted that during the agricultural censuses of 2006 [98] and 2016 [99], it was not possible to solve the problem of cartographic confirmation of statistical information on agricultural lands [20,21]. The reasons for the withdrawal of arable land from agricultural circulation were established during retrospective monitoring of the soil–land cover, and new lands were described.
As follows from Table 5, the sown area in Russia decreased by 32%, while the area of arable land decreased by only 7%. In other words, 25% of Russia’s arable land is not cultivated and is not taken into account as part of any other land type. In the course of retrospective monitoring of the soil–land cover, an extensive classification of the modern state of legal arable land was developed. The classification is given in open access publications for four federal subjects [39,92,93,95]. The classifier for Palekhsky District of Ivanovo Oblast is given in Table 2. The classifier is universal for all federal subjects of Russia.
Table 5 also shows that the seven federal subjects responded differently to market relations. In some federal subjects, the sown areas decreased by only 7%, while in others they decreased by more than 60%. Some federal subjects experienced massive abandonment of lands with subsequent return to cultivation; in other regions, the arable land areas decreased and stabilized, and in others, further reduction is apparently possible. It can be assumed that the reasons for the dynamics of arable land in different federal subjects are not the same.
Stavropol Krai, except for the administrative districts bordering Krasnodar Krai, is located in an arid zone of a dry steppe reaching a semi-desert. Since 1990, arid fields have been abandoned, as their profitability has been low or negative. This trend could have led to the stabilization at a level of 70–75% of the 1985 arable land. However, since about 2011, moisture-saving no-till technology has become widespread in Russia [100], which has allowed more than 10% of arable land in Stavropol Krai to return to profitability [101,102,103]. The main reason for the abandonment of arable land in Stavropol Krai is low natural fertility. The reason for the stabilization of arable land areas is new technologies.
The Azov district of Rostov Oblast was the first testing area for the development and implementation of retrospective monitoring of soil–land cover [39,60,74,75,76,91]. The decline in the sown area in the late 1990s was caused by the active redistribution of property on the most fertile lands of Russia. One agricultural field of a former collective farm could be divided between more than 12 owners (Figure 10). This process ended quickly, but about 360 thousand ha were lost [4,6]. Mostly, the land loss was caused by the redistribution of property for buildings, since the land code and amendments to it, which made it possible to somehow slow down the withdrawal of chernozems from agricultural use, were adopted somewhat later [104]. The second factor is the economic unprofitability of cultivating vertisols [75] and saline soils of the region [76], that is, territories needlessly involved in arable farming. The third factor was the process of the formation of new overmoistened landscape objects (mochars) as a result of improper cultivation of forest belts [74]. Over 25 years, excessively moistened fragments of fields with marsh vegetation have time to form, which are economically unprofitable for exploitation. The stabilization of arable lands in Rostov Oblast was achieved by involving all fertile lands in arable farming. A large role in stabilization is played by the widespread introduction of modern precision farming systems in Rostov Oblast [105,106,107].
In Tambov Oblast, the factor of building construction on agricultural fields is also relevant, but unlike Rostov Oblast, the climatic factor has a greater influence [108]. Tambov Oblast is a region of meadow-chernozem soils [109]. During periods of increased moisture, parts of the arable land are withdrawn from sowing, and then, during drier periods, they are returned. Partially (about 1% of arable land), the process of the formation of excessively moistened territories is irreversible when part of the arable land is finally lost [92]. The main reason for the dynamics of arable land in Tambov Oblast is climatic fluctuations, which form areas of overmoistening, preventing soil cultivation. A secondary reason is the erroneous inclusion of constantly overmoistened territories in arable land. The stabilization of sown areas has not been achieved, since sown areas still depend on climatic fluctuations.
The Republic of Tatarstan is distinguished by the absence of a period of sharp decline in sown areas with a subsequent rebound, which is not typical for federal subjects of Russia. This is due to the strict and unchangeable governance in the republic, which controlled the turnover of agricultural land. Protective afforestation and the construction of roads with forest belts in five rows of different trees play a major role in the republic [95]. Fallow land was formed mainly on low-fertility lands. In general, a controlled decrease in arable land areas occurred on the territory of the republic, mainly for the purpose of soil conservation measures. The main reason for the exit of land from arable land zones is natural fertility. The second reason is soil degradation and the preventive control of degradation. The third factor is active road construction. Stabilization has been achieved through clear administrative management.
In addition to retrospective monitoring of soil–land cover, a method for measuring land use intensity was developed in Tula Oblast [93]. The method is based on the processing of big RSD [41] with neural network filtering of multi-temporal remote sensing arrays [70]. Two methods were able to reveal the main reason for the reduction in sown areas in Russia [93]. Figure 11 shows the relationship between the decrease in land use intensity on arable land and the zonal soil type. The withdrawal of arable land from agricultural circulation is mainly associated with the natural fertility of soils. The maximum abandonment is recorded on podzolic soils (up to 80%), the average on gray forest soils (about 50%) and the minimum on chernozems (about 10%). When arable land is abandoned, secondary forests are formed on gray forest and podzolic soils (Figure 5). The main reason for the withdrawal of land from arable land zones is natural fertility. Stabilization has been achieved by trial and error in bringing lands of different fertility levels into arable land zones or withdrawing them from arable land zones. The process is currently ongoing.
Unlike the Rostov, Tambov and Tula Oblasts and the Republic of Tatarstan, Kaluga Oblast does not have chernozems. For example, the Yukhnovsky district is located in the southern taiga zone on sod–podzolic and gray forest soils [110], within the Central Russian province, Smolensk–Moskovsky soil district and Maloyaroslavetsky and Baryatinsky soil districts [89]. In the database of municipalities, the sown area of the district for 2025 was about 13 thousand ha [111]. This database was not maintained for the period from 1985 to 2012. According to the database of the subjects of the Russian Federation [4], the arable land area of Kaluga Oblast did not decrease, and the sown area decreased from 1990 to 2024 by more than two times. The most fertile soil is gray forest soil. In general, arable land abandonment follows the patterns described for Tula Oblast. However, the overgrowing of arable land with trees and shrubs required a more detailed description of its degree (Table 4). Overgrowing is the dominant form of withdrawal of arable land from agricultural use and accounts for up to 65% of the total plowed area. The main reason for land withdrawal from agricultural use is natural fertility. Stabilization has not been achieved, since arable land is still introduced and withdrawn into agricultural use by trial and error when owners change.
The northernmost and least fertile of the subjects described is Ivanovo Oblast. All soils in the oblast are considered low-fertility compared with other federal subjects. The amount of abandoned arable land reaches 72% of the maximum plowed area. Most of the abandoned arable land is covered with WSV of varying degrees—slight, moderate, severe and very intensive. A smaller portion is in the grassing stage. Development and other anthropogenic transformations are negligible. That is, there is practically no construction in the region. Indeed, there was a decrease in the population from 1,321,000 in 1985 to 905,900 people in 2025. The use of land is complicated by its registration as private property with the subsequent relocation of owners to other federal subjects. In this situation, the legal process of transferring land ownership to municipalities is complicated. Cultivated fields remain mainly near existing settlements. Ivanovo Oblast is the only one of the studied series where the area of legal arable land in 2025 is lower than the sown area in 1990. The main reason for land becoming unusable for cultivation is natural fertility. The reduction in sown areas continues.

4. Discussion

4.1. Catastrophe or Stabilization

The reduction in arable land area and the decline in gross crop yields up until the disastrous years of 2010 and 2014 [4,5] led to the interpretation of the plowed land abandonment as a catastrophe [112,113,114]. The alarmist sentiments subsided somewhat after 2015, when Russia began to see record harvests, and by 2021, it had surpassed the RSFSR records of 1978 in gross harvests [115]. By this time, the sown area had stabilized at 68% of the 1990 sown area (Table 5).
The reduction in arable land and the growth in gross harvests mean a rapid increase in crop yields. On the one hand, this is due to the fact that the least fertile lands have left agricultural circulation. On the other hand, this is connected with the widespread introduction of modern technologies: precision farming [116], landscape-adaptive farming [117], no-till technology [100], strip-till technology [118] and many others. The latest technologies have not yet covered all of Russia’s arable lands compared to other countries [119,120]. Consequently, the potential for further growth in crop yields exists even with the existing sown areas. The reduction in Russia’s sown areas after 1990 should, rather, be interpreted as a natural stabilization of agriculture more so than a catastrophe.

4.2. Detailed Mapping of Arable Land

In this study, we used methods of manual interpretation of large arrays of RSD for 40 years. The achieved accuracy corresponds to a scale of 1:5000–10,000. This is a labor-intensive process that requires highly qualified RSD interpretation operators. Alternative approaches exist in the form of automated systems for identifying arable land.
To calculate the potential carbon sequestration on agricultural lands in the Russian Federation, a raster “Map of unused agricultural lands potentially suitable for growing forests” was created [12]. According to these materials, up to 80 million ha of agricultural lands has been abandoned in Russia [121]. The analysis is based on open spatial data and Greenpeace’s own materials, in collaboration with the Global Land Analysis and Discovery Team, the University of Copenhagen and Kazan Federal University. The methodology and results of the work were presented at the conferences ASGIS 2019 (Moscow) and Living Planet 2019 (Milan). The map is based on a series of theoretical constructions for processing remote sensing materials with a spatial resolution of up to 30 m [122,123,124,125,126].
The combination with the real map of fields of Tula Oblast and land management materials allows for the calculation of the accuracy of the Greenpeace raster map (grid) of agricultural lands. For the Arsenyevsky District of Tula Oblast, it identifies up to 41% of lands where there has never been plowing (false alarm) and in 9% of cases does not detect real arable land (missed target). For the Plavsky District, with a high level of arable land and a small percentage of abandoned lands [93], the accuracy of the Greenpeace grid is higher and amounts to a 20% false alarm rate with a 5% missed target rate.
Another product for analyzing changes in arable lands in Russia is the Land Cover Type Product [13,127]. The MODIS Land Cover Type Product (MCD12Q1) is a global land cover map with an annual time step and a spatial resolution of 500 m for the period from 2001 to the present. The product contains 13 scientific datasets, including five classification schemes (IGBP, UMD, LAI, BGC and PFT) and a new three-level legend based on the Land Cover Classification System of the FAO.
Grids of agricultural lands from the MODIS Land Cover Type Product were also compared with the results of soil–land retrospective monitoring. It should be noted that these grids carry a monitoring component, as they are compiled independently for each year from 2001 to the present. Due to the low spatial resolution (500 m), they significantly expand the area of arable land. In federal subjects of Russia with an arable land area of less than 50%, the false alarm rate is 40% or more. The missing of a target on these grids is practically not observed; that is, they systematically overestimate the area of arable land.
The next global product can be considered the GCI30 data set (available on Harvard Dataverse) [16,128]. The principle of operation intersects with the principles of determining the intensity of exploitation of the soil and land cover [24]. The main difference is the lack of correction of the boundaries of the arable land measurement areas based on high-spatial-resolution RSD. In the area of intensive dynamics of arable lands in Russia, automated methods currently tend to overestimate the area of actually exploited arable lands. Overestimation by 20–30% makes raster maps unsuitable for the monitoring of the dynamics of arable lands.

4.3. Research Area

The state program adopted in 2021 for the introduction of about 13 million ha of unused lands into agricultural circulation [26] and the tightening of the administrative code [84] indirectly indicate the end of the period of purely market determination of the economic efficiency of land use. One article [23] shows how regional authorities have reacted to the government order. The short-term increase in the sown area in 2022 and the drop below 2020 in 2024 show that it is difficult to introduce low-fertility lands into agricultural circulation. It is especially difficult to introduce abandoned lands without having a detailed survey of them. But even short-term land introduction is accompanied by deforestation with a huge carbon footprint and with high costs (about RUB 60 thousand (~USD 750) per ha [129,130]). The carbon polygon program [90] fundamentally does not take into account forests on arable land, since officially, there are no forests on arable lands. The pilot carbon polygon, where such studies were conducted, has been closed. Thus, the Russian Federation Government Resolution of 21 September 2020 № 1509 “On the specifics of the use, protection, conservation, and reproduction of forests located on agricultural lands” is blocked [25]. At the same time, a number of studies show that carbon accumulation in forests formed on agricultural lands exceeds carbon stocks in arable soils [131,132,133].
The work of Greenpeace [12] has shown great potential for carbon sequestration in forests on arable land. However, the work is based on the automated decoding of RSD and greatly overestimates the area of arable land in Russia.
Further research will aim for the detailed mapping of the dynamics of carbon in arable lands, both in the soil and in WSV [88]. In the course of further research, it is planned to assess the carbon losses already occurring during the felling of secondary forests.

5. Conclusions

The decline in the sustainability of Russian agriculture from 1985 to 2015 led to the formation of a new type of land—abandoned arable land. During retrospective monitoring of the soil–land cover, at least 10 different states of abandoned arable land were identified and a new land classifier was created that takes into account the volume of accumulated biomass. Officially, these new lands do not exist; that is, they are listed as ordinary arable land. Mathematically, these lands are the difference between sown areas and legal arable land, which is at least 35 million ha, or at least 26% of the arable land area of Russia in 1985. In fact, these lands are represented by woody and shrubby vegetation with different volumes of wood, meadow vegetation, swamps, salt marshes, anthropogenic construction and much more. At the level of laws, these lands can be recognized as carbon deposit areas or administrative violation territories. That is, there is no single legal perspective on these lands, as there is no state cartographic system for their inventorying and description.
The simultaneous decline in gross agricultural yields and sown areas in 1985–2015 led to tougher administrative penalties (fines and confiscations) for unused arable land without the establishment of the reasons for the withdrawal of the land from agricultural use, since these reasons do not legally exist either. Administrative penalties did not stop the decline in sown areas. The stabilization of agricultural production occurred spontaneously by 2020 based on market mechanisms, with a sown area of 80 million ha (in 1990, the sown area was 117.4 million ha) and with an increase in gross grain and leguminous crop yields to 120–150 million tons. The previous stabilization occurred in the 1980s and was achieved in a state-controlled regime, with a sown area of 119.7 million ha and gross grain and leguminous crop yields at 95–105 million tons.
Retrospective monitoring of soil–land cover made it possible to describe the process of the loss of stability in crop production in Russia in 1985–2010 and its subsequent stabilization in 2015–2025 based on detailed (scale of 1:10,000) cartography. In the course of retrospective monitoring, land use maps for arable land were reconstructed for 1985, 1990, 1995, 2000, 2005, 2010, 2015, 2020 and 2025 based on the new classification of lands. It was possible to reveal the reasons for the reduction in sown areas. The main reason for the withdrawal of arable land from agricultural circulation and the decrease in sown areas is the negative profitability of crop production on soils with low natural fertility or on degraded lands. The termination of state subsidies in the non-chernozem region stopped agricultural production. Russia’s arable land was abandoned in proportion to the natural fertility of the soils in the following zonal series: sod–podzolic (60–70%), gray forest (40–50%), chernozem (5–10%) and chestnut (10–20%).
The withdrawal of low-productivity lands from agricultural circulation increased the profitability of crop production and freed up resources for agricultural intensification. The efficiency of land use on the remaining lands increased and allowed for the mass introduction of modern farming systems (smart, precise, landscape-adaptive, differentiated, no-till, strip-till, etc.), which further increased the profitability of crop yields and stabilized crop production in Russia at a new, higher level. Economically unprofitable lands were withdrawn from agricultural circulation spontaneously on the basis of market mechanisms. The prospect of using abandoned lands as carbon sequestration zones in forest plantations arose. The economic component of sequestration depends on the cost of carbon quotas. The results of this retrospective survey can be used as a basis for traditional monitoring, calculating the volumes of deposited carbon, assessing potential carbon emissions from the ineffective planned involvement of arable abandoned lands and forecasting the state of arable lands in Russia.

Author Contributions

Conceptualization, D.I.R.; methodology, D.I.R.; software, P.V.K. and M.A.K.; validation, P.V.K.; formal analysis, P.V.K.; investigation, D.I.R.; resources, D.I.R.; data curation, D.I.R. and P.V.K.; writing—original draft preparation, D.I.R.; writing—review and editing, M.A.K., D.A.S. and T.G.P.; visualization, P.V.K.; supervision, D.I.R.; project administration, D.I.R.; funding acquisition, D.I.R. All authors have read and agreed to the published version of the manuscript.

Funding

The research was conducted within the framework of state assignment № FGUR-2025-0001 “To study intra-field heterogeneity, transformation, evolution, degradation of the soil cover of agricultural landscapes at different levels of organization based on a combination of ground surveys and digital technologies”, with registration № 125041805282-6.

Institutional Review Board Statement

Not applicable.

Informed Consent Statement

Not applicable.

Data Availability Statement

Publicly available Landsat datasets were analyzed in this study. These data can be found here: http://earthexplorer.usgs.gov, accessed on 20 March 2025. The other data that support the findings of this study are available on request from the corresponding author.

Conflicts of Interest

The authors declare no conflicts of interest.

Abbreviations

The following abbreviations are used in this manuscript:
ATCORAtmospheric and topographic correction
BSSBare soil surface
CVCross-validation
DEMDigital elevation model
ERDASEarth Resource Development Assessment System
FAOFood and Agriculture Organization of the United Nations
GISGeographic information system
QGISQuantum geographic information system
MODISModerate Resolution Imaging Spectroradiometer
RSDRemote sensing data
RSFSRRussian Soviet Federative Socialist Republic
SRTMShuttle Radar Topography Mission
USSRUnion of Soviet Socialist Republics
WSVWoody and shrub vegetation

References

  1. Marx, K. Capital: A Critique of Political Economy. In The Process of Capitalist Production; Cosimo: New York, NY, USA, 1867; Volume 1. [Google Scholar]
  2. Union of Soviet Socialist Republics Law on Individual Labor Activity Dated 19.11.1986. Available online: https://docs.cntd.ru/document/9024308 (accessed on 30 May 2025).
  3. Russian Soviet Federative Socialist Republic Law on Enterprises and Entrepreneurial Activity Dated 01.01.1991. Available online: https://docs.cntd.ru/document/9005390 (accessed on 30 May 2025).
  4. Cultivated Area of Agricultural Crops. Unified Interdepartmental Information and Statistical System. State Statistics. Available online: https://fedstat.ru/indicator/31328 (accessed on 20 March 2025).
  5. Gross Harvest of Agricultural Crops. Unified Interdepartmental Information and Statistical System. State Statistics. Available online: https://www.fedstat.ru/indicator/30950 (accessed on 20 March 2025).
  6. The Area of Land Fund within the Boundaries of the Territories of the Russian Federation. Unified Interdepartmental Information and Statistical System. State Statistics. Available online: https://www.fedstat.ru/indicator/38150 (accessed on 20 March 2025).
  7. Koroleva, P.V. Spatio-Temporal Relationships Between Land Use and Soil Cover of Arable Land (on Example of the Arsenyevsky and Plavsky Districts of the Tula Oblast in the Period from 1969 to 2020). Ph.D. Thesis, V.V. Dokuchaev Soil Science Institute, Moscow, Russia, 2023. [Google Scholar]
  8. Peralta, G.; Di Paolo, L.; Luotto, I.; Omuto, C.; Mainka, M.; Viatkin, K.; Yigini, Y. Global Soil Organic Carbon Sequestration Potential Map (GSOCseq v1.1)–Technical Manual; FAO: Rome, Italy, 2022; ISBN 978-92-5-133796-7. [Google Scholar]
  9. Romanenkov, V.A.; Meshalkina, J.L.; Gorbacheva, A.Y.; Krenke, A.N.; Petrov, I.K.; Golozubov, O.M.; Rukhovich, D.I. Maps of soil organic carbon sequestration potential in the Russian croplands. Eurasian Soil Sci. 2024, 57, 737–750. [Google Scholar] [CrossRef]
  10. Zhidkin, A.P.; Rukhovich, D.I.; Maltsev, K.A.; Koroleva, P.V. Variation of soil erosion estimates based on different maps of cropland in Belgorod oblast, Russia. Eurasian Soil Sci. 2024, 57, 666–676. [Google Scholar] [CrossRef]
  11. Map of Arable Lands of Russia. Space Research Institute. Available online: http://smiswww.iki.rssi.ru/default.aspx?page=317 (accessed on 20 March 2025).
  12. Map of Unused Agricultural Land Potentially Suitable for Forest Cultivation. Available online: https://maps.greenpeace.org/maps/aal/ (accessed on 20 March 2025).
  13. Friedl, M.; Sulla-Menashe, D. MCD12q1 MODIS/Terra+Aqua Land Cover Type Yearly L3 Global 500m SIN Grid V006 [Data Set]. NASA EOSDIS Land Processes DAAC. Available online: https://www.earthdata.nasa.gov/data/catalog/lpcloud-mcd12q1-006 (accessed on 20 March 2025).
  14. Zhang, M.; Wu, B.; Zeng, H.; He, G.; Liu, C.; Tao, S.; Zhang, Q.; Nabil, M.; Tian, F.; Bofana, J.; et al. GCI30: A global dataset of 30 m cropping intensity using multisource remote sensing imagery. Earth Syst. Sci. Data 2021, 13, 4799–4817. [Google Scholar] [CrossRef]
  15. Remote Monitoring System for Agricultural Lands. Available online: https://sovzond.ru/services/gis/ogv/federal/sdmz/ (accessed on 20 March 2025).
  16. Unified Federal Information System on Agricultural Lands. Available online: http://efis.mcx.ru/ (accessed on 20 March 2025).
  17. Soil Map of the Bolshevik Collective Farm, Palekhsky District, Ivanovo Oblast, Scale 1:10000; Cartographic Branch of Roszemproekt: Saratov, Russia, 1985.
  18. Project of Internal Land Management of the Bandikov Collective Farm, Arsenyevsky District, Tula Oblast, Scale 1:10000; Ministry of Agriculture of the RSFSR: Moscow, Russia, 1986.
  19. Simakova, M.S. Soil maps. In Cartographic Knowledge of Russia (Topographic and Thematic Maps); Publishing House of the Institute of Geography of the Russian Academy of Sciences: Moscow, Russia, 1999; pp. 113–133. [Google Scholar]
  20. Rukhovich, D.I.; Shapovalov, D.A. Food safety of Russia: View from cosmos. Vlast 2015, 8, 101–107. [Google Scholar]
  21. Rukhovich, D.I.; Shapovalov, D.A.; Kulyanitsa, A.L.; Koroleva, P.V. Food security of Russia and state statistics—where do the invented numbers lead to. Int. Agric. J. 2017, 6, 64–69. [Google Scholar]
  22. Decree of the President of the Russian Federation Dated 04.11.2020 № 666 “On Reducing Greenhouse Gas Emissions”. Available online: http://www.kremlin.ru/acts/bank/45990 (accessed on 20 March 2025).
  23. Resolution of the Government of the Russian Federation Dated 21. 09. 2020 № 1509 “On the Specifics of the Use, Protection, Conservation, and Reproduction of Forests Located on Agricultural Lands”. Available online: https://base.garant.ru/74671970/?ysclid=m7ylkezbp8770147391 (accessed on 20 March 2025).
  24. Resolution of the Government of the Russian Federation Dated 14.05.2021 No. 731 “On the State Program for the Effective Involvement of Agricultural Lands into Circulation and the Development of the Land Reclamation Complex of the Russian Federation”. Available online: https://base.garant.ru/400773886/?ysclid=m7vna1yy6x836835665 (accessed on 20 March 2025).
  25. Federal State Statistics Service. Available online: https://rosstat.gov.ru/ (accessed on 20 March 2025).
  26. Adoption of the Paris Agreement; FCCC/CP/2015/L.9/Rev.1. In Proceedings of the United Nations Framework Convention on Climate Change, Le Bourget, France, 12 December 2015.
  27. UN. Kyoto Protocol to the United Nations Framework Convention on Climate Change. 1998. Available online: https://unfccc.int/resource/docs/convkp/kpeng.pdf (accessed on 20 March 2025).
  28. Fetting, C. The European Green Deal; ESDN Office: Vienna, Austria, 2020; Available online: https://www.esdn.eu/fileadmin/ESDN_Reports/ESDN_Report_2_2020.pdf (accessed on 20 March 2025).
  29. Kurganova, I.; Lopes de Gerenyu, V.; Kuzyakov, Y. Large-scale carbon sequestration in post-agrogenic ecosystems in Russia and Kazakhstan. Catena 2015, 133, 461–466. [Google Scholar] [CrossRef]
  30. Wertebach, T.; Hölzel, N.; Kämpf, I.; Yurtaev, A.; Tupitsin, S.; Kiehl, K.; Kamp, J.; Kleinebecker, T. Soil carbon sequestration due to post-Soviet cropland abandonment: Estimates from a large-scale soil organic carbon field inventory. Glob. Change Biol. 2017, 23, 3729–3741. [Google Scholar] [CrossRef]
  31. Hacisalihoglu, S.; Sezgin, H.; Karadag, U. Estimation of carbon stocks in forest and pasture area originated from abandoned cropland. In Proceedings of the ICOCEE–CAPPADOCIA 2017, Nevsehir, Turkey, 8–10 May 2017; Volume 2, pp. 1–24. [Google Scholar]
  32. Heikkinen, J.; Kurganova, I.; Lopes de Gerenyu, V.; Regina, K. Changes in soil carbon stock after cropland conversion to grassland in Russian temperate zone: Measurements versus model simulation. Nutr. Cycling Agroecosyst. 2014, 98, 97–106. [Google Scholar] [CrossRef]
  33. Haneklaus, S.; Lilienthal, H.; Schnug, E. 25 years Precision Agriculture in Germany—A retrospective. In Proceedings of the 13th International Conference on Precision Agriculture, St. Louis, MO, USA, 31 July–4 August 2016. [Google Scholar]
  34. Kukutai, A. Can Digital Farming Deliver on Its Promise? PrecisionAg. 2016. Available online: https://www.globalagtechinitiative.com/digital-farming/can-digital-farming-deliver-on-its-promise/ (accessed on 4 June 2025).
  35. Breakthroughs in Precision Agriculture. 1985. Available online: https://maes.umn.edu/history/discoveries (accessed on 20 March 2025).
  36. Robert, P.C. Evaluation of Some Remote Sensing Techniques for Soil And Crop Management. Ph.D. Thesis, University of Minnesota, St. Paul, MN, USA, 1982. [Google Scholar]
  37. Robert, P.C. Characterisation of soil conditions at the field level for soil specific management. Geoderma 1993, 60, 57–72. [Google Scholar] [CrossRef]
  38. Robert, P.C. Precision agriculture: A challenge for crop nutrition management. Plant and Soil 2002, 247, 143–149. [Google Scholar] [CrossRef]
  39. Bryzzhev, A.V.; Rukhovich, D.I.; Koroleva, P.V.; Kalinina, N.V.; Vilchevskaya, E.V.; Dolinina, E.A.; Rukhovich, S.V. Organization of retrospective monitoring of the soil cover of Rostov oblast. Eurasian Soil Sci. 2015, 48, 1029–1049. [Google Scholar] [CrossRef]
  40. Cox, M.; Ellsworth, D. Application-controlled demand paging for out-of-Core Visualization. In Proceedings of the 8th Conference on Visualization ’97 (VIS ’97), Phoenix, AZ, USA, 1 October 1997; pp. 235–244. [Google Scholar]
  41. Bovolo, F.; Bruzzone, L.; Fernández-Prieto, D.; Paris, C.; Solano-Correa, Y.T.; Volden, E.; Zanetti, M. Big data from space for precision agriculture applications. IOP Conf. Ser.: Earth Environ. Sci. 2020, 509, 012004. [Google Scholar] [CrossRef]
  42. Agroinvestor. Available online: https://www.agroinvestor.ru/markets/news/43563-eksport-zerna-iz-rossii-v-2024-godu-prevysil-71-mln-tonn/ (accessed on 25 June 2025).
  43. Natural and Agricultural Zoning of the Land Fund of the USSR, Scale 1:8000000; GUGK: Moscow, Russia, 1984.
  44. Unified State Register of Soil Resources of Russia, Ivanovo Oblsat. Available online: http://egrpr.soil.msu.ru/egrpr.php?show=RUREG&ValueID=991 (accessed on 20 March 2025).
  45. Vysotsky, G.N. On the oro-climatic bases of soil classification. Pochvovedeniye 1906, 8, 1–18. [Google Scholar]
  46. Database of Municipal Indicators. Ivanovo Oblast. Available online: https://rosstat.gov.ru/dbscripts/munst/munst24/DBInet.cgi (accessed on 20 March 2025).
  47. State Research and Implementation Center for Geoinformation Systems and Technologies. FSUE “GOSGISTSENTR”. Available online: https://web.archive.org/web/20021017101056/ggc.ru/ (accessed on 20 March 2025).
  48. Yandex Maps. Available online: https://yandex.ru/maps/ (accessed on 20 March 2025).
  49. Google Maps. Available online: www.google.ru/maps (accessed on 20 March 2025).
  50. Bing Maps. Available online: https://www.bing.com/maps (accessed on 20 March 2025).
  51. ArcGis Online. Available online: https://www.esri.ca (accessed on 20 March 2025).
  52. Landsat Data Courtesy of the U.S. Geological Survey. 2023. Available online: https://earthexplorer.usgs.gov (accessed on 20 March 2025).
  53. Modified Copernicus Sentinel Data 2016–2023. Available online: https://www.sentinel-hub.com (accessed on 20 March 2025).
  54. Topographic Map, Scale 1:100000. Available online: https://satmaps.info/map.php?s=100k&map=n-36-047 (accessed on 20 March 2025).
  55. Topographic Map, Scale 1:200000. Available online: https://satmaps.info/map.php?s=200k&map=n-36-12 (accessed on 20 March 2025).
  56. Public Cadastral Map. Available online: https://nspd.gov.ru/map?thematic=PKK (accessed on 20 March 2025).
  57. SRTM. Available online: http://srtm.csi.cgiar.org (accessed on 20 March 2025).
  58. European Space Agency. Copernicus Global Digital Elevation Model. Distributed by Open Topography. 2021. Available online: https://portal.opentopography.org/datasetMetadata?otCollectionID=OT.032021.4326.1 (accessed on 20 March 2025).
  59. ArcGIS. Available online: https://www.esri.com/ru-ru/arcgis/about-arcgis/overview (accessed on 20 March 2025).
  60. Rukhovich, D.I.; Simakova, M.S.; Kulyanitsa, A.L.; Bryzzhev, A.V.; Koroleva, P.V.; Kalinina, N.V.; Vilchevskaya, E.V.; Dolinina, E.A.; Rukhovich, S.V. Analysis of the use of soil maps in the system of retrospective monitoring of the state of lands and soil cover. Pochvovedeniye 2015, 5, 605–625. [Google Scholar]
  61. Erdas Imagine. Available online: https://www.hexagongeospatial.com/products/power-portfolio/erdas-imagine (accessed on 20 March 2025).
  62. Kulyanitsa, A.L.; Rukhovich, A.D.; Rukhovich, D.D.; Koroleva, P.V.; Rukhovich, D.I.; Simakova, M.S. The application of the piecewise linear approximation to the spectral neighborhood of soil line for the analysis of the quality of normalization of remote sensing materials. Eurasian Soil Sci. 2017, 50, 387–396. [Google Scholar] [CrossRef]
  63. QGIS. Available online: https://qgis.org/ (accessed on 20 March 2025).
  64. LeCun, Y.; Boser, B.; Denker, J.S.; Henderson, D.; Howard, R.E.; Hubbard, W.; Jackel, L.D. Backpropagation applied to handwritten zip code recognition. Neural Comput. 1989, 1, 541–551. [Google Scholar] [CrossRef]
  65. Data Mining. Available online: https://www.britannica.com/technology/data-mining (accessed on 20 March 2025).
  66. Friedman, J.H. Greedy function approximation: A gradient boosting machine. Ann. Stat. 2001, 29, 1189–1232. [Google Scholar] [CrossRef]
  67. Prokhorenkova, L.; Gusev, G.; Vorobev, A.; Dorogush, A.V.; Gulin, A. Catboost: Unbiased boosting with categorical features. Adv. Neural Inf. Process. Syst. 2018, 31, 6638–6648. [Google Scholar]
  68. LeCun, Y.; Bottou, L.; Bengio, Y.; Haffner, P. Gradient-based learning applied to document recognition. Proc. IEEE 1998, 86, 2278–2324. [Google Scholar] [CrossRef]
  69. Krizhevsky, A.; Sutskever, I.; Hinton, G.E. Imagenet classification with deep convolutional neural networks. Adv. Neural Inf. Process. Syst. 2012, 25, 1097–1105. [Google Scholar] [CrossRef]
  70. Rukhovich, D.I.; Koroleva, P.V.; Rukhovich, D.D.; Kalinina, N.V. The use of deep machine learning for the automated selection of remote sensing data for the determination of areas of arable land degradation processes distribution. Remote Sens. 2021, 13, 155. [Google Scholar] [CrossRef]
  71. Kohavi, R. A study of cross-validation and bootstrap for accuracy estimation and model selection. In Proceedings of the 14th International Joint Conference on Artificial Intelligence-Volume 2 (IJCAI’95), Montreal, QC, Canada, 20–25 August 1995; pp. 1137–1143. [Google Scholar]
  72. Mullin, M.; Sukthankar, R. Complete cross-validation for nearest neighbor classifiers. In Proceedings of the Seventeenth International Conference on Machine Learning (ICML ’00), Stanford, CA, USA, 29 June–2 July 2000; pp. 639–646. [Google Scholar]
  73. Konstantinovskaya, L.V. Remote Control Methods. Available online: http://www.astronom2000.info/different/11-g/ (accessed on 20 March 2025).
  74. Rukhovich, D.I.; Simakova, M.S.; Kulyanitsa, A.L.; Bryzzhev, A.V.; Koroleva, P.V.; Kalinina, N.V.; Vil’Chevskaya, E.V.; Dolinina, E.A.; Rukhovich, S.V. Impact of shelterbelts on the fragmentation of erosional networks and local soil waterlogging. Eurasian Soil Sci. 2014, 47, 1086–1099. [Google Scholar] [CrossRef]
  75. Rukhovich, D.I.; Simakova, M.S.; Kulyanitsa, A.L.; Bryzzhev, A.V.; Koroleva, P.V.; Kalinina, N.V.; Vil’Chveskaya, E.V.; Dolinina, E.A.; Rukhovich, S.V. Retrospective analysis of changes in land uses on vertic soils of closed mesodepressions on the Azov plain. Eurasian Soil Sci. 2015, 48, 1050–1075. [Google Scholar] [CrossRef]
  76. Rukhovich, D.I.; Simakova, M.S.; Kulyanitsa, A.L.; Bryzzhev, A.V.; Koroleva, P.V.; Kalinina, N.V.; Chernousenko, G.I.; Vil’Chevskaya, E.V.; Dolinina, E.A. The influence of soil salinization on land use changes in Azov district of Rostov oblast. Eurasian Soil Sci. 2017, 50, 276–295. [Google Scholar] [CrossRef]
  77. Sokolov, P.A. Forest Taxation; Izhevsk State Agricultural Academy: Izhevsk, Russia, 2007. [Google Scholar]
  78. Order of the Ministry of Natural Resources of Russia Dated 5. 8. 2022 № 510 “On Approval of the Forest Management Instructions”. Available online: https://urtmag.ru/upload/iblock/604/Prikaz-Minprirody-Rossii-ot-05_08_2022-N-510-Ob-utverzhdenii.pdf (accessed on 20 March 2025).
  79. Decree of the II All-Russian Congress of Soviets on Land. 1917. Available online: http://www.hist.msu.ru/ER/Etext/DEKRET/o_zemle.htm (accessed on 20 March 2025).
  80. Tsypin, A.P.; Ovsyannikov, V.A. Retrospective analysis of the dynamics of sown areas in Russia. In Proceedings of the V International Scientific and Practical Conference on Actual Problems and Prospects for the Development of State Statistics in Modern Conditions, Saratov, Russia, 19–21 December 2018; pp. 56–58. [Google Scholar]
  81. Russian Soviet Federative Socialist Republic Law on Land Reform Dated 23. 11. 1990 № 374-I. Available online: https://normativ.kontur.ru/document?moduleId=1&documentId=5379&ysclid=m7pytk54uv101250174 (accessed on 20 March 2025).
  82. Constitution of the Russian Federation. Available online: http://duma.gov.ru/legislative/documents/constitution/ (accessed on 20 March 2025).
  83. Federal Law Dated 24.07.2002 № 101-FZ “On the Circulation of Agricultural Land”. Available online: https://www.consultant.ru/document/cons_doc_LAW_37816/ (accessed on 20 March 2025).
  84. Code of the Russian Federation on Administrative Offenses Dated 30. 12. 2001 № 195-FZ. Available online: https://www.consultant.ru/document/cons_doc_LAW_34661/ (accessed on 20 March 2025).
  85. Non-Chernozem Region. Available online: https://dic.academic.ru/dic.nsf/enc3p/212246 (accessed on 20 March 2025).
  86. Averkieva, K.V. Rural non-chernozem: Depopulation and possible ways of adaptation to new conditions. Probl. Geogr. 2013, 135, 108–125. [Google Scholar]
  87. Fadeeva, O.P. Rural Communities and Economic Structures: From Survival to Development; Institute of Economics and Industrial Engineering SB RAS: Novosibirsk, Russia, 2015; Available online: http://lib.ieie.su/docs/2015/Fadeeva2015.pdf (accessed on 20 March 2025).
  88. Kurganova, I.N.; Lopes de Gerenyu, V.O.; Ipp, S.L.; Kaganov, V.V.; Khoroshaev, D.A.; Rukhovich, D.I.; Sumin, Y.V.; Durmanov, N.D.; Kuzyakov, Y.V. Pilot carbon polygon in Russia: Analysis of carbon stocks in soils and vegetation. J. Soils Environ. 2022, 5, e169. (In Russian) [Google Scholar] [CrossRef]
  89. Ugra National Park. Available online: https://parkugra.ru/about/prirodnye-osobennosti/pochvy/?ysclid=m7n68wmujf263162268 (accessed on 20 March 2025).
  90. Carbon Polygons. Ministry of Science and Higher Education of the Russian Federation. Available online: https://minobrnauki.gov.ru/action/poligony/index.php?sphrase_id=108077 (accessed on 20 March 2025).
  91. Khitrov, N.B.; Vlasenko, V.P.; Rukhovich, D.I.; Kalinina, N.V.; Rogovneva, L.V. The geography of vertisols and vertic soils in the Kuban-Azov lowland. Eurasian Soil Sci. 2015, 48, 671–688. [Google Scholar] [CrossRef]
  92. Koroleva, P.V.; Rukhovich, D.I.; Shapovalov, D.A.; Suleiman, G.A.; Dolinina, E.A. Retrospective monitoring of soil waterlogging on arable land of Tambov oblast in 2018–1968. Eurasian Soil Sci. 2019, 52, 834–852. [Google Scholar] [CrossRef]
  93. Rukhovich, D.I.; Rukhovich, A.D.; Simakova, M.S.; Kulyanitsa, A.L.; Koroleva, P.V.; Rukhovich, D.D. Application of the spectral neighborhood of soil line technique to analyze the intensity of soil use in 1985–2014 (by the example of three districts of Tula oblast). Eurasian Soil Sci. 2018, 51, 345–358. [Google Scholar] [CrossRef]
  94. Rukhovich, D.I.; Koroleva, P.V.; Vilchevskaya, E.V. Dynamics of intensity of exploitation of soil and land cover of Yukhnovsky district of Kaluga Oblast in 1984-2021. In Proceedings of the IV All-Russian Open Conference “Soil and Land Resources: Status, Assessment and Use”, Moscow, Russia, 5–7 December 2022; pp. 145–153. [Google Scholar]
  95. Koroleva, P.V.; Suleiman, G.A.; Kulyanitsa, A.L.; Shapovalov, D.A.; Rukhovich, D.I. The use of big satellite data to analyze changes in the intensity of exploitation of the soil-land cover of the Republic of Tatarstan. In Proceedings of the 19th International Multidisciplinary Scientific GeoConference SGEM 2019, Albena, Bulgaria, 30 June–6 July 2019; Volume 19, pp. 1021–1028. [Google Scholar] [CrossRef]
  96. Federal Research Center, V.V. Dokuchaev Soil Science Institute. Available online: https://esoil.ru/ (accessed on 20 March 2025).
  97. Federal Law Dated 21. 7. 2005 № 108-FZ “On the All-Russian Agricultural Census”. Available online: https://docs.cntd.ru/document/901941335 (accessed on 20 March 2025).
  98. Resolution of the Government of the Russian Federation Dated 31.10. 2005 № 651 “On the Organization of the All-Russian Agricultural Census”. Available online: https://docs.cntd.ru/document/901953898 (accessed on 20 March 2025).
  99. Resolution of the Government of the Russian Federation Dated 10.04. 2013 № 316 “On the Organization of the All-Russian Agricultural Census of 2016”. Available online: https://docs.cntd.ru/document/499014817 (accessed on 20 March 2025).
  100. Derpsch, R. Historical review of no-tillage cultivation of crops. Available online: http://www.rolf-derpsch.com/en/no-till/historical-review/ (accessed on 20 March 2025).
  101. Esaulko, A.N.; Drepa, E.B.; Ozheredova, A.Y.; Golosnoi, E.V. Experience of no-till technology in different climatic zones of the Stavropol Krai. Zemledelije 2019, 7, 28–31. [Google Scholar] [CrossRef]
  102. Stavropol Krai is Among the Top Five in Terms of Area of Application of the No-Till System. Available online: https://mcx.gov.ru/press-service/regions/stavropole-v-pyaterke-liderov-po-ploshchadi-primeneniya-sistemy-no-till/?ysclid=m7uoh6z88y335049292 (accessed on 20 March 2025).
  103. Nikitin, D.A.; Geraskina, A.P.; Frolov, O.A.; Tkhakakhova, A.K.; Ksenofontova, N.A.; Kutovaya, O.V. No-Till technology as a factor in the activity of soil microorganisms and invertebrates of agrochernozems of the Stavropol Krai. In Proceedings of the Conference “Soil Science: Horizons of the Future 2020”, Moscow, Russia, 11–14 February 2020; pp. 151–153. [Google Scholar]
  104. Land Code of the Russian Federation dated 25. 10. 2001 № 136-FZ. Article 39.18. Features of the Provision of Land Plots in State or Municipal Ownership to Citizens For Individual Housing Construction, Running a Personal Subsidiary Farm within the Boundaries of a Populated Area, Gardening for Personal Needs. Available online: https://www.consultant.ru/document/cons_doc_LAW_33773/3e878d61b0de409120ad70762779b6616b55d7d9/ (accessed on 20 March 2025).
  105. Lyashkov, M.A.; Slabunova, A.V.; Ariskina, Y.Y. Application of agricultural geographic information database of Rostov Region in the precision farming system. Ecol. Water Manag. 2021, 3, 40–60. (In Russian) [Google Scholar] [CrossRef]
  106. The Rostov Region Ministry of Agriculture Will Consider Proposals for Subsidizing “Smart” Farming. Available online: https://expertsouth.ru/news/minselkhoz-rostovskoy-oblasti-rassmotrit-predlozheniya-po-subsidirovaniyu-umnogo-zemledeliya/?ysclid=mcq2gwmsz8849111447 (accessed on 20 March 2025).
  107. True Fields. Available online: https://agronote.ru/truefields/?ysclid=m7vi979p91436768295 (accessed on 20 March 2025).
  108. Gvozdetsky, V.M.; Zamorin, P.K. Mochary on Tulchanin. J. Geol. Geogr. Cycle 1933, 2, 5–12. (In Russian) [Google Scholar]
  109. Zaidelman, F.R.; Nikiforova, A.S.; Stepantsova, L.V.; Krasin, V.N.; Safronov, S.B. Ecological-hydrological and genetic features of chernozem-like soils of closed depressions in the northern Tambov Lowland. Eurasian Soil Sci. 2002, 35, 176–189. [Google Scholar] [CrossRef]
  110. Unified State Register of Soil Resources of Russia, Kaluga Oblast. Available online: http://egrpr.soil.msu.ru/egrpr.php?show=RUREG&ValueID=994 (accessed on 20 March 2025).
  111. Database of Municipal Indicators. Kaluga Oblast. Available online: https://rosstat.gov.ru/dbscripts/munst/munst29/DBInet.cgi (accessed on 20 March 2025).
  112. Land Potential of Russia: Status, Problems and Measures for Its Rational Use and Protection. Available online: https://www.ras.ru/FStorage/Download.aspx?id=5e5ba20e-8e6f-440b-8e17-5b52118fe86c (accessed on 20 March 2025).
  113. Lyuri, D.I.; Nekrich, A.S.; Karelin, D.V. Cropland dynamics in Russia in 1990–2015 and soil emission of carbon dioxide. Vest. Mosk. Univ. Ser. 5 2018, 3, 70–76. [Google Scholar]
  114. Lyuri, D.I.; Goryachkin, S.V.; Karavaeva, N.A.; Denisenko, E.A.; Nefedova, T.G. Dynamics of Agricultural Lands of Russia in the 20th Century and Post-Agrogenic Restoration of Vegetation and Soils; GEOS: Moscow, Russia, 2010. (In Russian) [Google Scholar]
  115. Gross Collections in the USSR. Russian Statistical Yearbook. Rosstat: Moscow, Russia, 2023; Available online: https://ru.ruwiki.ru/wiki/Валoвые_сбoры_сельхoзкультур_в_РСФСР (accessed on 20 March 2025).
  116. Khitrov, N.B.; Rukhovich, D.I.; Koroleva, P.V.; Kalinina, N.V.; Trubnikov, A.V.; Petukhov, D.A.; Kulyanitsa, A.L. A study of the responsiveness of crops to fertilizers by zones of stable intra-field heterogeneity based on big satellite data analysis. Arch. Agron. Soil Sci. 2020, 66, 1963–1975. [Google Scholar] [CrossRef]
  117. Kiryushin, V.I. The management of soil fertility and productivity of agrocenoses in adaptive-landscape farming systems. Eurasian Soil Sci. 2019, 52, 1137–1145. [Google Scholar] [CrossRef]
  118. Safin, H.M.; Fakhrislamov, R.S.; Schwartz, L.S.; Davletshin, F.M.; Mudarisov, S.G.; Rakhimov, Z.S.; Ayupov, D.S.; Umetbaev, A.S. Agrotechnical Features of Using Strip-Till Technology in Crop Production; Mir Pechati: Ufa, Russia, 2017; Available online: https://apkrb.info/sites/default/files/doc/pdf/agrotehnicheskieosobennostiispolzovaniyastrip-till.pdf?ysclid=m7vvuxny58466098176 (accessed on 20 March 2025).
  119. Rodimtsev, S.A.; Pavlovskaya, N.E. Trends in solving precision farming problems in the implementation plans of state and industrial programs. Bull. Agrar. Sci. 2021, 6, 87–94. (In Russian) [Google Scholar] [CrossRef]
  120. Komissarov, M.A.; Klik, A. The impact of no-till, conservation, and conventional tillage systems on erosion and soil properties in Lower Austria. Eurasian Soil Sci. 2020, 53, 503–511. [Google Scholar] [CrossRef]
  121. Glushkov, I.; Lupachik, V.; Prishchepov, A.; Potapov, P.; Pukinskaya, M.; Yaroshenko, A.; Zhuravleva, I. Mapping Abandoned Lands in Eastern Europe Using Landsat and Google Earth Engine Satellite Images. 2019. Available online: http://cepl.rssi.ru/wp-content/uploads/2019/05/АКС_ГИС_2019_Глушкoв.pdf (accessed on 20 March 2025).
  122. Prishchepov, A.V.; Radeloff, V.C.; Baumann, M.; Kuemmerle, T.; Müller, D. Effects of institutional changes on land use: Agricultural land abandonment during the transition from state-command to market-driven economies in post-Soviet Eastern Europe. Environ. Res. Lett. 2012, 7, 020421. [Google Scholar] [CrossRef]
  123. Bartalev, S.A.; Plotnikov, D.E.; Loupian, E.A. Mapping of arable land in Russia using multi-year time series of MODIS data and the LAGMA classification technique. Remote Sens. Lett. 2016, 7, 269–278. [Google Scholar] [CrossRef]
  124. Lesiv, M.; Schepaschenko, D.; Moltchanova, E.; Bun, R.; Dürauer, M.; Prishchepov, A.V.; Schierhorn, F.; Estel, S.; Kuemmerle, T.; Alcántara, C.; et al. Spatial distribution of arable and abandoned land across former Soviet Union countries. Sci. Data 2018, 5, 180056. [Google Scholar] [CrossRef]
  125. Potapov, P.V.; Turubanova, S.A.; Tyukavina, A.; Krylov, A.M.; McCarty, J.L.; Radeloff, V.C.; Hansen, M.C. Eastern Europe’s forest cover dynamics from 1985 to 2012 quantified from the full Landsat archive. Remote Sens. Environ. 2015, 159, 28–43. [Google Scholar] [CrossRef]
  126. Phalke, A.; Ozdogan, M.; Thenkabail, P.; Congalton, R.; Yadav, K.; Massey, R.; Teluguntla, P. NASA Making Earth System Data Records for Use in Research Environments (MEaSUREs) Global Food Security-Support Analysis Data (GFSAD) Cropland Extent 2015 Europe, Central Asia, Russia, Middle East 30 m V001. 2017. Available online: https://www.earthdata.nasa.gov/data/catalog/lpcloud-gfsad30eucearumece-001 (accessed on 20 March 2025).
  127. Sulla-Menashe, D.; Friedl, M.A. User Guide to Collection 6 MODIS Land Cover (MCD12Q1 and MCD12C1) Product. 2018. Available online: https://modis.ornl.gov/documentation/guides/MCD12_User_Guide_V6.pdf (accessed on 20 March 2025).
  128. GCI30: Global Cropping Intensity at 30 m Resolution. Available online: https://dataverse.harvard.edu/dataset.xhtml?persistentId=doi:10.7910/DVN/86M4PO (accessed on 20 March 2025).
  129. Clearing and Uprooting of Overgrown Fields. Available online: https://uslugi.yandex.ru/profile/OooPartner-733563?occupationId=%2Fuborka-i-hozajstvo&serviceId=%2Fuborka-i-hozajstvo%2Fsad-i-ogorod%2Fkorcevanie-dereva&specId=%2Fuborka-i-hozajstvo%2Fsad-i-ogorod&text=расчистка+и+раскoрчевка+зарoсших+пoлей (accessed on 20 March 2025).
  130. Clearing Overgrown Agricultural Fields, Introducing into Agricultural Circulation. Available online: https://agroserver.ru/b/raschistka-zarosshikh-selkhoz-poley-vvedenie-v-s-kh-oborot-1636306.htm?ysclid=m7ywlpll85724698438 (accessed on 20 March 2025).
  131. Nakvasina, E.N.; Shumilova, Y.N. Dynamics of carbon stocks in the formation of forests on post-agrogenic lands. Russ. For. J. 2021, 1, 46–59. (In Russian) [Google Scholar] [CrossRef]
  132. Sprenkle-Hyppolite, S.; Griscom, B.; Griffey, V.; Munshi, E.; Chapman, M. Maximizing tree carbon in croplands and grazing lands while sustaining yields. Carbon Balance Manag 2024, 19, 23. [Google Scholar] [CrossRef] [PubMed]
  133. Fedorov, N.; Shirokikh, P.; Zhigunova, S.; Baisheva, E.; Tuktamyshev, I.; Bikbaev, I.; Komissarov, M.; Zaitsev, G.; Giniyatullin, R.; Gabbasova, I.; et al. Dynamics of biomass and carbon stocks during reforestation on abandoned agricultural lands in Southern Ural region. Agriculture 2023, 13, 1427. [Google Scholar] [CrossRef]
Figure 1. Location of the federal subjects for the testing of the methodology of retrospective monitoring of soil–land cover: 1—Ivanovo Oblast; 2—Kaluga Oblast; 3—Tula Oblast; 4—Republic of Tatarstan; 5—Tambov Oblast; 6—Rostov Oblast; 7—Stavropol Krai.
Sustainability 17 06203 g001
Figure 3. Block diagram of research flowchart.
Sustainability 17 06203 g003
Figure 4. Map of arable lands of Palekhsky District of Ivanovo Oblast with indication of permanently cultivated and dynamic territories.
Sustainability 17 06203 g004
Figure 5. Examples of photo recording of a forest stand on abandoned arable land: (a)—slight overgrowth of the field with WSV; (b)—moderate; (c)—severe; (d)—very intensive.
Sustainability 17 06203 g005
Figure 6. Examples of land-type maps: (a)—1985; (b)—2025 (classifier of the legend in Table 2). The blue rectangle indicates the boundaries of the map fragments in Figure 7.
Sustainability 17 06203 g006
Figure 7. Fragments of land-type maps by study period (classifier legend in Table 2).
Sustainability 17 06203 g007
Figure 8. Changes in arable land area (green bars) and timber volumes (red line) by study period.
Sustainability 17 06203 g008
Figure 9. Changes in the area of arable land (green bars) and the number of contours/polygons (yellow line) of the map by study period.
Sustainability 17 06203 g009
Figure 10. Example of modern cadastral division of agricultural field in Rostov Oblast.
Sustainability 17 06203 g010
Figure 11. Dependence of land use intensity (frequency of occurrence of bare soil surface (BSS), %) on soil types for different time periods, with soils indicated by numbers: 1—leached chernozems; 2—podzolized chernozems; 3—dark-gray forest; 4—gray forest; 5—light-gray forest; 6—sod–podzolic without division of qualifiers; 7—sod–weakly podzolic; 8—sod–medium podzolic.
Sustainability 17 06203 g011
Table 1. Example of a database for a unified map of arable lands (classifier of lands in Table 2).
IDLand Classes by Year
198519901995200020052010201520202025
4127111444444
3007141414111111
1351111131399
2120131333911
13991411133101011
1276111111111
5461111119101011
64921111339910
2864113331111
2249111116661
51121411139101011
409113333999
240111333113
23021414141413111
5931133333999
3686111111111
22881413139101010
58631114141414141414
301714141414141113
594113139101010
1974113113141414
Table 2. Classifier of land types.
Class NumberLand Class Name
1Arable land
2Land reclamation
3Fallow land
4Waterlogged depression
5Erosion gully–ravine network
6Waterlogged gully–ravine network
7Wetland
8Saline territory (solonchak)
9WSV (slight overgrowth of the field)
10WSV (moderate overgrowth of the field)
11WSV (severe overgrowth of the field)
12WSV (very intensive overgrowth of the field)
13Cultivated woody vegetation
14Anthropogenically modified territories
Table 3. Areas of land types by study period, ha (classifier in Table 2).
Class Number198519901995200020052010201520202025
125,876.324,815.822,546.519,298.411,842.17678.15923.96736.16662.3
2 4.4 3.05.3
3239.41247.53412.66491.113,322.311,700.36529.24877.84307.1
411.39.212.322.4719.416.315.113.416.9
6 7.114.112.0712.313.19.26.14.9
9 8.747.9162.31641.14838.76388.46002.65397.7
108.7 11.958.79202.91655.55821.96407.97136.8
11 0.90.90.9015.1138.61227.71739.32228.3
12 113.4214.7234.1
13 0.40.60.640.61.11.31.31.3
1456.898.6145.7145.80136.8150.8162.4190.5197.9
Table 4. Volume of wood by study period, m3/ha (classifier in Table 2).
Class Number198519901995200020052010201520202025
901146222110833462,90383,05078,03470,170
104410603296910,24483,602294,008323,597360,409
110100100100166715,318135,659192,192246,230
1200000020,47138,75442,252
Total4412131325517920,245161,823533,187632,577719,060
Table 5. Statistical information on the dynamics of crop areas in the regions where the methodology of retrospective monitoring of soil–land cover was tested and in the Russian Federation as a whole.
Subject of the Russian FederationSowing 1990Sowing 2025% 2025 from 1990Minimum SowingYear of Minimum% of Minimum from 1990Arable Land Area 2025
Ivanovo Oblast609.1199.567194.5202168562.2
Kaluga Oblast918.9346.962299.0201068955.4
Tula Oblast1448.1940.335644.02007561556.2
Republic of Tatarstan3402.42857.7132862.92003163405.6
Tambov Oblast2068.31894.481282.02005382127.5
Rostov Oblast5223.94862.873760.31998285983.1
Stavropol Krai3433.93049.0112736.72005203999.8
In the Russian Federation as a whole117,705.280,184.53274,861.4201034122,688.4
Disclaimer/Publisher’s Note: The statements, opinions and data contained in all publications are solely those of the individual author(s) and contributor(s) and not of MDPI and/or the editor(s). MDPI and/or the editor(s) disclaim responsibility for any injury to people or property resulting from any ideas, methods, instructions or products referred to in the content.

