Article

The Spatiotemporal Evolution and Multi-Scenario Simulation of Carbon Storage in the Middle Reaches of the Yangtze River Based on the InVEST-PLUS Model

1
Hubei Key Laboratory of Biologic Resources Protection and Utilization, Hubei Minzu University, Enshi 445000, China
2
School of Forestry and Horticulture, Hubei Minzu University, Enshi 445000, China
3
The Second Geological Brigade of Hubei Geological Bureau, Enshi 445000, China
*
Author to whom correspondence should be addressed.
Sustainability 2025, 17(13), 6067; https://doi.org/10.3390/su17136067
Submission received: 7 June 2025 / Revised: 23 June 2025 / Accepted: 26 June 2025 / Published: 2 July 2025

Abstract

The middle reaches of the Yangtze River are important bases for high-tech, advanced manufacturing, and modern service industries in China, as well as a demonstration area for the coordination of economic and ecological construction, which plays an important role in the ecosystem carbon cycle. With the steady progress of social and economic development and urbanization, the supply capacity of ecosystem services has sharply decreased, and the carbon cycle mechanism has changed, further reducing the sustainability of regional ecosystem services. In this study, carbon storage in the middle reaches of the Yangtze River was estimated from 2000 to 2020 based on the InVEST model, and the temporal and spatial evolution characteristics of carbon storage in the middle reaches of the Yangtze River were summarized using the coefficient of variation and spatial autocorrelation. The coupled InVEST-PLUS model was used to simulate the carbon storage characteristics of the middle reaches of the Yangtze River under natural development, ecological protection, cultivated land protection, and urban development scenarios in 2035. The results show the following: (1) The main land-use types in the middle reaches of the Yangtze River are cultivated and forest land, and the land-use types in the study area show the characteristics of “two increases and four decreases” in the past 20 years. (2) The carbon storage level in the middle reaches of the Yangtze River has decreased by 83.65 × 10⁶ t in the past 20 years (approximately 1.16%). The coefficient of variation showed that the carbon storage level in the middle reaches of the Yangtze River was high, with the fluctuating area accounting for 8.79% of the total area. The results of local spatial autocorrelation show that the high-value areas of carbon storage are mainly distributed in the west and southeast of the study area, and the low-value areas are mainly distributed in the middle of the study area, exhibiting characteristics of “high values surrounding low values” in space. (3) The simulation results of carbon storage in the middle reaches of the Yangtze River in 2035 showed that the ecological protection scenario was better than the other scenarios in terms of the mean level, functional performance, and patch presentation.

1. Introduction

Carbon stock (CS) refers to the amount of carbon stored in a carbon pool (forests, oceans, land, etc.) [1]. Carbon density is the amount of carbon stored per unit area. Carbon stock change (CSC) refers to the change in carbon stock in a carbon pool due to the difference between carbon gain and loss [2]. Since the middle of the 20th century, the concentration of CO2 in the atmosphere has continued to increase due to human activities, which have become a major cause of global change [3]. The IPCC’s Fifth Assessment Report (AR5) clearly identified the significant impact of human activities on the climate system. This impact is increasing or even intensifying, and significant adverse effects have been observed worldwide [4,5]. A series of social and economic anthropogenic activities has led to the increasingly serious phenomenon of global warming. Greenhouse gas emissions and other drivers of human activity have become the dominant causes of climate warming [6]. The signing of the Kyoto Protocol in 1997 marked the beginning of climate change mitigation as a major issue of widespread concern for the international community [7]. In 2015, the Paris Agreement established a grand blueprint to achieve net-zero greenhouse gas emissions by the second half of the 21st century, making global climate governance an unshirkable responsibility and challenge faced by all countries [8,9].
Carbon stock research originated in the middle of the last century and has focused on carbon stock estimation [8,9], the factors influencing carbon stock [10], carbon value [11,12], and other aspects. Western scholars have been studying carbon stocks, but the research conditions in the early experimental stage were poor, and many calculation methods were relatively backward, making it difficult to ensure the accuracy of carbon storage calculations. Later, with the deepening of research, mathematical tools gradually replaced traditional calculation methods. Subsequently, 3S technology has greatly promoted progress in carbon stock estimation research, and the mathematical model used for carbon stock estimation has gradually become the core and mainstream research tool in this field [13]. Stanford University, The Nature Conservancy, and the World Wide Fund for Nature (WWF) jointly created the InVEST model (Integrated Ecosystem Services and Trade-offs Tool) [14], which is a comprehensive assessment model of ecosystem services and trade-offs based on land-use/cover change that can accurately assess ecosystem service functions and economic values and simulate dynamic changes in the process [15]. Among them, the carbon sequestration module, which is specifically used for carbon stock estimation, relies on remote sensing data as its main data source, which shows convenience and efficiency in the process of the quantitative measurement of carbon stock and can intuitively display spatial numerical characteristics; therefore, it is widely used in the assessment of carbon storage in various regions. To date, most prediction and simulation studies of carbon stocks have relied on land-use change, highlighting the inseparable relationship between carbon storage and land use. The simulation of land-use change also relies on the progress of science and technology and the update of algorithms. The PLUS model is a patch-generated land-use change simulation model based on the integration of the random forest algorithm and cellular automata (CA) by Liang Xun et al. [16]. The model optimizes the traditional conversion rule-mining strategy and effectively solves the problems of complex conversion rules and difficult parameter determination. Compared with other land-use prediction models, the PLUS model can not only identify the driving factors of land expansion, project landscape dynamics, and explore the causes of land-type changes but can also achieve the high-precision simulation of multi-type land-use patch-level changes spatially by introducing multiple types of random seed growth mechanisms.
As research into carbon stock changes has progressed, scholars both domestically and internationally have generally agreed that the primary drivers of carbon stock changes stem from natural and socioeconomic environments. Zhang et al. [17] utilized the Terrestrial Ecosystem Model (TEM) to analyze the spatiotemporal characteristics of carbon stock changes in Inner Mongolia grasslands and their driving forces, incorporating eight influencing factors such as temperature, precipitation, and vegetation cover. Xiang et al. [18] utilized the carbon stock module of the InVEST model to study the spatiotemporal evolution of carbon stocks on the western Sichuan Plateau and employed a geographic detector to assess the spatial variation in carbon stocks influenced by factors such as elevation, slope, net primary production (NPP), and soil type. For example, Li Yi et al. [19] used a logistic regression model to analyze the drivers of land-use change in farmland, forest land, and construction land in the Changzhutan core area from seven dimensions, including natural environment and policy orientation. In this study, the middle reaches of the Yangtze River region is an economically developed area, so the driving factors of carbon stock changes are related to human socioeconomic activities. Therefore, three factors—population density, nighttime light, and the GDP—were selected [20]. Additionally, the middle Yangtze River region is an important ecological barrier and climate regulation zone, constrained by various climatic, topographic, and soil conditions. Thus, changes in carbon storage are also closely related to natural environmental factors, leading to the selection of natural environmental factors such as the annual average precipitation, annual average temperature, slope, elevation, soil type, and normalized vegetation index [21]. In the carbon storage simulation process, the driving factors of land-use change are also related to distance factors such as distance from roads and water systems. Therefore, distance factors are incorporated into the simulation process [22].
The middle reaches of the Yangtze River play a vital role in China’s overall economic and social development, food security system, agricultural and rural modernization processes, and ecological environment construction and are of irreplaceable strategic significance [23]. With the successive implementation and superposition of important national policies, such as the central rise strategy and the Yangtze River Economic Belt, the middle reaches of the Yangtze River have ushered in rapid waves of urbanization and industrialization. In this process, the rapid expansion of construction land and significant reduction in arable and ecological land have directly led to a significant decline in the supply capacity of ecosystem services, while consumer demand has surged [24,25]. Based on this problem, this study summarizes the spatiotemporal evolution law and multi-scenario simulation of carbon storage in the middle reaches of the Yangtze River from 2000 to 2020 based on the coupled InVEST-PLUS model and strives to find a development model and governance measures that coordinate economic and ecological construction in the middle reaches of the Yangtze River. The optimization of territorial spatial management planning and the maintenance and sustainable development of ecosystems provide a useful reference. The inVEST model calculates carbon storage based mainly on land cover data, whereas the PLUS model simulates future land-use data at the patch level based on the original land-use data.

1.1. Study Area Overview

The middle reaches of the Yangtze River are situated at the intersection of the horizontal axis along the Yangtze River corridor and the vertical axis of the Beijing–Harbin–Beijing–Guangzhou corridor within China’s “Two Horizontal and Three Vertical” urbanization strategic framework. Spanning the provinces of Hubei, Hunan, and Jiangxi, the region lies between 24°29′ and 33°20′ north latitude and 108°21′ and 118°28′ east longitude, encompassing 325 county-level administrative units [26]. With the steady advancement of modernization and the deepening implementation of the Central China Rise and Yangtze River Economic Belt strategies, the socioeconomic landscape and spatial patterns of the urban and rural areas in this region have been rapidly restructured. The accelerated bidirectional flow of urban–rural factors has triggered a series of land-use issues, particularly the large-scale expansion of construction land and a significant reduction in arable and ecological land [27,28]. These changes have severely threatened regional carbon cycle mechanisms, as well as the carrying capacity and sustainability of ecosystem services. Geographical location of the middle reaches of the Yangtze River was shown in Figure 1.

1.2. Data Sources and Data Processing

Vector data for the administrative divisions were obtained from the National Geographic Information Public Service Platform. Land-use data with a 30 m resolution were extracted from the China Land Cover Dataset (CLCD) [29]. Using the ArcGIS 10.6 reclassification tool, land-use types in the middle reaches of the Yangtze River were categorized into six classes: cultivated land, forest land, grassland, water bodies, construction land, and unused land. Meteorological data, including precipitation and temperature at a 1 km resolution, were sourced from the National Tibetan Plateau/Third Pole Environment Data Center. Digital Elevation Model (DEM) data with a 30 m resolution were acquired from the Geospatial Data Cloud platform, from which slope and aspect data were subsequently derived. Normalized Difference Vegetation Index (NDVI) data were obtained from the National Ecological Security Data Center. Additional datasets at a 1 km resolution, including soil type, gross domestic product (GDP), population density, and nighttime light data, were collected from the Resource and Environment Data Center of the Chinese Academy of Sciences. River and road network data were derived from the National Geographic Information Resource Directory Service System and subsequently converted to a grid format using the Euclidean distance method (Table 1).

1.3. Research Methods

1.3.1. Land-Use Transfer Matrix

The land-use transfer matrix was used to quantify the conversion relationships between different land-use types over a given time period [30]. It visually illustrates the “sources” and “destinations” of land-use changes, serving as a crucial method for studying land-use dynamics. Based on the land-use transfer analysis, a land transfer model was established with the following formula:
P i j = S i j i = 1 n j = 1 n S i j
In the formula, Pij represents the probability of land type i transitioning to land type j, and Sij represents the area (in km2) of land type i converted to land type j.

1.3.2. InVEST Model

The Integrated Valuation of Ecosystem Services and Trade-offs (InVEST) model, jointly developed by Stanford University, Nature Conservancy (TNC), and the World Wide Fund for Nature (WWF), is a widely used tool for large-scale studies. The carbon density data used in this study were compiled from empirical measurements reported in provincial-scale studies across the middle Yangtze River region. For Hubei Province, we adopted the carbon density parameters for cropland, forest land, and grassland from Chuai et al. [31,32], whereas the soil carbon data were sourced from Yu et al. [33], and the construction/unused land parameters were from Xi et al. [34]. In Hunan Province, the forest, grassland, and cropland values were derived from Piao et al. [35], with the soil carbon density referenced from Chen [36] and Li et al. [37] and the construction/unused land data obtained from Ke et al. [38]. The Jiangxi Province parameters were primarily based on the measurements of major vegetation types by Yang et al. [39]. Any remaining unavailable parameters were supplemented with China’s 2010 Terrestrial Ecosystem Carbon Density Dataset to ensure comprehensive coverage [40]. The values in Table 2 were obtained by averaging all data.
The carbon density data from the three provinces were consolidated and averaged to derive a nominal carbon density table for the study area. Subsequently, these values were adjusted using a prescribed correct-scale ecosystem carbon stock estimation [41,42]. This study employed the carbon stock module of the InVEST model, which categorizes ecosystem carbon storage into four pools: aboveground biomass, belowground biomass, soil organic matter, and dead organic matter. The total carbon stock was calculated by multiplying the area of each land-use type by its corresponding carbon density (derived from pre-collected data) for all four pools, followed by the summation of the results. The calculation formula is as follows:
C totali = ( C abovei + C belowi + C soili + C deadi ) × A i
In the formula, Ctotal denotes the total carbon stock (t/hm2), Cabove denotes the carbon stock in the aboveground part of the vegetation (t/hm2), Cbelow denotes the carbon stock in the belowground part of the vegetation (t/hm2), Csoil denotes the carbon stock in the soil (t/hm2), Cdead denotes the organic carbon stock of apoptotic death (t/hm2), i denotes the average carbon density of each land type, and Ai denotes the total area of the land class.
This methodology yielded the results presented in Table 2 on carbon density by land-use type. These findings demonstrate the spatial distribution of carbon density across the middle reaches of the Yangtze River, revealing that forest land, grassland, and cropland exhibit significantly higher carbon densities than water bodies, construction land, and unused land.

1.3.3. Coefficient of Variation

The coefficient of variation reflects the degree of variation in the relevant parameters, that is, the degree of dispersion. The smaller the CV value, the more stable the change in the relevant parameters; the larger the value, the higher the volatility of the parameter changes [43]. The formula used is as follows:
C V = x S D x ¯ = n i = 1 x i x ¯ 2 n 1 x ¯
where CV denotes the coefficient of variation of the parameter, x S D denotes the standard deviation of the parameter, x - denotes the mean value of the parameter, n denotes the length of the raster data time-series, and x i denotes the ith parameter.

1.3.4. Spatial Autocorrelation Analysis

The spatial autocorrelation model is used in geospatial statistical analyses to describe the similarity or dissimilarity of spatial phenomena and eigenvalues within a spatial distribution. Spatial autocorrelation analysis includes global spatial autocorrelation (Global Moran’s I) and local spatial autocorrelation (Local Moran’s I) [44].
(1)
Global Moran’s I:
M I = Σ i = 1 n Σ j = 1 n w i j ( x i x ¯ ) ( x j x ¯ ) S 2 Σ i = 1 n Σ j = 1 n w i j
where MI takes the value of [−1,1]; x i and x j denote the carbon stocks in grids i and j, respectively; n is the number of samples; x - indicates the average value of the carbon stocks; and Wij denotes the spatial weights of grids i and j. Positive and negative MI values indicate positive and negative correlations, respectively; the larger the absolute value, the greater the correlation, and 0 indicates no correlation.
(2)
Local Moran’s I:
The study area was divided into 352 counties according to county-level administrative divisions using ArcGIS 10.6, and local indicators of spatial association (LISAs) were used to characterize the distribution of carbon stocks in each county.
M I i = ( X i x ¯ ) S 2 i w i j ( x j x ¯ )
MIi takes values in the range of [−1,1], Xi and Xj denote the carbon stocks in grids i and j, n is the number of samples, x - denotes the average value of the carbon stocks, and Wij denotes the spatial weights of i and j. If the value is greater than 0, it indicates spatial clustering around the region with similar values; if the value is less than 0, it indicates spatial clustering of non-similarity; and if the value is equal to 0, it indicates that the region has no spatial correlation with neighboring regions.

1.3.5. Geoprobe with Optimal Parameters

A geoprobe is a statistical method used to detect spatial variability and quantitatively reveal its driving factors. An Optimal Parameter Geodetector (OPGD) was developed using traditional geodetectors. Compared with traditional geodetectors, the OPGD shows significant advantages in parameter optimization, analytical accuracy and stability, interaction detection capability, software implementation, and ease of use, as well as the effect of practical application [45]. The expression is as follows:
q = 1 h = 1 L N h σ h 2 N σ 2
where q takes the range of values [0,1]. Larger values indicate that the factor has more explanatory power for the dependent variable; h = 1, 2…, L is the stratification of variables, while Nh, N, σ 2 , and σ h 2 are the number of cells in layer h, the total number of cells, the total variance, and the variance of layer h, respectively.

1.3.6. PLUS Model

The PLUS model, developed by the High-Performance Spatial Computational Intelligence Laboratory of China University of Geosciences (Wuhan), simulates land-use changes at the patch level based on raster data, is a rule-mining framework based on the Land Expansion Analysis Strategy (LEAS), and is a model based on multiple types of stochastic seeds (CARS), which can present the contribution of each driving factor to land-use changes and can be used to simulate land-use changes under different scenarios by the Markov chain or linear regression methods [46].
(1)
Land demand and scenario setting
This study employed a Markov chain model to analyze land-use transition probabilities based on multiyear historical data, with future land demand projections derived from the product of the initial land-use areas and their corresponding transition probabilities. Building upon the existing literature and regional policy frameworks in the middle Yangtze River region, we developed four distinct development scenarios by systematically adjusting land development probabilities: (1) the natural development scenario (NDS) maintains baseline transition probabilities to reflect historical trends; (2) the ecological protection scenario (EPS), aligned with the spatial planning policies of Hubei, Hunan, and Jiangxi Provinces, reduces transition probabilities from ecological lands (e.g., forests, grasslands) to non-ecological uses (e.g., construction land, cropland) by 30% while increasing reverse transitions by 30%, with water bodies remaining unchanged; (3) the cultivated land protection scenario (CLPS) implements a 20% increase in conversion probabilities to cropland from other land types (excluding water) and a corresponding 20% decrease in outbound conversions from cropland; and (4) the urban development scenario (UDS) facilitates urbanization through a 20% reduction in conversions from construction land to non-water categories and a 20% increase in conversions to construction land. These scenario designs comprehensively address regional priorities regarding ecological conservation, agricultural protection, and urban expansion.
(2)
Domain Weight
The domain weights, ranging from 0 to 1, were determined based on the existing literature and regional characteristics of the middle Yangtze River Basin, and the domain weight parameter setting was mainly based on the proportion of the expansion area and the total expansion area of each category, with higher values indicating stronger domain dominance and greater expansion potential for the corresponding land categories. As shown in Table 3, distinct domain patterns emerge across scenarios: (1) under the natural development scenario, cropland, forest land, and construction land exhibit superior domain strength compared to other categories, reflecting their inherent expansion advantages; (2) the ecological protection scenario strategically enhances the forest land and grassland domains while suppressing cropland and construction land to prioritize ecological conservation; and (3) both the cultivated land protection and urban development scenarios demonstrate selective domain adjustments, with the former elevating cropland domains and the latter emphasizing construction land expansion, with corresponding reductions applied to other land categories to maintain scenario-specific development priorities. These calibrated domain weights systematically capture the trade-offs between ecological preservation, agricultural security, and urban growth in regional land-use planning.
(3)
Transition matrix
A transition transfer matrix was used in the PLUS model to describe the transition relationship between different land types, reflecting the possibility of transferring one land type to another. The transition transfer matrix parameter takes the value of 0 or 1, with 0 indicating that the land type cannot be converted to other land types and 1 indicating that it can be converted to other land types. The parameters were set based on the literature and land-use types in the middle reaches of the Yangtze River. Table 4 provides an overview of the set of transition transfer matrix parameters for various scenarios.
(4)
Accuracy verification
The Kappa coefficient is a statistical index used to measure the consistency or reliability of categorical data, which is used to test the consistency between the simulated and actual results of land use in this experiment, and the specific formula is as follows:
Kappa = P o P e 1 P e
where Po represents the actual consistency rate, PE indicates the expected coherence rate, and 1 indicates the ideal rate of concordance. The Kappa ∈ [0,1] quantifies this agreement. The higher the value, the higher the simulation accuracy. A Kappa value greater than 0.75 indicates that the simulation results are robust. Land-use data for 2000 and 2010 were used to simulate the land-use data for 2020, and the accuracy of the land-use data for 2020 was verified using the actual land-use data for 2020. A Kappa coefficient of 0.853 was used in this calculation, which means that land forecasting for future years can be performed.

1.3.7. Mechanisms for Coupling InVEST and PLUS Models

The InVEST model is an important tool for carbon stock estimation, which is based on the product of the land use in each year and the carbon density per unit area in the study area in a certain time period, while the land-use data in the PLUS model is also an important parameter of the model operation, and the Land Expansion Analysis Strategy (LEAS) module of the PLUS model is based on the land-use data and uses the random forest algorithm to mine the influence weights of different driving factors on the expansion of each type of land use and then generates the development probability of each type of land use. In the CA model based on the multi-class random patch seed (CARS) module, land-use data are used to set parameters such as the initial state and transfer matrix to simulate the spatial distribution of future land use. The two form a natural coupling mainly through the uniformity of the land-use parameter. Technology roadmap was shown in Figure 2.

2. Results

2.1. Land-Use Transfer in the Middle Reaches of the Yangtze River

Between 2000 and 2010, the middle reaches of the Yangtze River underwent substantial transformations in land-use structure. The most notable change occurred in cultivated land, which experienced a net outflow of 17,453.97 km2 (8.66% of its pre-transfer area), primarily converting to forest land (12,065.22 km2), construction land (2999.52 km2), and water bodies (2226.15 km2). Forest land followed with 15,373.89 km2 transferred out (4.60% of its original area), mainly transitioning to cultivated land (14,938.83 km2) and construction land (364.68 km2). Grassland showed the highest relative change, with 713.07 km2 (59.35% of its initial area) converted predominantly to cultivated land (357.66 km2) and forest land (305.55 km2). Water bodies decreased by 2921.49 km2, largely becoming cultivated land (2450.34 km2) and construction land (346.23 km2), while construction land itself saw minimal outflow (292.50 km2), mainly reverting to water bodies (280.26 km2). The changes in unutilized land were negligible because of the small baseline area.
On the inflow side, cultivated land also received the largest area (17,760.51 km2, 8.79% of its original extent), primarily sourced from forest land (14,938.83 km2), water bodies (2450.34 km2), and grassland (357.66 km2). Forest land gained 12,470.67 km2, mainly from cultivated land and grassland, while grassland and construction land incorporated 247.18 km2 and 3748.68 km2, respectively, with the latter drawing significantly from cultivated land, forest land, and water bodies.
The total land-use conversion during this decade reached 36,789.21 km2, reflecting growing land demand and intensive utilization patterns that correlate strongly with regional socioeconomic development and accelerating urbanization processes. These dynamic transformations highlight the complex interplay among agricultural needs, ecological considerations, and urban expansion in this strategically important region.
Between 2010 and 2020, land-use transformation in the middle Yangtze River region intensified significantly (Table 5). Cultivated land remained the most dynamic category, with 20,926.89 km2 (10.36% of its 2010 extent) converted, predominantly to forest land (14,742.99 km2), construction land (4583.70 km2), and water bodies (1520.19 km2). Forest land conversions reached 18,850.95 km2, mainly transitioning into cultivated land and urban areas. Grassland (569.52 km2), water bodies (2672.23 km2), and construction land (325.62 km2) showed more modest changes, whereas unutilized land conversions were minimal (23.31 km2) because of the limited baseline area.
The 2010–2020 period saw cultivated land receive the largest inflows (21,009.42 km2), primarily from forest land (14,742.99 km2), water bodies (4583.70 km2), and grassland (1682.73 km2). The substantial forest land gains, particularly from cultivated land, reflect the ongoing implementation of China’s “Grain for Green” ecological restoration policy. Water body expansions (2547.18 km2) were mainly derived from cultivated land and construction land conversions.
Over the entire 2000–2020 period (Table 6), the region experienced profound land-use changes shaped by natural, socioeconomic, and geographic factors. Cultivated land showed net losses of 27,717.66 km2 (13.75% of 2000 levels), whereas forest land decreased by 25,680.15 km2 (7.69%). Grassland experienced the most dramatic relative decline (88.67% reduction, 1065.42 km2). Urban expansion primarily consumed cultivated land (80.01% of new construction land) and forests (9.73%), demonstrating how rapid urbanization has fundamentally altered the region’s land cover patterns. These transformations underscore the competing demands for agricultural production, ecological conservation, and urban development in this strategically important watershed.
In conclusion, our analysis revealed that the middle Yangtze River region underwent substantial land-use transformations during 2000–2020, characterized by rapid urbanization that primarily converted cultivated land (accounting for over 80% of urban expansion), followed by forest and water areas. While such conversions are inevitable for socioeconomic development, our findings highlight the urgent need for balanced land management strategies that (1) implement strict farmland protection policies to maintain food security, (2) establish ecological redlines for forest and water conservation, and (3) promote compact urban growth through vertical and brownfield redevelopment. We recommend adopting a multi-stakeholder governance framework that incorporates ecological compensation mechanisms, strengthens land-use monitoring systems using remote sensing technologies, and develops differentiated zoning regulations to ensure sustainable land resource utilization while meeting development needs in this ecologically sensitive watershed region. Land-use transfer matrix 2000~2020 (unit: km2) was shown in Table 7.

2.2. Assessment Results of Carbon Storage in the Middle Reaches of the Yangtze River

Based on the carbon density data of different land-use types and land cover data from 2000 to 2020, we calculated the annual carbon storage in the middle reaches of the Yangtze River using the carbon storage module of the InVEST model. The assessment results for 2000, 2005, 2010, 2015, and 2020 (Figure 3) demonstrated that the study area maintained relatively high carbon storage overall, with the high-value zones significantly outnumbering the low-value zones. Spatially, high-carbon-storage areas are widely distributed across elevated terrains characterized by dense vegetation cover and are typically located in remote regions with minimal human disturbance, thereby preserving their carbon sequestration capacity. In contrast, low carbon storage zones are concentrated in the north-central, central, and eastern parts of the study area, particularly in urban centers, including Wuhan, Ezhou, Jingzhou, Xiantao, Qianjiang, and Nanchang, with a scattered distribution across other municipal administrative units. These low-value areas predominantly occur in flat plains or low-lying basins that are vulnerable to anthropogenic activities because of their topography and coincide with intensive urban, industrial, and agricultural land use, where high population density and frequent anthropogenic pressure have resulted in more fragile ecosystems. Statistical analysis using ArcGIS 10.6 and Excel revealed mean carbon storage values of 12,792.37 t/km2 (2000), 12,797.92 t/km2 (2005), 12,731.81 t/km2 (2010), 12,681.26 t/km2 (2015), and 12,644.25 t/km2 (2020), indicating generally stable high-level carbon storage, despite minor annual fluctuations. These findings align with the region’s dual role as China’s crucial ecological security barrier and as a demonstration zone for harmonizing ecological conservation with economic development, suggesting the effective implementation of relevant governance and protection policies. In conclusion, the study area exhibits (1) consistently high and spatially clustered carbon storage with dispersed low-value zones and (2) a gradual declining trend that could be mitigated through targeted ecological protection measures to maintain carbon sequestration capacity.

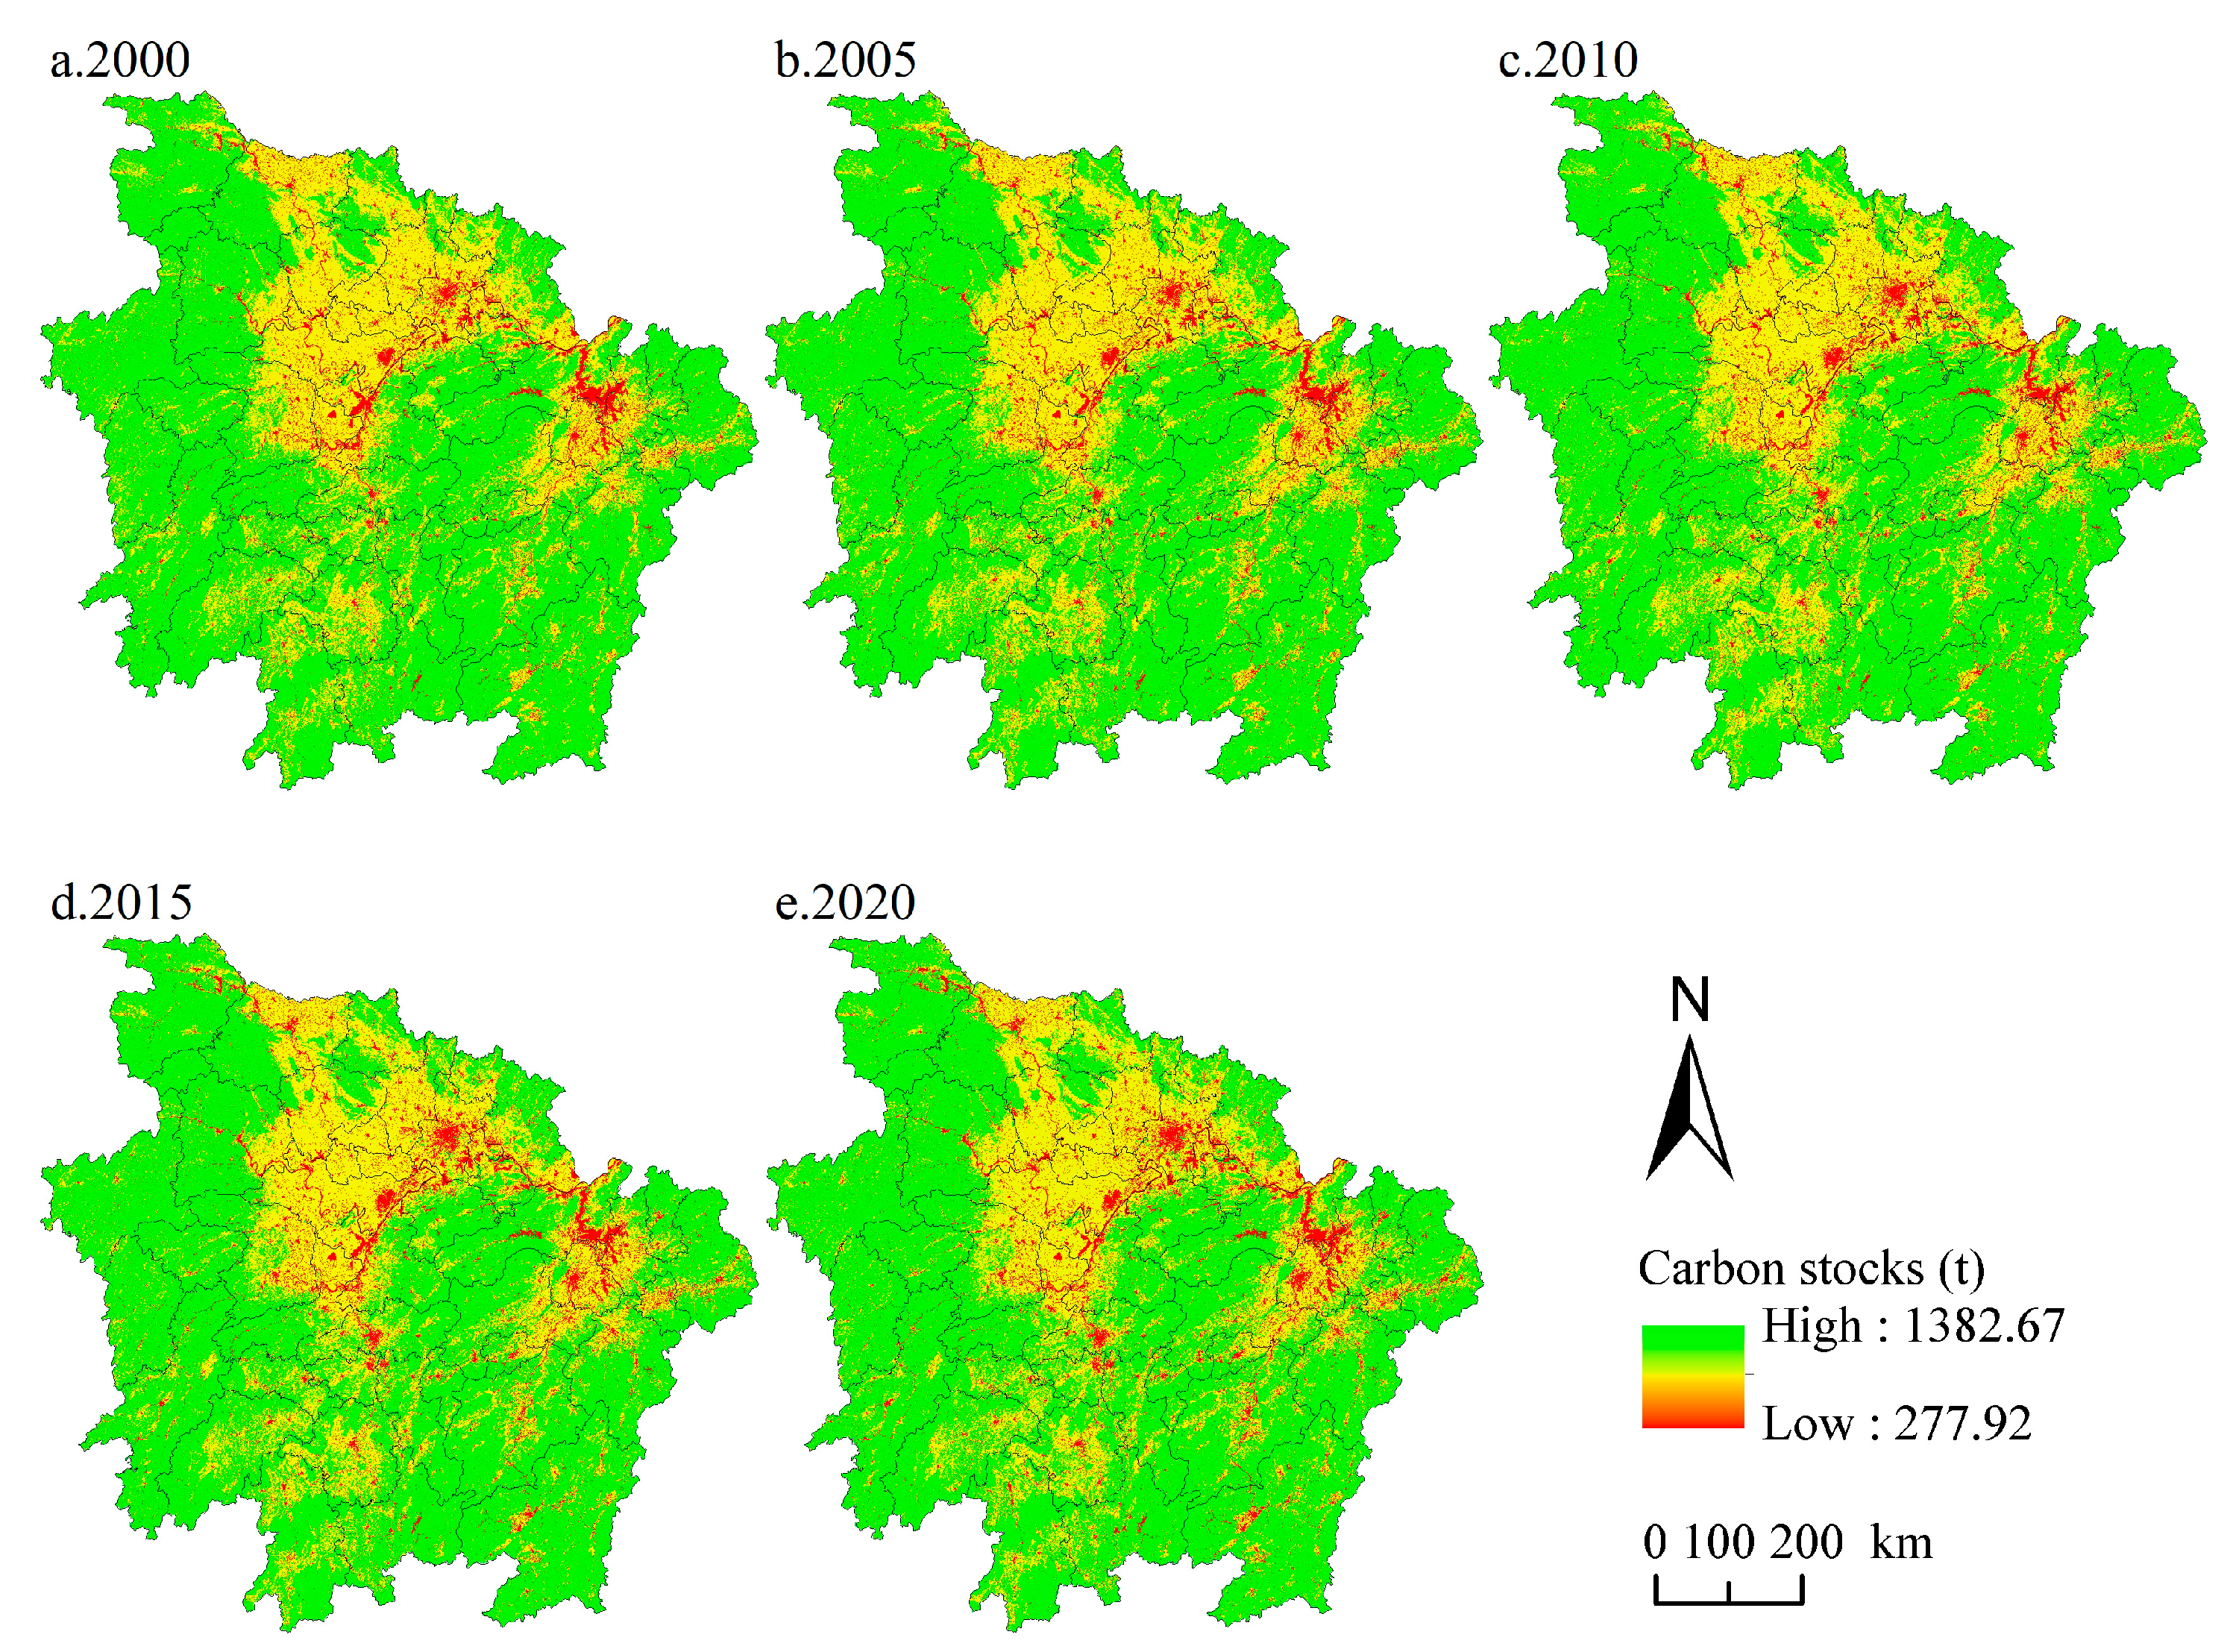
2.3. Spatial and Temporal Evolution of Carbon Stocks in the Middle Reaches of the Yangtze River from 2000 to 2020

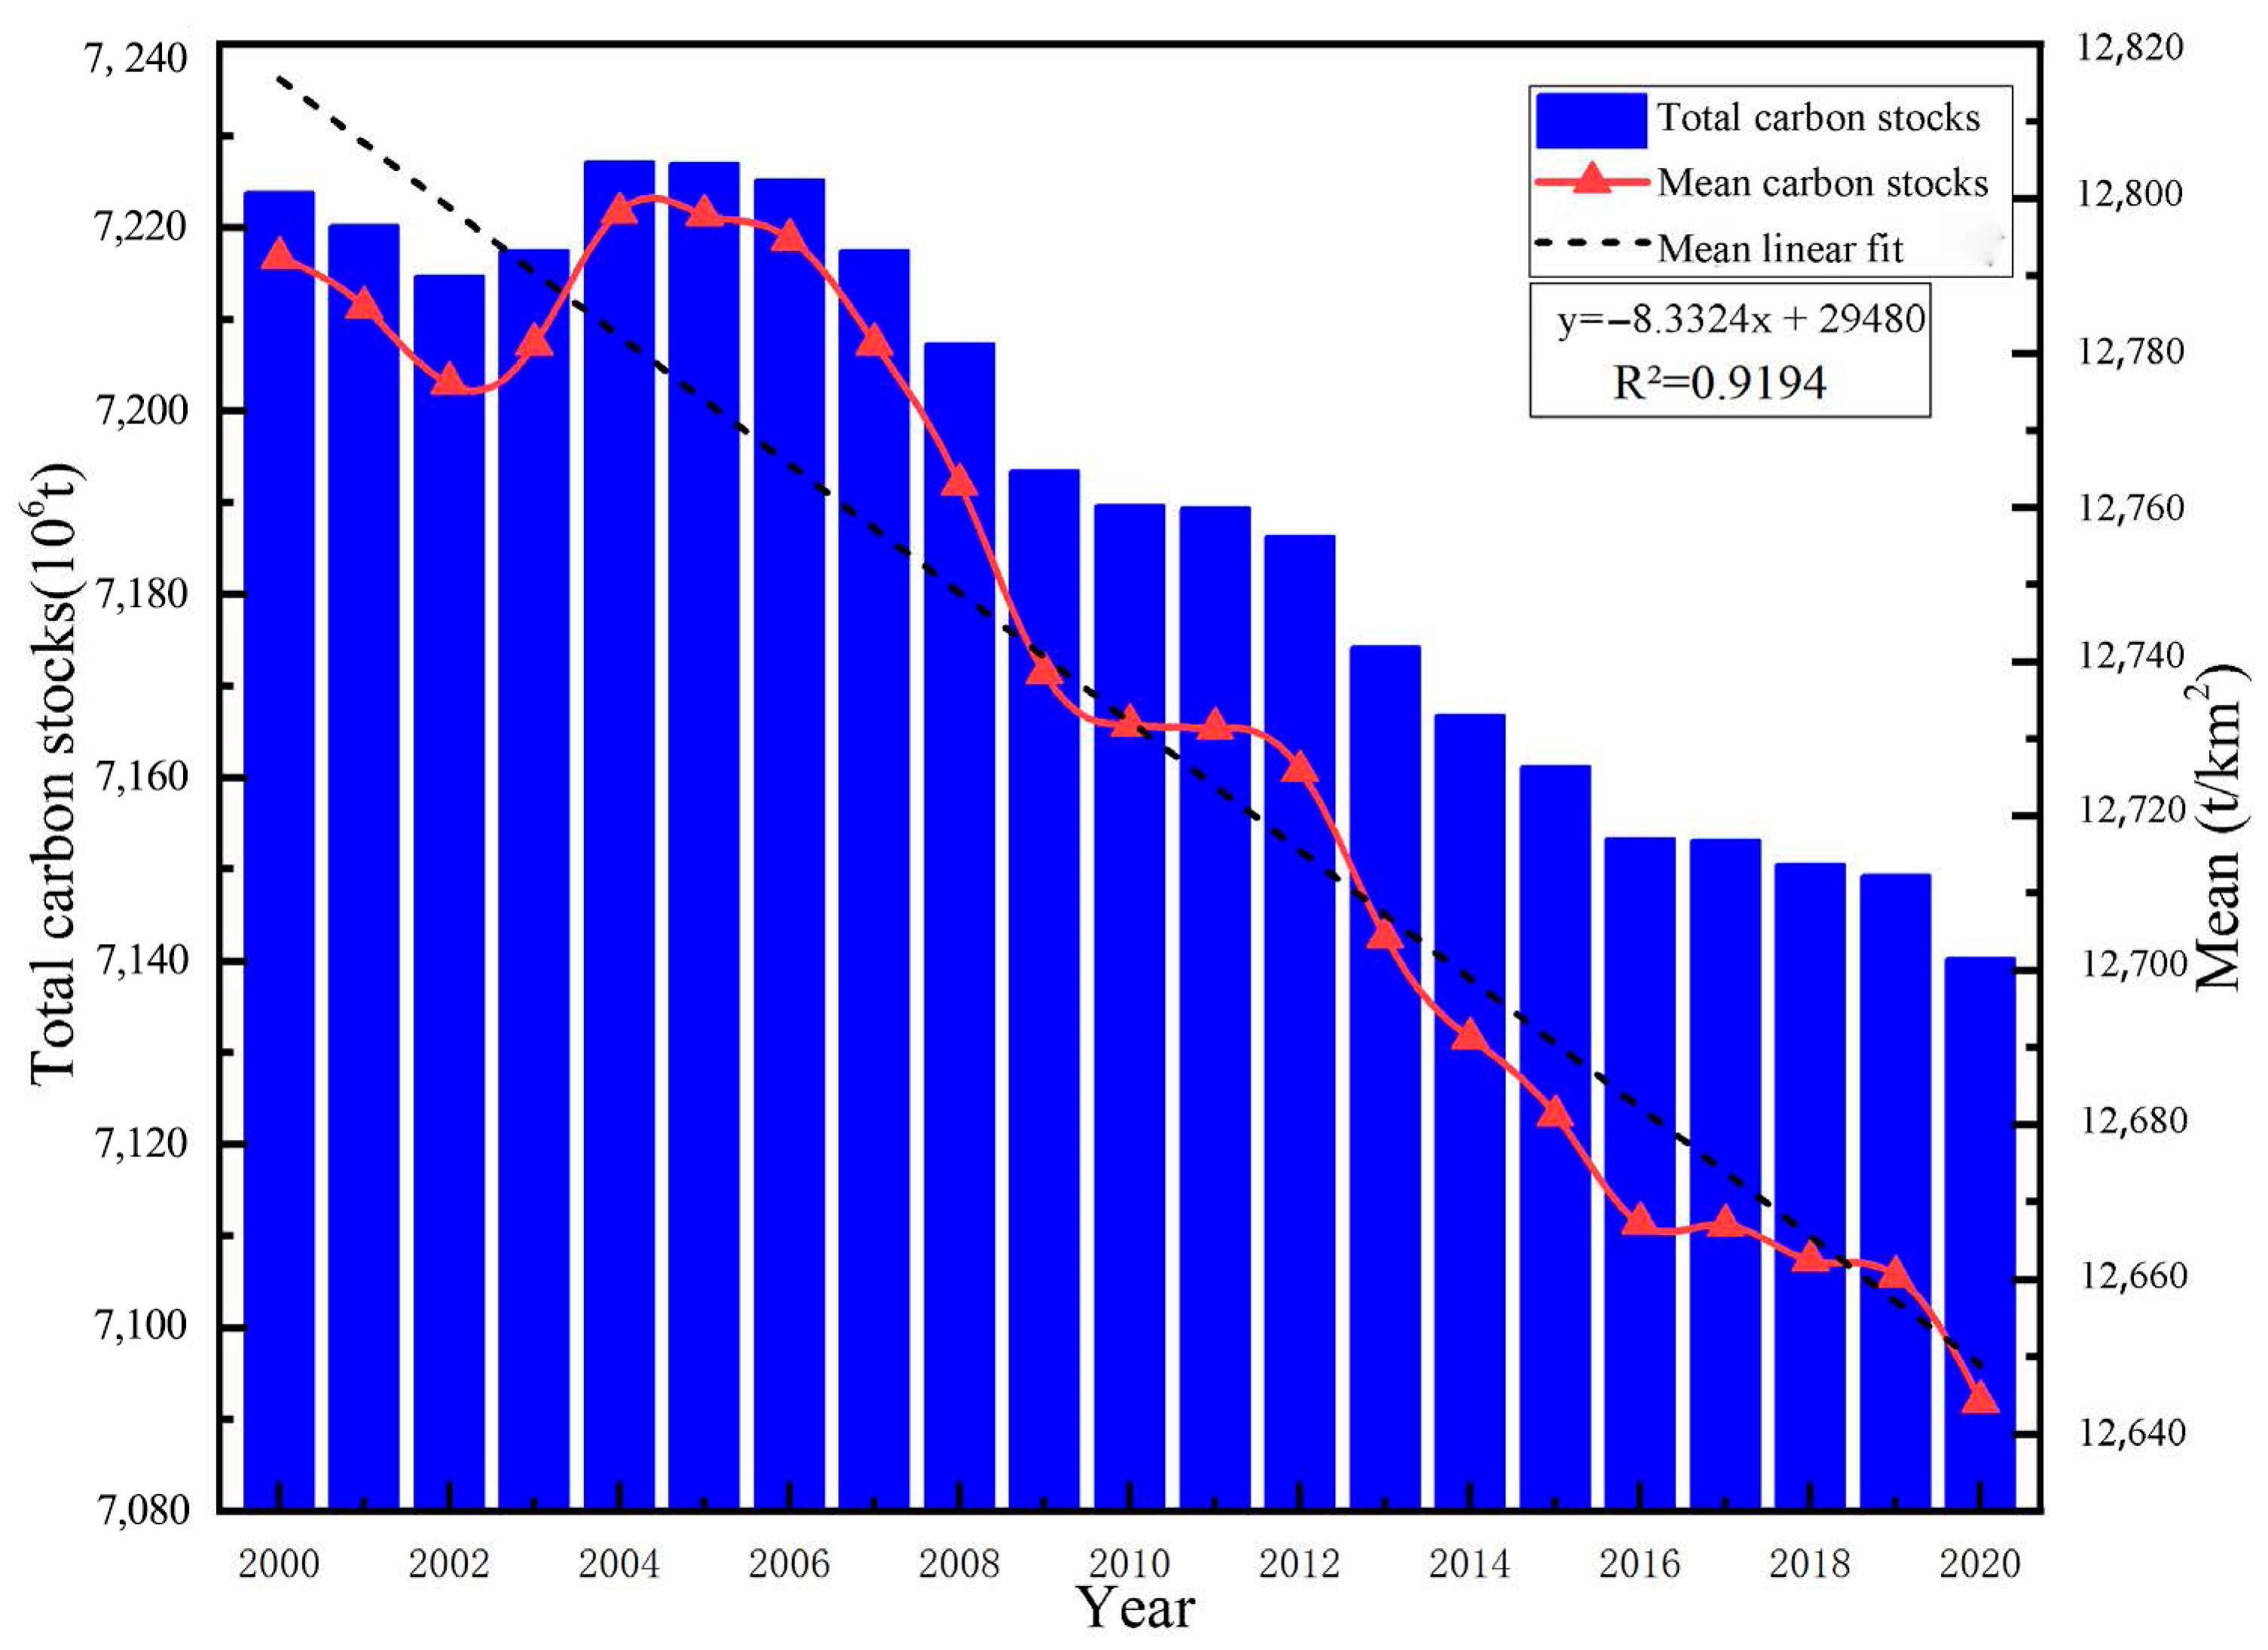
2.3.1. Characteristics of Temporal Changes in Carbon Stocks in the Middle Reaches of the Yangtze River

The carbon stock dynamics in the middle reaches of the Yangtze River from 2000 to 2020 (Figure 4) demonstrated significant inter-annual variations. Our analysis revealed that the total carbon stock exhibited a nonlinear trajectory, beginning at 7223.94 × 106 t in 2000, peaking at 7225.15 × 106 t in 2004, and subsequently declining to a minimum of 7140.29 × 106 t by 2020. This represents a net decrease of 83.65 × 10⁶ t (1.16%) over two decades.
To account for spatial heterogeneity and enable comparative analysis, we normalized the carbon stock measurements using ArcGIS 10.6′s zonal statistics tool and calculated area-weighted mean values. The normalized data (t/km2) showed an initial increase from 12,792.37 t/km2 in 2000 to 12,798.25 t/km2 in 2004, followed by a consistent decline to 12,644.34 t/km2 in 2020, a total reduction of 148.03 t/km2.
Linear regression analysis of the annual mean values yielded a coefficient of determination (R2) of 0.91, indicating an excellent fit between the model and the observed data. This robust statistical relationship confirmed a clear and significant decrease in the carbon storage capacity of the region. The high R2 value (where 1 represents a perfect correlation) strongly supports the reliability of this observed trend, suggesting systematic changes in the carbon sequestration potential of the middle Yangtze River Basin during the study period.
Using the ArcGIS 10.6 partitioning statistics tool, combined with Excel statistics of carbon stocks stored in each land category in the middle reaches of the Yangtze River, our results showed (Table 8) that, as a whole, cropland and woodland are the main land categories for carbon sequestration in the middle reaches of the Yangtze River. The carbon stocks stored in cropland in the middle reaches of the Yangtze River in 2000, for example, were 1969.40 × 106 t, which accounted for 27.26% of the total carbon stocks, and those in woodland were 5131.24 × 106 t, which accounted for 71.03% of the total carbon stocks. In 2000, the carbon stock stored in croplands in the middle reaches of the Yangtze River was 1969.40 × 106 t, accounting for 27.26% of the total carbon stock, and the carbon stock stored in forest land was 5131.24 × 106 t, accounting for 71.03% of the total carbon stock, which together accounted for 98.29% of the total carbon stock in the study area. The carbon stock stored in other land categories accounted for a smaller proportion, at only 1.71% of the total carbon stock in the study area. In terms of changes, the carbon stock in cropland showed a fluctuating trend of “decrease and increase” from 2000 to 2020, but compared with 2000, the overall increase was 3.8 × 10⁶ t, accounting for approximately 0.36% of the carbon stock in cropland in 2000. The carbon stock in forest land showed a decreasing annual trend during this period, with an overall decrease of 107.71 × 10⁶ t, accounting for approximately 0.36% of the total carbon stock in cropland. The carbon stock in forest land showed an annual decreasing trend during this period, with an overall decrease of 107.71 × 10⁶ t, accounting for approximately 2.09% of the carbon stock in forest land in 2000; the carbon stock in grassland showed an annual decreasing trend, with an overall decrease of 9.54 × 10⁶ t, or an overall decrease of 75.96%; the carbon stock in waters showed a fluctuating trend of “decreasing, then increasing, then decreasing again.” However, compared with the 2000 carbon stock, it showed a decrease of 3.25 × 10⁶ t. However, compared with 2000, the carbon stock in water decreased by 3.25 × 10⁶ t, accounting for 4.42% of the carbon stock in water in 2000. The carbon stock in construction land showed an annual increasing trend, with an overall increase of 33.16 × 10⁶ t, accounting for 89.50% of the carbon stock in construction land in 2000. The carbon stock in unutilized land showed an annual decreasing trend, with an overall decrease of 0.11 × 10⁶ t, accounting for 64.71% of the carbon stock in unutilized land in 2000. In summary, cropland and forest land are the main land types for carbon sequestration in the middle reaches of the Yangtze River, while grassland, watersheds, construction land, and unutilized land have lower carbon sequestration, accounting for only 1.71% of the total carbon stock. The amount of carbon stock accumulated in cropland and construction land among the carbon sequestration land types in the middle reaches of the Yangtze River from 2000 to 2020 has increased. Although cropland carbon sequestration has increased, the overall trend shows upward and downward fluctuations, and the increase in carbon sequestration in construction land is the largest. The amount of carbon sequestered in construction land increased the most, with a total increase of 89.50%, while the amount of carbon sequestered in forest land, grassland, water, and unused land decreased. The amount of carbon sequestered in water decreased but also showed an up-and-down fluctuating trend. The amount of carbon sequestered in grassland decreased the most, with a total decrease of 75.96%, followed by unused land, with a total decrease of 64.71%. Therefore, the carbon sequestration capacity of each land-use type in the middle reaches of the Yangtze River in the past 20 years showed a trend of “one increase, three decreases, and two fluctuations”.
Using the zonal statistics tool in ArcGIS 10.6, we assigned the estimated carbon storage values from 2000 to 2020 in the middle reaches of the Yangtze River to various municipal administrative divisions and calculated the average carbon storage. From a municipal perspective (Table 9), significant variations in carbon storage levels were observed among the administrative divisions. Taking 2020 as an example, among the forty-two municipal divisions in the study area, seven cities exhibited carbon storage below 10,000 t/km2: Ezhou, Wuhan, Jingzhou, Nanchang, Xiantao, Qianjiang, and Tianmen. These urban areas, characterized by high urbanization levels, play crucial roles in the regional economic framework as key cities along the Yangtze River Economic Belt; however, they demonstrate relatively lower vegetation coverage compared to other cities. Conversely, thirty-five cities exceeded 10,000 t/km2 in carbon storage, with seventeen surpassing 13,000 t/km2 and five exceeding 14,000 t/km2: Ganzhou, Zhangjiajie, Huaihua, Enshi Tujia and Miao Autonomous Prefecture, and Shennongjia Forestry District. These regions are distinguished by high vegetation coverage (>70%) and serve as vital ecological zones in the middle Yangtze region. They play a critical role in maintaining ecological stability, promoting regional sustainable development, and safeguarding ecosystem services, making them key carbon sequestration cities in the area.
In terms of the timescale, compared with 2000, the average value of carbon stock in the middle reaches of the Yangtze River showed a decreasing trend in thirty-four cities, except for in Yueyang, Huanggang, Xiangyang, Suizhou, Shiyan, Zhangjiajie, Xiangxi Tujia, Miao Autonomous Prefecture, Shennongjia Forestry District, and the other eight municipal administrative divisions. On the one hand, for Ezhou City, Wuhan City, Jingzhou City, Nanchang City, and other cities with average carbon stock values lower than 10,000 t/km2, the average value of carbon stock was lower than the average level of the middle reaches of the Yangtze River, and at the same time, with the passage of time, the level of their carbon stock exhibited a decreasing trend. On the other hand, among the seventeen cities with an average value of carbon stock higher than 13,000 t/km2, fourteen had an average value of carbon stock exhibiting a decreasing trend compared with the carbon stock level in 2000, including three cities with an average carbon stock higher than 14,000 t/km2 in Enshi Tujia and Miao Autonomous Prefecture, Huaihua City, and Ganzhou City, which are in the middle reaches of the Yangtze River. In recent years, with social and economic development and the steady progress of urbanization, the average value of the carbon stock in the middle reaches of the Yangtze River has been lower than the average level of the region. The carbon stock level in the middle reaches of the Yangtze River shows an annual declining trend from the perspective of municipalities.
In summary, the carbon stock level in the middle reaches of the Yangtze River shows a decreasing annual trend. First, from a quantitative point of view, the total amount of carbon stock and the average value of carbon stock in the middle reaches of the Yangtze River exhibit a decreasing trend. Second, from the point of view of carbon stock fixed by land-use types, the ability of each carbon-sequestering land-use type to fix the carbon stock shows a trend of “one increase, three decreases, and two fluctuations,” which is specifically shown in the carbon stock in construction land. Specifically, the carbon stock of construction land increased, that of forest land, grassland, and unutilized land decreased, and that of cultivated land and watersheds fluctuated. Finally, from the perspective of municipalities, 34 out of 42 municipal administrative divisions in the middle reaches of the Yangtze River exhibit a continuous downward trend in carbon stock levels, which is reflected in the fact that the average value of cities with relatively low and high carbon stock levels continues to decrease, leading to a decrease in the level of carbon stock in the entire study area.

2.3.2. Analysis of the Volatility of Spatial and Temporal Changes in Carbon Stocks Based on the Coefficient of Variation

The coefficient of variation (CV) is an effective metric for assessing the spatial and temporal variability in carbon stocks across different regions or sample sets. Lower CV values indicate greater parameter stability, whereas higher values indicate greater volatility. For computational efficiency, raster-based carbon stock assessment results (2000–2020) for the middle Yangtze River were converted into a tibble data frame using the R Terra package. Following the classification scheme established by Zhang et al., CV values were categorized into five distinct volatility types: low volatility (CV < 0.05), relatively low volatility (0.05 ≤ CV < 0.1), moderate volatility (0.1 ≤ CV < 0.15), relatively high volatility (0.15 ≤ CV < 0.2), and high volatility (CV ≥ 0.2).
As illustrated in Figure 5, low-volatility areas dominated the carbon stock dynamics of the middle reaches of the Yangtze River, covering 469,080.80 km2 (83.30% of the study area). Relatively low-volatility zones accounted for 8677.86 km2 (1.5%), while moderate-volatility, relatively high-volatility, and high-volatility regions occupied 16,913.88 km2 (3.0%), 20,456.55 km2 (3.60%), and 49,645.26 km2 (8.80%), respectively.
Spatially, low-volatility areas were extensively distributed across all 42 municipal administrative divisions. In contrast, high-volatility zones were predominantly concentrated in the central plains, encompassing major urban centers such as Wuhan, Ezhou, Nanchang, Changsha, and Yueyang, with isolated occurrences elsewhere.
In summary, the carbon stock variability hierarchy by area was as follows: low volatility > high volatility > relatively high volatility > moderate volatility > relatively low volatility. Geographically, high-volatility areas were correlated with economically developed, highly urbanized central plains, whereas low-volatility regions coincided with topographically elevated zones characterized by robust ecosystems and dense vegetation cover, demonstrating broad spatial prevalence throughout the study area.

2.3.3. Spatial Autocorrelation Analysis of Carbon Storage in the Middle Reaches of the Yangtze River

Spatial autocorrelation describes the potential interdependence between the observed data for certain variables within the same distribution area. Specifically, it examines the degree of spatial autocorrelation of a certain characteristic value between a spatial unit and its neighboring units using statistical methods, thereby analyzing the distribution patterns of these spatial units. Using ArcGIS 10.6, the middle reaches of the Yangtze River were divided into 352 county-level administrative units, with each county serving as a spatial unit. Local autocorrelation was used to identify the locations where the variables were clustered in space.
A spatial autocorrelation model was used to identify the spatial associations and clustering patterns of carbon storage in the middle reaches of the Yangtze River. Global spatial autocorrelation analysis revealed that the Global Moran’s I indices for 2000, 2005, 2010, 2015, and 2020 were all greater than 0 (0.756, 0.749, 0.742, 0.735, and 0.734, respectively) and all passed the significance test. This indicates a strong positive spatial correlation in carbon storage across the region, indicating that high values tend to cluster with other high values, whereas low values tend to cluster with other low values. However, the gradual decline in Global Moran’s I suggests that this spatial correlation has weakened over time.
Subsequently, a local spatial autocorrelation analysis was conducted. As shown in Figure 6, high-value clusters (HH) were primarily concentrated in the western and southeastern parts of the region, including Shiyan City, Shennongjia Forestry District, Enshi Tujia and Miao Autonomous Prefecture, Zhangjiajie City, Xiangxi Tujia and Miao Autonomous Prefecture, Huaihua City, Shaoyang City, Ganzhou City, Chenzhou City, and Pingxiang City. In contrast, low-value clusters (LL) were mainly distributed in the central-northern areas, including Ezhou, Wuhan, Jingzhou, Nanchang, Xiantao, Qianjiang, Tianmen, parts of Xiaogan, Jingmen, southeastern Changde, northwestern Yueyang, and eastern Jiujiang.
From a temporal perspective, between 2000 and 2020, the high-value clusters in the southeastern region gradually became more fragmented, particularly in western Yichun City, western Xinyu City, eastern Pingxiang City, and southeastern Zhuzhou City. This suggests a weakening of the clustering characteristics, meaning that neighboring areas exhibit increasing differences in carbon storage values. A similar trend was observed in the low-value clusters, such as in central Yueyang City, where the differentiation in the characteristic values also increased.
In summary, the distribution of carbon storage in the middle reaches of the Yangtze River exhibited a strong positive spatial correlation, which weakened over time. Local autocorrelation results indicate that high carbon storage values are concentrated in the western and southeastern parts of the study area, while low values dominate the central region, forming a pattern of “high values surrounding low values.” However, the clustering characteristics of these high and low values diminished over time, leading to increased differentiation in the characteristic values.

2.4. Driving Force Analysis of Carbon Storage Changes in the Middle Reaches of the Yangtze River

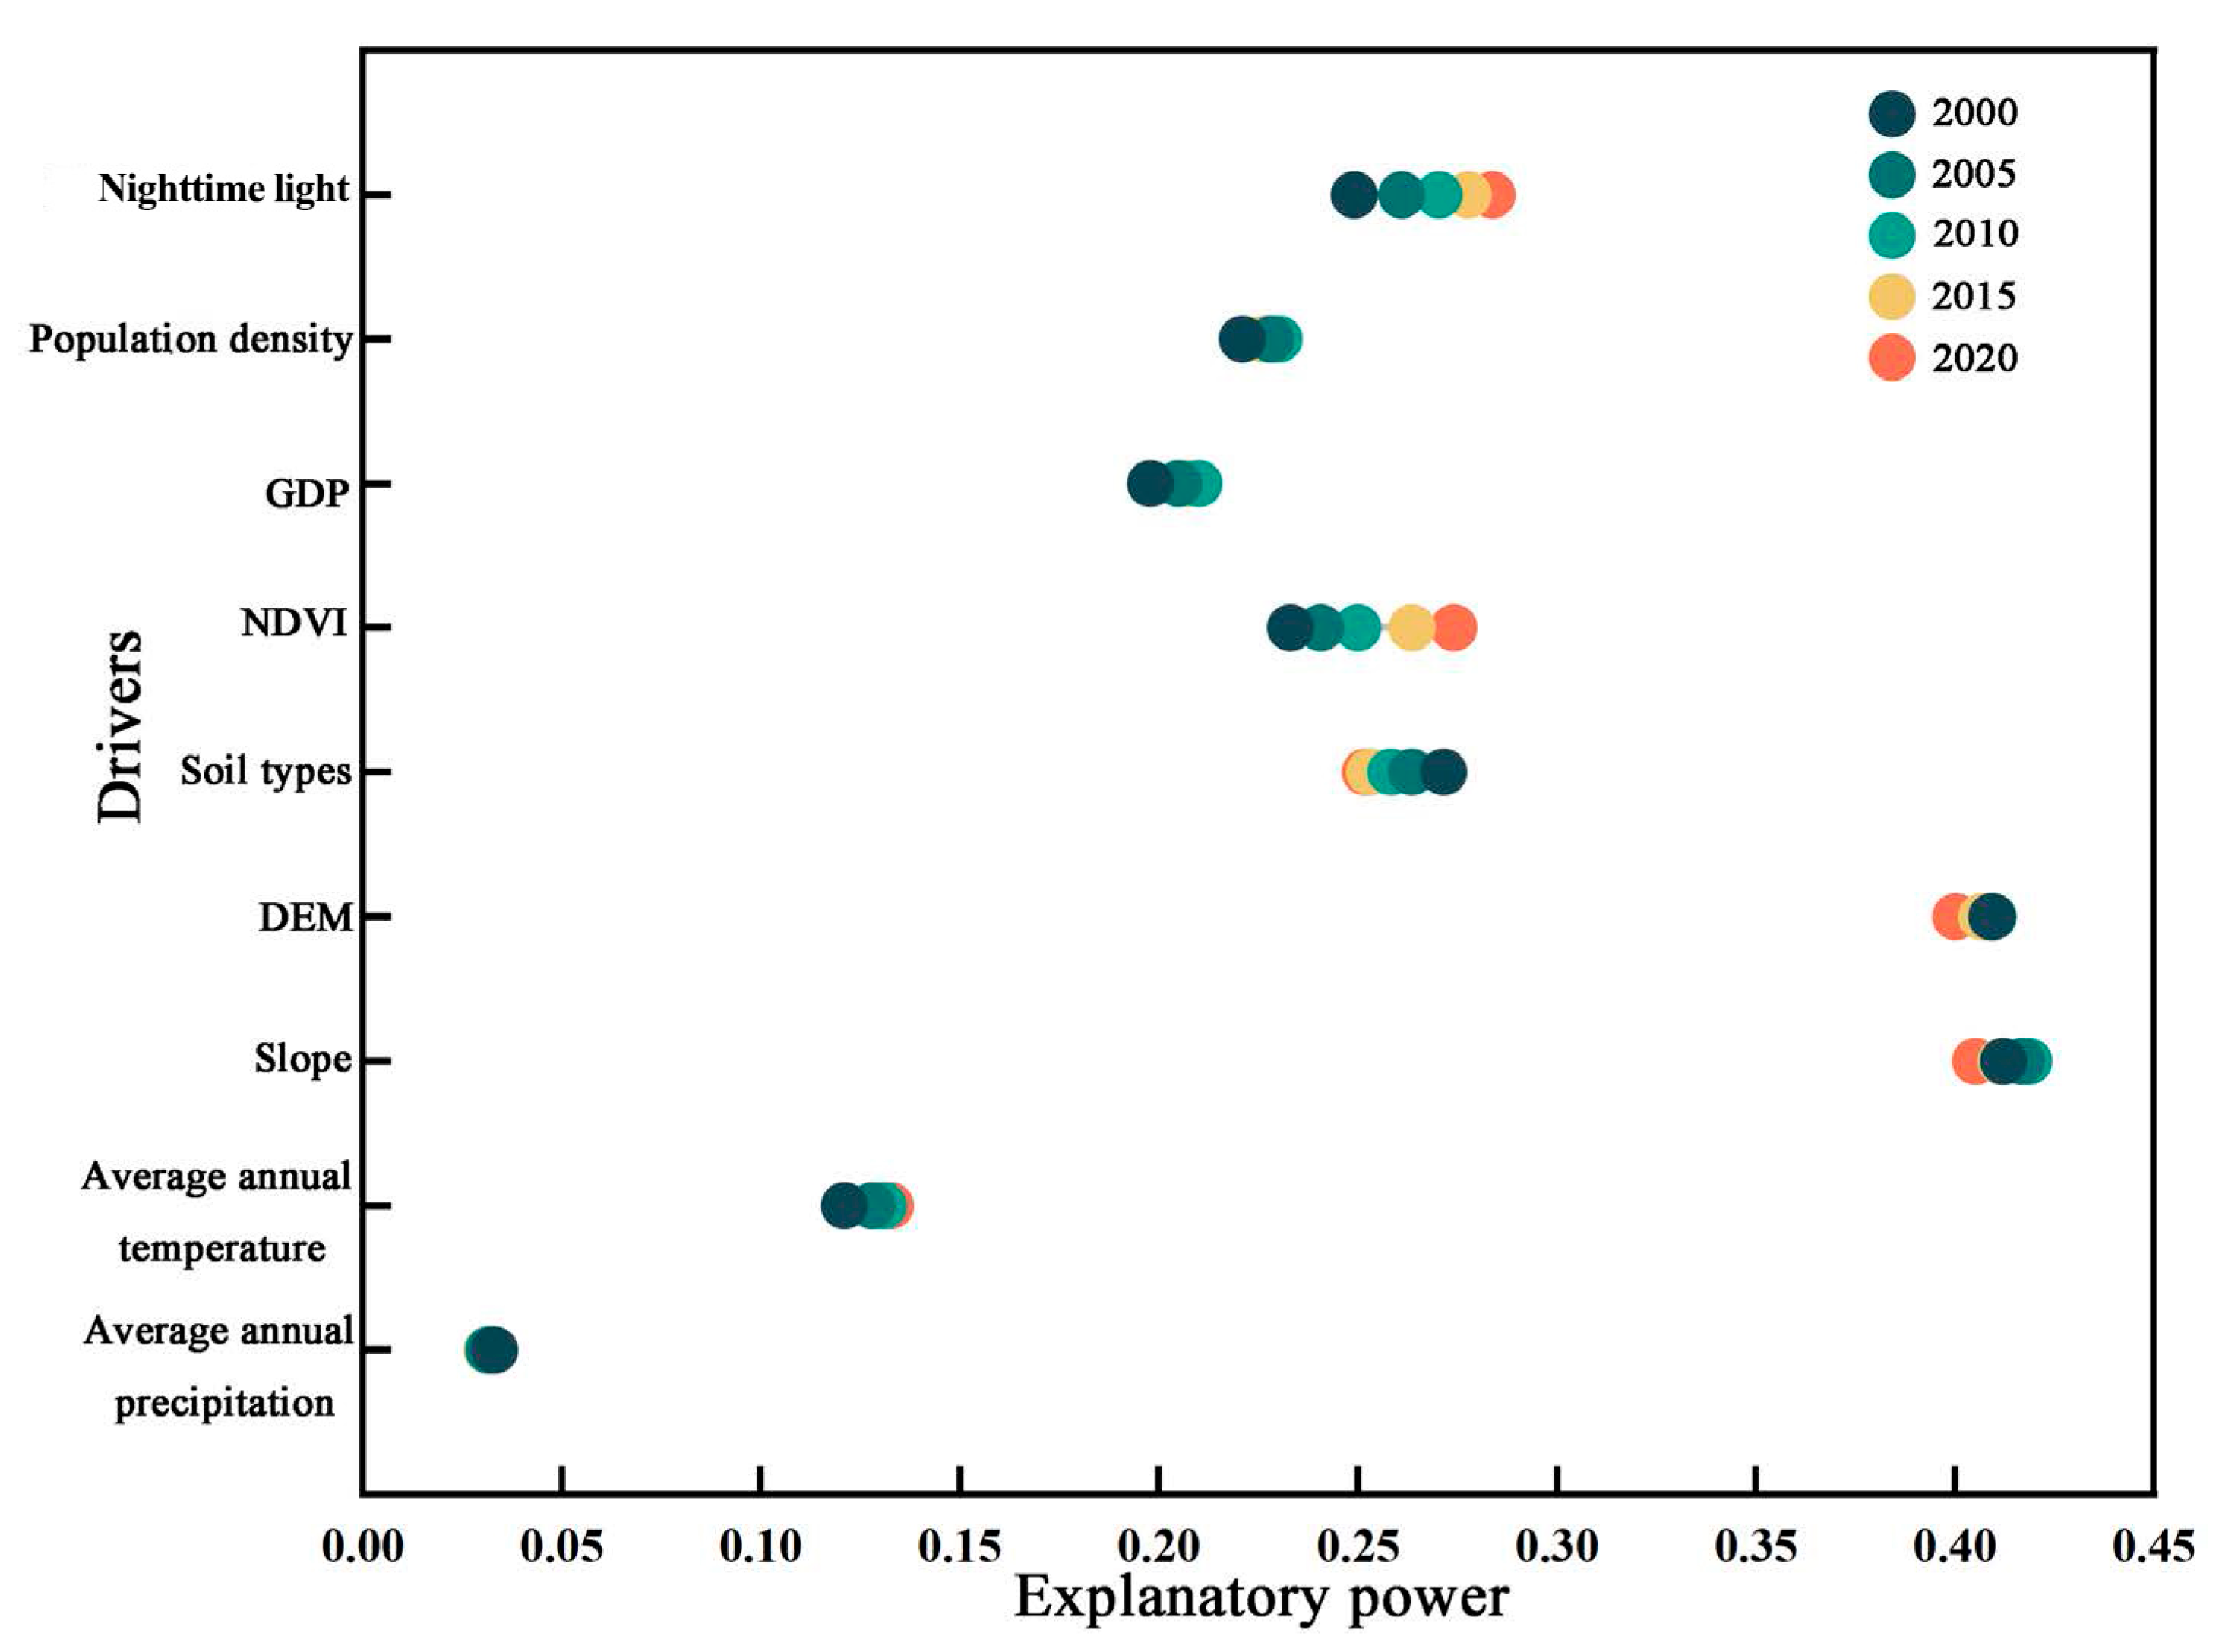
2.4.1. Single-Factor Detection Analysis

The change in regional carbon stock is mainly related to natural environmental factors and socioeconomic factors, including natural environmental factors such as annual precipitation, annual mean temperature, slope, elevation, soil type, normalized vegetation index, and other natural environmental factors, as well as socioeconomic factors such as gross domestic product, population density, and nighttime lighting, totaling nine influencing factors. As shown in Figure 7, taking 2000 as an example, it is evident that the degree of influence of different driving factors on the carbon stock in the middle reaches of the Yangtze River varies through the single-factor detection by the optimal geodetector, with slope (q-mean, 0.412) > elevation (0.409) > soil type (0.272) > nighttime lighting (0.249) > NDVI (0.233) > population density (0.221) > GDP (0.198) > average annual temperature (0.121) > average annual precipitation (0.033). The slope factor is the dominant factor in the distribution of carbon stocks in the middle reaches of the Yangtze River, and its explanatory power is greater than that of the other drivers, which indicates that a region with larger slopes has more carbon stocks, and the slope factor reflects the boundaries of the natural and human environments to a certain extent. Regions with large slopes are relatively steep and mainly consist of woodland and shrubland, whereas areas with smaller slopes have relatively flat terrain and are more suitable for human habitation. The driving explanatory power of the three socioeconomic factors of nighttime lighting (0.249), population density (0.221), and the GDP (0.198) should not be ignored, although they are not the dominant factors affecting regional carbon stocks. To a certain extent, they indicate that human activities and the socioeconomic activities generated by human activities also affect the accumulation of carbon stock in the region; the distribution of carbon stock is also affected by annual precipitation (0.033), and its explanatory power is relatively weak. From 2000 to 2020, the explanatory power of different driving factors also changed, with the explanatory power of nighttime lighting, population density, the GDP, the NDVI, and the average annual temperature regarding carbon storage in the Yangtze River’s middle reaches gradually increasing. Nighttime lighting and the NDVI showed the most obvious enhancement, whereas the explanatory power of the slope, elevation, and soil type regarding carbon storage in the middle reaches of the Yangtze River increased. The explanatory power of the slope, elevation, and soil type regarding carbon stocks in the middle reaches of the Yangtze River gradually weakened (Table 10 shows the explanatory power and significance of the driving factors for each year).

2.4.2. Factor Interaction Detection Analysis

The explanatory power of the interaction detected among the driving factors was greater than that of a single driving factor, and the interaction among the driving factors was mainly characterized by two-factor enhancement, followed by nonlinear enhancement. Taking 2000 as an example (Figure 8), most interactions among driving factors showed stronger explanatory power, with several exceeding 40%. Notably, the interactions of mean annual precipitation with slope and elevation demonstrated explanatory powers of 0.426 and 0.449, respectively. The interactions of mean annual temperature with slope and elevation demonstrated explanatory powers of 0.425 and 0.437, respectively. The interactions of slope with elevation, soil type, the NDVI, the GDP, population density, and nighttime lighting exhibited explanatory powers of 0.464, 0.462, 0.464, 0.421, 0.444, and 0.453, respectively. The interaction of elevation with soil type, the NDVI, the GDP, population density, and nighttime lighting exhibited explanatory powers of 0.454, 0.468, 0.415, 0.427, and 0.441, respectively. The explanatory power of the spatial differentiation of carbon stocks in the study area was less than 30% for the interactions of mean annual precipitation with mean annual temperature, soil type, the NDVI, the GDP, population density, and nighttime lighting, which had explanatory powers of 0.244, 0.298, 0.256, 0.229, 0.254, and 0.271, respectively. The interactions of mean annual temperature and the NDVI, the GDP, population density, and nighttime lighting had explanatory powers of 0.286, 0.252, 0.268, and 0.291, respectively. The interaction of the GDP and population density had an explanatory power of 0.244. The most significant interaction detected among all the driving factors was the interaction between elevation and the NDVI, with an explanatory power of 0.468 for the spatial distribution of carbon stocks in the study area. During the period 2000–2020, the interaction between the NDVI and elevation and slope became increasingly frequent, indicating that topography and vegetation cover are the main factors affecting the middle reaches of the Yangtze River. The interactions of the GDP, population density, and nighttime lighting with elevation and slope also occupied a larger proportion, among which the interactions of nighttime lighting with elevation and slope gradually increased. In summary, the interactions of the aforementioned driving factors are not just a mere superposition of effects; they also affect the spatial differentiation of carbon stocks in the middle reaches of the Yangtze River to some extent. Therefore, the interactions between natural environmental and socioeconomic factors should be considered in regional governance and low-carbon construction. Specifically, multiple factors from these two domains should be comprehensively considered to ensure a holistic approach. Detection of each driving factor and its significance was shown in Table 10.

2.5. Accuracy Verification Before Land-Use Simulation of Future Years

Before the formal simulation, it was necessary to verify the accuracy, that is, to simulate the land-use structure in 2020 using the evolution trend of land-use structure from 2000 to 2010 and compare it with the real land-use structure in 2020. The specific parameters of the model needed to be adjusted according to the accuracy of the simulation and relevant policies or constraints. As shown in Figure 9, the land-use data of the middle reaches of the Yangtze River in 2010 were taken as the base year for prediction, and 15 influencing factors, such as the annual average precipitation, the annual average temperature, the elevation, the slope, the GDP, the population density, and other natural environment, socioeconomic, and transportation factors, were added. The relevant domain weights, transition matrix, and other relevant parameters were adjusted to simulate the land-use structure in 2020 and compare it with the actual land-use data in 2020. The Kappa coefficient was 0.853, and the overall accuracy was 0.922. Generally, the Kappa coefficient was greater than 0.75, which meant that the simulation accuracy was good and a prediction could be made for future years.

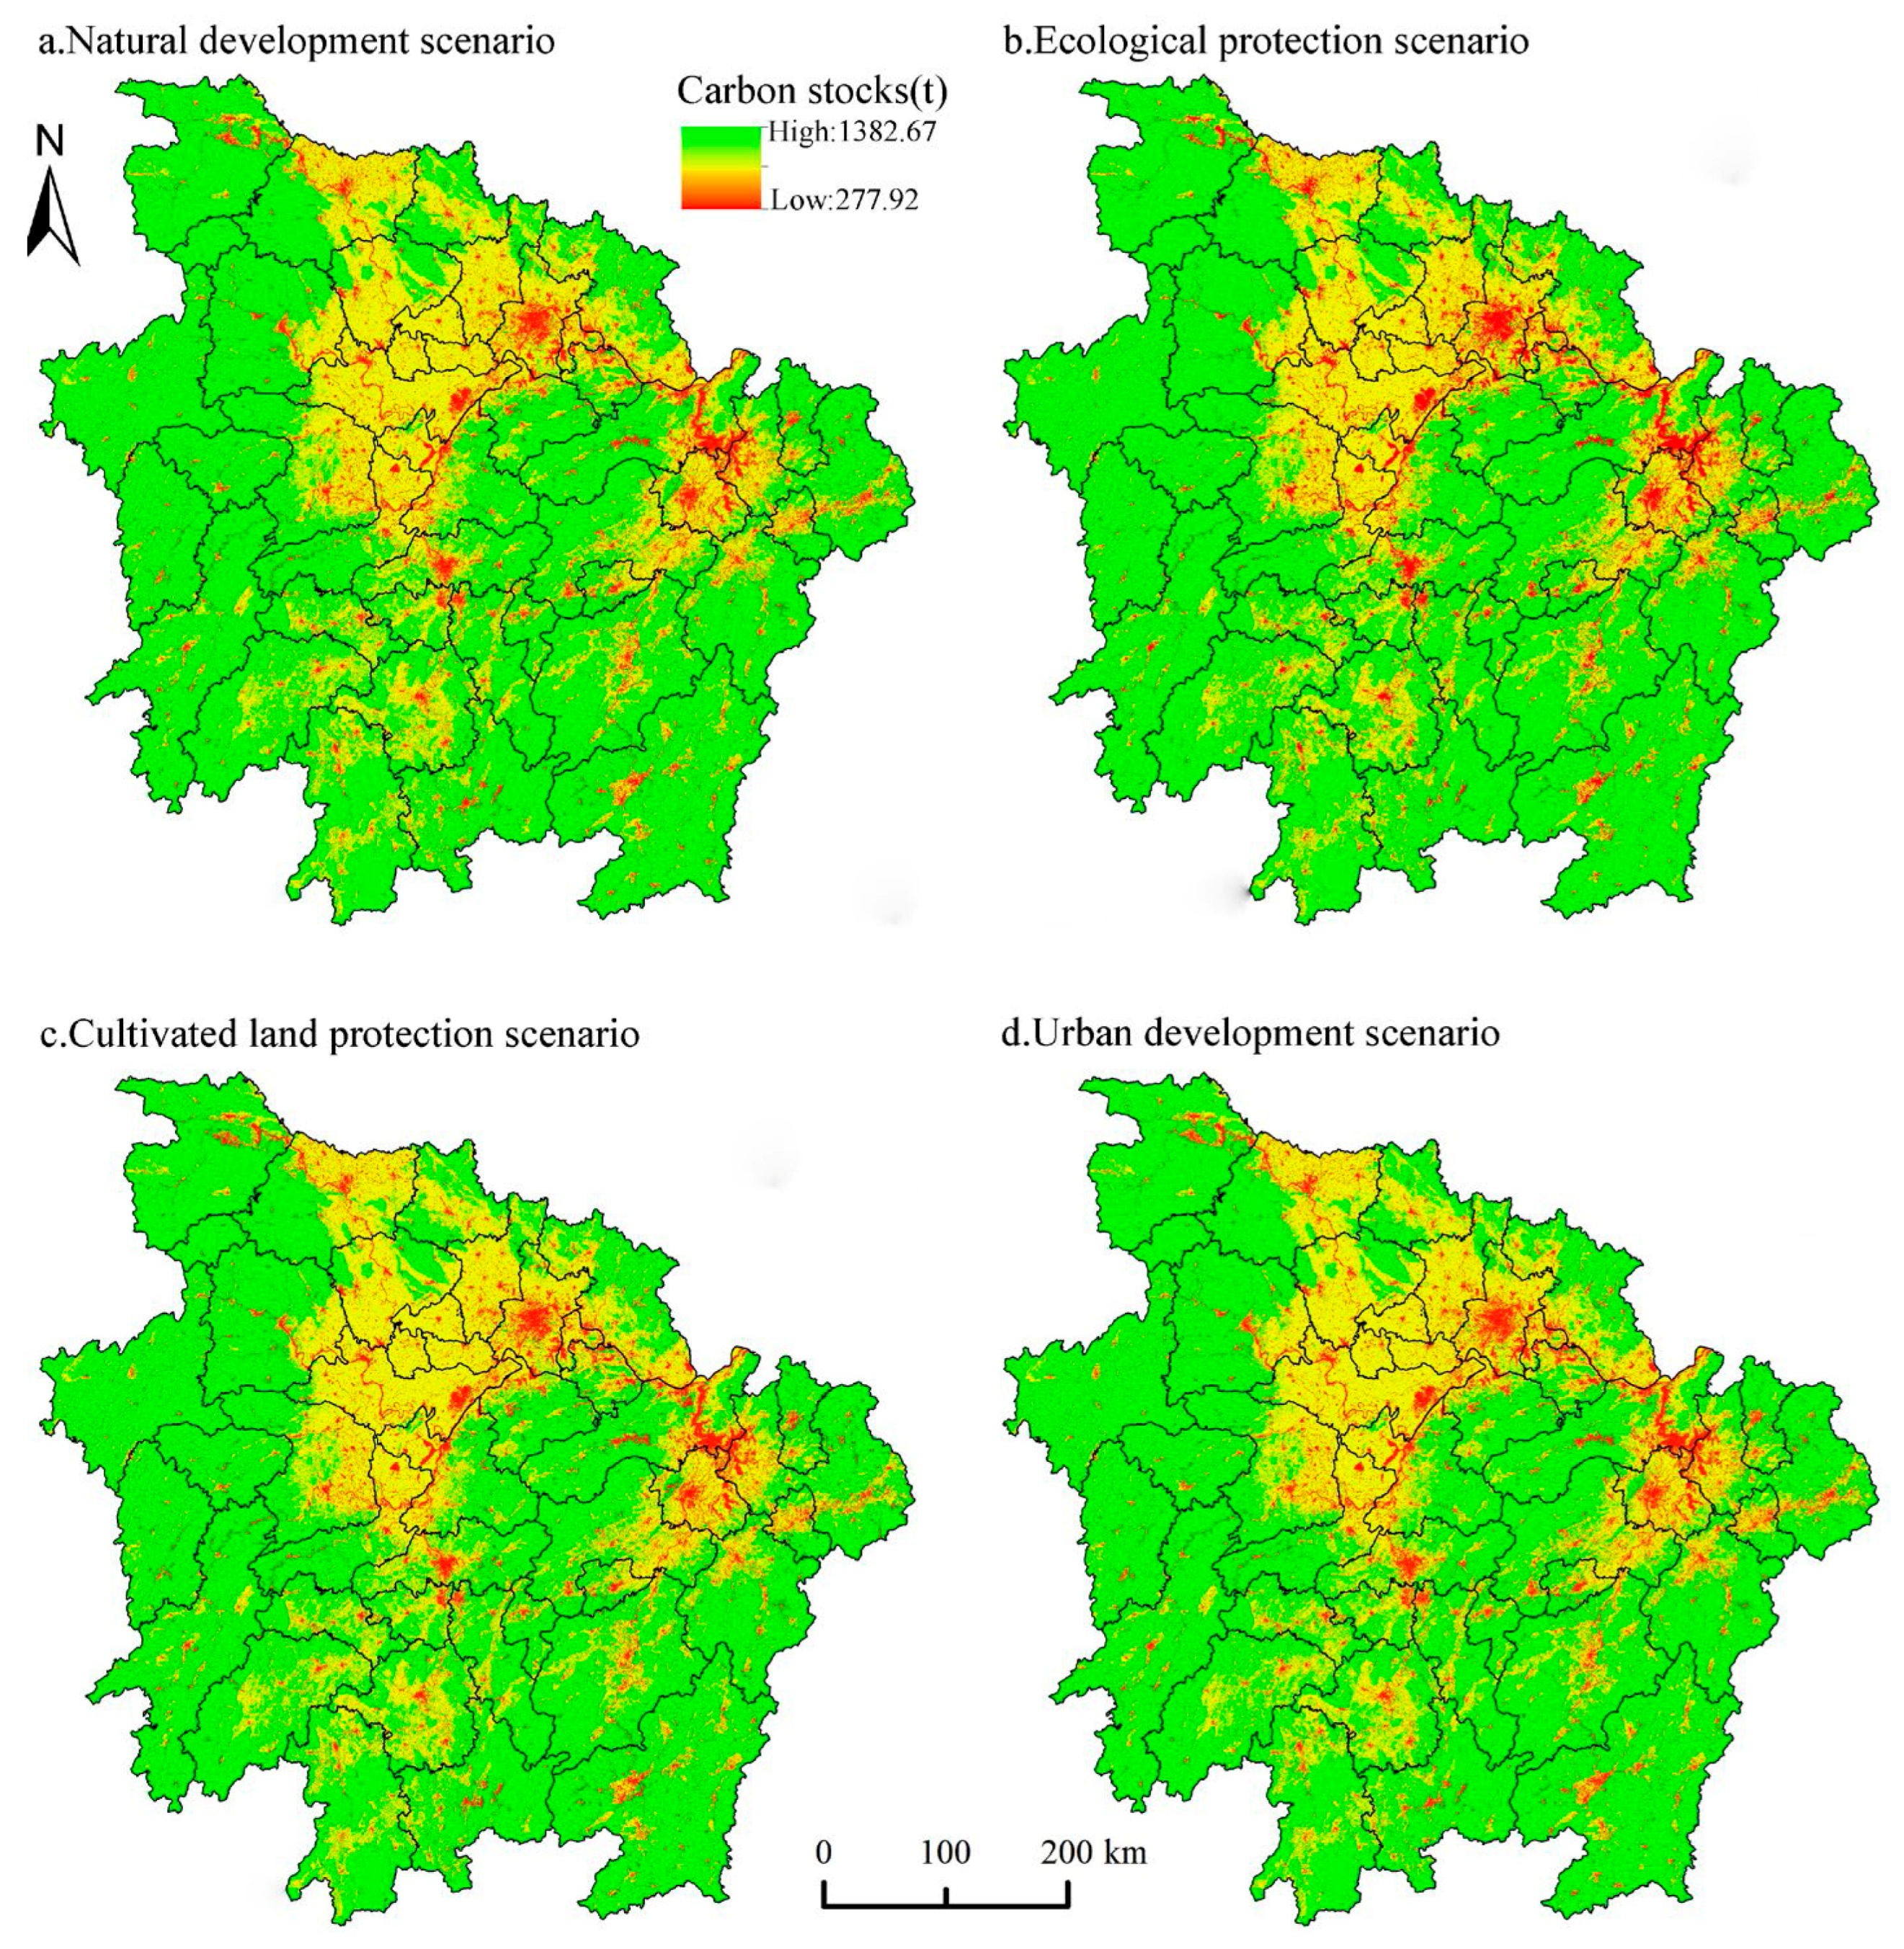
2.6. Multi-Scenario Modeling of Carbon Stocks in the Middle Reaches of the Yangtze River

Using the InVEST model, the simulated land use under the four scenarios in the middle reaches of the Yangtze River in 2035 was synergistically calculated using the carbon density data described in the previous section, and the carbon stock distribution results under the four scenarios in 2035 were obtained (Figure 10). To more clearly compare the spatial distribution differences across the four scenarios, the difference method was employed to analyze the variations between the carbon stocks projected for 2035 under these scenarios and the actual carbon stocks recorded in 2020. This analysis produced a map illustrating the changes between the scenarios in the middle reaches of the Yangtze River and the 2020 carbon stocks. We categorized the changes in the region’s carbon stocks as significant if they exceeded 15%, while changes of 15% or less were considered essentially unchanged (the results are shown in Figure 11).
As shown in Table 11, there were significant differences in the carbon stock levels for each scenario in the middle reaches of the Yangtze River in 2035. In terms of the total amount of carbon stock in each scenario, the carbon stock in the natural development scenario decreased by 48.38 × 10⁶ t compared with the carbon stock level in 2020, the carbon stock in the ecological protection scenario increased by 0.06 × 10⁶ t, the carbon stock in the arable land protection scenario decreased by 79.52 × 10⁶ t, and the carbon stock in the urban development scenario decreased by 54.99 × 10⁶ t. The total amount of carbon stock decreased the most under the arable land protection scenario, with the urban development scenario coming in second. Compared with 2020, the average level of carbon stock under each scenario also changed significantly, with the average carbon stock under the natural development scenario decreasing by 85.49 t/km2, under the ecological protection scenario increasing by 0.09 t/km2, under the cropland protection scenario decreasing by 140.64 t/km2, and under the urban development scenario decreasing by 97.23 t/km2. In general, the ecological protection scenario was better than the other scenarios in terms of the total and average carbon storage, indicating that the adoption of ecological protection measures is conducive to the accumulation of regional carbon storage.
In terms of the carbon stock accumulated by each land category, cropland and forest land remained the main land categories for carbon sequestration in the middle reaches of the Yangtze River in each scenario, and the carbon stock accumulated by other land categories accounted for a relatively small proportion. Compared with 2020, the carbon stock in croplands decreased by 3.72 × 10⁶ t, decreased by 44.86 × 10⁶ t, decreased by 11.86 × 10⁶ t, and increased by 68.79 × 10⁶ t in the natural development, ecological protection, urban development, and cropland protection scenarios, respectively. In terms of the carbon stocks in woodlands, compared to 2020, the carbon stock in croplands under the ecological protection scenario increased by 68.79 × 10⁶ t. For forest lands, the carbon stock decreased by 61.29 × 10⁶ t in the natural development scenario, by 161.54 × 10⁶ t in the cropland protection scenario, and by 63.68 × 10⁶ t in the urban development scenario. In contrast, the carbon stock in croplands under the ecological protection scenario increased by 43.76 × 10⁶ t. Regarding construction land, the carbon stock in each scenario in 2035 showed an increase compared to 2020, with respective gains of 17.72 × 10⁶ t, 0.25 × 10⁶ t, 14.08 × 10⁶ t, and 21.64 × 10⁶ t, with the ecological protection scenario having a relatively low increase. For grassland, water, and unutilized land, the carbon stocks in 2035 across all four scenarios showed relatively minor changes compared to 2020. The small changes in grassland and unutilized land may be attributed to their smaller baseline areas relative to other land categories. Meanwhile, the carbon stocks of water showed minimal variation across the four scenarios because it was designated as a restricted-conversion land category during scenario development.
From the perspective of spatial distribution differences (Figure 5 and Figure 6), the area of the 2035 natural development scenario in the middle reaches of the Yangtze River with a significant decrease in carbon stocks is 6281.46 km2, accounting for 1.11% of the total area of the study area. The area of the 2035 ecological protection scenario with a significant decrease in carbon stocks is 296.10 km2, accounting for 0.34% of the total area of the study area. The area of the 2035 ecological protection scenario in the middle reaches of the Yangtze River with a significant decrease in carbon stocks is 296.10 km2, accounting for 0.34%, which is more scattered in the spatial distribution of the study area. The area of the 2035 ecological protection scenario in the middle reaches of the Yangtze River where the carbon stock decreases significantly is 296.10 km2, accounting for 0.05% of the total area of the study area, which is more scattered in spatial distribution. The area of significant increase was 16,542.90 km2, accounting for 2.93% of the total area of the study area, and the increase was obvious in the northern, northeastern, and southwestern regions of the study area, mainly involving Shiyan City in the north, Suizhou City, Xiaogan City, and Huanggang City in the northeast, and Huaihua City, Shaoyang City, Yongzhou City, and Hengyang City in the southwest. The area with an obvious decrease in carbon stock in the 2035 cropland protection scenario in the middle reaches of the Yangtze River is 10,651.86 km2, accounting for 1.89% of the total area of the study area, mainly distributed in Jiujiang City, Shangrao City, Shangrao City, and Ganzhou City. This is mainly the area with an expansion of cropland in the cropland protection scenario, and the area of the obvious increase is smaller, increasing by only 125.73 km2, showing a sporadic distribution. The area of the 2035 urban development scenario in the middle reaches of the Yangtze River is 7282.17 km2, accounting for 1.29% of the total area of the study area, and the distribution area is mainly the area of expansion of construction land under the urban development scenario, which is more dispersed compared with the natural development scenario and is mainly located in the central and southern cities of the study area, and in the north of the study area, the area of significant increase is more obvious in places such as Shiyan and Yichang City. In the northern part, Shiyan and Yichang Cities are more obvious, while the area with an obvious increase is 1910.70 km2, which is more dispersed in the region and mixed in the areas with an obvious decrease.
In summary, the carbon stock levels in the middle reaches of the Yangtze River in 2035 exhibited distinct patterns across the different scenarios. In terms of both the total amount of carbon fixed and the average carbon stock level, the ranking is ecological protection scenario > natural development scenario > urban development scenario > arable land protection scenario. In terms of the carbon stock of each land category, the carbon stock of arable land, forest land, and grassland under the natural development scenario decreased relative to the total carbon stock, whereas the proportion of construction land gradually increased compared to that in the natural development scenario. In the ecological protection scenario, the proportion of carbon stocks in croplands decreased, while the proportions of forest land, grassland, and construction land increased; however, the increase in construction land was much lower than in other scenarios. In the cropland protection scenario, the proportion of carbon stocks in cropland and construction land increased, whereas the proportions in ecological lands, such as forest land and grassland, decreased substantially. In the urban development scenario, the proportions of carbon stocks in cropland, forest land, and grassland decreased, and the proportion of carbon stocks in cropland, forest land, and grassland increased by a large margin; forest land and grassland carbon stock decreased from 2020, and the decrease was even larger than that of the natural development scenario, while the carbon stock level of construction land was the highest among the four scenarios. Therefore, the ecological protection scenario is the most effective for maintaining ecological land and limiting urban expansion in the study area. Spatially, the ecological conservation scenario had the largest number of patches with significantly increased carbon stocks and the fewest patches with significant decreases compared to other scenarios. Consequently, the ecological conservation scenario is essential for the sustainable development of the middle reaches of the Yangtze River, aligning with China’s goals for ecological civilization construction, green economic transformation, and the “dual carbon” strategy. Adopting ecological conservation measures will have comprehensive and far-reaching benefits, influencing not only environmental stability but also economic, cultural, health, and societal sustainability.

3. Discussion

The overall carbon stock in the middle reaches of the Yangtze River was relatively high and remained stable to some extent. The “Carbon Special Project” team of the Chinese Academy of Sciences estimated the carbon stock per square kilometer in China to be approximately 8000 t, while the average value of the carbon stock in the middle reaches of the Yangtze River was much higher than this level [47]. In addition, the results of this study are consistent with those of He, Wang et al. [48,49] in terms of the average carbon storage levels, and the average carbon storage levels are decreasing over time, further indicating that as human activities become more frequent and urbanization levels continue to rise, regional carbon storage levels will show a declining trend. However, there is large variation in the average carbon storage across different cities in the region, which is primarily linked to the intensity and scale of human activities. With urban development and continuous socioeconomic improvements, the carbon stock level in the middle reaches of the Yangtze River has shown a consistent decline, reflecting the region’s status as a demonstration area where ecological and economic development are integrated. Striving to maintain a balance between economic construction and ecological protection is crucial for addressing the “double carbon” challenges in the middle reaches of the Yangtze River and ensuring the sustainable development of the region’s social, economic, and natural environments. It is necessary to solve the “double carbon” problem in the middle reaches of the Yangtze River and ensure the sustainable development of the region’s socioeconomic and natural environments.
The results of the geoprobe analysis with optimal parameters indicate that slope has consistently been the dominant factor influencing regional carbon stock in the middle reaches of the Yangtze River during the study period. However, the explanatory power of other socioeconomic factors has been increasing year by year. The interaction probe results also reveal a gradual rise in the importance of socioeconomic factors in the evolution of regional carbon stocks, which aligns with the findings of Wang, Xue et al. [50,51]. Therefore, systematic thinking is needed in regional governance and in the construction of the “double carbon” strategy. Countermeasures should integrate natural and socioeconomic environmental factors, such as improving synergistic governance mechanisms and fostering collaboration with neighboring regions. Effective ecological management of the middle reaches of the Yangtze River requires cross-regional and cross-sectoral cooperation. Strengthening partnerships and exchanges with neighboring areas will help achieve resource sharing and complementary advantages, thereby enhancing the efficiency and effectiveness of ecological management in the region.
Based on the results of partition statistics and local spatial autocorrelation analysis, it was found that areas with high carbon stock values in the middle reaches of the Yangtze River were located in the west and southeast of the study area, whereas low-value areas were mainly distributed in the central part. The high-value carbon stock areas have been gradually declining with socioeconomic development, driven by urbanization demands and rapid economic growth. Therefore, it is essential to strengthen land-use control and maintain a balance between ecological protection and socioeconomic development in high-value concentration areas, such as Shennongjia Forest and the Enshi Tujia–Miao Autonomous Region. In the central areas with low carbon stock values, including Wuhan City, Ezhou City, Jingzhou City, Nanchang City, Xiantao City, Qianjiang City, and Tianmen City, efforts should be made to enhance the carbon sink capacity of these areas.
The simulation of carbon stock scenarios revealed that the mean carbon stock values in the middle reaches of the Yangtze River in 2035 differed across the natural development, cropland protection, urban development, and ecological protection scenarios. The first three scenarios were found to be less conducive to the region’s sustainable development, as the expansion of cropland and construction land contributed to a decrease in the overall carbon stock levels, consistent with the findings of Zhou et al. [52] and Li et al. [53]. In contrast, the ecological protection scenario restricted the expansion of low-carbon-density land categories, thereby increasing the probability of conversion to high-carbon-density land types, such as woodland and grassland. This is critical for enhancing the region’s carbon sequestration capacity and promoting sustainable development. In managing the study area, it is important to ensure intensive and efficient land use while implementing relevant policies such as the “linkage between increase and decrease” and the “balance of occupation and compensation.” Additionally, controlling the conversion of high-carbon-density land to low-carbon-density land is essential to protect the carbon sequestration capacity of ecological lands.
In general, comprehensive ecological protection and management strategies should be implemented to promote the sustainable development of carbon stocks in the study area. Specifically, this involves two key approaches. First, it is essential to prioritize the protection of ecologically sensitive areas, such as nature reserves and forest farms, which typically have high carbon stock values and play a critical role in maintaining regional ecological balance. To achieve this, the government should provide clear policy guidelines and establish robust legal and regulatory frameworks to ensure the effective protection of these areas. Such measures include restricting human activities, preventing overexploitation and degradation, and implementing ecological restoration projects to maintain and enhance their carbon sink capacity. Second, for areas with relatively low carbon density, targeted measures should be adopted to boost their carbon sink potential. This can be accomplished through ecological restoration initiatives such as afforestation, farmland-to-forest conversions, and grassland restoration to increase vegetation cover and improve soil organic matter content. Additionally, optimizing land-use structures, reducing high-emission industrial activities, and promoting green, low-carbon production and lifestyles are crucial steps to relieve environmental pressures and foster regional sustainability.
Using the InVEST-PLUS model, we investigated the spatial and temporal evolution of carbon stocks in the middle reaches of the Yangtze River through multi-scenario simulations. The results of this study are both scientifically sound and practically valuable, as they reflect the spatial and temporal dynamics of carbon stocks in the region and highlight future trends under various policy scenarios. These insights can inform the green development of the middle reaches of the Yangtze River. However, there are some limitations to the research. First, the carbon density data used for estimating carbon stocks were mainly derived from literature sources and adjusted using empirical formulas, which differ from actual field measurements. Future studies could improve accuracy by incorporating directly measured data for the six land classes and refining carbon density estimates for these classes. Second, in the multi-scenario simulations, the 15 driving factors selected for land-use simulation may influence the results. It is important for subsequent studies to comprehensively evaluate the contributions of different driving factors to land-use change, including incorporating policy constraints, to enhance the model’s simulation accuracy.

4. Conclusions

In this study, the coupled InVEST-PLUS model revealed the spatiotemporal evolution of carbon storage in the middle reaches of the Yangtze River. Geographic detectors were used to identify the driving forces of carbon storage changes, and the model simulated and predicted carbon storage in 2035 under four scenarios. The main conclusions are described below.
The dominant land-use types in the middle reaches of the Yangtze River are forest and cultivated land, together accounting for over 90% of the study area. From 2000 to 2020, land-use changes in the region were characterized by increases in cultivated and construction land and decreases in forest land, grassland, construction land, and unused land. Over the past two decades, land-use changes have been relatively frequent to accommodate social and economic development, with construction land expansion encroaching on cultivated land, forests, and water areas. The comprehensive land-use dynamic degree over this period was 0.26, indicating active land turnover and steady urbanization. Carbon storage assessments show a significant downward trend in the region’s carbon stock, confirmed by trend line analyses. The coefficient of variation results reveal that high-fluctuation areas (8.79%) are mainly concentrated in the central plain, a region of advanced economic development and high urbanization. Local spatial autocorrelation analysis indicates that high carbon storage values are concentrated in the west and southeast, while low-value areas are mainly in the central part of the study area.
The analysis of the driving factors of carbon storage change showed a descending order of explanatory power: slope > elevation > soil type > night light > NDVI > population density > GDP > annual average temperature > average annual precipitation. Slope emerged as the dominant driver, while the influence of the NDVI, night light, the GDP, and population density has gradually strengthened, reflecting the growing impact of socioeconomic activities and vegetation cover on carbon storage patterns. Cross-detection analysis demonstrated primarily “two-factor enhancement” and “nonlinear enhancement” interactions, with elevation and NDVI interactions being the most significant. Interactions between socioeconomic factors (GDP, population density, and night light) and topographic factors (elevation and slope) also played important roles.
In terms of the total carbon storage and average sequestration across scenarios, the ranking was ecological protection scenario > natural development scenario > urban development scenario > cultivated land protection scenario. The ecological protection scenario not only preserved ecological lands but also limited construction land expansion, a capability not shared by other scenarios. Patch analysis further confirmed that the ecological protection scenario was most conducive to carbon storage accumulation. Thus, ecological protection emerges as the essential strategy for sustainable development in the middle reaches of the Yangtze River and the realization of the “dual carbon” goal.

Author Contributions

Conceptualization, H.C. and Y.S.; methodology, H.C.; software, D.T.; validation, H.C., Y.S. and Q.Z.; formal analysis, H.C.; investigation, Y.S.; resources, J.S.; data curation, Y.S.; writing—original draft preparation, Y.S.; writing—review and editing, H.C.; visualization, Y.T.; supervision, Y.S.; project administration, Y.S.; funding acquisition, H.C. All authors have read and agreed to the published version of the manuscript.

Funding

This research was funded by the National Natural Science Foundation of China (42367070) and the Open Fund of the Hubei Key Laboratory of Biological Resources Protection and Utilization (Hubei Minzu University) (KYPT012405).

Institutional Review Board Statement

Not applicable.

Informed Consent Statement

Not applicable.

Data Availability Statement

The original contributions presented in this study are included in the article. Further inquiries can be directed to the corresponding author.

Conflicts of Interest

The authors declare no conflicts of interest.

References

  1. Fang, J.Y.; Chen, A.P. Dynamic Forest Biomass Carbon Pools in China and Their Significance. Acta Bot. Sin. 2001, 43, 967–973. [Google Scholar] [CrossRef]
  2. Cao, J.; Zhang, Y.; Liu, Y. Changes in Forest Biomass Carbon Storage in Hainan Island over the Last 20 Years. Geogr. Res. 2002, 21, 551–560. [Google Scholar]
  3. Duncanson, L.; Liang, M.; Leitold, V.; Armston, J.; Krishna Moorthy, S.M.; Dubayah, R.; Costedoat, S.; Enquist, B.J.; Fatoyinbo, L.; Goetz, S.J.; et al. The Effectiveness of Global Protected Areas for Climate Change Mitigation. Nat. Commun. 2023, 14, 2908. [Google Scholar] [CrossRef]
  4. Niroumand Fard, F.; Khashei Siuki, A.; Hashemi, S.R.; Ghorbani, K. Evaluation of the Effect of Scenarios in the 6th Report of IPCC on the Prediction Groundwater Level Using the Non-Linear Model of the Input-Output Time Series. Environ. Monit. Assess. 2023, 195, 1359. [Google Scholar] [CrossRef] [PubMed]
  5. Baidya, A.; Saha, A.K. Exploring the Research Trends in Climate Change and Sustainable Development: A Bibliometric Study. Clean. Eng. Technol. 2024, 18, 100720. [Google Scholar] [CrossRef]
  6. Montràs-Janer, T.; Suggitt, A.J.; Fox, R.; Jönsson, M.; Martay, B.; Roy, D.B.; Walker, K.J.; Auffret, A.G. Anthropogenic Climate and Land-Use Change Drive Short- and Long-Term Biodiversity Shifts across Taxa. Nat. Ecol. Evol. 2024, 8, 739–751. [Google Scholar] [CrossRef] [PubMed]
  7. Stranadko, N. Global Climate Governance: Rising Trend of Translateral Cooperation. Int. Environ. Agreem. Politics Law Econ. 2022, 22, 639–657. [Google Scholar] [CrossRef]
  8. He, X.; Xu, Y.; Fan, X.; Geng, Q.; Tian, Z. Temporal and Spatial Variation and Prediction of Regional Carbon Storage in Zhongyuan Urban Agglomeration. China Environ. Sci. 2022, 42, 2965–2976. [Google Scholar]
  9. Nakakaawa, C.A.; Vedeld, P.O.; Aune, J.B. Spatial and Temporal Land Use and Carbon Stock Changes in Uganda: Implications for a Future REDD Strategy. Mitig. Adapt. Strat. Glob. Change 2011, 16, 25–62. [Google Scholar] [CrossRef]
  10. Zhu, W.; Zhang, J.; Cui, Y.; Zheng, H.; Zhu, L. Assessment of Territorial Ecosystem Carbon Storage Based on Land Use Change Scenario: A Case Study in Qihe River Basin. Acta Geogr. Sin. 2019, 74, 446–459. [Google Scholar] [CrossRef]
  11. Zhang, Z.; Li, J.; Guan, D. Value Chain Carbon Footprints of Chinese Listed Companies. Nat. Commun. 2023, 14, 2794. [Google Scholar] [CrossRef]
  12. Murray, B.C. Carbon Values, Reforestation, and ‘perverse’ Incentives under the Kyoto Protocol: An Empirical Analysis. Mitig. Adapt. Strateg. Glob. Chang. 2000, 5, 271–295. [Google Scholar] [CrossRef]
  13. Lin, Z.H.; Liu, X.F.; Ren, Z.Y. Estimation of Soil Organic Carbon in Shaanxi Province and Analysis of Its Spatial Difference Based on GIS. Resour. Sci. 2012, 34, 911–918. [Google Scholar]
  14. Wang, R.-Y.; Mo, X.; Ji, H.; Zhu, Z.; Wang, Y.-S.; Bao, Z.; Li, T. Comparison of the CASA and InVEST Models’ Effects for Estimating Spatiotemporal Differences in Carbon Storage of Green Spaces in Megacities. Sci. Rep. 2024, 14, 5456. [Google Scholar] [CrossRef] [PubMed]
  15. Baral, H.; Keenan, R.J.; Sharma, S.K.; Stork, N.E.; Kasel, S. Spatial Assessment and Mapping of Biodiversity and Conservation Priorities in a Heavily Modified and Fragmented Production Landscape in North-Central Victoria, Australia. Ecol. Indic. 2014, 36, 552–562. [Google Scholar] [CrossRef]
  16. Liang, X.; Liu, X.; Li, X.; Chen, Y.; Tian, H.; Yao, Y. Delineating Multi-Scenario Urban Growth Boundaries with a CA-Based FLUS Model and Morphological Method. Landsc. Urban Plan. 2018, 177, 47–63. [Google Scholar] [CrossRef]
  17. Zhang, L.; Zhou, G.; Ji, Y.; Bai, Y. Spatiotemporal Dynamic Simulation of Grassland Carbon Storage in China. Sci. China Earth Sci. 2016, 59, 1946–1958. [Google Scholar] [CrossRef]
  18. Xiang, M.; Wang, C.; Tan, Y.; Yang, J.; Duan, L.; Fang, Y.; Li, W.; Shu, Y.; Liu, M. Spatio-Temporal Evolution and Driving Factors of Carbon Storage in the Western Sichuan Plateau. Sci. Rep. 2022, 12, 8114. [Google Scholar] [CrossRef] [PubMed]
  19. Yi, L.; Lamei, X.; Wenmin, H.; Min, Y.I.; Yizhang, X.I.E. Spatio-Temporal Pattern of Land Use Change in Changsha-Zhuzhou-Xiangtan Core Areas and Its Driving Forces. Econ. Geogr. 2021, 41, 173–182. [Google Scholar] [CrossRef]
  20. Chen, L.; Zhang, A. Identification of Land Use Conflicts and Dynamic Response Analysis of Natural-Social Factors in Rapidly Urbanizing Areas − a Case Study of Urban Agglomeration in the Middle Reaches of Yangtze River. Ecol. Indic. 2024, 161, 112009. [Google Scholar] [CrossRef]
  21. Zhang, C.; Yang, G.; Chen, D.; Zhang, H. Spatiotemporal coupling relationship between supply-demand balance of ecosystem services and welfare of residents in the Middle Reaches of the Yangtze River. Trans. Chin. Soc. Agric. Eng. 2024, 40, 356–368. [Google Scholar] [CrossRef]
  22. Li, W.; Yan, Z. Analysis of Spatiotemporal Evolution of Land Use and Its Driving Mechanism in the Agro-Pastoral Ecotone of Gansu Province Using Geodetector. Arid. Zone Res. 2024, 41, 590–602. [Google Scholar] [CrossRef]
  23. Jia, Q.; Jiao, L.; Lian, X.; Wang, W. Linking Supply-Demand Balance of Ecosystem Services to Identify Ecological Security Patterns in Urban Agglomerations. Sustain. Cities Soc. 2023, 92, 104497. [Google Scholar] [CrossRef]
  24. Chen, W.; Chi, G.; Li, J. The Spatial Aspect of Ecosystem Services Balance and Its Determinants. Land. Use Policy 2020, 90, 104263. [Google Scholar] [CrossRef]
  25. Zhang, Y.; Liu, Y.; Zhang, Y.; Liu, Y.; Zhang, G.; Chen, Y. On the Spatial Relationship between Ecosystem Services and Urbanization: A Case Study in Wuhan, China. Sci. Total Environ. 2018, 637–638, 780–790. [Google Scholar] [CrossRef]
  26. Chen, L.; Gong, J.; Wang, X.; Zheng, X. Spatial Relationship between Ecosystem Services Balance and Urbanization in the Middle Reaches of the Yangtze River. Acta Ecol. Sin. 2022, 41, 5546–5556. [Google Scholar] [CrossRef]
  27. Qu, S.; Ma, J.; Li, Q.; Hu, S. Pattern Evolution and Driving Mechanism of Urbanization Quality at County Level in the Middle Reaches of Yangtze River. Econ. Geogr. 2023, 43, 93–102. [Google Scholar] [CrossRef]
  28. Hou, M.; Deng, Y.; Yao, S. Coordinated Relationship between Urbanization and Grain Production in China: Degree Measurement, Spatial Differentiation and Its Factors Detection. J. Clean. Prod. 2022, 331, 129957. [Google Scholar] [CrossRef]
  29. Yang, J.; Huang, X. The 30&thinsp;m Annual Land Cover Dataset and Its Dynamics in China from 1990 to 2019. Earth Syst. Sci. Data 2021, 13, 3907–3925. [Google Scholar] [CrossRef]
  30. Nascimento, B.S.D.; de Oliveira Silva, J.; de Jesus Araújo Pinto, U.; Bispo, D.C.; Silva Rodrigues, P.M.; de Freitas Lins-Neto, E.M. Inferring Population Trends of Syagrus Coronata (Arecaceae) in Areas under Different Management in Brazilian Caatinga Using a Transition Matrix Model. J. Nat. Conserv. 2024, 81, 126674. [Google Scholar] [CrossRef]
  31. Chuai, X.; Huang, X.; Lai, L.; Wang, W.; Peng, J.; Zhao, R. Land Use Structure Optimization Based on Carbon Storage in Several Regional Terrestrial Ecosystems across China. Environ. Sci. Policy 2013, 25, 50–61. [Google Scholar] [CrossRef]
  32. Hu, Q. Biomass and Carbon Density of Main Forest Ecosystems in Hubei Province. Chin. J. Ecol. 2012, 31, 1626. [Google Scholar]
  33. Yu, H.; Zha, T.; Zhang, X.; Ma, L. Vertical Distribution and Influencing Factors of Soil Organic Carbon in the Loess Plateau, China. Sci. Total Environ. 2019, 693, 133632. [Google Scholar] [CrossRef] [PubMed]
  34. Xiaohuan, X. Research on Soil Organic Carbon Distribution and Change Trend in Middle-East Plain and Its Vicinity in China. Earth Sci. Front. 2013, 20, 154. [Google Scholar]
  35. Piao, S.; Fang, J.; Zhou, L.; Tan, K.; Tao, S. Changes in Biomass Carbon Stocks in China’s Grasslands between 1982 and 1999. Glob. Biogeochem. Cycles 2007, 21, 1–10. [Google Scholar] [CrossRef]
  36. Chen, W.; Chi, G. Ecosystem Services Trade-Offs and Synergies in China, 2000–2015. Int. J. Environ. Sci. Technol. 2023, 20, 3221–3236. [Google Scholar] [CrossRef]
  37. Li, M.; Xi, X.; Xiao, G.; Cheng, H.; Yang, Z.; Zhou, G.; Ye, J.; Li, Z. National Multi-Purpose Regional Geochemical Survey in China. J. Geochem. Explor. 2014, 139, 21–30. [Google Scholar] [CrossRef]
  38. Ke, X.; Tang, L. Impact of Cascading Processes of Urban Expansion and Cropland Reclamation on the Ecosystem of a Carbon Storage Service in Hubei Province, China. Acta Ecol. Sin. 2018, 39, 672–683. [Google Scholar] [CrossRef]
  39. Yang, S.; Liu, J.; Kuang, Y.; Wang, Q.; Huang, R.; Nie, W.; Sun, J.; Zhao, Y. Spatiotemporal Dynamics and Driving Forces of Trade-Offs and Synergies among Ecosystem Services in Jiangxi Province. Chin. J. Ecol. 2025, 44, 216. [Google Scholar] [CrossRef]
  40. Xu, L.; He, N.; Yu, G. A Dataset of Carbon Density in Chinese Terrestrial Ecosystems (2010s). China Sci. Data 2018, 4, 90–91. [Google Scholar] [CrossRef]
  41. Shao, Z.; Chen, C.; Liu, Y.; Cao, J.; Liao, G.; Lin, Z. Impact of Land Use Change on Carbon Storage Based on FLUS-InVEST Model: A Case Study of Chengdu–Chongqing Urban Agglomeration, China. Land 2023, 12, 1531. [Google Scholar] [CrossRef]
  42. Yang, X.-M.; Qian, B.-W.; Ji, G.-X.; Chen, W.-Q.; Huang, J.-C.; Guo, Y.-L.; Chen, Y.-N. Characteristics of Spatial and Temporal Changes in Carbon Stocks in the Middle and Upper Reaches of the Huaihe River Basin and Future Multi-scenario Simulation Prediction. Huan Jing Ke Xue 2024, 45, 5970–5982. [Google Scholar] [CrossRef] [PubMed]
  43. Yang, M.; Zhu, L.; Wang, R.; Hu, Z. Spatiotemporal variation and climate responsiveness of NDVI in Liaohe River Basin. Chin. J. Ecol. 2025, 44, 1321. [Google Scholar] [CrossRef]
  44. Xu, Q.; Shi, S. Spatial Relationship and Influencing Factors of Traditional Villages and Intangible Cultural Heritage along the Grand Canal. Geogr. Sci. 2025, 45, 603–612. [Google Scholar] [CrossRef]
  45. Xu, J.; Song, Z. Spatial-Temporal Coupling between the Global Digital Economy and Sustainable Development. Geogr. Sci. 2025, 45, 164–175. [Google Scholar]
  46. Wang, Y.; Jiang, X.; Gao, S.; Jiang, Q.; Du, H.; Han, N. Multi-Scenario Carbon Storage Analysis Based on PLUS Model and InVEST Model: A Case Study of Zhejiang Province, China. Earth Sci. Inform. 2025, 18, 192. [Google Scholar] [CrossRef]
  47. Tang, X.; Zhao, X.; Bai, Y.; Tang, Z.; Wang, W.; Zhao, Y.; Wan, H.; Xie, Z.; Shi, X.; Wu, B.; et al. Carbon Pools in China’s Terrestrial Ecosystems: New Estimates Based on an Intensive Field Survey. Proc. Natl. Acad. Sci. USA 2018, 115, 4021–4026. [Google Scholar] [CrossRef]
  48. He, Y.; Liang, Y.; Shen, C.; Bu, X.; Wang, J. Spatial and Temporal Trade-Offs between Carbon Storage and Crop Production in Chinese Terrestrial Ecosystems, 1995–2100. J. Nat. Conserv. 2025, 87, 126989. [Google Scholar] [CrossRef]
  49. Wang, W.-W.; Fu, T.; Chen, H. Spatio-temporal Evolution and Prediction of Carbon Storage in the Yangtze River Delta Urban Agglomeration Based on PLUS-InVEST Model. Huan Jing Ke Xue 2025, 46, 1937–1950. [Google Scholar] [CrossRef]
  50. Xue, Z.; Meng, X.; Liu, B. Spatiotemporal Evolution and Driving Factors of Ecosystem Services in the Upper Fenhe Watershed, China. Ecol. Indic. 2024, 160, 111803. [Google Scholar] [CrossRef]
  51. Wang, C.; Luo, J.; Qing, F.; Tang, Y.; Wang, Y. Analysis of the Driving Force of Spatial and Temporal Differentiation of Carbon Storage in Taihang Mountains Based on InVEST Model. Appl. Sci. 2022, 12, 10662. [Google Scholar] [CrossRef]
  52. Zhou, R.; Lin, M.; Wu, Z.; Gong, J. Responses of Ecosystem Carbon Stocks to Land Use Change on the West Side of the Pearl River. Ecol. Sci. 2018, 37, 175–183. [Google Scholar]
  53. Jiao, L.I.; Jie, W.; Lang, L.I.; Cui-Yan, Z.; Qian, N.I.U.; Can-Ming, Z. Impact of Land Use Change on Carbon Storage in the Dongting Lake Eco-Economic Zone. Chin. J. Ecol. 2022, 41, 1156. [Google Scholar] [CrossRef]
Figure 1. Geographical location of the middle reaches of the Yangtze River.
Sustainability 17 06067 g001
Figure 2. Technology roadmap.
Sustainability 17 06067 g002
Figure 3. Results of carbon stock assessment in the middle reaches of the Yangtze River.
Sustainability 17 06067 g003
Figure 4. Annual changes in the carbon stock quantity in the middle reaches of the Yangtze River.
Sustainability 17 06067 g004
Figure 5. Spatial distribution of the coefficient of variation of carbon stocks in the middle reaches of the Yangtze River.
Sustainability 17 06067 g005
Figure 6. Local spatial autocorrelation analysis of carbon stock in the middle reaches of the Yangtze River.
Sustainability 17 06067 g006
Figure 7. Detection of driving factors of carbon stock changes in the middle reaches of the Yangtze River from 2000 to 2020.
Sustainability 17 06067 g007
Figure 8. Interaction detection of drivers of carbon stock changes in the middle reaches of the Yangtze River from 2000 to 2020. Note: X1 represents the average annual precipitation, X2 the average annual temperature, X3 the slope, X4 the elevation, X5 the soil type, X6 the NDVI, X7 the GDP, X8 the population density, and X9 the night light.
Sustainability 17 06067 g008
Figure 9. Comparison of actual and simulated land use in the middle reaches of the Yangtze River.
Sustainability 17 06067 g009
Figure 10. Spatial distribution of carbon stocks under four scenarios in the middle reaches of the Yangtze River in 2035.
Sustainability 17 06067 g010
Figure 11. Changes in carbon stocks in the middle reaches of the Yangtze River by scenario, 2000–2035.
Sustainability 17 06067 g011
Table 1. List of data sources.
DataAbbreviationTimeResolutionSource
Administrative divisions///National Geographic Information Public Service Platform (https://www.tianditu.gov.cn)
Land use CLCD2000~202030 mChina Land Cover Dataset Products
Average annual precipitationPRE2010, 20201000 mNational Tibetan Plateau and Data Center
(https://data.tpdc.ac.cn)
Average annual temperatureTEMP2010, 20201000 m
SlopeSlope/30 mGeospatial Data Cloud (http://www.gscloud.cn)
AspectAspect/30 m
ElevationDEM/30 m
Normalized vegetation indexNDVI2010, 202030 mNational Ecological Science Data Center (https://www.nesdc.org.cn)
Soil typesSoil19951000 mResource and Environment Data Center, Chinese Academy of Sciences
(http://www.resdc.cn)
Gross domestic productGDP2010, 20201000 m
Population densityPOP2010, 20201000 m
Nighttime lightNIL2010, 20201000 m
Railway/2010, 2020/National Geographic Information Resources Directory Service System (https://www.webmap.cn)
Rivers/2010, 2020/
First-class roads/2010, 2020/
Secondary roads/2010, 2020/
Tertiary roads/2010, 2020/
Carbon density/2015~2020/Refer to the measured data of each province
Table 2. Carbon density by class (unit: t/hm2).
Type of
Land Use
Aboveground Part
Carbon Density
Underground Part
Carbon Density
Soil Organic Matter
Carbon Density
Death and Decay Organic
Carbon Density
Cropland5.242.2488.281.93
Forest26.1413.64111.382.47
Grassland5.7410.5183.374.92
Water1.820.9734.742.26
Impervious1.890.3137.350
Barren1.970.6127.740.56
Table 3. Parameter settings for the weights of each scenario domain.
Type of
Land Use
CroplandForestGrasslandWaterImperviousBarren
Natural development scenarios0.400.350.150.010.800.35
Ecological protection scenarios0.120.500.350.010.500.20
Cultivated land protection scenario0.600.350.310.010.650.45
Urban development scenario0.240.280.330.010.950.15
Table 4. Parameters for each transition matrix in each scenario.
Type of
Land Use
Natural Development ScenarioEcological Protection Scenario
CroplandForestGrasslandWaterImperviousBarrenCroplandForestGrasslandWaterImperviousBarren
Cropland111111111111
Forest111111010000
Grassland111111011100
Water000100000100
Impervious111111111111
Barren111111111111
Type of
Land Use
Cropland Protection ScenarioUrban Development Scenario
CroplandForestGrasslandWaterImperviousBarrenCroplandForestGrasslandWaterImperviousBarren
Cropland100000111011
Forest111011111011
Grassland111011111011
Water000100000100
Impervious011011011010
Barren111011111011
Table 5. Land-use transfer matrix 2000~2010 (unit: km2).
Year2010
CroplandForestGrasslandWaterImperviousBarrenTotalRoll Out
2000Cropland184,143.3312,065.22161.642226.152999.521.44201,597.317,453.97
Forest14,938.83318,626.2852.3818.00364.680334,000.1715,373.89
Grassland357.66305.55488.4315.3927.277.201201.50713.07
Water2450.3499.6319.1715,555.24346.236.1218,476.732921.49
Impervious11.880.270.09280.269076.1409368.64292.50
Barren1.80014.137.3810.9820.1654.4534.29
Total201,903.84331,096.95735.8418,102.4212,824.8234.92564,698.7936,789.21
Shift to17,760.5112,470.67247.412547.183748.6814.7636,789.21
Table 6. Land-use transfer matrix 2010~2020 (unit: km2).
Year2020
CroplandForestGrasslandWaterImperviousBarrenTotalRoll Out
2010Cropland180,976.9514,520.6977.671855.534470.662.34201,903.8420,926.89
Forest18,303.39312,246.0037.9838.25471.330.01331,096.9518,850.95
Grassland291.69199.62166.3226.8247.074.32735.84569.52
Water2385.7222.593.5115,429.69258.931.9818,102.422672.73
Impervious24.210.090.54300.3312,499.200.4512,824.82325.62
Barren4.410.012.8810.535.4911.6134.9223.31
Total201,986.37326,988.99288.917,661.1517,752.6820.70564,698.7943,369.02
Shift to21,009.4214,742.99122.582231.465253.489.0943,369.02
Table 7. Land-use transfer matrix 2000~2020 (unit: km2).
Year2020
CroplandForestGrasslandWaterImperviousBarrenTotalRoll Out
2000Cropland173,879.6418,058.0563.812413.987178.942.88201,597.3027,717.66
Forest24,422.94308,320.0278.5758.861118.71.08334,000.1725,680.15
Grassland460.98526.59136.0836.4537.533.871201.51065.42
Water3149.9183.076.5714,751.63482.043.5118,476.733725.10
Impervious64.621.260.45382.778919.270.279368.64449.37
Barren8.280.013.4217.4616.209.0954.4545.36
Total201,986.37326,988.99288.9017,661.1517,752.6820.7564,698.7958,683.06
Shift to28,106.7318,668.97152.822909.528833.4111.6158,683.06
Table 8. Carbon stocks of various types in the middle reaches of the Yangtze River.
YearCarbon Stocks/106 t
CroplandForestGrasslandWaterImperviousBarrenTotal
20001969.405131.2412.5673.5237.050.177223.94
20051953.745151.578.7371.3741.820.117227.34
20101972.405086.647.6972.0350.720.117189.59
20151964.635056.395.1474.1860.530.077160.94
20201973.205023.433.0270.2770.210.067140.19
Table 9. Average value of carbon stock in each municipal administrative division in the middle reaches of the Yangtze River (unit: t/km2).
City20002005201020152020City20002005201020152020
Ezhou8649.848714.388617.158578.838567.06Xinyu12,585.2512,450.4412,124.9411,928.2411,855.64
Wuhan8865.308829.548660.648620.998577.67Shangrao12,762.6712,801.3112,782.5512,645.3012,577.62
Jingzhou9135.269097.399007.319036.459081.98Yichun12,822.6312,792.1612,672.0712,525.7212,441.45
Nanchang9193.409181.759175.599089.609029.50Changsha12,947.4212,697.7012,418.5412,231.8812,203.24
Xiantao9220.299158.529031.929123.909204.49Loudi13,046.6712,745.5812,755.7912,731.7312,506.80
Qianjiang9365.869398.269389.049339.609335.72Yongzhou13,335.2413,247.6713,115.4213,172.2513,177.28
Tianmen9502.959481.959467.319407.459383.53Shaoyang13,452.5213,341.1713,288.8813,321.3313,258.33
Xiaogan10,118.9410,111.0610,044.3410,119.0310,028.18Fuzhou13,501.9413,498.9413,518.1813,403.0813,405.10
Jingmen10,880.2310,919.3410,816.5810,830.2510,765.21Zhuzhou13,513.8113,608.0213,385.1413,201.7213,148.05
Huangshi11,085.8411,197.2611,092.4010,913.2410,780.47Jian13,584.4113,564.0213,560.5513,379.2113,275.14
Yueyang11,382.4411,419.3511,361.8011,330.5711,422.19Yichang13,629.0713,711.9113,591.3113,518.6813,546.60
Huanggang11,535.5611,620.6911,628.7311,665.9611,602.40Jingdezhen13,696.9113,676.1013,619.9013,383.2313,297.37
Xiangyang11,731.8311,841.5711,745.4911,786.9811,761.93Pingxiang13,904.3313,829.4813,591.0613,347.9313,213.22
Changde11,845.7411,820.7611,813.8611,763.8411,722.31Chenzhou13,936.2813,815.5513,704.4513,748.1813,701.44
Suizhou11,951.8612,059.4711,928.9312,164.8812,003.22Shiyan13,956.8614,069.3114,054.9014,124.0414,125.95
Hengyang12,048.8212,083.3511,818.6811,828.6811,801.49Xiangxi13,994.2314,085.0614,146.8514,169.6914,193.12
Yingtan12,077.5912,098.9112,066.0911,942.0011,937.12Ganzhou14,168.3014,165.5614,191.3414,085.6013,974.37
Xiangtan12,142.1812,058.2511,868.7211,749.4411,731.76Zhangjiajie14,237.6514,326.7914,172.9114,131.0914,297.71
Jiujiang12,222.8312,261.9112,288.4712,168.8112,095.92Huaihua14,330.2814,290.3314,184.3514,168.5114,232.12
Yiyang12,290.7812,283.6912,247.3212,127.4412,110.46Enshi14,390.5314,555.4714,547.9114,356.8114,291.06
Xianning12,580.9112,611.1612,500.7312,555.8912,528.32Shennongjia15,175.4315,210.9315,217.7915,202.5515,191.83
Table 10. Detection of each driving factor and its significance.
20002005201020152020
q Valuep Valueq Valuep Valueq Valuep Valueq Valuep Valueq Valuep Value
Precipitation0.0330.0000.0320.0000.0320.0000.3110.0000.0320.000
Temperature0.1210.0000.1280.0000.1310.0000.1300.0000.1330.000
Slope0.4120.0000.4170.0000.4190.0000.4110.0000.4050.000
DEM0.4090.0000.4090.0000.4100.0000.4070.0000.4000.000
Soil0.2720.0000.2640.0000.2580.0000.2530.0000.2520.000
NDVI0.2330.0000.2410.0000.2500.0000.2640.0000.2740.000
GDP0.1980.0000.2050.0000.2100.0000.2070.0000.2080.000
population0.2210.0000.2280.0000.2300.0000.2260.0000.2270.000
Night light0.2490.0000.2610.0000.2700.0000.2780.0000.2840.000
Table 11. Comparison of carbon stocks by scenario in 2035 (unit:106 t).
Type of
Land Use
20202035
Natural Development ScenarioEcological Protection ScenarioCultivated Land Protection ScenarioUrban Development Scenario
Cropland1973.20 1969.48 1928.34 2041.99 1961.34
Forest5023.53 4962.24 5067.29 4861.99 4959.85
Grassland3.02 1.95 2.68 2.18 1.93
Water70.27 70.27 71.42 70.27 70.27
Impervious70.21 87.93 70.46 84.29 91.85
Barren0.06 0.04 0.06 0.05 0.04
Total carbon stocks7140.19 7091.91 7140.25 7060.77 7085.30
Mean carbon stocks (t/km2)12,644.25 12,558.76 12,644.34 12,503.61 12,547.02
Disclaimer/Publisher’s Note: The statements, opinions and data contained in all publications are solely those of the individual author(s) and contributor(s) and not of MDPI and/or the editor(s). MDPI and/or the editor(s) disclaim responsibility for any injury to people or property resulting from any ideas, methods, instructions or products referred to in the content.

