Abstract
[Objective] To quantify key ecosystem services within the Dongting Lake region, clarify the trade-off/synergy relationships, and detect the driving factors in order to support the ecological sustainable development of the Dongting Lake region. [Methods] Using the InVEST model, taking the area around Dongting Lake as the study area, four ecosystem services including water yield, carbon storage, soil conservation, and habitat quality were quantitatively assessed. Interdependencies between ecosystem services were assessed using correlation analysis to quantify trade-offs/synergies, and the geodetector model was used to detect their driving factors. [Results] (1) From 2000 to 2020, the soil retention service and water yield service in the Dongting Lake area showed an increasing trend over time. The total water yield increased from 4.93 × 10¹⁰ m3 to 6.71 × 10¹⁰ m3, while the total soil retention increased from 4.46 × 10⁹ t to 5.77 × 10⁹ t; habitat quality and total carbon storage continued to decline, with habitat quality decreasing from 0.6906 to 0.6785 and carbon storage decreasing from 1.480 × 10⁹ t to 1.476 × 10⁹ t. (2) In the study area, significant synergistic effects existed between carbon storage and habitat quality, carbon storage and soil retention, carbon storage and water yield, habitat quality and soil retention, and soil retention and water yield. However, there was a significant trade-off relationship between habitat quality and water yield. (3) During the study period, ecosystem service trade-offs and synergy relationships in the Dongting Lake area were jointly influenced by natural factors and human activities. Ranked by the magnitude of driving factor influence, they were land use type, land use intensity, vegetation coverage, temperature, and nighttime light. [Conclusions] Synergies dominated the ecosystem services in the research region, and the influence of natural factors behind them was greater than that of human activities. These research conclusions offer a scientific foundation for the institutional construction of the ecological compensation mechanism in the Dongting Lake basin.
1. Introduction
Natural ecosystems offer humans various direct and indirect advantages, known as ecosystem services (ESs) [1], encompassing various aspects such as food supply, water resources, and climate regulation. They constitute an integrated complex of multiple services [2]. Research methodologies include cartographic representation [3], statistical analysis [4,5], scenario assessment [6], model simulation [7], among others.
With the advancement of research, the academic community has gradually categorized the interrelationships among ecosystem services into three types: trade-off relationships, synergistic relationships, and neutral associations [8]. When the synergy/trade-off relationships among ecosystem services differ significantly, they may lead to ecosystem imbalance, sharp declines in biodiversity, weakened carbon sequestration capacity, and long-term socioeconomic losses. During recent decades, trade-off/synergy relationships in ecosystem service research has increased. Using Pearson correlation analysis [9], Yuchun Wang quantitatively assessed the trade-off and synergy relationships among five typical ecosystem services in the Wanjiang urban belt, finding that synergistic effects dominated among the ecosystem services in the study area. Bradford et al. [10] introduced the root mean square deviation (RMSD) to address the complexity and imbalance issues among different ecosystem services. However, none of these studies analyzed the underlying driving factors behind the trade-off and synergy relationships.
Research on driving factors can reveal the evolutionary mechanisms of ecosystem services [11]. Therefore, many researchers have begun investigating the driving factors behind trade-off and synergy relationships. For instance, Wen Wanqin et al. [12] employed a geographically weighted regression (GWR) model to examine the constraining relationships between key driving factors and the composite ecosystem service index. Unlike previous studies focusing solely on trade-offs and synergies, this research identified critical thresholds of ecosystems by analyzing driving factors, subsequently proposing regional ecological security zoning schemes and targeted optimization strategies. Recently, the geographical detector method has been extensively utilized in driving factor analysis due to its strong capability in handling categorical variables and its intuitive, efficient the interpretation of results. For example, Gao Lin et al. [13] investigated the spatiotemporal evolution of landscape ecological risks over 30 years in Beijing’s ecological conservation zone using the geographical detector model to analyze the driving effects of natural and anthropogenic factors. Similarly, Wang Jiaqi et al. [14] applied the geographical detector to understand the spatial distribution patterns and driving factors of ecosystem services, finding that natural factors had a dominant influence on the spatial distribution of ecosystem services in the study area, with slope exhibiting the strongest explanatory power for the spatial distribution of soil retention services.
The Dongting Lake area, located in the central Yangtze River area, serves as a crucial wetland ecosystem and species gene pool in China. This region performs multiple ecological functions, including flood regulation of the Yangtze River, water purification, and biodiversity maintenance, while simultaneously supporting agricultural production known as China’s “land of fish and rice”. Although existing studies have accumulated research on ecosystem services around the Dongting Lake area, current findings still present limitations. Yang Jun et al. [15] systematically assessed four ecosystem services from 2005 to 2018 using the InVEST model and analyzed trade-off/synergy relationships among services. However, the 13-year period may be insufficient to capture complete ecological evolution cycles, and data timeliness is inadequate with the study ending in 2018. While Wang Rong et al. [16] extended the research period to 2000–2020, their focus on the relationship between ecosystem service values and farmers’ livelihoods leaves room for deepening research on key ecosystem service trade-offs/synergies. Neither study thoroughly examined the intrinsic mechanisms nor driving factors behind changing trade-off/synergy relationships of ecosystem services in the Dongting Lake area. Therefore, this study takes the Dongting Lake area as the research object, quantitatively assessing four ecosystem services: Water Yield (WY), Carbon Storage (CS), Soil Retention (SR), and Habitat Quality (HQ) from temporal, spatial, and land use type perspectives to reveal driving mechanisms. The InVEST model was employed to evaluate four key ecosystem services in the Dongting Lake area from 2000 to 2020, analyzing their spatiotemporal characteristics. Correlation analysis was conducted to examine pairwise correlations, spatial trade-offs, and trade-off intensity among the four services, revealing trade-off and synergy effects. Based on frequency statistics, driving factors were chosen from natural environment and human activities [17], and the driving factors and their influence levels behind trade-off/synergy relationships were explored using the geographical detector model.
This study addresses three key problems: (1) How do the four ecosystem services evolve in spatiotemporal trends and spatial distribution patterns during the study period? (2) For each ecosystem service pair, what is the nature (trade-off/synergy) and magnitude of their relationships? (3) What are the factors influencing these trade-off/synergy relationships?
This research will help scientifically quantify the total ecosystem services in the Dongting Lake area, enhancing comprehension of ecosystem functioning; it will examine these services’ trade-offs/synergies relationships, and by rationally utilizing synergistic relationships, can optimize the integrated ecosystem service benefits while effectively predicting and mitigating potential adverse impacts, thereby reducing their harm to the ecological environment. The analysis will likewise detect significant factors governing these trade-offs/synergies, facilitating efficient bioecological governance, and supporting sustainable growth of economic systems and natural ecosystems in the Dongting Lake area.
2. Methods and Materials
2.1. Research Region
The Dongting Lake region (Figure 1), situated in central-south China [18], spans the geographical coordinates of 110°40′–113°10′ E and 28°30′–30°20′ N. The area experiences an annual average temperature range of 15.6–17.7 °C and receives an annual precipitation of 1200–2000 mm. The study area encompasses the surrounding regions of Dongting Lake, including Changde City, Yueyang City, and Yiyang City in Hunan Province; Wangcheng District and Yuelu District of Changsha City in Hunan Province; Honghu City in Hubei Province. Characterized by relatively flat topography and fertile red soils conducive to plant growth, the lake region represents a major agricultural production area, with forest land covering approximately 30% of the total area. As China’s second largest freshwater lake (mean water surface area: 2820 km2), it constitutes a pivotal zone supporting Yangtze River’s watershed ecosystem recovery and species conservation [19].
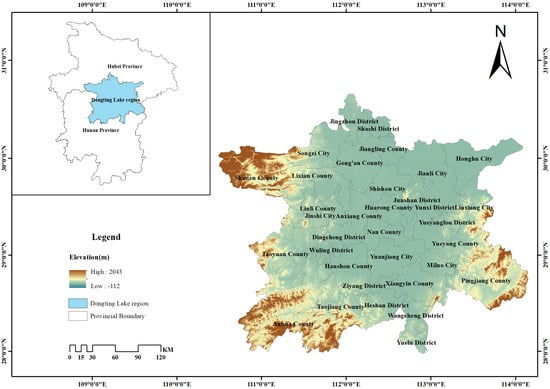
Figure 1.
Overview of the Dongting Lake area.
2.2. Data Acquisition and Processing
- (1)
- DEM data. The 30 m resolution raster DEM data was acquired from the ASTGTM2 dataset (Release date: 6 January 2015), which is accessible through the Geospatial Data Cloud (http://www.gscloud.cn/, accessed on 10 November 2024). After preprocessing steps such as mosaicking, projection, and clipping, DEM data of the research region was gathered. Smoothing filters and median filtering were applied to remove outliers in the DEM data.
- (2)
- Land use data. From the Resource and Environmental Science and Data Center (https://www.resdc.cn/, accessed on 10 November 2024 ) of the Chinese Academy of Sciences, the land use data were acquired. Through a multi-stage remote sensing interpretation process (including image preprocessing and supervised classification), the study created 30 m resolution land use data for the Dongting Lake region.
- (3)
- Soil data. From the National Cryosphere Desert Data Center (https://www.crensed.ac.cn/portal/, accessed on 10 November 2024), the soil data were acquired, comprising soil type, soil texture, and soil organic carbon content.
- (4)
- Meteorological data. This research retrieved two decades (2000–2020) of meteorological records, consisting of precipitation and potential evapotranspiration measurements, from the National Earth System Science Data Center (http://www.geodata.cn, accessed on 10 November 2024), The 1 km resolution dataset included annual precipitation, potential evapotranspiration, and mean annual temperature.
- (5)
- The biophysical parameters for each model were calculated and set based on previous literature and studies. Sub-watershed boundaries were derived using hydrological analysis tools in ArcMap.
2.3. Methods
2.3.1. Technical Approach
After preliminary data processing using ArcGIS 10.8 software, this research first utilizes the InVEST model [20] to conduct spatial quantification analysis of four critical ecosystem services (ESs) in the research region: SR, WY, HQ, and CS. Subsequently, SPSS 28 software [9] is used to perform pairwise correlation analysis to identify these services’ trade-off/synergy relationships, while GeoDA 1.22 software [21] is applied to investigate their spatial distribution patterns. Finally, the geographical detector [14] method is utilized to ascertain the driving factors behind these trade-off/synergy relationships. The technical workflow is illustrated in Figure 2 below.
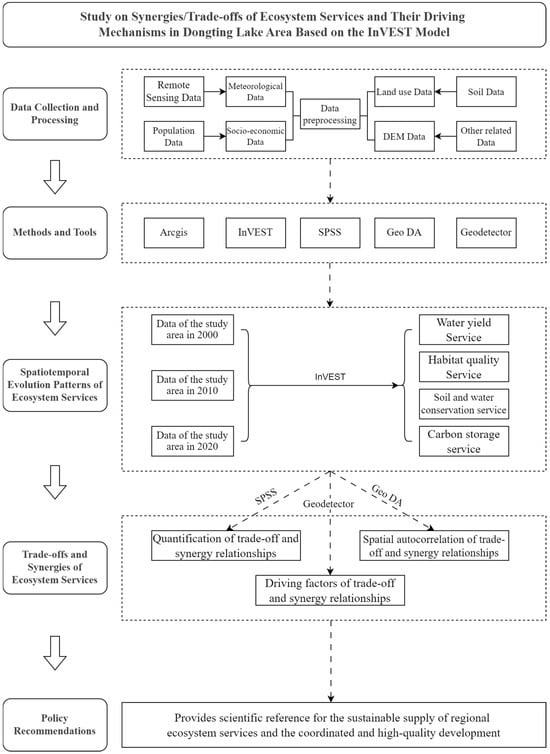
Figure 2.
Technical framework showing the research workflow of ESs.
2.3.2. Methods for ES Evaluation
- WY service
The InVEST WY module calculates WY depth by subtracting the annual actual evapotranspiration (AET) from precipitation (P) across the study watershed on an annual basis [22]. The formula is expressed as
where (annual WY), (annual precipitation at grid x), and (annual actual evapotranspiration at grid x) are the key variables.
In Equations (1) and (2), represents the annual actual evapotranspiration (mm) at pixel x; is a dimensionless empirical soil parameter. In Equation (4), is defined as the Budyko dryness index, while Z (ranging from 1 to 30) is a seasonal constant, and indicates the soil’s available water capacity [23], determined by soil texture and soil depth, ranging from 0 to 1. With potential evapotranspiration (mm) designated as and the vegetation evapotranspiration coefficient as [24].
(1) Potential evapotranspiration
Obtained by combining the actual conditions of the research area data from the National Earth System Science Data Center and the recommended calculation formula of the InVEST model, the formula is as follows:
In Equation (5), is the potential evapotranspiration (mm); is the average daily temperature difference (°C); is the daily temperature difference (°C); P denoting daily precipitation (mm), representing solar radiation (MJ·m−2·day−1).
(2) Biophysical coefficients table
Biophysical table of different land use types in South Central China, as shown below in Table 1.

Table 1.
Biophysical coefficients of six land use types.
(3) Seasonal constant Z
Through repeated adjustments and corrections based on actual WY data from the Hunan and Hubei Water Resources Bulletins and model results, it was finally determined that when the seasonal constant Z value is 1, the model results most closely match the actual data.
(4) Plant available water content
A nonlinear regression model served to estimate soil available water content, with the computational formula detailed in Equation (6):
In the equation, , and correspond to the contents of clay particles, sand particles, silt particles, and organic matter, respectively.
- 2.
- Soil retention service
The calculation principle of the SDR module (sediment delivery ratio module) [25] is as follows: when there is no vegetation cover on the surface, the potential soil erosion is estimated by integrating topographic and climatic factors according to Equation (7). When vegetation cover exists, the Universal Soil Loss Equation (USLE) serves to quantify actual soil loss, as shown in Equation (8).
In these equations, R stands for rainfall erosivity (MJ·mm/(hm2·h·a)); P (0–1) denotes the support practice factor; C (0–1) represents the cover and management factor; LS indicates the slope length-gradient factor; K [26] (t·hm2·h/(hm2·MJ·mm)) is the soil erodibility factor.
Finally, based on the calculation results of Equations (7) and (8), the SR amount can be obtained using Equation (9):
where USLE quantifies actual soil erosion (t/(hm2·a)); SD represents the SR amount (t/(hm2·a)); RKLS indicates potential soil erosion (t/(hm2·a)).
The erosivity is primarily calculated using annual rainfall data, with the calculation method as follows Equation (10):
In the equation α3 and β3 are model parameters with values of 0.0534 and 1.6548, respectively; j represents the corresponding year of rainfall; rainfall is denoted as P (mm); rainfall erosivity is denoted as R (MJ·mm·hm−2·h−1).
The soil erodibility factor K is defined as a measure of soil’s susceptibility to erosion processes:
In Equations (11) and (12), the mass fraction of sand is denoted as S, the mass fraction of silt as L, and the mass fraction of clay as A; the mass fraction of organic matter divided by 1.724 yields the mass fraction of organic carbon, denoted as B. Values of P and C corresponding to various land use types were primarily derived from previous studies by Sharp [27], Liang [28], as shown in Table 2.
Table 2.
Land use type-specific soil retention practice factor P and vegetation cover factor C values.
- 3.
- HQ Service
HQ indices are computed by the HQ module through evaluating different landscape types’ sensitivity and the degree of external threats [27]. The calculation method is shown in Equation (10):
In Equation (8), represents HQ at grid x in land cover type j; the half-saturation coefficient is denoted by k, typically set to 0.5; indicates the habitat suitability for land cover type j [29]; z serves as the model’s default normalization constant [30] with a typical value of 2.5.
The model uses two distance decay functions to describe how stress factors attenuate with distance, as shown in Equations (9) and (10):
In these equations, : stress factor r’s maximum impact radius; : the Euclidean distance between grid cells x and y.
(1) Threat Factors
The degree of human activities’ impact on land use types mainly determined the selection of threat factors, determined through a synthesis of the previous literature. Three land use types were identified as threat factors: cropland, construction land, and unused land. The resulting threat factor data are presented in Table 3.
Table 3.
Threat factors.
(2) Habitat Sensitivity
Model manuals and prior studies were referenced, combined with the study area’s actual conditions, and the threat factors and habitat sensitivity parameters to these threats were determined. This resulted in the development of a habitat suitability and threat sensitivity presented in Table 4 for the Dongting Lake area [31].
Table 4.
Habitat suitability and sensitivity to threat factor.
- 4.
- CS Service
CS is mainly determined including soil organic carbon, dead organic carbon, aboveground biomass, and belowground biomass [32]. The total CS is the sum of these four basic carbon pools, calculated as follows (11):
In the equation: C is the total CS (t/hm2); is the aboveground biomass CS; is the belowground biomass CS; is the dead organic CS; is the soil organic CS.
Table 5 presents a carbon density table modified based on previous research findings [33]. Since dead organic CS is highly complex to measure and has a minimal impact on the experiment, it has not been considered.
Table 5.
CS of three carbon pools.
2.3.3. Methods for ES Trade-Offs/Synergy Analysis
- Correlation Analysis Method
Correlation analysis can describe the interaction and degree of closeness among multiple variables, with its numerical values directly reflecting the strength of ES’s trade-off/synergy relationships [34]. This study randomly sampled to determine the sample size and conducted correlation analysis using SPSS software. The specific calculation is shown in Equation (12):
In the equation is the correlation coefficient; n is the sample size; and are the ith values of x and y, respectively; and are the mean values of x and y. The research categorized correlations as: weak (0.1 ≤ r < 0.3), moderate (0.3 ≤ r < 0.5), strong (r ≥ 0.5).
- 2.
- Spatial Autocorrelation Analysis
This study conducted a raster-based statistical analysis of various ESs at a 1 km × 1 km grid scale. Using GeoDA software, we employed bivariate spatial autocorrelation analysis to determine ES’s trade-off and synergy relationships in spatial distribution. A positive Moran’s I index indicates synergistic spatial relationships between two ESs, while a negative value suggests trade-off relationships.
- 3.
- Geodetector Model
This study adopted the geodetector model [35] and selected influencing factors from both natural environment and human activity aspects (the key driving factors primarily include twelve variables: air temperature, precipitation, land use type, soil type, elevation, slope gradient, land use intensity, vegetation coverage, evapotranspiration, population density, gross regional product, and nighttime light data) based on frequency statistics [36] to detect and identify the influencing factors of ES’s trade-off/synergy relationships. The geodetector model formula is
where q (ranging 0–1) quantifies factor detection power, with constant h = 1. The variance of Y values in the entire region is denoted by ; represents variance within stratum h; N and indicate total units in the region and stratum h, respectively; n corresponds to variable stratification.
3. Results
3.1. Spatiotemporal Distribution of Ecosystem Services in Dongting Lake Region
Based on the InVEST model modules (WY, SR, HQ, and CS), the total value of ESs in the study area was calculated (Table 6). Spatiotemporal distribution maps of each service were generated through analysis (Figure 3 and Figure 4).
Table 6.
Variations in ESs of Dongting Lake (2000–2020).
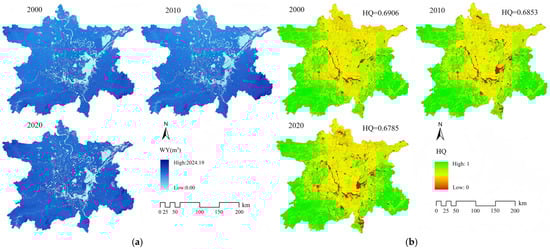
Figure 3.
Distribution of space–time dynamics in WY (a) and HQ (b) in Dongting Lake region from 2000 to 2020.
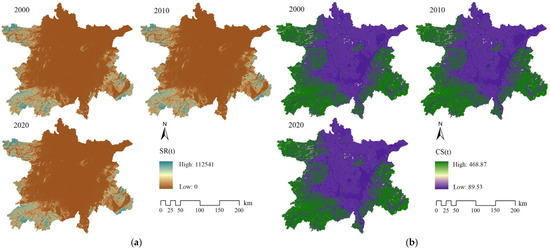
Figure 4.
Distribution of space–time dynamics in SR (a) and CS (b) in the Dongting Lake area from 2000 to 2020.
From 2000 to 2020, the WY in the research region showed an overall increasing trend. As shown in Table 6, WY enhanced from 4.93 × 10¹⁰ m3 (the 2000s) to 6.71 × 10¹⁰ m3 (the 2020s). Spatially, the WY services in the Dongting Lake region exhibited distinct zonal differentiation characteristics, presenting a geographic distribution pattern of “low in the center and high in the periphery”. The central area of the region is occupied by Dongting Lake where the large water surface area and high evaporation rates contribute to this heterogeneous spatial distribution in WY. Figure 3a displays the spatial distribution pattern.
As illustrated in Figure 3b, over the 20-year period, HQ exhibited an overall declining trend. As shown in Table 6, significant changes occurred in the Dongting Lake area from 2000 to 2020, with HQ declining from 0.6906 to 0.6785. The most pronounced decline occurred during 2010–2020, with a reduction of 0.0068 (approximately 0.9923%). Spatially, high HQ areas were primarily allocated in mountainous regions surrounding the study area, where forest land dominates. Conversely, regions with degraded HQ aggregate in central and northern plains, characterized by cultivated land and construction land, where intensive human activities resulted in poorer habitat conditions.
In terms of SR, the research region exhibited a rising tendency in total SR services. According to Table 6, the SR increased from 4.46 × 10⁹ t (the 2000s) to 5.77 × 10⁹ t (the 2020s), indicating reduced soil erosion during this period. Spatially, according to Figure 4a, areas with high SR values were primarily woodland, where abundant arboreal vegetation created favorable soil stabilization conditions. In contrast, lower SR levels were principally distributed in mid-latitude and northern sections of the research region, primarily composed of agricultural and urbanized areas. The loose soil texture and intensive human activities exacerbated soil loss in these regions, particularly in areas lacking vegetation protection measures [37].
The CS services in the Dongting Lake region exhibited a decreasing tendency both in total and average terms, with consistent spatiotemporal patterns. As indicated in Table 6, the total CS reduced from 1.48 × 10⁹ t in 2000 to 1.47 × 10⁹ t in 2020. Spatially, regions with enhanced CS capacity were primarily distributed in mountainous areas surrounding the research region, particularly in southeastern, southwestern, and northwestern sectors (Figure 4b). These areas are characterized by dense forest coverage. In contrast, areas exhibiting reduced carbon sequestration potential showed spatial aggregation in central and northeastern zones where land use is dominated by cultivated land, water bodies, and construction areas [38], resulting in diminished CS potential.
3.2. Analysis of Trade-Offs/Synergies Among Ecosystem Services in the Dongting Lake Region
3.2.1. Correlation Analysis of Ecosystem Services
This research utilizes the correlation coefficient method to analyze interaction relationships between different ESs, utilizing random sampling for sample selection to determine ES’s trade-off and synergy relationships. All analyses showed statistically significant results (p < 0.05).
Figure 5 displays the trade-off and synergy relationships between different ESs during 2000–2020. As can be seen from Figure 5, CS and HQ maintained a consistently strong synergistic relationship; CS and HQ showed moderate correlations with SR; the relationship between CS and WY transitioned from moderate to weak and back to moderate correlation; while SR and WY maintained a weak correlation that was relatively unstable.
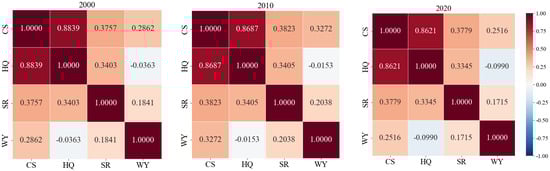
Figure 5.
Tradeoffs/synergies between different ecosystem services from 2000 to 2020 (p < 0.05).
The trends showed that during 2000–2020, the synergistic relationship between CS and HQ was the strongest, although its intensity exhibited a declining trend. The synergistic relationship between CS and SR generally exhibited an initial rise and subsequent decline. The synergistic relationship between CS and WY followed a similar pattern to that between CS and SR but showed an overall decreasing trend. The synergistic relationship between HQ and SR decreased slightly, but the magnitude of decrease was small. The trade-off between HQ and WY gradually declined while their synergistic relationship strengthened, indicating that over time, HQ and WY were progressively developing toward a more synergistic relationship. The correlation between SR and WY was synergistic but relatively weak, unstable, and showed an overall declining trend.
3.2.2. Spatial Trade-Offs and Synergies of Ecosystem Services
Through GeoDA software, the research implements bivariate spatial autocorrelation for identifying geographically weighted ES’s trade-off/synergy relationships. Through the local spatial autocorrelation analysis of different ESs (Figure 6), we obtained statistical data on local autocorrelation types for various ESs, as shown in Figure 7.
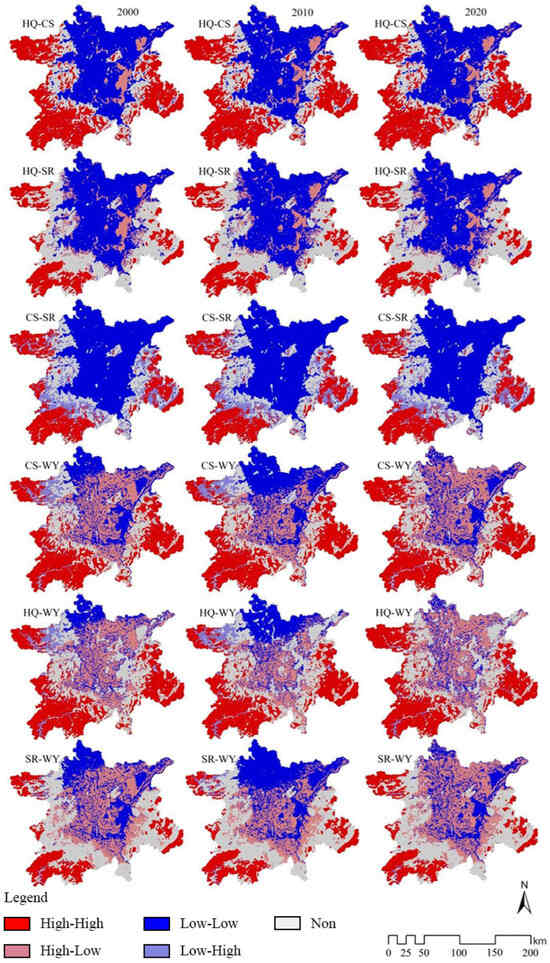
Figure 6.
Local spatial autocorrelation of bivariate for different ESs from 2000 to 2020.
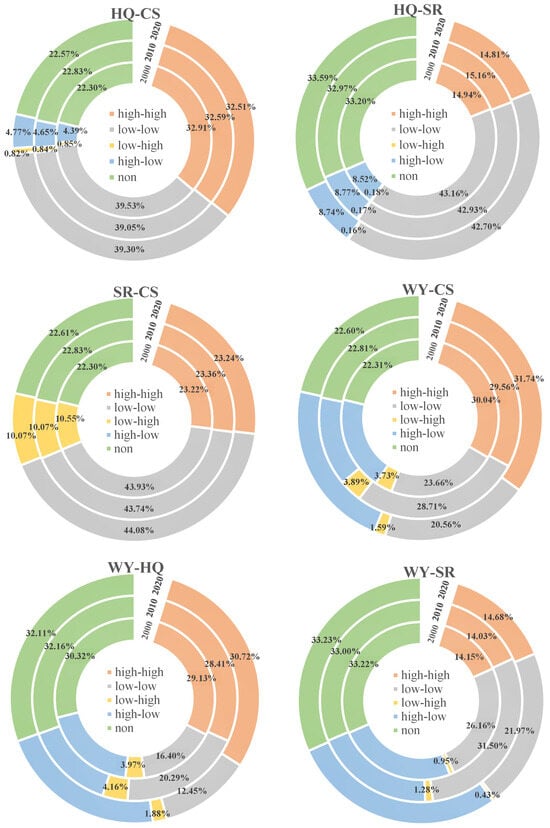
Figure 7.
Statistics of local autocorrelation types of different ecosystem services from 2000 to 2020.
The results demonstrate that, during 2000–2020, both trade-off (high-low or low-high) and synergistic (low-low or high-high) relationships coexisted spatially between different ESs, with synergistic relationships being predominant. Spatially, the ES’s trade-off and synergistic relationships exhibited spatial similarity. Synergistic relationships were primarily concentrated in central, northwestern, southwestern, and southeastern regions, while trade-off relationships were mainly distributed in central areas, interwoven with synergistic relationships.
Specifically, during 2000–2020, the synergistic areas between HQ and CS accounted for approximately 72.45%, 71.65%, and 71.81% of the total area, respectively, showing an overall descending tendency with progressive diminution magnitude of about 0.88%. Conversely, their trade-off areas represented merely 5.25%, 5.51%, and 5.60%, respectively, demonstrating an increasing trend with a growth rate of approximately 6.66%.
HQ and SR were also predominantly characterized by synergistic relationships, though showing an overall declining trend. As shown in Figure 6, the proportions were 58.10%, 58.08%, and 57.78% across different periods, with a decrease in magnitude of approximately 0.55%.
The relationship between SR and CS exhibited similar patterns to those between HQ and SR, but their trade-off relationship moderated during the study period while the synergistic proportion gradually increased by about 0.27%.
Furthermore, WY maintained predominantly synergistic relationships with CS, HQ, and SR. However, spatially, their trade-off areas accounted for relatively large proportions, averaging 22.67%, 22.67%, and 26.03%, respectively. During the study period, the trade-off proportions between WY and CS, HQ, and SR all showed increasing trends, rising by 4.59%, 2.40%, and 13.82%, respectively.
Spatially, the ES’s trade-off/synergistic relationships displayed spatial similarity, with synergistic relationships mainly clustered in central, northwestern, southwestern, and southeastern areas, while trade-off relationships were predominantly located in central regions, interwoven with synergistic relationships (Figure 7).
3.3. Driving Factors of Ecosystem Service Trade-Offs
Factors influencing ESs and their trade-off/synergy dynamics primarily comprise two categories: natural environmental factors (such as elevation, climate, and slope) and societal intervention factors (such as socioeconomic development, policies, and institutions). Accordingly, building upon the existing literature and employing frequency statistics analysis, this research identifies key factors across natural environmental and human activity dimensions. The factor detector in the geographical detector model was applied to identify key drivers of trade-off/synergy relationships in different ESs (Table 7). A higher determinant power (q-value) of a factor indicates its stronger influence on the ES’s trade-off/synergy relationships.
Table 7.
Determinant q-values of factors influencing ecosystem service trade-offs/synergies.
Among them, HQ-CS trade-off influencing factors (ordered by decreasing impact), including land use type, land use intensity, vegetation coverage, nighttime light, elevation, and population density, with determinant power q-values of 0.421, 0.385, 0.342, 0.311, 0.268, and 0.263, respectively, all exceeding 0.2, indicate that these factors play a decisive role in the trade-off relationship, while slope yields a q-value of 0.125 and precipitation reaches merely 0.156, below 0.2, indicating that these two factors have relatively small influence on the trade-off relationship between HQ and CS. HQ and SR, land use type, vegetation coverage, land use intensity, nighttime light, and temperature have a greater influence on the trade-off relationship. In the trade-off relationship between CS and SR, land use type, land use intensity, vegetation coverage, temperature, and soil type play more significant roles in their trade-off relationship. Land use type, land use intensity, temperature, vegetation coverage, population density, and precipitation are the main influencing factors for the trade-off relationships between WY and CS, HQ and SR.
Overall, during the study period in the Dongting Lake region, the key drivers of ES’s trade-offs/synergies were closely related to land use type, land use intensity, vegetation coverage, temperature, and nighttime light.
4. Discussion
4.1. Spatiotemporal Analysis of Dongting Lake Region’s ES
From 2000 to 2020, the WY in the research region showed an annual expanding trend, exhibiting a distinct “low in center, high in periphery” spatial pattern. This distribution is closely associated with precipitation–evapotranspiration characteristics: the peripheral mountainous areas with dense vegetation experience higher precipitation but lower evaporation, while the central water-dominated regions show stronger lake surface evaporation. Such spatial configuration is commonly observed in global lake-surrounding areas, as evidenced by Yang Xiaofang’s consistent findings in Poyang Lake studies [39].
The HQ index showed a continuous decline during the research period, primarily attributed to intensified human activities. Areas with low values were predominantly concentrated in cultivated and construction lands across the central-northern plains, which experienced significant human disturbance. These findings align with Yang Keke’s research results in southern Jiangxi [40].
Areas with high SR values were limited in spatial terms, primarily clustered in the southwest, northwest, and southeast corners of the study area. These zones were dominated by forested lands with dense arboreal vegetation that effectively stabilized soils. This finding corroborates Liang Ziao’s Qinghai study demonstrating maximal SR per unit area in arboreal forests [41]. Since the early 2000s, Hunan’s Grain-for-Green Program in the Dongting Lake region has significantly enhanced SR capacity through continuous forest expansion, increasing it by 1.31 × 10⁹ t (2000–2020), confirming the policy’s ecological effectiveness.
In terms of CS, the study period witnessed an overall declining trend in total CS with a cumulative reduction of 1.14 × 10⁷ t. Areas with higher CS capacity and stronger carbon sequestration potential were mainly situated in the peripheral mountainous areas of research regions. These zones, characterized by dense forest coverage, maintained elevated CS levels through enhanced photosynthetic carbon fixation. These findings align with Cheng Jiahua’s research [42], which similarly identified forested areas as exhibiting the highest CS density per unit area, thereby validating our conclusions.
4.2. ES Trade-Offs and Synergies Analysis in Dongting Lake Region
During the period of 2000–2020, the study area showed positive correlations between CS-WY, SR-WY, CS-HQ, CS-SR, and SR-HQ, indicating synergistic relationships among these ESs. A negative correlation was observed between HQ and WY, showing trade-off patterns.
From 2000 to 2020, CS and HQ services in the research region demonstrated the strongest synergistic relationship, with their correlation coefficient reaching a peak value of 0.8839. This strong interdependence likely stems from the fact that both CS and HQ services are significantly influenced by land use types. As highlighted in Niu Xiaogeng’s research [43], changes in land use types can simultaneously exert similar impacts on both CS and HQ services, thus establishing a synergistic interaction of the two ESs.
From 2000 to 2020, the WY-HQ trade-off intensity declined while their synergistic relationship strengthened. This transition may be attributed to WY’s regulatory role in Dongting Lake’s water levels. Zhou’s research [44] demonstrates that the population of wetland species, particularly migratory waterbirds, shows significant correlation with Dongting Lake’s water levels. This occurs because water level fluctuations directly affect the distribution of suitable habitats. When WY decreases, resulting in lower lake levels, the exposed lakebed area becomes altered. This negatively impacts the development of annual wetlands (e.g., Carex wetlands), reducing suitable foraging areas and consequently diminishing wintering habitats for birds and other species. Ultimately, the HQ decreased due to these changes.
In conclusion, these two cases demonstrate that both the significant synergistic effect between CS and HQ and the dynamic trade-off/synergy relationship between WY and HQ are substantially influenced by land use types. The former originates from their similar responses to land use changes, while the latter is directly related to land use transformations caused by wetland area reduction, collectively revealing that land use type serves as an underlying mechanism affecting ES’s trade-offs and synergies.
4.3. Analysis of Driving Factors for Trade-Offs/Synergies in Ecosystem Services in Dongting Lake Region
The comprehensive discussion (Section 4.2) and the determinant power analysis (q-values in Table 7) collectively demonstrate that the key influencing factors of the ES’s trade-offs and synergies in the Dongting Lake area primarily include land use type, land use intensity, vegetation coverage, temperature, and nighttime light data. Among these factors, land use type exhibited the strongest influence, which is principally attributed to the fact that land use types primarily determine ES estimations. Both land use type and intensity directly determine the magnitude of ESs [45]. Secondly, vegetation coverage serves as a critical factor affecting soil and water resources, while also playing a pivotal role in maintaining ecosystem stability. Temperature influences ES functionality by altering surface temperatures and thereby affecting vegetation growth and development [46], a finding corroborated by Xu’s research. Nighttime light, as a comprehensive indicator of human activities, reflects the intensity of anthropogenic disturbances and exerts significant effects on ESs. In summary, the trade-off and synergy relationships among ESs are jointly driven by natural environmental factors and societal interventions. However, the effects exerted by natural environmental factors outweighs that of human activities.
4.4. Governance Recommendations for the Dongting Lake Basin
- Preserve high-value service zones and protect low-value areas: This study shows higher WY, HQ and CS in surrounding forested mountains versus lower values in central Dongting Lake, necessitating restricted intensive development in these mountainous forests. For low SR value zones in northern farmlands, the immediate prohibition of lake reclamation and control of disorderly farmland expansion are required.
- Implement zonal differentiated management to balance ES trade-offs: The central lake/wetland areas exhibit significant habitat–water yield trade-offs, requiring agroforestry systems and constructed wetlands with vegetative buffers to reconcile these services. In peripheral mountain synergy zones, enforce natural forest conservation to enhance soil–carbon synergies, replace logging with ecotourism, and provide economic compensation for regions with significant contributions to ecological protection.
- Prioritize natural restoration with regulated human activities: Given natural factors dominate but nighttime light intensity (indicating human activity) significantly influences trade-offs, we recommend controlling anthropogenic impacts by enforcing “Grain-for-Green” policies in high-nighttime-light-intensity urban/rural areas to curb the expansion of human activities.
These three recommendations—spatial planning (spatiotemporal distribution), zonal governance (trade-off synergies), and human activity regulation (driving factors)—form a systematic governance construct. With the implementation of ecological conservation policies such as farmland-to-forest and farmland-to-lake conversion in Dongting Lake, its water area will gradually expand, biodiversity will continuously improve, and ecosystem stability will be significantly enhanced, thereby achieving sustainable development.
4.5. Limitations and Future Prospects
The biophysical parameter settings, threat factor weight allocation, and CS estimation in Chapter 2’s methodology primarily rely on existing research findings, which may introduce subjective bias [44]. Future studies could incorporate quantitative models or measured data for comparative optimization to enhance objectivity. While this study employed geographical detectors to identify influencing factors of ES trade-offs/synergies, it only analyzed the spatiotemporal differentiation effects of individual factors without considering multi-factor interactions. Future research should comprehensively assess the impact of factor interactions on ES relationships to furnish a scientific basis for regional sustainable development.
5. Conclusions
This research utilized InVEST model, ArcGIS, SPSS, and GeoDA software to assess ES levels and their trade-off/synergy relationships in the Dongting Lake region during 2000–2020, while identifying key driving factors. The core results demonstrate that
- (1)
- During 2000–2020, the Dongting Lake region showed increases in WY and SR, but decreases in HQ and CS. Spatially, WY, HQ, and CS all exhibited a “high periphery-low center” pattern, with high-value areas concentrated in surrounding mountainous forest zones. In contrast, SR was dominated by low-value areas located in the central-eastern regions with intensive human activities.
- (2)
- The analysis of ES trade-off/synergy relationships demonstrates significant synergistic effects between CS and HQ/SR/WY, as well as between HQ-SR and SR-WY, while revealing a relatively weak trade-off between HQ and WY.
- (3)
- The trade-off/synergy relationships were jointly driven by natural and anthropogenic factors, with land use type being the most influential, followed by land use intensity, vegetation coverage, temperature, and nighttime light, where natural factors generally exerted greater impacts than human activities.
Author Contributions
Z.L.: Writing—original draft, data curation, validation, and visualization. J.H.: data curation, visualization. S.H.: Writing—review and editing. W.Z.: supervision. J.L.: supervision, funding acquisition. All authors have read and agreed to the published version of the manuscript.
Funding
This research was funded by the Hunan Provincial Graduate Research and Innovation Project (Grant No. LXBZZ2024187), the National Key Research and Development Program of China during the 14th Five-Year Plan Period (Grant No. 2022YFD2200505), and the Graduate Research and Innovation Project of Central South University of Forestry and Technology (Grant No. 2025CX01042).
Institutional Review Board Statement
Not applicable.
Informed Consent Statement
Not applicable.
Data Availability Statement
The original contributions presented in this study are included in the article. Further inquiries can be directed to the corresponding author.
Acknowledgments
We are very grateful to all those who assisted in the data collection and experimentation. We also thank the anonymous reviewers for their helpful comments and suggestions.
Conflicts of Interest
The authors declare that they have no known competing financial interests or personal relationships that could have appeared to influence the work reported in this paper.
References
- Daily, G.C. Nature’s Services: Societal Dependence on Natural Ecosystems; Island Press: Washington, DC, USA, 1997. [Google Scholar]
- Costanza, R.; d’Arge, R.; de Groot, R.; Farber, S.; Grasso, M.; Hannon, B.; Limburg, K.; Naeem, S.; O’Neill, R.V.; Paruelo, J.; et al. The value of the world’s ecosystem services and natural capital. Nature 1997, 387, 253–260. [Google Scholar] [CrossRef]
- Haase, D.; Schwarz, N.; Strohbach, M.; Kroll, F.; Seppelt, R. Synergies, Trade-offs, and Losses of Ecosystem Services in Urban Regions: An Integrated Multiscale Framework Applied to the Leipzig-Halle Region, Germany. Ecol. Soc. 2012, 17, 102–123. [Google Scholar] [CrossRef]
- Jacobs, S.; Wolfstein, K.; Vandenbruwaene, W.; Vrebos, D.; Beauchard, O.; Maris, T.; Meire, P. Detecting ecosystem service trade-offs and synergies: A practice-oriented application in four industrialized estuaries. Ecosyst. Serv. 2015, 16, 378–389. [Google Scholar] [CrossRef]
- Li, B.Y.; Chen, N.C.; Wang, Y.C.; Wang, W. Spatio-temporal quantification of the trade-offs and synergies among ecosystem services based on grid-cells: A case study of Guanzhong Basin, NW China. Ecol. Indic. 2018, 94, 246–253. [Google Scholar] [CrossRef]
- Kubiszewski, I.; Costanza, R.; Anderson, S.; Sutton, P. The future value of ecosystem services: Global scenarios and national implications. Ecosyst. Serv. 2017, 26, 289–301. [Google Scholar] [CrossRef]
- Tian, Y.C.; Wang, S.J.; Bai, X.Y.; Luo, G.J.; Xu, Y. Trade-offs among ecosystem services in a typical Karst watershed, SW China. Sci. Total Environ. 2016, 566–567, 1297–1308. [Google Scholar] [CrossRef]
- Bennett, E.M.; Peterson, G.D.; Gordon, L.J. Understanding relationships among multiple ecosystem services. Ecol. Lett. 2009, 12, 1394–1404. [Google Scholar] [CrossRef]
- Wang, Y.; Ang, Y.; Zhang, Y.; Ruan, Y.; Wang, B. Identification of Ecological Functional Areas and Scenario Simulation Analysis of the Wanjiang Urban Belt from a Trade-Off/Synergy Perspective. Land 2025, 14, 444. [Google Scholar] [CrossRef]
- Bradford, J.B.; D’Amato, A.W. Recognizing trade-offs in multi-objective land management. Front. Ecol. Environ. 2012, 10, 210–216. [Google Scholar] [CrossRef]
- Shi, J.; Shi, P.J.; Li, X.H.; Wang, Z.Y.; Xu, A.K. Spatiotemporal changes and multi-scale influencing factors of ecosystem services in the Shiyang River Basin. Prog. Geogr. 2024, 43, 276–289. [Google Scholar] [CrossRef]
- Wen, W.Q.; Wang, Q.; Chen, T.T. Ecological security zoning by integrating ecosystem services and threshold effects of driving factors: A case study of Southwest China. Acta Ecol. Sin. 2024, 44, 3142–3156. [Google Scholar]
- Li, D.; Zhang, Y.; Gao, Y.; Duan, L.; Li, H.; Zhang, H.; Gao, Q.; Zhao, M.; Liu, Q. Coupling Land Use with Multiple Geographical Factors Drives the Evolution of Habitat Quality: Case Study from Resource-Exhausted City—Jiawang District, East China. Sustainability 2025, 17, 2954. [Google Scholar] [CrossRef]
- Wang, J.Q.; Xing, Y.Q.; Chang, X.Q.; Yang, H. Analysis of Spatial Distribution of Ecosystem Services and Driving Factors in Northeast China. Environ. Sci. 2024, 45, 5385–5394. [Google Scholar]
- Yang, J.; Zhou, P.Q.; Yuan, S.J.; Tan, X.; Lou, Z.F. Ecosystem services in Dongting Lake Eco-economic Zone based on InVEST model. Bull. Soil Water Conserv. 2022, 42, 267–272+282. [Google Scholar] [CrossRef]
- Wang, R.; Wang, J.; Chen, W. The Coordinated Development of Ecosystem Services and Farming Household Livelihood Security: A Case Study of the Dongting Lake Area in China. Sustainability 2023, 15, 11121. [Google Scholar] [CrossRef]
- Miao, Y.; Geng, C.; Ji, Y.; Wang, S.; Wang, L.; Yang, W. Understanding the Dynamics of PM2.5 Concentration Levels in China: A Comprehensive Study of Spatio-Temporal Patterns, Driving Factors, and Implications for Environmental Sustainability. Sustainability 2025, 17, 1742. [Google Scholar] [CrossRef]
- Yin, X.; Lu, Z.; Zhang, B. Study on the factors influencing ecological environment and zoning control: A study case of the Dongting Lake area. Front. Ecol. Evol. 2024, 11, 1308310. [Google Scholar] [CrossRef]
- Zhang, J.X.; Wang, X.B.; Xiong, J.X. Spatiotemporal evolution characteristics and influencing factors of ecological efficiency in Dongting Lake area. J. Cent. South Univ. For. Technol. 2025, 45, 201–208. [Google Scholar]
- Liu, Z.; Bi, H.; Zhao, D.; Guan, N.; Wang, N.; Song, Y. Determination of Fractional Vegetation Cover Threshold Based on the Integrated Synergy–Supply Capacity of Ecosystem Services. Forests 2025, 16, 587. [Google Scholar] [CrossRef]
- Anselin, L.; Syabri, I.; Kho, Y. GeoDa: An Introduction to Spatial Data Analysis. Geogr. Anal. 2006, 38, 5–22. [Google Scholar] [CrossRef]
- Donohue, R.J.; Roderick, M.L.; McVicar, T.R. Roots, storms and soil pores: Incorporating key ecohydrological processes into Budyko’s hydrological model. J. Hydrol. 2012, 436–437, 35–50. [Google Scholar] [CrossRef]
- Li, T.; Liu, Y.; Cai, Q.; Duan, X.; Li, P.; Ren, M.; Ye, Y. Water Stress-Induced Divergence Growth of Picea schrenkiana in the Western Tianshan and Its Forcing Mechanisms. Forests 2023, 14, 354. [Google Scholar] [CrossRef]
- Angelica, V.T.; Chetan, T.; Samuel, F.A. Progress in ecosystem services research: A guide for scholars and practitioners. Ecosyst. Serv. 2021, 49, 101267. [Google Scholar]
- Fatima, B.; Rachid, H.; Abdeldjalil, B.; Abdessalam, O.; Mohamed, B.; Alfagham, A.T.; Tariq, A. Monitoring and forecasting water erosion in response to climate change effects using the integration of the global RUSLE/SDR model and predictive models. Appl. Soil Ecol. 2025, 206, 105910. [Google Scholar] [CrossRef]
- He, S.S.; Zhu, W.B.; Cui, Y.P.; He, C.L.; Ye, L.P.; Feng, X.Y.; Zhu, L.Q. Soil erosion characteristics in Qishui River Basin of Taihang Mountains based on InVEST model. Resour. Environ. Yangtze Basin 2019, 28, 426–439. [Google Scholar]
- Sharp, R.; Tallis, H.T.; Ricketts, T. InVEST 3.8.0 Users Guide. The Natural Capital Project; Stanford University: Stanford, CA, USA; University of Minnesota: Minneapolis, MN, USA; The Nature Conservancy: Arlington, MA, USA; World Wildlife Fund: Washington, DC, USA, 2020. [Google Scholar]
- Liang, J.; Li, S.; Li, X.D.; Li, X.; Liu, Q.; Meng, Q.F.; Lin, A.Q.; Li, J.J. Trade-off analyses and optimization water-related ecosystem services (WRESs) based on land use change a typical agricultural watershed, southern China. J. Clean. Prod. 2021, 279, 123851. [Google Scholar] [CrossRef]
- Wang, H.; Yuan, W.; Ma, Y.; Bai, X.; Huang, L.; Cheng, S.; Yang, H.; Guo, W. Spatiotemporal dislocation of ecosystem supply and demand services from habitat quality under different development scenarios. Ecol. Indic. 2023, 157, 111230. [Google Scholar] [CrossRef]
- Li, H.; Qi, Y.; Qu, Y. Use a Spatial Analysis Model to Assess Habitat Quality in Lashihai Watershed. J. Resour. Ecol. 2018, 9, 622–631. [Google Scholar]
- Sun, X.; Lu, Z.M.; Li, F.; Crittenden, J.C. Analyzing spatio-temporal changes and trade-offs to support the supply of multiple ecosystem services in Beijing, China. Ecol. Indic. 2018, 94, 117–129. [Google Scholar] [CrossRef]
- Zhu, N.N.; Yang, B.S.; Dong, Z. An explicit calculation model for forest carbon storage based on remote sensing. Acta Geodaetica et Cartographica Sinica 2024, 53, 36–49. [Google Scholar]
- Xu, L.; Yu, G.R.; He, N.P. Changes of soil organic carbon storage in Chinese terrestrial ecosystems from the 1980s to the 2010s. J. Geogr. Sci. 2019, 29, 49–66. [Google Scholar] [CrossRef]
- Raudsepp-Hearne, C.; Peterson, G.D.; Bennett, E.M. Ecosystem service bundles for analyzing tradeoffs in diverse landscapes. Proc. Natl. Acad. Sci. USA 2010, 107, 5242–5247. [Google Scholar] [CrossRef]
- Zhu, M.; Yu, X.; Chen, K.; Tan, H.; Yuan, J. Spatiotemporal characteristics and driving factors of chemical oxygen demand emissions in China’s wastewater: An analysis based on spatial autocorrelation and geodetector. Ecol. Indic. 2024, 166, 112308. [Google Scholar] [CrossRef]
- O’Shea, D.; Nathan, R.; Wasko, C.; Sharma, A. Separating Storm Intensity and Arrival Frequency in Nonstationary Rainfall Frequency Analysis. Water Resour. Res. 2024, 60, e2023WR036165. [Google Scholar] [CrossRef]
- He, L.J.; Huang, L.B.; Ke, X.L.; Chen, Q.Y.; Song, Y. Impacts of cropland slope climbing on regional ecosystem services in the Yangtze River Basin. Acta Ecol. Sin. 2025, 45, 367–384. [Google Scholar]
- Zhang, Y.; Yuan, X.S.; Yang, F.; Li, J.Y.; Wang, H.C. Carbon offset capacity assessment of urban green spaces and driving force analysis of carbon sequestration in Chinese cities. J. Hainan Norm. Univ. 2025, 38, 111–118. [Google Scholar] [CrossRef]
- Yang, X.F.; Yu, S.K.; Luo, Z.J.; Luo, S.K.; Nie, X.R. Interrelationships between landscape ecological risk and ecosystem services from multi-scale perspectives and zoning regulation in the Poyang Lake Circum-Region. Environ. Sci. 2025, 1–18. [Google Scholar] [CrossRef]
- Yang, K.K.; Chen, W.B.; Xiong, Q.L.; Gao, B.J. Impacts of human activities on ecosystem services in southern Jiangxi from 2000 to 2020. Chin. J. Appl. Ecol. 2025, 1–15. [Google Scholar] [CrossRef]
- Liang, Z.A.; Wang, X.F.; Wang, W.F.; Yan, K.; Li, Y.H.; Dong, W.T.; Wang, R.N. Evaluation of soil conservation benefits from the Natural Forest Protection Program in Qinghai Province. J. Nanjing For. Univ. 2023, 47, 181–188. [Google Scholar]
- Cheng, J.H.; Zhu, C.J. Spatiotemporal characteristics of typical ecological carbon sequestration capacity and its correlation with ecological patterns in Jinan City. Water Resour. Hydropower Eng. 2025, 1–18. Available online: https://www.cnki.com.cn/Article/CJFDTotal-SJWJ20250325002.htm (accessed on 2 June 2025).
- Niu, X.G.; Zhu, X.L.; Liu, M.Y.; Che, J.N. Spatiotemporal evolution characteristics and driving factors of ecosystem carbon storage and habitat quality in Hebei Province. Bull. Soil Water Conserv. 2024, 44, 353–365. [Google Scholar]
- Zhou, J.; Wang, Z.; He, Y.; Liu, P.; Xu, J.; Lu, C.; Lei, G.; Wen, L. Evaluating the Effects of Wetland Restoration on Ecosystem Services Using InVEST and Geostatistics: A Case Study of Dongting Lake in China. Remote Sens. 2024, 16, 4062. [Google Scholar] [CrossRef]
- Li, Y.; Liu, W.; Feng, Q.; Zhu, M.; Zhang, J.; Yang, L.; Yin, X. Spatiotemporal Dynamics and Driving Factors of Ecosystem Services Value in the Hexi Regions, Northwest China. Sustainability 2022, 14, 14164. [Google Scholar] [CrossRef]
- Xu, L.; He, Y.; Zhang, L.; Tang, C.; Xu, H. Relationships and Spatiotemporal Variations of Ecosystem Services and Land Use in Alpine Ecosystems: A Case Study of the Daxing’anling Forest Area, Inner Mongolia. Forests 2025, 16, 359. [Google Scholar] [CrossRef]
Disclaimer/Publisher’s Note: The statements, opinions and data contained in all publications are solely those of the individual author(s) and contributor(s) and not of MDPI and/or the editor(s). MDPI and/or the editor(s) disclaim responsibility for any injury to people or property resulting from any ideas, methods, instructions or products referred to in the content. |
© 2025 by the authors. Licensee MDPI, Basel, Switzerland. This article is an open access article distributed under the terms and conditions of the Creative Commons Attribution (CC BY) license (https://creativecommons.org/licenses/by/4.0/).