
The Evolution of Ecological Well-Being Performance and Its Effects on Population Longevity: A County-Level Spatiotemporal Analysis of Hubei Province, China


Abstract
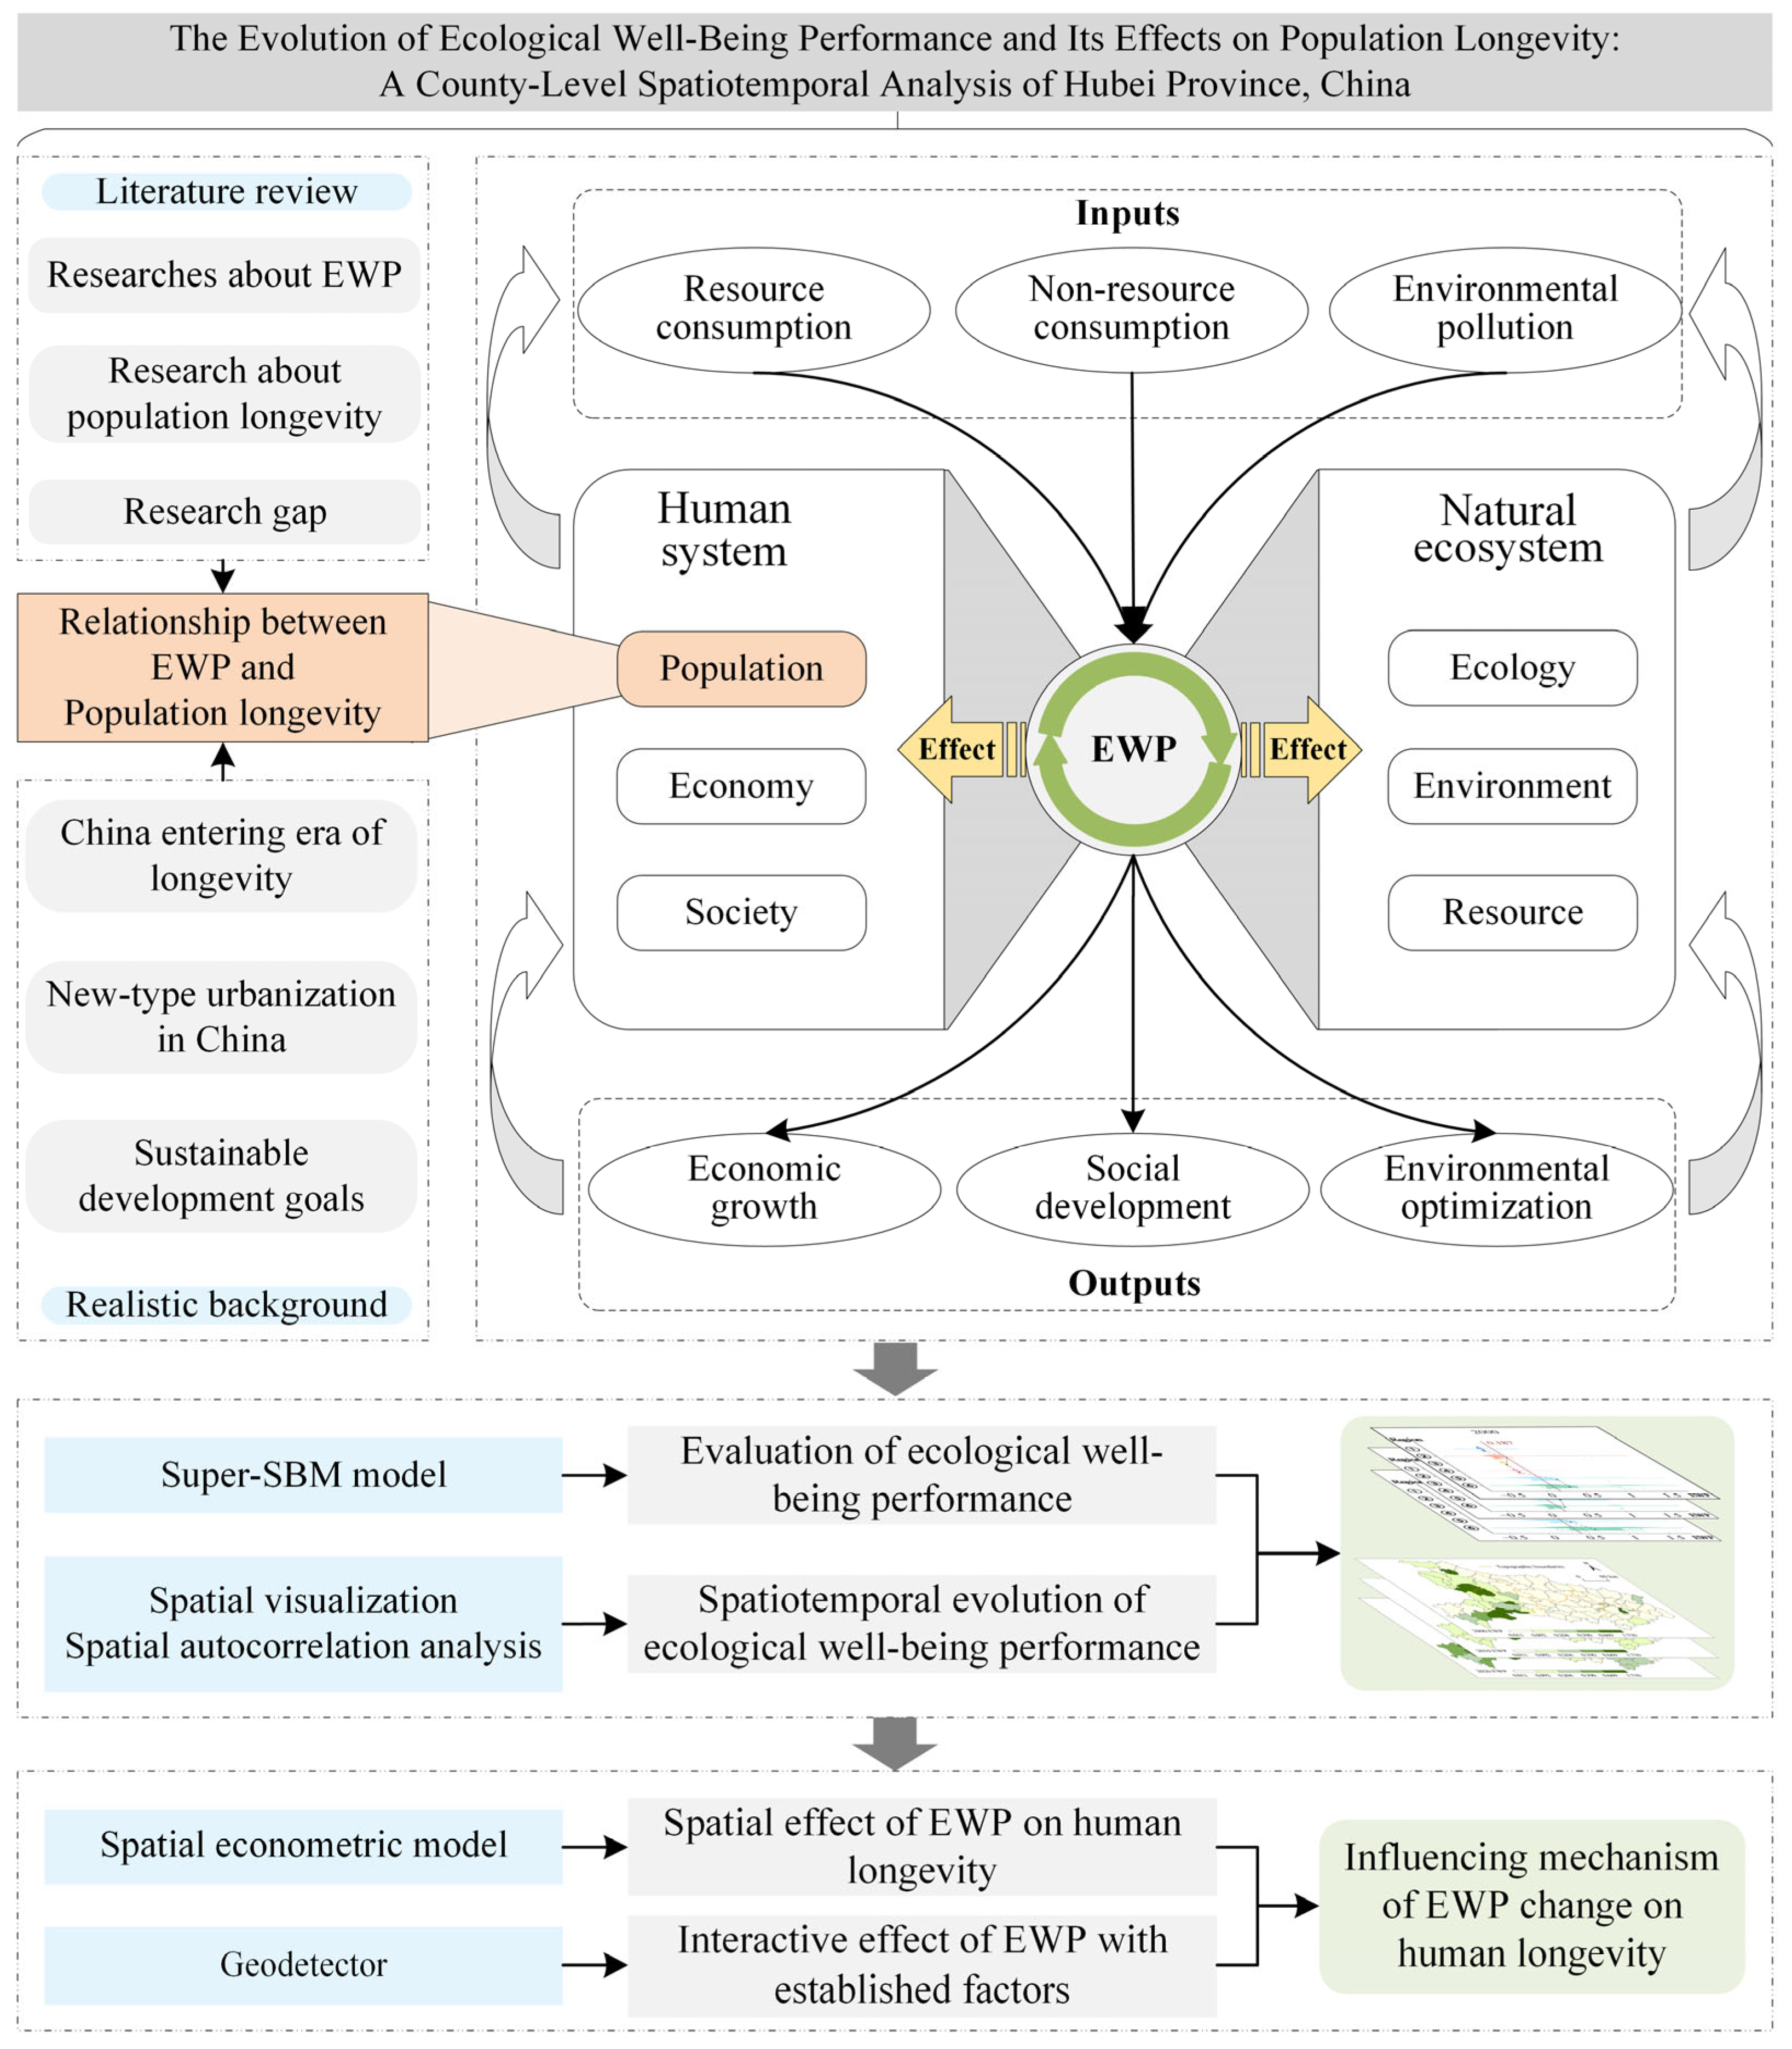
1. Introduction
2. Literature Review
3. Materials and Methods
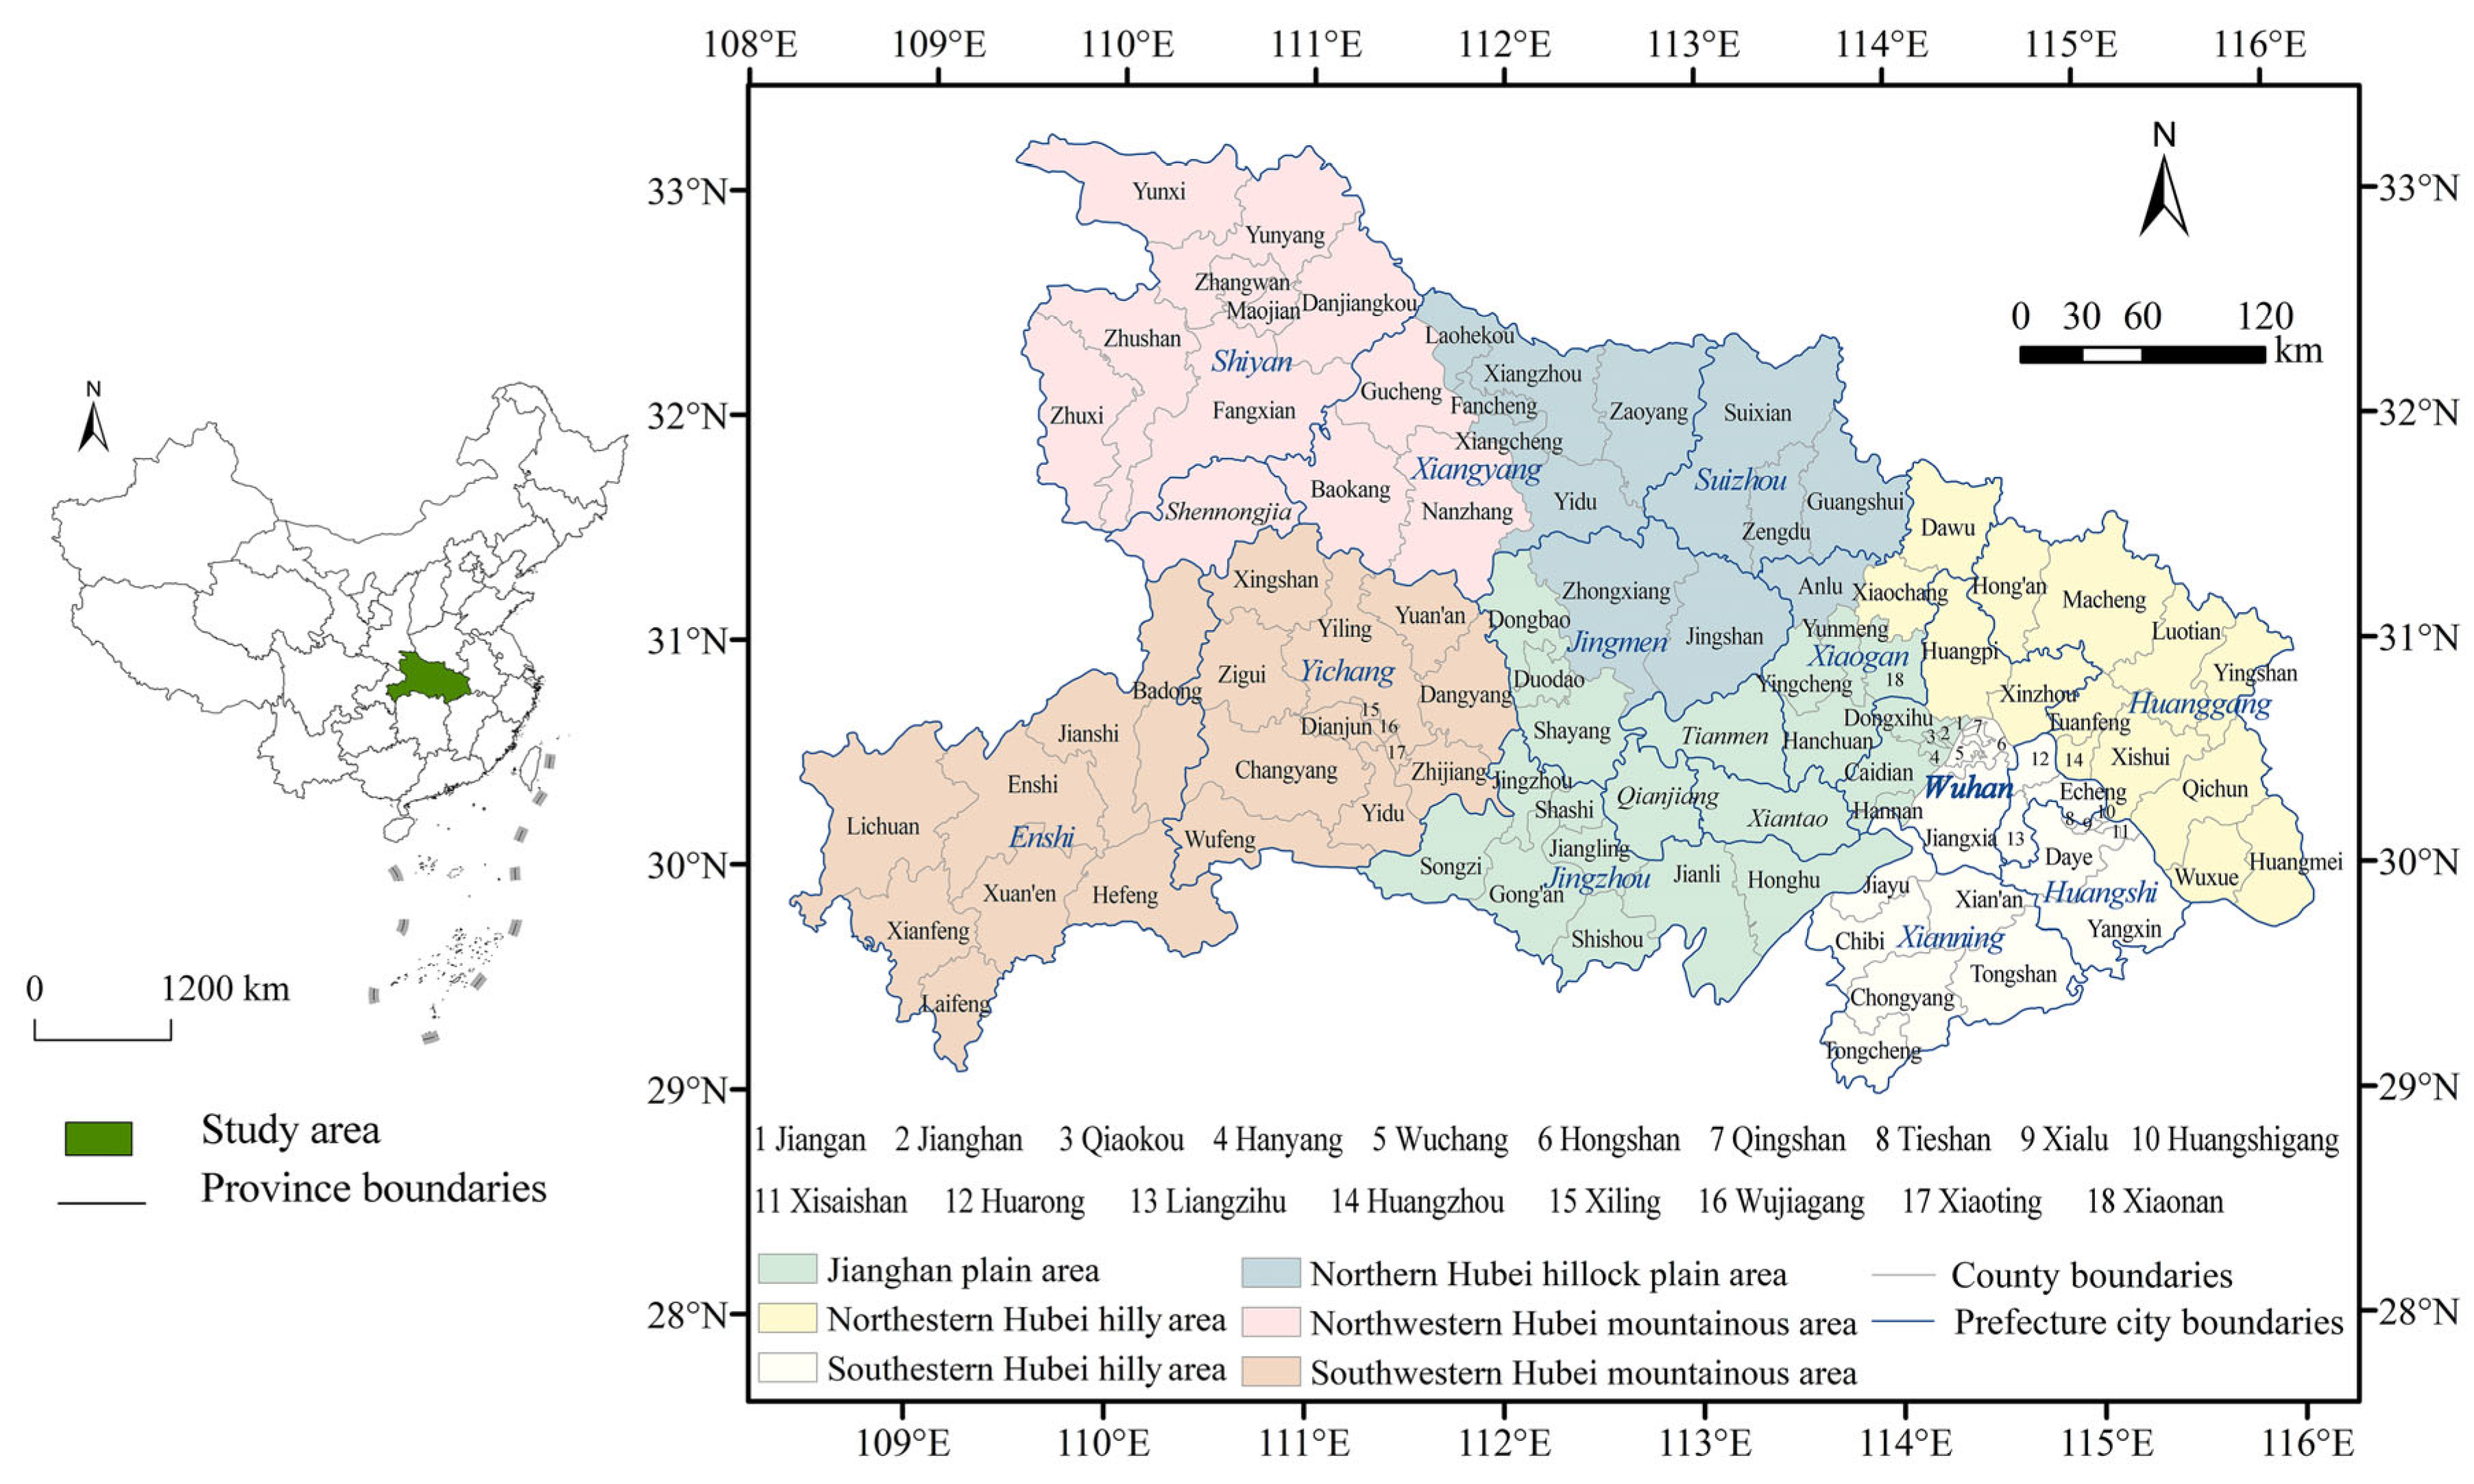
3.1. Study Area
3.2. Evaluation Indicators
3.2.1. Ecological Well-Being Performance
3.2.2. Human Longevity Level
3.3. Models
3.3.1. Super-SBM Model
3.3.2. Spatial Autocorrelation Model
3.3.3. Spatial Econometric Model
3.3.4. Geographical Detector
3.4. Data Sources
4. Results
4.1. Spatial–Temporal Evolution of EWP in Hubei Province
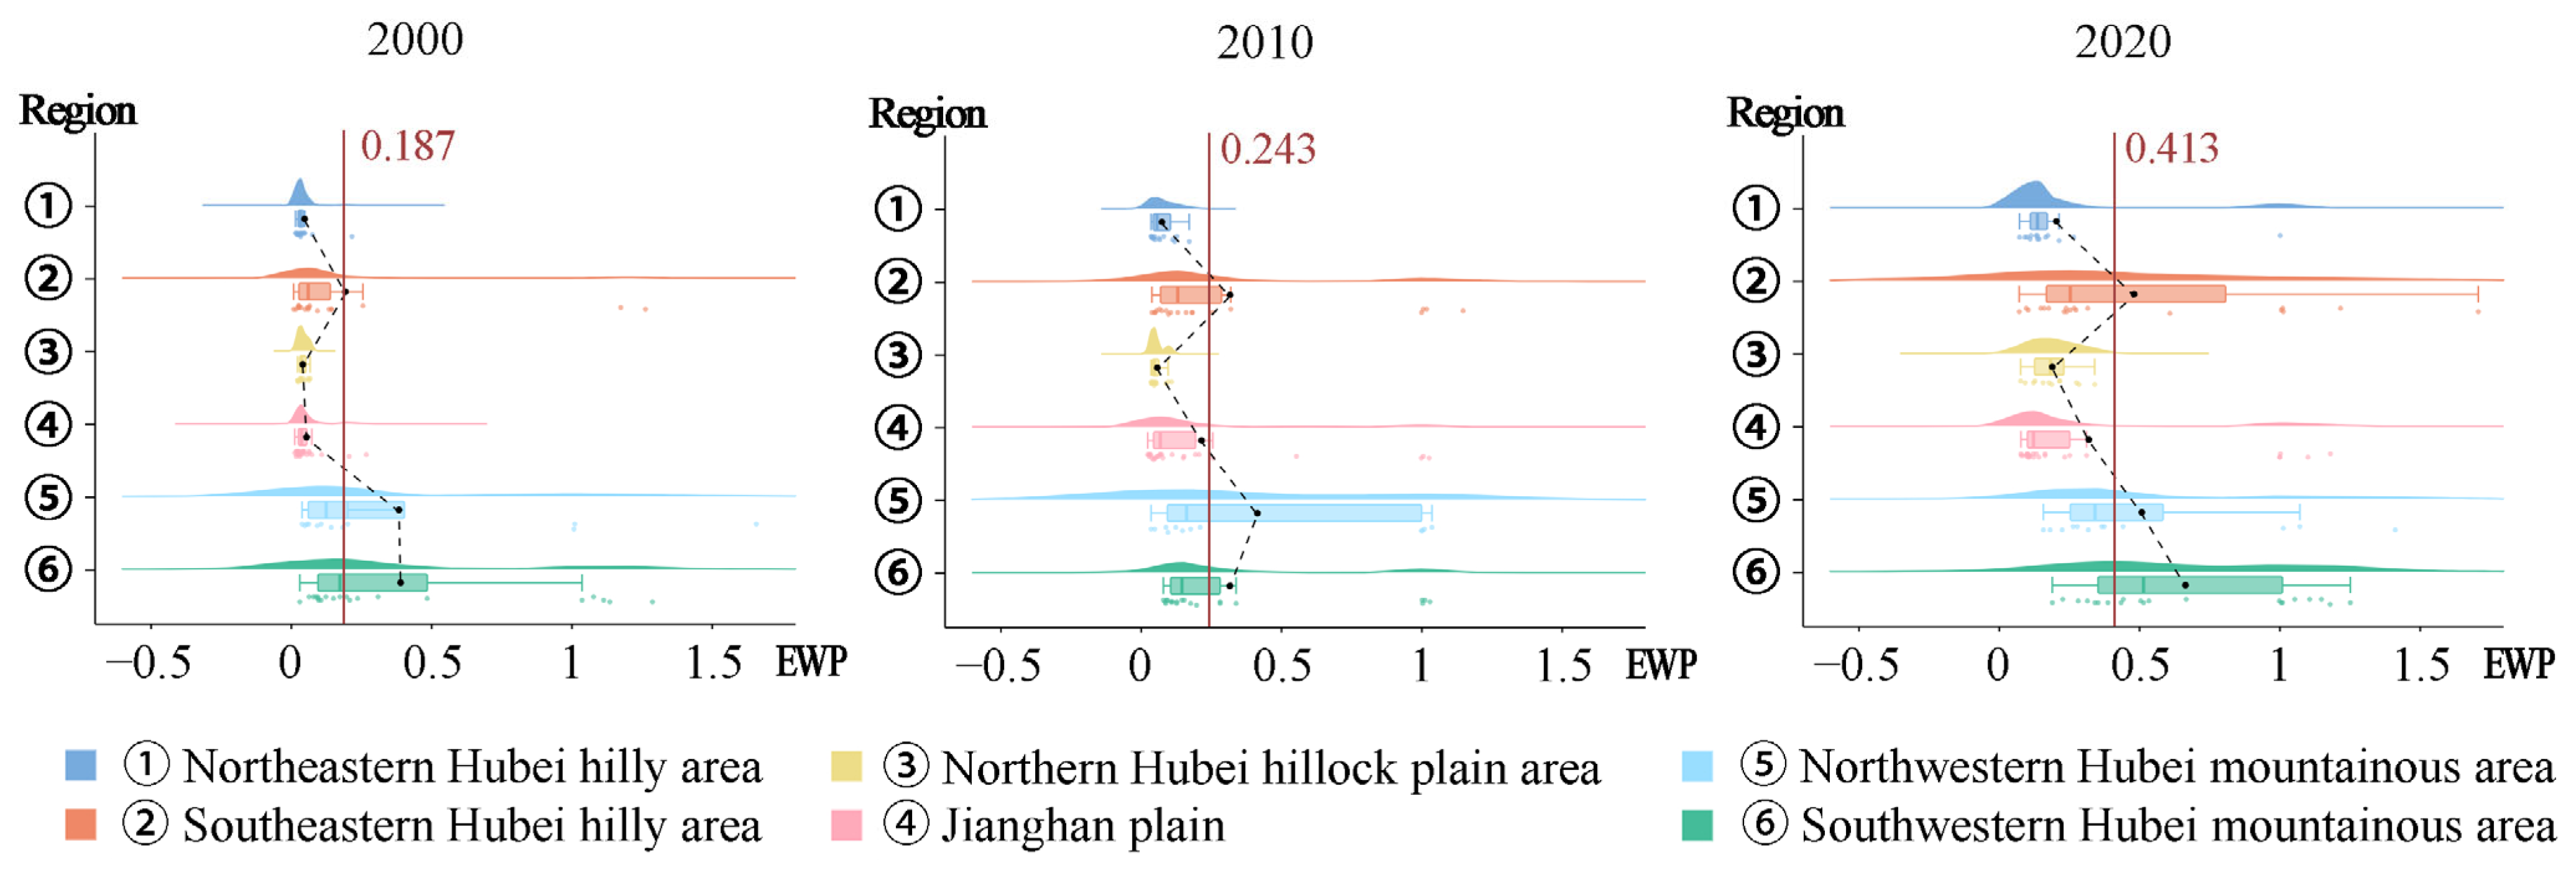
4.1.1. Temporal Changes and Regional Differences in EWP in Hubei Province
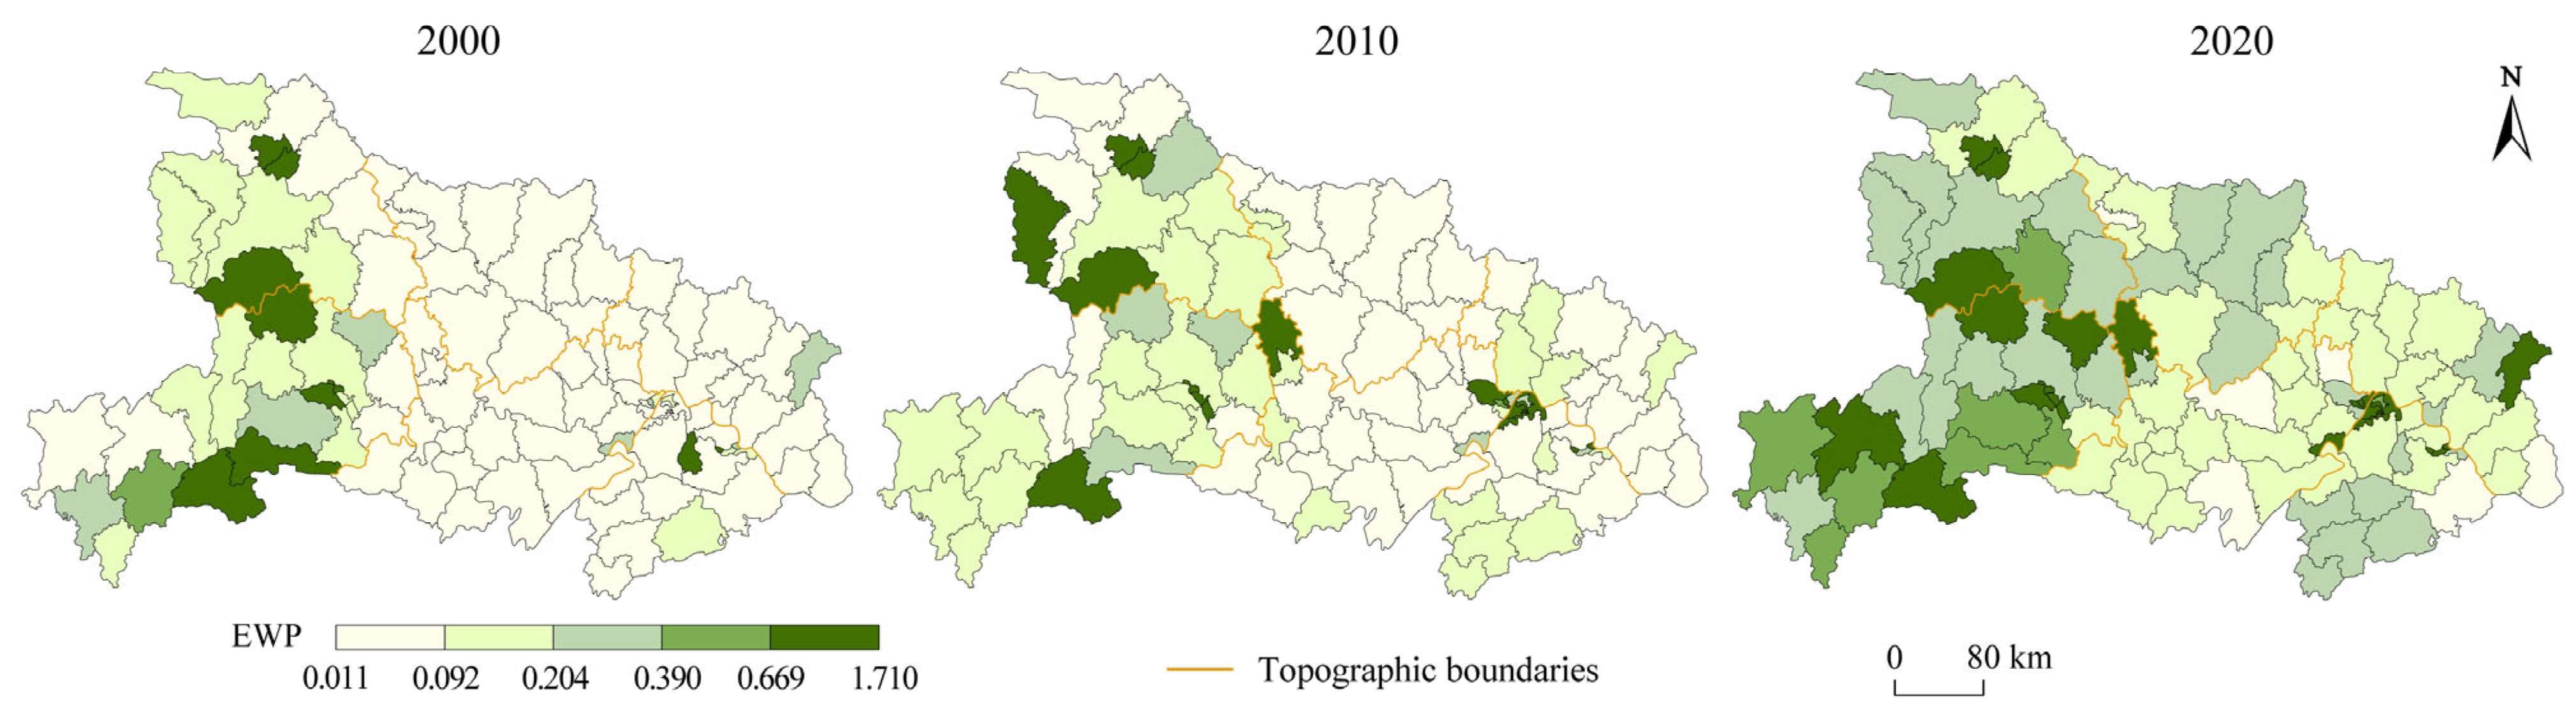
4.1.2. Spatial Pattern Evolution of Hubei Province’s EWP
4.2. Spatial Effects of EWP on Human Longevity
4.2.1. Model Processing
4.2.2. Regression Results
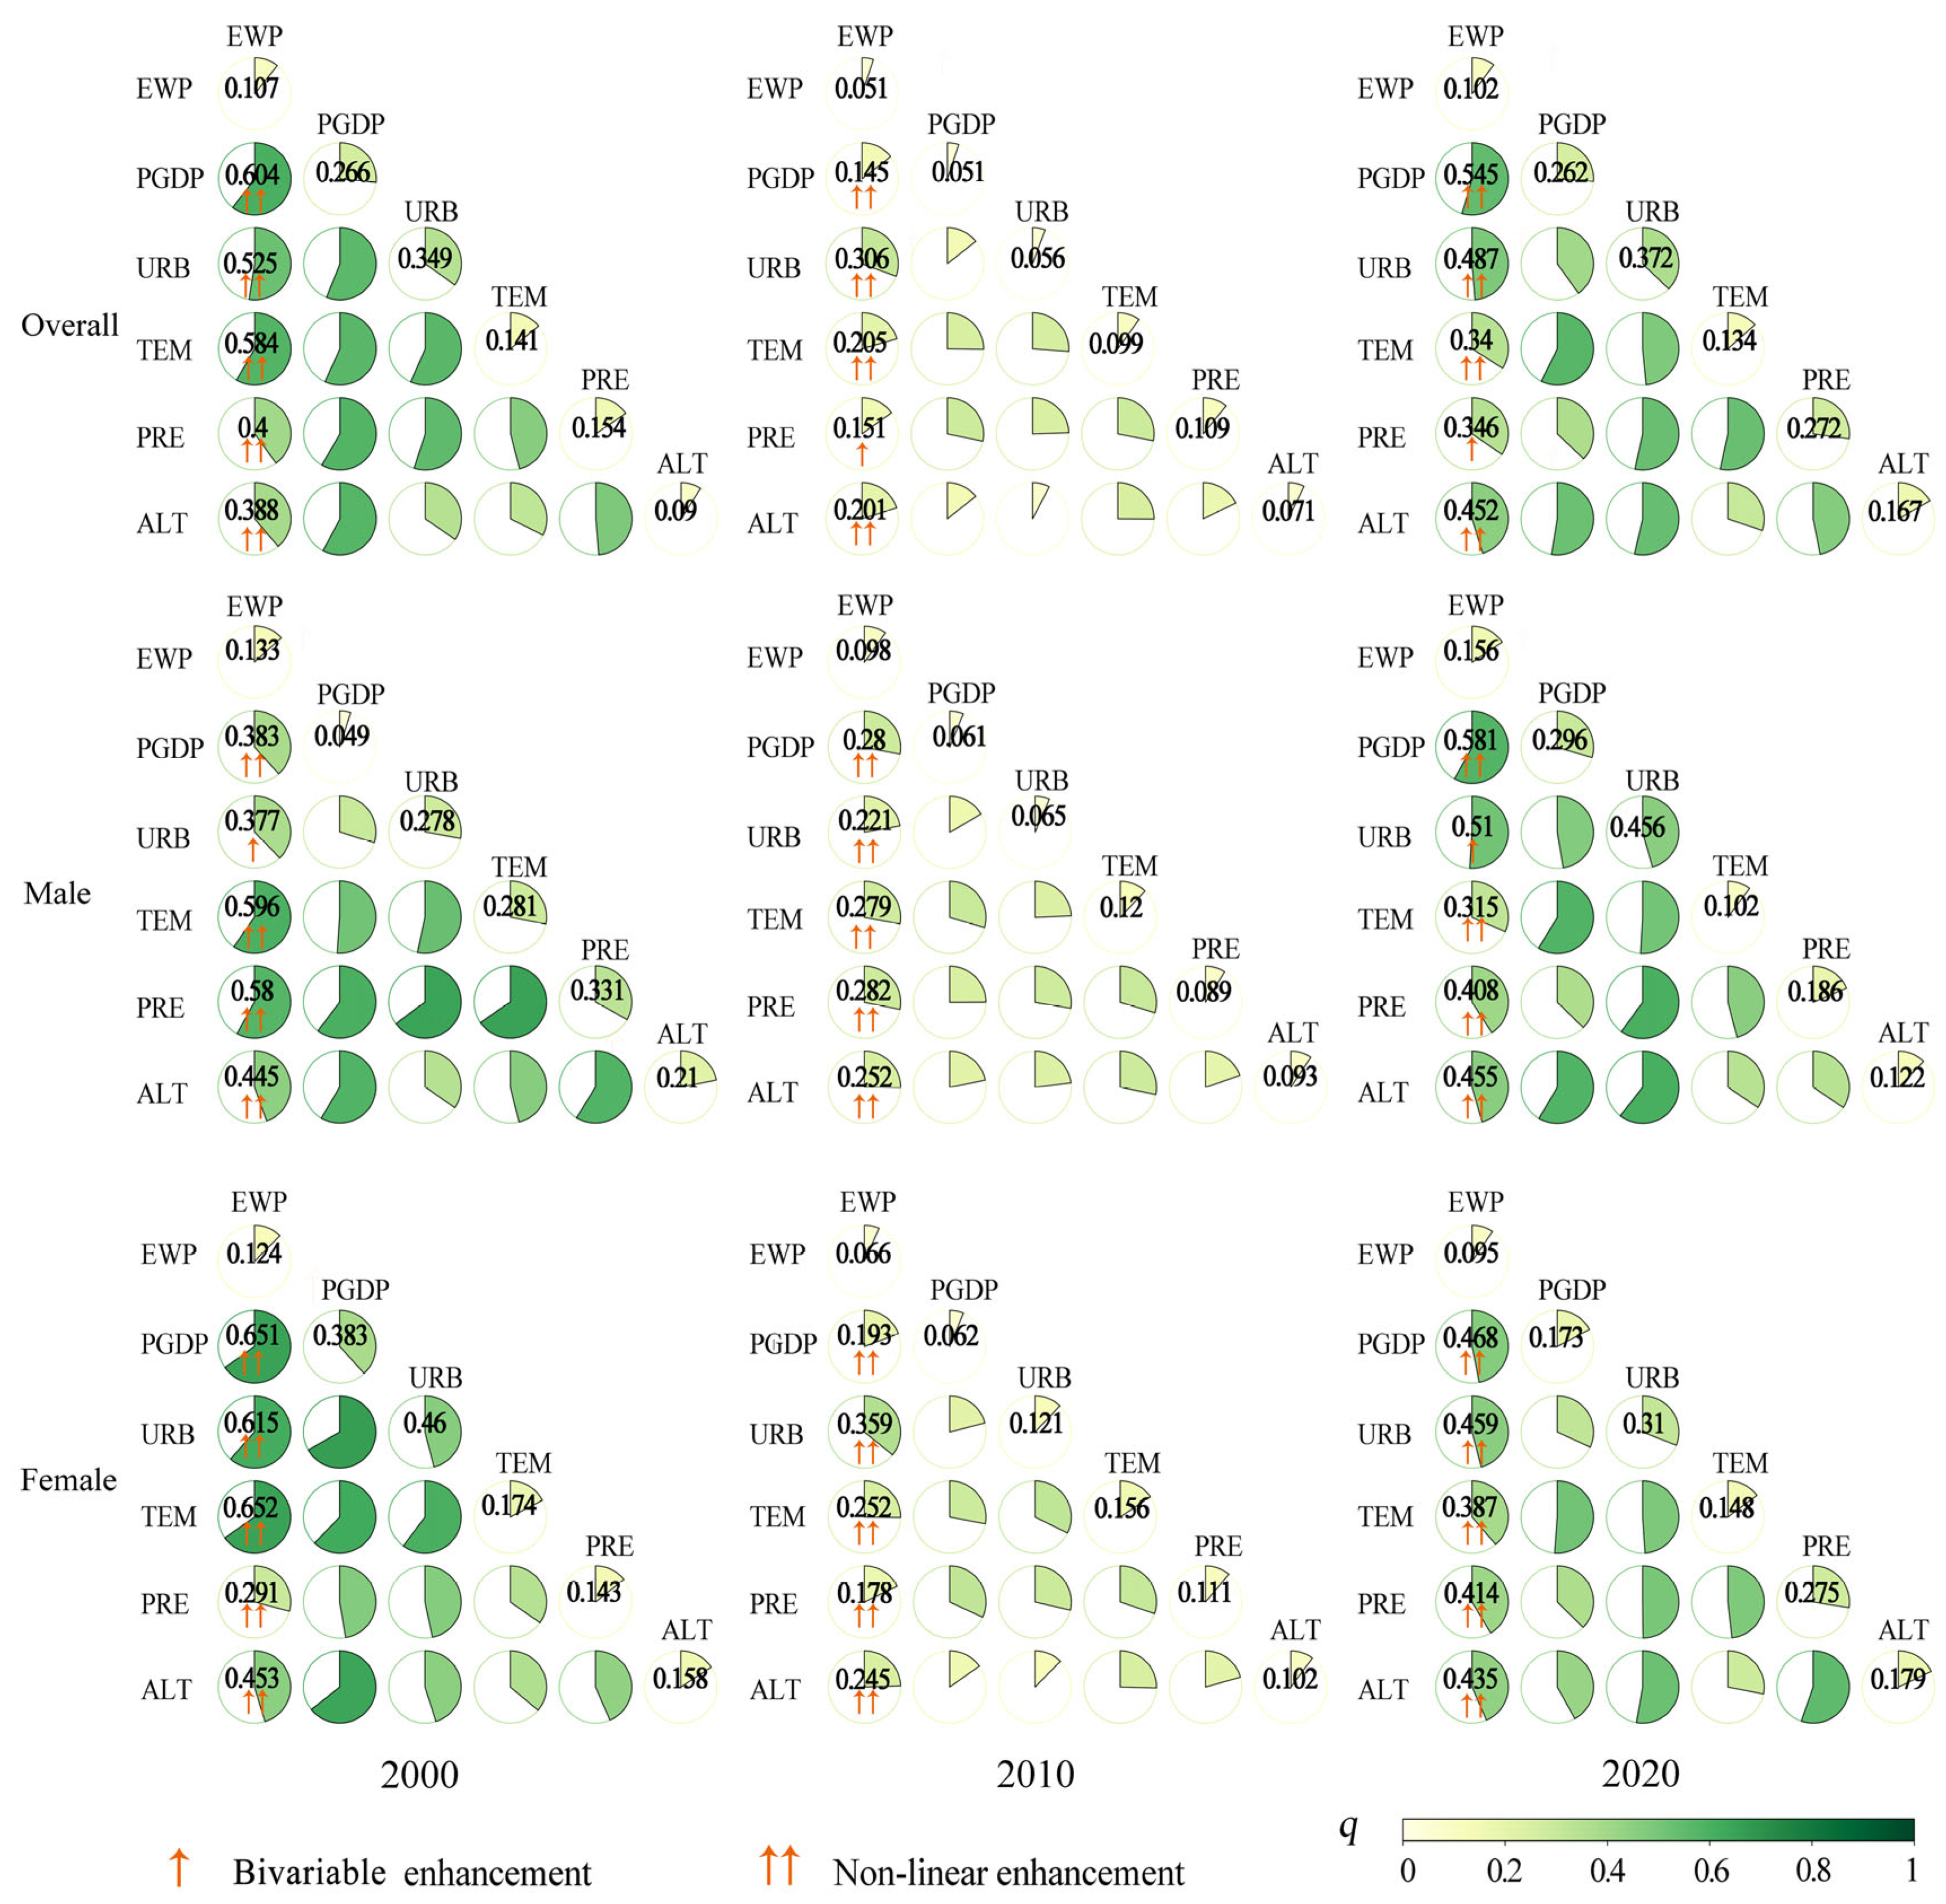
4.3. Interactive Influence of EWP with Environmental and Socioeconomic Factors
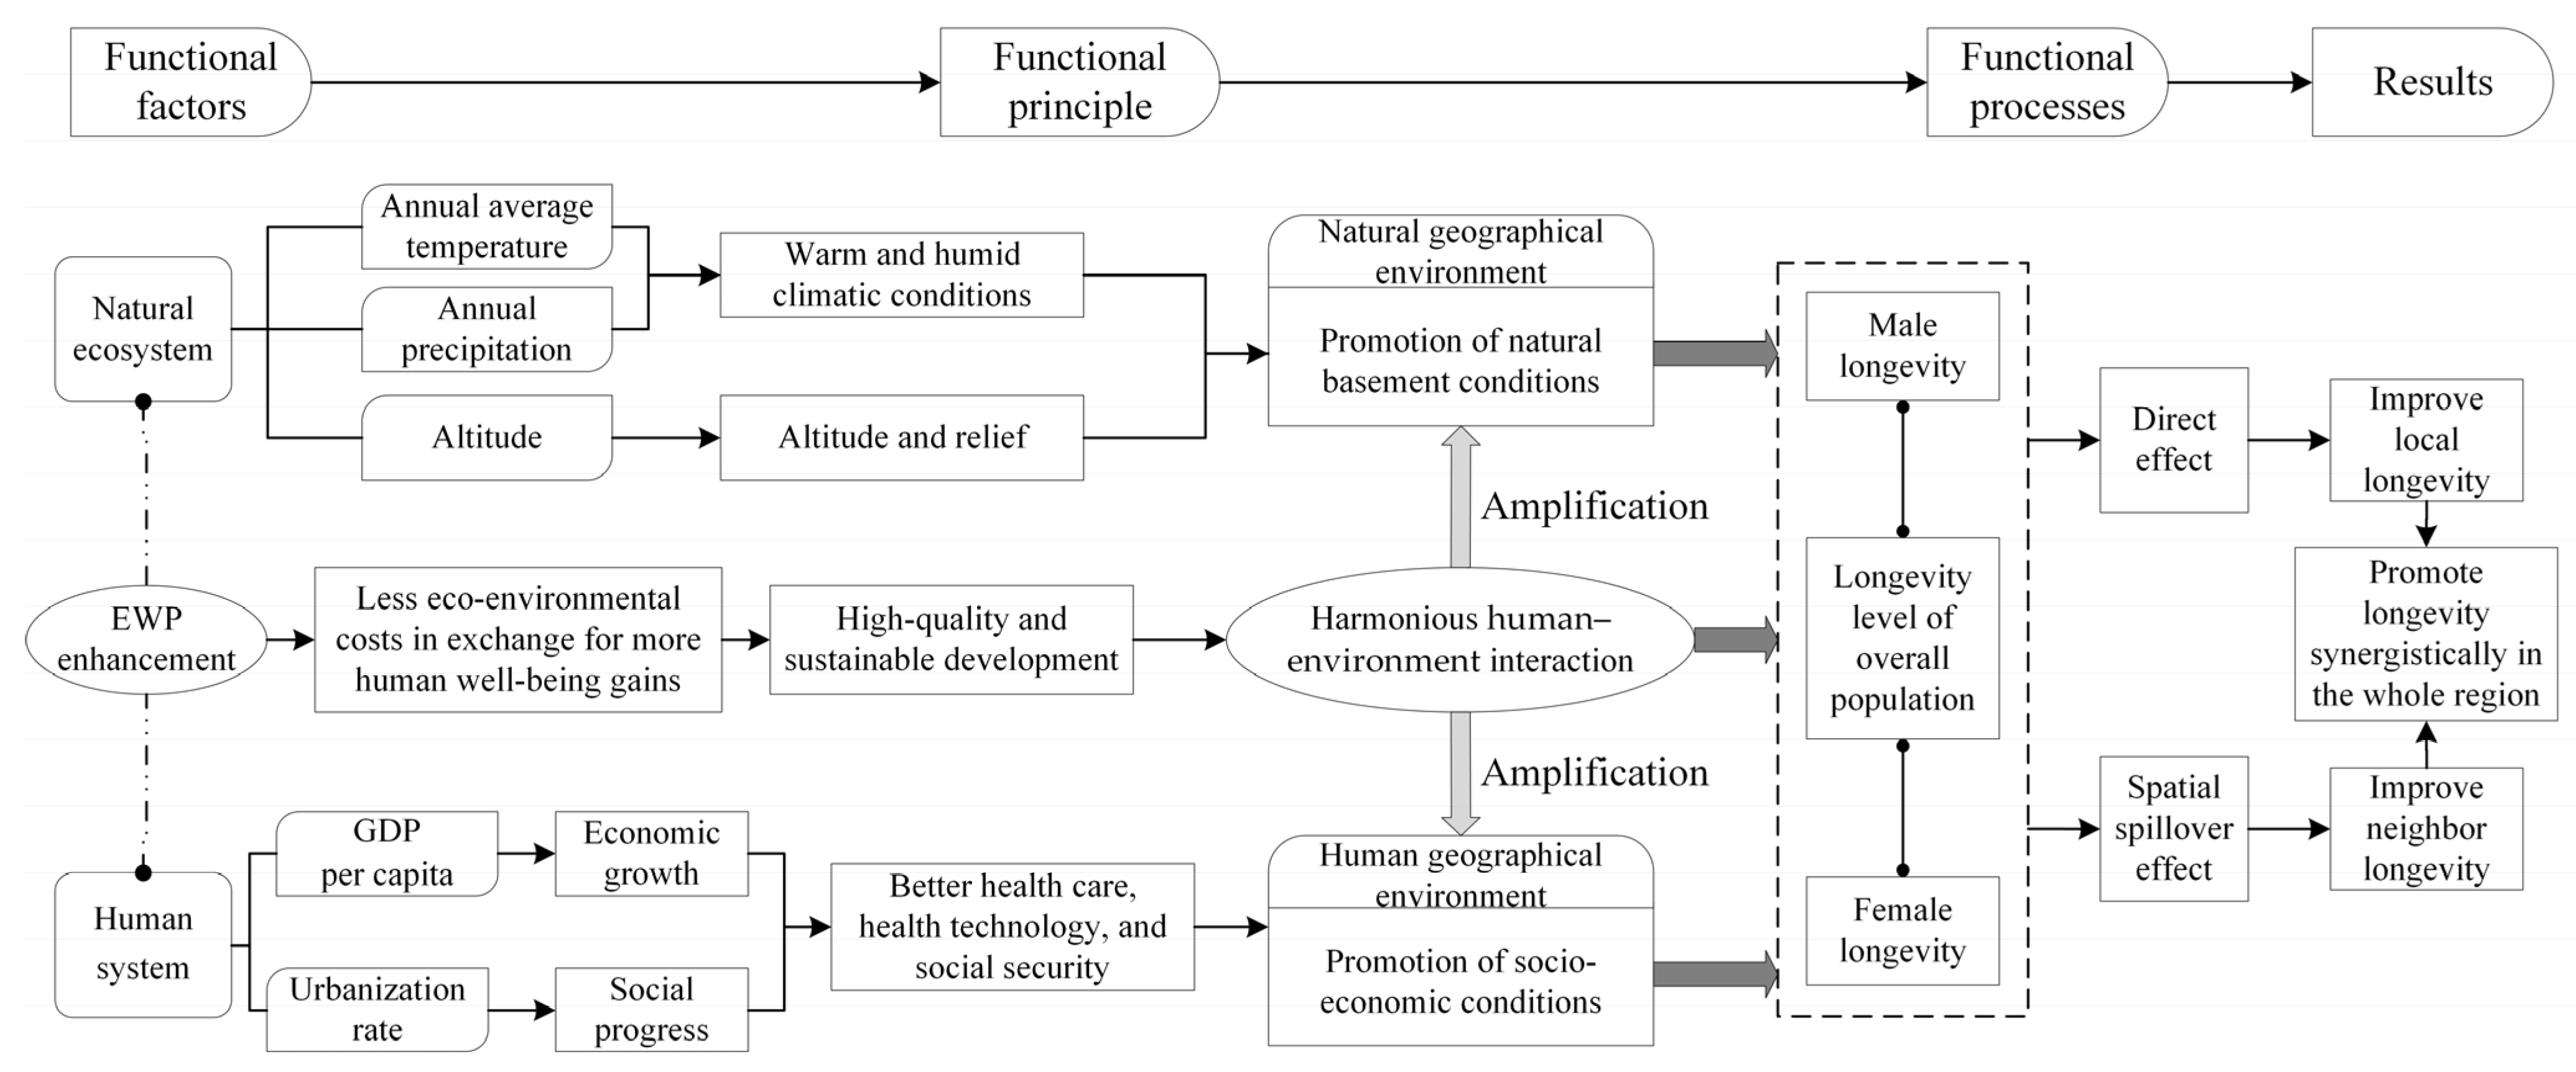
4.4. Influencing Mechanism of EWP on Longevity in Hubei Province
5. Discussion
6. Conclusions
Author Contributions
Funding
Institutional Review Board Statement
Informed Consent Statement
Data Availability Statement
Acknowledgments
Conflicts of Interest
Abbreviations
| EWP | Ecological well-being performance. |
Appendix A

| Variables | Symbol | Unit | Observations | SD | Mean | Min | Max |
|---|---|---|---|---|---|---|---|
| Total longevity level | TLI | % | 309 | 1.76 | 5.4 | 1.82 | 10.22 |
| Male longevity level | MLI | % | 309 | 1.73 | 4.11 | 0.87 | 9.47 |
| Female longevity level | FLI | % | 309 | 1.89 | 6.58 | 2.43 | 11.04 |
| Ecological well-being performance | EWP | index | 309 | 0.37 | 0.28 | 0.01 | 1.71 |
| GDP per capita | PGDP | CNY | 309 | 26,556 | 14,951 | 120.3 | 401,886 |
| Urbanization rate | URB | ratio | 309 | 0.26 | 0.52 | 0.1 | 1 |
| Annual average temperature | TEM | °C | 309 | 1.62 | 16.48 | 9.25 | 18.33 |
| Annual precipitation | PRE | mm | 309 | 200.7 | 1402 | 909.5 | 1926 |
| Altitude | ALT | m | 309 | 373.1 | 287.8 | 22.38 | 1676 |
References
- Ahmad, M.; Akram, W.; Ikram, M.; Shah, A.A.; Rehman, A.; Chandio, A.A.; Jabeen, G. Estimating Dynamic Interactive Linkages among Urban Agglomeration, Economic Performance, Carbon Emissions, and Health Expenditures across Developmental Disparities. Sustain. Prod. Consum. 2021, 26, 239–255. [Google Scholar] [CrossRef]
- Almetwally, A.A.; Bin-Jumah, M.; Allam, A.A. Ambient Air Pollution and Its Influence on Human Health and Welfare: An Overview. Environ. Sci. Pollut. R. 2020, 27, 24815–24830. [Google Scholar] [CrossRef] [PubMed]
- Announcement from China Association of Gerontology Geriatrics. Available online: http://www.cagg.org.cn/portal/article/index/id/1540/cid/34.html (accessed on 31 October 2024).
- Gong, S.S.; Wang, W.W.; Yang, L.S.; Chai, Y.W.; Zhou, S.H.; Huang, L.; Wang, L.; Cheng, Y.; Ge, M.; Luo, Y.J. The Key Fields and Action Suggestions of Geography Participating in the Construction of Healthy China. Acta Geogr. Sin. 2022, 77, 1851–1872. [Google Scholar] [CrossRef]
- Zhu, D.J.; Zhang, S. Ecological wellbeing Performance and Further Research on Sustainable Development. J. Tonji Univ. Soc. Sci. Ed. 2014, 25, 106–115. [Google Scholar]
- Wang, S.; Zhang, Y.; Yao, X. Research on Spatial Unbalance and Influencing Factors of Ecological Well-Being Performance in China. Int. J. Environ. Res. Public Health 2021, 18, 9299. [Google Scholar] [CrossRef]
- Yang, L.; Ma, Z.; Xu, Y. How Does the Digital Economy Affect Ecological Well-Being Performance? Evidence from Three Major Urban Agglomerations in China. Ecol. Indic. 2023, 157, 111261. [Google Scholar] [CrossRef]
- Song, Y.; Mei, D. Sustainable Development of China’s Regions from the Perspective of Ecological Welfare Performance: Analysis Based on GM(1,1) and the Malmquist Index. Environ. Dev. Sustain. 2022, 24, 1086–1115. [Google Scholar] [CrossRef]
- Wang, L.; Li, Y.; Li, H.; Holdaway, J.; Hao, Z.; Wang, W.; Krafft, T. Regional Aging and Longevity Characteristics in China. Arch. Gerontol. Geriatr. 2016, 67, 153–159. [Google Scholar] [CrossRef]
- Yang, R.; Ren, F.; Ma, X.; Zhang, H.; Xu, W.; Jia, P. Explaining the Longevity Characteristics in China from a Geographical Perspective: A Multi-Scale Geographically Weighted Regression Analysis. Geospat. Health 2021, 16, 1024. [Google Scholar] [CrossRef]
- Lan, F.; Hui, Z.; Bian, J.; Wang, Y.; Shen, W. Ecological Well-Being Performance Evaluation and Spatio-Temporal Evolution Characteristics of Urban Agglomerations in the Yellow River Basin. Land 2022, 11, 2044. [Google Scholar] [CrossRef]
- Zhu, Y.Y.; Zhang, R.; Gu, J.; Gao, Z. Spatiotemporal Evolution and Driving Mechanism of Ecological Well-being Performance in the Urban Agglomeration of the Middle Reaches of the Yangtze River under the Carbon Peaking and Carbon Neutrality Goals. Prog. Geogr. 2022, 41, 2231–2243. [Google Scholar] [CrossRef]
- Zhu, Y.Y.; Zhang, R.; Gu, J.; Luo, W.C. Economic and Environmental Effects of Ecological Well-Being Performance Change of Urban Agglomeration in the Middle Reaches of the Yangtze River under the Carbon Peaking and Carbon Neutrality Goals. Econ. Geogr. 2023, 43, 89–96. [Google Scholar] [CrossRef]
- Xia, M.; Li, J. Assessment of Ecological Well-Being Performance and Its Spatial Correlation Analysis in the Beijing-Tianjin-Hebei Urban Agglomeration. J. Clean. Prod. 2022, 362, 132621. [Google Scholar] [CrossRef]
- Dong, Y.; Sun, Y.H.; Ding, J. Decomposition of ecological welfare performance drivers in China. Acta Geogr. Sin. 2024, 79, 1337–1354. [Google Scholar] [CrossRef]
- Daly, H.E. The Economics of the Steady State. Amer. Econ. Rev. 1974, 64, 15–21. [Google Scholar]
- Rees, W.E. Ecological Footprints and Appropriated Carrying Capacity: What Urban Economics Leaves Out. Environ. Urban. 1992, 4, 121–130. [Google Scholar] [CrossRef]
- Common, M. Measuring National Economic Performance without Using Prices. Ecolog. Econ. 2007, 64, 92–102. [Google Scholar] [CrossRef]
- Ng, Y.-K. Environmentally Responsible Happy Nation Index: Towards an Internationally Acceptable National Success Indicator. Soc. Indic. Res. 2007, 85, 425–446. [Google Scholar] [CrossRef]
- Dietz, T.; Rosa, E.A.; York, R. Environmentally Efficient Well-Being: Rethinking Sustainability as the Relationship between Human Well-Being and Environmental Impacts. Hum. Ecol. Rev. 2009, 16, 114–123. [Google Scholar]
- Bian, J.; Ren, H.; Liu, P. Evaluation of Urban Ecological Well-Being Performance in China: A Case Study of 30 Provincial Capital Cities. J. Clean. Prod. 2020, 254, 120109. [Google Scholar] [CrossRef]
- Han, H.; Gu, R.; Yang, Y. Impacts of Low-Carbon City Pilot Policy on Ecological Well-Being Performance across Chinese Cities: A Spatial Difference-in-Difference Analysis. Sustain. Cities Soc. 2025, 118, 105864. [Google Scholar] [CrossRef]
- Behjat, A.; Tarazkar, M.H. Investigating the Factors Affecting the Ecological Well-Being Performance in Iran from 1994 to 2014. Environ. Dev. Sustain. 2021, 23, 13871–13889. [Google Scholar] [CrossRef]
- Knight, K.W. Temporal Variation in the Relationship between Environmental Demands and Well-Being: A Panel Analysis of Developed and Less-Developed Countries. Popul. Environ. 2014, 36, 32–47. [Google Scholar] [CrossRef]
- Bian, J.; Lan, F.; Hui, Z.; Bai, J.; Wang, Y. Ecological Well-Being Performance Evaluation of Chinese Major Node Cities along the Belt and Road. Land 2022, 11, 1928. [Google Scholar] [CrossRef]
- Guo, J.; Ou, X.; Li, Y.; Liu, K. Can the Carbon Emissions Trading Pilot Policy Improve the Ecological Well-Being Performance of Cities in China? Sustainability 2024, 16, 841. [Google Scholar] [CrossRef]
- Zhu, Y.; Zhang, R.; Cui, J. Spatial Differentiation and Influencing Factors in the Ecological Well-Being Performance of Urban Agglomerations in the Middle Reaches of the Yangtze River: A Hierarchical Perspective. Int. J. Environ. Res. Public Health 2022, 19, 12867. [Google Scholar] [CrossRef]
- Dietz, T.; Rosa, E.A.; York, R. Environmentally Efficient Well-Being: Is There a Kuznets Curve? Appl. Geogr. 2012, 32, 21–28. [Google Scholar] [CrossRef]
- He, S.; Fang, B.; Xie, X. Temporal and Spatial Evolution and Driving Mechanism of Urban Ecological Welfare Performance from the Perspective of High-Quality Development: A Case Study of Jiangsu Province, China. Land 2022, 11, 1607. [Google Scholar] [CrossRef]
- Bao, L.; Ding, X.; Zhang, J.; Ma, D. Can New Urbanization Construction Improve Ecological Welfare Performance in the Yangtze River Economic Belt? Sustainability 2023, 15, 8758. [Google Scholar] [CrossRef]
- Liu, N.; Wang, Y.; Liu, S. Spatial Evolution and Driving Factors of Ecological Well-Being Performance in the Yellow River Basin. Sustainability 2024, 16, 6063. [Google Scholar] [CrossRef]
- Wang, G.; Gao, J.; Li, Y. Does Low-Carbon Transition Promote Regional Sustainable Development? Evidence from the Huaihe River Ecological Economic Belt. Sustainability 2024, 16, 9107. [Google Scholar] [CrossRef]
- Xiao, L.M.; Zhang, X.P. Spatiotemporal Characteristics of Coupling Coordination between Green Innovation Efficiency and Ecological Welfare Performance under the Concept of Strong Sustainability. J. Nat. Resour. 2019, 34, 312–324. [Google Scholar] [CrossRef]
- Xu, W.X.; Xu, Z.X.; Liu, C.J. Coupling analysis of land intensive use efficiency and ecological well-being performance of cities in the Yellow River Basin. J. Nat. Resour. 2021, 36, 114–130. [Google Scholar] [CrossRef]
- Magnolfi, S.U.; Noferi, I.; Petruzzi, E.; Pinzani, P.; Malentacchi, F.; Pazzagli, M.; Antonini, F.M.; Marchionni, N. Centenarians in Tuscany: The Role of the Environmental Factors. Arch. Gerontol. Geriatr. 2009, 48, 263–266. [Google Scholar] [CrossRef]
- Govindaraju, D.; Atzmon, G.; Barzilai, N. Genetics, Lifestyle and Longevity: Lessons from Centenarians. Appl. Transl. Genomics 2015, 4, 23–32. [Google Scholar] [CrossRef]
- Ljungquist, B.; Berg, S.; Lanke, J.; McClearn, G.E.; Pedersen, N.L. The Effect of Genetic Factors for Longevity: A Comparison of Identical and Fraternal Twins in the Swedish Twin Registry. J. Gerontol. A Biol. Sci. Med. Sci. 1998, 53A, M441–M446. [Google Scholar] [CrossRef]
- Dobis, E.A.; Stephens, H.M.; Skidmore, M.; Goetz, S.J. Explaining the Spatial Variation in American Life Expectancy. Soc. Sci. Med. 2020, 246, 112759. [Google Scholar] [CrossRef]
- Wei, C.; Lei, M.; Wang, S. Spatial Heterogeneity of Human Lifespan in Relation to Living Environment and Socio-Economic Polarization: A Case Study in the Beijing-Tianjin-Hebei Region, China. Environ. Sci. Pollut. R. 2022, 29, 40567–40584. [Google Scholar] [CrossRef]
- Huang, Y.; Rosenberg, M.; Hou, L.; Hu, M. Relationships among Environment, Climate, and Longevity in China. Int. J. Environ. Res. Public Health 2017, 14, 1195. [Google Scholar] [CrossRef]
- Lv, J.; Wang, W.; Krafft, T.; Li, Y.; Zhang, F.; Yuan, F. Effects of Several Environmental Factors on Longevity and Health of the Human Population of Zhongxiang, Hubei, China. Biol. Trace Elem. Res. 2011, 143, 702–716. [Google Scholar] [CrossRef]
- Chen, Z.; Ma, Y.; Hua, J.; Wang, Y.; Guo, H. Impacts from Economic Development and Environmental Factors on Life Expectancy: A Comparative Study Based on Data from Both Developed and Developing Countries from 2004 to 2016. Int. J. Environ. Res. Public Health 2021, 18, 8559. [Google Scholar] [CrossRef] [PubMed]
- Wang, L.; Wei, B.; Li, Y.; Li, H.; Zhang, F.; Rosenberg, M.; Yang, L.; Huang, J.; Krafft, T.; Wang, W. A Study of Air Pollutants Influencing Life Expectancy and Longevity from Spatial Perspective in China. Sci. Total Environ. 2014, 487, 57–64. [Google Scholar] [CrossRef] [PubMed]
- Zha, X.; Tian, Y.; Gao, X.; Wang, W.; Yu, C. Quantitatively Evaluate the Environmental Impact Factors of the Life Expectancy in Tibet, China. Environ. Geochem. Health 2019, 41, 1507–1520. [Google Scholar] [CrossRef]
- Jiang, L.; Chen, J.; Zhang, C.; Tian, Y.; Wu, G.; Luo, J. Study on Spatial Evolution and Mechanism of County Economic Differences in Hubei Province from 2005 to 2020. Front. Earth Sci. 2022, 10, 1–20. [Google Scholar] [CrossRef]
- Gong, S.S.; Ge, L.L.; Zhang, T. Geographic Distribution of Centenarians and Environmental Backgrounds of Longevity Regions in Hubei Province. Trop. Geogr. 2016, 36, 727–735. [Google Scholar] [CrossRef]
- Ma, Y.; Tong, Y.; Ren, J. Calculation and Robustness Test of County-scale Ecological Efficiency Based on Multisource Remote Sensing Data: Taking the Urban Agglomeration in the Middle Reaches of Yangtze River as an Example. J. Nat. Resour. 2019, 34, 1196–1208. [Google Scholar] [CrossRef]
- Ma, Y.; Zhang, R. Spatial Pattern and Influencing Factors of County-scale Eco-efficiency: Case of the Yangtze River Economic Belt. J. Chin. Univ. Geosci. Soc. Sci. Ed. 2021, 21, 62–76. [Google Scholar] [CrossRef]
- Liu, H.M.; Fang, C.L.; Huang, J.J.; Zhu, X.D.; Zhou, Y.; Wang, Z.B.; Zhang, Q. The Spatial-temporal Characteristics and Influencing Factors of Air Pollution in Beijing-Tianjin-Hebei Urban Agglomeration. Acta Geogr. Sin. 2018, 73, 177–191. [Google Scholar] [CrossRef]
- Bian, J.; Zhang, Y.; Shuai, C.; Shen, L.; Ren, H.; Wang, Y. Have Cities Effectively Improved Ecological Well-Being Performance? Empirical Analysis of 278 Chinese Cities. J. Clean. Prod. 2020, 245, 118913. [Google Scholar] [CrossRef]
- Guo, J.F.; Ou, X.T. Impact of Carbon Emission Trading Policy on Urban Ecological Well-being Performance from the Performance from the Perspective of High-quality Development. J. Earth Sci. Environ. 2023, 45, 373–384. [Google Scholar] [CrossRef]
- Hu, M.J.; Li, Z.J.; Ding, Z.S.; Zhou, N.X.; Qin, D.L.; Zhang, B. Urban Ecological Well-being Intensity and Driving Mode Based on Three-dimensional Well-being: Taking the Yangtze Delta as an Example. J. Nat. Resour. 2021, 36, 327–341. [Google Scholar] [CrossRef]
- Deng, Y.J.; Yang, X.; Ma, Q.W.; Wang, L.D. Regional Disparity and Convergence of China’s Ecological Welfare Performance Level. Chin. Popul. Resour. Environ. 2021, 31, 132–143. [Google Scholar] [CrossRef]
- Leslie, E.; Sugiyama, T.; Ierodiaconou, D.; Kremer, P. Perceived and Objectively Measured Greenness of Neighbourhoods: Are They Measuring the Same Thing? Landsc. Urban Plan. 2010, 95, 28–33. [Google Scholar] [CrossRef]
- Wilker, E.H.; Wu, C.-D.; McNeely, E.; Mostofsky, E.; Spengler, J.; Wellenius, G.A.; Mittleman, M.A. Green Space and Mortality Following Ischemic Stroke. Environ. Res. 2014, 133, 42–48. [Google Scholar] [CrossRef]
- Magnolfi, S.U.; Petruzzi, E.; Pinzani, P.; Malentacchi, F.; Pazzagli, M.; Antonini, F.M. Longevity Index (LI%) and Centenarity Index (CI%): New Indicators to Evaluate the Characteristics of Aging Process in the Italian Population. Arch. Gerontol. Geriatr. 2007, 44, 271–276. [Google Scholar] [CrossRef]
- Tone, K. A Slacks-Based Measure of Super-Efficiency in Data Envelopment Analysis. Eur. J. Oper. Res. 2002, 143, 32–41. [Google Scholar] [CrossRef]
- Ding, X.H.; He, J.H.; Wang, L.Y. Interprovincial Water Resources Utilization Efficiency and its Driving Factors Considering Undesirable Outputs: Based on SE-SBM and Tobit model. Chin. Popul. Resour. Environ. 2018, 28, 157–164. [Google Scholar] [CrossRef]
- Chen, Q. Advanced Econometrics and Stata Applications, 2nd ed.; Higher Education Press: Beijing, China, 2014; pp. 575–598. ISBN 978-7-04-032983-4. [Google Scholar]
- Li, X.; Chen, J. Global or Local Spatial Spillovers? Industrial Diversity and Economic Resilience in the Middle Reaches of the Yangtze River Urban Agglomeration, China. Sustainability 2023, 15, 11376. [Google Scholar] [CrossRef]
- Chen, J.; Li, X.; Zhu, Y. Shock Absorber and Shock Diffuser: The Multiple Roles of Industrial Diversity in Shaping Regional Economic Resilience after the Great Recession. Ann. Reg. Sci. 2024, 72, 1015–1045. [Google Scholar] [CrossRef]
- Wang, J.; Li, X.; Christakos, G.; Liao, Y.; Zhang, T.; Gu, X.; Zheng, X. Geographical Detectors-Based Health Risk Assessment and Its Application in the Neural Tube Defects Study of the Heshun Region, China. Int. J. Geogr. Inf. Sci. 2010, 24, 107–127. [Google Scholar] [CrossRef]
- LeSage, J.P. What Regional Scientists Need to Know about Spatial Econometrics. Rev. Reg. Stud. 2014, 13–32. [Google Scholar]
- Cui, S.H.; Yu, J.; Chen, Y.H.; Han, C.X. Research on temporal and spatial differentiation of urban human settlement environment quality in Hubei Province based on entropy TOPSIS. J. Cent. Chin. Norm. Univ. Nat. Sci. Ed. 2022, 56, 695–702+716. [Google Scholar] [CrossRef]
- Wang, W.Y.; Li, Y.H.; Li, H.R.; Yu, J.P.; Xiao, Z.Y. Environmental Mechanism of Regional Longevity in China. Sci. Decis. Mak. 2015, 1, 1–12. [Google Scholar] [CrossRef]
- Wang, S.; Ren, Z. Spatial Variations and Macroeconomic Determinants of Life Expectancy and Mortality Rate in China: A County-Level Study Based on Spatial Analysis Models. Int. J. Public Health 2019, 64, 773–783. [Google Scholar] [CrossRef]
- Jia, J.; Ke, R. Accompanying Learning or Accompanying Work—Impact of Admission Thresholds in Different Regions on the Labor Supply of Mothers in Migrant Families. J. Shanxi. Univ. Finan. Econ. 2024, 46, 29–44. [Google Scholar] [CrossRef]
- Xu, M.B.; Zeng, M. Gender Identity Norms and the Gender Gap of College Major Choice. J. Econ. Sci. 2024, 198–219. [Google Scholar] [CrossRef]
| Dimension | Criteria | Two-Level Index | Indicators | Unit | Reference |
|---|---|---|---|---|---|
| Input indicators | Land resource input | Construction land consumption | Developed area | km2 | Ma et al.(2019) [47]; Ma & Zhang (2021) [48] |
| Cropland consumption | Cropland area | km2 | Ma et al.(2019) [47] | ||
| Energy input | Energy consumption | Energy consumption index | (index) | Ma & Zhang (2021) [48] | |
| Ecological environment destruction | Environmental quality | PM2.5 concentration | µg/m3 | Zhu et al. (2022) [12]; Xia & Li (2022) [14] | |
| Nonecological resource input | Labor force | Population aged 15 to 64 | 104 person | Bian et al. (2020) [50]; Guo & Ou (2023) [51] | |
| Output indicators | Economic well-being | Level of economic development | GDP per capita | CNY | Liu et al. (2024) [31] |
| Social well-being | Universal education | Average years of schooling | year | Han et al. (2025) [22] | |
| Health care | Number of beds in health institutions per 1000 persons | bed/1000 persons | Hu et al. (2021) [52] | ||
| Overall quality of life | Average life expectancy at birth | year | Deng at al. (2021) [53] | ||
| Environmental well-being | Level of favorable environment | NDVI | (index) | Leslie et al. (2010) [54]; Wilker et al. (2014) [55] |
| q Value | Interaction Type |
|---|---|
| q (X1 ∩ X2) < min [q (X1), q (X2)] | Non-linear weakening |
| min [q (X1), q (X2)] < q (X1 ∩ X2) < max [q (X1), q (X2)] | Single-factor weakening |
| q (X1 ∩ X2) = q (X1) + q (X2) | Independent |
| q (X1 ∩ X2) > max [q (X1), q (X2)] | Bivariable enhancement |
| q (X1 ∩ X2) > q (X1) + q (X2) | Non-linear enhancement |
| Year | Moran’s I | Z | p |
|---|---|---|---|
| 2000 | 0.126 | 2.32 | 0.02 |
| 2010 | 0.296 | 5.1 | <0.01 |
| 2020 | 0.391 | 6.655 | <0.01 |
| Year | Overall Longevity | Male Longevity | Female Longevity | ||||||
|---|---|---|---|---|---|---|---|---|---|
| Moran’s I | Z | p | Moran’s I | Z | p | Moran’s I | Z | p | |
| 2000 | 0.361 | 6.153 | <0.01 | 0.451 | 7.641 | <0.01 | 0.295 | 5.043 | <0.01 |
| 2010 | 0.304 | 5.203 | <0.01 | 0.386 | 6.6 | <0.01 | 0.215 | 3.732 | <0.01 |
| 2020 | 0.414 | 7.018 | <0.01 | 0.443 | 7.517 | <0.01 | 0.319 | 5.443 | <0.01 |
| Var. | OLS | SDM | SLM | SEM | |||||
|---|---|---|---|---|---|---|---|---|---|
| K = 3 | K = 4 | K = 5 | K = 6 | K = 7 | K = 6 | K = 6 | |||
| Coef. | EWP | 0.16 ** (2.56) | 0.12 *** (2.80) | 0.11 *** (2.78) | 0.11 *** (2.71) | 0.10 ** (2.52) | 0.10 ** (2.45) | 0.11 *** (2.60) | 0.11 *** (2.61) |
| lnPGDP | 0.60 *** (9.33) | 0.16 ** (2.51) | 0.14 ** (2.27) | 0.14 ** (2.28) | 0.14 ** (2.13) | 0.14 ** (2.10) | 0.23 *** (4.22) | 0.25 *** (3.42) | |
| lnURB | 0.16 * (1.92) | 0.12 ** (1.98) | 0.11 * (1.84) | 0.09 (1.59) | 0.09 (1.51) | 0.08 (1.36) | 0.10 * (1.68) | 0.16 *** (2.74) | |
| lnTEM | 1.64 *** (4.11) | 0.75 (1.58) | 0.96 ** (2.01) | 1.01 ** (2.18) | 1.06 ** (2.30) | 1.05 ** (2.24) | 0.52 * (1.83) | 2.02 *** (4.90) | |
| lnPRE | 0.02 (0.47) | 0.17 *** (3.28) | 0.18 *** (3.45) | 0.17 *** (3.28) | 0.17 *** (3.43) | 0.17 *** (3.44) | 0.04 (1.26) | 0.19 *** (3.76) | |
| lnALT | 2.17 ** (2.49) | 1.91 *** (3.06) | 2.07 *** (3.32) | 1.96 *** (3.17) | 1.97 *** (3.17) | 1.96 *** (3.16) | 1.52 *** (2.58) | 2.71 *** (4.64) | |
| W × EWP | 0.07 (1.07) | 0.09 (1.18) | 0.09 (1.04) | 0.13 (1.42) | 0.14 (1.43) | ||||
| W × lnPGDP | 0.21 *** (2.74) | 0.27 *** (3.32) | 0.25 *** (2.84) | 0.28 *** (2.96) | 0.29 *** (2.80) | ||||
| W × lnURB | −0.04 (−0.42) | −0.10 (−0.93) | −0.07 (−0.55) | −0.08 (−0.58) | −0.08 (−0.50) | ||||
| W × lnTEM | −0.02 (−0.03) | −0.39 (−0.69) | −0.59 (−1.03) | −0.75 (−1.27) | −0.72 (−1.15) | ||||
| W × lnPRE | −0.24 *** (−3.67) | −0.25 *** (−3.56) | −0.22 *** (−3.12) | −0.23 *** (−3.13) | −0.24 *** (−3.14) | ||||
| W × lnALT | −0.89 (−1.06) | −0.62 (−0.66) | −1.42 (−1.40) | −1.77 (−1.59) | −1.96 (−1.62) | ||||
| ρ | 0.46 *** (8.32) | 0.48 *** (8.10) | 0.51 *** (8.11) | 0.49 *** (7.41) | 0.49 *** (6.99) | 0.59 *** (11.23) | |||
| λ | 0.71 *** (11.64) | ||||||||
| sigma2 | 0.12 *** (12.17) | 0.12 *** (12.21) | 0.12 *** (12.21) | 0.12 *** (12.25) | 0.12 *** (12.27) | 0.12 *** (12.22) | 0.13 *** (11.83) | ||
| Direct effect | EWP | 0.14 *** (2.93) | 0.13 *** (2.95) | 0.13 *** (2.84) | 0.12 *** (2.74) | 0.12 *** (2.66) | 0.12 ** (2.57) | ||
| lnPGDP | 0.20 *** (3.37) | 0.18 *** (3.12) | 0.18 *** (3.03) | 0.17 *** (2.82) | 0.17 *** (2.72) | 0.25 *** (4.51) | |||
| lnURB | 0.13 ** (2.18) | 0.11 * (1.88) | 0.10 * (1.69) | 0.09 (1.58) | 0.09 (1.43) | 0.11 * (1.88) | |||
| lnTEM | 0.79 * (1.82) | 0.96 ** (2.17) | 1.00 ** (2.31) | 1.03 ** (2.40) | 1.03 ** (2.35) | 0.55 * (1.89) | |||
| lnPRE | 0.14 *** (3.06) | 0.16 *** (3.29) | 0.15 *** (3.17) | 0.16 *** (3.37) | 0.16 *** (3.38) | 0.05 (1.35) | |||
| lnALT | 1.95 *** (2.97) | 2.16 *** (3.30) | 1.95 *** (2.99) | 1.92 *** (2.98) | 1.91 *** (2.98) | 1.68 *** (2.69) | |||
| Indirect effect | EWP | 0.22 * (1.80) | 0.26 * (1.86) | 0.27 * (1.70) | 0.34 ** (1.96) | 0.36 * (1.92) | 0.15 ** (2.21) | ||
| lnPGDP | 0.48 *** (5.23) | 0.60 *** (5.79) | 0.60 *** (5.08) | 0.65 *** (4.93) | 0.65 *** (4.53) | 0.31 *** (4.67) | |||
| lnURB | 0.04 (0.24) | −0.07 (−0.39) | −0.01 (−0.06) | −0.04 (−0.17) | −0.04 (−0.15) | 0.14 * (1.76) | |||
| lnTEM | 0.56 (0.81) | 0.13 (0.17) | −0.14 (−0.17) | −0.43 (−0.50) | −0.37 (−0.41) | 0.68 * (1.90) | |||
| lnPRE | −0.28 *** (−3.2) | −0.30 *** (−3.06) | −0.26 ** (−2.47) | −0.27 ** (−2.47) | −0.29 ** (−2.53) | 0.06 (1.27) | |||
| lnALT | 0.11 (0.07) | 0.79 (0.43) | −0.64 (−0.3) | −1.33 (−0.58) | −1.69 (−0.68) | 2.14 ** (2.33) | |||
| Total effect | EWP | 0.36 ** (2.38) | 0.40 ** (2.39) | 0.40 ** (2.16) | 0.47 ** (2.36) | 0.48 ** (2.29) | 0.27 ** (2.42) | ||
| lnPGDP | 0.68 *** (6.85) | 0.79 *** (7.09) | 0.78 *** (6.20) | 0.82 *** (6.00) | 0.82 *** (5.50) | 0.56 *** (5.12) | |||
| lnURB | 0.17 (0.92) | 0.04 (0.18) | 0.09 (0.35) | 0.05 (0.20) | 0.04 (0.14) | 0.25 * (1.85) | |||
| lnTEM | 1.35 ** (1.98) | 1.09 (1.51) | 0.86 (1.07) | 0.60 (0.72) | 0.65 (0.77) | 1.24 * (1.94) | |||
| lnPRE | −0.13 (−1.51) | −0.14 (−1.47) | −0.11 (−1.06) | −0.11 (−1.05) | −0.13 (−1.19) | 0.11 (1.32) | |||
| lnALT | 2.06 (1.04) | 2.95 (1.33) | 1.30 (0.52) | 0.59 (0.22) | 0.22 (0.08) | 3.82 ** (2.56) | |||
| N | 309 | 309 | 309 | 309 | 309 | 309 | 309 | 309 | |
| R2 | 0.78 | 0.82 | 0.83 | 0.83 | 0.83 | 0.84 | 0.80 | 0.74 | |
| AIC | 356.87 | 285.79 | 280.04 | 279.66 | 279.35 | 279.91 | 292.53 | 288.73 | |
| BIC | 383.01 | 382.85 | 377.11 | 376.73 | 376.42 | 376.97 | 367.20 | 318.59 | |
| log-likelihood | −171.44 | −116.89 | −114.02 | −113.83 | −113.68 | −113.95 | −126.27 | −136.36 | |
| Var. | Population Longevity | |||
|---|---|---|---|---|
| Overall | Male | Female | ||
| Direct effect | EWP | 0.12 ***(2.74) | 0.12 ***(2.92) | 0.11 **(2.2) |
| lnPGDP | 0.17 ***(2.82) | 0.13 **(2.24) | 0.21 ***(3.07) | |
| lnURB | 0.09(1.58) | −0.08(−1.36) | 0.24 ***(3.52) | |
| lnTEM | 1.03 **(2.4) | 1.26 ***(3.12) | 0.74(1.5) | |
| lnPRE | 0.16 ***(3.37) | 0.12 ***(2.81) | 0.18 ***(3.4) | |
| lnALT | 1.92 ***(2.98) | 1.67 ***(2.77) | 2.05 ***(2.82) | |
| Indirect effect | EWP | 0.34 **(1.96) | 0.35 **(2.21) | 0.32 *(1.78) |
| lnPGDP | 0.65 ***(4.93) | 0.67 ***(5.48) | 0.61 ***(4.4) | |
| lnURB | −0.04(−0.17) | 0.08(0.35) | −0.15(−0.58) | |
| lnTEM | −0.43(−0.5) | −0.27(−0.34) | −0.52(−0.57) | |
| lnPRE | −0.27 **(−2.47) | −0.19 *(−1.89) | −0.34 ***(−2.93) | |
| lnALT | −1.33(−0.58) | −1.29(−0.61) | −1.14(−0.49) | |
| Total effect | EWP | 0.47 **(2.36) | 0.48 ***(2.63) | 0.44 **(2.13) |
| lnPGDP | 0.82 ***(6) | 0.79 ***(6.31) | 0.82 ***(5.83) | |
| lnURB | 0.05(0.2) | 0(0.01) | 0.09(0.32) | |
| lnTEM | 0.6(0.72) | 0.99(1.29) | 0.22(0.26) | |
| lnPRE | −0.11(−1.05) | −0.07(−0.68) | −0.15(−1.4) | |
| lnALT | 0.59(0.22) | 0.38(0.16) | 0.91(0.34) | |
| ρ | 0.49 ***(7.41) | 0.48 ***(7.30) | 0.43 ***(6.05) | |
| N | 309 | 309 | 309 | |
| R2 | 0.83 | 0.86 | 0.78 | |
| AIC | 279.35 | 240.54 | 362.81 | |
| BIC | 376.42 | 337.6 | 459.88 | |
| log-likelihood | −113.68 | −94.27 | −155.41 | |
Disclaimer/Publisher’s Note: The statements, opinions and data contained in all publications are solely those of the individual author(s) and contributor(s) and not of MDPI and/or the editor(s). MDPI and/or the editor(s) disclaim responsibility for any injury to people or property resulting from any ideas, methods, instructions or products referred to in the content. |
© 2025 by the authors. Licensee MDPI, Basel, Switzerland. This article is an open access article distributed under the terms and conditions of the Creative Commons Attribution (CC BY) license (https://creativecommons.org/licenses/by/4.0/).
Share and Cite
Yan, J.; Ao, R.; Zhou, X.; Jiang, J. The Evolution of Ecological Well-Being Performance and Its Effects on Population Longevity: A County-Level Spatiotemporal Analysis of Hubei Province, China. Sustainability 2025, 17, 5669. https://doi.org/10.3390/su17135669
Yan J, Ao R, Zhou X, Jiang J. The Evolution of Ecological Well-Being Performance and Its Effects on Population Longevity: A County-Level Spatiotemporal Analysis of Hubei Province, China. Sustainability. 2025; 17(13):5669. https://doi.org/10.3390/su17135669
Chicago/Turabian StyleYan, Jinbo, Rongjun Ao, Xiaoqi Zhou, and Jing Jiang. 2025. "The Evolution of Ecological Well-Being Performance and Its Effects on Population Longevity: A County-Level Spatiotemporal Analysis of Hubei Province, China" Sustainability 17, no. 13: 5669. https://doi.org/10.3390/su17135669
APA StyleYan, J., Ao, R., Zhou, X., & Jiang, J. (2025). The Evolution of Ecological Well-Being Performance and Its Effects on Population Longevity: A County-Level Spatiotemporal Analysis of Hubei Province, China. Sustainability, 17(13), 5669. https://doi.org/10.3390/su17135669