
Environmental and Health Benefits: A Bibliometric and Knowledge Mapping Analysis of Research Progress


Abstract
1. Introduction
2. Materials and Methods
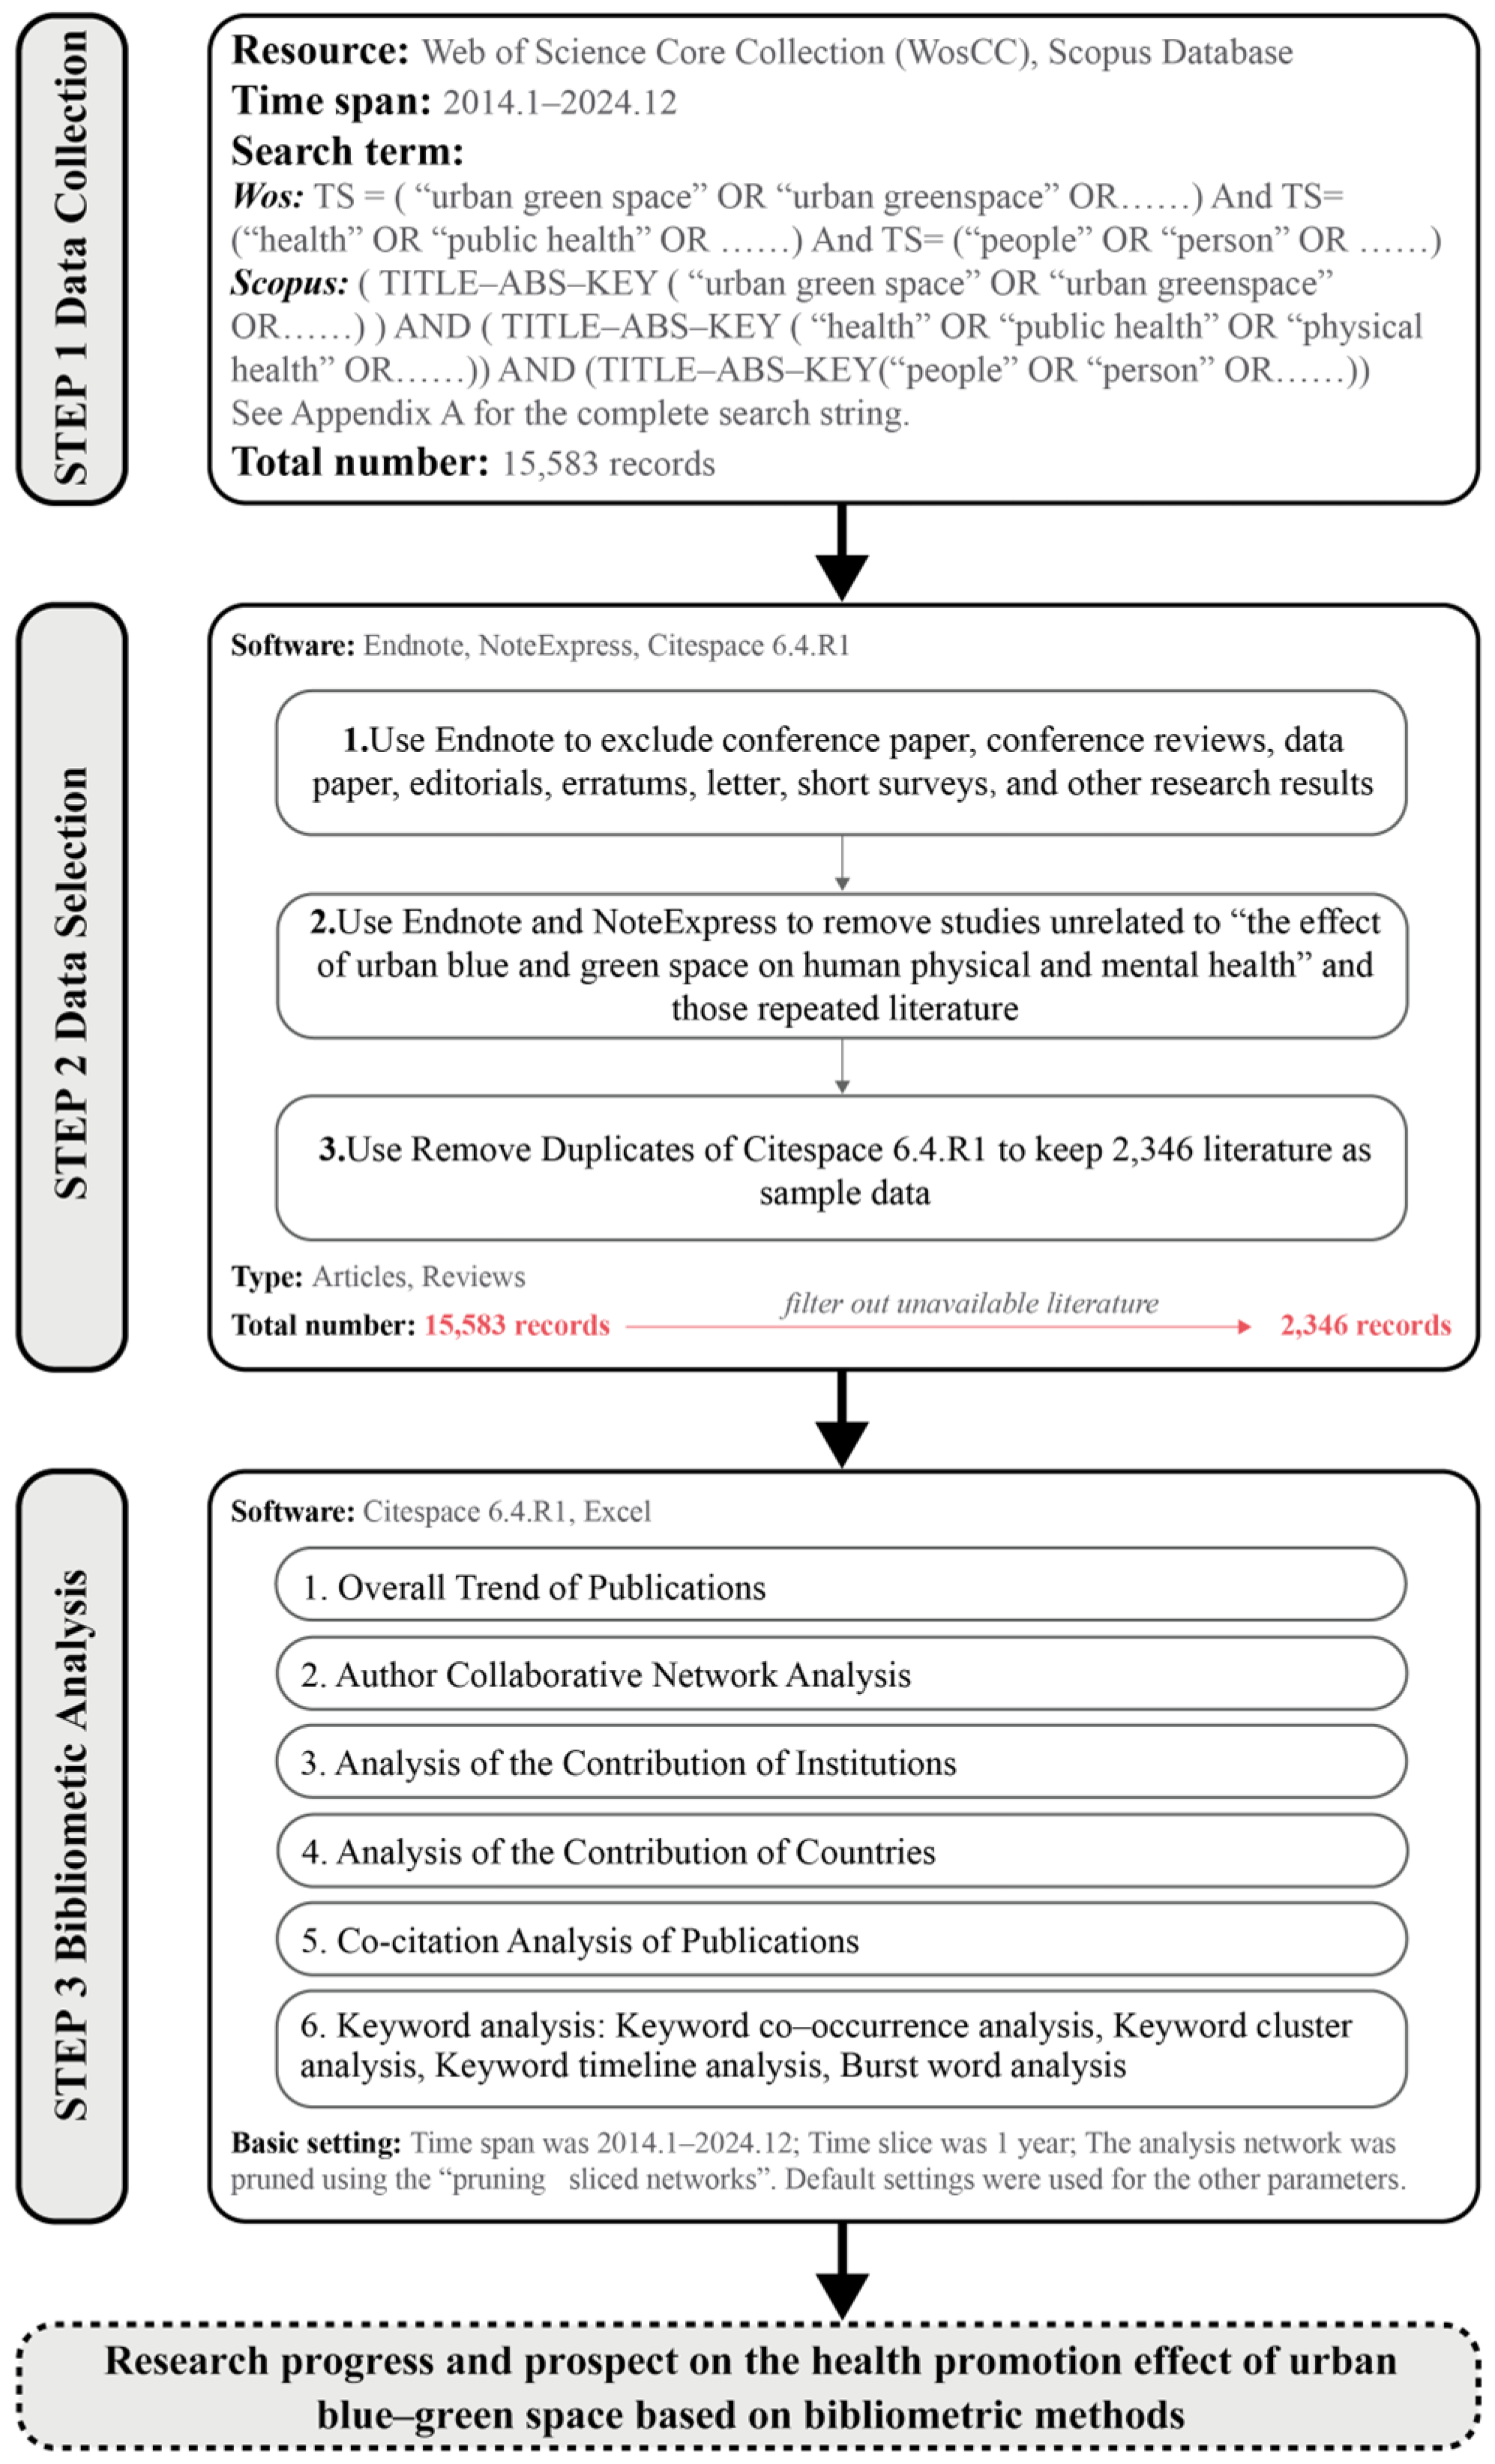
2.1. Data Sources
2.2. Data Analysis Methods
3. Results
3.1. Overall Trend of Publications
3.2. Author Collaborative Network Analysis
3.3. An Analysis of the Contribution of Institutions
3.4. An Analysis of the Contribution of Countries
3.5. Analysis of Hotspots and Trends
3.5.1. Co-Citation Analysis of Publications
3.5.2. Keyword Analysis
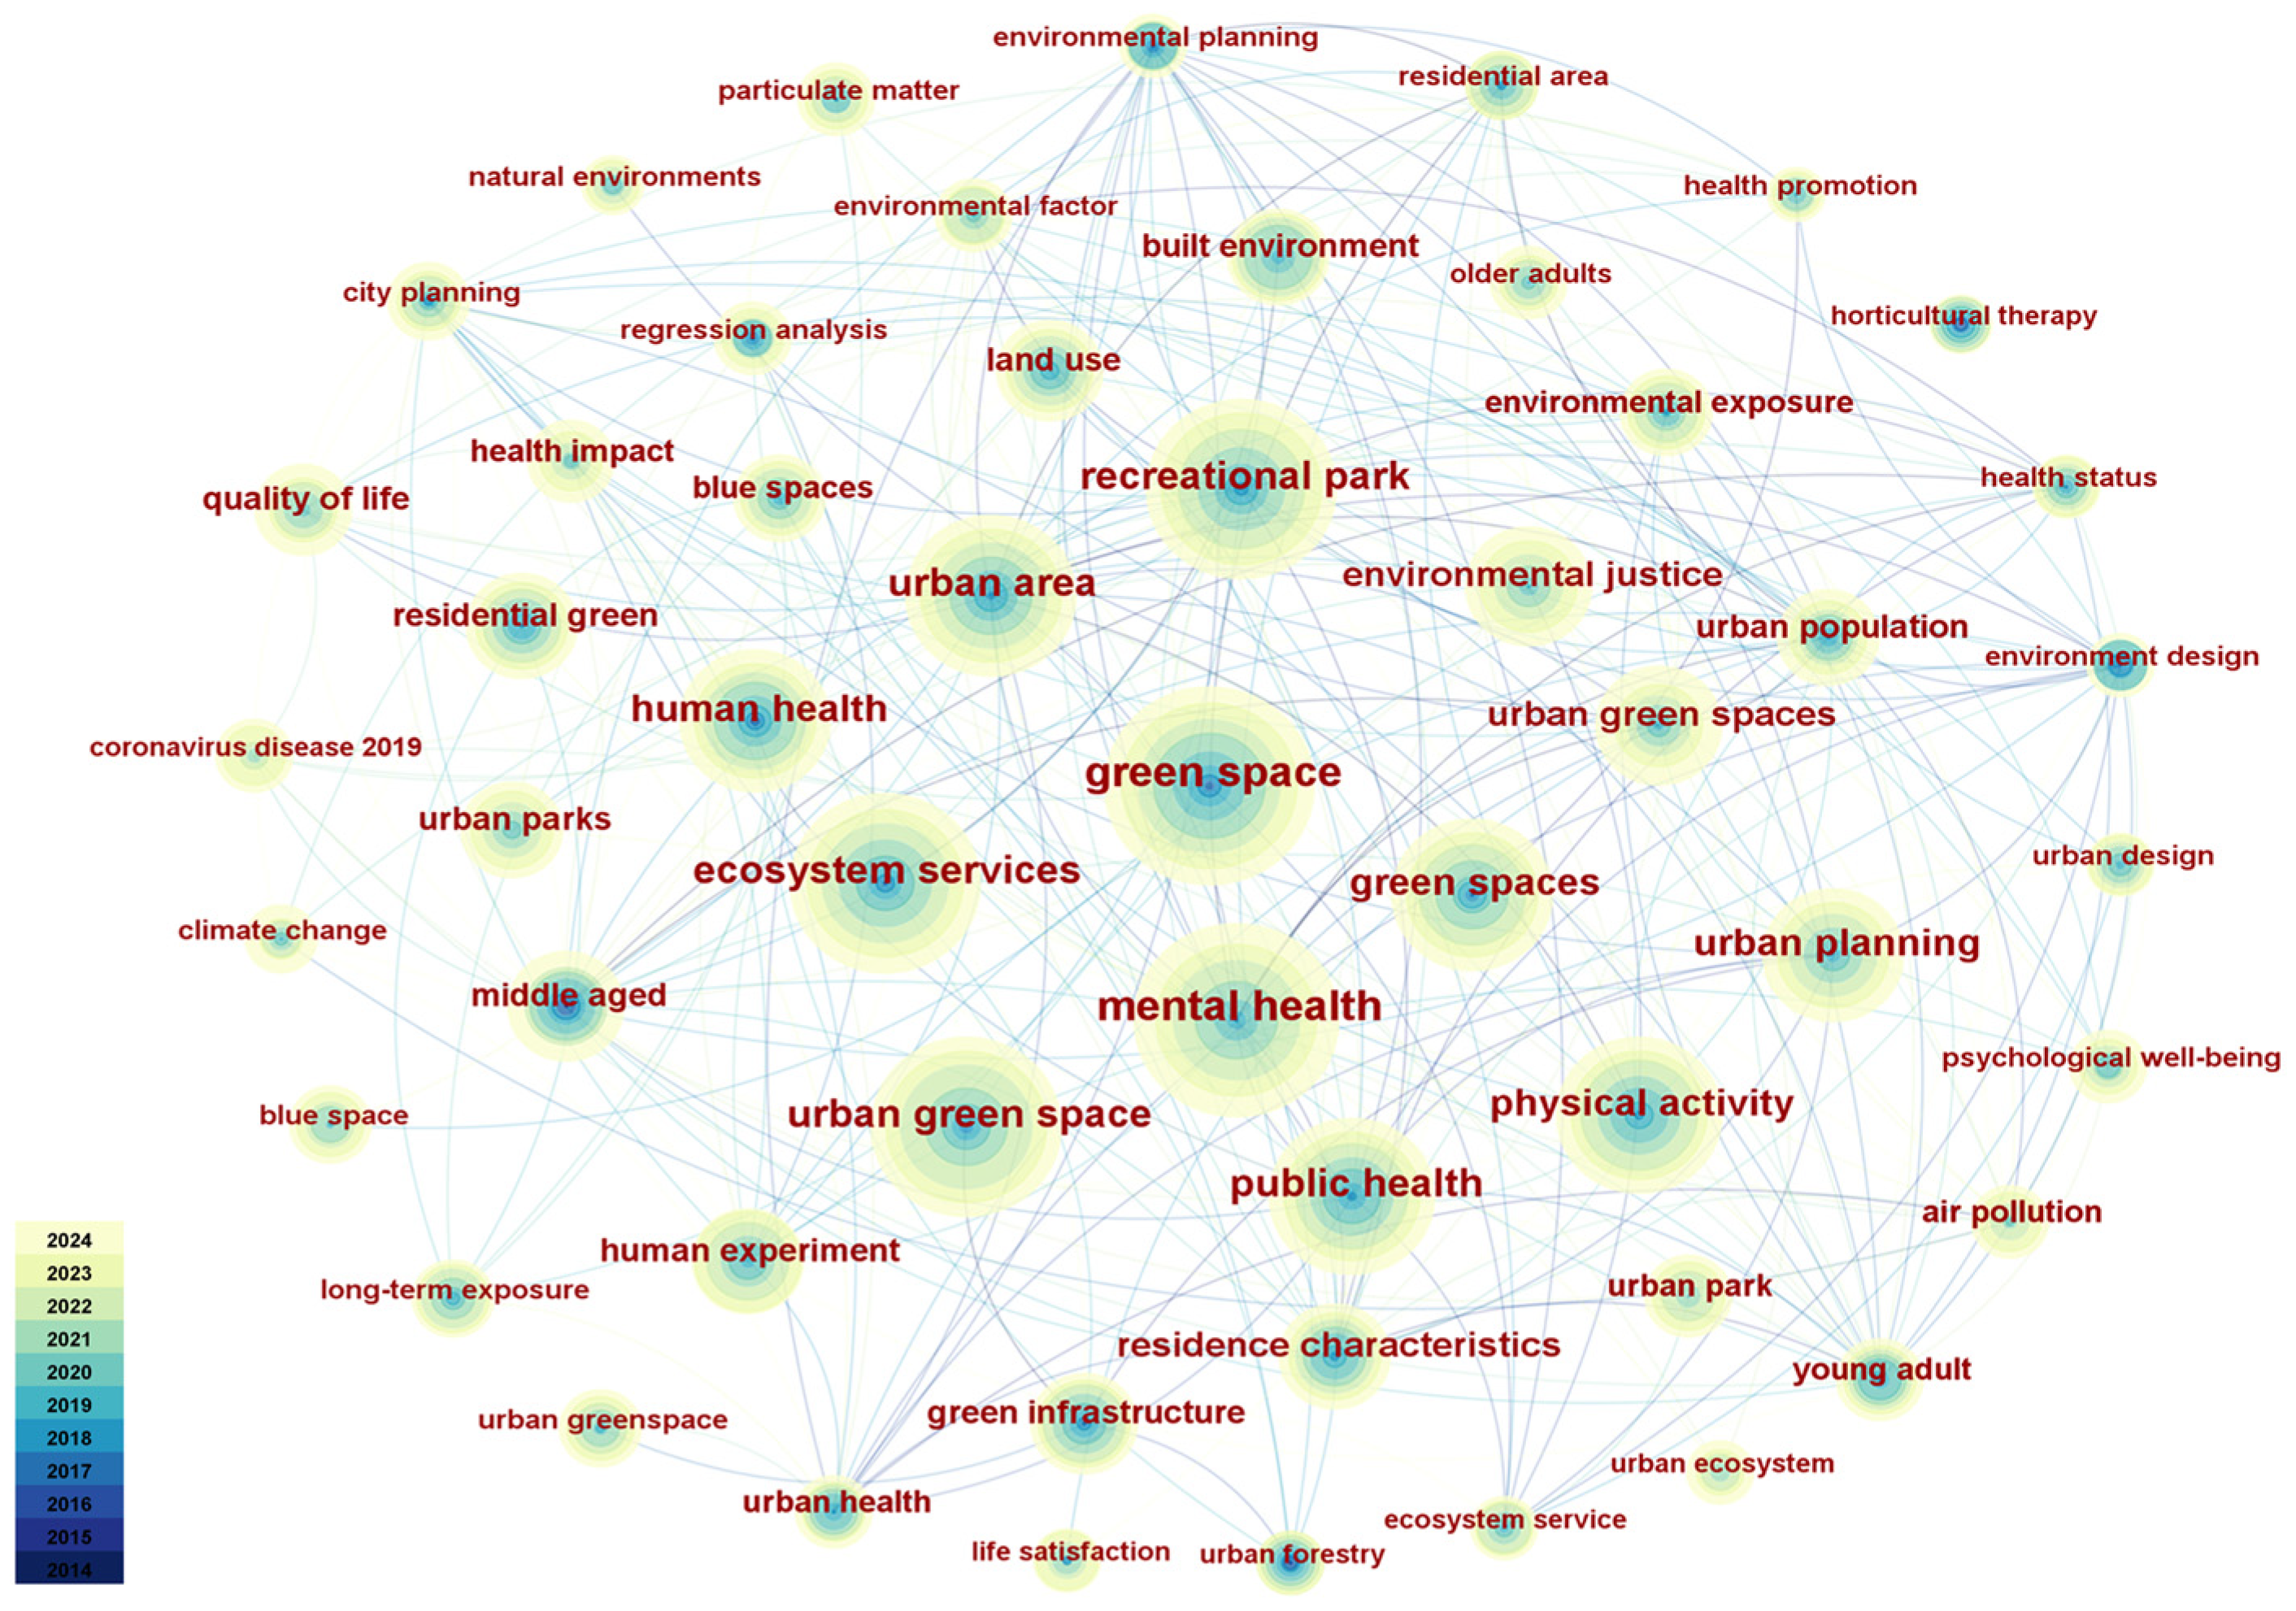
Keyword Co-Occurrence Analysis
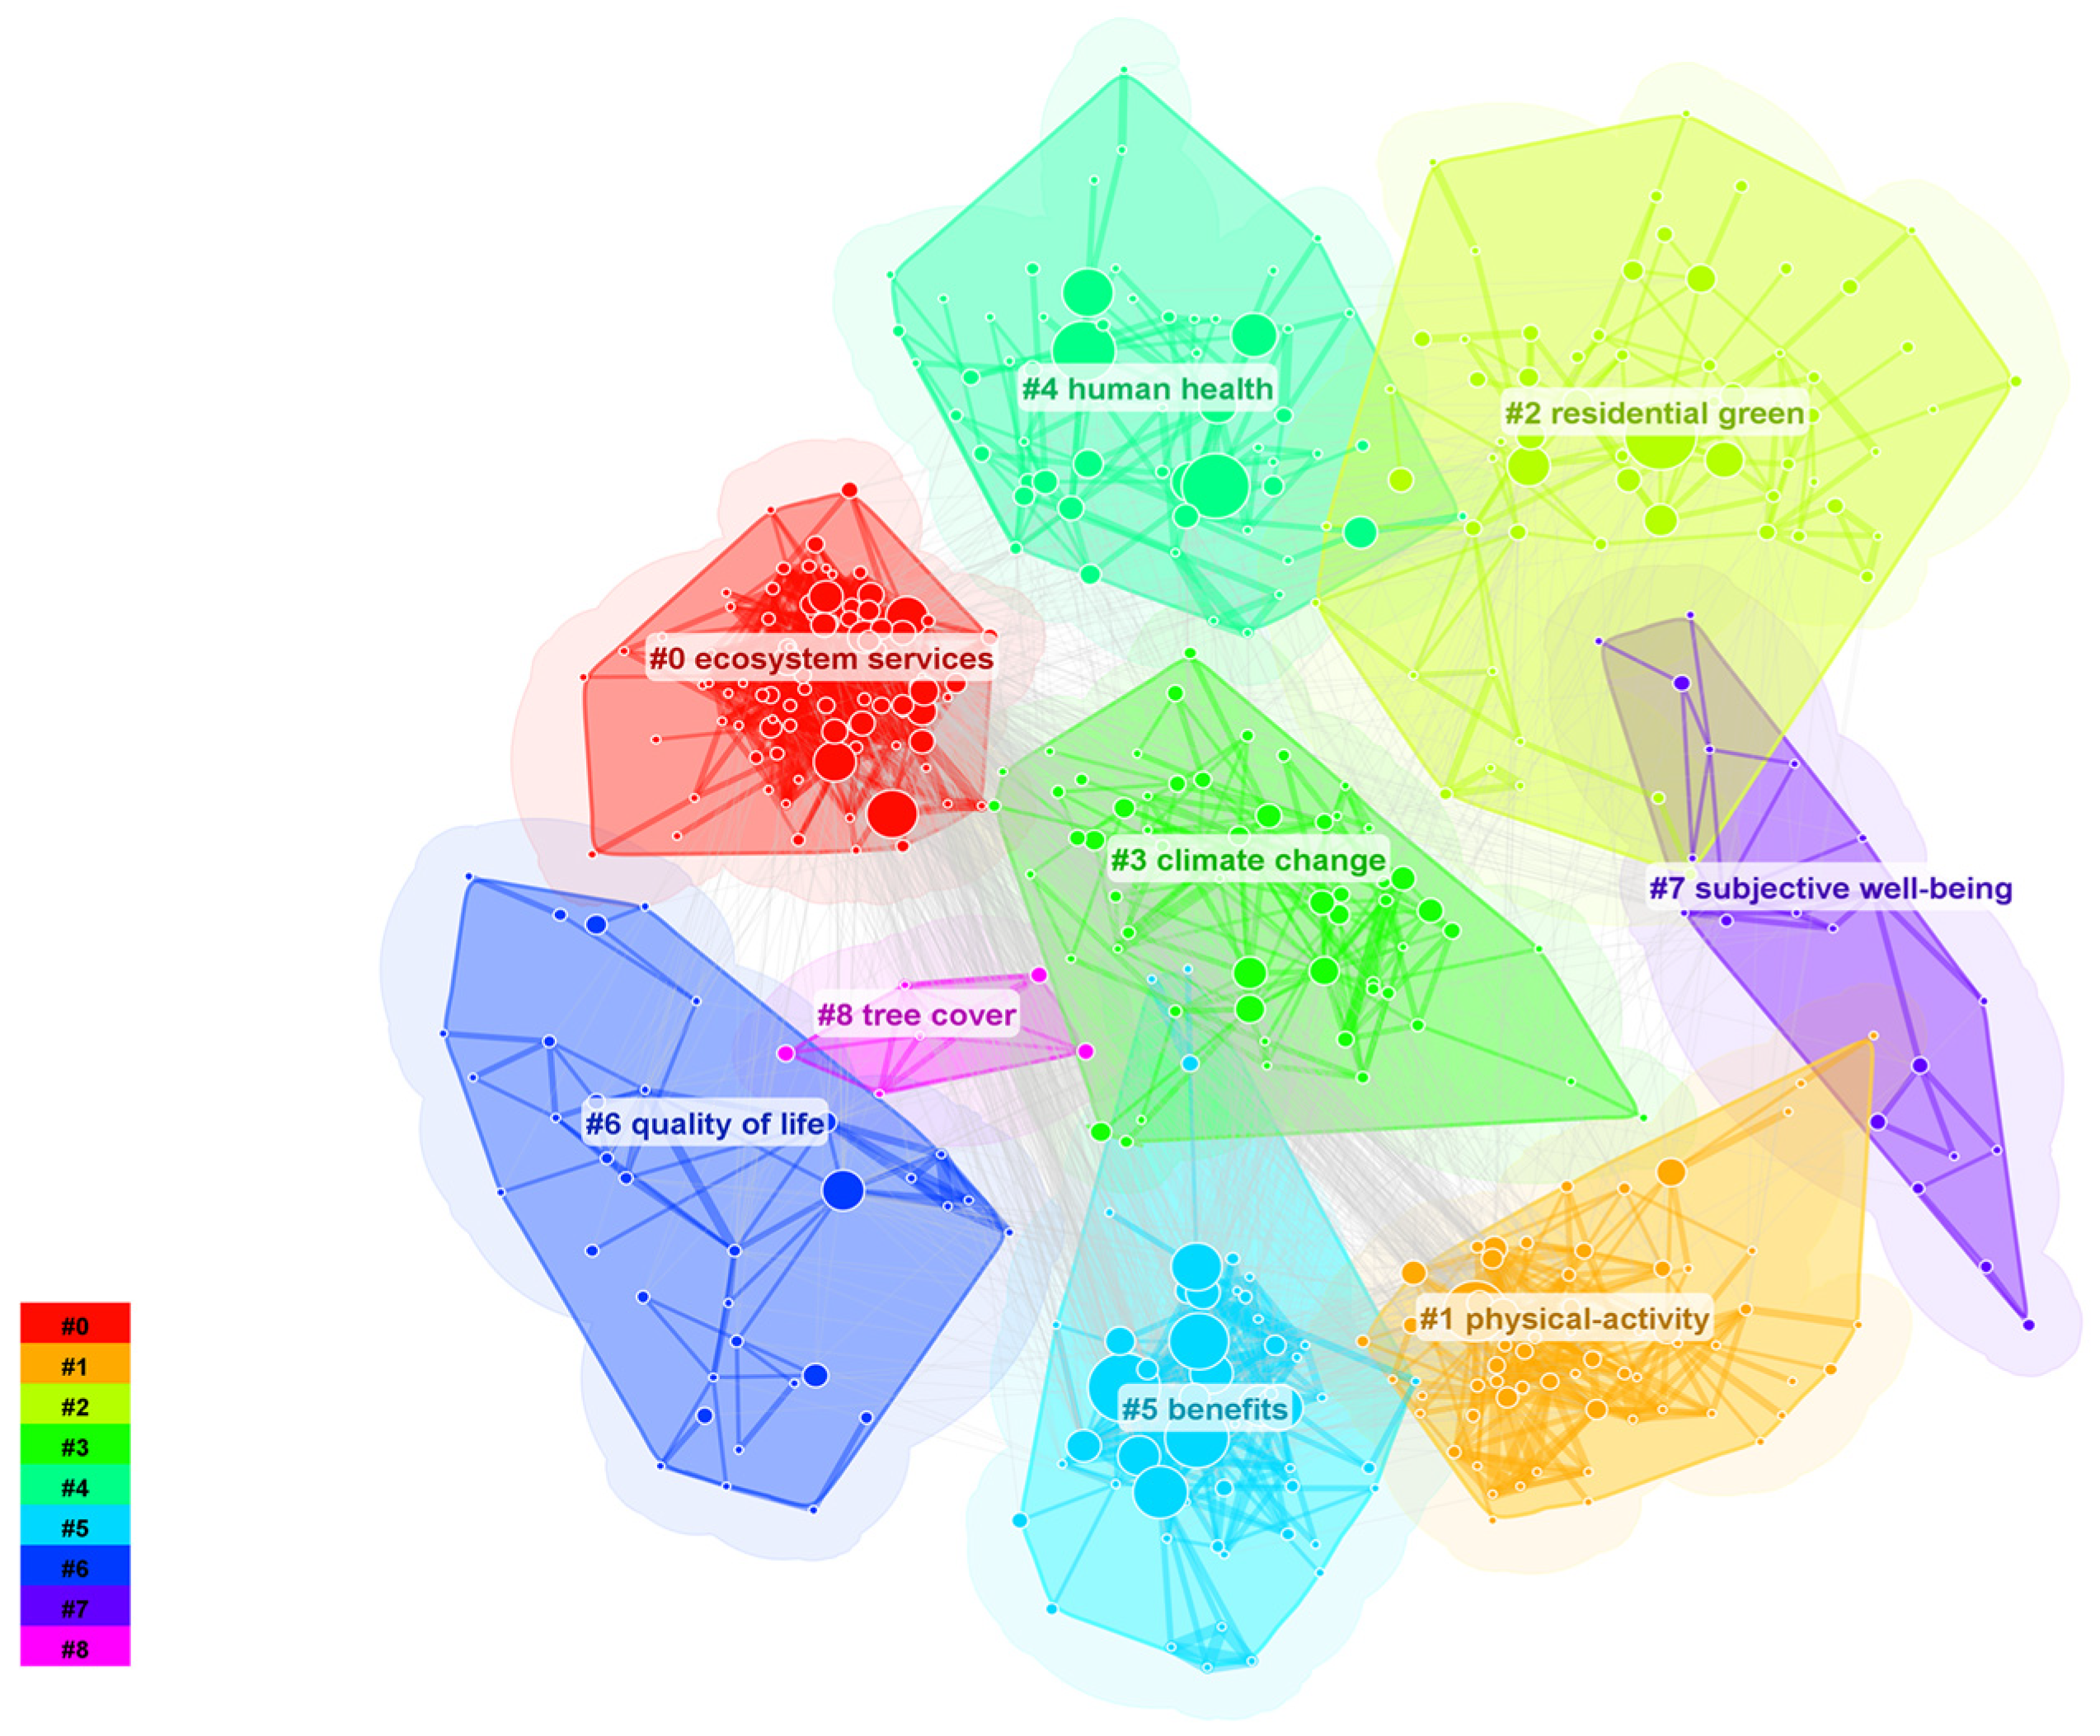
Keyword Cluster Analysis
Keyword Timeline Analysis
Burst Word Analysis
4. Discussion
4.1. Analysis of Research on Health Benefits of Urban Blue–Green Spaces
4.2. Limitations and Future Research
5. Conclusions
Author Contributions
Funding
Data Availability Statement
Acknowledgments
Conflicts of Interest
Appendix A

| Search String | |
|---|---|
| Web of Science Database | (TS = (“urban green space” OR “urban greenspace” OR “urban green infrastructure” OR “neighborhood greenness” OR “urban tree” OR “urban greenway” OR “urban forest *” OR “urban greenery” OR “residential green” OR “urban park” OR “garden” OR “urban blue space” OR “urban blue *” OR “urban lake” OR “urban river *” OR “urban coastal” OR “urban beach *” OR “urban seaside”) And TS = (“health” OR “public health” OR “physical health” OR “mental health” OR “health status” OR “functional status” OR “psychological health” OR “well-being” OR “wellbeing” OR “disease” OR “disorder” OR “stress *” OR “depress *” OR “anxiety” OR “emotion *” OR “cognitive *” OR “mood” OR “respiratory” OR “quality of life” OR “life satisfaction” OR “illness” OR “happiness” OR “attention” OR “chronic” OR “obesity” OR “cardiovascular *” OR “hypertension” OR “circulatory” OR “sleep” OR “immune” OR “diabet *” OR “respirat*” OR “morbidit *” OR “mortalit *” OR “incidence” OR “restoration” OR “recover”) And TS = (“people” OR “person” OR “participant” OR “subject” OR “volunteer” OR “respondent” OR “adult” OR “teenager” OR “older” OR “man” OR “woman” OR “human” OR “child”)) |
| Scopus Database | ((TITLE-ABS-KEY (“urban green space” OR “urban greenspace” OR “urban green infrastructure” OR “neighbourhood greenness” OR “urban tree” OR “urban greenway” OR “urban forest *” OR “urban greenery” OR “residential green” OR “urban park” OR “garden” OR “urban blue space” OR “urban blue *” OR “urban lake” OR “urban river *” OR “urban coastal” OR “urban beach *” OR “urban seaside”)) AND (TITLE-ABS-KEY (“health” OR “public health” OR “physical health” OR “mental health” OR “health status” OR “functional status” OR “psychological health” OR “well-being” OR “wellbeing” OR “disease” OR “disorder” OR “stress *” OR “depress *” OR “anxiety” OR “emotion *” OR “cognitive *” OR “mood” OR “respiratory” OR “quality of life” OR “life satisfaction” OR “illness” OR “happiness” OR “attention” OR “chronic” OR “obesity” OR “cardiovascular *” OR “hypertension” OR “circulatory” OR “sleep” OR “immune” OR “diabet *” OR “respirat *” OR “morbidit *” OR “mortalit *” OR “incidence” OR “restoration” OR “recover”)) AND (TITLE-ABS-KEY (“people” OR “person” OR “participant” OR “subject” OR “volunteer” OR “respondent” OR “adult” OR “teenager” OR “older” OR “man” OR “woman” OR “human” OR “child”))) |
References
- Kadakia, K.T.; Galea, S. Urbanization and the Future of Population Health. Milbank Q. 2023, 101, 153–175. [Google Scholar] [CrossRef] [PubMed]
- Callaghan, A.; McCombe, C.; Harrold, A.; Hock, E.; Ito, K.; Spencer, N.; Michalopoulou, M.; Nichols, G. The Impact of Green Spaces on Mental Health in Urban Settings: A Scoping Review. J. Ment. Health 2021, 30, 179–193. [Google Scholar] [CrossRef]
- Okkels, N.; Kristiansen, C.B.; Munk-Jørgensen, P. Urban Mental Health: Challenges and Perspectives. Curr. Opin. Psychiatry 2018, 31, 258–264. [Google Scholar] [CrossRef] [PubMed]
- United Nations, Department of Economic and Social Affairs, Population Division. World Urbanization Prospects: The 2014 Revision; United Nations: New York, NY, USA, 2015. [Google Scholar]
- Anugwom, E.E.; Anugwom, K.N. Urbanization and the Epidemiology of Infectious Diseases: Towards the Social Framing of Global Responses. In Integrated Science of Global Epidemics; Springer International Publishing: Cham, Switzerland, 2023; pp. 307–328. [Google Scholar]
- Wu, J.; Zhang, F.; Li, Z.; Xu, Y.; Zhang, X. The Spatial Non-Stationary Effect of Urban Landscape Pattern on Urban Waterlogging: A Case Study of Shenzhen City. Sci. Rep. 2020, 10, 7369. [Google Scholar] [CrossRef]
- Wang, Q. Urbanization and Global Health: The Role of Air Pollution. Iran. J. Public Health 2018, 47, 1644. [Google Scholar]
- Tong, S.; Prior, J.; McGregor, G.; Shi, X.; Kinney, P. Urban Heat: An Increasing Threat to Global Health. BMJ 2021, 375, n2467. [Google Scholar] [CrossRef]
- Okimiji, O.P.; Oyinloye, B.O.; Atanda, A.; Anyamele, C. Proliferation of Noise Pollution: Implication on Health and Community Perception in Coastal Slums. Appl. Acoust. 2023, 214, 109713. [Google Scholar] [CrossRef]
- Wei, H.; Gao, J.; Zhang, J.; Li, X.; Yin, J.; Wang, G. Emotional Perceptions of People Exposed to Green and Blue Spaces in Forest Parks of Cities at Rapid Urbanization Regions of East China. Urban For. Urban Green. 2022, 78, 127772. [Google Scholar] [CrossRef]
- Millennium Ecosystem Assessment. Ecosystems and Human Well-Being: Synthesis; Island Press: Washington, DC, USA, 2005. [Google Scholar]
- Hernández-Blanco, M.; Costanza, R.; Chen, H.; de Groot, D.; Jarvis, D.; Kubiszewski, I.; Montoya, J.; Sangha, K.; Stoeckl, N.; Turner, K.; et al. Ecosystem Health, Ecosystem Services, and the Well-Being of Humans and the Rest of Nature. Glob. Change Biol. 2022, 28, 5027–5040. [Google Scholar] [CrossRef]
- Hunter, R.F.; Cleary, A.; Nieuwenhuijsen, M.; Fabian, C.; Murphy, N.; O’Hara, K.; Rappe, E.; Sallis, J.F.; Lambert, E.V.; Duenas, O.L.S.; et al. Advancing Urban Green and Blue Space Contributions to Public Health. Lancet Public Health 2023, 8, e735–e742. [Google Scholar] [CrossRef]
- Ma, F. Seasonal Effects on Blue-Green Space Preferences: Examining Spatial Configuration and Residents’ Perspectives. Environ. Res. Commun. 2023, 5, 065009. [Google Scholar] [CrossRef]
- Taylor, L.; Hochuli, D.F. Defining Greenspace: Multiple Uses across Multiple Disciplines. Landsc. Urban Plan. 2017, 158, 25–38. [Google Scholar] [CrossRef]
- Grellier, J.; White, M.P.; Albin, M.; Bell, S.; Elliott, L.R.; Gascón, M.; Gualdi, S.; Mancini, L.; Nieuwenhuijsen, M.J.; Sarigiannis, D.A.; et al. BlueHealth: A Study Programme Protocol for Mapping and Quantifying the Potential Benefits to Public Health and Well-Being from Europe’s Blue Spaces. BMJ Open 2017, 7, e016188. [Google Scholar] [CrossRef]
- Luo, S.; Xie, J.; Wang, H.; Wang, Q.; Chen, J.; Yang, Z.; Furuya, K. Natural Dose of Blue Restoration: A Field Experiment on Mental Restoration of Urban Blue Spaces. Land 2023, 12, 1834. [Google Scholar] [CrossRef]
- Maas, J.; Verheij, R.A.; de Vries, S.; Spreeuwenberg, P.; Schellevis, F.G.; Groenewegen, P.P. Morbidity Is Related to a Green Living Environment. J. Epidemiol. Community Health 2009, 63, 967–973. [Google Scholar] [CrossRef]
- Garrett, J.; White, M.P.; Huang, J.; Ng, S.; Hui, Z.; Leung, C.; Tse, S.; Fung, F.; Elliott, L.R.; Depledge, M.H.; et al. The Association between Blue Space Exposure, Health and Wellbeing in Hong Kong. Health Place 2019, 55, 100–110. [Google Scholar] [CrossRef] [PubMed]
- Geneshka, M.; Coventry, P.; Cruz, J.; Gilbody, S. Relationship between Green and Blue Spaces with Mental and Physical Health: A Systematic Review of Longitudinal Observational Studies. Int. J. Environ. Res. Public Health 2021, 18, 9010. [Google Scholar] [CrossRef] [PubMed]
- Wang, X.; Zhao, X.; Liu, Q.; Zhou, Y.; Yu, Y.; Xu, X. Spatial Patterns of Urban Green-Blue Spaces and Residents’ Well-Being: The Mediating Effect of Neighborhood Social Cohesion. Land 2023, 12, 1454. [Google Scholar] [CrossRef]
- Gidlow, C.J.; Jones, M.V.; Hurst, G.; Masterson, D.; Clark-Carter, D.; Tarvainen, M.P.; Rouquette, J.; Nieuwenhuijsen, M.J. Where to Put Your Best Foot Forward: Psycho-Physiological Responses to Walking in Natural and Urban Environments. J. Environ. Psychol. 2016, 45, 22–29. [Google Scholar] [CrossRef]
- Valente, D.; Pasimeni, M.R.; Petrosillo, I. The Role of Green Infrastructures in Italian Cities by Linking Natural and Social Capital. Ecol. Indic. 2020, 108, 105694. [Google Scholar] [CrossRef]
- Du, X.C.; Li, F.Z. A Review of Research on Green Exposure as an Assessment Indicator and Mechanism for Health Services Promotion. Fengjing Yuanlin (Landsc. Archit.) 2022, 29, 26–31. [Google Scholar]
- Mao, N.; Zhou, L. Design Analysis of Kenya Hara’s Works from the Perspective of Design Psychology. Art Res. 2023, 5, 76–78. [Google Scholar]
- Coon, J.T.; Boddy, K.; Stein, K.; Whear, R.; Barton, J.; Depledge, M.H. Does Participating in Physical Activity in Outdoor Natural Environments Have a Greater Effect on Physical and Mental Well-Being than Physical Activity Indoors? A Systematic Review. Environ. Sci. Technol. 2011, 45, 1761–1772. [Google Scholar] [CrossRef]
- Georgiou, M.; Morison, G.; Smith, N.; Tieges, Z.; Chastin, S.F.M. Mechanisms of Impact of Blue Spaces on Human Health: A Systematic Literature Review and Meta-Analysis. Int. J. Environ. Res. Public Health 2021, 18, 2486. [Google Scholar] [CrossRef]
- Zhou, P.; Grady, S.C.; Chen, G. How the Built Environment Affects Change in Older People’s Physical Activity: A Mixed-Methods Approach Using Longitudinal Health Survey Data in Urban China. Soc. Sci. Med. 2017, 192, 74–84. [Google Scholar] [CrossRef]
- Perchoux, C.; Kestens, Y.; Brondeel, R.; Chaix, B. Accounting for the Daily Locations Visited in the Study of the Built Environment Correlates of Recreational Walking (the RECORD Cohort Study). Prev. Med. 2015, 81, 142–149. [Google Scholar] [CrossRef] [PubMed]
- Jansen, F.M.; Van Kollenburg, G.H.; Kamphuis, C.B.M.; Pierik, F.H.; Ettema, D.F. Hour-by-Hour Physical Activity Patterns of Adults Aged 45–65 Years: A Cross-Sectional Study. J. Public Health 2018, 40, 787–796. [Google Scholar] [CrossRef]
- Grow, H.M.; Saelens, B.E.; Kerr, J.; Durant, N.H.; Norman, G.J.; Sallis, J.F. Where Are Youth Active? Roles of Proximity, Active Transport, and Built Environment. Med. Sci. Sports Exerc. 2008, 40, 2071–2079. [Google Scholar] [CrossRef]
- Rugel, E.J.; Carpiano, R.M.; Henderson, S.B.; Brauer, M. Exposure to Natural Space, Sense of Community Belonging, and Adverse Mental Health Outcomes across an Urban Region. Environ. Res. 2019, 171, 365–377. [Google Scholar] [CrossRef]
- Chen, Y.; Yuan, Y. The Neighborhood Effect of Exposure to Blue Space on Elderly Individuals’ Mental Health: A Case Study in Guangzhou, China. Health Place 2020, 63, 102348. [Google Scholar] [CrossRef]
- Amirbeiki, F.; Khaki Ghasr, A. Investigating the Effects of Exposure to Natural Blue Elements on the Psychological Restoration of University Students. Int. J. Archit. Eng. Urban Plan. 2020, 30, 1–10. [Google Scholar]
- Ansah, E.W.; Amoadu, M.; Obeng, P.; Sarfo, J.O. Health Systems Response to Climate Change Adaptation: A Scoping Review of Global Evidence. BMC Public Health 2024, 24, 2015. [Google Scholar] [CrossRef]
- Dzhambov, A.M.; Markevych, I.; Hartig, T.; Tilov, B.; Dimitrova, D. Multiple Pathways Link Urban Green-and Bluespace to Mental Health in Young Adults. Environ. Res. 2018, 166, 223–233. [Google Scholar] [CrossRef]
- Smith, N.; Chastin, S.; Tieges, Z.; Webb, S.; Georgiou, M.; King, A. A Systematic Literature Review and Meta-Analysis of Quantitative Studies on the Impact of Urban Blue Space on Human Health. Cities 2020, 119, 103413. [Google Scholar] [CrossRef]
- Völker, S.; Kistemann, T. The Impact of Blue Space on Human Health and Well-Being—Salutogenetic Health Effects of Inland Surface Waters: A Review. Int. J. Hyg. Environ. Health 2011, 214, 449–460. [Google Scholar] [CrossRef] [PubMed]
- Wang, K.; Sun, Z.; Cai, M.; Liu, L.; Wu, H.; Peng, Z. Impacts of Urban Blue-Green Space on Residents’ Health: A Bibliometric Review. Int. J. Environ. Res. Public Health 2022, 19, 16192. [Google Scholar] [CrossRef] [PubMed]
- Zhang, J.; Yu, Z.; Zhao, B.; Sun, R.; Vejre, H. Links Between Green Space and Public Health: A Bibliometric Review of Global Research Trends and Future Prospects from 1901 to 2019. Int. J. Environ. Res. Public Health 2020, 17, 1234. [Google Scholar] [CrossRef]
- Labib, S.M.; Lindley, S.; Huck, J.J. Spatial Dimensions of the Influence of Urban Green-Blue Spaces on Human Health: A Systematic Review. Environ. Res. 2020, 180, 108869. [Google Scholar] [CrossRef]
- Yao, W.; Zhang, X.; Gong, Q. The Effect of Exposure to the Natural Environment on Stress Reduction: A Meta-Analysis. Urban For. Urban Green. 2021, 57, 126932. [Google Scholar] [CrossRef]
- Collins, R.M.; Spake, R.; Brown, K.A.; Ogutu, B.O.; Smith, D.; Eigenbrod, F. A Systematic Map of Research Exploring the Effect of Greenspace on Mental Health. Landsc. Urban Plan. 2020, 201, 103823. [Google Scholar] [CrossRef]
- Zeleznik, D.; Vosner, H.B.; Kokol, P. A Bibliometric Analysis of the Journal of Advanced Nursing, 1976–2015. J. Adv. Nurs. 2017, 73, 2407–2419. [Google Scholar] [CrossRef] [PubMed]
- Mukherjee, D.; Lim, W.M.; Kumar, S.; Donthu, N. Guidelines for Advancing Theory and Practice through Bibliometric Research. J. Bus. Res. 2022, 148, 101–115. [Google Scholar] [CrossRef]
- Klarin, A. How to Conduct a Bibliometric Content Analysis: Guidelines and Contributions of Content Co-Occurrence or Co-Word Literature Reviews. Int. J. Consum. Stud. 2024, 48, e13031. [Google Scholar] [CrossRef]
- Wang, P.; Guo, W.; Liang, C.; She, B.; Li, D. Bibliometric-Based Research Status and Development Trends of Dam Breach Studies. Sustainability 2024, 17, 209. [Google Scholar] [CrossRef]
- Han, Y.H.; Mai, J.H.; Zhang, F. A Quantitative Review of Industrial Policy Research: A Bibliometric Analysis Based on CNKI and Web of Science Using CiteSpace. Ind. Organ. Rev. 2022, 16, 148–182. [Google Scholar]
- Li, J.M.; Zhao, K.; Qu, T.; Liu, X.X. Research Analysis of the Blockchain and Internet of Things Domain Based on Knowledge Graphs. Comput. Sci. 2021, 48, 563–567. [Google Scholar]
- Markevych, I.; Schoierer, J.; Hartig, T.; Chudnovsky, A.; Hystad, P.; Dzhambov, A.M.; de Vries, S.; Triguero-Mas, M.; Brauer, M.; Nieuwenhuijsen, M.J.; et al. Exploring Pathways Linking Greenspace to Health: Theoretical and Methodological Guidance. Environ. Res. 2017, 158, 301–317. [Google Scholar] [CrossRef]
- Hartig, T.; Mitchell, R.; De Vries, S.; Frumkin, H. Nature and Health. Annu. Rev. Public Health 2014, 35, 207–228. [Google Scholar]
- Twohig-Bennett, C.; Jones, A. The Health Benefits of the Great Outdoors: A Systematic Review and Meta-Analysis of Greenspace Exposure and Health Outcomes. Environ. Res. 2018, 166, 628–637. [Google Scholar] [CrossRef]
- Bratman, G.N.; Anderson, C.B.; Berman, M.G.; Cochran, B.; de Vries, S.; Flanders, J.; Folke, C.; Frumkin, H.; Gross, J.J.; Hartig, T.; et al. Nature and Mental Health: An Ecosystem Service Perspective. Sci. Adv. 2019, 5, eaax0903. [Google Scholar] [CrossRef]
- Kondo, M.C.; Fluehr, J.M.; McKeon, T.; Branas, C.C. Urban Green Space and Its Impact on Human Health. Int. J. Environ. Res. Public Health 2018, 15, 445. [Google Scholar] [CrossRef] [PubMed]
- Venter, Z.S.; Barton, D.N.; Gundersen, V.; Figari, H.; Nowell, M. Urban Nature in a Time of Crisis: Recreational Use of Green Space Increases during the COVID-19 Outbreak in Oslo, Norway. Environ. Res. Lett. 2020, 15, 104075. [Google Scholar] [CrossRef]
- Wolch, J.R.; Byrne, J.; Newell, J.P. Urban Green Space, Public Health, and Environmental Justice: The Challenge of Making Cities ‘Just Green Enough’. Landsc. Urban Plan. 2014, 125, 234–244. [Google Scholar] [CrossRef]
- Van den Bosch, M.; Ode Sang, Å. Urban Natural Environments as Nature-Based Solutions for Improved Public Health—A Systematic Review of Reviews. Environ. Res. 2017, 158, 373–384. [Google Scholar] [CrossRef]
- Ekkel, E.D.; de Vries, S. Nearby Green Space and Human Health: Evaluating Accessibility Metrics. Landsc. Urban Plan. 2017, 157, 214–220. [Google Scholar] [CrossRef]
- Dadvand, P.; Gascon, M.; Triguero-Mas, M.; Martínez, D.; Rojas-Rueda, D.; Plasència, A.; Nieuwenhuijsen, M.J.; Bartoll, X.; Basagaña, X. Residential Green Spaces and Mortality: A Systematic Review. Environ. Int. 2016, 86, 60–67. [Google Scholar]
- Frumkin, H.; Bratman, G.N.; Breslow, S.J.; Cochran, B.; Kahn, P.H., Jr.; Lawler, J.J.; Levin, P.S.; Tandon, P.S.; Varanasi, U.; Wolf, K.L.; et al. Nature Contact and Human Health: A Research Agenda. Environ. Health Perspect. 2017, 125, 075001. [Google Scholar] [CrossRef]
- Gascon, M.; Triguero-Mas, M.; Martínez, D.; Dadvand, P.; Rojas-Rueda, D.; Plasència, A.; Nieuwenhuijsen, M.J. Mental Health Benefits of Long-Term Exposure to Residential Green and Blue Spaces: A Systematic Review. Int. J. Environ. Res. Public Health 2015, 12, 4354–4379. [Google Scholar] [CrossRef]
- Gascon, M.; Triguero-Mas, M.; Martínez, D.; Dadvand, P.; Forns, J.; Sánchez-Benavides, G.; Gramunt, N.; Gotsens, X.; Cirach, M.; Vert, C.; et al. Long-Term Exposure to Residential Green and Blue Spaces and Anxiety and Depression in Adults: A Cross-Sectional Study. Environ. Res. 2018, 162, 231–239. [Google Scholar] [CrossRef]
- Geng, D.; Innes, J.; Wu, W.; Wang, G. Impacts of COVID-19 Pandemic on Urban Park Visitation: A Global Analysis. J. For. Res. 2021, 32, 553–567. [Google Scholar] [CrossRef]
- Nesbitt, L.; Meitner, M.J.; Girling, C.; Sheppard, S.R.J.; Lu, Y. Who Has Access to Urban Vegetation? A Spatial Analysis of Distributional Green Equity in 10 US Cities. Landsc. Urban Plan. 2019, 181, 51–79. [Google Scholar] [CrossRef]
- Jennings, V.; Bamkole, O. The Relationship between Social Cohesion and Urban Green Space: An Avenue for Health Promotion. Int. J. Environ. Res. Public Health 2019, 16, 452. [Google Scholar] [CrossRef] [PubMed]
- Helbich, M.; Yao, Y.; Liu, Y.; Zhang, J.; Liu, P.; Wang, R. Using Deep Learning to Examine Street View Green and Blue Spaces and Their Associations with Geriatric Depression in Beijing, China. Environ. Int. 2019, 126, 107–117. [Google Scholar] [CrossRef] [PubMed]
- Fong, K.C.; Hart, J.E.; James, P. A Review of Epidemiologic Studies on Greenness and Health: Updated Literature through 2017. Curr. Environ. Health Rep. 2018, 5, 77–87. [Google Scholar] [CrossRef]
- Livesley, S.J.; McPherson, E.G.; Calfapietra, C. The Urban Forest and Ecosystem Services: Impacts on Urban Water, Heat, and Pollution Cycles at the Tree, Street, and City Scale. J. Environ. Qual. 2016, 45, 119–124. [Google Scholar] [CrossRef]
- Jiang, C.L.; Liu, S.B.; Ding, K. Chinese Journal of Scientific and Technology Periodicals: Its Research Hot Fields and Evolvement Shown by Domain Mapping. Chin. Sci. Technol. J. Res. 2008, 19, 954. [Google Scholar]
- Groenewegen, P.P.; van den Berg, A.E.; de Vries, S.; Verheij, R.A. Is a Green Residential Environment Better for Health? If so, Why? Ann. Assoc. Am. Geogr. 2012, 102, 996–1003. [Google Scholar] [CrossRef]
- Pasanen, T.P.; White, M.P.; Wheeler, B.W.; Garrett, J.K.; Elliott, L.R. Neighbourhood Blue Space, Health and Wellbeing: The Mediating Role of Different Types of Physical Activity. Environ. Int. 2019, 131, 105016. [Google Scholar] [CrossRef]
- Marini, S.; Mauro, M.; Grigoletto, A.; Toselli, S.; Maietta Latessa, P. The Effect of Physical Activity Interventions Carried Out in Outdoor Natural Blue and Green Spaces on Health Outcomes: A Systematic Review. Int. J. Environ. Res. Public Health 2022, 19, 12482. [Google Scholar] [CrossRef]
- Scopelliti, M.; Carrus, G.; Adinolfi, C.; Suarez, G.; Colangelo, G.; Lafortezza, R.; Panno, A.; Sanesi, G. Staying in Touch with Nature and Well-Being in Different Income Groups: The Experience of Urban Parks in Bogotá. Landsc. Urban Plan. 2016, 148, 139–148. [Google Scholar] [CrossRef]
- Liu, M.; Ye, Z.; He, P.; Yang, S.; Zhang, Y.; Zhou, C.; Zhang, Y.; Gan, X.; Qin, X. Relations of Residential Green and Blue Spaces with New-Onset Chronic Kidney Disease. Sci. Total Environ. 2023, 869, 161788. [Google Scholar] [CrossRef] [PubMed]
- Zhang, Z.; Chen, L.; Qian, Z.M.; Li, H.; Cai, M.; Wang, X.; McMillin, S.E.; Vaughn, M.G.; Liu, K.; Shao, Z. Residential Green and Blue Space Associated with Lower Risk of Adult-Onset Inflamma- tory Bowel Disease: Findings from a Large Prospective Cohort Study. Environ. Int. 2022, 160, 107084. [Google Scholar] [CrossRef] [PubMed]
- Li, R.; Li, L.; Liu, D.; Chen, X.; Peng, F. Residential Green and Blue Spaces and Type 2 Diabetes Mellitus: A Population-Based Health Study in China. Toxics 2021, 9, 11. [Google Scholar] [CrossRef]
- Richardson, E.A.; Pearce, J.; Mitchell, R.; Kingham, S. Role of Physical Activity in the Relationship between Urban Green Space and Health. Public Health 2013, 127, 318–324. [Google Scholar] [CrossRef]
- Chen, K.; Zhang, T.; Liu, F.; Zhang, Y.; Song, Y. How Does Urban Green Space Impact Residents’ Mental Health: A Literature Review of Mediators. Int. J. Environ. Res. Public Health 2021, 18, 11746. [Google Scholar] [CrossRef]
- Pan, M.; Zhang, S. Visualization of Prediction Methods for Wildfire Modeling Using CiteSpace: A Bibliometric Analysis. Atmosphere 2023, 14, 1009. [Google Scholar] [CrossRef]
- Chen, Y.; Chen, C.M.; Liu, Z.Y.; Hu, Z.G.; Wang, X.W. The Methodology Function of CiteSpace Mapping Knowledge Domains. Stud. Sci. Sci. 2015, 33, 242–253. [Google Scholar]
- De La Iglesia Martinez, A.; Labib, S.M. Demystifying Normalized Difference Vegetation Index (NDVI) for Greenness Exposure Assessments and Policy Interventions in Urban Greening. Environ. Res. 2023, 220, 115155. [Google Scholar] [CrossRef]
- Jabbar, M.; Nasar-u-Minallah, M.; Yusoff, M.M. Measuring and Modeling the Association between Human Psychological Well-Being and Urban Green Spaces of Lahore, Pakistan. J. Environ. Stud. Sci. 2024, 14, 732–743. [Google Scholar] [CrossRef]
- Bai, Y.; Zhang, Y.; Zotova, O.; Pineo, H.; Siri, J.; Liang, L.; Luo, X.; Kwan, M.-P.; Ji, J.; Jiang, X.; et al. Healthy Cities Initiative in China: Progress, Challenges, and the Way Forward. Lancet Reg. Health West. Pac. 2022, 27, 100539. [Google Scholar] [CrossRef]
- Jiang, X.J.; Ye, D.; Wang, L. The Evolution of Global Healthy City Movement and the Function of Urban Planning. Urban Plan. Int. 2020, 6, 128–134. [Google Scholar]
- CS Speaks at 6th Global Conference of the Alliance for Healthy Cities. Available online: https://www.info.gov.hk/gia/general/201410/29/P201410290494.htm?utm (accessed on 8 January 2025).
- China City News. Available online: http://paper.people.com.cn/zgcsb/html/2015-08/03/content_1594983.htm (accessed on 8 January 2025).
- Akbari, P.; Yazdanfar, S.-A.; Hosseini, S.-B.; Norouzian-Maleki, S. Housing and Mental Health during Outbreak of COVID-19. J. Build. Eng. 2021, 43, 102919. [Google Scholar] [CrossRef]
- Leng, H.; Yan, T.J.; Yuan, Q. Research Progress on Mental Health Effect of Blue-Green Space and Its Enlightenments. Urban Plan. Int. 2022, 37, 34–43. [Google Scholar]
- Tzoulas, K.; Galan, J.; Venn, S.; Dennis, M.; Pedroli, B.; Mishra, H.; Haase, D.; Pauleit, S.; Niemelä, J.; James, P. A Conceptual Model of the Social–Ecological System of Nature-Based Solutions in Urban Environments. Ambio 2021, 50, 335–345. [Google Scholar] [CrossRef]
- Giles-Corti, B.; Vernez-Moudon, A.; Reis, R.; Turrell, G.; Dannenberg, A.L.; Badland, H.; Foster, S.; Lowe, M.; Sallis, J.F.; Stevenson, M.; et al. City Planning and Population Health: A Global Challenge. Lancet 2016, 388, 2912–2924. [Google Scholar] [CrossRef] [PubMed]
- Rigolon, A.; Browning, M.H.E.M.; Lee, K.; Shin, S. Access to Urban Green Space in Cities of the Global South: A Systematic Literature Review. Urban Sci. 2018, 2, 67. [Google Scholar] [CrossRef]
- Alejandre, J.C.; Chastin, S.; Irvine, K.N.; Georgiou, M.; Khanna, P.; Tieges, Z.; Smith, N.; Chong, Y.-Y.; Onagan, F.C.; Price, L.; et al. Contextual factors and programme theories associated with implementing blue prescription programmes: A systematic realist review. Health Soc. Care Community 2023, 31, 6551521. [Google Scholar] [CrossRef]
- Haeffner, M.; Jackson-Smith, D.; Buchert, M.; Risley, J. Accessing blue spaces: Social and geographic factors structuring familiarity with, use of, and appreciation of urban waterways. Landsc. Urban Plan. 2017, 167, 136–146. [Google Scholar] [CrossRef]
- Barton, H. Land Use Planning and Health and Well-Being. Land Use Policy 2009, 26, S115–S123. [Google Scholar] [CrossRef]
- Liu, Y.L.; Zhou, A.X. From Natural Healing to Social Restoration: Exploring the Healing Value of Community Gardens from the Perspective of Public Health. Fengjing Yuanlin (Landsc. Archit.) 2024, 31, 103–115. [Google Scholar]
- Chen, B.; Wu, S.; Song, Y.; Webster, C.; Xu, B.; Gong, P. Contrasting Inequality in Human Exposure to Greenspace between Cities of Global North and Global South. Nat. Commun. 2022, 13, 4636. [Google Scholar] [CrossRef]
- Zhang, X.P.; Wang, H.; Li, H.; Yan, J.; George, G.; Sun, X.; Zhang, F.F.; Wang, D.X. Hotspots and Frontier of Urban Forest Research in Recent 30 Years—Knowledge Mapping Analysis Based on CiteSpace. Zhongguo Chengshi Linye 2020, 18, 2. [Google Scholar]
- Liu, Y.; He, J.; Wang, R.; Li, Z. The Impact of Urban Green Space on Mental Wellbeing: Research and Recommendations. Trop. Geogr. 2022, 55, 1–13. [Google Scholar]
- Shi, C.Y. Literature review on environmental justice of urban green space. World Reg. Stud. 2020, 29, 621–630. [Google Scholar]
- Jelks, N.O.; Jennings, V.; Rigolon, A. Green gentrification and health: A scoping review. Int. J. Environ. Res. Public Health 2021, 18, 907. [Google Scholar] [CrossRef]
- Wu, Z.H.; Feng, C.C.; Yang, Z.J. Land Use Concepts in Compact City Development. Urban Probl. (Chengshi Wenti) 2012, 1, 9–14. [Google Scholar]
- Whitelaw, S. The Emergence of a ‘Dose–Response’ Analogy in the Health Improvement Domain of Public Health: A Critical Review. Crit. Public Health 2012, 22, 427–440. [Google Scholar] [CrossRef]
- Kondo, M.C.; Triguero-Mas, M.; Donaire-Gonzalez, D.; Seto, E.; Valentín, A.; Hurst, G.; Carrasco-Turigas, G.; Masterson, D.; Ambròs, A.; Ellis, N.; et al. Momentary Mood Response to Natural Outdoor Environments in Four European Cities. Environ. Int. 2020, 134, 105237. [Google Scholar] [CrossRef]
- White, M.P.; Alcock, I.; Grellier, J.; Wheeler, B.W.; Hartig, T.; Warber, S.L.; Bone, A.; Depledge, M.H.; Fleming, L.E. Spending at Least 120 Minutes a Week in Nature Is Associated with Good Health and Wellbeing. Sci. Rep. 2019, 9, 7730. [Google Scholar] [CrossRef]
- Li, S.; Zhang, L.; Li, J.; Chen, T.; Chen, J. Comparison of Domestic and Foreign Studies on the Impact of Built Environment on Public Health and Its Implications. Rural Dev. Res. 2025, 44, 1001–5221. [Google Scholar]
- Zhang, J. The Impact of Multi-Scale Blue-Green Spaces on Urban Thermal Environment; Jiangxi Agricultural University: Nanchang, China, 2023. [Google Scholar]
- Li, J. Research on the Spatiotemporal Transformation and Ecological Restoration of River Corridors in Zhengzhou Under the Background of Urbanization; Henan Agricultural University: Zhengzhou, China, 2021. [Google Scholar] [CrossRef]
- Zhen, F.; Xu, J.T.; Xi, G.L. Domestic and International Urban Geography Researches in Recent 10 Years: Progress and Perspectives. Econ. Geogr. 2021, 41, 87–96. [Google Scholar]
- Dutcher, N. Expanding Educational Opportunity in Linguistically Diverse Societies; ERIC Number: ED466099, Non-Journal Record; ERIC: Washington, DC, USA, 2001; 125p. [Google Scholar]
- Landa, L.G.G. Academic Language Barriers and Language Freedom. Curr. Issues Lang. Plan. 2006, 7, 61–81. [Google Scholar] [CrossRef]
- Montgomery, S. Does Science Need a Global Language? University of Chicago Press: Chicago, IL, USA, 2013. [Google Scholar]
- Ye, C. The Research Development of Big Data in Education: A Bibliometric Analysis Based on CiteSpace. In Proceedings of the 2018 Seventh International Conference of Educational Innovation through Technology (EITT), Auckland, New Zealand, 4–6 December 2018; IEEE: New York, NY, USA, 2018. [Google Scholar]

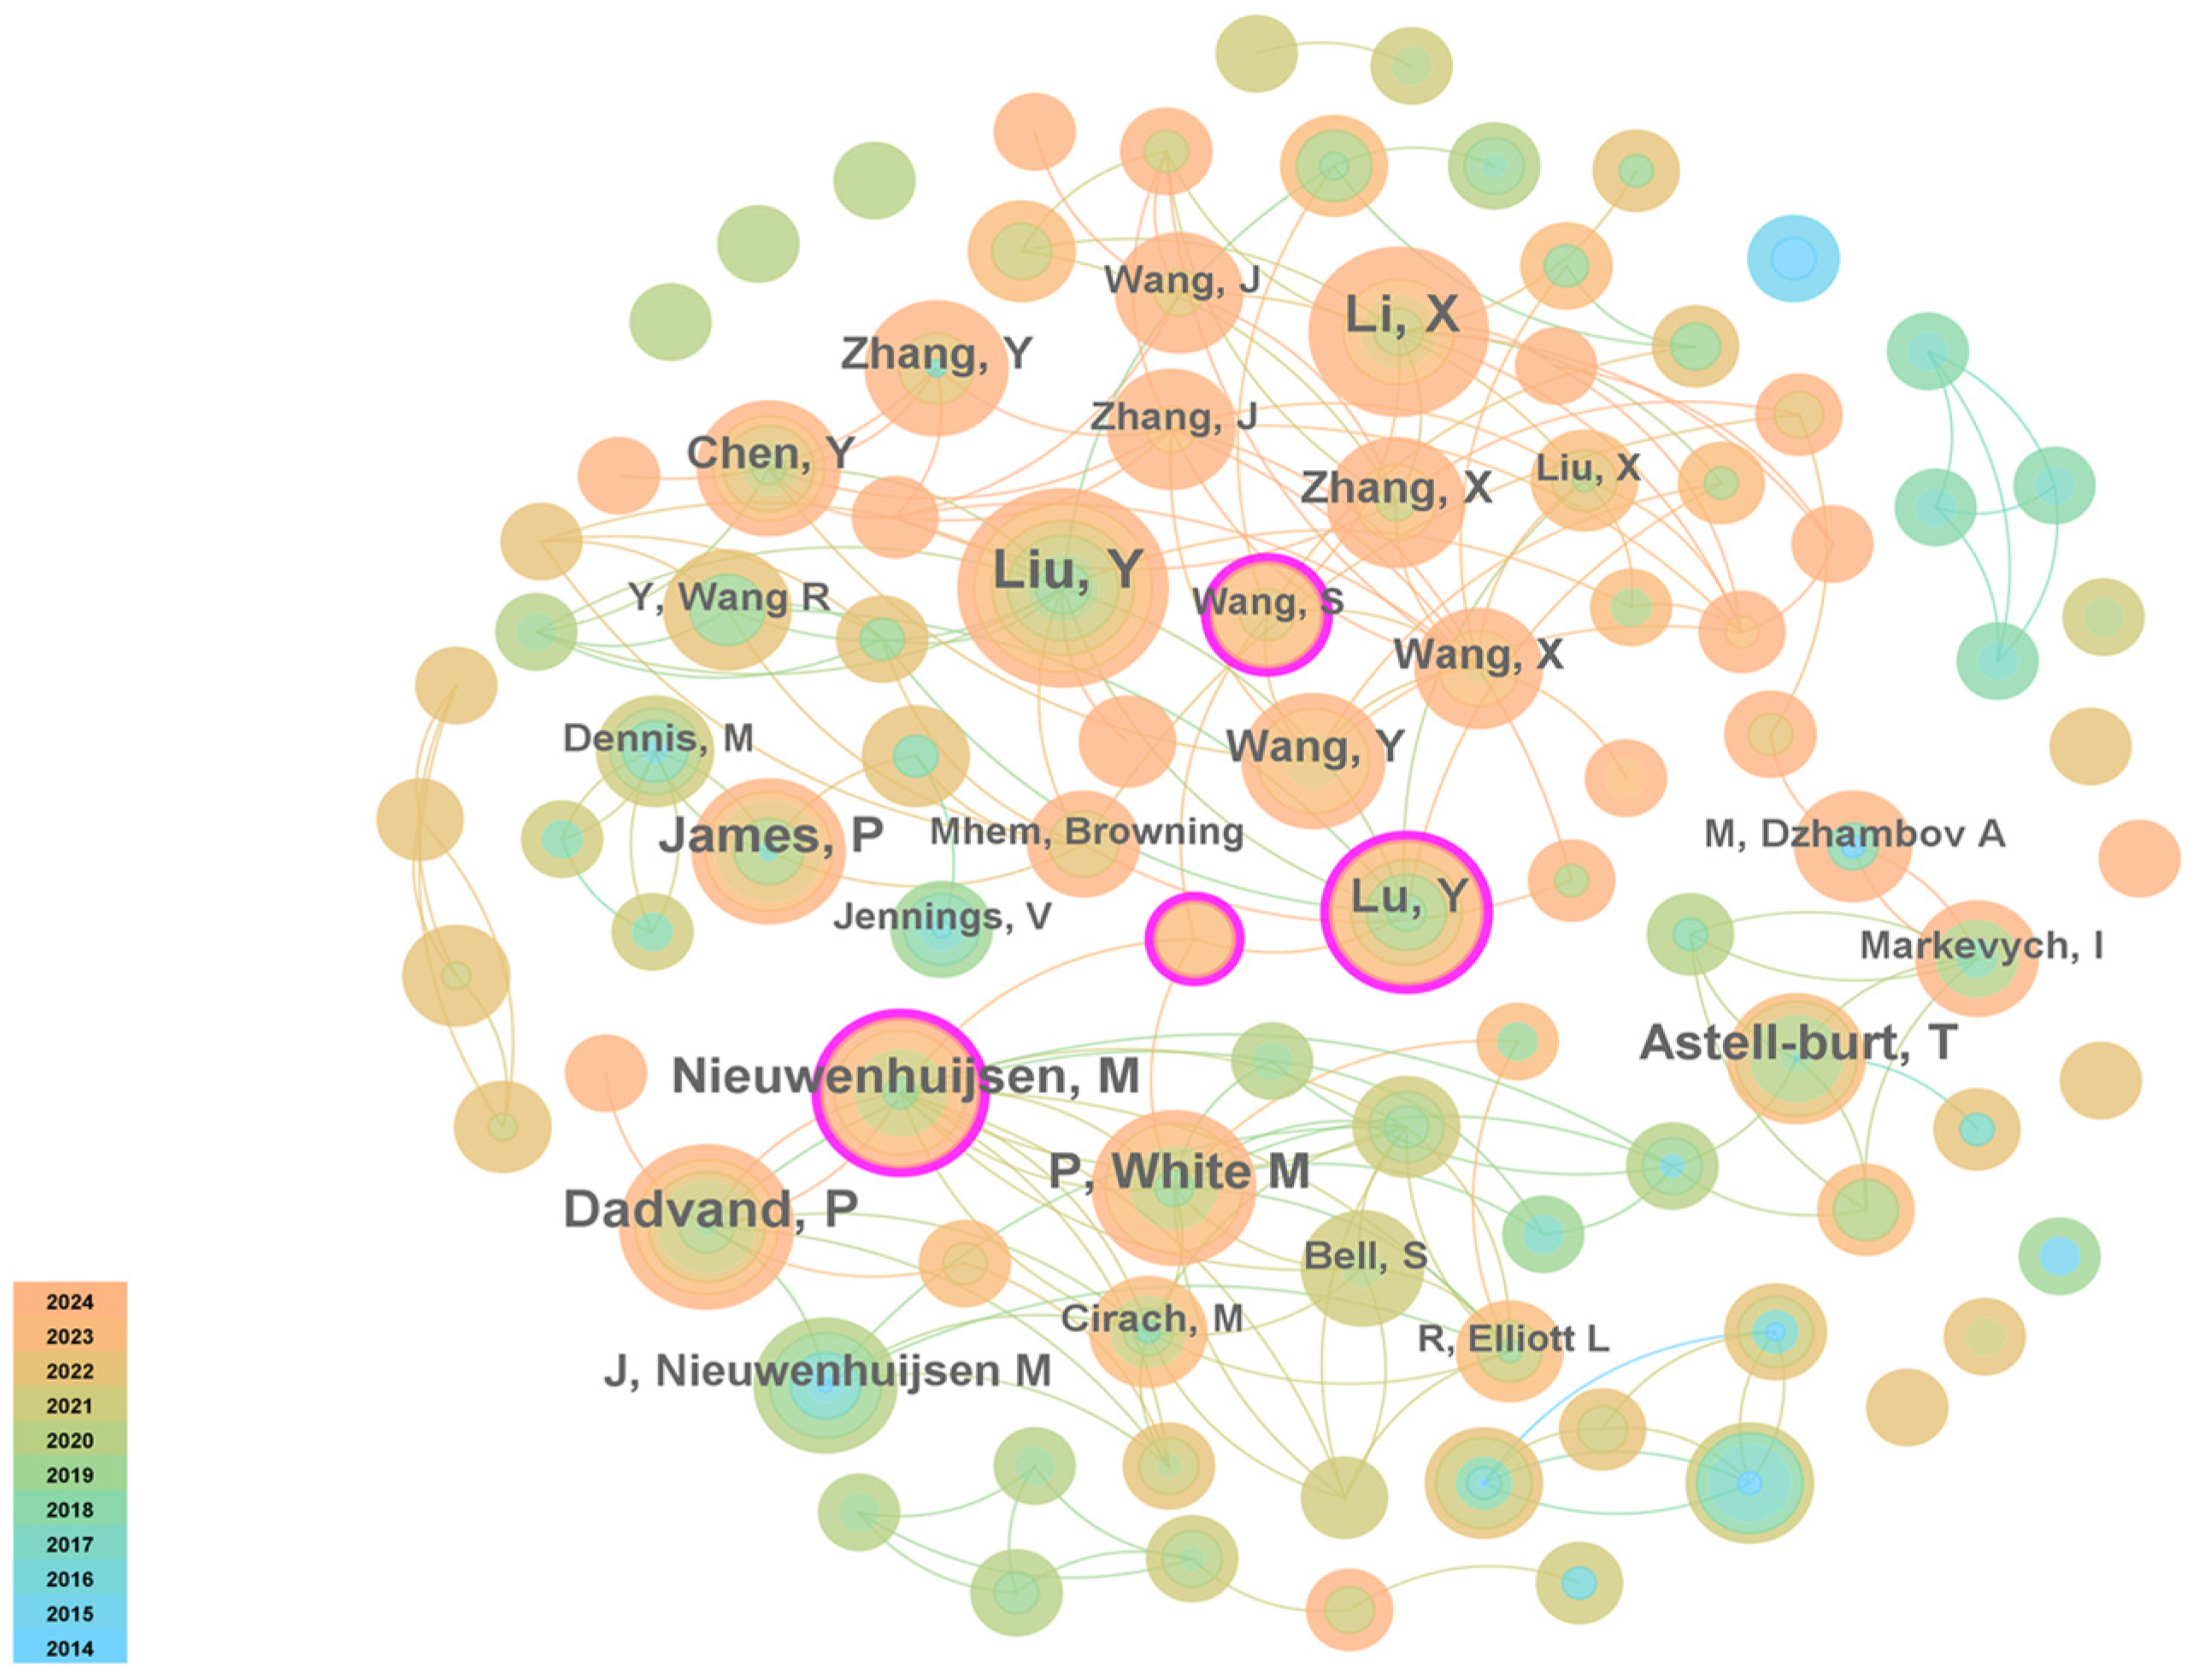


| Sequence Number | Number of Publication | Centrality | Year | Author |
|---|---|---|---|---|
| 1 | 28 | 0.07 | 2019 | Liu, Y |
| 2 | 22 | 0.04 | 2019 | Dadvand, P |
| 3 | 22 | 0.05 | 2020 | Li, X |
| 4 | 18 | 0.06 | 2016 | James, P |
| 5 | 18 | 0.1 | 2018 | Nieuwenhuijsen, M |
| 6 | 18 | 0.06 | 2019 | P, White M |
| 7 | 17 | 0.04 | 2014 | Astell-burt, T |
| 8 | 15 | 0.1 | 2019 | Lu, Y |
| 9 | 14 | 0.03 | 2020 | Chen, Y |
| 10 | 14 | 0.01 | 2022 | Wang, Y |
| 11 | 14 | 0.05 | 2014 | J, Nieuwenhuijsen M |
| Sequence Number | Number of Publication | Centrality | Year | Institute |
|---|---|---|---|---|
| 1 | 155 | 0.23 | 2014 | Chinese Academy of Sciences |
| 2 | 96 | 0.21 | 2014 | University of California System |
| 3 | 86 | 0.07 | 2014 | United States Department of Agriculture (USDA) |
| 4 | 70 | 0.06 | 2014 | United States Forest Service |
| 5 | 69 | 0.03 | 2014 | University of Chinese Academy of Sciences |
| 6 | 54 | 0.06 | 2015 | Helmholtz Association |
| 7 | 53 | 0.06 | 2014 | University of Exeter |
| 8 | 52 | 0.04 | 2014 | CIBER—Centro de Investigacion Biomedica en Red |
| 9 | 52 | 0.03 | 2014 | University of London |
| 10 | 51 | 0.04 | 2016 | University of Hong Kong |
| Sequence Number | Number of Publication | Centrality | Year | Country |
|---|---|---|---|---|
| 1 | 1085 | 0.08 | 2014 | China |
| 2 | 948 | 0.34 | 2014 | USA |
| 3 | 515 | 0.18 | 2014 | UK |
| 4 | 307 | 0.18 | 2014 | Australia |
| 5 | 256 | 0.12 | 2014 | Germany |
| 6 | 207 | 0.12 | 2014 | Italy |
| 7 | 193 | 0.05 | 2014 | Canada |
| 8 | 183 | 0.09 | 2014 | Spain |
| 9 | 128 | 0.03 | 2014 | Japan |
| 10 | 124 | 0.01 | 2014 | Poland |
| 11 | 121 | 0.09 | 2014 | France |
| 12 | 121 | 0.05 | 2014 | The Netherlands |
| 13 | 120 | 0.03 | 2014 | Brazil |
| 14 | 111 | 0.07 | 2014 | Sweden |
| 15 | 109 | 0.08 | 2014 | Belgium |
| 16 | 107 | 0.05 | 2014 | India |
| Freq | Centrality | Label | Name | Research Content | Research Method |
|---|---|---|---|---|---|
| 152 | 0.07 | Markevych I (2017) | Exploring pathways linking greenspace to health: Theoretical and methodological guidance [50] | Evaluates the impact of green and blue spaces on mental health. | Theoretical and methodological guidance |
| 93 | 0.08 | Hartig T (2014) | Nature and Health [51] | Explores how reduced human–nature interaction due to urbanisation affects health. | Literature review, conceptual model, and method summary |
| 91 | 0.01 | Twohig-Bennett C (2018) | The health benefits of the great outdoors: A systematic review and meta-analysis of greenspace exposure and health outcomes [52] | Quantify evidence of the impact of greenspace on a wide range of health outcomes. | Literature review |
| 85 | 0.12 | Bratman GN (2019) | Nature and mental health: An ecosystem service perspective [53] | Nature experience and mental health. | Conceptual model and hypothetical application |
| 79 | 0.01 | Kondo MC (2018) | Urban green space and its impact on human health [54] | Assess the possibility of causal relationships between nature and health in urban settings. | Literature review |
| 75 | 0.01 | Venter ZS (2020) | Urban nature in a time of crisis: recreational use of green space increases during the COVID-19 outbreak in Oslo, Norway [55] | Explore how social distancing measures affected recreational use of urban green space during the partial lockdown in Oslo, Norway. | STRAVA and Google mobility data with geospatial analysis |
| 72 | 0.02 | Wolch JR (2014) | Urban green space, public health, and environmental justice: The challenge of making cities “just green enough” [56] | The importance of urban green space for public health. | Literature review and case studies |
| 67 | 0.04 | van den Bosch M (2017) | Urban natural environments as nature-based solutions for improved public health–A systematic review of reviews [57] | Evaluate the evidence on public health benefits of exposure to natural environments and explore how this knowledge could be framed within the NBS concept. | Literature review |
| 65 | 0.06 | Ekkel ED (2017) | Nearby green space and human health: Evaluating accessibility metrics [58] | Emphasis was placed on evaluating the types of existing green space accessibility indicators and their applicability to health impact studies. | Literature review and related empirical research |
| 60 | 0.02 | Gascon M (2016) | Residential green spaces and mortality: A systematic review [59] | Systematically review the available evidence on the association between long-term exposure to residential green and blue spaces and mortality in adults and make recommendations for further research. | Literature review following PRISMA protocol and meta-analysis |
| 59 | 0.07 | Frumkin H (2017) | Nature contact and human health: A research agenda [60] | Propose a research agenda on nature contact and health, identifying principal domains of research and key questions. | Literature review and research agenda |
| 58 | 0.02 | Gascon M (2015) | Mental health benefits of long-term exposure to residential green and blue spaces: a systematic review [61] | The health benefits of residential green and blue spaces. | Literature review and meta-analysis. |
| 55 | 0.03 | Gascon M (2018) | Long-term exposure to residential green and blue spaces and anxiety and depression in adults: A cross-sectional study [62] | Evaluate the effects of long-term exposure to residential green and blue spaces on anxiety and depression and intake of related medication and explore potential mediators and effect modifiers of this association. | Questionnaires and logistic regression models |
| 51 | 0.01 | Geng DH (2021) | Impacts of COVID-19 pandemic on urban park visitation: a global analysis [63] | Analyse the impacts of COVID-19 and government response policies to the pandemic on park visitation at global, regional, and national levels and assess the importance of parks during this global pandemic. | Correlation analysis, ANOVA analysis, and stepwise regression analysis |
| 51 | 0.04 | Nesbitt L (2019) | Who has access to urban vegetation? A spatial analysis of distributional green equity in 10 US cities [64] | A spatial analysis of distributional green equity in 10 US cities. | Spearman’s correlations and spatial auto-regressive models |
| 49 | 0.03 | Jennings V (2019) | The relationship between social cohesion and urban green space: An avenue for health promotion [65] | Discuss how positive interactions in urban green space can catalyse social cohesion, social capital, and critical health-promoting behaviours that may enhance psychological health and well-being, summarise the strengths and limitations of previous studies, and suggest directions for future research. | Literature review, conceptual model, and method summary |
| 49 | 0.04 | Helbich M (2019) | Using deep learning to examine street view green and blue spaces and their associations with geriatric depression in Beijing, China [66] | Compare street view indicators from street view images with street view indicators from satellites assessing green and blue spaces and examine the relationship between green and blue space exposure and depression in older adults in Beijing, China. | Questionnaires and multilevel regressions models |
| 49 | 0.04 | Fong KC (2018) | A review of epidemiologic studies on greenness and health: updated literature through 2017 [67] | Summarise the latest research in the field of health benefits of natural vegetation and green environments. | Literature review |
| 46 | 0.03 | Labib SM (2020) | Spatial dimensions of the influence of urban green-blue spaces on human health: A systematic review [41] | Learn how spatial scales, datasets, methods, and analyses are currently applied to research investigating the relationship between green and blue spaces and human health in urban areas. | Literature review following PRISMA protocol |
| 43 | 0.01 | Livesley SJ (2016) | The urban forest and ecosystem services: impacts on urban water, heat, and pollution cycles at the tree, street, and city scale [68] | The role of urban trees in urban biogeochemical cycles. | Literature review |
| Sequence Number | Number | Centrality | Year | Keyword |
|---|---|---|---|---|
| 1 | 275 | 0.02 | 2014 | green space |
| 2 | 263 | 0.05 | 2014 | mental health |
| 3 | 226 | 0.01 | 2014 | urban green space |
| 4 | 216 | 0.01 | 2014 | ecosystem services |
| 5 | 209 | 0.05 | 2015 | recreational park |
| 6 | 198 | 0.06 | 2014 | urban area |
| 7 | 177 | 0.01 | 2014 | public health |
| 8 | 167 | 0.05 | 2014 | physical activity |
| 9 | 142 | 0.01 | 2014 | green spaces |
| 10 | 137 | 0.04 | 2015 | urban planning |
| 11 | 135 | 0.03 | 2014 | human health |
| 12 | 114 | 0.03 | 2014 | urban green spaces |
| 13 | 109 | 0.01 | 2015 | environmental justice |
| Cluster ID | Size | Silhouette | Mean Year | Keywords (freq > 10) |
|---|---|---|---|---|
| 0 | 90 | 0.746 | 2018 | green spaces, land use, middle aged, environmental exposure, air pollution, environmental factor, psychological well-being, regression analysis, particulate matter, atmospheric pollution, social status, health risk, cardiovascular disease, neighborhood greenness, risk factor, environmental health, normalized difference vegetation index, self report, risk assessment, air pollutant, household income, socioeconomic status, structural equation modeling, sensitivity analysis, blood pressure, environmental parameters, traffic noise, child health, residential location |
| 1 | 66 | 0.737 | 2018 | recreational park, older adults, health status, horticultural therapy, coronavirus disease 2019, population density, very elderly, 80 and over, social interaction, mental stress, social behavior, physiological stress, decision making, prospective study, park design, young population |
| 2 | 63 | 0.781 | 2018 | green space, built environment, residential green, blue spaces, blue space, long-term exposure, natural environments, cultural ecosystem services, urban green, urban forest, outdoor recreation, therapeutic landscapes, residential greeness, social environment, social support, healing garden, nature connectedness, natural environment, body-mass index, urban green-space, landscape planning, depressive symptoms |
| 3 | 60 | 0.691 | 2020 | health impact, city planning, health promotion, climate change, spatial analysis, nature-based solutions, urban development, urban greenery, urban green infrastructure, air quality, social media, public space, urban greening, urban heat island, deep learning |
| 4 | 58 | 0.744 | 2017 | urban green space, ecosystem services, human health, environmental justice, urban parks, green infrastructure, urban park, urban greenspace, urban forestry, urban ecosystem, ecosystem service, urban forests, stress recovery, health benefits, psychological restoration, human well-being, forest therapy |
| 5 | 56 | 0.824 | 2016 | mental health, urban area, public health, physical activity, urban planning, urban green spaces, residence characteristics, urban population, human experiment, young adult, urban health, environmental planning, environmental design, urban design, remote sensing, socioeconomic factors, body mass, statistics and numerical data, health survey, social cohesion, machine learning |
| 6 | 35 | 0.849 | 2020 | quality of life, life satisfaction, health care, thermal comfort, physical health |
| 7 | 21 | 0.889 | 2020 | subjective well-being, qualitative analysis, public parks, natural experiment |
| 8 | 7 | 0.948 | 2022 | mediation analysis, tree cover, mental disorder |
Disclaimer/Publisher’s Note: The statements, opinions and data contained in all publications are solely those of the individual author(s) and contributor(s) and not of MDPI and/or the editor(s). MDPI and/or the editor(s) disclaim responsibility for any injury to people or property resulting from any ideas, methods, instructions or products referred to in the content. |
© 2025 by the authors. Licensee MDPI, Basel, Switzerland. This article is an open access article distributed under the terms and conditions of the Creative Commons Attribution (CC BY) license (https://creativecommons.org/licenses/by/4.0/).
Share and Cite
Qu, S.; Li, H.; Wu, J.; Zhao, B. Environmental and Health Benefits: A Bibliometric and Knowledge Mapping Analysis of Research Progress. Sustainability 2025, 17, 2269. https://doi.org/10.3390/su17052269
Qu S, Li H, Wu J, Zhao B. Environmental and Health Benefits: A Bibliometric and Knowledge Mapping Analysis of Research Progress. Sustainability. 2025; 17(5):2269. https://doi.org/10.3390/su17052269
Chicago/Turabian StyleQu, Siruo, Hongyi Li, Jing Wu, and Bing Zhao. 2025. "Environmental and Health Benefits: A Bibliometric and Knowledge Mapping Analysis of Research Progress" Sustainability 17, no. 5: 2269. https://doi.org/10.3390/su17052269
APA StyleQu, S., Li, H., Wu, J., & Zhao, B. (2025). Environmental and Health Benefits: A Bibliometric and Knowledge Mapping Analysis of Research Progress. Sustainability, 17(5), 2269. https://doi.org/10.3390/su17052269