Greening of Inland and Coastal Ships in Europe by Means of Retrofitting: State of the Art and Scenarios
Abstract
1. Introduction
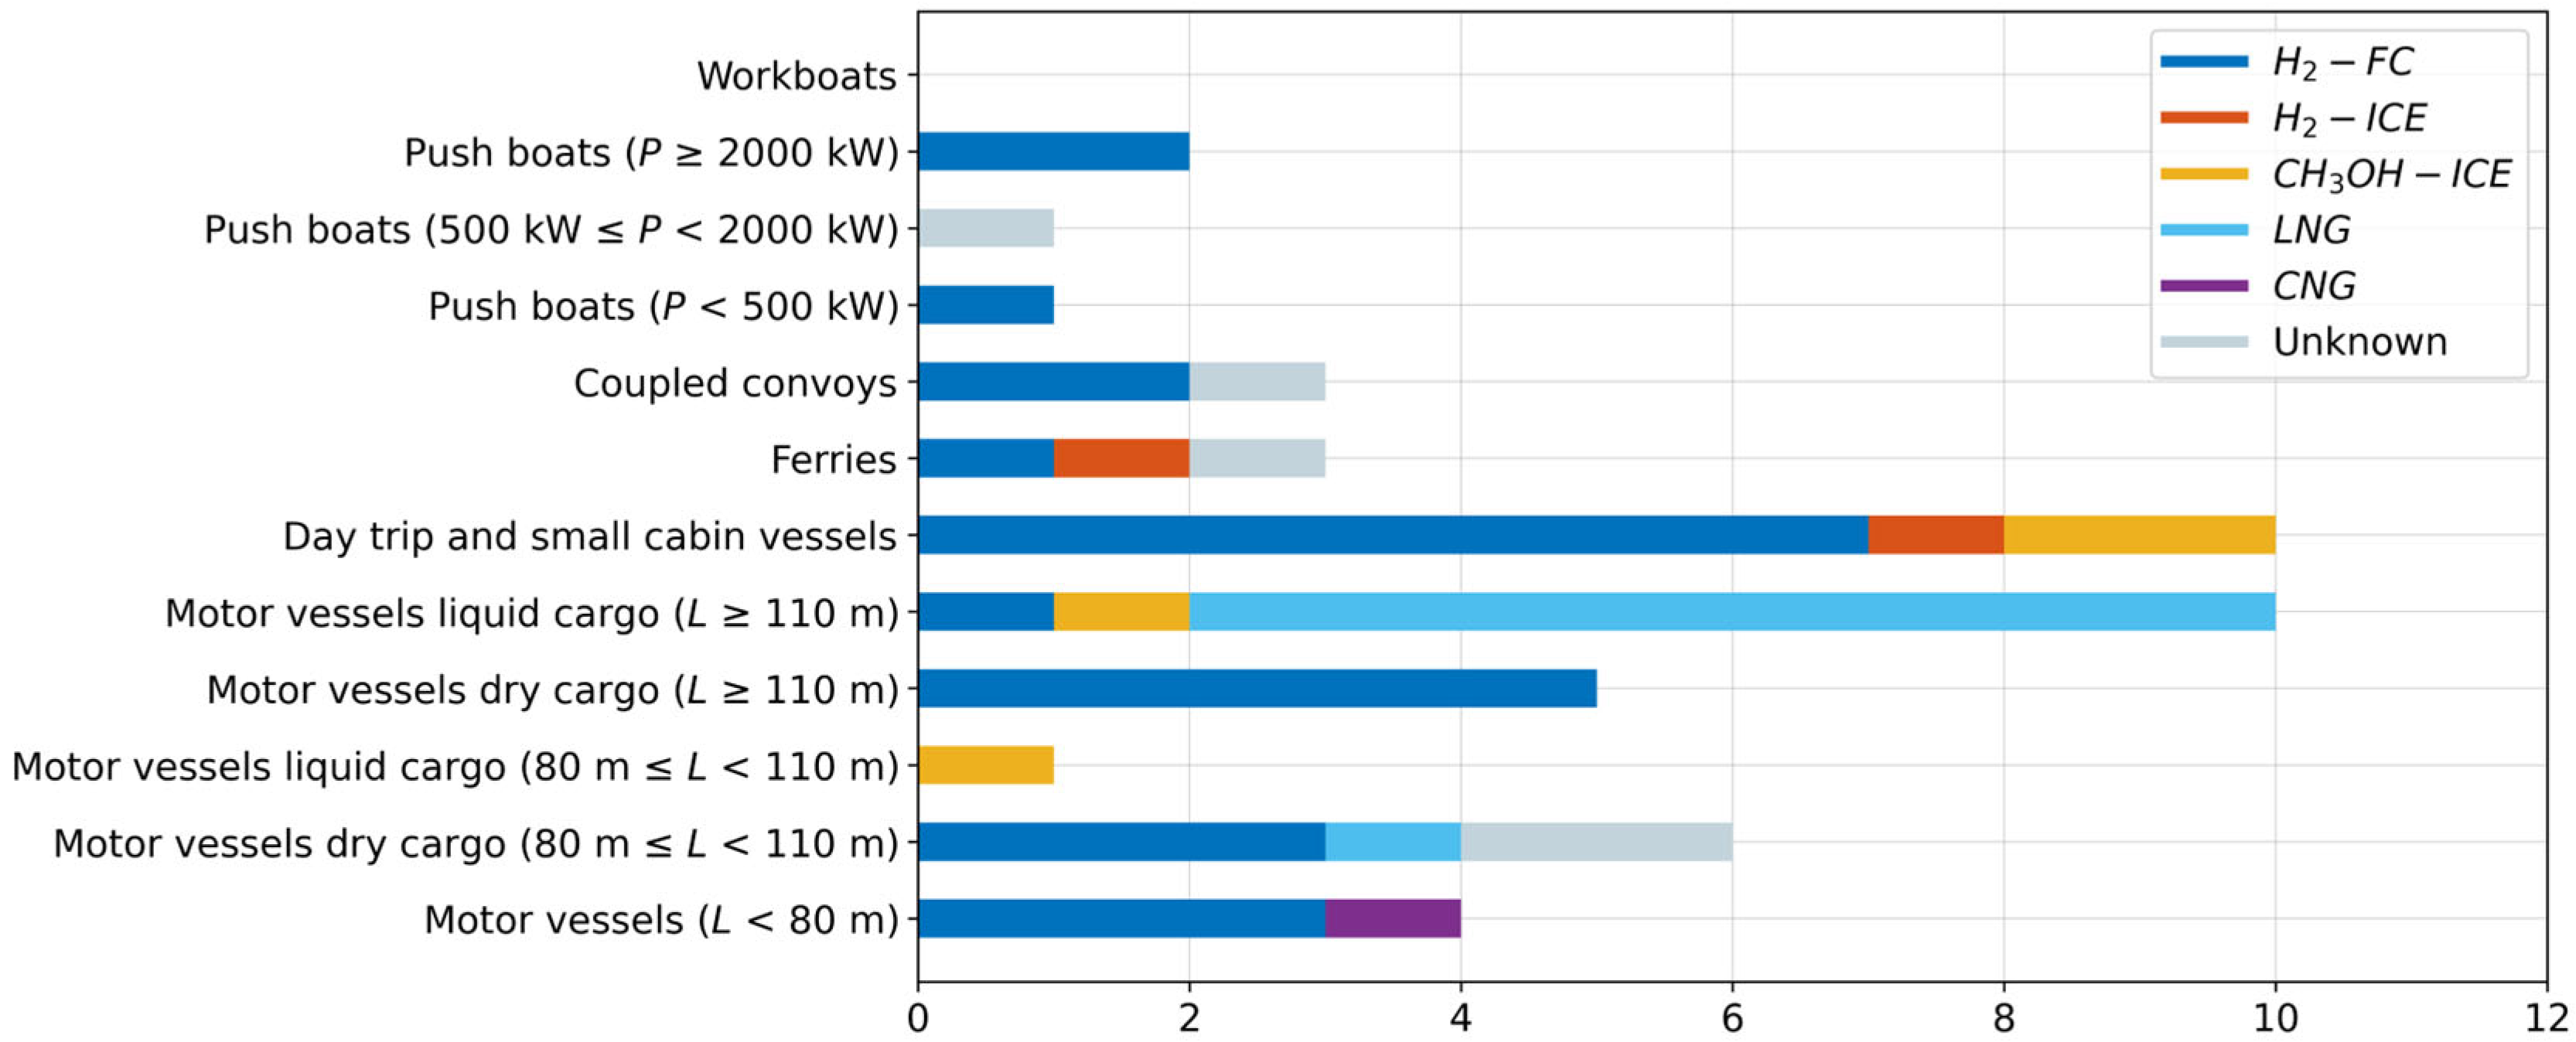
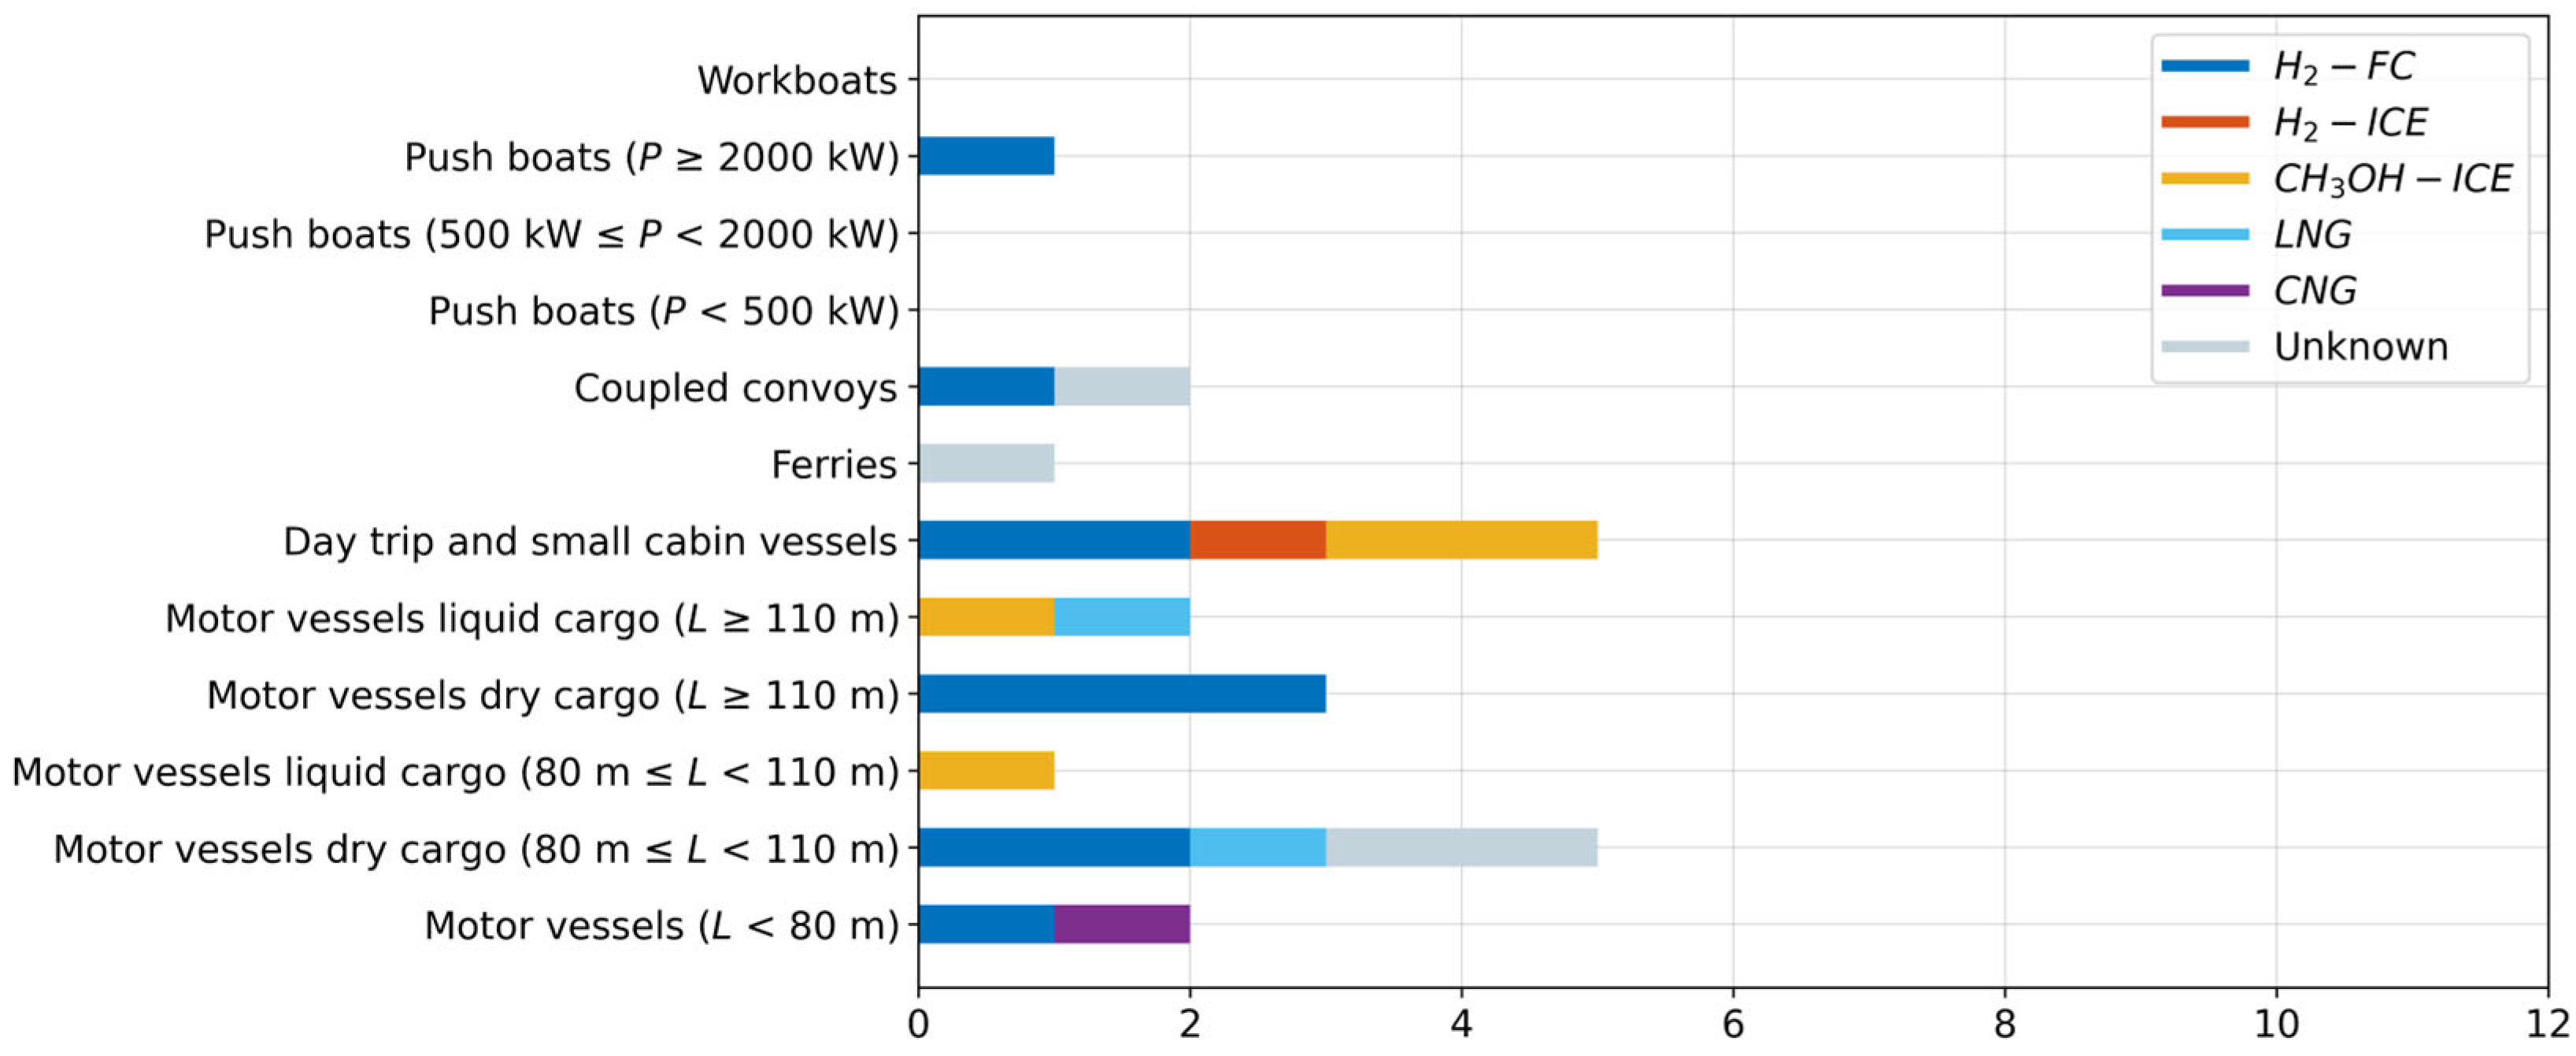
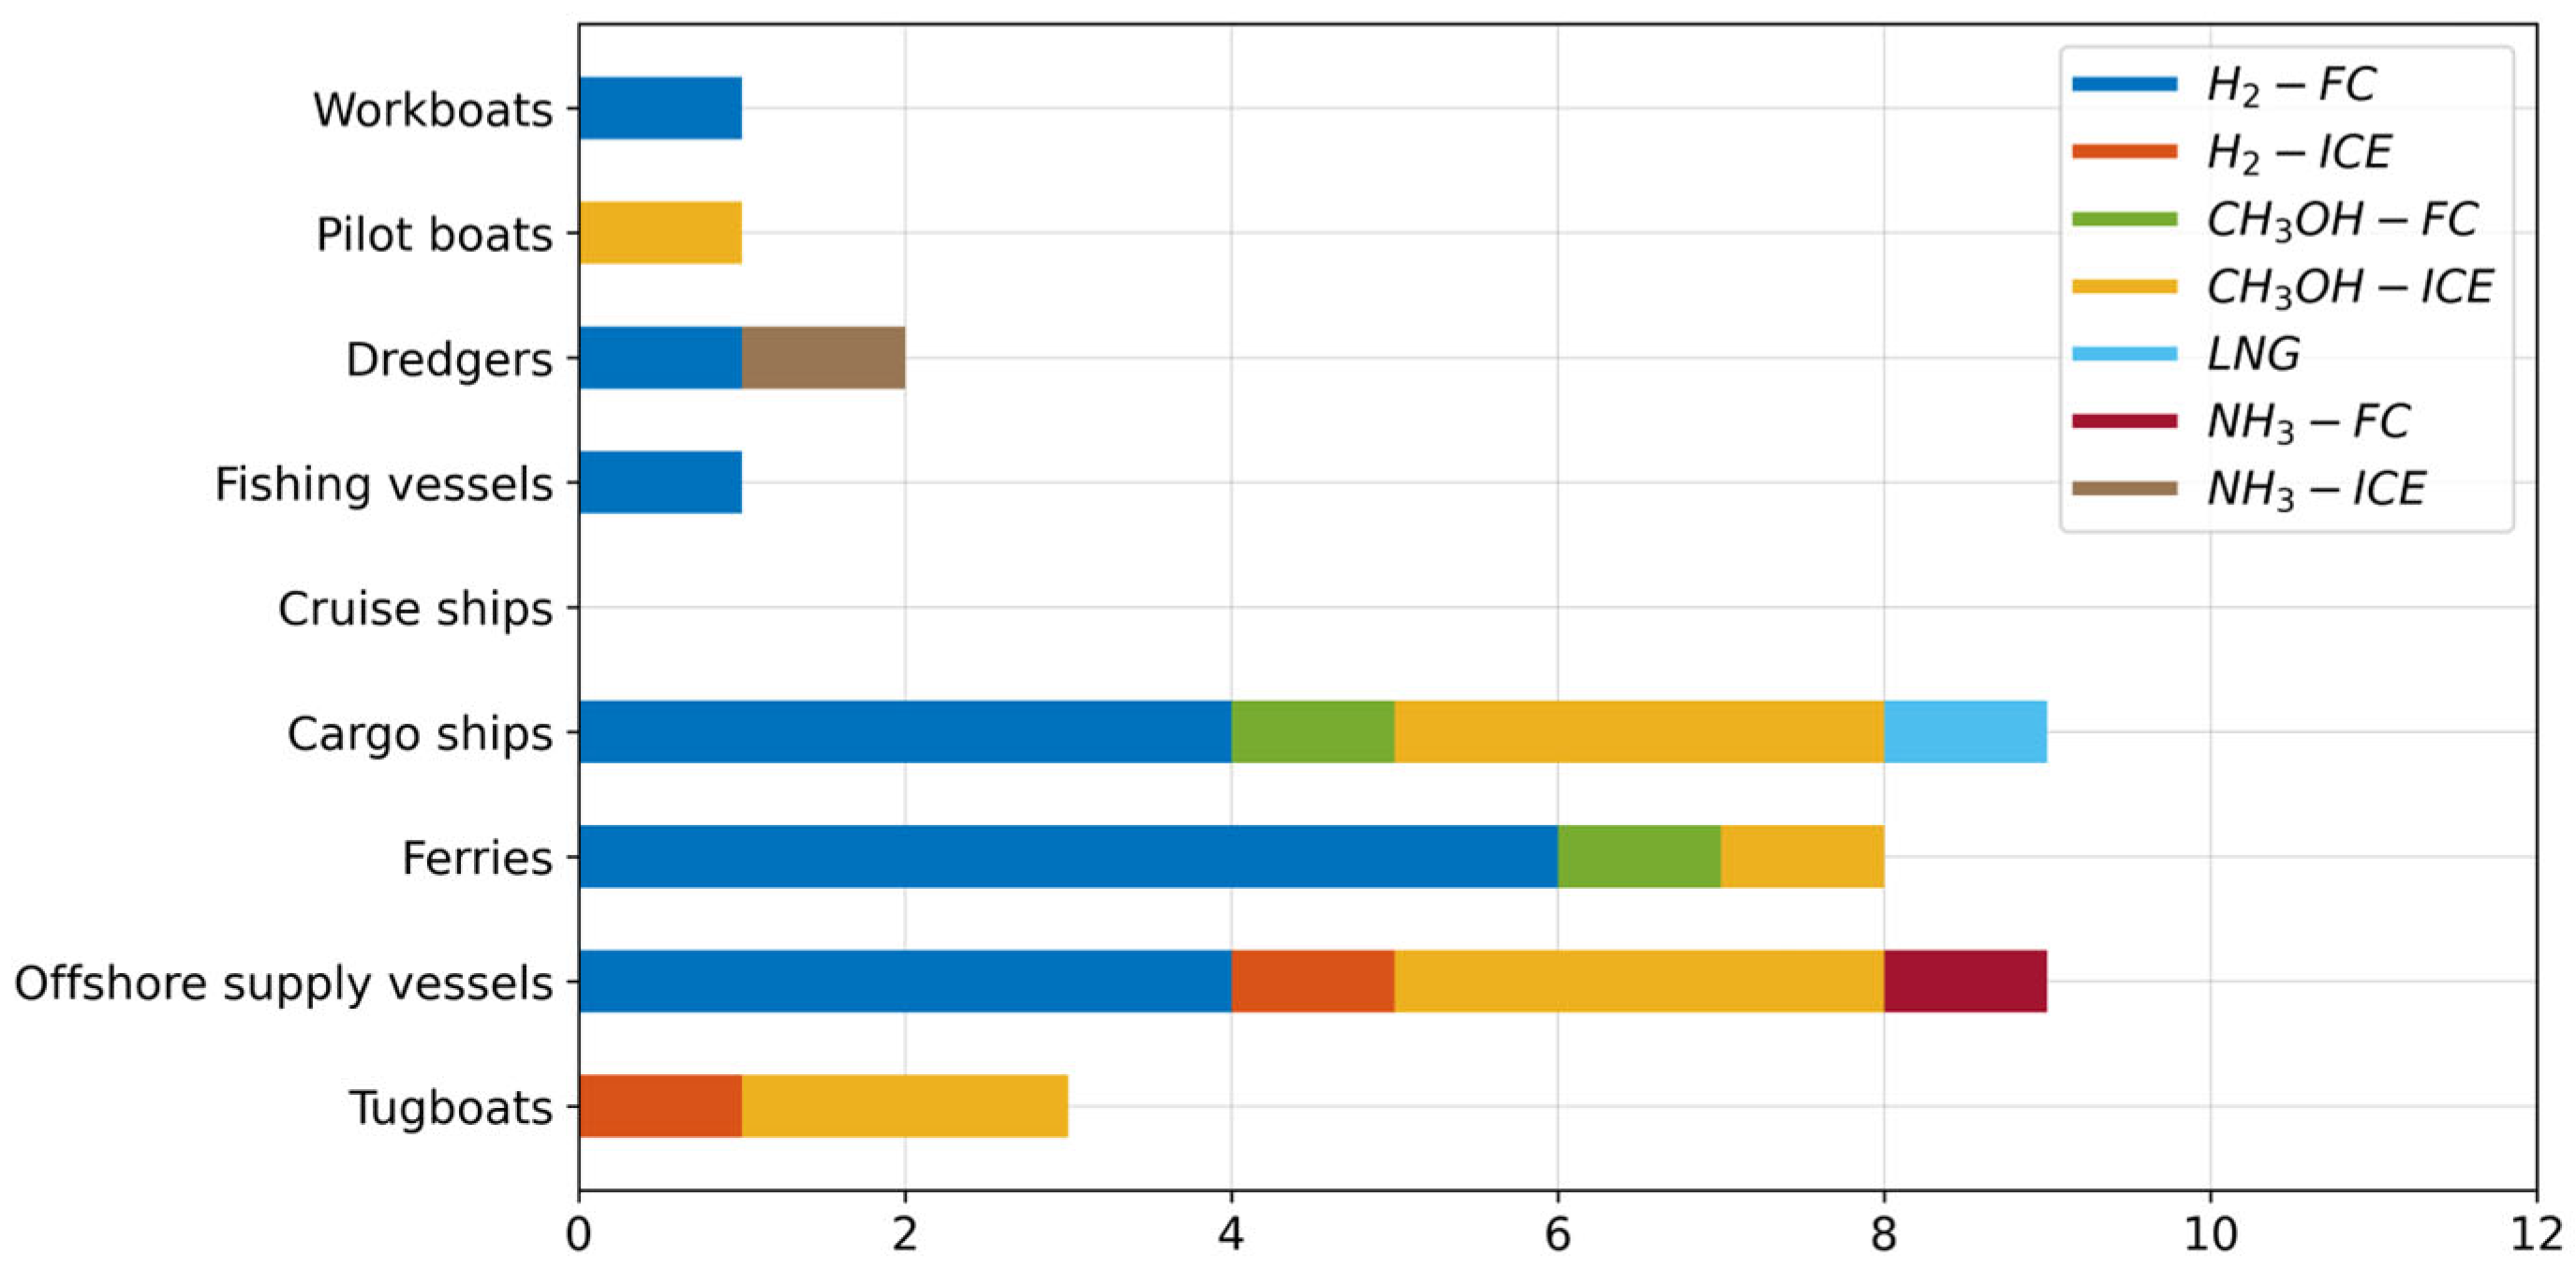
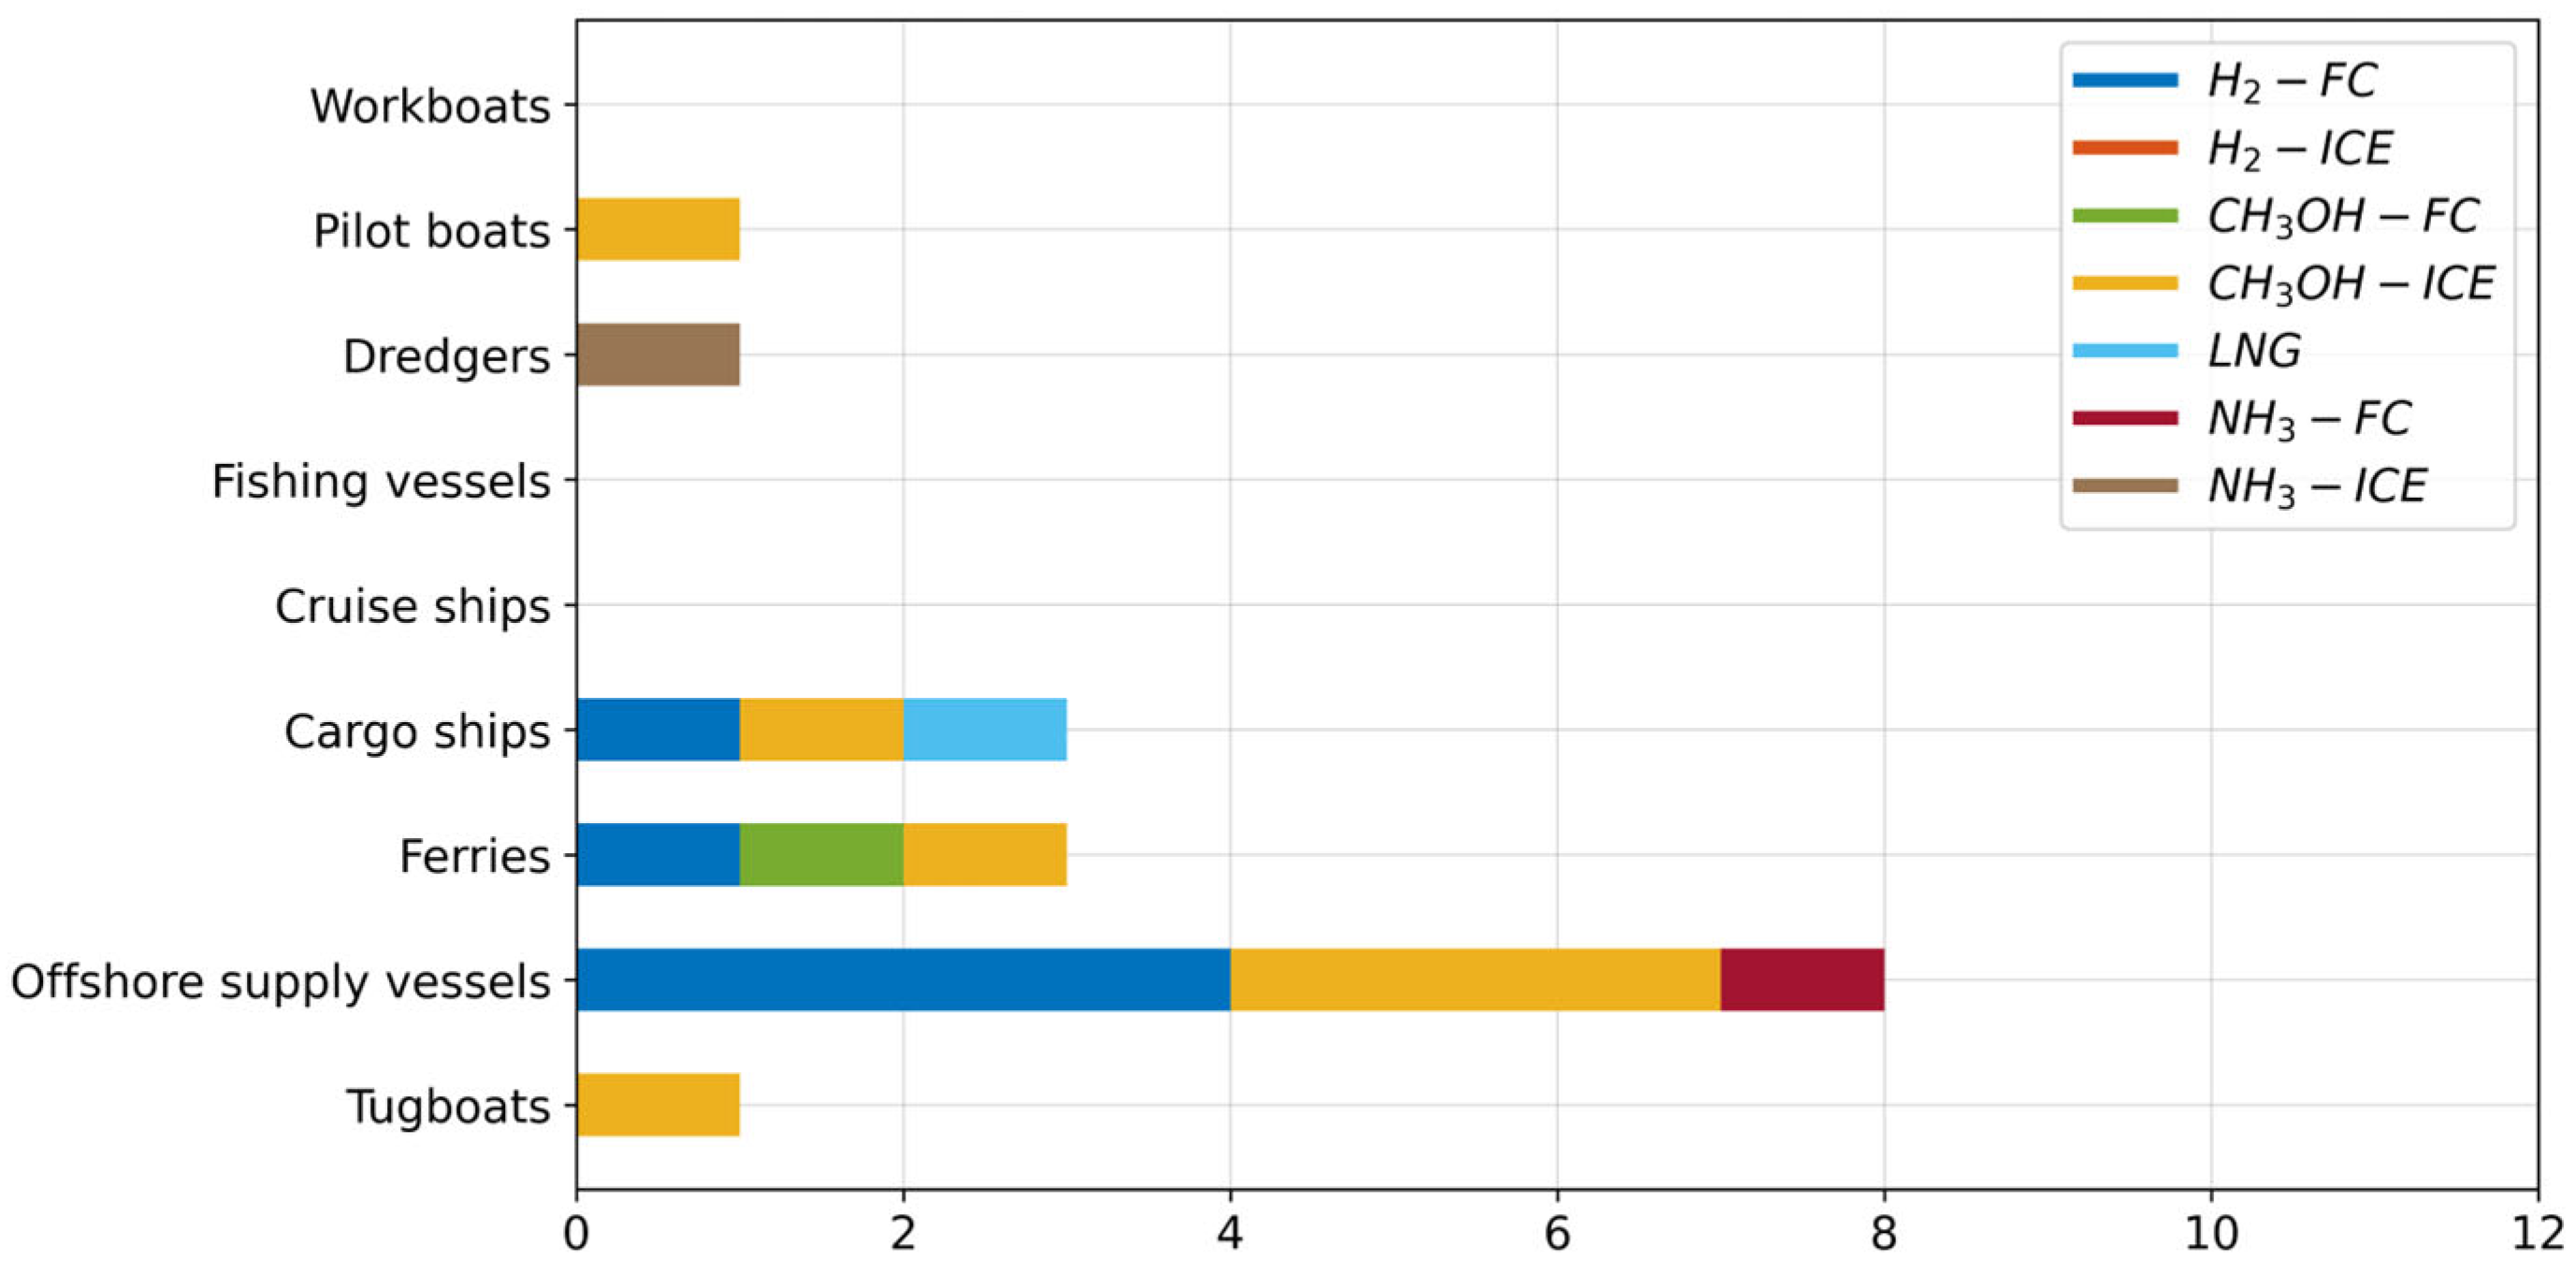
2. Identification of Greening Trends in Retrofitting
3. Well-to-Tank Modeling of Emissions and Costs
4. Tank-to-Wake Modeling of Emissions and Costs
- All internal combustion engines (ICEs) are assumed to be high-speed engines, as commonly used in inland ships. Smaller coastal ships also often feature engines of comparable characteristics.
- Based on the technical readiness level of the various technologies, it was assumed that electrification meant a fully electric propulsion train powered by lithium nickel manganese cobalt oxide (Li-NMC) batteries.
- H2-FC was assumed to feature 300-bar hydrogen storage and low-temperature proton-exchange membrane (LT-PEM) fuel cells.
- The currently available dual-fuel technologies for methanol feature variable methanol energy fractions. The dual-fuel methanol combustion metrics were based on research performed in [19], where a 65% methanol energy fraction was achieved.
- As a reference technology, marine diesel oil (MDO) or diesel fuels used in inland shipping (standard EN 590 of the European Committee for Standardization, see [20]) were used in combination with a high-speed engine including exhaust after-treatment.
5. Emissions and Costs of Retrofitting of Selected Inland and Coastal Ships
5.1. Electrification of the European Coastal Ferry Fleet
5.2. Electrification of the European Inland Day-Trip and Small Cabin Vessel Fleet
5.3. Retrofit of the European Fleet of Large Inland Dry Cargo Vessels Utilizing Hydrogen in Fuel Cells
5.4. Retrofit of the European Fleet of Offshore Supply Vessels Utilizing Methanol in Internal Combustion Engines
5.5. Evaluation of the Effects of Scaling Up of the Observed Greening Trends
6. Regulatory and Policy Landscape
- Reduce greenhouse gas emissions by 35% compared with 2015 by 2035;
- Reduce pollutant emissions by at least 35% compared with 2015 by 2035;
- Largely eliminate greenhouse gases and other pollutants by 2050 (at least 90% reduction).
7. Conclusions
Supplementary Materials
Author Contributions
Funding
Institutional Review Board Statement
Informed Consent Statement
Data Availability Statement
Conflicts of Interest
Abbreviations
| CCNR | Central Commission for the Navigation of the Rhine |
| CSRD | Corporate Sustainability Reporting Directive |
| EU | European Union |
| ETS | Emission Trading System |
| FC | Fuel cell |
| GFI | Greenhouse gas fuel intensity |
| GHG | Greenhouse gas |
| GT | Gross tonnage |
| GWP | Global warming potential |
| ICE | Internal combustion engine |
| Li-NMC | Lithium nickel manganese cobalt oxides |
| LT-PEM | Low-temperature proton-exchange membrane |
| MDO | Marine diesel oil |
| MRV | Monitoring, Reporting, and Verification |
| OSV | Offshore supply vessel |
| SSMS | Sustainable and Smart Mobility Strategy |
| TRL | Technology readiness level |
Appendix A
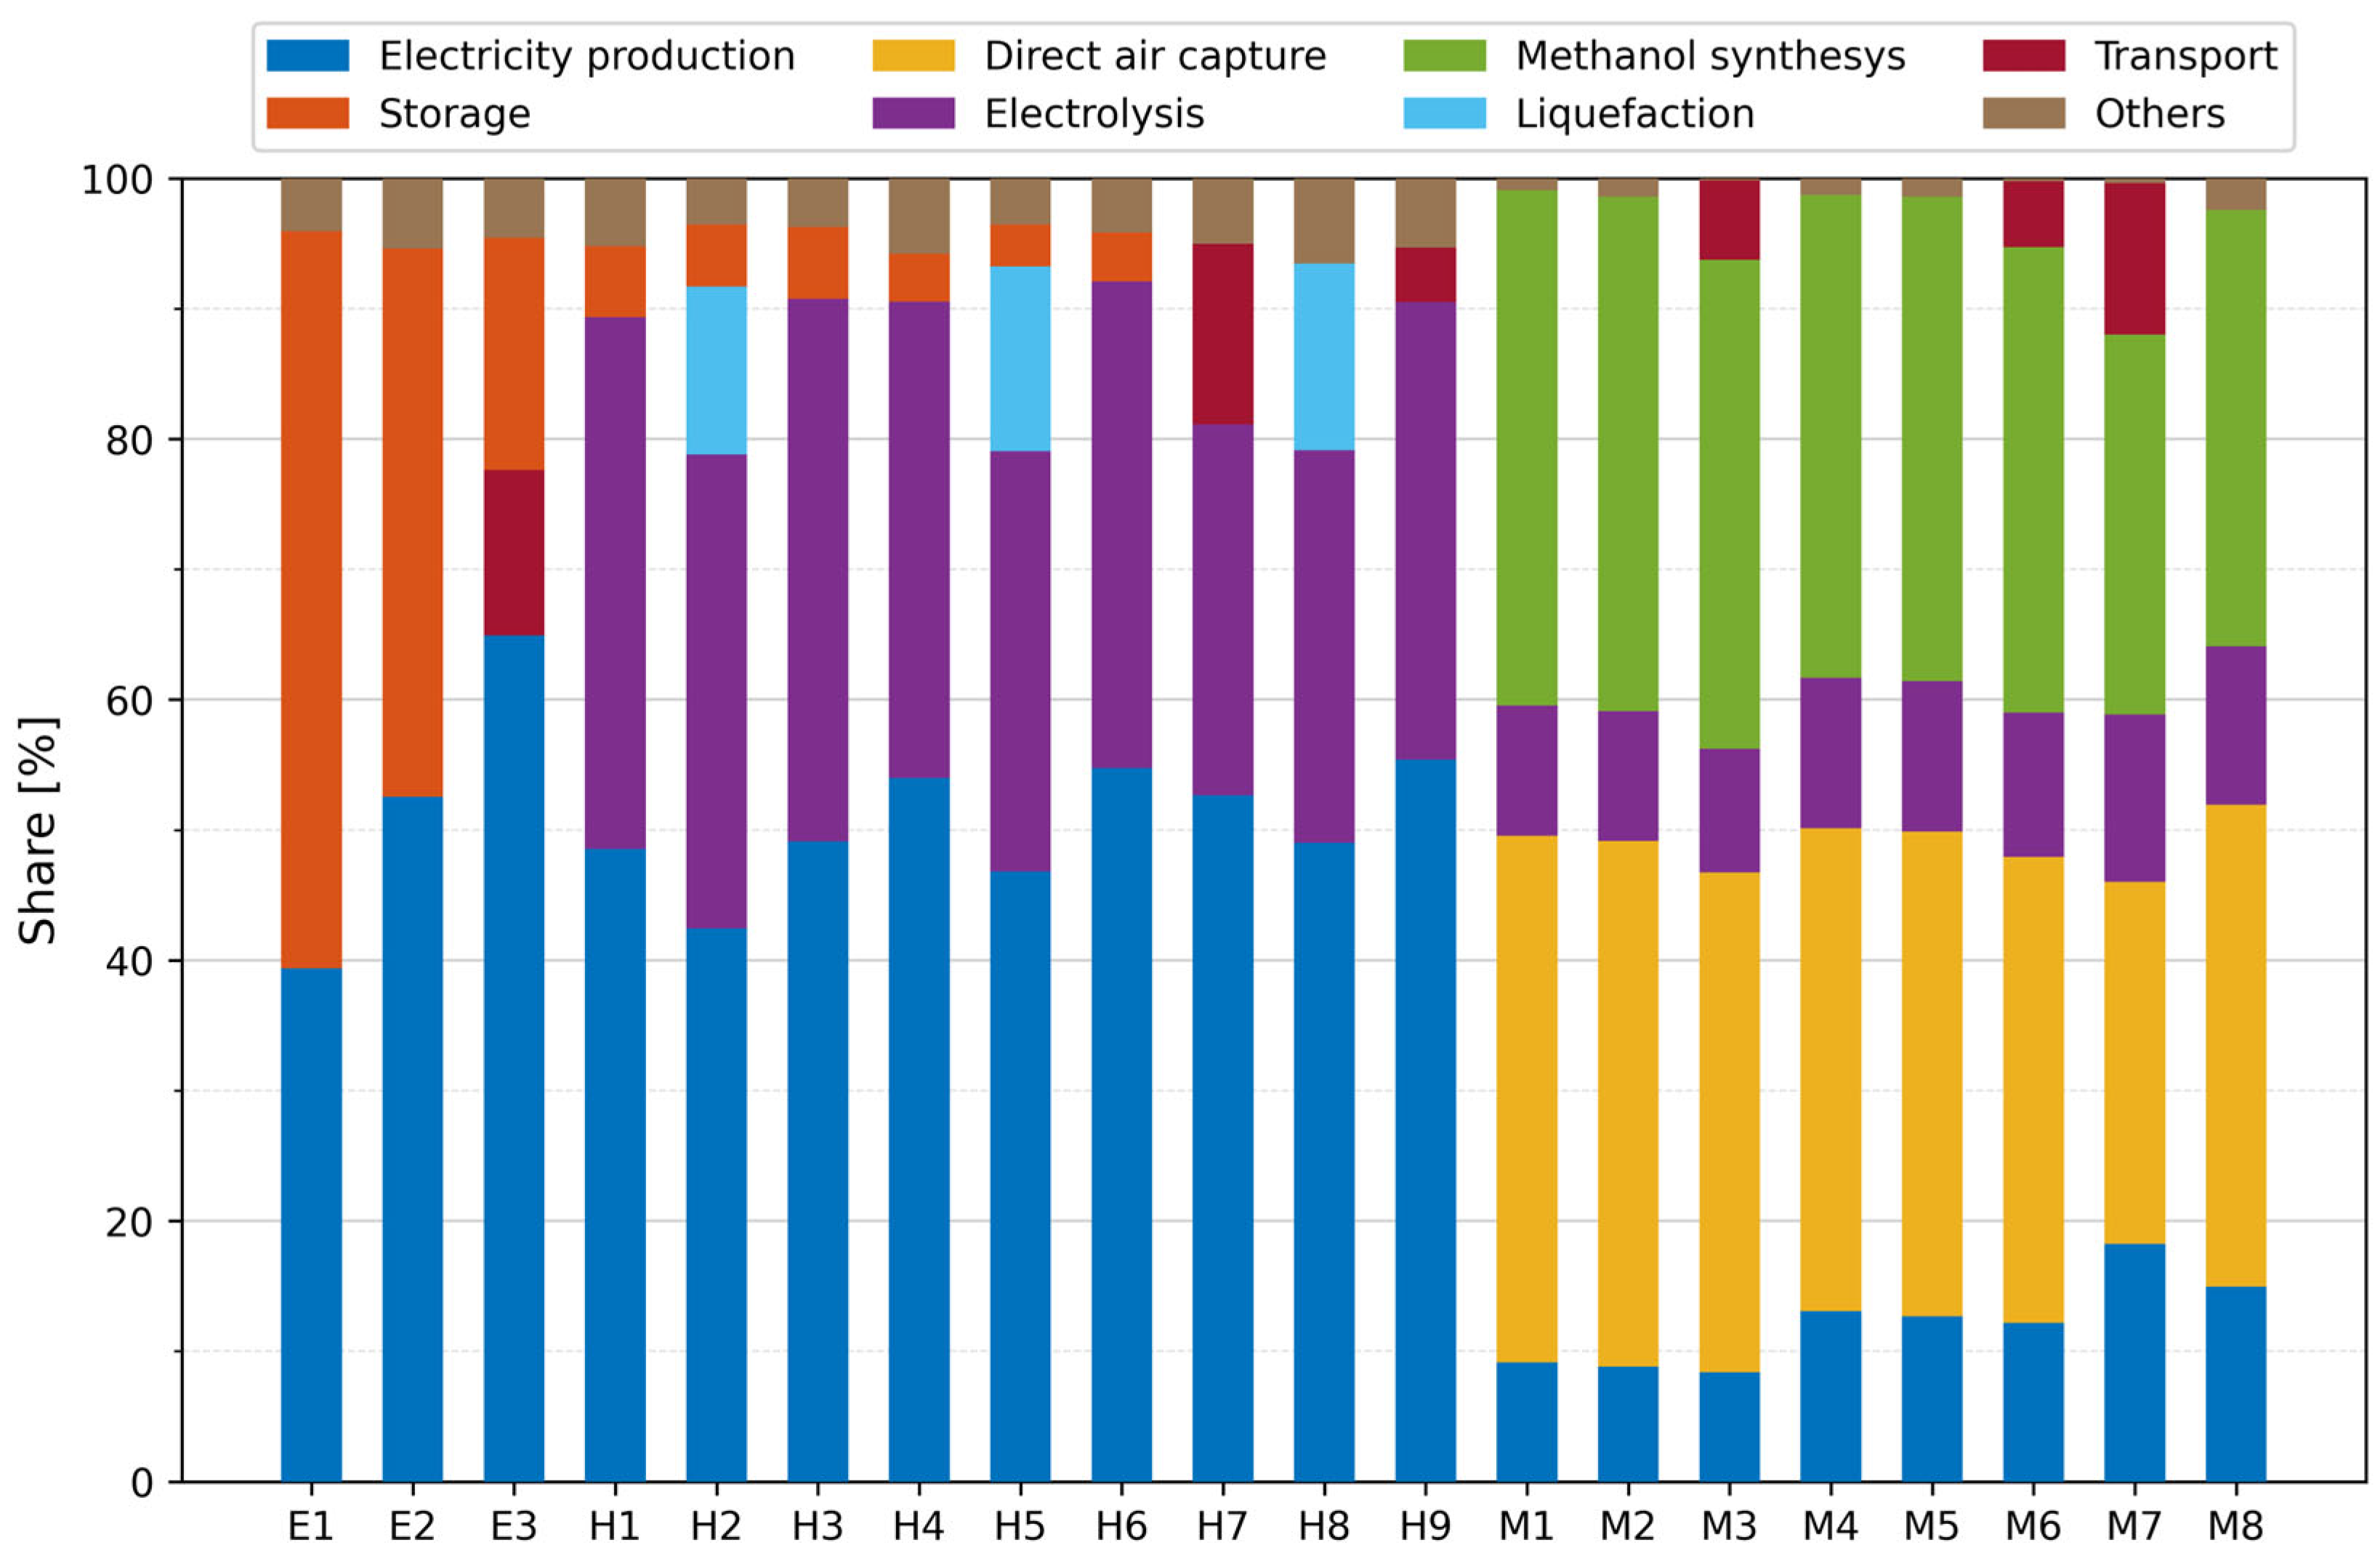
| Path | Energy Source | Decentralized Process | Energy Carrier/Mode of Transport | Centralized Process |
|---|---|---|---|---|
| E1 | Offshore wind | — | Electricity/grid | — |
| E2 | Onshore wind | — | Electricity/grid | — |
| E3 | Photovoltaics | — | Electricity/grid | — |
| H1 | Offshore wind | — | Electricity/grid | Electrolysis |
| H2 | Offshore wind | Electrolysis | Hydrogen/vessel | — |
| H3 | Offshore wind | Electrolysis | Hydrogen/pipeline | — |
| H4 | Onshore wind | — | Electricity/grid | Electrolysis |
| H5 | Onshore wind | Electrolysis | Hydrogen/vessel | — |
| H6 | Onshore wind | Electrolysis | Hydrogen/pipeline | — |
| H7 | Photovoltaics | — | Electricity/grid | Electrolysis |
| H8 | Photovoltaics | Electrolysis | Hydrogen/vessel | — |
| H9 | Photovoltaics | Electrolysis | Hydrogen/pipeline | — |
| M1 | Offshore wind | — | Electricity/grid | Methanol synthesis |
| M2 | Offshore wind | Methanol synthesis | Methanol/vessel | — |
| M3 | Offshore wind | Methanol synthesis | Methanol/lorry | — |
| M4 | Onshore wind | — | Electricity/grid | Methanol synthesis |
| M5 | Onshore wind | Methanol synthesis | Methanol/vessel | — |
| M6 | Onshore wind | Methanol synthesis | Methanol/lorry | — |
| M7 | Photovoltaics | — | Electricity/grid | Methanol synthesis |
| M8 | Photovoltaics | Methanol synthesis | Methanol/vessel | — |
Appendix B
| Fleet Segment | Costs of New System | Minimum Cost of Energy per Year | Maximum Cost of Energy per Year | Cost of Diesel System | Cost of Diesel per Year |
|---|---|---|---|---|---|
| [EUR] | [EUR] | [EUR] | [EUR] | [EUR] | |
| Coastal ferries (<1000) a | 1,639,900 | 1,546,756 | 1,857,119 | 585,871 | 821,376 |
| Coastal ferries (1000–1999) a | 3,758,200 | 3,544,740 | 4,256,007 | 1,342,656 | 1,882,368 |
| Coastal ferries (2000–2999) a | 5,639,600 | 5,319,279 | 6,386,616 | 2,014,805 | 2,824,704 |
| Inland day-trip and small cabin vessels a | 743,026 | 62,936 | 73,700 | 400,860 | 52,969 |
| Inland dry cargo vessels, L ≥ 110 m b | 5,695,557 | 497,657 | 953,393 | 1,398,996 | 332,528 |
| OSVs (<2000 GT) c | 3,764,961 | 5,800,261 | 10,185,228 | 2,790,347 | 1,105,328 |
| OSVs (<2000 GT) d | 4,576,865 | 4,480,192 | 7,574,726 | 2,790,347 | 1,105,328 |
| OSVs (2000–3000 GT) c | 5,010,924 | 7,719,779 | 13,555,891 | 3,713,775 | 1,471,121 |
| OSVs (2000–3000 GT) d | 6,091,517 | 5,962,851 | 10,081,479 | 3,713,775 | 1,471,121 |
| OSVs (3000–4000 GT) c | 7,029,156 | 10,829,047 | 19,015,748 | 5,209,559 | 2,063,640 |
| OSVs (3000–4000 GT) d | 8,544,975 | 8,364,487 | 14,141,959 | 5,209,559 | 2,063,640 |
| OSVs (4000–5000 GT) c | 7,860,925 | 12,110,462 | 21,265,907 | 5,826,013 | 2,307,833 |
| OSVs (4000–5000 GT) d | 9,556,114 | 9,354,268 | 15,815,396 | 5,826,013 | 2,307,833 |
| Fleet Segment | Costs of New System | Minimum Cost of Energy per Year | Maximum Cost of Energy per Year | Cost of Diesel System | Cost of Diesel per Year |
|---|---|---|---|---|---|
| [EUR] | [EUR] | [EUR] | [EUR] | [EUR] | |
| Coastal ferries (<1000) a | 1,547,210 | 1,107,650 | 1,306,682 | 585,871 | 824,456 |
| Coastal ferries (1000–1999) a | 3,545,780 | 2,538,428 | 2,994,555 | 1,342,656 | 1,889,427 |
| Coastal ferries (2000–2999) a | 5,320,840 | 3,809,196 | 4,493,666 | 2,014,805 | 2,835,297 |
| Inland day-trip and small cabin vessels a | 668,724 | 39,604 | 51,856 | 400,860 | 69,267 |
| Inland dry cargo vessels, L ≥ 110 m b | 5,142,821 | 310,201 | 633,364 | 1,394,371 | 434,845 |
| OSVs (<2000 GT) c | 3,393,235 | 2,776,449 | 6,214,744 | 2,790,347 | 1,109,473 |
| OSVs (<2000 GT) d | 4,123,683 | 2,347,695 | 4,774,149 | 2,790,347 | 1,109,473 |
| OSVs (2000–3000 GT) c | 4,516,180 | 3,695,277 | 8,271,430 | 3,713,775 | 1,476,638 |
| OSVs (2000–3000 GT) d | 5,488,361 | 3,124,633 | 6,354,090 | 3,713,775 | 1,476,638 |
| OSVs (3000–4000 GT) c | 6,335,145 | 5,183,610 | 11,602,883 | 5,209,559 | 2,071,378 |
| OSVs (3000–4000 GT) d | 7,698,888 | 4,383,130 | 8,913,303 | 5,209,559 | 2,071,378 |
| OSVs (4000–5000 GT) c | 7,084,791 | 5,796,994 | 12,975,868 | 5,826,013 | 2,316,487 |
| OSVs (4000–5000 GT) d | 8,609,907 | 4,901,792 | 9,968,026 | 5,826,013 | 2,316,487 |
References
- International Maritime Organization. International Convention for the Prevention of Pollution from Ships, 1973, as Modified by the Protocol of 1978 (MARPOL) as Amended; International Maritime Organization: London, UK, 2021. [Google Scholar]
- Handl, G. Decarbonising the Shipping Industry: A Status Report. Int. J. Mar. Coast. Law 2023, 38, 730–791. [Google Scholar] [CrossRef]
- Ehlers, P. A Success Story? Fifty Years of MARPOL. Int. J. Mar. Coast. Law 2024, 40, 1–56. [Google Scholar] [CrossRef]
- Bačkalov, I.; Frank, E.; Friedhoff, B.; Grasman, A.; Jasa, J.; Kreukniet, N.; Quispel, M. Exploration and synchronization of greening of shipping by means of retrofit: The SYNERGETICS perspective. In Transport Transitions: Advancing Sustainable and Inclusive Mobility. TRA Conference 2024. Lecture Notes in Mobility; McNally, C., Carroll, P., Martinez-Pastor, B., Ghosh, B., Efthymiou, M., Valantasis-Kanellos, N., Eds.; Springer: Cham, Switzerland, 2025; Volume 3, pp. 687–693. [Google Scholar]
- SYNERGETICS Website. Available online: https://www.synergetics-project.eu/downloads/ (accessed on 12 May 2025).
- Martínez-López, A.; Marrero, A.; Romero-Filgueira, A. Assessment of emerging technologies for high-speed-crafts decarbonization under the European Union regulation. Res. Transp. Econ. 2024, 108, 101497. [Google Scholar] [CrossRef]
- Laasma, A.; Otsason, R.; Tapaninen, U.; Hilmola, O.-P. Evaluation of alternative fuels for coastal ferries. Sustainability 2022, 14, 16841. [Google Scholar] [CrossRef]
- Bergek, A.; Bjørgum, Ø.; Hansen, T.; Hanson, J.; Steen, M. Sustainability transitions in coastal shipping: The role of regime segmentation. Transp. Res. Interdiscip. Perspect. 2021, 12, 100497. [Google Scholar] [CrossRef]
- Dong, T.; Alamoush, A.; Schönborn, A.; Ghaforian Masodzadeh, P.; Park, C.; Park, H.-S.; Vakili, S.; Bilgili, L.; Ballini, F.; Ölcer, A.I. Roadmap for the Decarbonization of Domestic Passenger Ferries in the Republic of Korea. Sustainability 2025, 17, 1545. [Google Scholar] [CrossRef]
- Ahmed, S.; Li, T.; Li, S.Y.; Chen, R. Comparative life cycle impact assessment of offshore support vessels powered by alternative fuels for sustainable offshore wind operations using machine learning. J. Ocean. Eng. Sci. 2023, in press. [Google Scholar] [CrossRef]
- Perčić, M.; Jovanović, I.; Fan, A.; Vladimir, N. Design of alternative power systems for ferries operating in the Adriatic Sea. Ocean Eng. 2025, 319, 120246. [Google Scholar] [CrossRef]
- Chatelier, J.M. Entering a new era for electrical vessels on inland waterways. Ship Sci. Technol. 2023, 16, 21–32. [Google Scholar] [CrossRef]
- Otsason, R.; Tapaninen, U. Decarbonizing City Water Traffic: Case of Comparing Electric and Diesel-Powered Ferries. Sustainability 2023, 15, 16170. [Google Scholar] [CrossRef]
- Teske, T.; Fitz, A.; Schwedt, T.; Baetcke, L.; Ehlers, S. Electrifying inland waterway transport—A case study for Germany. Ship Technol. Res. 2025, 1–14. [Google Scholar] [CrossRef]
- Chandrasekar, A.; Godjevac, M.; Littler, B. Assessment of the Scalability of (Hydrogen) Retrofit Solutions as a Greening Solution Across the Inland Waterway Fleet. Future Proof Shipping White Paper. 2023. Available online: https://futureproofshipping.com/whitepapers/2023/assessment-of-the-scalability-of-hydrogen-retrofit-solutions-as-a-greening-solution-across-the-inland-waterway-fleet/ (accessed on 7 March 2025).
- Thalmann, F.; Frank, E.; Moser-Stenström, C.; Sanchen, A. SYNERGETICS Deliverable 1.2: Report on Suitability of Identified Technical Solutions. 2024. Available online: https://www.synergetics-project.eu/downloads/ (accessed on 17 February 2025).
- Liebich, A.; Fröhlich, T.; Münter, D.; Fehrenbach, H.; Giegrich, J.; Köppen, S.; Dünnebeil, F.; Knörr, W.; Biemann, K.; Simon, S.; et al. System Comparison of Storable Energy Carriers from Renewable Energies; Federal Environment Agency (Umweltbundesamt): Dessau-Rosslau, Germany, 2021. [Google Scholar]
- Grasman, A.; Gaillarde, G. Sustainable Power Portal. MARIN Report 141. 2024. Available online: https://www.marin.nl/en/publications/sustainable-power-portal (accessed on 17 February 2025).
- Ramne, B.; Puljic, A.; Thompson, O.; Molander, P. SYNERGETICS Deliverable 3.17 Evaluation Report on Application of Methanol: Compression Ignited vs. Dual Fuel. 2024. Available online: https://www.synergetics-project.eu/downloads/ (accessed on 17 February 2025).
- EN 590:2022; Automotive fuels—Diesel—Requirements and test methods. European Committee for Standardization: Brussels, Belgium, 2022.
- International Maritime Organization. Third IMO GHG Study 2014; International Maritime Organization: London, UK, 2014. [Google Scholar]
- International Maritime Organization. Fourth IMO GHG Study 2020; International Maritime Organization: London, UK, 2020. [Google Scholar]
- Verbeek, R.P.; Verbeek, M.M.J.F. LNG for Trucks and Ships: Fact Analysis Review of Pollutant and GHG Emissions; TNO: Delft, The Netherlands, 2014. [Google Scholar]
- Zijlema, P.J. The Netherlands: List of Fuels and Standard CO2 Emission Factors; Netherlands Enterprise Agency: The Hague, The Netherlands, 2024. [Google Scholar]
- ISO 14083:2023; Greenhouse Gases—Quantification and Reporting of Greenhouse Gas Emissions Arising from Transport Chain Operations. International Organization for Standardization: Geneva, Switzerland, 2023.
- Dahlke-Wallat, F.; Friedhoff, B.; Karaarslan, S.; Martens, S.; Quispel, M. Assessment of Technologies in View of Zero-Emission IWT Edition 2. Part of the Overarching Study “Financing the Energy Transition Towards a Zero-Emission Europe—An IWT Sector”; Central Commission for the Navigation of the Rhine: Strasbourg, France, 2021. [Google Scholar]
- Stoffregen, A.; Baumann, M.; Hengstler, J.; Whitehouse, S. 1st Life Cycle GHG Emission Study on the Use of Alternative Marine Fuels; Sphera Solutions GmbH: Leinfelden-Echterdingen, Germany, 2021. [Google Scholar]
- Taljegard, M.; Brynolf, S.; Grahn, M.; Andersson, K.; Johnson, H. Cost-Effective Choices of Marine Fuels in a Carbon-Constrained World: Results from a Global Energy Model. Environ. Sci. Technol. 2014, 48, 12986–12993. [Google Scholar] [CrossRef]
- Kersey, J.; Popovich, N.D.; Phadke, A.A. Rapid battery cost declines accelerate the prospects of all-electric interregional container shipping. Nat. Energy 2022, 7, 664–674. [Google Scholar] [CrossRef]
- Kistner, L.; Bensmann, A.; Hanke-Rauschenbach, R. Potentials and limitations of battery-electric container ship propulsion systems. Energy Convers. Manag. X. 2024, 21, 100507. [Google Scholar] [CrossRef]
- E-Ferry—Prototype and Full-Scale Demonstration of Next Generation 100% Electrically Powered Ferry for Passengers and Vehicles. Available online: https://cordis.europa.eu/project/id/636027 (accessed on 13 May 2025).
- van der Geest, W.; Menist, M. Op Weg Naar Een Klimaatneutrale Binnenvaart Per 2050; Panteia: Zoetermeer, The Netherlands, 2019. [Google Scholar]
- DG Reform. Green Shipping in the Dutch State Fleet. Directorate-General for Structural Reform Support. 2021. Available online: https://reform-support.ec.europa.eu/publications-0/green-shipping-dutch-state-fleet_en (accessed on 10 March 2025).
- Lindstad, E.; Eskeland, G.; Rialland, A. Batteries in offshore support vessels—Pollution, climate impact and economics. Transp. Res. Part D Transp. Environ. 2017, 50, 409–417. [Google Scholar] [CrossRef]
- Crippa, M.; Guizzardi, D.; Pagani, F.; Banja, M.; Muntean, M.; Schaaf, E.; Becker, W.; Monforti-Ferrario, F.; Quadrelli, R.; Risquez Martin, A.; et al. GHG Emissions of All World Countries—JRC/IEA 2024 Report; EDGAR: Luxembourg, 2024; JRC138862. [CrossRef]
- The European Green Deal. Available online: https://commission.europa.eu/strategy-and-policy/priorities-2019-2024/european-green-deal_en (accessed on 13 May 2025).
- European Commission. Sustainable and Smart Mobility Strategy—Putting European Transport on Track for the Future; European Commission: Brussels, Belgium, 2020. [Google Scholar]
- Fit for 55. Available online: https://www.consilium.europa.eu/en/policies/fit-for-55/ (accessed on 13 May 2025).
- European Union. Directive (EU) 2023/2413 of the European Parliament and of the Council. In Official Journal of the European Union; European Union: Brussels, Belgium, 2023. [Google Scholar]
- EU Emissions Trading System. Available online: https://climate.ec.europa.eu/eu-action/eu-emissions-trading-system-eu-ets_en (accessed on 13 May 2025).
- International Maritime Organization. Circular Letter No. 5005; International Maritime Organization: London, UK, 2025. [Google Scholar]
- European Union. Directive (EU) 2022/2464 of the European Parliament and of the Council. In Official Journal of the European Union; European Union: Brussels, Belgium, 2022. [Google Scholar]
- Commission Simplifies Rules on Sustainability and EU Investments, Delivering over €6 Billion in Administrative Relief. Available online: https://finance.ec.europa.eu/publications/commission-simplifies-rules-sustainability-and-eu-investments-delivering-over-eu6-billion_en (accessed on 14 May 2025).
- European Commission. NAIADES III: Boosting Future-Proof European Inland Waterway Transport; European Commission: Brussels, Belgium, 2021. [Google Scholar]
- EU Taxonomy for Sustainable Activities. Available online: https://finance.ec.europa.eu/sustainable-finance/tools-and-standards/eu-taxonomy-sustainable-activities_en (accessed on 14 May 2025).
- European Union. Commission delegated Regulation (EU) 2023/2485. In Official Journal of the European Union; European Union: Brussels, Belgium, 2023. [Google Scholar]
- European Union. Regulation (EU) 2023/1805 of the European Parliament and of the Council. In Official Journal of the European Union; European Union: Brussels, Belgium, 2023. [Google Scholar]
- European Union. Regulation (EU) 2016/1628 of the European Parliament and of the Council. In Official Journal of the European Union; European Union: Brussels, Belgium, 2016. [Google Scholar]
- Central Commission for Navigation of the Rhine. CCNR Roadmap for Reducing Inland Navigation Emissions; Central Commission for Navigation of the Rhine: Strasbourg, France, 2022. [Google Scholar]
- Central Commission for Navigation of the Rhine. 150 Years of the Mannheim Act—The Driving Force Behind Dynamic Inland Navigation; Central Commission for Navigation of the Rhine: Strasbourg, France, 2018. [Google Scholar]
- European Union. Regulation (EU) 2015/757 of the European Parliament and of the Council. Reducing emissions from the shipping sector. In Official Journal of the European Union; European Union: Brussels, Belgium, 2015. [Google Scholar]


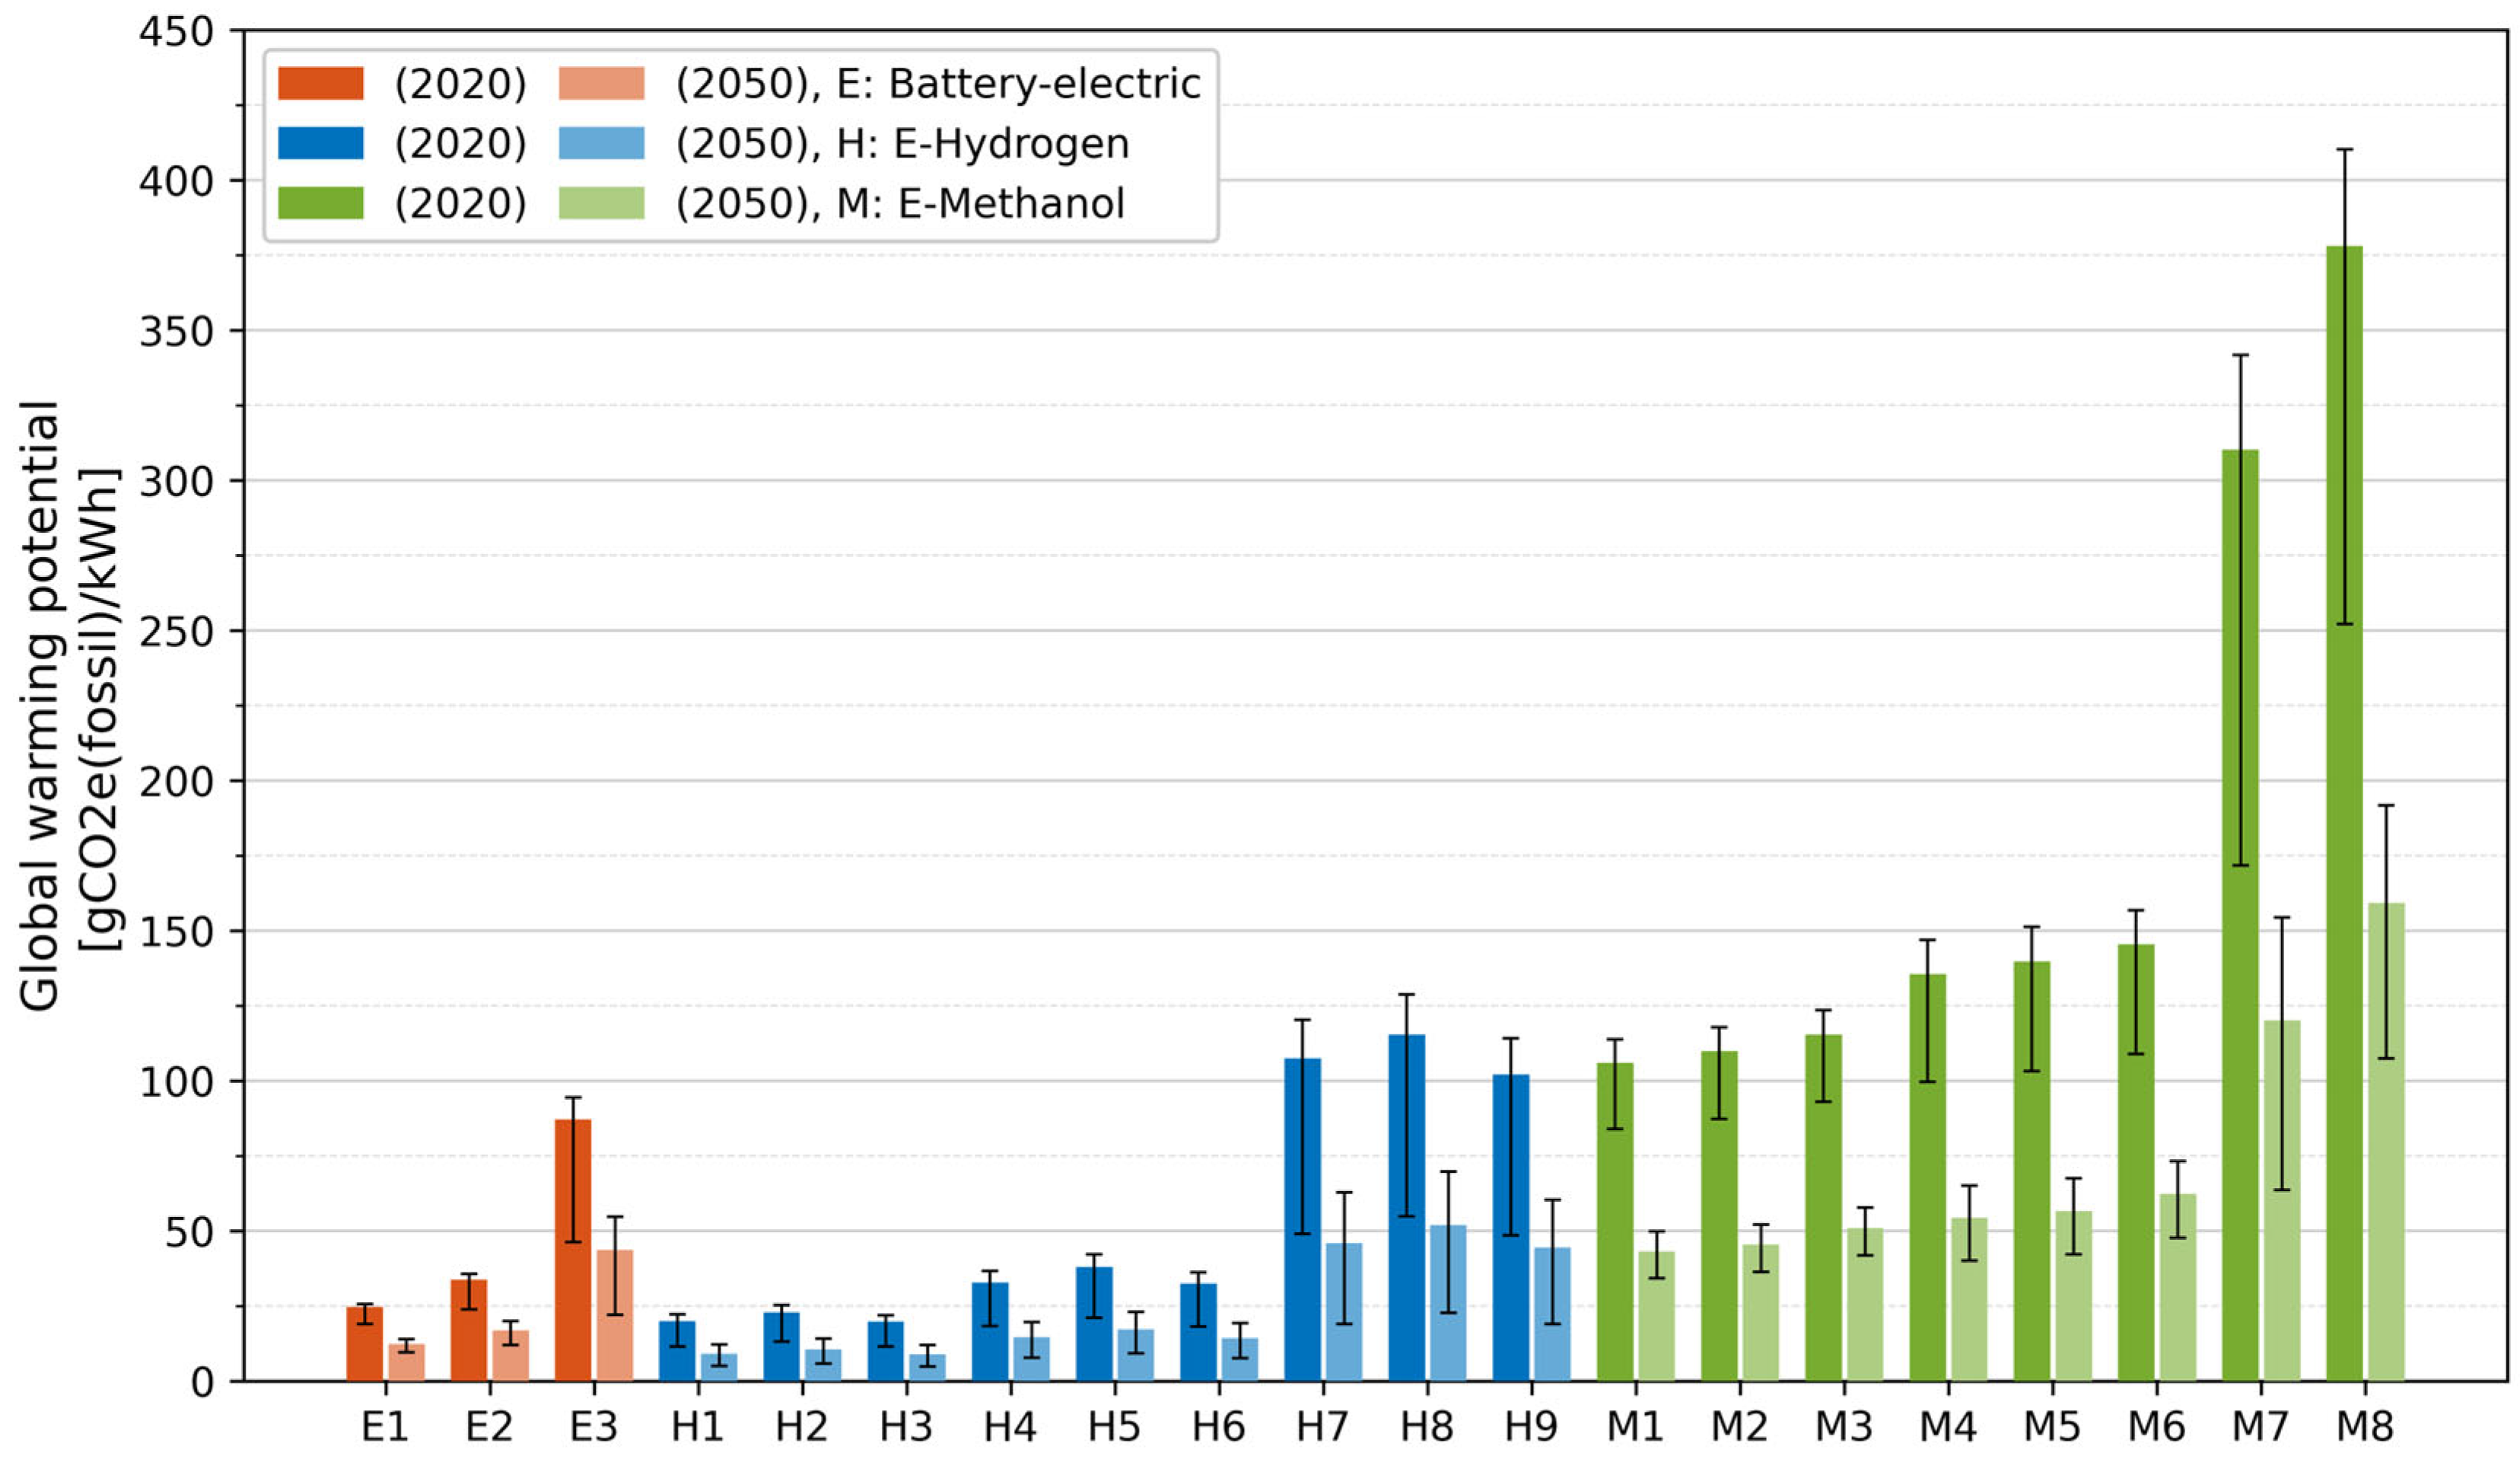
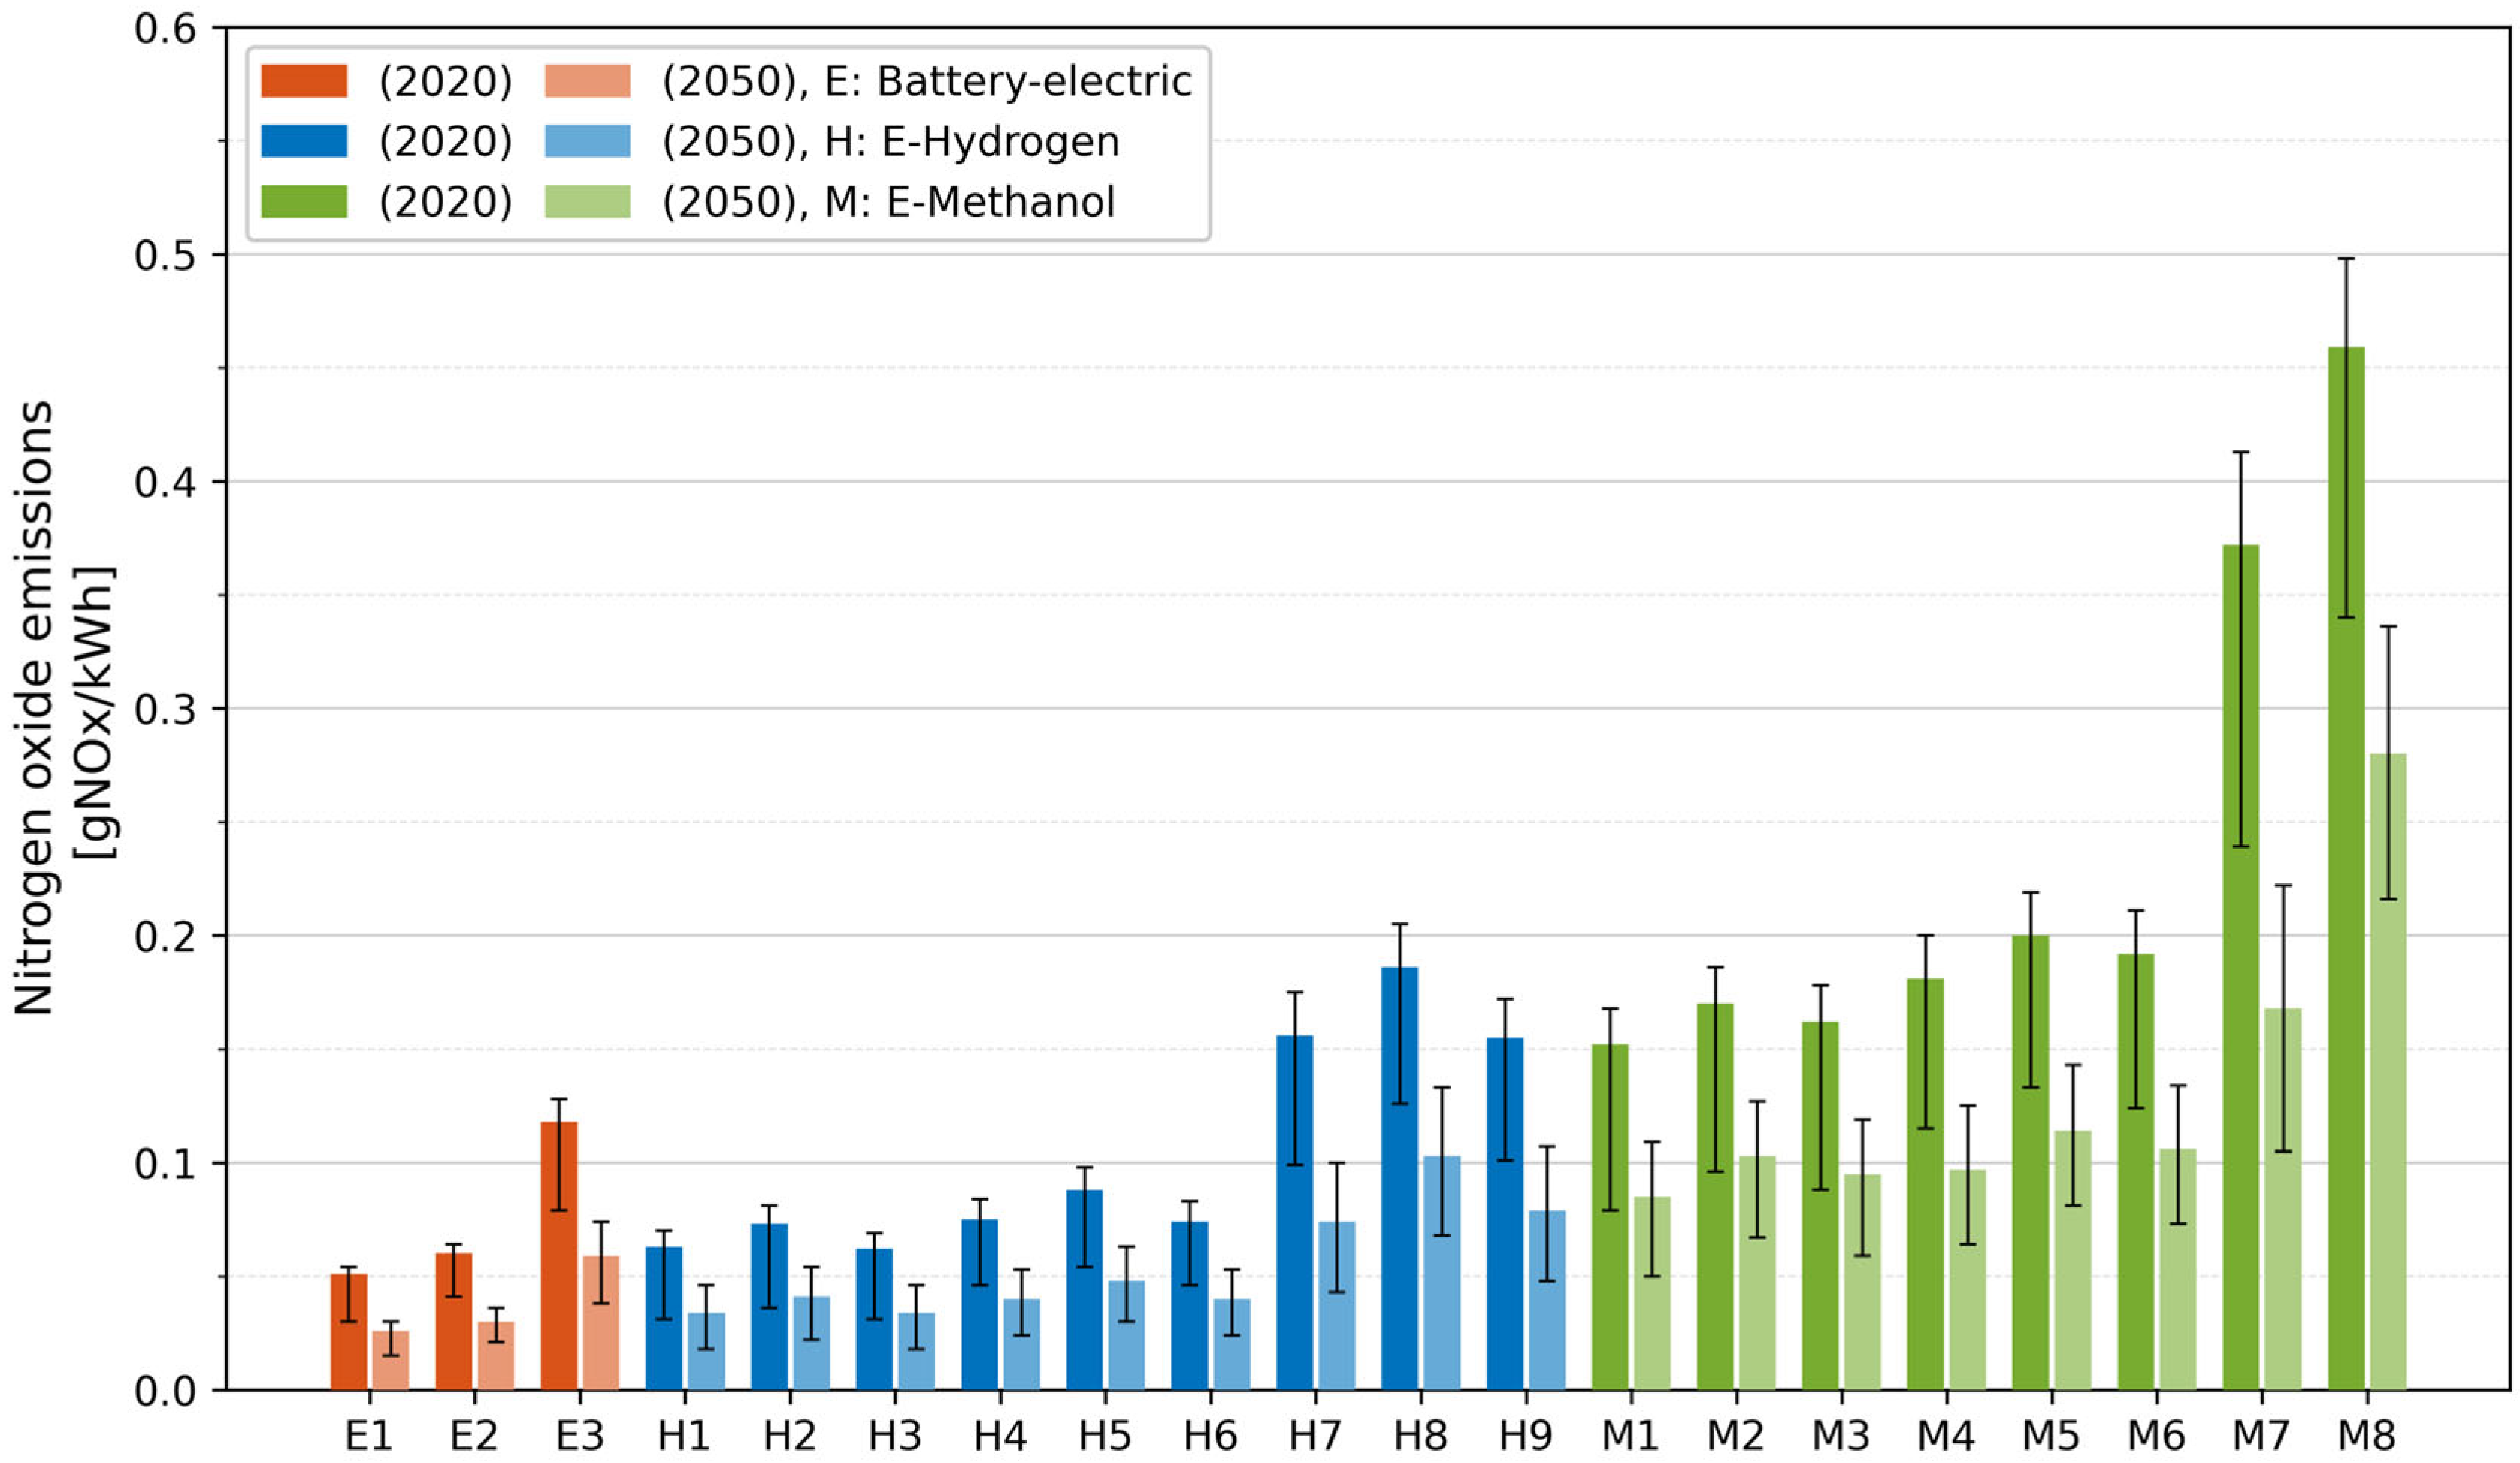
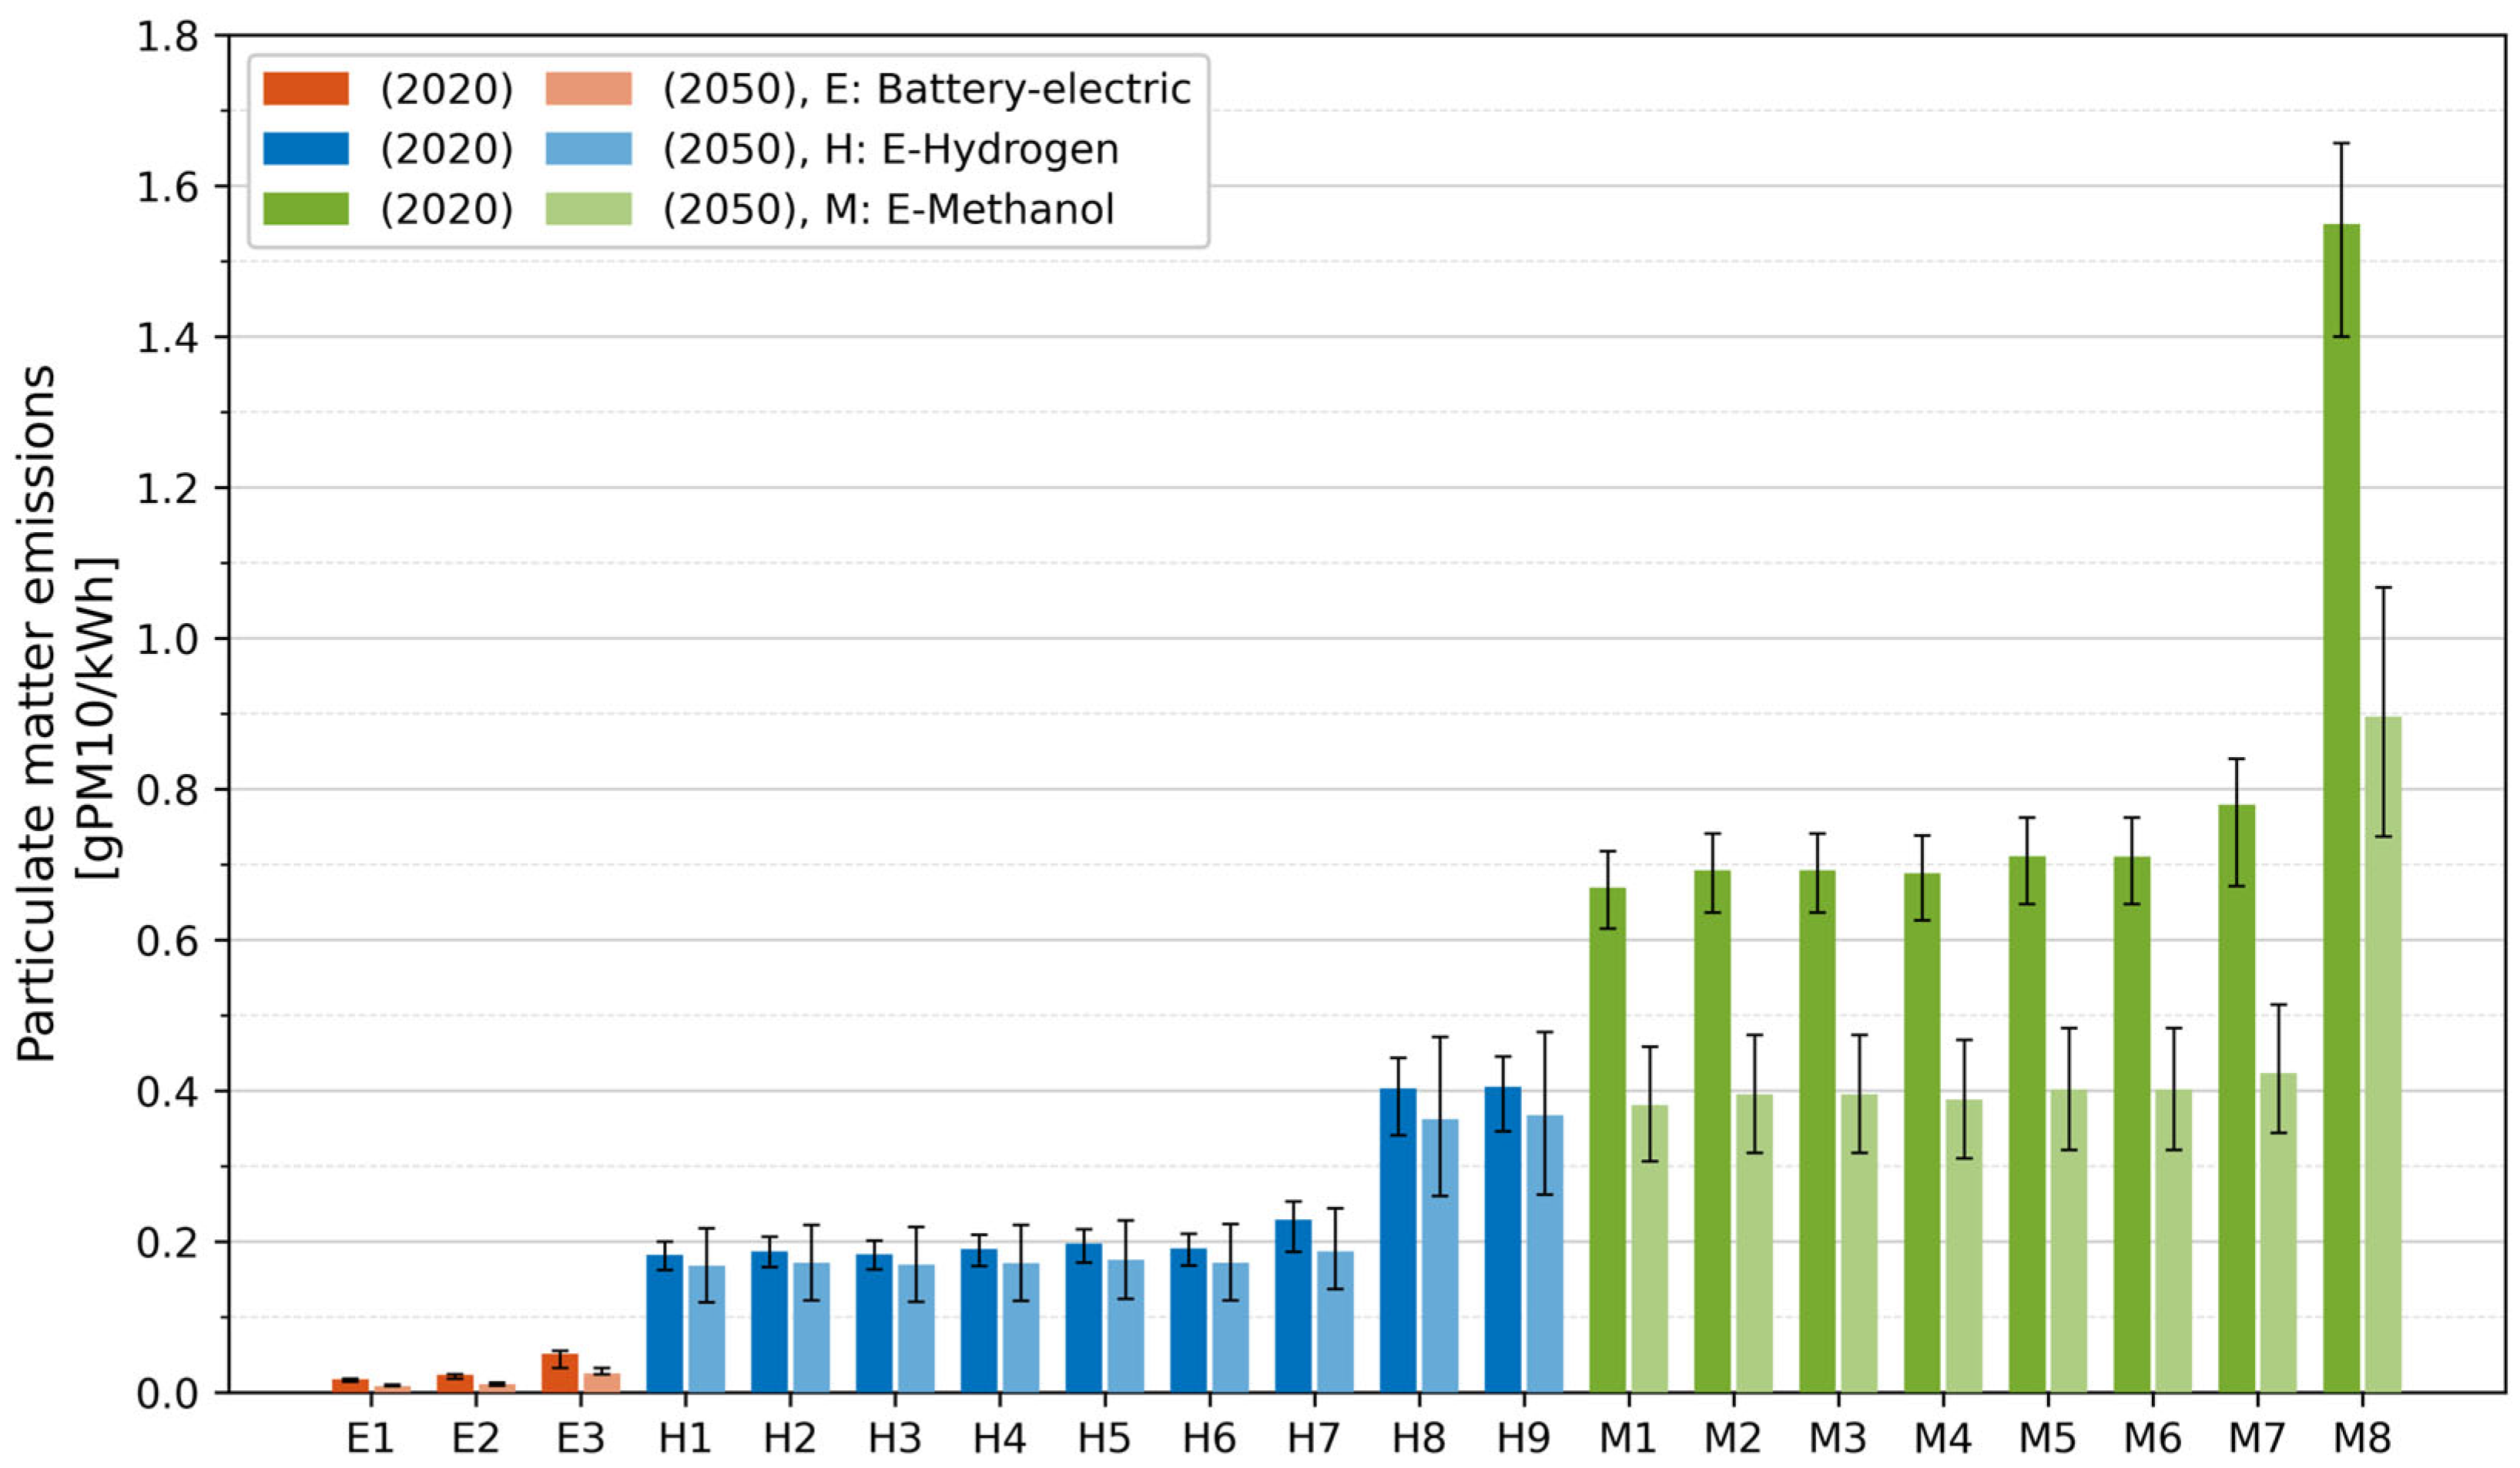
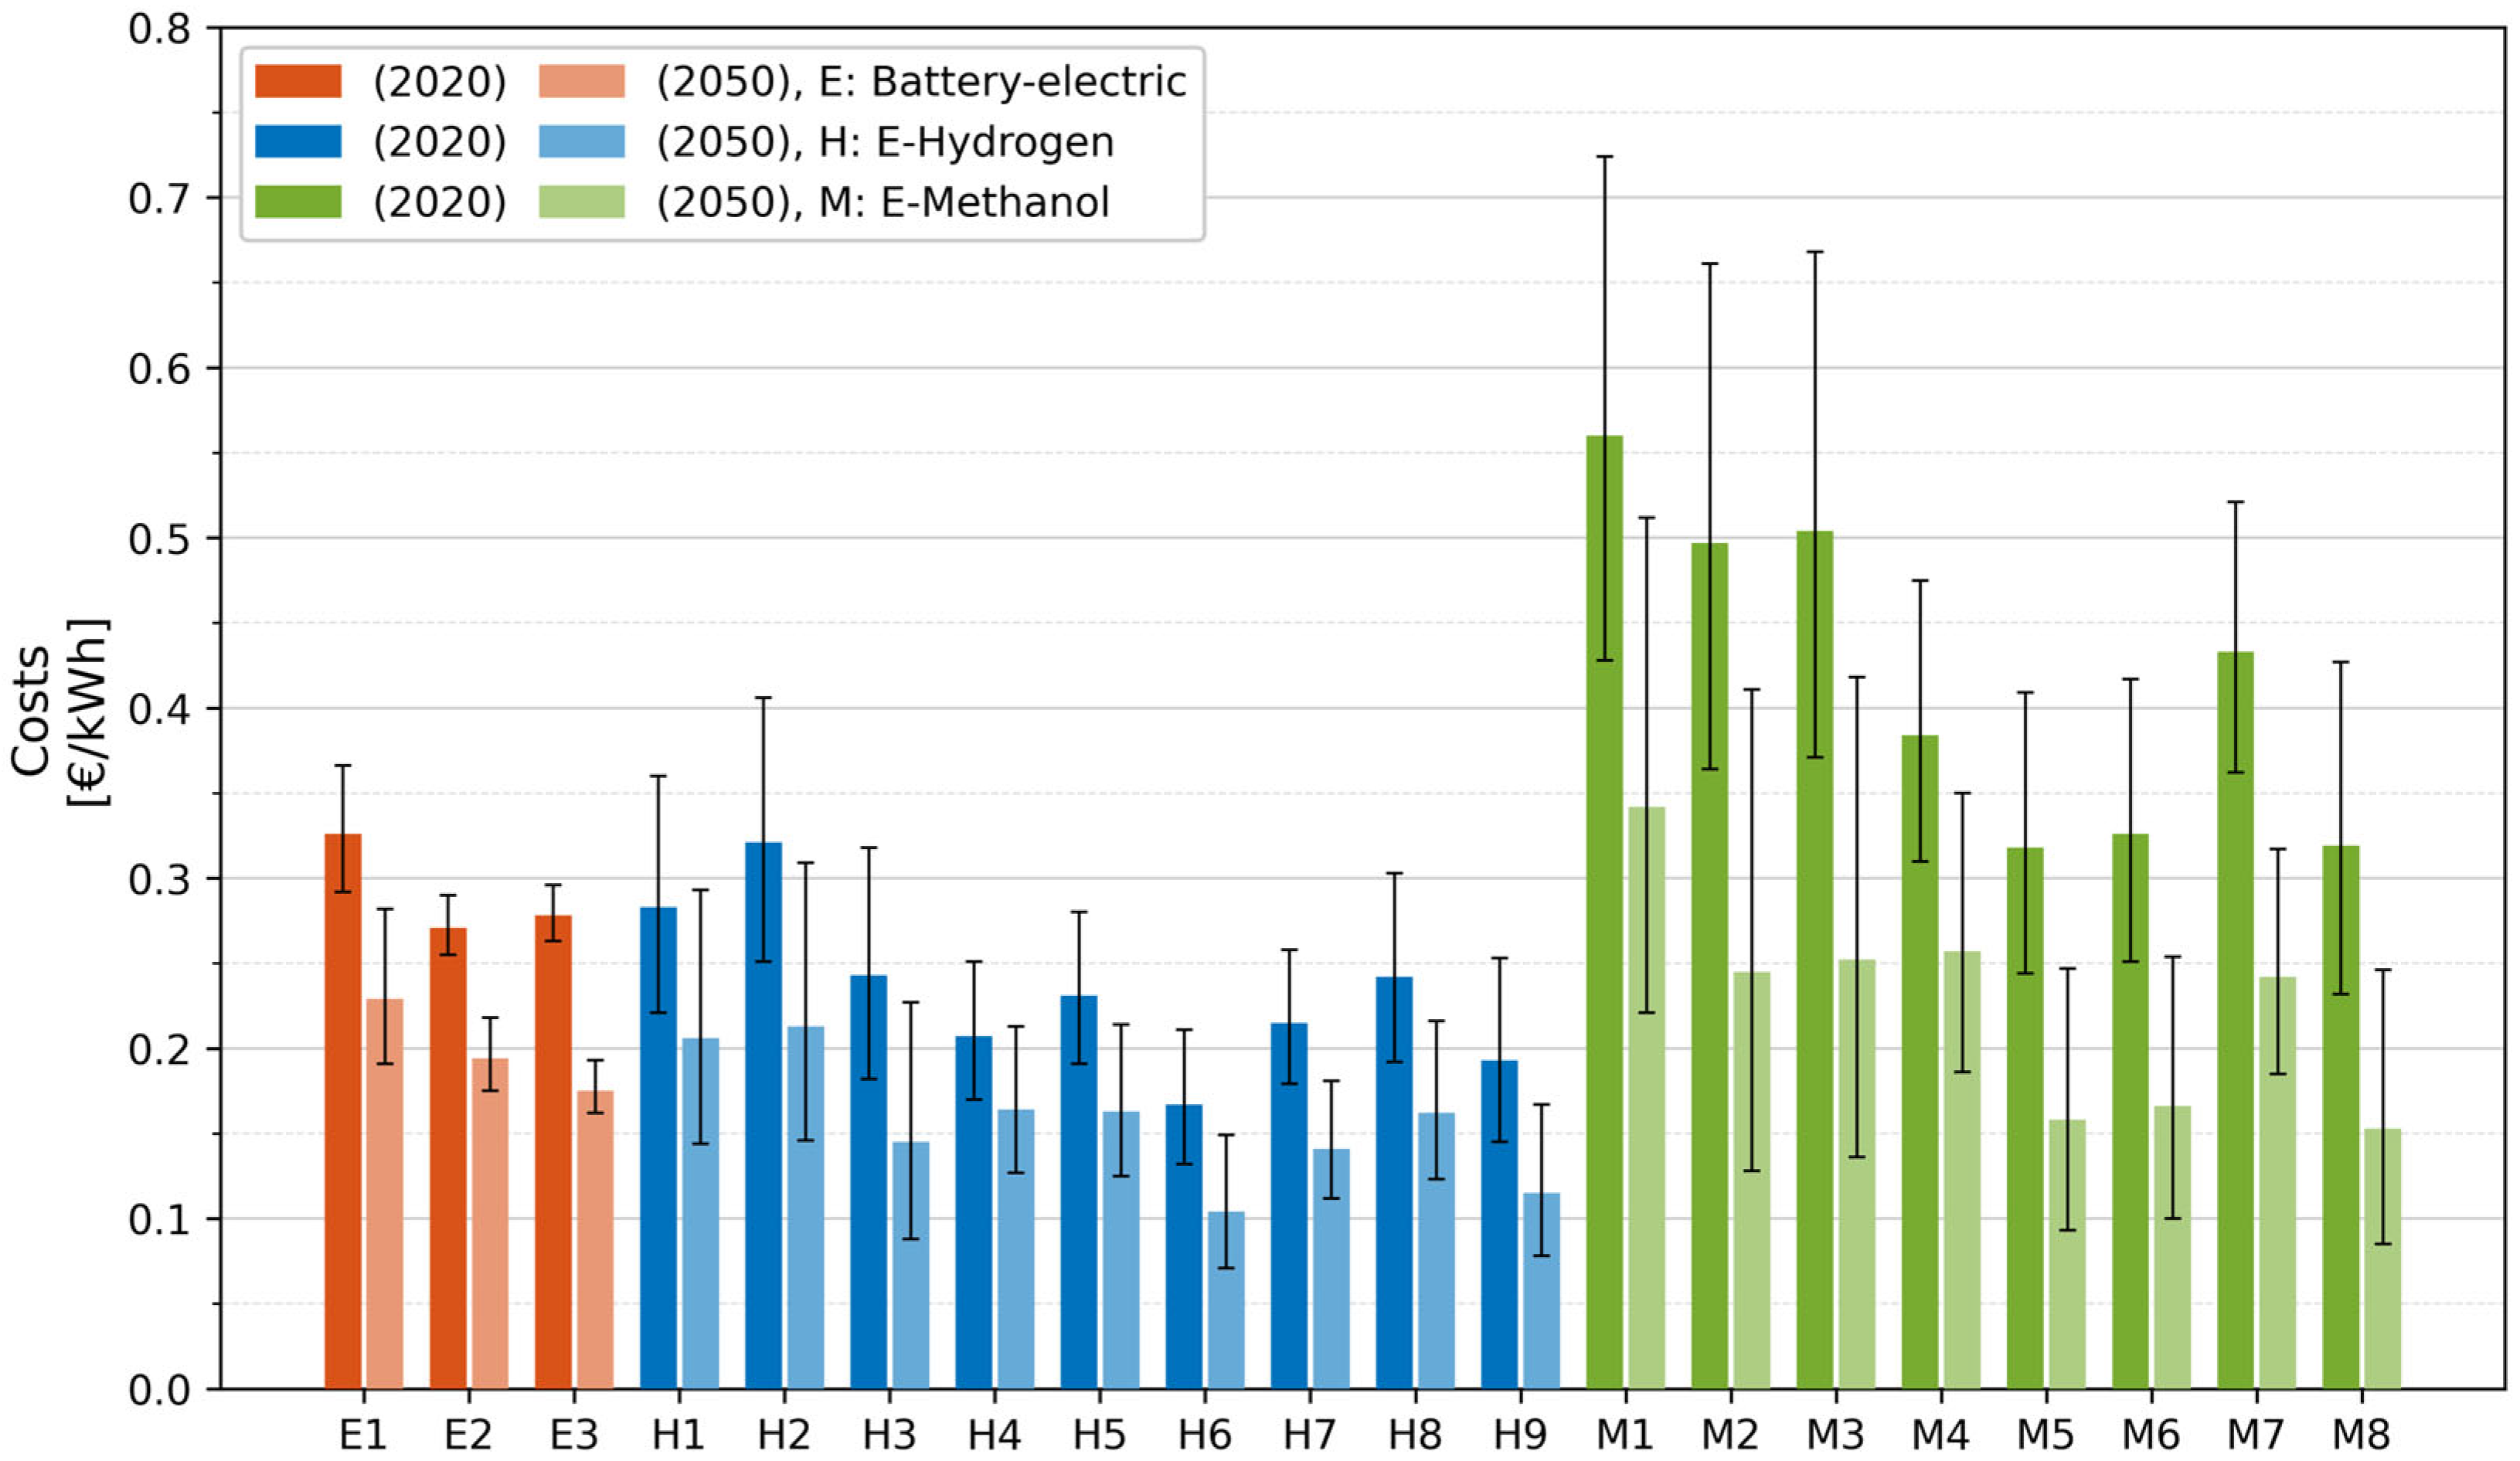
| Energy Source | Main Decentralized Process Step Options | Energy Carrier and Mode of Transport | Main Centralized Process Step Options |
|---|---|---|---|
| Offshore wind Onshore wind Photovoltaics | Electrolysis (including water treatment) Methanol synthesis (including direct air capture) | Electricity: grid Hydrogen: vessel or pipeline Methanol: vessel or lorry | Electrolysis Methanol synthesis Onshore storage Fueling/charging |
| Diesel-ICE | Electrification | H2-FC | CH3OH-ICE | ||
|---|---|---|---|---|---|
| Specific technology | Diesel-ICE, high speed | Li-NMC battery-electric | H2 300 bar LT-PEM FC | 4-stroke, high speed, single fuel | 4-stroke, high speed, dual fuel |
| GWP [gCO2e/kWh] | 584 a 695 b | No emissions | No emissions | Net zero | 263 |
| NOx [gNOx/kWh] | 10.48 a 8.13 c 9.63 d | No emissions | No emissions | 1.53 | 1.53 |
| PM [gPM10/kWh] | 0.426 a 0.41 c 0.51 d | No emissions | No emissions | 0.04 | 0.04 |
| Diesel-ICE | Electrification | H2-FC | CH3OH-ICE | ||
|---|---|---|---|---|---|
| Specific technology | Diesel-ICE, high speed | Li-NMC battery-electric | H2 300 bar LT-PEM FC | 4-stroke, high speed, single fuel | 4-stroke, high speed, dual fuel |
| GWP [gCO2e/kWh] | 584 a 695 b | No emissions | No emissions | Net zero | 263 |
| NOx [gNOx/kWh] | 10.48 a 1.8 c 1.8 d | No emissions | No emissions | 1.53 | 1.53 |
| PM [gPM10/kWh] | 0.426 a 0.015 c 0.015 d | No emissions | No emissions | 0.04 | 0.04 |
| Diesel-ICE | Electrification | H2-FC | CH3OH-ICE | ||
|---|---|---|---|---|---|
| Specific technology | Diesel-ICE, high speed | Li-NMC battery-electric | H2 300 bar LT-PEM FC | 4-stroke, high speed, single fuel | 4-stroke, high speed, dual fuel |
| Efficiency of the propulsion system | 44% a 38% b | 90% | 43% | 38% | 35% |
| Energy storage per unit energy stored [EUR/kWh] | 0.11 | 500 | 24 | 0.18 | 0.17 |
| Power system per unit of maximum power required [EUR/kW] | 800 | 1300 | 3173 | 1077 | 1313 |
| Energy per unit of shaft/auxiliary energy [EUR/kWh] | 0.16 a 0.26 b | 0.30–0.37 | 0.40–0.74 | 0.84–1.47 | 0.66–1.09 |
| Diesel-ICE | Electrification | H2-FC | CH3OH-ICE | ||
|---|---|---|---|---|---|
| Specific technology | Diesel-ICE high speed | Li-NMC battery-electric | H2 300 bar LT-PEM FC | 4-stroke, high speed, single fuel | 4-stroke, high speed, dual fuel |
| Efficiency of the propulsion system | 44% a 38% b | 90% | 43% | 38% | 35% |
| Energy storage per unit energy stored [EUR/kWh] | 0.11 | 500 | 24 | 0.18 | 0.17 |
| Power system per unit of maximum power required [EUR/kW] | 800 | 1170 | 2856 | 969 | 1182 |
| Energy per unit of shaft/auxiliary energy [EUR/kWh] | 0.16 a 0.34 b | 0.19–0.25 | 0.24–0.5 | 0.4–0.9 | 0.34–0.69 |
| Main Engine Power [kW] | Number of Vessels | Average Main Engine Power [kW] | Annual Energy Demand per Vessel [kWh] |
|---|---|---|---|
| <1000 | 250 | 713 | 5,133,600 |
| 1000–1999 | 313 | 1634 | 11,764,800 |
| 2000–2999 | 151 | 2452 | 17,654,400 |
| Emissions | 2020 | 2050 | |||
|---|---|---|---|---|---|
| Well-to-Wake | Tank-to-Wake | Well-to-Wake | Tank-to-Wake | ||
| CO2e | [t] | [187,491; 664,813] | 0 | [93,902; 332,688] | 0 |
| NOx | [t] | [399; 905] | 0 | [194; 445] | 0 |
| PM | [t] | [133; 399] | 0 | [56; 187] | 0 |
| CO2e | [%] | [−88; −97] | −100 | [−94; −98] | −100 |
| NOx | [%] | [−99; −100] | −100 | −100 | −100 |
| PM | [%] | [−98; −99] | −100 | [−99; −100] | −100 |
| Total Cost | 2020 | 2050 | |
|---|---|---|---|
| TC | [mil. EUR] | [48,426; 57,654] | [35,233; 41,150] |
| TC | [%] | [+91; +128] | [+39; +62] |
| Main Engine Power [kW] | Number of Vessels | Average Main Engine Power [kW] | Annual Energy Demand per Vessel [kWh] |
|---|---|---|---|
| 100–750 | 2207 | 500 | 203,727 |
| Emissions | 2020 | 2050 | |||
|---|---|---|---|---|---|
| Well-to-Wake | Tank-to-Wake | Well-to-Wake | Tank-to-Wake | ||
| CO2e | [t] | [11,057; 39,174] | 0 | [5518; 19,598] | 0 |
| NOx | [t] | [22.1; 53] | 0 | [11; 26.5] | 0 |
| PM | [t] | [6.6; 22.1] | 0 | [4.4; 11] | 0 |
| CO2e | [%] | [−90; −97] | −100 | [−95; −99] | −100 |
| NOx | [%] | [−99; −100] | −100 | −100 | −100 |
| PM | [%] | [−98; −99] | −100 | −99 | −100 |
| Total Cost | 2020 | 2050 | |
|---|---|---|---|
| TC | [mil. EUR] | [4418; 4893] | [3224; 3765] |
| TC | [%] | [+37; +52] | [−18; −4] |
| Main Engine Power [kW] | Number of Vessels | Average Main Engine Power [kW] | Annual Energy Demand per Vessel [kWh] |
|---|---|---|---|
| 1118–1617 | 610 | 1742 | 1,278,955 |
| Emissions | 2020 | 2050 | |||
|---|---|---|---|---|---|
| Well-to-Wake | Tank-to-Wake | Well-to-Wake | Tank-to-Wake | ||
| CO2e | [t] | [15,366; 90,024] | 0 | [6978; 40,467] | 0 |
| NOx | [t] | [48; 145] | 0 | [27; 81] | 0 |
| PM | [t] | [142; 315] | 0 | [131; 286] | 0 |
| CO2e | [%] | [−87; −98] | −100 | [−93; −99] | −100 |
| NOx | [%] | [−99; −100] | −100 | [−99; −100] | −100 |
| PM | [%] | [−83; −92] | −100 | [−81; −91] | −100 |
| Toatl Cost | 2020 | 2050 | |
|---|---|---|---|
| TC | [mil. EUR] | [9546; 15,106] | [6992; 10,864] |
| TC | [%] | [+94; +208] | [+12; +76] |
| Gross Tonnage [GT] | Number of Vessels | Average Main Engine Power [kW] | Annual Energy Demand per Vessel [kWh] |
|---|---|---|---|
| <2000 | 8 | 3452 | 6,908,301 |
| 2000–3000 | 8 | 4594 | 9,194,509 |
| 3000–4000 | 48 | 6444 | 12,897,748 |
| 4000–5000 | 95 | 7206 | 14,423,956 |
| Emissions | 2020 | 2050 | ||||
|---|---|---|---|---|---|---|
| Well-to-Wake | Tank-to-Wake | Well-to-Wake | Tank-to-Wake | |||
| CO2e | Single-fuel engine | [t] | [224,424; 800,938] | 0 | [91,338; 337,319] | 0 |
| NOx | [t] | [3567; 4216] | 3243 | [3421; 3831] | 3243 | |
| PM | [t] | [1497; 3364] | 87 | [893; 1984] | 87 | |
| CO2e | Single-fuel engine | [%] | [−49; −86] | −100 | [−78; −94] | −100 |
| NOx | [%] | [−91; −92] | −85 | −92 | −85 | |
| PM | [%] | [−33; −70] | −90 | [−61; −82] | −90 | |
| CO2e | Dual-fuel engine | [t] | [781,550; 1,357,969] | 557,126 | [648,512; 894,350] | 557,126 |
| NOx | [t] | [3567; 4216] | 3243 | [3421; 3831] | 3243 | |
| PM | [t] | [1497; 3364] | 87 | [893; 1984] | 87 | |
| CO2e | Dual-fuel engine | [%] | [−13; −50] | −55 | [−43; −58] | −55 |
| NOx | [%] | [−91; −92] | −86 | −92 | −86 | |
| PM | [%] | [−33; −70] | −91 | [−61; −82] | −91 | |
| Total Cost | 2020 | 2050 | |
|---|---|---|---|
| TC—single-fuel engine | [mil. EUR] | [36,723; 63,613] | [18,066; 39,151] |
| TC—single-fuel engine | [%] | [+381; +733] | [+136; +411] |
| TC—dual-fuel engine | [mil. EUR] | [28,877; 47,854] | [15,661; 30,541] |
| TC—dual-fuel engine | [%] | [+278; +527] | [+104; +299] |
| Fleet Segment | Average TCmin per Vessel [mil. EUR] | Average TCmax per Vessel [mil. EUR] | Average TCmin per Vessel [mil. EUR] | Average TCmax per Vessel [mil. EUR] |
|---|---|---|---|---|
| 2020 | 2020 | 2050 | 2050 | |
| Coastal ferries | 67.8 | 80.7 | 49.3 | 57.6 |
| Inland day-trip and small cabin vessels | 2.2 | 2.2 | 1.5 | 1.7 |
| Inland dry cargo vessels, L ≥ 110 m | 15.6 | 24.7 | 11.5 | 17.8 |
| Offshore supply vessels—single-fuel engine | 231 | 400.1 | 113.6 | 246.2 |
| Offshore supply vessels—dual-fuel engine | 181.6 | 301 | 98.5 | 192.1 |
| Fleet Segment | ΔTCmin per Vessel [mil. EUR] | ΔTCmax per Vessel [mil. EUR] | ΔTCmin per Vessel [mil. EUR] | ΔTCmax per Vessel [mil. EUR] |
|---|---|---|---|---|
| 2020 | 2020 | 2050 | 2050 | |
| Coastal ferries | 55.4 | 68.3 | 36.9 | 45.2 |
| Inland day-trip and small cabin vessels | 0.5 | 0.8 | −0.3 | −0.08 |
| Inland dry cargo vessels, L ≥ 110 m | 7.6 | 16.7 | 1.3 | 7.7 |
| Offshore supply vessels—single-fuel engine | 183 | 352.1 | 65.4 | 198.1 |
| Offshore supply vessels—dual-fuel engine | 133.6 | 253 | 50.3 | 143.9 |
| Fleet Segment | CO2e Abated [mil. t] | CO2e Abated per Vessel [t] | CO2e Abated [mil. t] | CO2e Abated per Vessel [t] |
|---|---|---|---|---|
| 2020 | 2020 | 2050 | 2050 | |
| Coastal ferries | [3.889; 4.366] | [5447; 6115] | [4.221; 4.460] | [5912; 6246] |
| Inland day-trip and small cabin vessels | [0.276; 0.304] | [125; 138] | [0.295; 0.309] | [134; 140] |
| Inland dry cargo vessels, L ≥ 110 m | [0.457; 0.531] | [749; 841] | [0.506; 0.540] | [830; 885] |
| Offshore supply vessels—single-fuel engine | [0.462; 1.040] | [2912; 6538] | [0.926; 1.173] | [5828; 7375] |
| Offshore supply vessels—dual-fuel engine | [−0.094; 0.482] | [−591; 3034] | [0.370; 0.615] | [2324; 3871] |
| Fleet Segment | Minimum CCO2eabated [EUR/t] | Maximum CCO2eabated [EUR/t] | Minimum CCO2eabated [EUR/t] | Maximum CCO2eabated [EUR/t] |
|---|---|---|---|---|
| 2020 | 2020 | 2050 | 2050 | |
| Coastal ferries | 5384 | 7412 | 1561 | 3535 |
| Inland day-trip and small cabin vessels | 3757 | 5494 | −2431 | −576 |
| Inland dry cargo vessels, L ≥ 110 m | 8890 | 19,278 | 1430 | 8745 |
| Offshore supply vessels—single-fuel engine | 53,853 | 120,901 | 9657 | 26,858 |
| Offshore supply vessels—dual-fuel engine | 51,587 | 605,704 | 13,476 | 37,179 |
| Seagoing Ships | Inland Vessels | |||||
|---|---|---|---|---|---|---|
| 2025–2029 | 2030–2034 | 2035–2039 | 2040–2044 | 2045–2049 | 2050 | |
| GHG emissions [gCO2e/MJ] | 76.4 | 61.1 | 45.8 | 30.6 | 15.3 | 0.0 |
| Emission reduction compared to fossil diesel | −20% | −36% | −52% | −68% | −84% | −100% |
Disclaimer/Publisher’s Note: The statements, opinions and data contained in all publications are solely those of the individual author(s) and contributor(s) and not of MDPI and/or the editor(s). MDPI and/or the editor(s) disclaim responsibility for any injury to people or property resulting from any ideas, methods, instructions or products referred to in the content. |
© 2025 by the authors. Licensee MDPI, Basel, Switzerland. This article is an open access article distributed under the terms and conditions of the Creative Commons Attribution (CC BY) license (https://creativecommons.org/licenses/by/4.0/).
Share and Cite
Bačkalov, I.; Dahlke-Wallat, F.; Frank, E.; Friedhoff, B.; Grasman, A.; Jasa, J.; Kreukniet, N.; Quispel, M.; Thalmann, F. Greening of Inland and Coastal Ships in Europe by Means of Retrofitting: State of the Art and Scenarios. Sustainability 2025, 17, 5154. https://doi.org/10.3390/su17115154
Bačkalov I, Dahlke-Wallat F, Frank E, Friedhoff B, Grasman A, Jasa J, Kreukniet N, Quispel M, Thalmann F. Greening of Inland and Coastal Ships in Europe by Means of Retrofitting: State of the Art and Scenarios. Sustainability. 2025; 17(11):5154. https://doi.org/10.3390/su17115154
Chicago/Turabian StyleBačkalov, Igor, Friederike Dahlke-Wallat, Elimar Frank, Benjamin Friedhoff, Alex Grasman, Justin Jasa, Niels Kreukniet, Martin Quispel, and Florin Thalmann. 2025. "Greening of Inland and Coastal Ships in Europe by Means of Retrofitting: State of the Art and Scenarios" Sustainability 17, no. 11: 5154. https://doi.org/10.3390/su17115154
APA StyleBačkalov, I., Dahlke-Wallat, F., Frank, E., Friedhoff, B., Grasman, A., Jasa, J., Kreukniet, N., Quispel, M., & Thalmann, F. (2025). Greening of Inland and Coastal Ships in Europe by Means of Retrofitting: State of the Art and Scenarios. Sustainability, 17(11), 5154. https://doi.org/10.3390/su17115154


