Article

Greening of Inland and Coastal Ships in Europe by Means of Retrofitting: State of the Art and Scenarios

by
Igor Bačkalov
1,*,
Friederike Dahlke-Wallat
1,
Elimar Frank
2,
Benjamin Friedhoff
1,
Alex Grasman
3,
Justin Jasa
1,
Niels Kreukniet
4,
Martin Quispel
4 and
Florin Thalmann
2
1
Development Centre for Ship Technology and Transport Systems (DST e. V.), 47057 Duisburg, Germany
2
WERZ Institut für Wissen Energie und Rohstoffe Zug, OST—Ostschweizer Fachhochschule, 6300 Zug, Switzerland
3
MARIN (Maritime Research Institute Netherlands), 6708 PM Wageningen, The Netherlands
4
Stichting Projecten Binnenvaart (SPB)/Expertise and Innovation Centre Barging (EICB), 3331 MC Zwijndrecht, The Netherlands
*
Author to whom correspondence should be addressed.
Sustainability 2025, 17(11), 5154; https://doi.org/10.3390/su17115154
Submission received: 30 March 2025 / Revised: 28 May 2025 / Accepted: 30 May 2025 / Published: 4 June 2025

Abstract

:
This paper analyzes the potential of retrofitting in “greening” of European inland vessels and coastal ships, which are normally not the focus of major international environmental policies aimed at waterborne transport. Therefore, greening of the examined fleets would result, for the most part, in additional emission reductions to the environmental targets put forth by the International Maritime Organization. By scoping past and ongoing pilot projects, the most prominent retrofit trends in the greening of inland and coastal ships are identified. Assuming a scenario in which the observed trends are scaled up to the fleet level, the possible emission abatement is estimated (both on the tank-to-wake and well-to-wake bases), as well as the capital and operational costs associated with the retrofit. Therefore, the paper shows what can be achieved in terms of greening if the current trends are followed. The results show that the term “greening” may take a significantly different meaning contingent on the approaches, perspectives, and targets considered. The total costs of a retrofit of a single vessel may be excessively high; however, the costs may significantly vary depending on the vessel power requirements, operational profile, and technology applied. While some trends are worth following (electrification of ferries and small inland passenger ships), others may be too cost-intensive and not satisfactorily efficient in terms of emissions reduction (retrofit of offshore supply vessels with dual-fuel methanol engines). Nevertheless, the assessment of different retrofit technologies strongly depends on the adopted criteria, including but not limited to the total cost of the retrofit of the entire fleet segment, cost of the retrofit of a single vessel, emission abatement achieved by the retrofit of a fleet segment, average emission abatement per retrofitted vessel, and cost of abatement of one ton of greenhouse gases, etc.

1. Introduction

Improvement of environmental performance (i.e., “greening”) of ships emerged on the agenda of the then Inter-Governmental Maritime Consultative Organization (which was renamed to the International Maritime Organization in 1982) in the 1950s. However, at that time, the goals of such an improvement were envisioned rather differently than today and primarily concerned intentional and (later) unintentional release of oil and oily water from ships into the sea. Over the decades, the scope has been expanded to include the adverse effects of discharge of noxious and harmful substances carried as cargo, and disposal of sewage and garbage from ships, on the marine environment. The air pollution from ships was addressed only in the 1990s, when the use of ozone-depleting substances (such as halons) in ship systems was either restricted or prohibited, and the contents of nitrogen and sulfur oxides in exhaust gases of marine engines were limited. Since then, significant progress has been made; in addition to the aforementioned sources of pollution, the contemporary international maritime regulatory framework, primarily embodied by the International Convention for the Prevention of Pollution from Ships (hereinafter MARPOL Convention), see [1], includes a range of measures aimed at improvement of the energy efficiency of new and existing ships, and restricts the carbon intensity of shipping (a well-documented evolution of the regulatory efforts aimed at decarbonization may be found in [2]).
The historical process described shows that the idea of greening ships has considerably evolved over time, by gradually including pollution which originates from both routine operations and accidents, by expanding the scope from sea to air, by considering both the existing and the future fleet, and by accounting for both the immediate and the long-term negative effects on the environment (for the evolution of the MARPOL Convention, see [3]). The perspective could be broadened even further, e.g., from the ship-life-cycle point of view, to include the environmental impacts of production and/or dismantling of ships, or from the point of view of energy sourcing, to include the environmental effects of energy production, etc. This indicates that the concept of greening may be differently defined and understood and that it may address different phases of ship life, different fleet segments, and different environmental impacts. Moreover, depending on the adopted view of greening, the achieved mitigation of negative environmental effects of shipping may strongly vary.
Further complexities arise when individual segments of shipping are considered. Currently, the regulations of the MARPOL Convention relevant for decarbonization and reductions in air pollutant emissions cover most of the fleet. However, a number of ship categories (such as fishing vessels and passenger ships providing service to islands below 200,000 inhabitants) and ship sizes (e.g., ships of gross tonnage below 5000 GT) are still excluded from major policies and regulations targeting carbon intensity of shipping or are subject to specific national or regional environmental protection rules. Furthermore, the MARPOL Convention obviously does not comprise inland vessels and neither does the European Union Emissions Trading System (EU ETS). The regulatory and policy landscape in inland navigation is much more fragmented than in maritime shipping. It is, however, clear that both inland vessels and smaller seagoing ships (such as ferries and offshore supply vessels) play an important role in transport of people and goods, as well as in energy supply and resilience.
Therefore, this paper focuses on a specific aspect of greening, which entails reductions in emissions of greenhouse gases and air pollutants caused by existing inland vessels and coastal ships. The intended reduction is to be achieved by means of retrofitting, that is, by substituting the conventional drivetrains and fuels with novel energy converters and energy carriers, and by lowering the ship power demand utilizing various measures aimed at improvement of ship energy efficiency.
The paper is structured as follows. The greening trends in retrofitting are identified in Section 2, based on an analysis of the past and ongoing greening pilots in inland and coastal shipping in Europe. Three innovative greening technologies are selected for further investigation of energy supply pathways (i.e., modeling of “well-to-tank” costs and emissions scenarios), presented in Section 3, and energy demand (i.e., modeling of onboard energy consumption and associated “tank-to-wake” costs and emissions scenarios), presented in Section 4. The selected greening technologies are subsequently paired with those inland and coastal ship types which have most commonly been the subject of retrofitting so far; an assessment of the impacts of the analyzed greening retrofit when scaled up to the fleet level is given in Section 5. To understand the obstacles to scaling up of greening, as well as the opportunities in terms of supportive legal and financial instruments, the regulatory and policy landscape is studied and presented in Section 6. The paper concludes with an assessment of the possible environmental gains which can be achieved when the examined greening practices are scaled up from pilot projects to entire fleet segments.

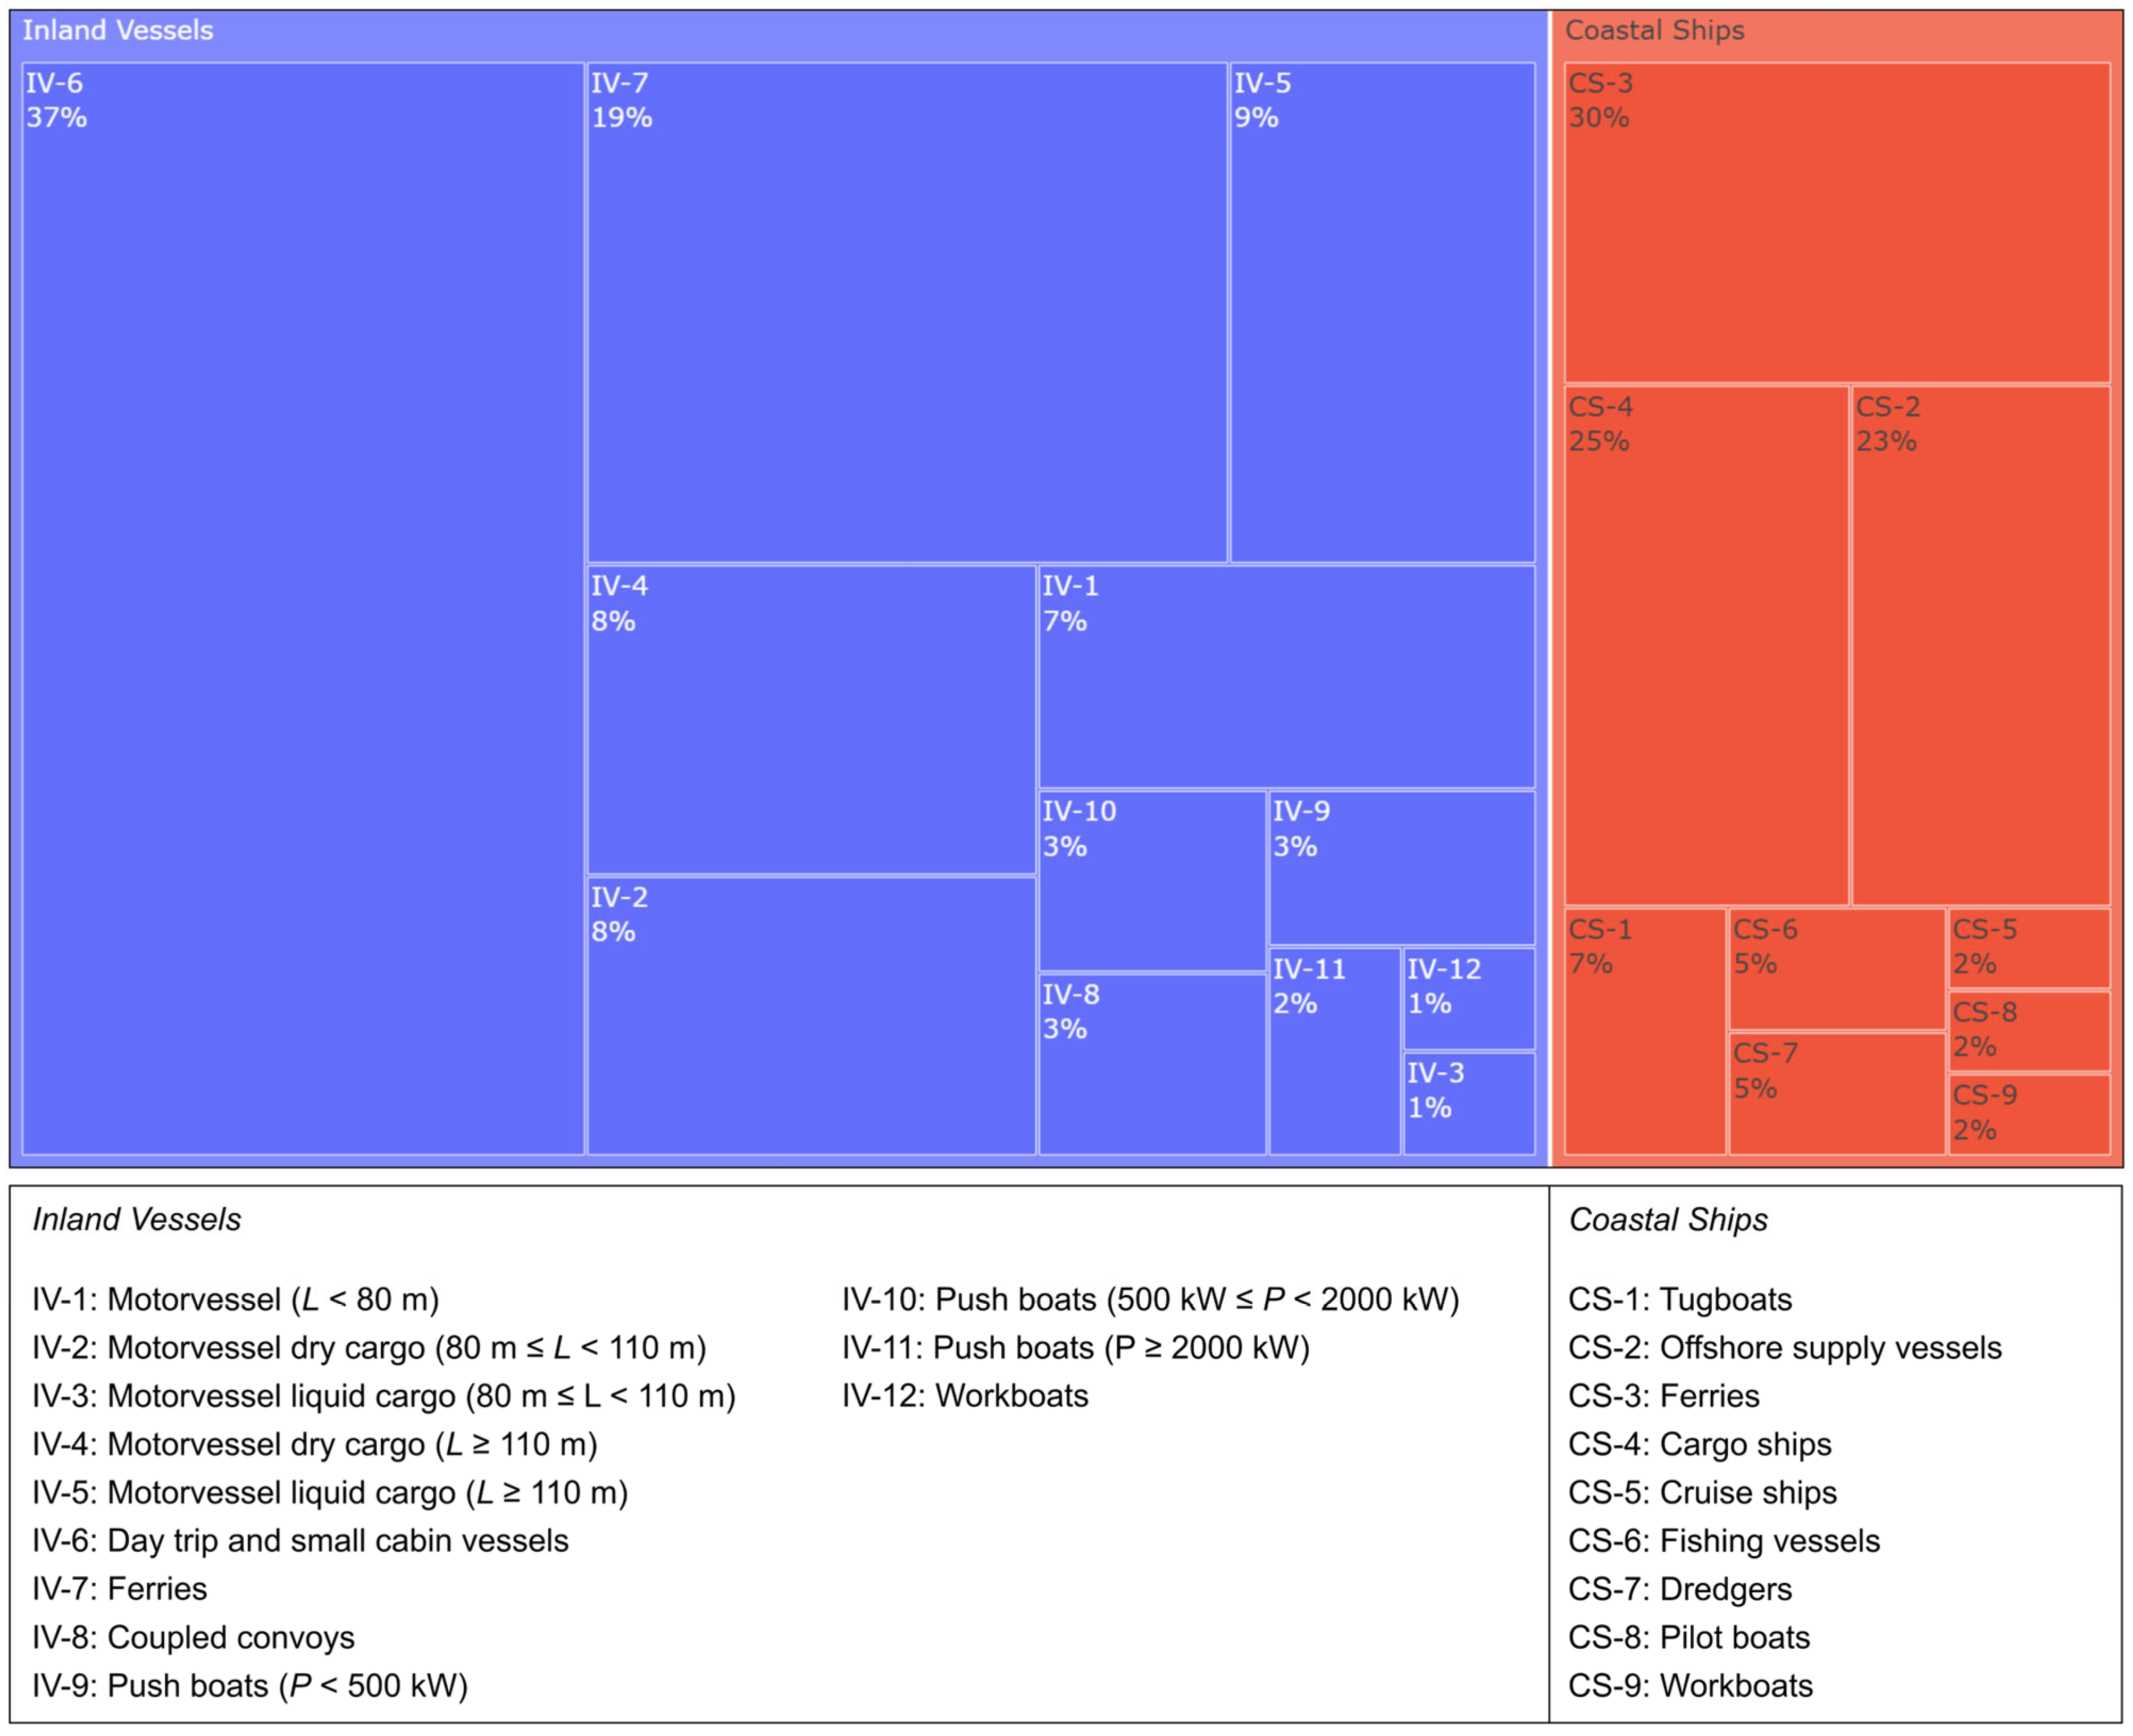
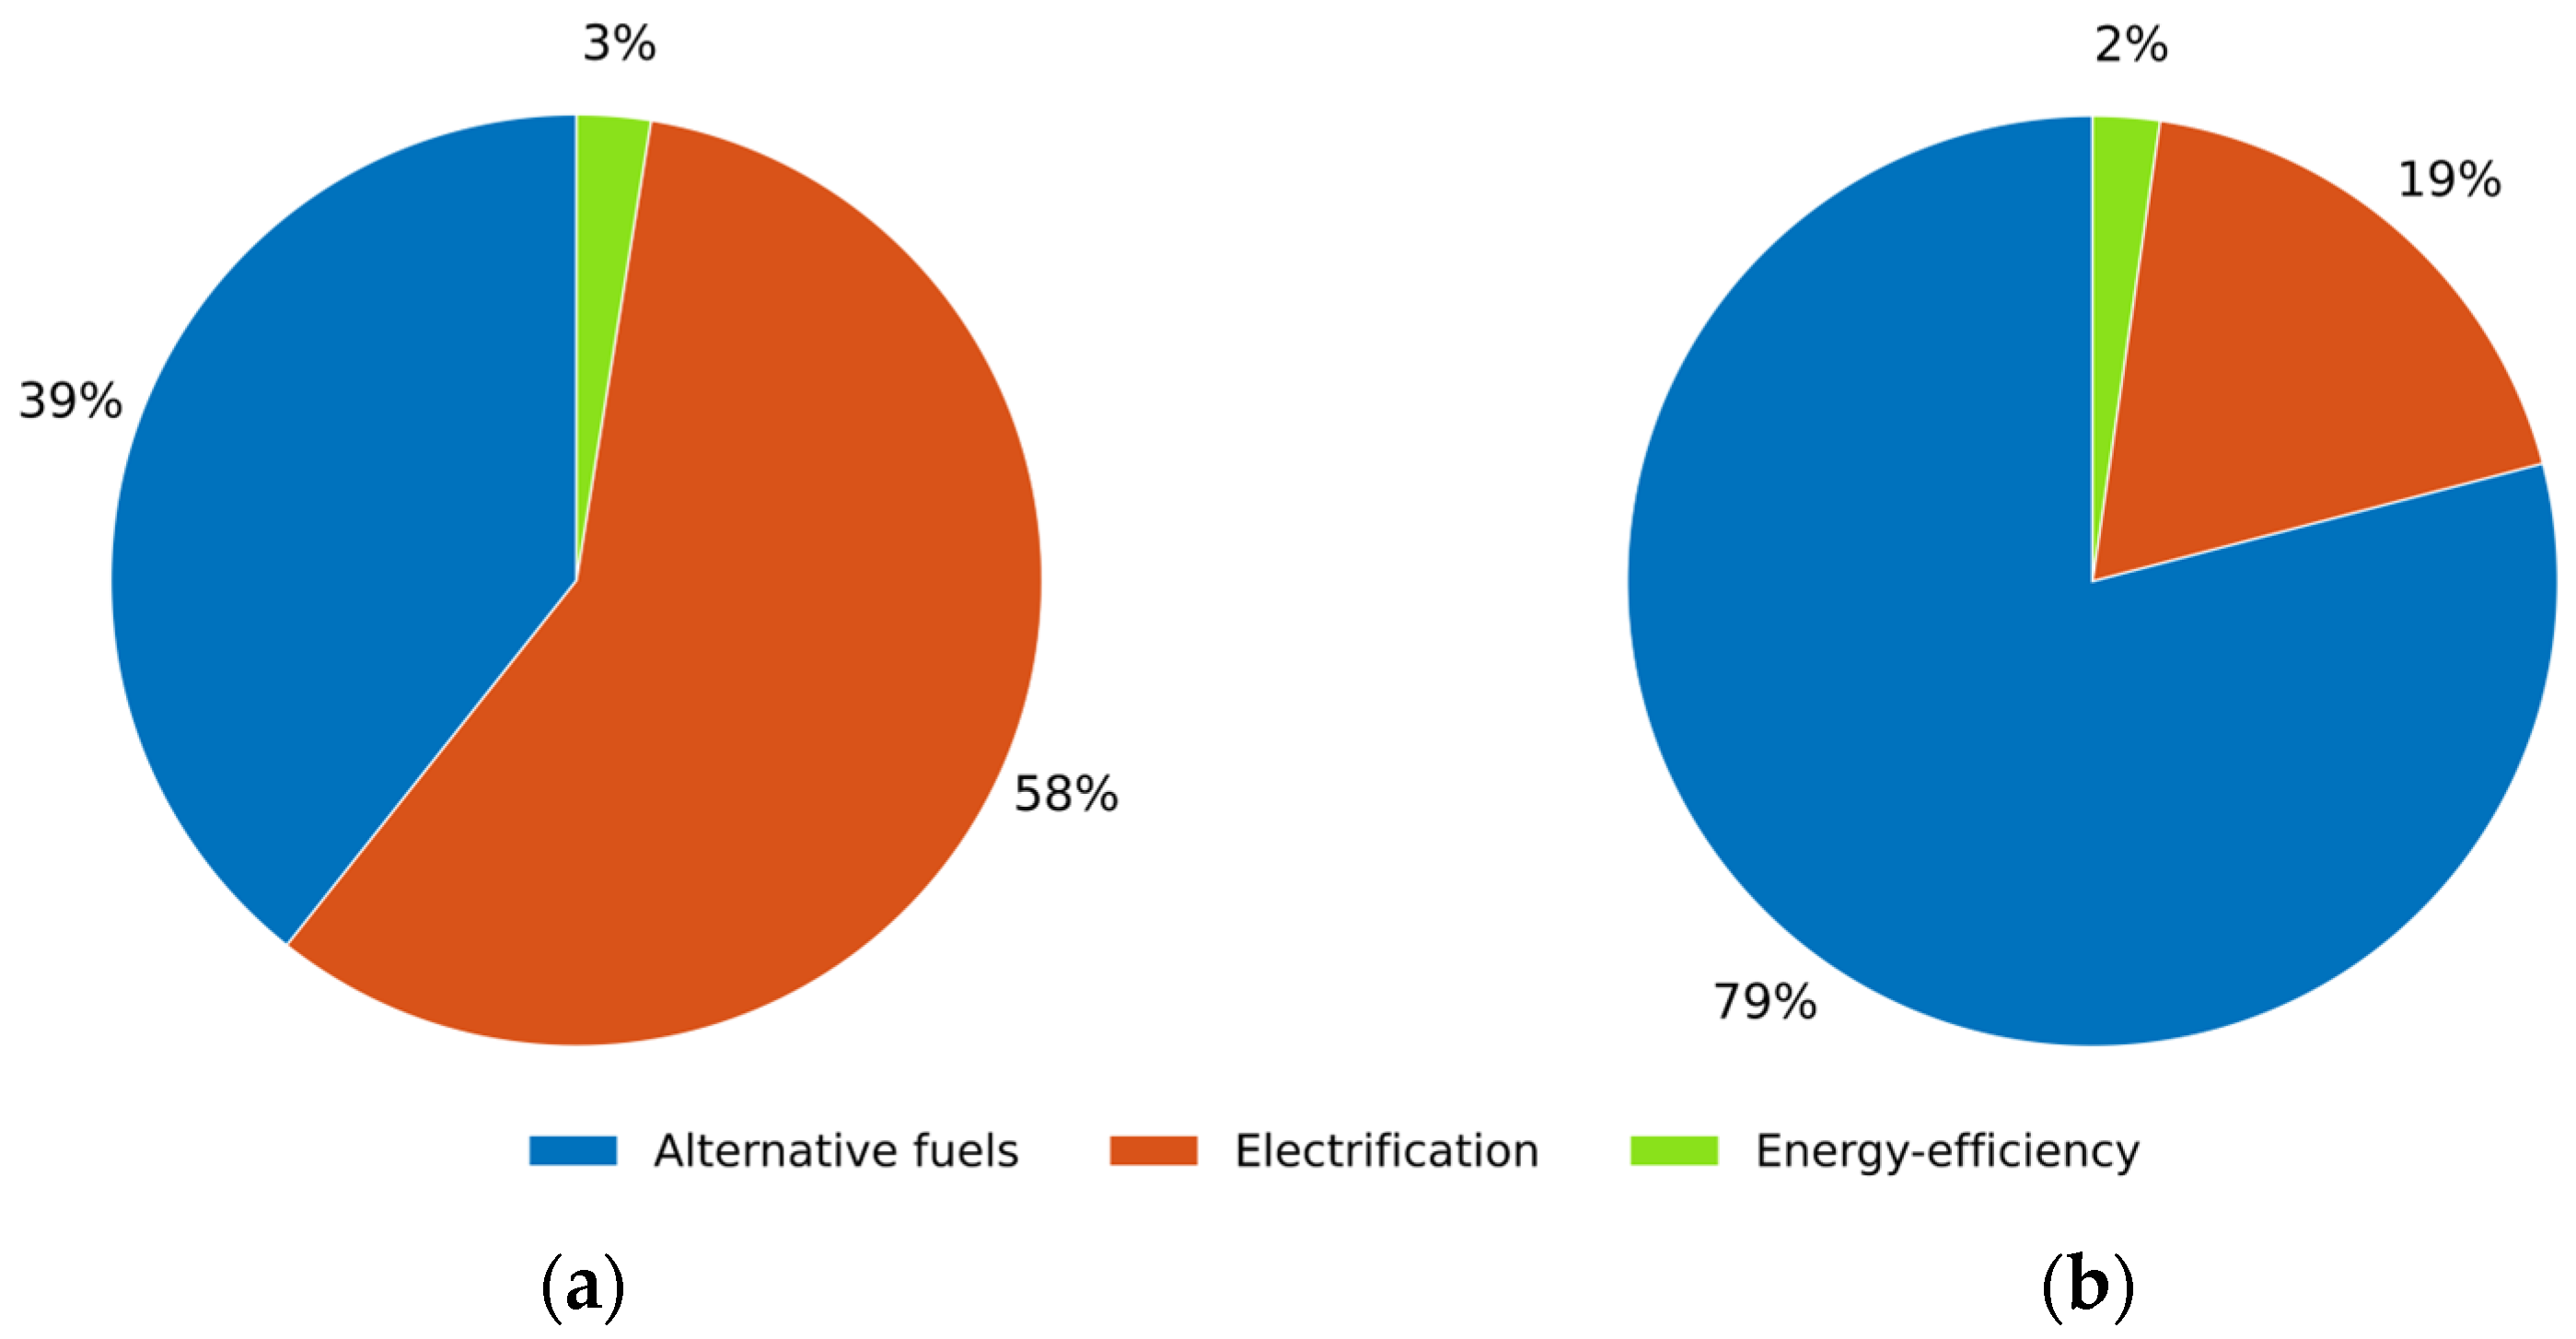
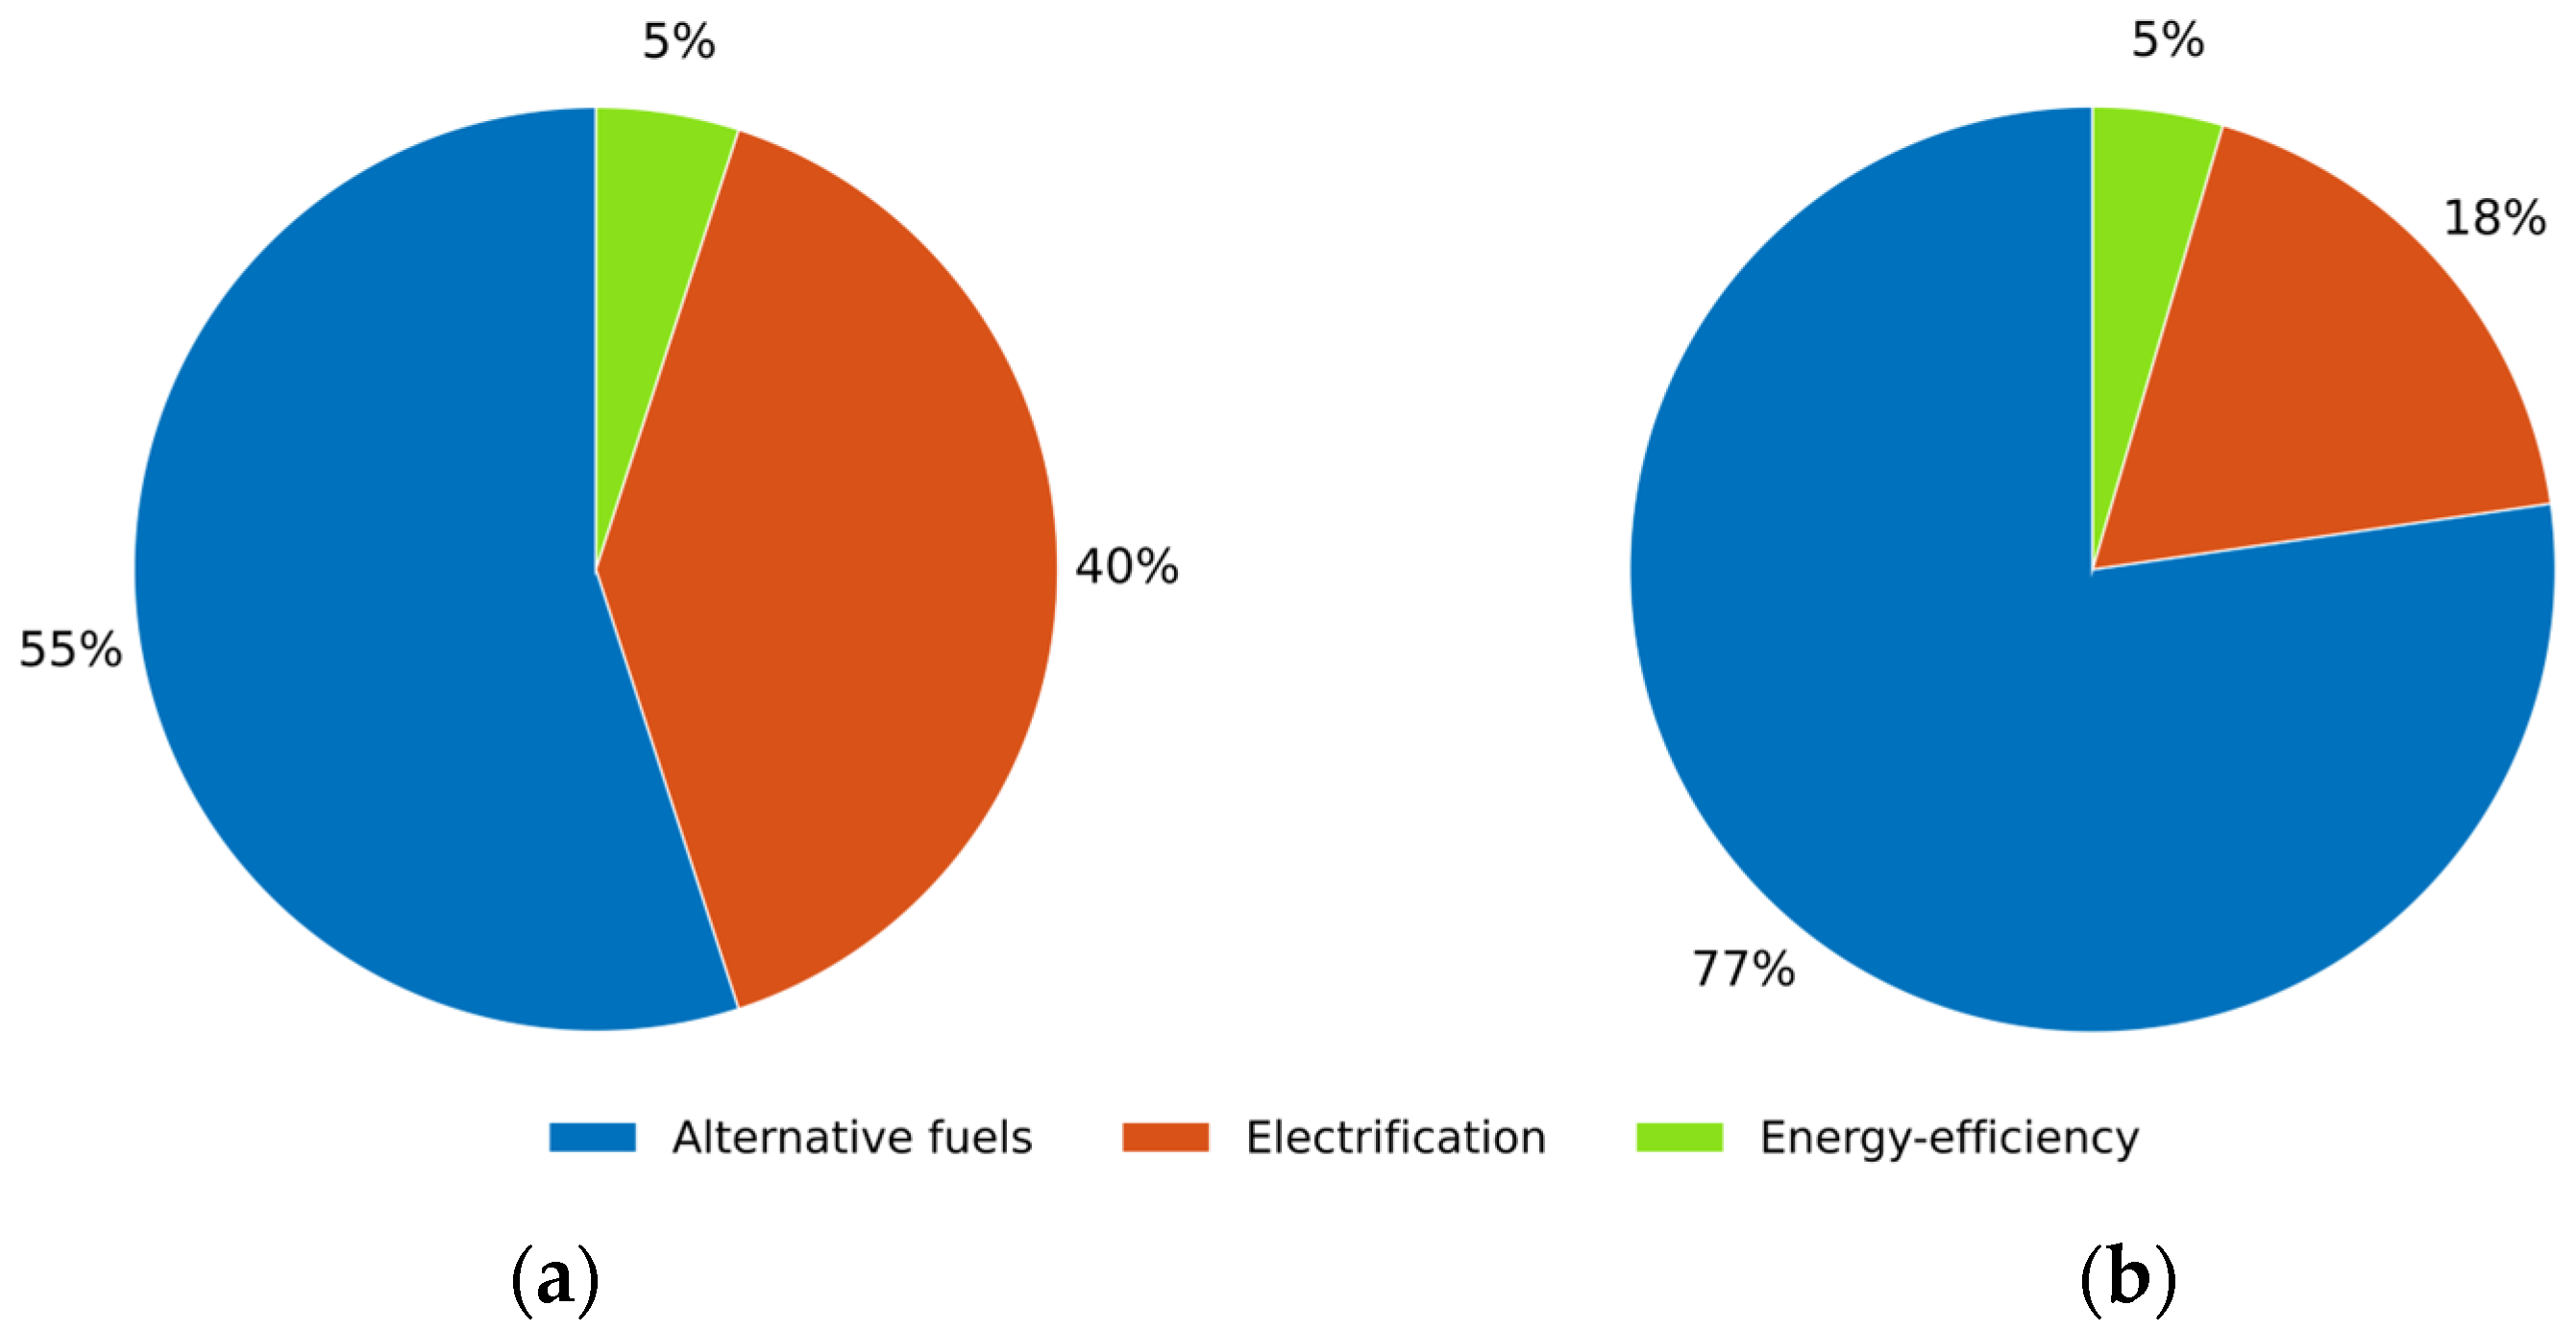
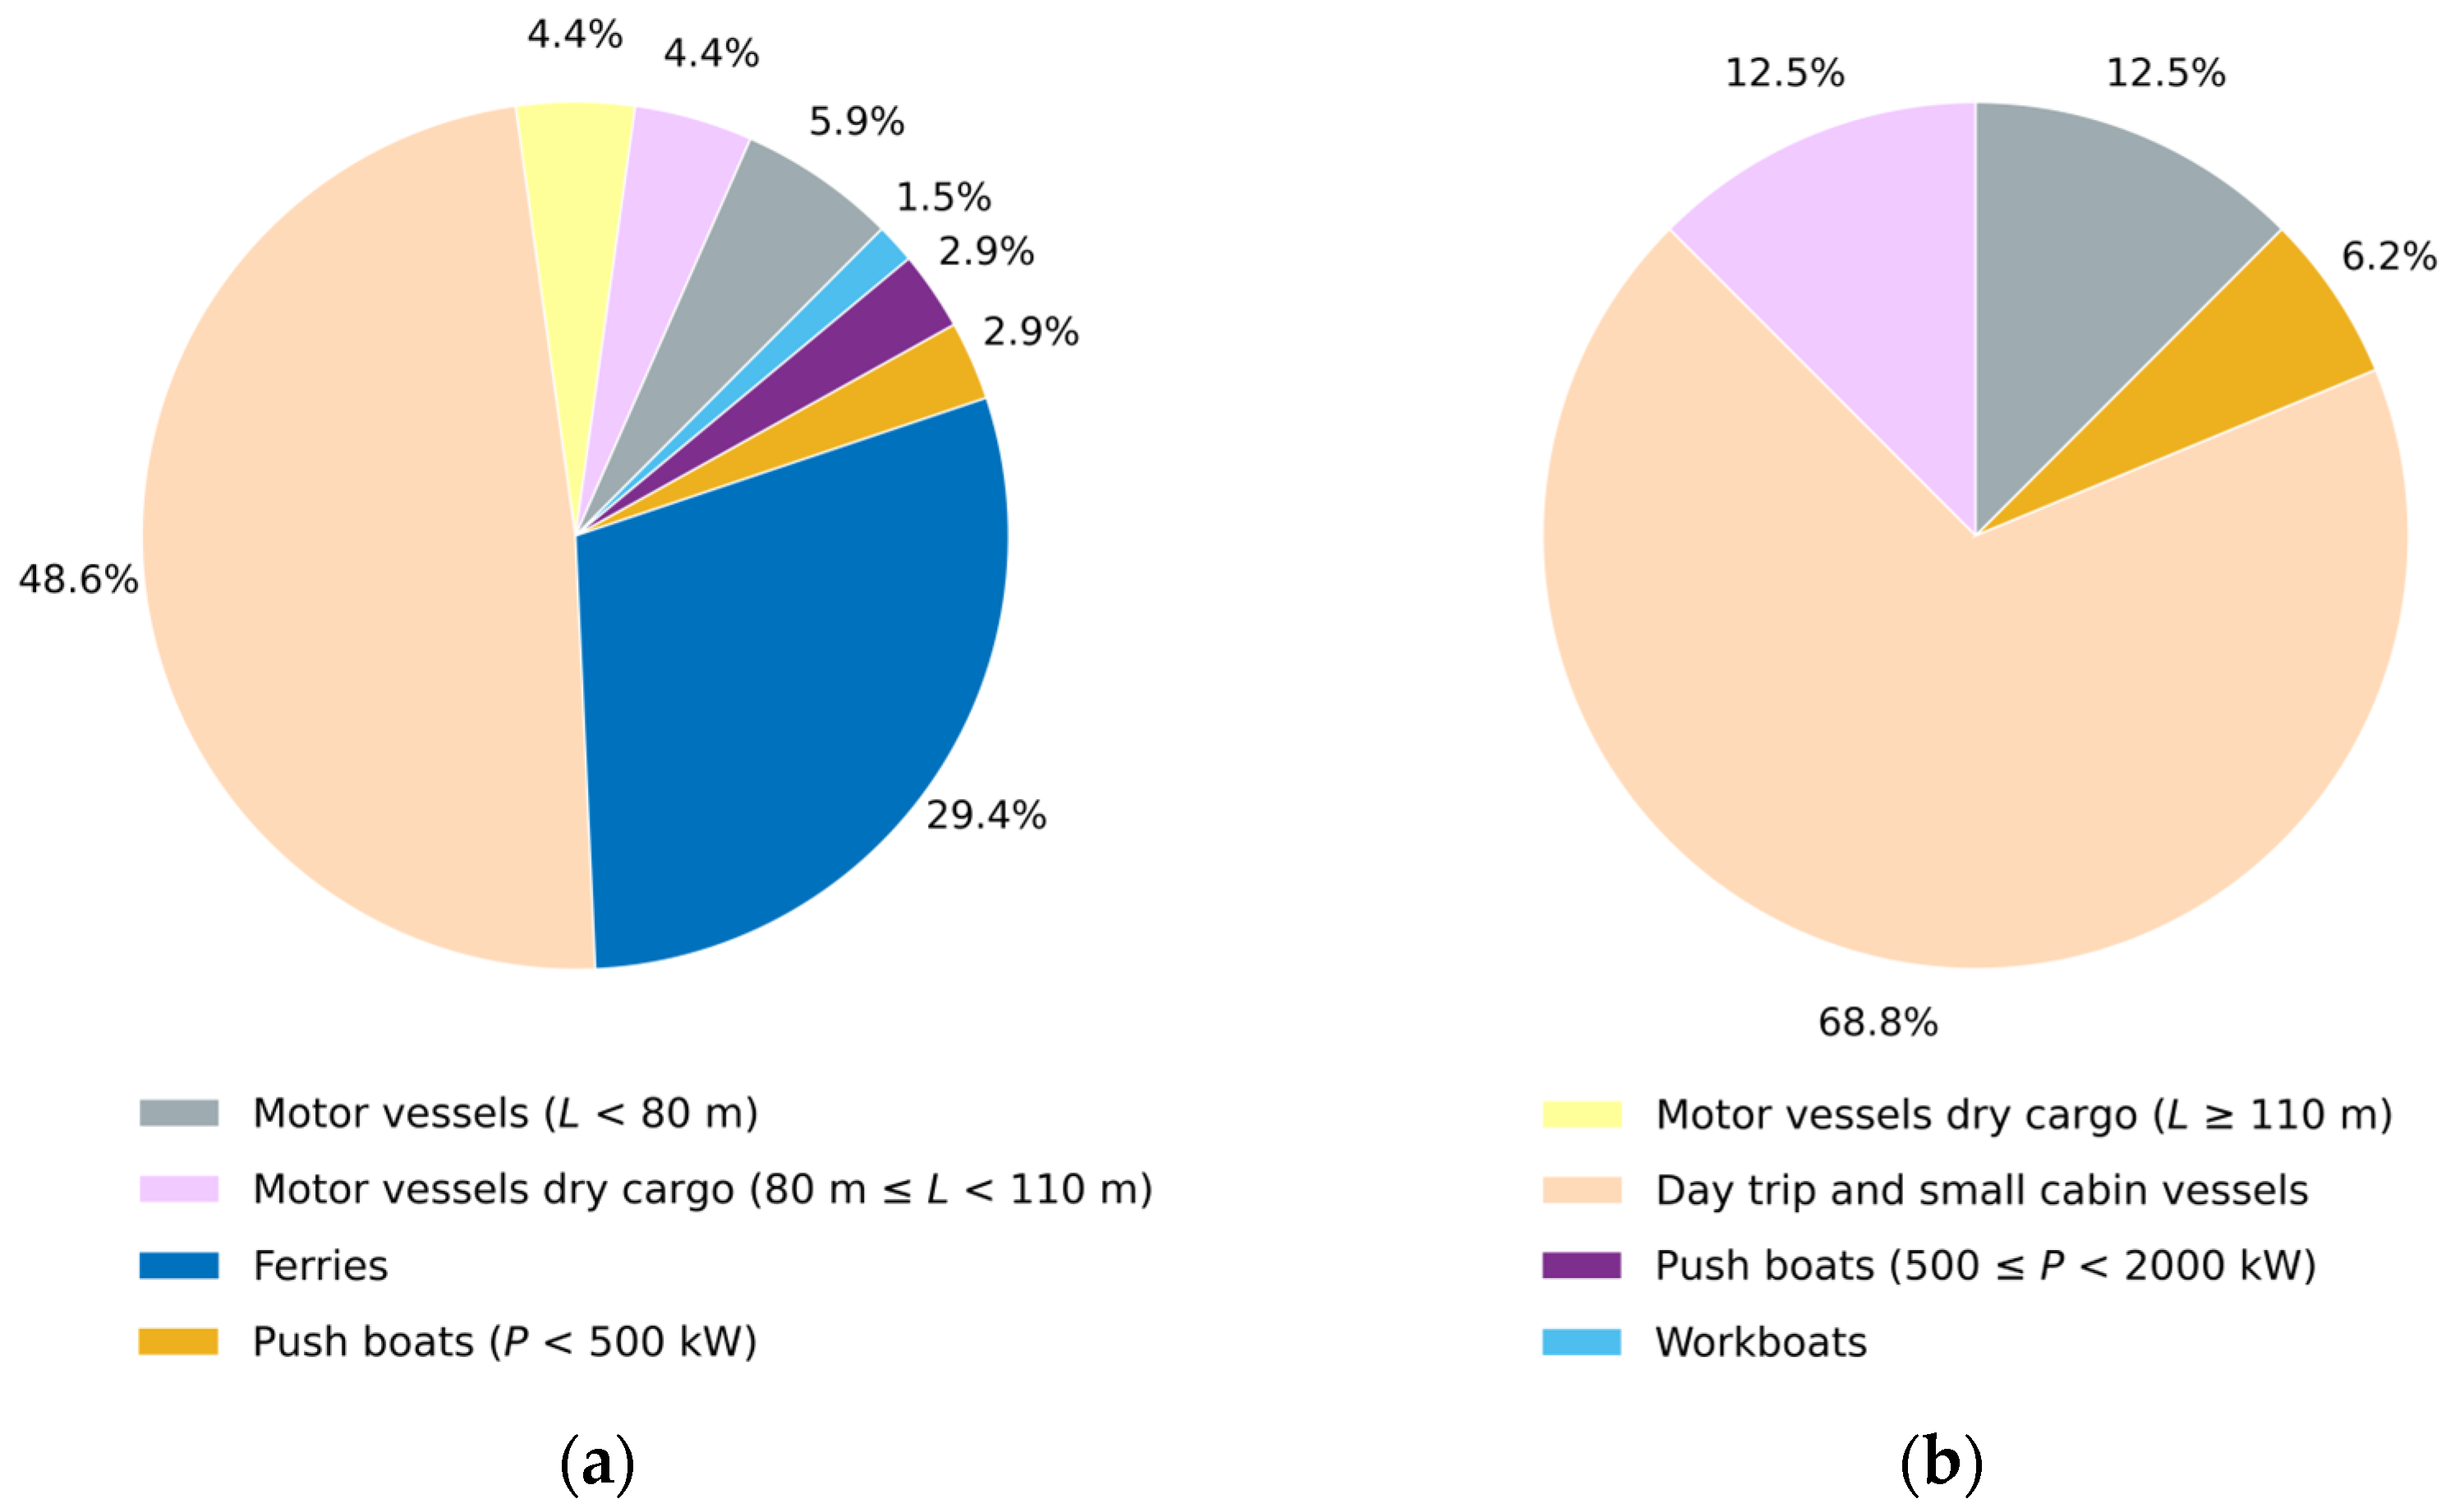
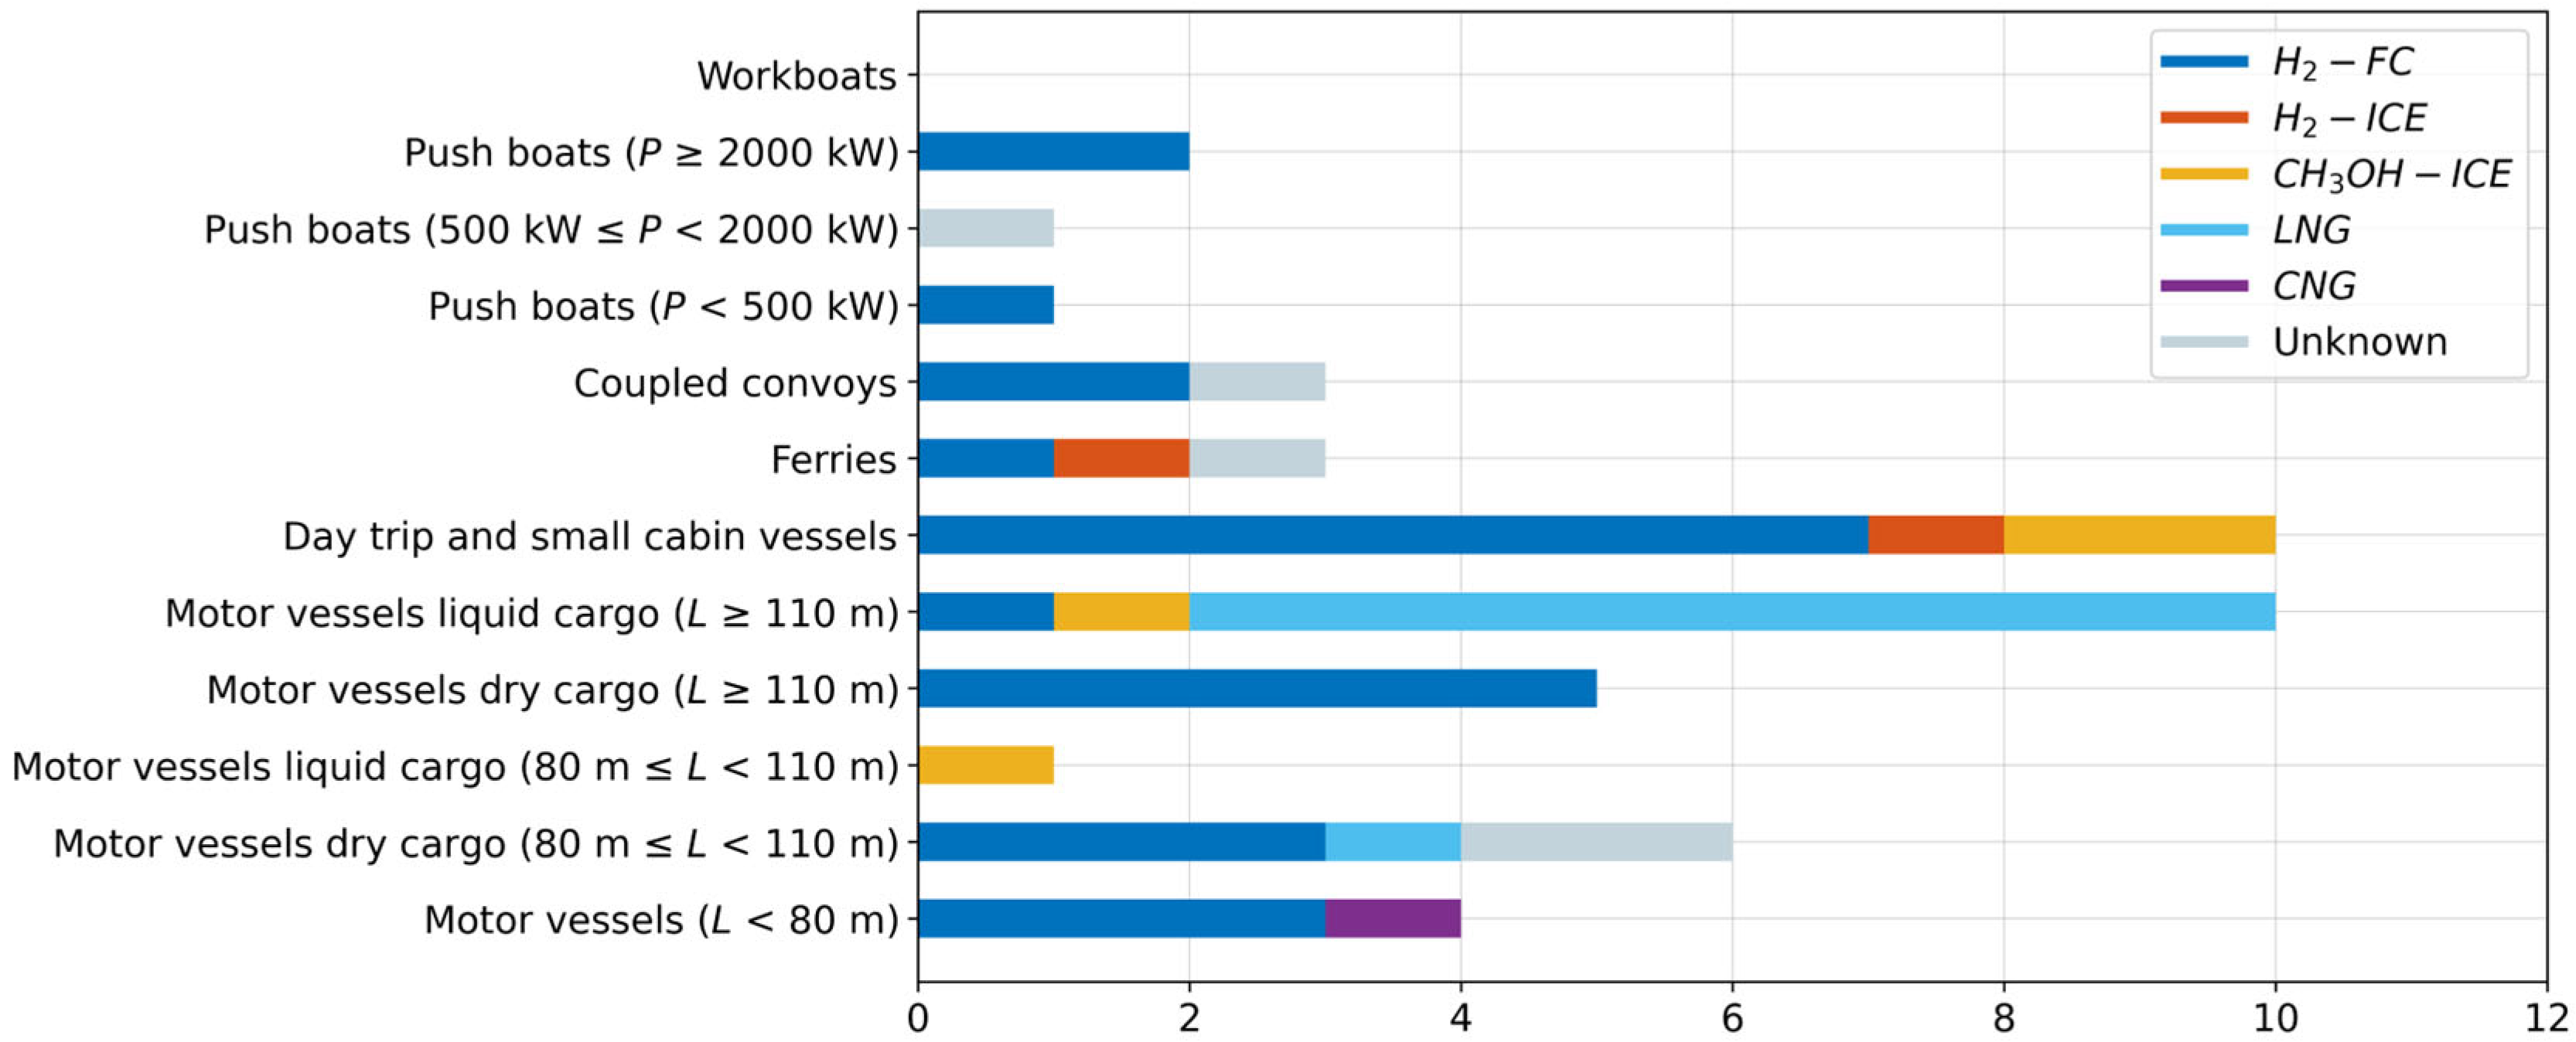
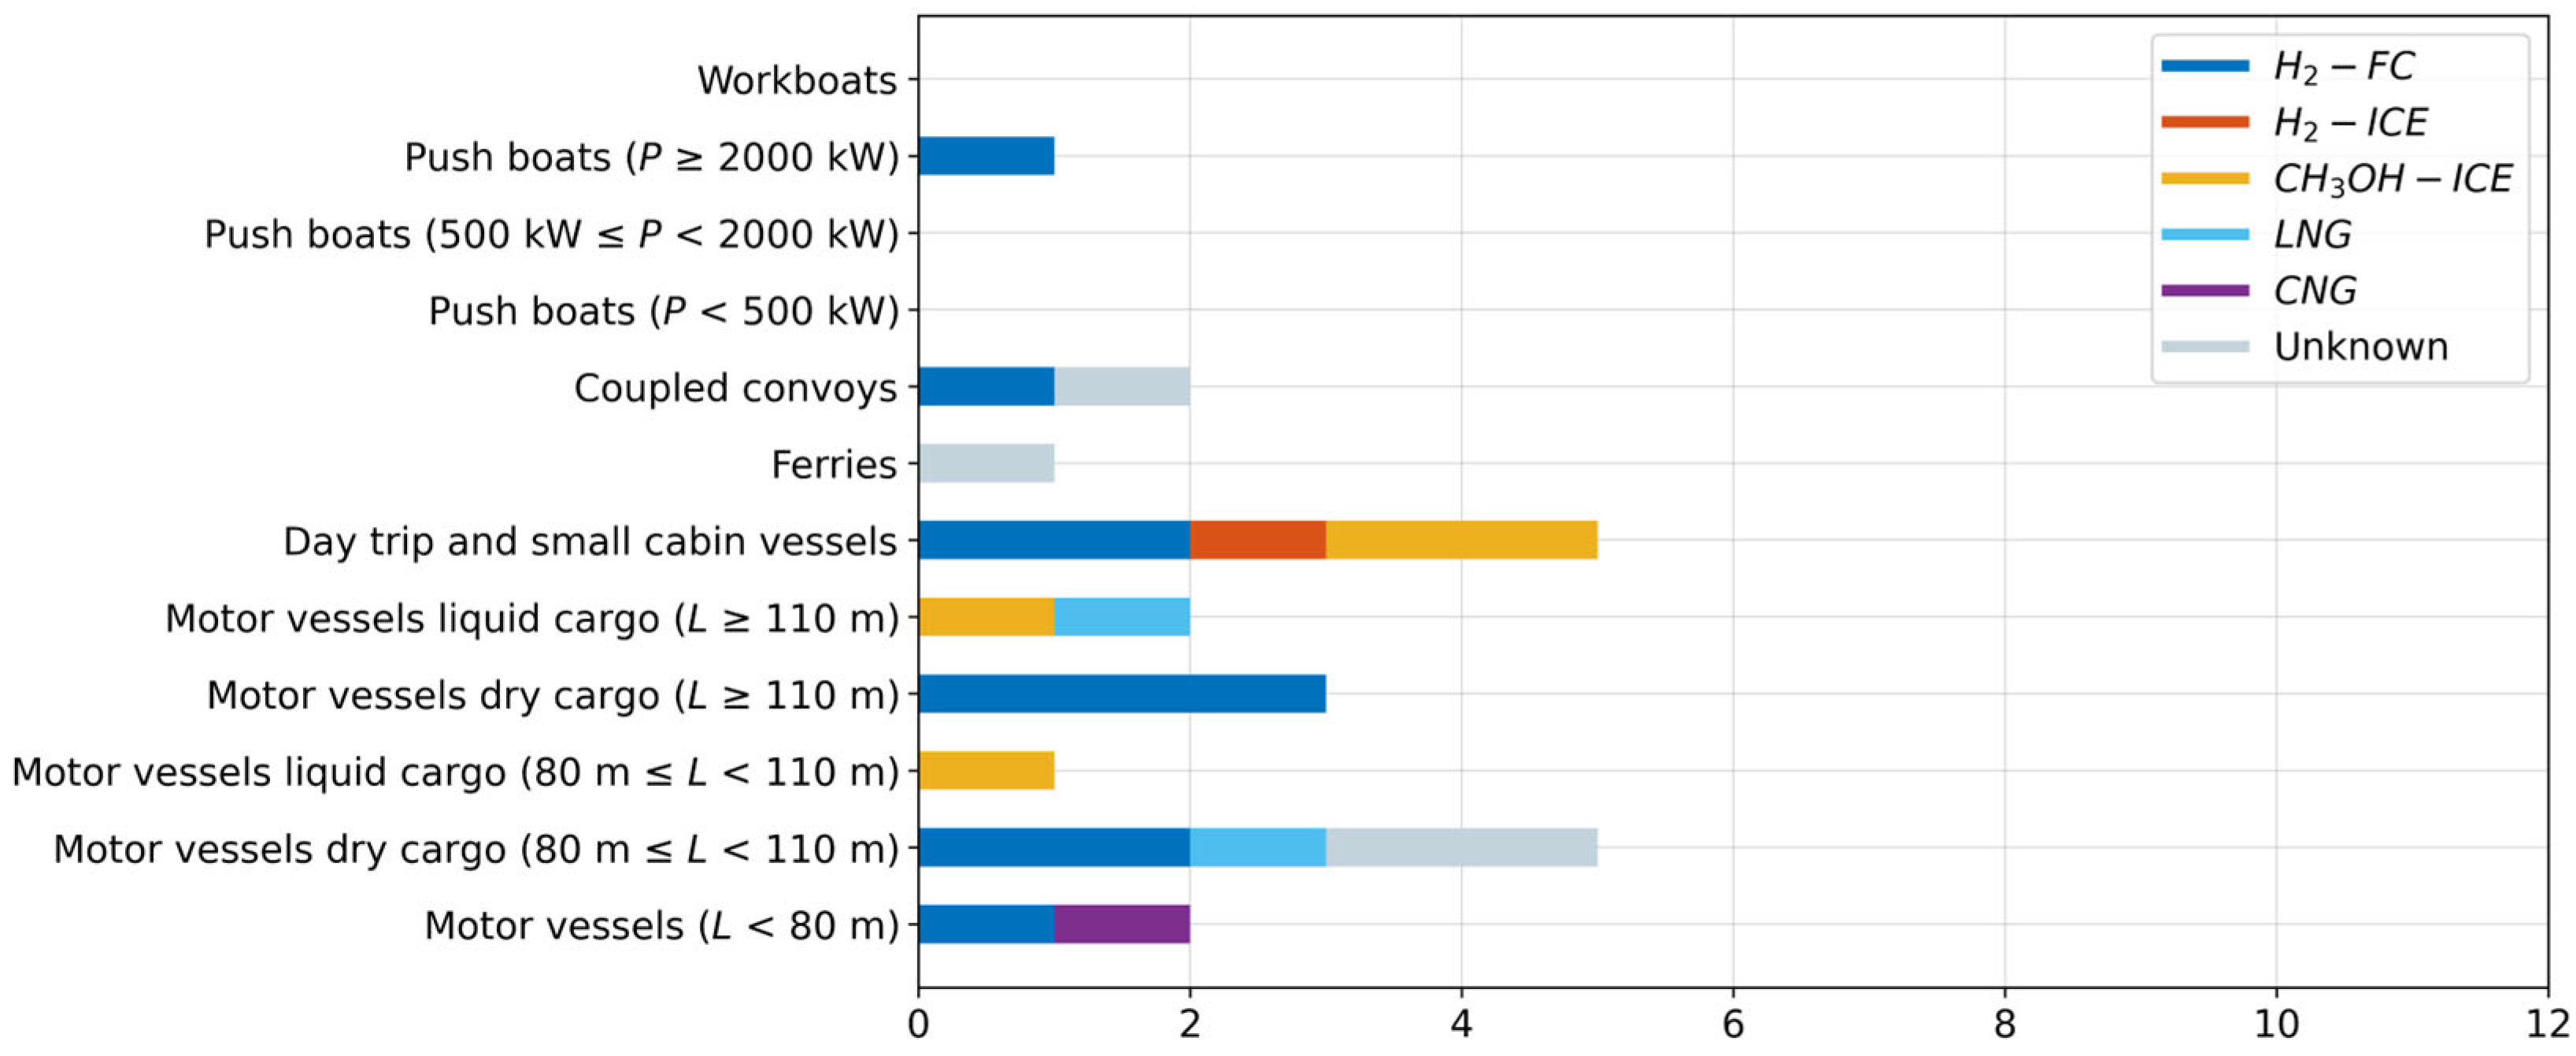
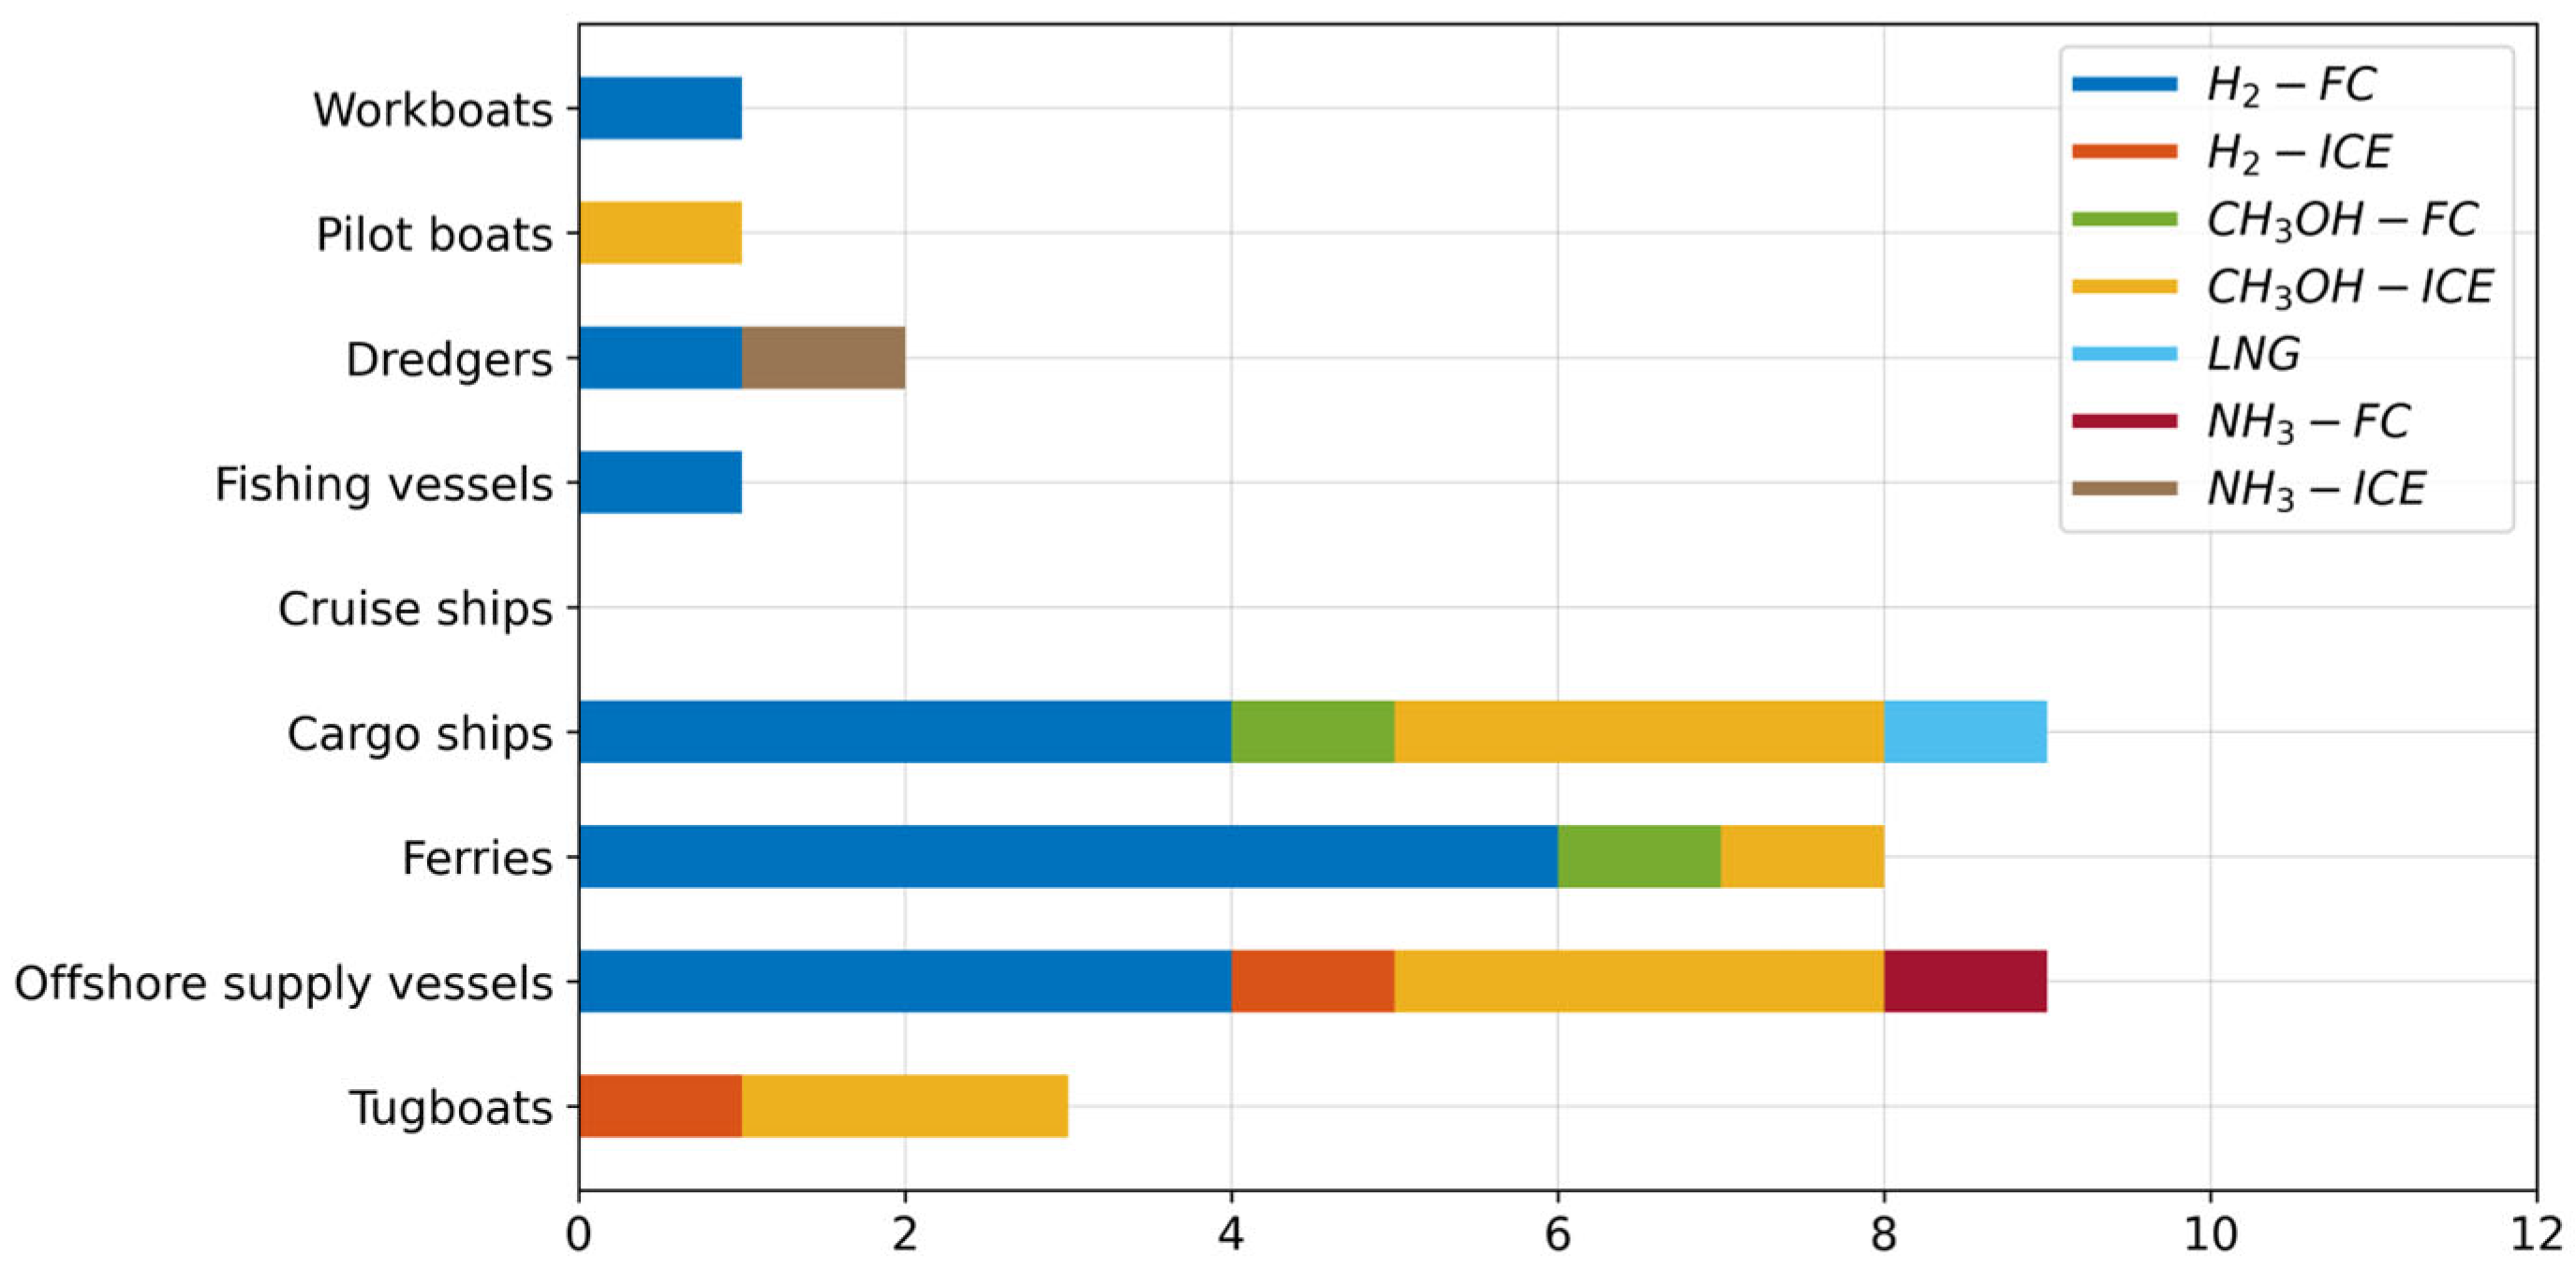
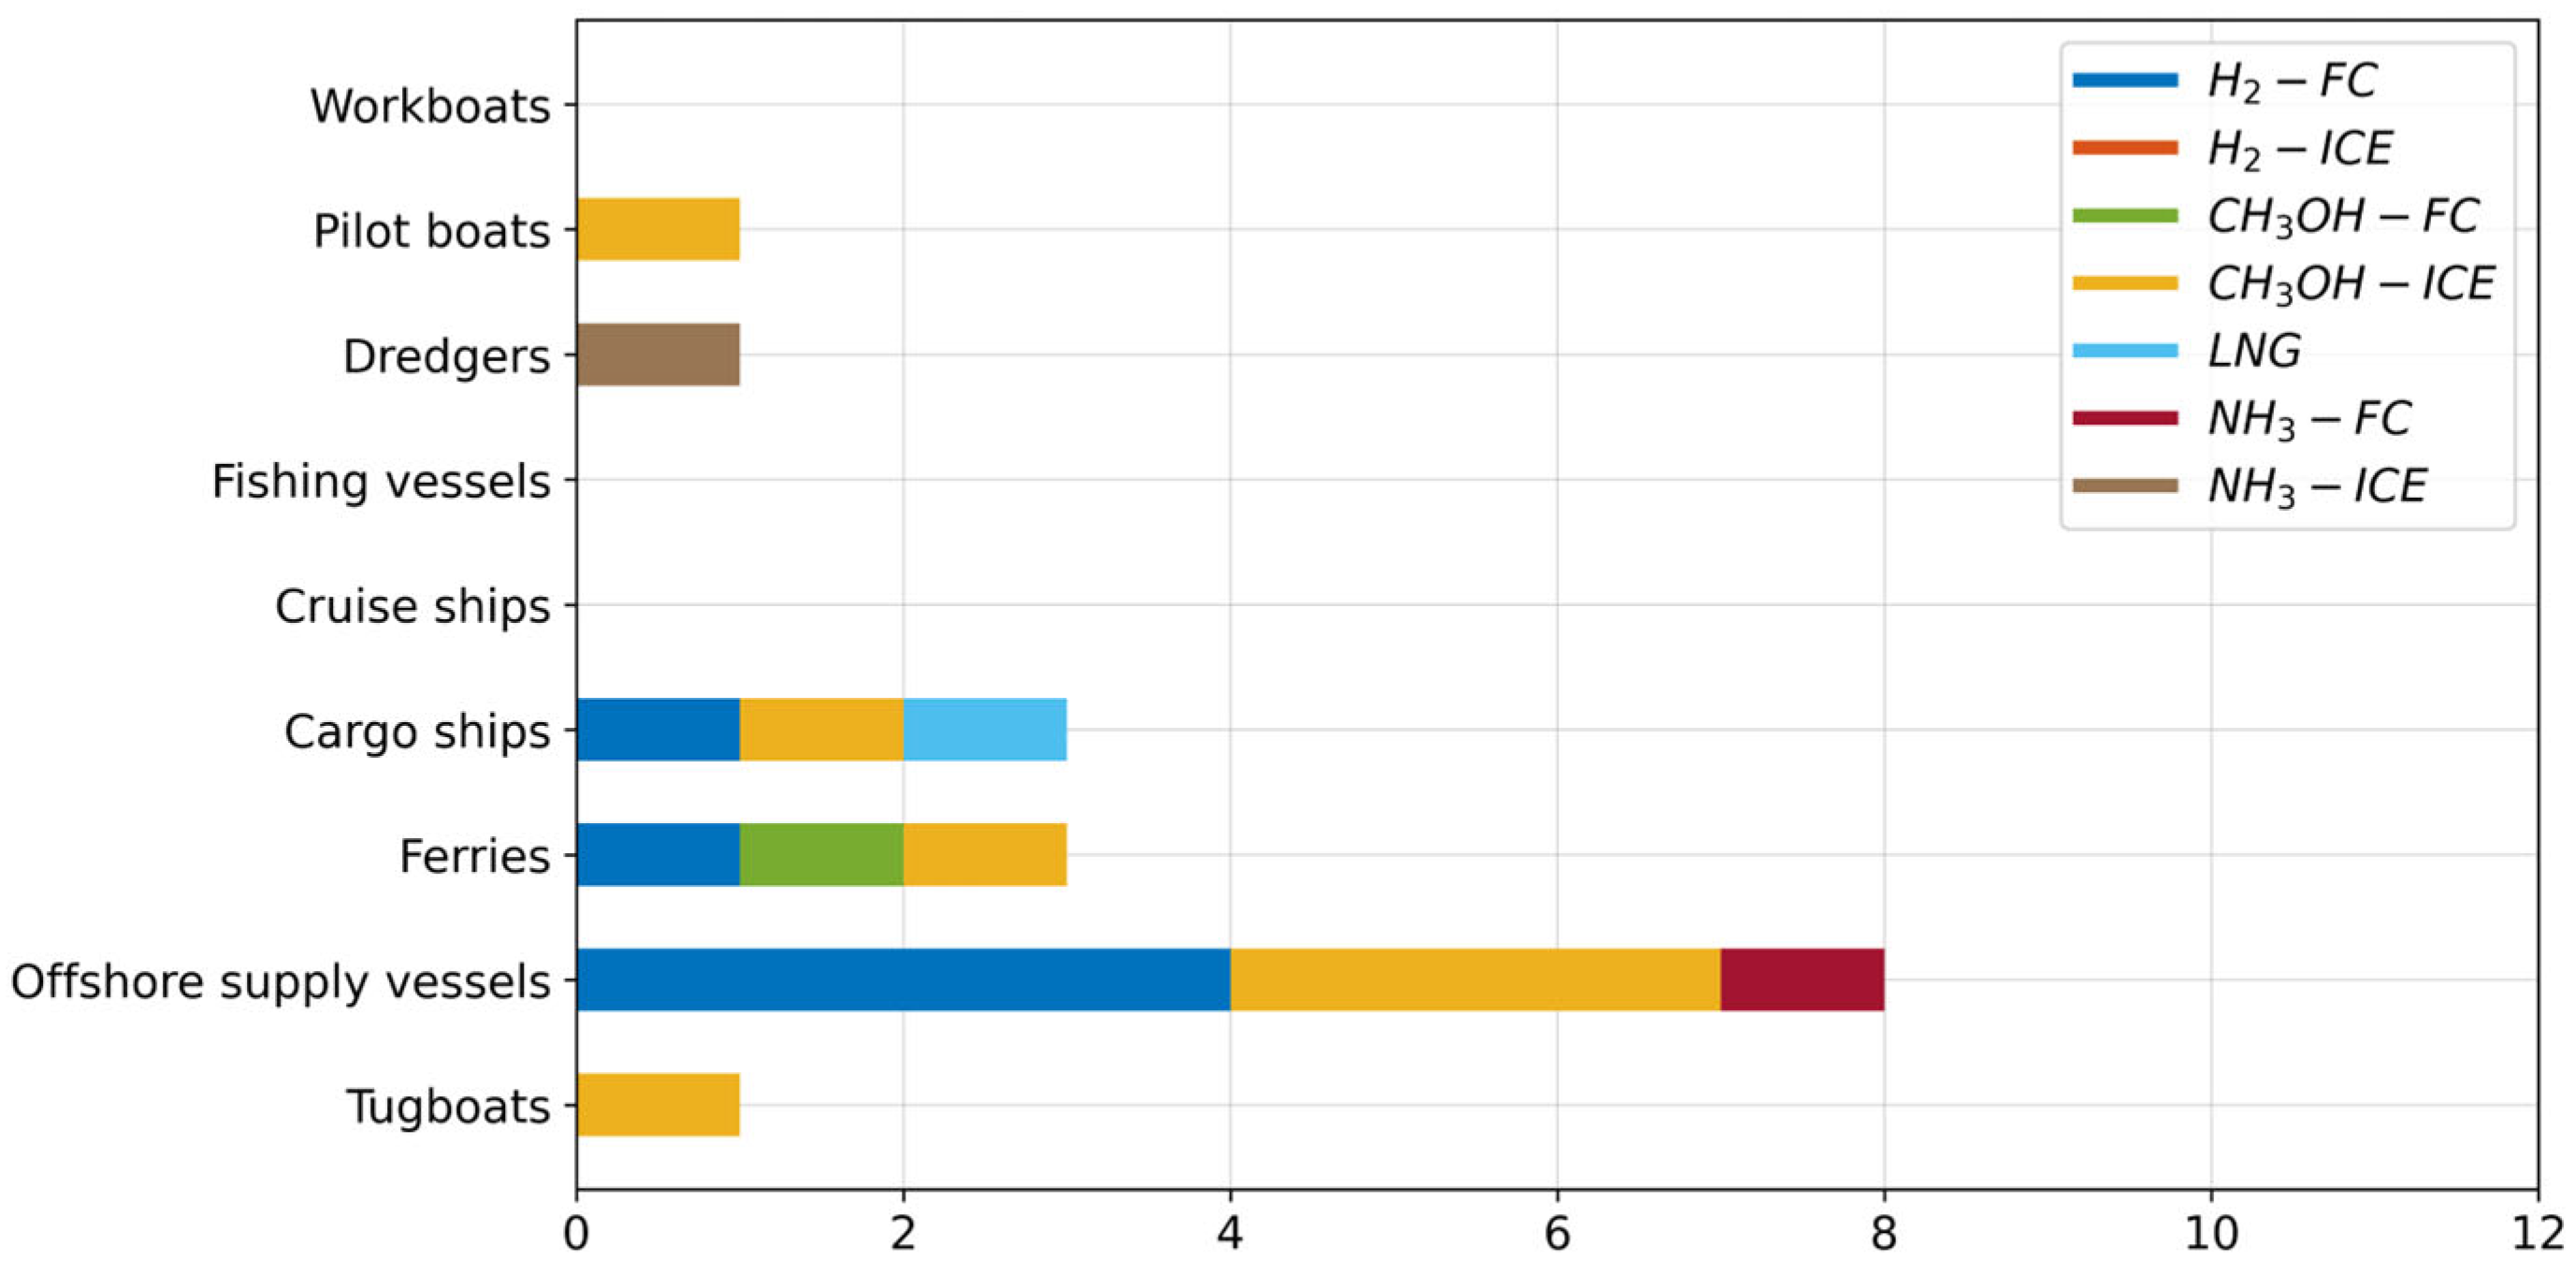
2. Identification of Greening Trends in Retrofitting

To identify the trends in greening of inland and coastal ships, a comprehensive amount of relevant information pertaining to past and ongoing pilot projects has been collected within the framework of the Horizon Europe project SYNERGETICS. The information has been compiled and structured into the Pilot database which was presented in [4] and can be downloaded from [5]. For the purpose of the analysis presented in this paper, the Pilot database has been filtered to extract only those pilot projects that took place in Europe.
The database contains information on 118 inland navigation and 44 coastal shipping pilots carried out in Europe in the period 2008–2026 (Figure 1). Inland vessels comprise ships intended for transport of goods and passengers on inland waterways, as well as floating equipment and waterway maintenance vessels. Coastal ships, as considered in this paper, include seagoing ships, which operate in harbors, along coastlines, between islands, and in marginal seas; that is, ocean-going ships are out of the scope of the analysis. Considering the size of the coastal ships herein analyzed, such vessels are often excluded from the regulatory and policy instruments aimed at greening of the fleet. At least one third of the pilot projects on coastal ships registered in the Pilot database were performed on vessels below 5000 GT. Although the pilot projects have been carried out on all major types of inland vessels and coastal ships, they are not equally distributed across the ship categories and classes. In inland navigation, the major share of pilots has been performed on small passenger ships (as much as 37%) and ferries (19%), while push boats, across all power ranges, comprise only a small fraction of the pilots (8%). In coastal shipping, nearly 80% of the pilots in Europe have been performed on three ship types: offshore supply vessels, ferries, and cargo ships. The assessment of success of individual pilot projects is not within the scope of this paper. Instead, the focus is on the observation of retrofit trends and an evaluation of the potential gains which could be achieved if the trends are followed.
Nearly two thirds of the pilots in inland navigation were performed on newbuild vessels. In coastal shipping, the number of pilots performed on newbuild ships is (almost) equal to the number of pilots projects on retrofitted ships (Figure 2).
Innovative technologies used in greening of shipping are grouped into three categories: electrification of the main propulsion plant, use of alternative fuels, and measures aimed at improvement of energy efficiency (Figure 3). Electrification has been used on nearly 60% of pilots in inland navigation; in coastal shipping, however, less than 20% of pilots employed electrification. Alternative fuels were utilized on almost 40% of pilots in inland navigation, and on a little less than 80% of pilots in coastal shipping. Measures for an increase in energy efficiency seem to be seldom used in pilot projects in both inland navigation and coastal shipping. If the analysis is narrowed down to pilot projects carried out on existing ships, i.e., when the greening was achieved by means of a retrofit (Figure 4), the overall picture does not change considerably for coastal ships. However, inland vessel pilots are significantly affected: the share of electrification pilots is brought down to 40%, while the alternative fuel pilots comprise a share of 55%; the share of energy efficiency pilots increases as well.
Electrification pilots in European inland navigation have been carried out mostly on small passenger vessels (day-trip and small cabin vessels) and ferries, while other vessel types feature a single-digit number of pilots (Figure 5a). The variety of inland vessel types engaged in electrification is further reduced if only greening by means of retrofitting is considered (Figure 5b). It turns out that all inland ferries which adopted electrification as the greening approach were newbuild vessels, and that only one push boat was retrofitted to electric propulsion. The electrification pilots comprise only eight costal ships (Figure 6a); this number drops to four (three ferries and one offshore supply vessel) if only retrofitted ships are considered (Figure 6b).
Alternative fuel pilots featured in the Pilot database comprise a wide variety of fuels: hydrogen used in fuel cells (H2-FC) and in internal combustion engines (H2-ICE), methanol used in fuel cells (CH3OH-FC) and internal combustion engines (CH3OH-ICE), ammonia used in fuel cells (NH3-FC) and internal combustion engines (NH3-ICE), liquified natural gas (LNG), and compressed natural gas (CNG). In inland navigation, hydrogen in fuel cells has been used in almost all ship types and comprises more than 50% of alternative fuel pilot projects (Figure 7). This observation remains valid if the analysis focuses on greening by retrofitting, with 45% of pilots utilizing H2-FC (Figure 8). Most of the pilot projects have been conducted on day-trip and small cabin vessels, and the largest tankers, whose length exceeds 110 m (Figure 7). If newbuild vessels are excluded, most of the pilots were conducted on small passenger ships and medium- to large-sized dry cargo ships (Figure 8). As for coastal ships, a wide variety of alternative fuels have been tested in pilot projects (Figure 9), with cargo ships, ferries, and offshore supply vessels being the subject of most of the projects. Half of the pilot projects in coastal shipping have involved the use of hydrogen in fuel cells. The use of methanol in internal combustion engines has had a prominent role as well, with 30% of the pilots opting for this solution. Utilization of CH3OH-ICE has been, however, slightly more popular on retrofitted coastal ships, whereby most of the greening projects were performed on offshore supply vessels (Figure 10).
Based on the data presented in Figure 5b, Figure 6b, Figure 8 and Figure 10, it follows that greening by retrofitting is more commonly performed on some ship types. In inland navigation, these are day-trip and small cabin vessels, and dry cargo motor vessels whose length is both between 80 m and 110 m and above 110 m. In coastal shipping, these are ferries and offshore supply vessels. Furthermore, the innovative technologies most frequently utilized in retrofitting of these ship types can be identified as well. Therefore, in the subsequent sections, the analysis focuses on costs and emissions related to the electrification of small inland passenger ships and seagoing ferries, utilization of hydrogen in fuel cells on inland dry cargo vessels of length 110 m and longer, and utilization of methanol in internal combustion engines of offshore supply vessels.
Greening of the selected coastal ship types has been addressed in a number of recent studies. The possibilities for greening of a high-speed ferry by a combination of retrofit and operational measures were analyzed in [6]; the suitability of energy for greening of small coastal ferries was explored in [7]; the societal, infrastructure, technical, policy, etc., aspects affecting the adoption of battery-electric propulsion by the Norwegian coastal fleet, including ferries and offshore supply vessels, was examined in [8]; the options for decarbonization of the domestic ferry fleet of the Republic of Korea in view of compliance with the national environmental targets were investigated in [9]; life-cycle impact assessment was performed in [10] to find the most viable and environmentally friendly fuel for a category of offshore supply vessels; a life-cycle assessment perspective was also used in [11] to identify the most appropriate power systems for Adriatic ferries, etc.
Greening of inland vessels, however, has not received comparable attention. Electrification of inland vessels in general has been addressed in [12]. The environmental benefits and the cost efficiency of electrification of small inland ferries was evaluated in [13]. The impacts of electrification of the entire passenger and cargo fleet operating on German inland waterways, on a tank-to-wake basis, was examined in [14]. The possibilities for scaling up the retrofit of the Dutch inland fleet (primarily focusing on large cargo vessels) by means of hydrogen fuel cells, in order to meet the emission reduction goals in inland navigation, were analyzed in [15].
However, the existing literature does not have a strong focus on retrofitting, and (with some exceptions) does not offer a systematic view of the effects of greening of entire fleet segments (i.e., scaling up retrofitting from individual pilot projects to complete fleets). Specifically, this pertains to a lack of comparison of emission reduction potentials of greening approaches which consider well-to-tank emissions and costs with those which are based on tank-to-wake metrics only. This paper aims at filling these gaps. Perhaps most importantly, it presents the possible costs of retrofitting, both in absolute numbers (e.g., total costs of the retrofit of a fleet segment) and in relative terms (e.g., costs of abatement of a ton of greenhouse gases).

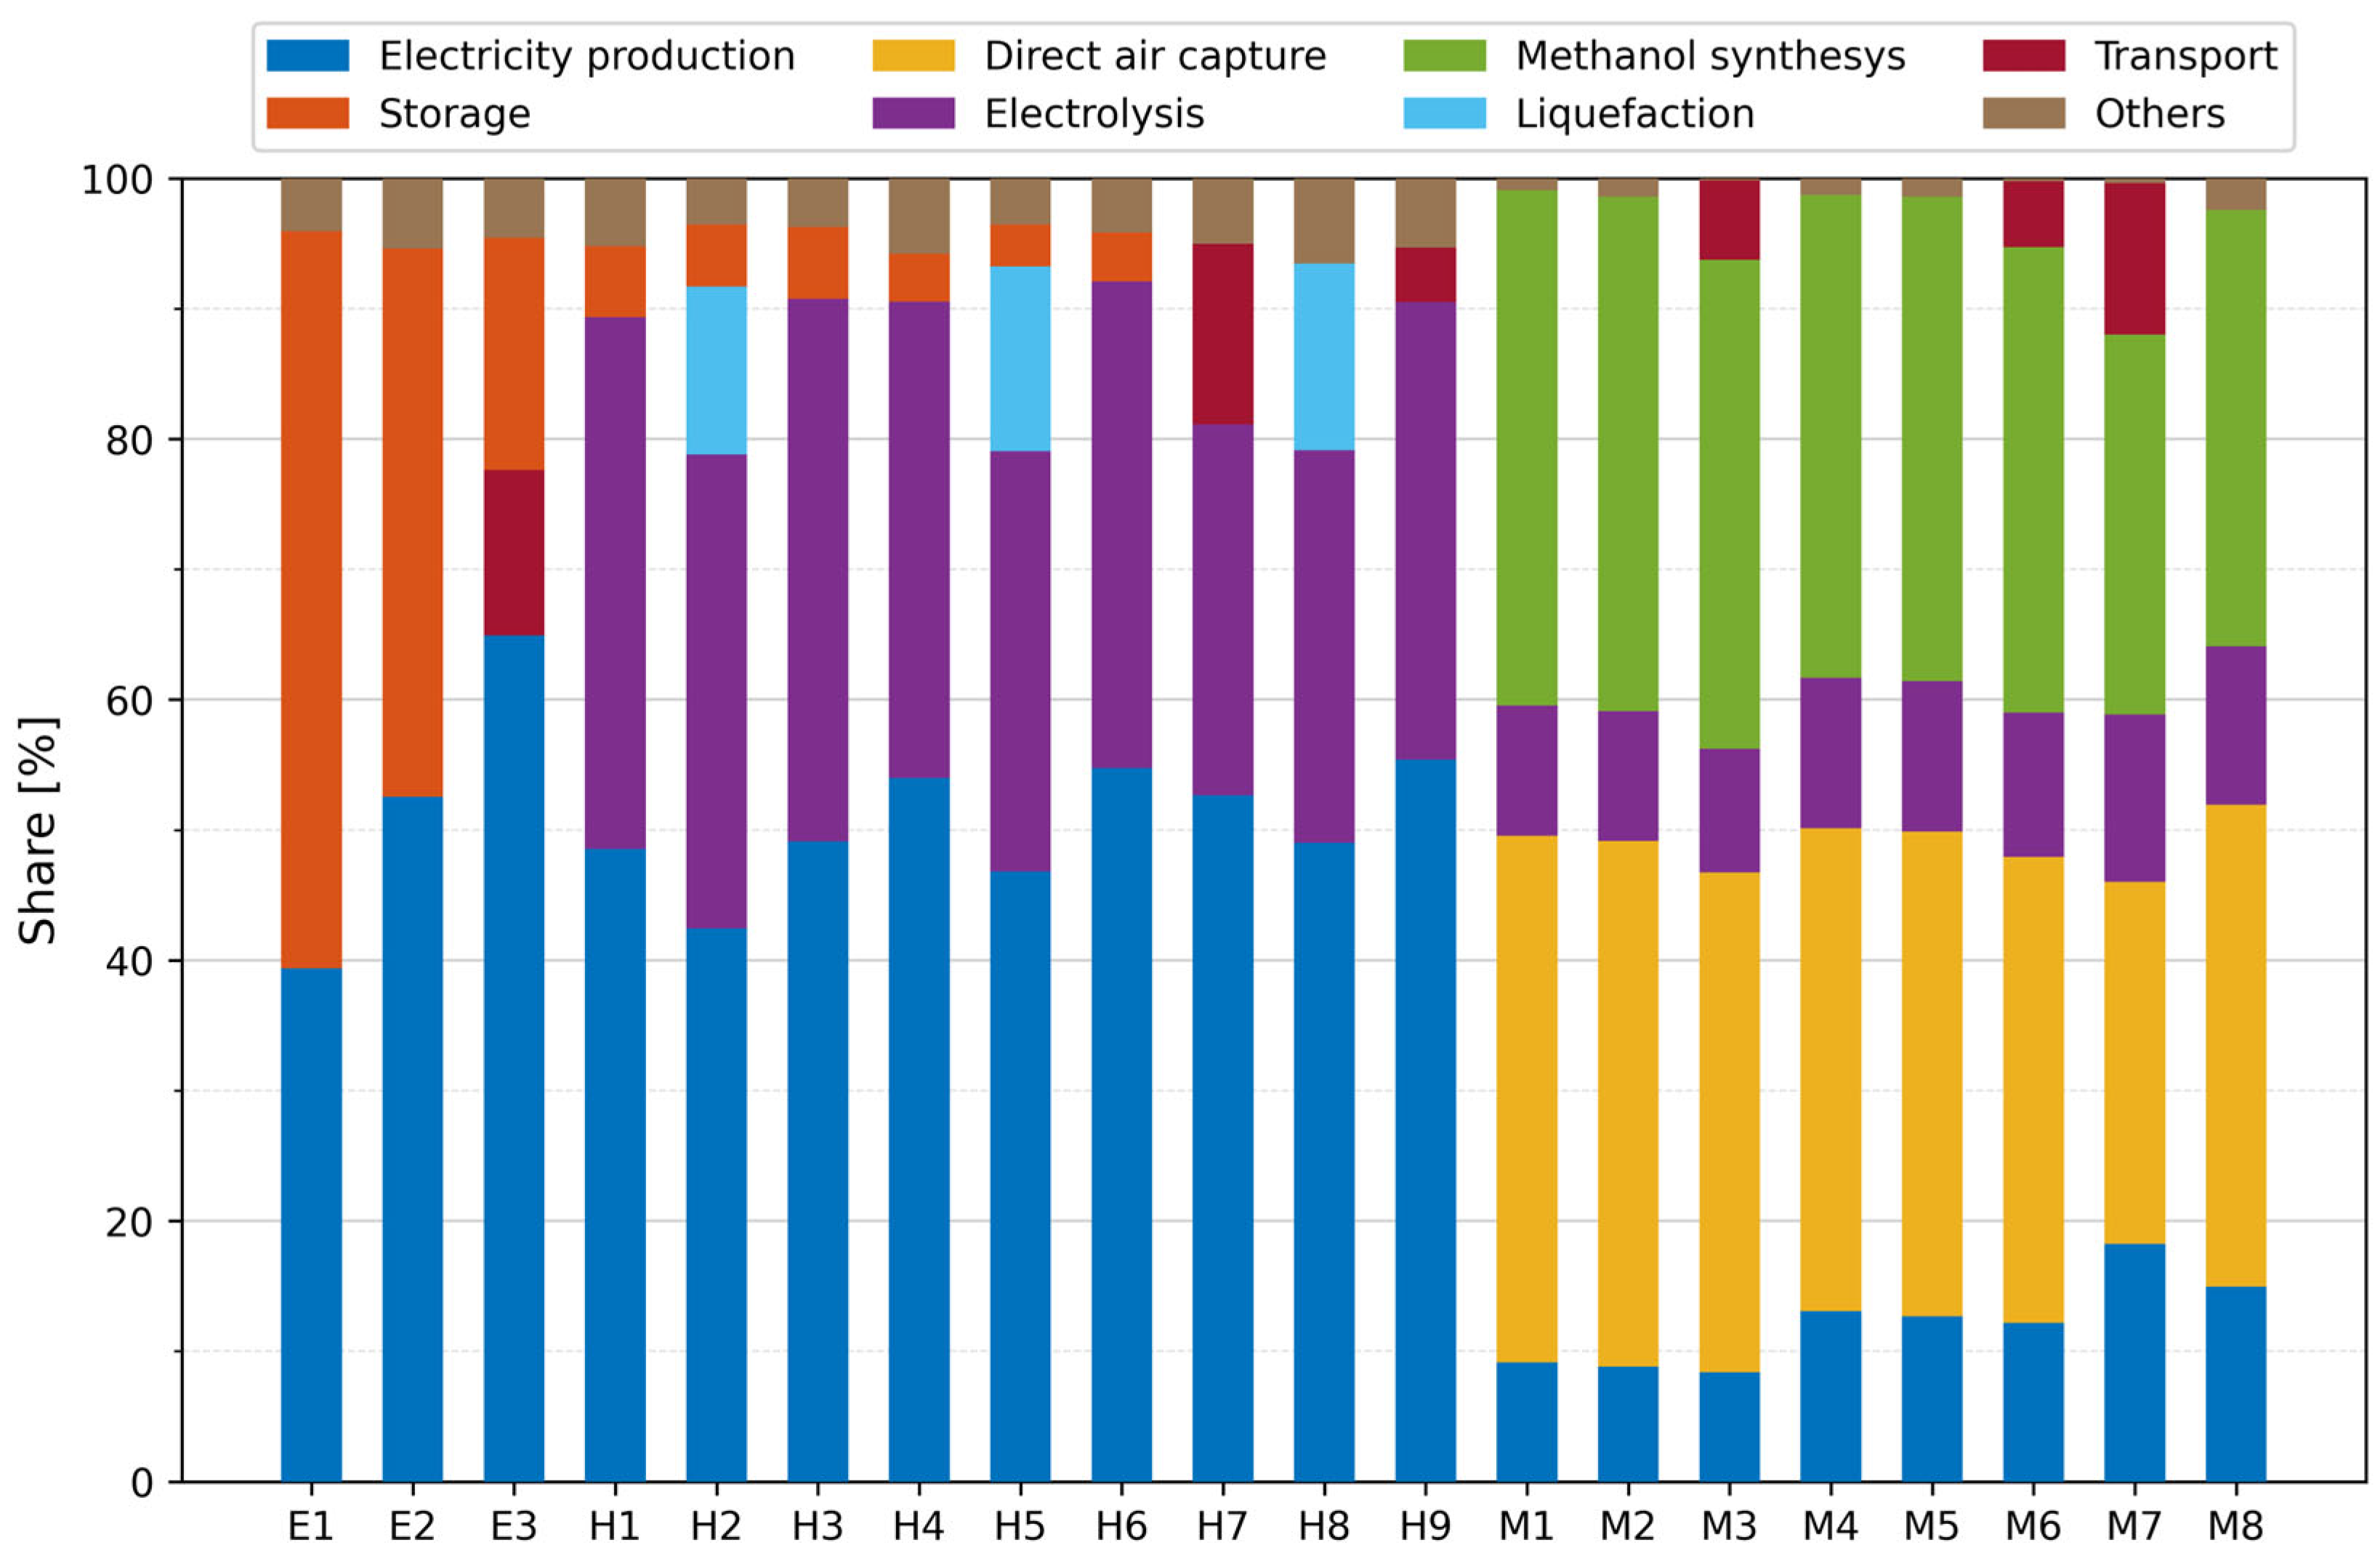
3. Well-to-Tank Modeling of Emissions and Costs

In this section, the emissions and costs associated with the well-to-tank part (production and supply of energy carriers) are discussed. To quantify the emissions and costs, a comprehensive, modular modeling framework has been developed; see [16]. First, all process steps (modules) are modeled individually using module-specific raw data from the literature (see Table 1). The comprehensive SYSEET study [17] is used as a primary source. Missing or outdated parameters are added or updated using the data from several other sources. These modules are subsequently linked to each other and compiled, resulting in hundreds of possible module combinations. Based on the feasibility of individual paths, three battery-electric paths (E1–E3), nine e-hydrogen paths (H1–H9), and eight e-methanol paths (M1–M8) are chosen for further investigation (the specifics of the supply paths configurations are given in Appendix A to the paper). For instance, hydrogen transport by lorry would lead to unreasonably high costs and is therefore not modeled. In addition, to reflect uncertainty in the modeling and scatter in the raw data, the results for each of the selected paths are shown with bandwidths corresponding to “optimistic” and “pessimistic” raw data and assumptions.
The emissions of greenhouse gases, nitrogen oxides, and particulate matter, which have an impact on the climate and/or are harmful to health, are considered in the analysis. Greenhouse gases (GHGs) are taken into account using CO2e (which stands for CO2–equivalent) as a measure, utilized to summarize the global warming potential (GWP) of various GHGs. Nitrogen oxides (NOx) comprise nitric oxide (NO) and nitrogen dioxide (NO2); they contribute to forming smog and acid rain, and have an indirect global warming effect. Particulate matter (PM) emissions are considered with PM10 (corresponding to a particle size of 10 µm or less), which can penetrate the upper respiratory tract and be deposited in the lungs; in this way, PM2.5 (corresponding to a particle size of 2.5 µm or less) is considered as well, as a subset of PM10. The modeled specific GWP for the year 2020 varies between 20 and 380 gCO2e(fossil)/kWh (“best guess” values; see Figure 11). The battery-electric and e-hydrogen paths have lower GHG emissions compared to e-methanol paths. In general, electricity from European wind parks (E1–E2, H1–H6, M1–M6) outperforms electricity from photovoltaics, which is produced in North Africa and the Middle East (E3, H7–H9, M7–M8). Unlike for fossil diesel, there are no (additional) direct fossil GHG emissions for any of these alternative energy carriers. The well-to-tank nitrogen oxide (NOx) emissions of the investigated energy carriers are between 0.05 and 0.5 gNOx/kWh (Figure 12), whereas the particulate matter (PM) emissions range between 0.02 and 1.5 gPM10/kWh (Figure 13). In both cases, the battery-electric supply paths show the lowest emission levels. The costs vary between 0.2 EUR/kWh and 0.6 EUR/kWh (Figure 14). The e-hydrogen paths tend to have the lowest overall costs (including necessary onshore storage capacities).
For the year 2050, GWP values are in the range of 9 to 159 gCO2e(fossil)/kWh (Figure 11). The NOx and PM emissions corresponding to the “best guess” values in 2050 are between 0.03 and 0.28 gNOx/kWh, and between 0.01 and 0.9 gPM10/kWh, depending on the path (Figure 12 and Figure 13, respectively). Thus, the absolute values of GHG, NOx, and PM emissions would decrease but the emission intensities of the supply paths relative to each other would remain the same as in 2020. Finally, the 2050 costs vary between 0.1 and 0.34 EUR/kWh (Figure 14). Generally, the same relations between the costs associated with different supply paths apply as in 2020. Yet, the costs for the battery-electric path from photovoltaics (E3) may fall below the costs of onshore wind (E2).
The standardized relevance of the individual modules (“hotspot analysis”) for GWP is reported in Figure 15. While the transport of energy carriers has little impact on the overall GWP, the main hotspots along the supply chain are electricity production, electrolysis, methanol synthesis, and direct air capture. The key is that only fully renewable energy sources are used. If the current electricity mix from the EU grid is used, GWP may increase more than tenfold. Likewise, if the renewable electricity used for the paths described is not added to the supply, the cheapest marginal energy sources (like coal or natural gas) are likely to compensate the resulting energy deficit.

4. Tank-to-Wake Modeling of Emissions and Costs

To establish the energy, emissions, and costs for the tank-to-wake part, use was primarily made of the Sustainable Power database [18] (see https://sustainablepower.application.marin.nl/; accessed on 17 February 2025). This database provides scalable metrics for various ship technologies, collected from numerous publications and datasheets. However, several other relevant resources were consulted as well. A number of steps were undertaken to select the most representative metrics for the technologies considered in the paper.
In Section 2, the identified greening solutions were described in a rather generic manner, without referring to a specific technology which could be implemented onboard the vessels. Therefore, it was necessary to specify the technologies by introducing the following assumptions:
  • All internal combustion engines (ICEs) are assumed to be high-speed engines, as commonly used in inland ships. Smaller coastal ships also often feature engines of comparable characteristics.
  • Based on the technical readiness level of the various technologies, it was assumed that electrification meant a fully electric propulsion train powered by lithium nickel manganese cobalt oxide (Li-NMC) batteries.
  • H2-FC was assumed to feature 300-bar hydrogen storage and low-temperature proton-exchange membrane (LT-PEM) fuel cells.
  • The currently available dual-fuel technologies for methanol feature variable methanol energy fractions. The dual-fuel methanol combustion metrics were based on research performed in [19], where a 65% methanol energy fraction was achieved.
  • As a reference technology, marine diesel oil (MDO) or diesel fuels used in inland shipping (standard EN 590 of the European Committee for Standardization, see [20]) were used in combination with a high-speed engine including exhaust after-treatment.
These assumptions allowed adequate metrics to be selected. An overview of the selected metrics is reported in Table 2, Table 3, Table 4 and Table 5. The metrics are given per unit of energy or power that the propeller shaft and/or auxiliary consumers require, and therefore corrected for any losses within the system. The emission factors applicable to seagoing ships were derived considering several sources [21,22,23,24] in addition to the Sustainable Power database. To determine the emission factors which apply to inland vessels, Refs. [25,26] were used as primary sources. It is to be noted that the CO2e emission factors corresponding to the seagoing ships are significantly lower due to a higher power system efficiency, resulting from a more constant sailing profile and greater installed power.
The efficiency of the propulsion system refers not only to the engine but to the entire power train, comprising energy pre-treatment, energy conversion, after-treatment, and distribution. All efficiencies are typical values found in the literature. The energy conversion (engine/fuel cell) efficiencies are weighed based on the IMO E3 propeller-law load cycle (Appendix II to MARPOL Convention; see [1]) and the data was used from other comparative studies (such as [27]) wherever possible. It was assumed the efficiencies of the propulsion systems would not change in 2050.
The cost of energy storage mainly concerns the fuel tank; this cost is given in various publications (see, e.g., [28]). Even though the cost of Li-NMC batteries sometimes appears to be as low as EUR 130/kWh, such estimations are often based on market prices for the EV industry [29], without considering the complete battery system costs. When considering these, the costs increase considerably, to in the order of EUR 500/kWh [30]. The power system costs are based on the relative costs of each power component (energy conversion, pre-treatment, after-treatment, distribution). The available data for this is limited and based on the E-ferry Project [31,32,33]. The power system costs of the considered retrofit solutions in 2050 are 10% lower than in 2020; it is considered that this is a conservative approach. The energy costs were based on the data given in Section 3, and were corrected for the efficiency losses in the drivetrain. Maintenance costs were not taken into account. In addition, the potential loss of payload as a consequence of retrofitting has not been considered either. For the reference case (diesel-ICE) the current market fuel prices (February 2025) were used.

5. Emissions and Costs of Retrofitting of Selected Inland and Coastal Ships

In this section, an assessment of the emissions and costs associated with the retrofit of the fleet segments identified in Section 2 is carried out on the well-to-wake and tank-to-wake bases, using the information reported in Section 3 and Section 4. Where applicable, each of the identified fleet segments was divided into groups (based on size or main engine power). For each of the groups, a representative ship was created (including operational profiles) and retrofitted with the technology selected based on the observed trends. Using the data available in the literature and the statistical analysis of the operational profiles, the annual energy demand was calculated for each of the analyzed fleet segments. The total cost (TC) of the retrofit were calculated in a simplified manner as the sum of the costs of the new system and the costs of energy for 20 years of operation:
T C = C s y s t e m + 20 C e n e r g y .
The total costs corresponding to a diesel-powered vessel were calculated in the same manner, assuming that in the course of 20 years, the existing propulsion system would have to be upgraded at least once. This allows the calculation of the additional costs a greening retrofit may imply:
Δ T C = T C Retrofit T C Diesel .
Abated GHG emissions may be calculated as
CO 2 e a b a t e d = m CO 2 e Diesel m CO 2 e Retrofit ,
while the costs of abatement of 1 t of CO2e may be calculated as
C CO 2 e a b a t e d = Δ T C CO 2 e a b a t e d .
A detailed overview of the results is given in Appendix B to the paper, whereas the main outcomes are summarized in the sections to follow.

5.1. Electrification of the European Coastal Ferry Fleet

So far, the greening retrofit of coastal ferries has typically been realized on ships of up to 3000 kW main engine power, which sets a practical limit for consideration of retrofits in this paper. Thus, greening by means of electrification would be scaled up to the ferry fleet, whose main features are given in Table 6. On most of the routes served by the examined ferries, the maximum journey between (intermediate) stops takes one hour. However, based on the batteries utilized on the existing electric ferries which may be used as examples, the batteries were sized for two hours of operation in order to have a safety reserve.
The main outcomes of the analysis (at the fleet level) are summarized in Table 7 and Table 8. Considering that three different battery-electric energy supply paths were modeled (see Figure 11, Figure 12, Figure 13 and Figure 14), well-to-wake emissions and costs are expressed as ranges of minimum and maximum values. On the tank-to-wake basis, CO2e, NOx, and PM emissions would be reduced by 100% in comparison to the conventionally powered ferries using MDO, both in 2020 and 2050. The potential for emission reduction slightly decreases if the well-to-wake approach is adopted. The total costs of a retrofit of the entire ferry fleet would be between EUR 48.4 billion and 57.6 billion in 2020 over the next 20 years. Using the 2050 cost estimates, the costs are reduced to between EUR 35.2 billion and 41.1 billion. On average, the total costs of retrofitting a single vessel, including 20 years of operation, could amount to as much as EUR 80.7 million, and could not be less than EUR 49.3 million.

5.2. Electrification of the European Inland Day-Trip and Small Cabin Vessel Fleet

The main features of the inland day-trip and small cabin vessel fleet are reported in Table 9. It was assumed that the capacity of batteries installed on these vessels, whose energy requirements are relatively low, would provide energy sufficient for eight hours of operation. This refers only to the main propulsion. The hotel load was not taken into account. Furthermore, it was assumed that the vessels are usually sailing on fixed routes with intermediate stops.
The main outcomes of the analysis (at the fleet level) are summarized in Table 10 and Table 11. Just as in the case of seagoing ferry electrification, due to the availability of different energy supply paths, well-to-wake emissions and costs are expressed as ranges of minimum and maximum values. From the tank-to-wake perspective, electrification of the small inland passenger ships would result in a 100% reduction in GHG and air pollutant emissions, in comparison to the fossil diesel-powered day-trip and small cabin vessels, both in 2020 and 2050. From the well-to-wake point of view, the potential gains are still very high albeit somewhat smaller. If the entire fleet family is electrified, the total costs would be between EUR 4.4 billion and 4.9 billion based on the 2020 cost levels, and between EUR 3.2 billion and 3.8 billion if 2050 cost estimates are used. As a matter of fact, the costs of retrofitting in 2050 would be lower than the costs associated with fossil diesel propulsion. The maximum average costs of electrification of a single small inland passenger vessel could be EUR 2.2 million in 2020, and could drop below EUR 1.5 million in 2050.

5.3. Retrofit of the European Fleet of Large Inland Dry Cargo Vessels Utilizing Hydrogen in Fuel Cells

Following the trends observed in Section 3, it was assumed that the fleet of inland dry cargo vessels with a length of 110 m and above would be retrofitted to hydrogen fuel cells as the energy converter. The main features of the considered fleet are given in Table 12.
The main outcomes of the analysis are summarized in Table 13 and Table 14. Nine different hydrogen supply paths give ranges of emission reductions and costs on the well-to-wake basis. In comparison to the fossil diesel-powered vessels, GHG and air pollutant emissions would be reduced by 100% from the tank-to-wake perspective, both in 2020 and 2050. The emission reduction potential on the well-to-wake basis is high (but not as high as in the case of electrification). The total costs of the retrofit of the entire fleet segment would be up to 15.1 billion in 2020, and up to EUR 10.9 billion in 2050.

5.4. Retrofit of the European Fleet of Offshore Supply Vessels Utilizing Methanol in Internal Combustion Engines

The examined offshore supply vessels were divided into four groups based on the vessel size (Table 15). The 5000 GT limit was adopted as it was observed that the retrofit would most likely take place on vessels below this gross tonnage. As only a generic operational profile was available (see [34]), the same relative emission reductions were retained for all the considered groups; however, they differ in absolute terms.
The main outcomes of the analysis (at the fleet level) are summarized in Table 16 and Table 17. The potential for reductions in both GHG and air pollutants is much smaller than in the case of the other examined pairings of retrofit technologies and fleet segments. This is particularly the case for utilization of methanol in dual-fuel engines.
On average, the maximum cost of the retrofit of a single vessel (including 20 years of operation with e-methanol) with the single-fuel technology would be as high as EUR 400 million in 2020. The minimum costs would not be less than EUR 113.6 million if the retrofit were performed in 2050. Retrofits based on the dual-fuel methanol engines would result in lower (but still rather high) costs per vessel: EUR 301 million as the maximum, corresponding to 2020 cost levels; and EUR 98.5 million as the minimum, corresponding to the 2050 cost estimates.

5.5. Evaluation of the Effects of Scaling Up of the Observed Greening Trends

Having the results of the analysis available, it may be assessed whether it would be meaningful to follow the observed trends and scale them up to the fleet level. Such an assessment may be based on different parameters: total amount of emissions abated in absolute terms, emissions abated as a share of the total emissions within the fleet segment or at the level of the entire (inland or coastal) fleet, cost-effectiveness of emission reduction, compliance with the environmental targets, etc.
The average minimum and maximum costs of the retrofit of a single vessel, including the energy costs for 20 years of operation (i.e., total costs), are given in absolute terms in Table 18. It may be observed that the costs may be excessively high for some of the “fleet segment–retrofit technology” pairings. However, it may also be noticed that the reduction in TC in 2050 may strongly depend on the considered technology. While the TC of electricity- and hydrogen-based retrofits could be reduced by some 30% in 2050, both methanol-based retrofit solutions show greater cost reduction potential, between approximately 40% and 50%.
However, if the average costs are expressed relative to the total costs of diesel-powered vessels, that is, as the additional costs of a greening retrofit, calculated using Formula (2), the perspective may change; see Table 19. The additional average costs of greening of seagoing ships (costal ferries and OSVs) would remain high. On the other hand, the additional costs of electrification of small inland passenger ships would become attractive already in 2020, while in 2050, the additional costs would be negative—that is, the total costs of diesel-powered day-trip and small cabin vessels would be higher than the total costs of green alternatives. Furthermore, in the most optimistic scenario, the additional costs of the hydrogen fuel cell-based retrofit of large inland dry cargo vessels would be significantly reduced in 2050.
The amount of GHG emissions which would be abated in each of the examined fleet segments if the current trends are followed is calculated using Formula (3) and given in absolute values in Table 20. In total, up to 6.2 mil. t of CO2e could be abated in 2020, and up to 6.5 mil. t in 2050, which corresponds to the GHG emissions of the entire transport sector (rail, road, waterborne, and aviation) of Lithuania or Hong Kong in 2023, and makes up around 0.8% of the GHG emissions of the entire transport sector of the EU27 or around 0.9% of international shipping GHGs emitted in the same year (see [35]). If the total amount of the GHG emissions in each of the segments is normalized by the number of vessels, the perspective may change again: while electrified coastal ferries remain the best performers in 2020, the OSVs retrofitted to single-fuel methanol-ICE show comparable performance in the same year, and considerably exceed the performance of ferries in 2050.
The costs of abatement of 1 t of CO2e over the 20-year period, calculated using Formula (4), are given in Table 21. It should be emphasized that CCO2eabated should be calculated for each energy supply path, as the most cost-intensive retrofit technologies may not be the ones with the lowest GWP (and vice versa). The path M8 would lead to the lowest reduction in GHGs in case of methanol-ICE application in OSVs. The most cost-effective electricity paths are E2 (in 2020) and E3 (in 2050), even though E1 would lead to the largest GHG reduction in absolute terms, both in 2020 and 2050. H6 is the most cost-effective e-hydrogen path in 2020, as well as in 2050, although H1 and H4 result in the largest absolute abatement of CO2e. Finally, the most cost-effective e-methanol paths are M1 (in 2020) and M5 (in 2050) for single-fuel technology, and M5 (both in 2020 and 2050) for dual-fuel technology. Electrification of inland day-trip and small cabin vessels is overall the most cost-effective pairing of retrofit technology and fleet segment. However, both the hydrogen- and methanol-based retrofits examined in the paper show significant potential for improvement in 2050.

6. Regulatory and Policy Landscape

The most important set of statutory requirements aimed at a reduction in air pollutant emissions and greenhouse gases originating from international maritime shipping is found in Annex VI of the MARPOL Convention [1]. The regulations of Annex VI have a rather broad scope, both in terms of emissions addressed (including ozone-depleting substances, sulfur oxides, NOx, PM, CO2, etc.) and ship categories (all ships, with some exceptions related to engine power or ship gross tonnage). With respect to carbon intensity requirements, the most prominent exception refers to ships below 5000 GT. Thus, a number of coastal ships (including the ferry and OSV categories examined in this paper) are not considered by the MARPOL regulations limiting carbon intensity.
The policy documents most relevant to greening of the waterborne transport in Europe are the European Green Deal [36] and the Sustainable and Smart Mobility Strategy (SSMS); see [36]. Both documents provide more specific motivation and objectives for transport. The European Green Deal notes that transport accounts for a quarter of the climate change emissions of the European Union (EU), and this is still growing. To achieve climate neutrality, a 90% reduction in transport emissions is needed by 2050. Road, rail, aviation, and waterborne transport, including inland waterway transportation (IWT), will all have to contribute to this reduction. Furthermore, modal shift is regarded as another tool for achieving ambitions in view of climate change emissions reduction. The European Commission emphasizes that a “substantial part of the 75% of inland freight carried today by road should shift onto rail and inland waterways” [36]. A milestone defined in SSMS on shifting more activity towards more sustainable transport modes is: “Transport by inland waterways and short sea shipping will increase by 25% by 2030 and by 50% by 2050” [37].
The Fit-for-55 package [38] of the European Commission, resulting from the European Green Deal, provided specific measures to contribute to emissions reduction in various ways. The revision of the Renewable Energy Directive (the so-called RED-III) [39] should ensure that the share of renewable fuel will increase in the energy mix in Europe. Another major development is the expansion of the Emission Trading System (ETS) [40]. This expansion concerns the inclusion of seagoing vessels of 5000 GT and above in the existing scheme as well as the setting-up of an additional ETS for buildings, road transport, and additional sectors (the so-called ETS-2). In the ETS-2, the CO2 emissions resulting from fuel supply to inland navigation can optionally be included in the scheme from 2027 onwards. For example, the Dutch government already decided to add fuel supply to inland navigation to this ETS-2 scheme.
The most recent addition to the MARPOL Convention is the so-called IMO Net-zero Framework [41] (approved by the Marine Environment Protection Committee in April 2025 and expected to come into force in 2027). The framework includes requirements for reductions in annual greenhouse gas fuel intensity (GFI) (amount of GHG emitted per unit of energy used) and a global carbon pricing mechanism intended to discourage emitting above GFI thresholds. Nevertheless, the IMO Net-zero Framework will also apply to ships of 5000 GT and above.
Furthermore, upcoming requirements for the monitoring and reporting of the emissions, arising from the Corporate Sustainability Reporting Directive (CSRD) [42], are expected to result in increased transparency, better awareness, and targeted actions to reduce emissions. The CSRD will initiate reporting obligations for a lot of companies. Larger shipping companies themselves will have to provide such sustainability reports while smaller companies in inland navigation or coastal shipping will have to report to their clients. (However, according to the latest Omnibus proposal of the European Commission, the administrative requirements for companies to provide sustainability reports might be decreased. In this case, the implementation of CSRD would be postponed and the scope of affected companies would be reduced [43].)
A specific policy document, “NAIADES III” [44], intended for inland navigation focuses on two core objectives: shifting more freight transport to inland waterways and setting the sector on an irreversible path to zero emissions. For instance, it is stated that “Despite its strong environmental record compared to other transport modes, it is nonetheless crucial that inland waterway transport quickly embarks on a pathway to zero greenhouse gas emissions by 2050, if it is to remain competitive and sustainable”.
More specific targets for inland vessels and seagoing ships can be derived from the latest updates to the EU Taxonomy [45], which aims for zero direct (tailpipe) CO2 emissions [46]. However, if achieving zero direct CO2 emissions is technologically and economically not feasible, the EU Taxonomy refers to a methodology for calculating CO2e/MJ values based on the FuelEU Maritime methodology [47]. If it is technologically and economically not feasible for vessels to achieve zero direct (tailpipe) CO2 emissions, the criteria from the EU Taxonomy Regulation apply, effective from 2025 onwards for vessels, as given in Table 22 in comparison to the fossil diesel baseline (the reference value for the CO2e emission of fossil fuel is 95.1 gCO2e/MJ). Furthermore, seagoing vessels will also need to show that their Energy Efficiency Existing Ship Index (EEXI) is 10% lower as compared to the baseline. Note that the value for 2050 applies to inland vessels only.
Regarding air pollutant emissions, it is defined that engines used on inland vessels need to comply with emission limits outlined in Annex II to the EU Regulation [48] (including vessels meeting those limits without type-approved solutions such as through after-treatment). Seagoing vessels need to comply with the corresponding regulations of the MARPOL convention.
Similar to FuelEU Maritime and, to some extent, the EU Taxonomy, the RED-III implementation can follow a well-to-wake approach based on the CO2e emissions in g/MJ. In case a Member State follows such an approach, the reduction target for transport to be achieved at the national level shall be 14.5% by the year 2030. This concerns a relative CO2e reduction in g/MJ of energy supplied to the transport market. However, another approach is also possible for implementing RED-III at the Member State level. This second approach focuses on the share of renewable/biofuels in the total fuel mix, which must be at least 29% in 2030. Additionally, multipliers can be taken into account for certain types of energy. Moreover, it does not impose any limit on the total energy consumption [39].
The greatest elaboration roadmap on energy transition and emission reduction for inland vessels was published by the Central Commission for Navigation on the Rhine (CCNR); see [49]. It provides an elaboration of the three main emission reduction goals which have been agreed by the CCNR Member States (Belgium, France, Germany, the Netherlands, Switzerland) and put forward in the “Mannheim Declaration” [50]:
  • Reduce greenhouse gas emissions by 35% compared with 2015 by 2035;
  • Reduce pollutant emissions by at least 35% compared with 2015 by 2035;
  • Largely eliminate greenhouse gases and other pollutants by 2050 (at least 90% reduction).
This CCNR Roadmap presents an assessment of the possible energy carriers and technologies, “transition pathways”, to reach these objectives, an assessment of the associated capital expenditures and operational costs, and the implementation plan. The implementation plan consists of regulatory, voluntary, and financial measures.
Regarding the seagoing vessels, the ships of gross tonnage of 5000 GT and above are already subject to the Monitoring, Reporting and Verification (MRV) regulation [51]. Based on MRV, the FuelEU Maritime will be also implemented, and these vessels will also become part of ETS. This means that these vessels will have to use an increasing share of renewable energy and at the same time they will have to purchase emission rights to be allowed to emit CO2 emissions. The CO2 costs for society will thus be partly internalized. Moreover, the emission rights will be capped, and the volume of CO2 emissions auctioned each year will decrease over time, resulting in a steady decline in the overall emissions under the ETS scope [46].
Based on the current regulatory and policy landscape it can be concluded that there are not many direct measures specifically aimed at owner/operators of inland vessels and smaller coastal vessels (below 5000 GT) to reduce emissions. However, there are clear possibilities to use the existing legal framework to provide supporting measures for the transition of the existing fleet. This concerns in particular the implementation of RED-III and ETS. Moreover, MRV will be expanded to smaller seagoing vessels (from 400 GT upwards) which can be seen as a first step towards the future integration of these smaller seagoing vessels in the current EU ETS scheme.
However, the decision making about these measures lies mainly at the level of the individual Member States of the European Union, which makes it even more challenging. At the time of writing of this paper, the Dutch government is setting the example by providing the RED-III-specific targets for fuel supply to seagoing vessels and specific targets for inland vessels as regards the well-to-wake reduction in the average CO2e emissions per MJ of supplied energy. Furthermore, the ETS-2 opt-in is used to regulate the CO2 emissions from fossil fuel supplied to inland navigation in the Netherlands. Revenues from the ETS-2 (from auctioning the added CO2 emission allowances) will be used to feed a fund to support the fleet to in the transition to (near) zero-emission energy carriers and solutions. However, it is yet to be seen if other Member States of the EU follow this example. An uncoordinated implementation approach regarding RED-III and opt-in decisions for ETS-2 may make the EU policy to reduce the greenhouse gas emissions much less effective and efficient.

7. Conclusions

This paper explored the possible improvement of environmental performance (“greening”) of inland and coastal fleets by means of retrofitting. Considering that most of the vessels belonging to these fleets are not within the scope of the major international policies and regulations, emission reductions achieved by retrofitting would represent a contribution to the greening of waterborne transport, additional to the goals put forward by, e.g., the IMO. The focus was on specific fleet segments (“fleet families”), which were selected based on the trends observed in greening of shipping by retrofitting in Europe in the period 2008–2026: small inland passenger ships, inland dry cargo vessels of length 110 m and longer, seagoing ferries, and offshore supply vessels. Therefore, the paper shows how much can be achieved in terms of emission abatement (greenhouse gases, nitrogen oxides, and particulate matter) if the current trends are followed and scaled up to the fleet level, and how that compares to the European environmental ambitions. In addition, the costs associated with the examined retrofitting were estimated. The study comprised different scenarios. These were performed both on the well-to-wake and tank-to-wake bases. Furthermore, the analysis was conducted using the values for emissions and costs which applied in 2020, as well as the values estimated for 2050. The analysis was based on state-of-the-art technologies, which have reached a high technology readiness level (TRL); future developments of technologies, which are presently at low or moderate TRL stages, could yield different trends. Throughout the analysis, only fully renewable energy sources were considered.
The outcomes of the analysis show that the concept of “greening” may indeed come in different “shades of green”. While in most of the examined cases, assessment of emissions on the tank-to-wake basis resulted in 100% GHG emission reductions (except in the case of utilization of methanol in dual-fuel engines), the emission reduction potential decreases if the well-to-wake perspective is adopted. For some of the examined retrofit technologies such decreases could be significant: the use of single-fuel methanol internal combustion engines on offshore supply vessels could reduce GHG emissions by not more than 49% (in comparison to conventional, MDO-powered OSVs); on the tank-to-wake basis, the same technology would result in net zero GHG emissions. Furthermore, when different energy supply paths are considered, it becomes impossible to pinpoint single emission reduction values common for a specific technology; instead, it is necessary to express the emission reduction potentials in terms of ranges of values. While the ranges are relatively small in both considered electrification cases, they increase in the case of hydrogen-based retrofits, and become very wide in the case of methanol-based retrofits.
Finally, it may be assessed whether or not it would be meaningful to follow the observed trends and scale them up to the fleet level. If the trends are consistently followed through, the absolute amount of abated GHG emissions could correspond to the GHG emissions of the entire transport sector of a (smaller) high-income country. Electrification of the coastal ferry fleet seems particularly worthwhile, especially from the point of view of the total amount of GHGs abated, which is considerably higher than in other examined fleet segments. Nevertheless, electrification has practical limitations as it is suitable only for ships carrying “light cargo” (i.e., passengers with or without vehicles), and which operate on fixed routes with sufficient shore-side charging points. Even so, in practice, the speed of the electrified ferries is reduced in comparison to conventionally powered ships, to avoid the batteries being disproportionally large. On the other side of the spectrum, the retrofitting of offshore supply vessels based on utilization of methanol in internal combustion engines appears to be expensive and cost-inefficient in terms of emissions reduction. Nevertheless, even this technology–vessel pairing may show strong performance in terms of possible reductions in GHG emissions per vessel. The assessment of the effectiveness of hydrogen fuel cell-based retrofitting of large inland dry cargo vessels is complex as well, as it may become much more attractive in the future. All the considered solutions result in significant reductions in air pollutants, except for the use of methanol in internal combustion engines of offshore supply vessels, where PM emissions remain considerable.
The results, however, do not preclude the application of the examined retrofit technologies to other fleet segments, which may operate in different market and environmental conditions, and thus may have different operational profiles and energy requirements. Therefore, future research could investigate pairings of the same fleet segments with different greening technologies and vice versa, which may lead to novel insights and, consequently, policy recommendations. Specifically, it would be worthwhile exploring the effects of incorporating inland vessels and smaller coastal ships in major decarbonization policies. Furthermore, the effectiveness of combining several greening technologies in retrofitting of a single vessel category could be analyzed in a more systematic manner.
Considering the research presented in this study, as normally happens in life, some trends are worth following while some roads are better not taken. To distinguish between the two, when it comes to greening of shipping, a careful consideration of operational requirements should precede the decision on which retrofit technology should be adopted. This may not suffice though, because (again, as in life) the measure of success depends on the adopted metrics. Setting the amount or the share of emissions reduced as a target without taking the cost perspective into consideration may lead to ineffective policies and disincentivize greening efforts.

Supplementary Materials

The following supporting information can be downloaded at: https://www.synergetics-project.eu/wp-content/uploads/2023/12/T2.1_Pilot_Database_for_external_sharing_V2.0.xlsx (accessed on 12 May 2025).

Author Contributions

Conceptualization, I.B.; methodology, F.D.-W., E.F., B.F., A.G. and F.T.; validation, I.B., E.F., B.F., A.G., J.J. and M.Q.; formal analysis, I.B., F.D.-W. and F.T.; investigation, I.B., F.D.-W., E.F., N.K., M.Q. and F.T.; resources, B.F., F.D.-W., A.G., N.K. and F.T.; writing—original draft preparation, I.B., F.D.-W., A.G., M.Q. and F.T.; writing—review and editing, I.B., F.D.-W., E.F., J.J., A.G. and M.Q.; visualization, J.J.; supervision, I.B., E.F. and B.F.; project administration, B.F.; funding acquisition, B.F. All authors have read and agreed to the published version of the manuscript.

Funding

The research herein presented is funded by the Horizon Europe Programme of the European Union (under grant agreement No. 101096809) and by the Swiss State Secretariat for Education, Research, and Innovation (SERI).

Institutional Review Board Statement

Not applicable.

Informed Consent Statement

Not applicable.

Data Availability Statement

The original contributions presented in this study are included in the article/Supplementary Materials. Further inquiries can be directed to the corresponding author.

Conflicts of Interest

The authors declare no conflicts of interest. The funders had no role in the design of the study; in the collection, analyses, or interpretation of data; in the writing of the manuscript; or in the decision to publish the results.

Abbreviations

The following abbreviations are used in this manuscript:
CCNRCentral Commission for the Navigation of the Rhine
CSRDCorporate Sustainability Reporting Directive
EUEuropean Union
ETSEmission Trading System
FCFuel cell
GFIGreenhouse gas fuel intensity
GHGGreenhouse gas
GTGross tonnage
GWPGlobal warming potential
ICEInternal combustion engine
Li-NMCLithium nickel manganese cobalt oxides
LT-PEMLow-temperature proton-exchange membrane
MDOMarine diesel oil
MRVMonitoring, Reporting, and Verification
OSVOffshore supply vessel
SSMSSustainable and Smart Mobility Strategy
TRLTechnology readiness level

Appendix A

Table A1. Supply path configurations used in the analysis.
PathEnergy SourceDecentralized ProcessEnergy Carrier/Mode of TransportCentralized Process
E1Offshore wind Electricity/grid
E2Onshore wind Electricity/grid
E3PhotovoltaicsElectricity/grid
H1Offshore wind Electricity/gridElectrolysis
H2Offshore wind ElectrolysisHydrogen/vessel
H3Offshore wind ElectrolysisHydrogen/pipeline
H4Onshore wind Electricity/gridElectrolysis
H5Onshore wind ElectrolysisHydrogen/vessel
H6Onshore wind ElectrolysisHydrogen/pipeline
H7PhotovoltaicsElectricity/gridElectrolysis
H8PhotovoltaicsElectrolysisHydrogen/vessel
H9PhotovoltaicsElectrolysisHydrogen/pipeline
M1Offshore wind Electricity/gridMethanol synthesis
M2Offshore wind Methanol synthesisMethanol/vessel
M3Offshore wind Methanol synthesisMethanol/lorry
M4Onshore wind Electricity/gridMethanol synthesis
M5Onshore wind Methanol synthesisMethanol/vessel
M6Onshore wind Methanol synthesisMethanol/lorry
M7PhotovoltaicsElectricity/gridMethanol synthesis
M8PhotovoltaicsMethanol synthesisMethanol/vessel

Appendix B

Table A2. Costs of propulsion systems and energy for retrofitted vessels and fossil diesel-powered vessels in 2020.
Fleet SegmentCosts of New SystemMinimum Cost
of Energy per Year
Maximum Cost
of Energy per Year
Cost of Diesel SystemCost of Diesel
per Year
[EUR][EUR][EUR][EUR][EUR]
Coastal ferries (<1000) a1,639,9001,546,7561,857,119585,871821,376
Coastal ferries (1000–1999) a3,758,2003,544,7404,256,0071,342,6561,882,368
Coastal ferries (2000–2999) a5,639,6005,319,2796,386,6162,014,8052,824,704
Inland day-trip and small cabin vessels a743,02662,93673,700400,86052,969
Inland dry cargo vessels, L ≥ 110 m b5,695,557497,657953,3931,398,996332,528
OSVs (<2000 GT) c3,764,9615,800,26110,185,2282,790,3471,105,328
OSVs (<2000 GT) d4,576,8654,480,1927,574,7262,790,3471,105,328
OSVs (2000–3000 GT) c5,010,9247,719,77913,555,8913,713,7751,471,121
OSVs (2000–3000 GT) d6,091,5175,962,85110,081,4793,713,7751,471,121
OSVs (3000–4000 GT) c7,029,15610,829,04719,015,7485,209,5592,063,640
OSVs (3000–4000 GT) d8,544,9758,364,48714,141,9595,209,5592,063,640
OSVs (4000–5000 GT) c7,860,92512,110,46221,265,9075,826,0132,307,833
OSVs (4000–5000 GT) d9,556,1149,354,26815,815,3965,826,0132,307,833
a Battery-electric propulsion with renewable electricity. b e-hydrogen in fuel cells. c e-methanol in single-fuel internal combustion engines. d e-methanol in dual-fuel internal combustion engines.
Table A3. Costs of propulsion systems and energy for retrofitted vessels and fossil diesel-powered vessels in 2050.
Fleet SegmentCosts of New SystemMinimum Cost
of Energy per Year
Maximum Cost
of Energy per Year
Cost of Diesel SystemCost of Diesel
per Year
[EUR][EUR][EUR][EUR][EUR]
Coastal ferries (<1000) a1,547,2101,107,6501,306,682585,871824,456
Coastal ferries (1000–1999) a3,545,7802,538,4282,994,5551,342,6561,889,427
Coastal ferries (2000–2999) a5,320,8403,809,1964,493,6662,014,8052,835,297
Inland day-trip and small cabin vessels a668,72439,60451,856400,86069,267
Inland dry cargo vessels, L ≥ 110 m b5,142,821310,201633,3641,394,371434,845
OSVs (<2000 GT) c3,393,2352,776,4496,214,7442,790,3471,109,473
OSVs (<2000 GT) d4,123,6832,347,6954,774,1492,790,3471,109,473
OSVs (2000–3000 GT) c4,516,1803,695,2778,271,4303,713,7751,476,638
OSVs (2000–3000 GT) d5,488,3613,124,6336,354,0903,713,7751,476,638
OSVs (3000–4000 GT) c6,335,1455,183,61011,602,8835,209,5592,071,378
OSVs (3000–4000 GT) d7,698,8884,383,1308,913,3035,209,5592,071,378
OSVs (4000–5000 GT) c7,084,7915,796,99412,975,8685,826,0132,316,487
OSVs (4000–5000 GT) d8,609,9074,901,7929,968,0265,826,0132,316,487
a Battery-electric propulsion with renewable electricity. b e-hydrogen in fuel cells. c e-methanol in single-fuel internal combustion engines. d e-methanol in dual-fuel internal combustion engines.

References

  1. International Maritime Organization. International Convention for the Prevention of Pollution from Ships, 1973, as Modified by the Protocol of 1978 (MARPOL) as Amended; International Maritime Organization: London, UK, 2021. [Google Scholar]
  2. Handl, G. Decarbonising the Shipping Industry: A Status Report. Int. J. Mar. Coast. Law 2023, 38, 730–791. [Google Scholar] [CrossRef]
  3. Ehlers, P. A Success Story? Fifty Years of MARPOL. Int. J. Mar. Coast. Law 2024, 40, 1–56. [Google Scholar] [CrossRef]
  4. Bačkalov, I.; Frank, E.; Friedhoff, B.; Grasman, A.; Jasa, J.; Kreukniet, N.; Quispel, M. Exploration and synchronization of greening of shipping by means of retrofit: The SYNERGETICS perspective. In Transport Transitions: Advancing Sustainable and Inclusive Mobility. TRA Conference 2024. Lecture Notes in Mobility; McNally, C., Carroll, P., Martinez-Pastor, B., Ghosh, B., Efthymiou, M., Valantasis-Kanellos, N., Eds.; Springer: Cham, Switzerland, 2025; Volume 3, pp. 687–693. [Google Scholar]
  5. SYNERGETICS Website. Available online: https://www.synergetics-project.eu/downloads/ (accessed on 12 May 2025).
  6. Martínez-López, A.; Marrero, A.; Romero-Filgueira, A. Assessment of emerging technologies for high-speed-crafts decarbonization under the European Union regulation. Res. Transp. Econ. 2024, 108, 101497. [Google Scholar] [CrossRef]
  7. Laasma, A.; Otsason, R.; Tapaninen, U.; Hilmola, O.-P. Evaluation of alternative fuels for coastal ferries. Sustainability 2022, 14, 16841. [Google Scholar] [CrossRef]
  8. Bergek, A.; Bjørgum, Ø.; Hansen, T.; Hanson, J.; Steen, M. Sustainability transitions in coastal shipping: The role of regime segmentation. Transp. Res. Interdiscip. Perspect. 2021, 12, 100497. [Google Scholar] [CrossRef]
  9. Dong, T.; Alamoush, A.; Schönborn, A.; Ghaforian Masodzadeh, P.; Park, C.; Park, H.-S.; Vakili, S.; Bilgili, L.; Ballini, F.; Ölcer, A.I. Roadmap for the Decarbonization of Domestic Passenger Ferries in the Republic of Korea. Sustainability 2025, 17, 1545. [Google Scholar] [CrossRef]
  10. Ahmed, S.; Li, T.; Li, S.Y.; Chen, R. Comparative life cycle impact assessment of offshore support vessels powered by alternative fuels for sustainable offshore wind operations using machine learning. J. Ocean. Eng. Sci. 2023, in press. [Google Scholar] [CrossRef]
  11. Perčić, M.; Jovanović, I.; Fan, A.; Vladimir, N. Design of alternative power systems for ferries operating in the Adriatic Sea. Ocean Eng. 2025, 319, 120246. [Google Scholar] [CrossRef]
  12. Chatelier, J.M. Entering a new era for electrical vessels on inland waterways. Ship Sci. Technol. 2023, 16, 21–32. [Google Scholar] [CrossRef]
  13. Otsason, R.; Tapaninen, U. Decarbonizing City Water Traffic: Case of Comparing Electric and Diesel-Powered Ferries. Sustainability 2023, 15, 16170. [Google Scholar] [CrossRef]
  14. Teske, T.; Fitz, A.; Schwedt, T.; Baetcke, L.; Ehlers, S. Electrifying inland waterway transport—A case study for Germany. Ship Technol. Res. 2025, 1–14. [Google Scholar] [CrossRef]
  15. Chandrasekar, A.; Godjevac, M.; Littler, B. Assessment of the Scalability of (Hydrogen) Retrofit Solutions as a Greening Solution Across the Inland Waterway Fleet. Future Proof Shipping White Paper. 2023. Available online: https://futureproofshipping.com/whitepapers/2023/assessment-of-the-scalability-of-hydrogen-retrofit-solutions-as-a-greening-solution-across-the-inland-waterway-fleet/ (accessed on 7 March 2025).
  16. Thalmann, F.; Frank, E.; Moser-Stenström, C.; Sanchen, A. SYNERGETICS Deliverable 1.2: Report on Suitability of Identified Technical Solutions. 2024. Available online: https://www.synergetics-project.eu/downloads/ (accessed on 17 February 2025).
  17. Liebich, A.; Fröhlich, T.; Münter, D.; Fehrenbach, H.; Giegrich, J.; Köppen, S.; Dünnebeil, F.; Knörr, W.; Biemann, K.; Simon, S.; et al. System Comparison of Storable Energy Carriers from Renewable Energies; Federal Environment Agency (Umweltbundesamt): Dessau-Rosslau, Germany, 2021. [Google Scholar]
  18. Grasman, A.; Gaillarde, G. Sustainable Power Portal. MARIN Report 141. 2024. Available online: https://www.marin.nl/en/publications/sustainable-power-portal (accessed on 17 February 2025).
  19. Ramne, B.; Puljic, A.; Thompson, O.; Molander, P. SYNERGETICS Deliverable 3.17 Evaluation Report on Application of Methanol: Compression Ignited vs. Dual Fuel. 2024. Available online: https://www.synergetics-project.eu/downloads/ (accessed on 17 February 2025).
  20. EN 590:2022; Automotive fuels—Diesel—Requirements and test methods. European Committee for Standardization: Brussels, Belgium, 2022.
  21. International Maritime Organization. Third IMO GHG Study 2014; International Maritime Organization: London, UK, 2014. [Google Scholar]
  22. International Maritime Organization. Fourth IMO GHG Study 2020; International Maritime Organization: London, UK, 2020. [Google Scholar]
  23. Verbeek, R.P.; Verbeek, M.M.J.F. LNG for Trucks and Ships: Fact Analysis Review of Pollutant and GHG Emissions; TNO: Delft, The Netherlands, 2014. [Google Scholar]
  24. Zijlema, P.J. The Netherlands: List of Fuels and Standard CO2 Emission Factors; Netherlands Enterprise Agency: The Hague, The Netherlands, 2024. [Google Scholar]
  25. ISO 14083:2023; Greenhouse Gases—Quantification and Reporting of Greenhouse Gas Emissions Arising from Transport Chain Operations. International Organization for Standardization: Geneva, Switzerland, 2023.
  26. Dahlke-Wallat, F.; Friedhoff, B.; Karaarslan, S.; Martens, S.; Quispel, M. Assessment of Technologies in View of Zero-Emission IWT Edition 2. Part of the Overarching Study “Financing the Energy Transition Towards a Zero-Emission Europe—An IWT Sector”; Central Commission for the Navigation of the Rhine: Strasbourg, France, 2021. [Google Scholar]
  27. Stoffregen, A.; Baumann, M.; Hengstler, J.; Whitehouse, S. 1st Life Cycle GHG Emission Study on the Use of Alternative Marine Fuels; Sphera Solutions GmbH: Leinfelden-Echterdingen, Germany, 2021. [Google Scholar]
  28. Taljegard, M.; Brynolf, S.; Grahn, M.; Andersson, K.; Johnson, H. Cost-Effective Choices of Marine Fuels in a Carbon-Constrained World: Results from a Global Energy Model. Environ. Sci. Technol. 2014, 48, 12986–12993. [Google Scholar] [CrossRef]
  29. Kersey, J.; Popovich, N.D.; Phadke, A.A. Rapid battery cost declines accelerate the prospects of all-electric interregional container shipping. Nat. Energy 2022, 7, 664–674. [Google Scholar] [CrossRef]
  30. Kistner, L.; Bensmann, A.; Hanke-Rauschenbach, R. Potentials and limitations of battery-electric container ship propulsion systems. Energy Convers. Manag. X. 2024, 21, 100507. [Google Scholar] [CrossRef]
  31. E-Ferry—Prototype and Full-Scale Demonstration of Next Generation 100% Electrically Powered Ferry for Passengers and Vehicles. Available online: https://cordis.europa.eu/project/id/636027 (accessed on 13 May 2025).
  32. van der Geest, W.; Menist, M. Op Weg Naar Een Klimaatneutrale Binnenvaart Per 2050; Panteia: Zoetermeer, The Netherlands, 2019. [Google Scholar]
  33. DG Reform. Green Shipping in the Dutch State Fleet. Directorate-General for Structural Reform Support. 2021. Available online: https://reform-support.ec.europa.eu/publications-0/green-shipping-dutch-state-fleet_en (accessed on 10 March 2025).
  34. Lindstad, E.; Eskeland, G.; Rialland, A. Batteries in offshore support vessels—Pollution, climate impact and economics. Transp. Res. Part D Transp. Environ. 2017, 50, 409–417. [Google Scholar] [CrossRef]
  35. Crippa, M.; Guizzardi, D.; Pagani, F.; Banja, M.; Muntean, M.; Schaaf, E.; Becker, W.; Monforti-Ferrario, F.; Quadrelli, R.; Risquez Martin, A.; et al. GHG Emissions of All World Countries—JRC/IEA 2024 Report; EDGAR: Luxembourg, 2024; JRC138862. [CrossRef]
  36. The European Green Deal. Available online: https://commission.europa.eu/strategy-and-policy/priorities-2019-2024/european-green-deal_en (accessed on 13 May 2025).
  37. European Commission. Sustainable and Smart Mobility Strategy—Putting European Transport on Track for the Future; European Commission: Brussels, Belgium, 2020. [Google Scholar]
  38. Fit for 55. Available online: https://www.consilium.europa.eu/en/policies/fit-for-55/ (accessed on 13 May 2025).
  39. European Union. Directive (EU) 2023/2413 of the European Parliament and of the Council. In Official Journal of the European Union; European Union: Brussels, Belgium, 2023. [Google Scholar]
  40. EU Emissions Trading System. Available online: https://climate.ec.europa.eu/eu-action/eu-emissions-trading-system-eu-ets_en (accessed on 13 May 2025).
  41. International Maritime Organization. Circular Letter No. 5005; International Maritime Organization: London, UK, 2025. [Google Scholar]
  42. European Union. Directive (EU) 2022/2464 of the European Parliament and of the Council. In Official Journal of the European Union; European Union: Brussels, Belgium, 2022. [Google Scholar]
  43. Commission Simplifies Rules on Sustainability and EU Investments, Delivering over €6 Billion in Administrative Relief. Available online: https://finance.ec.europa.eu/publications/commission-simplifies-rules-sustainability-and-eu-investments-delivering-over-eu6-billion_en (accessed on 14 May 2025).
  44. European Commission. NAIADES III: Boosting Future-Proof European Inland Waterway Transport; European Commission: Brussels, Belgium, 2021. [Google Scholar]
  45. EU Taxonomy for Sustainable Activities. Available online: https://finance.ec.europa.eu/sustainable-finance/tools-and-standards/eu-taxonomy-sustainable-activities_en (accessed on 14 May 2025).
  46. European Union. Commission delegated Regulation (EU) 2023/2485. In Official Journal of the European Union; European Union: Brussels, Belgium, 2023. [Google Scholar]
  47. European Union. Regulation (EU) 2023/1805 of the European Parliament and of the Council. In Official Journal of the European Union; European Union: Brussels, Belgium, 2023. [Google Scholar]
  48. European Union. Regulation (EU) 2016/1628 of the European Parliament and of the Council. In Official Journal of the European Union; European Union: Brussels, Belgium, 2016. [Google Scholar]
  49. Central Commission for Navigation of the Rhine. CCNR Roadmap for Reducing Inland Navigation Emissions; Central Commission for Navigation of the Rhine: Strasbourg, France, 2022. [Google Scholar]
  50. Central Commission for Navigation of the Rhine. 150 Years of the Mannheim Act—The Driving Force Behind Dynamic Inland Navigation; Central Commission for Navigation of the Rhine: Strasbourg, France, 2018. [Google Scholar]
  51. European Union. Regulation (EU) 2015/757 of the European Parliament and of the Council. Reducing emissions from the shipping sector. In Official Journal of the European Union; European Union: Brussels, Belgium, 2015. [Google Scholar]
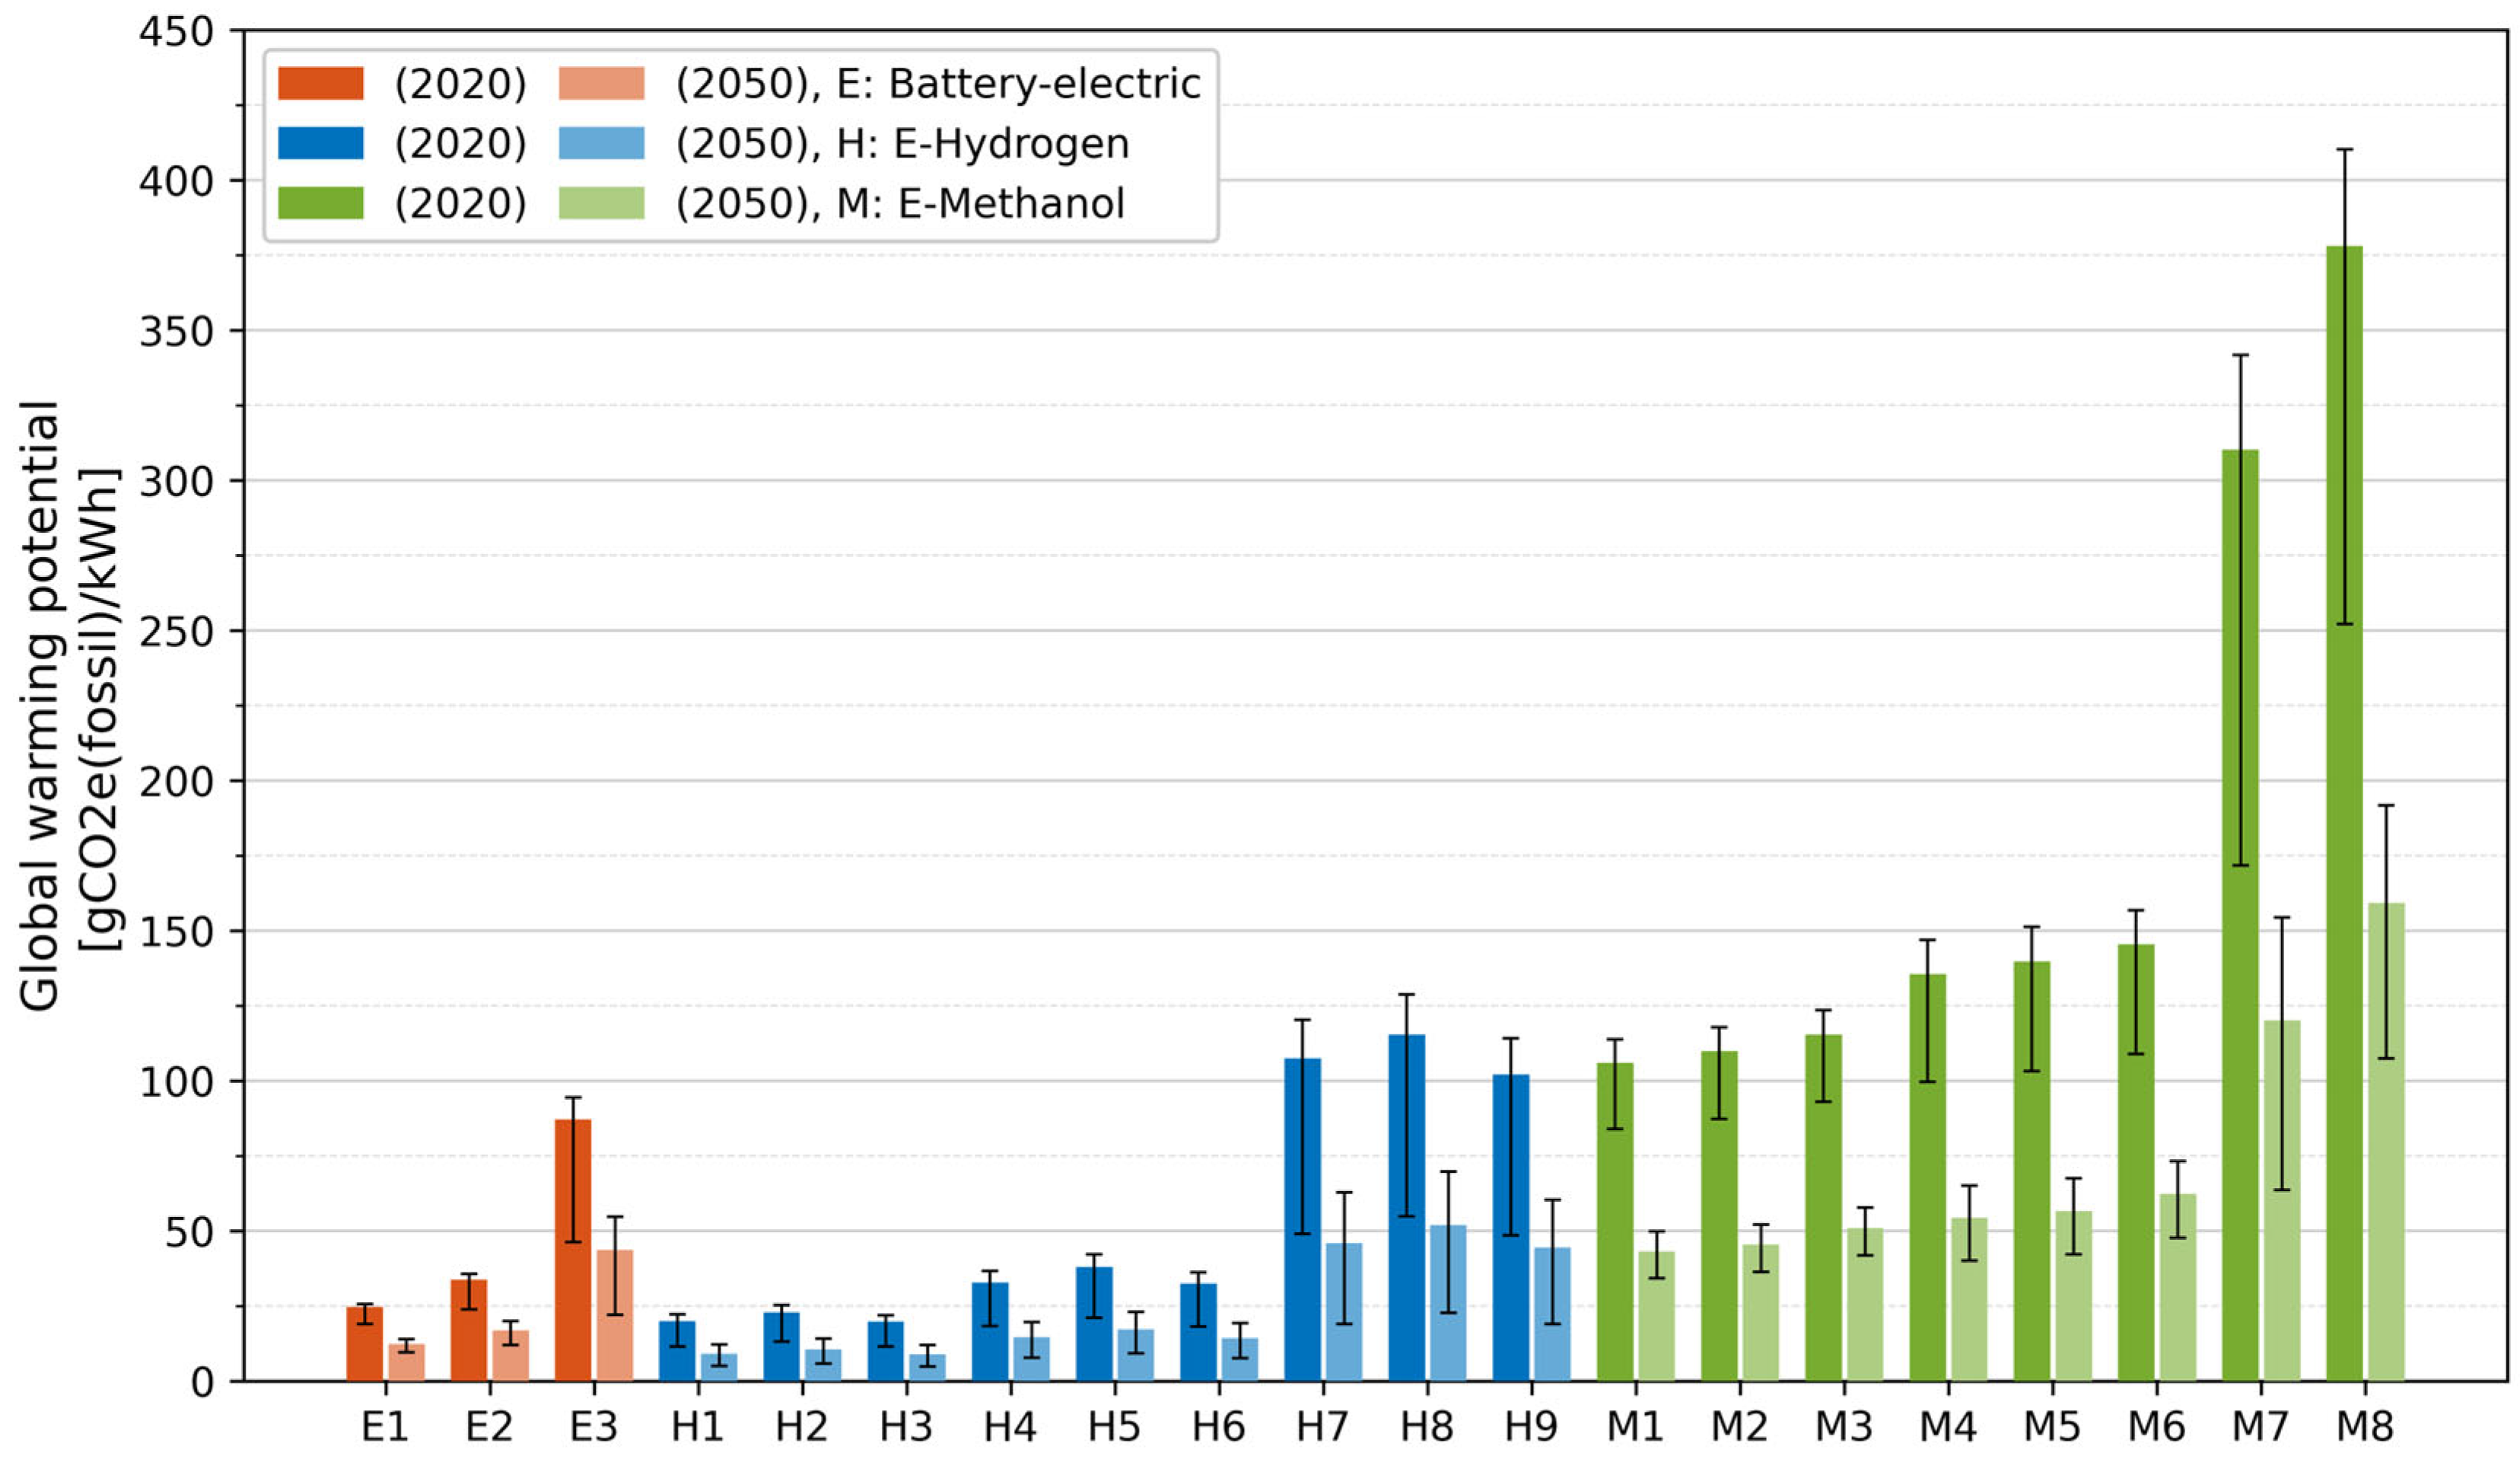
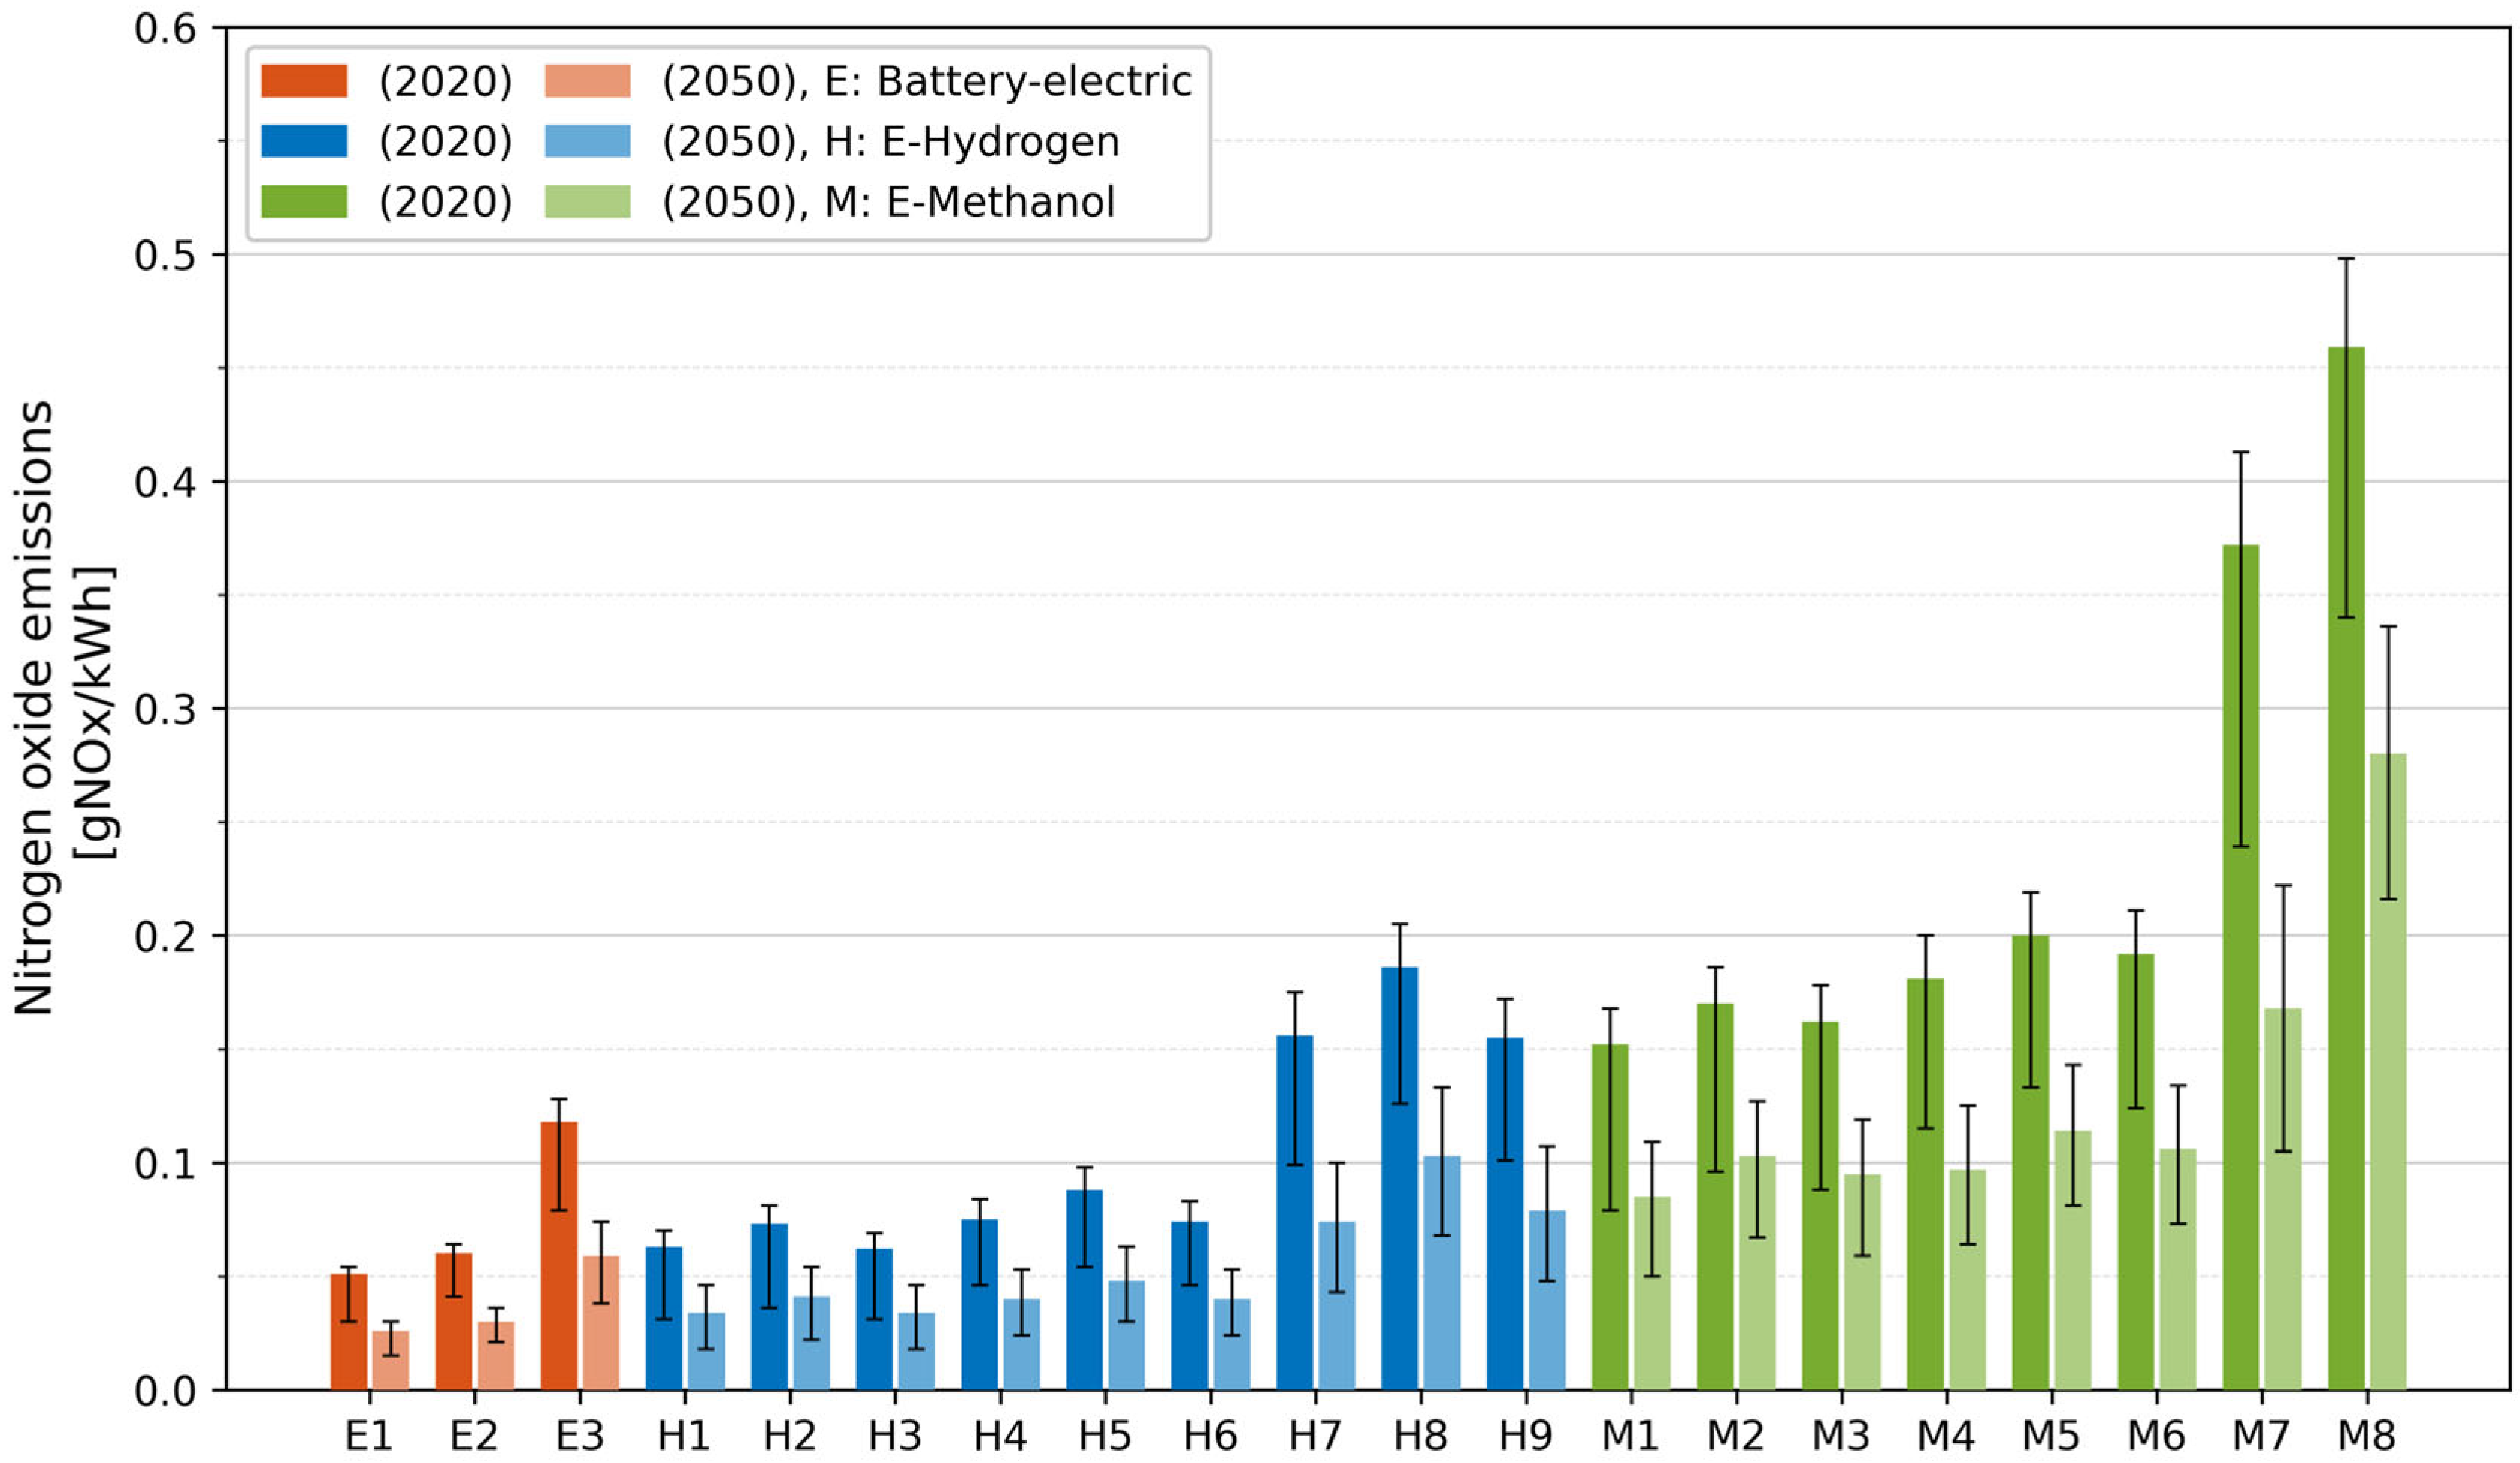
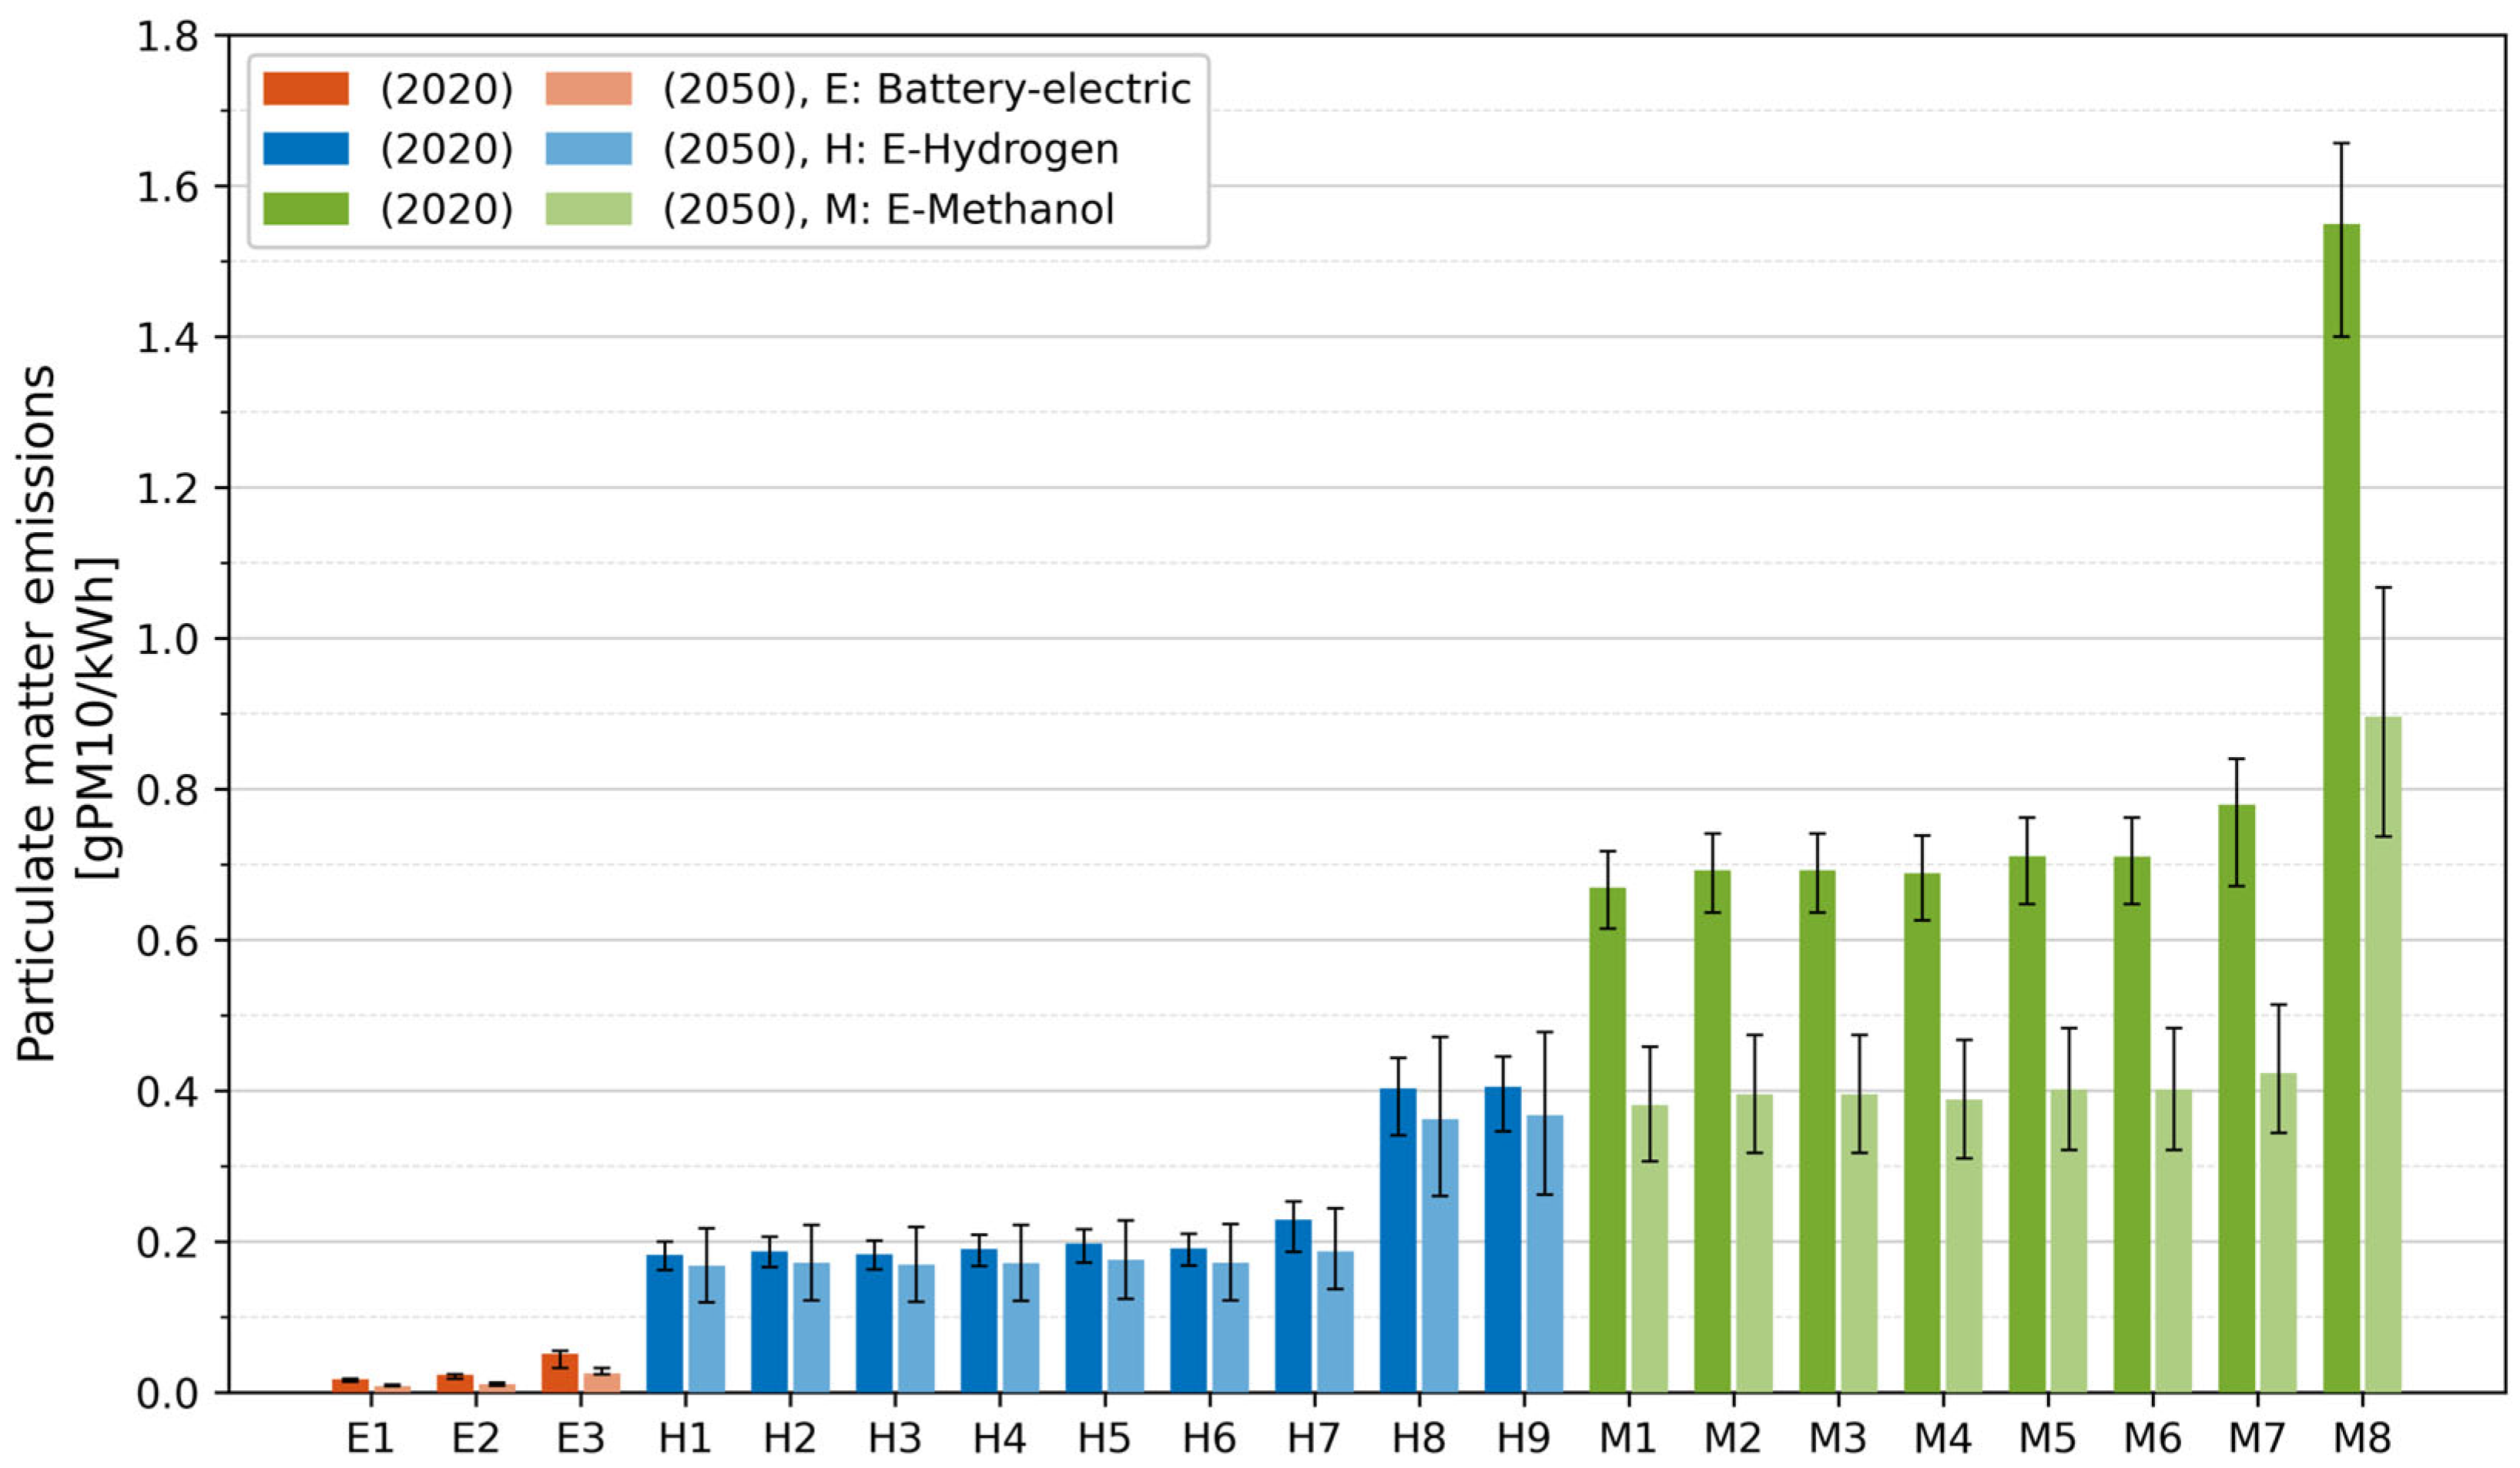
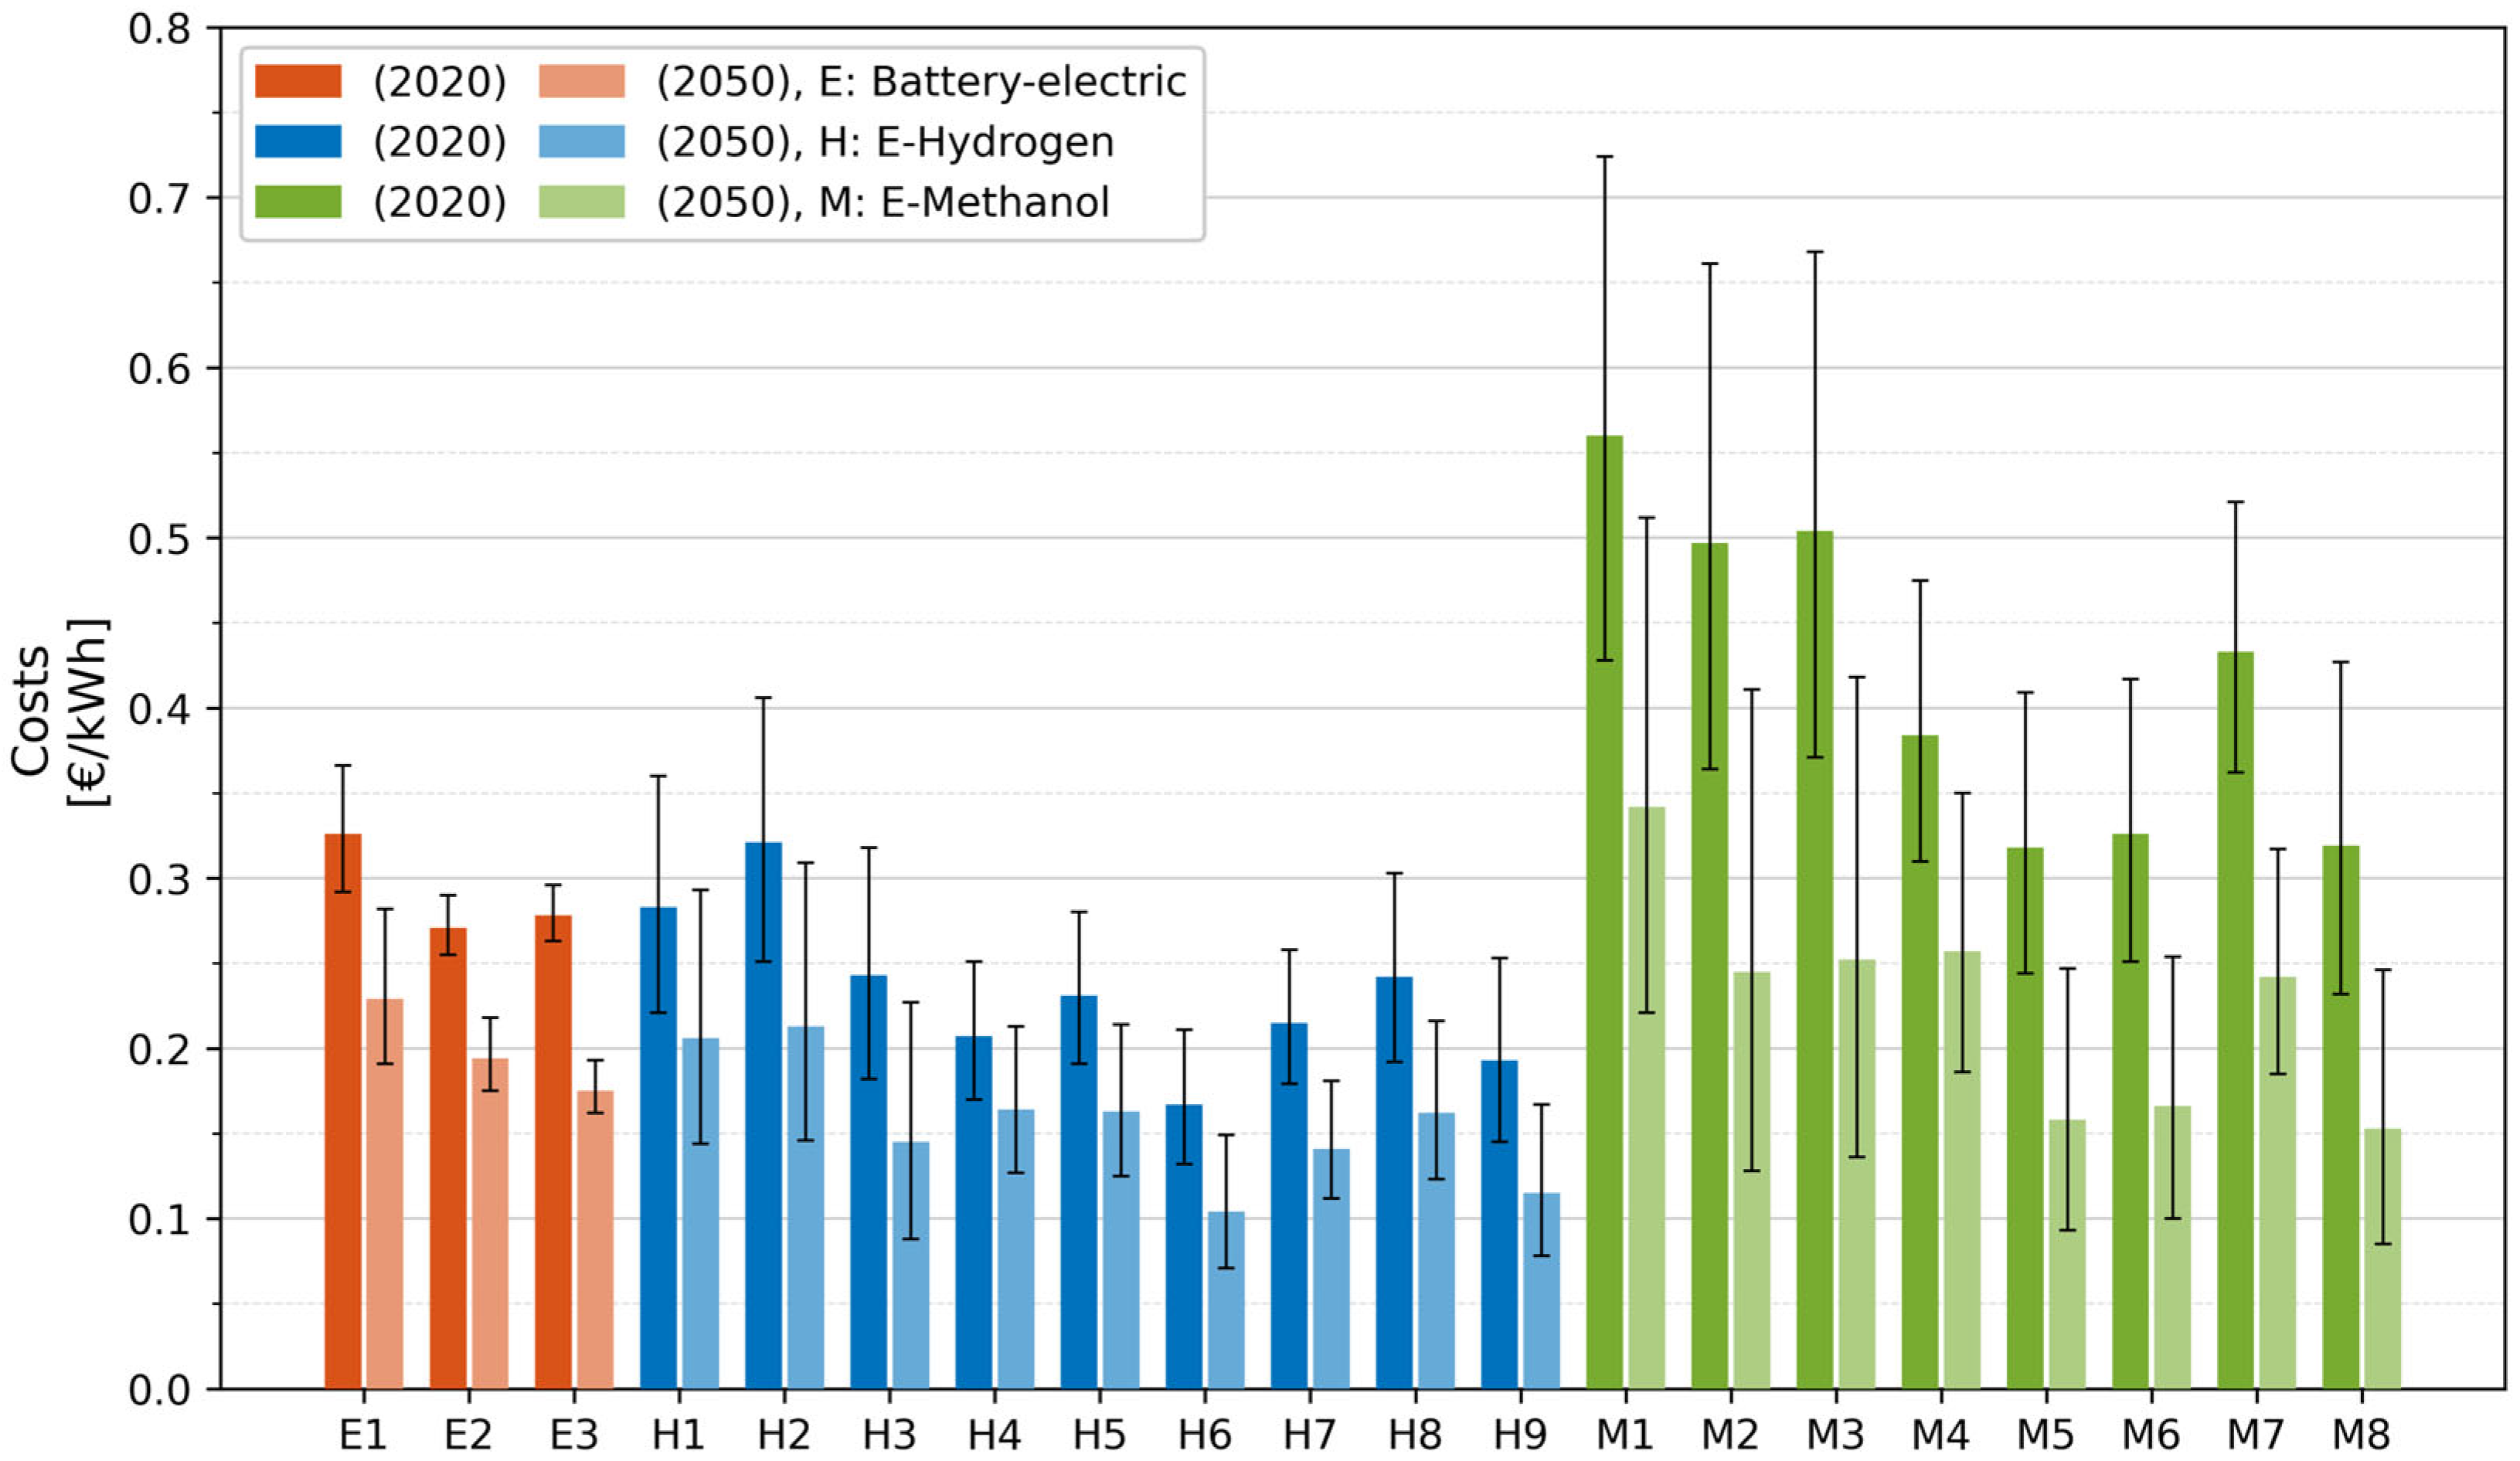
Figure 1. Composition of the Pilot database: greening pilots in inland navigation and coastal shipping in Europe. Size of the blue and orange rectangles is proportional to the share of vessel types in the Pilot database.
Sustainability 17 05154 g001
Figure 2. Share of greening pilots in Europe performed on newbuild ships and by means of retrofitting on (a) inland vessels and (b) coastal ships.
Sustainability 17 05154 g002
Figure 3. Innovative technologies used in greening pilots in Europe performed on (a) inland vessels and (b) coastal ships.
Sustainability 17 05154 g003
Figure 4. Innovative technologies used in greening pilots in Europe performed on (a) inland vessels and (b) coastal ships, whereby greening was performed by means of retrofitting.
Sustainability 17 05154 g004
Figure 5. Electrification pilots on inland vessels in Europe, broken down by ship type and performed as (a) both newbuild and retrofit projects and (b) retrofit projects only.
Sustainability 17 05154 g005
Figure 6. Electrification pilots on coastal ships in Europe, broken down by ship type and performed as (a) both newbuild and retrofit projects and (b) retrofit projects only.
Sustainability 17 05154 g006
Figure 7. Alternative fuels pilots on inland vessels in Europe, broken down by ship type.
Sustainability 17 05154 g007
Figure 8. Alternative fuel pilots on inland vessels in Europe, broken down by ship type, whereby greening was performed by means of retrofitting.
Sustainability 17 05154 g008
Figure 9. Alternative fuel pilots on coastal ships in Europe, broken down by ship type.
Sustainability 17 05154 g009
Figure 10. Alternative fuel pilots on coastal ships in Europe, broken down by ship type, whereby greening was performed by means of retrofitting.
Sustainability 17 05154 g010
Figure 11. Global warming potential of the modeled supply paths for the years 2020 and 2050 from well-to-tank perspective. Bars correspond to the “best guess” values; bandwidths describe the “pessimistic” and “optimistic” assumptions.
Sustainability 17 05154 g011
Figure 12. Nitrogen oxide emissions of the modeled supply paths for the years 2020 and 2050 from well-to-tank perspective. Bars correspond to the “best guess” values; bandwidths describe the “pessimistic” and “optimistic” assumptions.
Sustainability 17 05154 g012
Figure 13. Particulate matter emissions of the modeled supply paths for the years 2020 and 2050 from well-to-tank perspective. Bars correspond to the “best guess” values; bandwidths describe the “pessimistic” and “optimistic” assumptions.
Sustainability 17 05154 g013
Figure 14. Costs of the modeled supply paths for the years 2020 and 2050 from a well-to-tank perspective. Bars correspond to the “best guess” values; bandwidths describe the “pessimistic” and “optimistic” assumptions.
Sustainability 17 05154 g014
Figure 15. Standardized hotspot analysis of the modeled supply paths for the year 2020 from a well-to-tank perspective regarding the global warming potential of individual modules.
Sustainability 17 05154 g015
Table 1. Overview of the main modules for the supply path configurations.
Energy SourceMain Decentralized
Process Step Options
Energy Carrier and
Mode of Transport
Main Centralized
Process Step Options
Offshore wind
Onshore wind
Photovoltaics
Electrolysis
(including water treatment)
Methanol synthesis
(including direct air capture)
Electricity: grid
Hydrogen: vessel or pipeline
Methanol: vessel or lorry
Electrolysis
Methanol synthesis
Onshore storage
Fueling/charging
Table 2. Tank-to-wake emissions of the considered technologies for 2020.
Diesel-ICEElectrificationH2-FCCH3OH-ICE
Specific technologyDiesel-ICE,
high speed
Li-NMC battery-electricH2 300 bar
LT-PEM FC
4-stroke,
high speed,
single fuel
4-stroke,
high speed,
dual fuel
GWP
[gCO2e/kWh]
584 a
695 b
No emissionsNo emissionsNet zero263
NOx
[gNOx/kWh]
10.48 a
8.13 c
9.63 d
No emissionsNo emissions1.531.53
PM
[gPM10/kWh]
0.426 a
0.41 c
0.51 d
No emissionsNo emissions0.040.04
a For seagoing ships. b For inland vessels. c For inland cargo vessels. d For inland passenger vessels.
Table 3. Tank-to-wake emissions of the considered technologies for 2050.
Diesel-ICEElectrificationH2-FCCH3OH-ICE
Specific technologyDiesel-ICE,
high speed
Li-NMC battery-electricH2 300 bar
LT-PEM FC
4-stroke,
high speed,
single fuel
4-stroke,
high speed,
dual fuel
GWP
[gCO2e/kWh]
584 a
695 b
No emissionsNo emissionsNet zero263
NOx
[gNOx/kWh]
10.48 a
1.8 c
1.8 d
No emissionsNo emissions1.531.53
PM
[gPM10/kWh]
0.426 a
0.015 c
0.015 d
No emissionsNo emissions0.040.04
a For seagoing ships. b For inland vessels. c For inland cargo vessels. d For inland passenger vessels.
Table 4. Tank-to-wake costs of the considered technologies for 2020.
Diesel-ICEElectrificationH2-FCCH3OH-ICE
Specific technologyDiesel-ICE,
high speed
Li-NMC battery-electricH2 300 bar
LT-PEM FC
4-stroke,
high speed,
single fuel
4-stroke,
high speed,
dual fuel
Efficiency of the propulsion system44% a
38% b
90%43%38%35%
Energy storage per unit energy stored
[EUR/kWh]
0.11500240.180.17
Power system per unit of maximum power required
[EUR/kW]
8001300317310771313
Energy per unit of shaft/auxiliary energy
[EUR/kWh]
0.16 a
0.26 b
0.30–0.370.40–0.740.84–1.470.66–1.09
a For seagoing ships. b For inland vessels.
Table 5. Tank-to-wake costs of the considered technologies for 2050.
Diesel-ICEElectrificationH2-FCCH3OH-ICE
Specific technologyDiesel-ICE
high speed
Li-NMC battery-electricH2 300 bar
LT-PEM FC
4-stroke,
high speed,
single fuel
4-stroke,
high speed,
dual fuel
Efficiency of the propulsion system44% a
38% b
90%43%38%35%
Energy storage per unit energy stored
[EUR/kWh]
0.11500240.180.17
Power system per unit of maximum power required
[EUR/kW]
800117028569691182
Energy per unit of shaft/auxiliary energy
[EUR/kWh]
0.16 a
0.34 b
0.19–0.250.24–0.50.4–0.90.34–0.69
a For seagoing ships. b For inland vessels.
Table 6. Main features of the considered coastal ferry fleet.
Main Engine Power
[kW]
Number of VesselsAverage Main Engine Power
[kW]
Annual Energy Demand per Vessel
[kWh]
<10002507135,133,600
1000–1999313163411,764,800
2000–2999151245217,654,400
Table 7. Emissions of the retrofitted coastal ferry fleet (714 vessels); absolute values and values relative to the diesel-powered ferry fleet.
Emissions20202050
Well-to-WakeTank-to-WakeWell-to-WakeTank-to-Wake
CO2e[t][187,491; 664,813]0[93,902; 332,688]0
NOx[t][399; 905]0[194; 445]0
PM[t][133; 399]0[56; 187]0
CO2e[%][−88; −97]−100[−94; −98]−100
NOx[%][−99; −100]−100−100−100
PM[%][−98; −99]−100[−99; −100]−100
Table 8. Total cost of retrofit of coastal ferry fleet (714 vessels); absolute values and values relative to the diesel-powered ferry fleet.
Total Cost20202050
TC[mil. EUR][48,426; 57,654][35,233; 41,150]
TC[%][+91; +128][+39; +62]
Table 9. Main features of the considered inland day-trip and small cabin vessels fleet.
Main Engine Power
[kW]
Number of VesselsAverage Main Engine Power
[kW]
Annual Energy Demand per Vessel
[kWh]
100–7502207500203,727
Table 10. Emissions of the retrofitted inland day-trip and small cabin vessel fleet (2207 vessels); absolute values and values relative to the diesel-powered day-trip and small cabin vessel fleet.
Emissions20202050
Well-to-WakeTank-to-WakeWell-to-WakeTank-to-Wake
CO2e[t][11,057; 39,174]0[5518; 19,598]0
NOx[t][22.1; 53]0[11; 26.5]0
PM[t][6.6; 22.1]0[4.4; 11]0
CO2e[%][−90; −97]−100[−95; −99]−100
NOx[%][−99; −100]−100−100−100
PM[%][−98; −99]−100−99−100
Table 11. Total cost of retrofit of inland day-trip and small cabin vessel fleet (2207 vessels); absolute values and values relative to the diesel-powered day-trip and small cabin vessel fleet.
Total Cost20202050
TC[mil. EUR][4418; 4893][3224; 3765]
TC[%][+37; +52][−18; −4]
Table 12. Main features of the considered fleet of large inland dry cargo vessels (L ≥ 110 m).
Main Engine Power
[kW]
Number of VesselsAverage Main Engine Power
[kW]
Annual Energy Demand per Vessel
[kWh]
1118–161761017421,278,955
Table 13. Emissions of the retrofitted large inland dry cargo vessel fleet (610 vessels); absolute values and values relative to the diesel-powered large inland dry cargo vessel fleet.
Emissions20202050
Well-to-WakeTank-to-WakeWell-to-WakeTank-to-Wake
CO2e[t][15,366; 90,024]0[6978; 40,467]0
NOx[t][48; 145]0[27; 81]0
PM[t][142; 315]0[131; 286]0
CO2e[%][−87; −98]−100[−93; −99]−100
NOx[%][−99; −100]−100[−99; −100]−100
PM[%][−83; −92]−100[−81; −91]−100
Table 14. Total cost of retrofit of large inland dry cargo vessel fleet (610 vessels); absolute values and values relative to the diesel-powered large inland dry cargo vessel fleet.
Toatl Cost20202050
TC[mil. EUR][9546; 15,106][6992; 10,864]
TC[%][+94; +208][+12; +76]
Table 15. Main features of the considered offshore supply vessel fleet.
Gross Tonnage
[GT]
Number of VesselsAverage Main Engine Power
[kW]
Annual Energy Demand per Vessel
[kWh]
<2000834526,908,301
2000–3000845949,194,509
3000–400048644412,897,748
4000–500095720614,423,956
Table 16. Emissions of the retrofitted offshore supply vessel fleet (159 vessels); absolute values and values relative to the diesel-powered offshore supply vessel fleet.
Emissions20202050
Well-to-WakeTank-to-WakeWell-to-WakeTank-to-Wake
CO2eSingle-fuel engine[t][224,424; 800,938]0[91,338; 337,319]0
NOx[t][3567; 4216]3243[3421; 3831]3243
PM[t][1497; 3364]87[893; 1984]87
CO2eSingle-fuel engine[%][−49; −86]−100[−78; −94]−100
NOx[%][−91; −92]−85−92−85
PM[%][−33; −70]−90[−61; −82]−90
CO2eDual-fuel engine[t][781,550; 1,357,969]557,126[648,512; 894,350]557,126
NOx[t][3567; 4216]3243[3421; 3831]3243
PM[t][1497; 3364]87[893; 1984]87
CO2eDual-fuel engine[%][−13; −50]−55[−43; −58]−55
NOx[%][−91; −92]−86−92−86
PM[%][−33; −70]−91[−61; −82]−91
Table 17. Total cost of retrofit of offshore supply vessels fleet (159 vessels); absolute values and values relative to the diesel-powered offshore supply vessels fleet.
Total Cost20202050
TC—single-fuel engine[mil. EUR][36,723; 63,613][18,066; 39,151]
TC—single-fuel engine[%][+381; +733][+136; +411]
TC—dual-fuel engine[mil. EUR][28,877; 47,854][15,661; 30,541]
TC—dual-fuel engine[%][+278; +527][+104; +299]
Table 18. Average minimum and maximum costs of retrofit (including 20 years of operation) of a single vessel.
Fleet SegmentAverage TCmin per Vessel
[mil. EUR]
Average TCmax per Vessel
[mil. EUR]
Average TCmin per Vessel
[mil. EUR]
Average TCmax per Vessel
[mil. EUR]
2020202020502050
Coastal ferries67.880.749.357.6
Inland day-trip and small cabin vessels2.22.21.51.7
Inland dry cargo vessels, L ≥ 110 m15.624.711.517.8
Offshore supply vessels—single-fuel engine231400.1113.6246.2
Offshore supply vessels—dual-fuel engine181.630198.5192.1
Table 19. Additional average costs of retrofit (including 20 years of operation) of a single vessel.
Fleet SegmentΔTCmin
per Vessel
[mil. EUR]
ΔTCmax
per Vessel
[mil. EUR]
ΔTCmin
per Vessel
[mil. EUR]
ΔTCmax
per Vessel
[mil. EUR]
2020202020502050
Coastal ferries55.468.336.945.2
Inland day-trip and small cabin vessels0.50.8−0.3−0.08
Inland dry cargo vessels, L ≥ 110 m7.616.71.37.7
Offshore supply vessels—single-fuel engine183352.165.4198.1
Offshore supply vessels—dual-fuel engine133.625350.3143.9
Table 20. CO2e abated from the well-to-wake perspective; total amount of CO2e abated by the fleet segment and CO2e abated per vessel.
Fleet SegmentCO2e Abated
[mil. t]
CO2e Abated
per Vessel
[t]
CO2e Abated
[mil. t]
CO2e Abated
per Vessel
[t]
2020202020502050
Coastal ferries[3.889; 4.366][5447; 6115][4.221; 4.460][5912; 6246]
Inland day-trip and small cabin vessels[0.276; 0.304][125; 138][0.295; 0.309][134; 140]
Inland dry cargo vessels, L ≥ 110 m[0.457; 0.531][749; 841][0.506; 0.540][830; 885]
Offshore supply vessels—single-fuel engine[0.462; 1.040][2912; 6538][0.926; 1.173][5828; 7375]
Offshore supply vessels—dual-fuel engine[−0.094; 0.482][−591; 3034][0.370; 0.615][2324; 3871]
Table 21. Costs of abatement of 1 t of CO2e over 20 years of operation.
Fleet SegmentMinimum CCO2eabated
[EUR/t]
Maximum CCO2eabated
[EUR/t]
Minimum CCO2eabated
[EUR/t]
Maximum CCO2eabated
[EUR/t]
2020202020502050
Coastal ferries5384741215613535
Inland day-trip and small cabin vessels37575494−2431−576
Inland dry cargo vessels, L ≥ 110 m889019,27814308745
Offshore supply vessels—single-fuel engine53,853120,901965726,858
Offshore supply vessels—dual-fuel engine51,587605,70413,47637,179
Table 22. Criteria from the EU Taxonomy Regulation, both for inland and seagoing vessels, in comparison to the fossil diesel baseline [46].
Seagoing ShipsInland Vessels
2025–20292030–20342035–20392040–20442045–20492050
GHG emissions
[gCO2e/MJ]
76.461.145.830.615.30.0
Emission reduction
compared to fossil diesel
−20%−36%−52%−68%−84%−100%
Disclaimer/Publisher’s Note: The statements, opinions and data contained in all publications are solely those of the individual author(s) and contributor(s) and not of MDPI and/or the editor(s). MDPI and/or the editor(s) disclaim responsibility for any injury to people or property resulting from any ideas, methods, instructions or products referred to in the content.

