1. Introduction
Geological hazards represent a major global threat to ecological security, often initiating cascading secondary disasters such as vegetation degradation, soil erosion, and hydrological disruption [
1,
2]. These processes can cause persistent instability in regional ecosystems. Common geological hazards include earthquakes, landslides, debris flows, and rockfalls, all of which are prevalent in tectonically active and topographically complex mountain regions [
3,
4,
5]. In southwestern China, the interplay of active fault systems, steep slopes, and concentrated monsoonal precipitation fosters a high incidence of such hazards [
6,
7].
Among these, debris flows—a type of rapid mass movement involving saturated soil, rock, and organic material—are particularly destructive due to their sudden onset, high mobility, and capacity for repeated occurrence. They are often triggered by intense rainfall events, particularly in landscapes already destabilized by prior seismic activity or human disturbance [
8]. Following the 2008 Wenchuan earthquake, vast quantities of loose deposits were generated in the alpine gorge zones of western Sichuan. These unstable materials, under repeated rainfall stimulation, have formed a typical “earthquake–landslide–debris flow” hazard chain [
9]. This compounded hazard regime has led to complex, nonlinear patterns of vegetation destruction and recovery, posing challenges for long-term ecological rehabilitation [
10].
In such high-risk areas, monitoring vegetation recovery through spatiotemporal analyses is critical. Understanding vegetation dynamics not only helps reveal ecosystem resilience, but it is also crucial for designing sustainable land-use strategies and ecological restoration in hazard-prone regions [
11,
12].
Remote sensing technology has played an increasingly important role in vegetation monitoring in recent years. Owing to its sensitivity to vegetation cover and biomass, the normalized difference vegetation index (NDVI) has been widely used to quantify vegetation dynamics across various ecosystems [
13,
14]. Numerous studies have explored post-disaster vegetation recovery. For example, Yang et al. [
15] identified linkages between vegetation change and landslide activity in the Wenchuan earthquake zone; Zhang et al. [
16] analyzed the long-term influence of debris flow evolution on vegetation restoration via a decade of observations; and Wang et al. [
17] investigated the feedback of vegetation growth on slope erosion induced by debris flows. However, existing research has focused largely on the spatiotemporal features of hazards or short-term ecological responses, with insufficient attention given to long-term vegetation recovery via multi-scale and integrative approaches. Moreover, many studies rely on single statistical methods (e.g., linear regression or basic trend analysis), which often fail to capture the nonlinear characteristics and spatial heterogeneity of vegetation dynamics. In regions with frequent cascading hazards, the coupling mechanisms between secondary disaster disturbances and natural vegetation recovery remain poorly understood, limiting the precision of ecological restoration strategies [
18].
The Chutou Gully watershed, located in the core rupture zone of the 2008 Wenchuan earthquake, has experienced repeated seismic activity and frequent debris flows, making it a representative area for studying vegetation response under compound hazard conditions [
19,
20]. Despite this, systematic research linking vegetation recovery with the spatial distribution of geological hazards and the role of mitigation engineering remains limited. In light of the limitations in existing studies—particularly the lack of long-term, multi-scale, and integrative analyses—this study conducts a comprehensive assessment of vegetation recovery using Landsat NDVI data from 2000 to 2022. Compared to previous work, our study offers the following three key contributions: (1) it quantifies long-term vegetation recovery rates in a typical high-risk watershed; (2) it captures nonlinear and spatially heterogeneous recovery patterns through advanced spatiotemporal analysis; and (3) it examines the coupled effects of secondary hazard activity and protective engineering interventions on vegetation dynamics. By addressing these underexplored dimensions, the study aims to improve understanding of ecosystem resilience in seismically active regions and provide scientific evidence to inform ecological restoration, disaster risk reduction, and spatial planning in mountainous environments [
21].
4. Results and Analysis
4.1. Spatiotemporal Evolution of the NDVI in the Chutou Gully Watershed
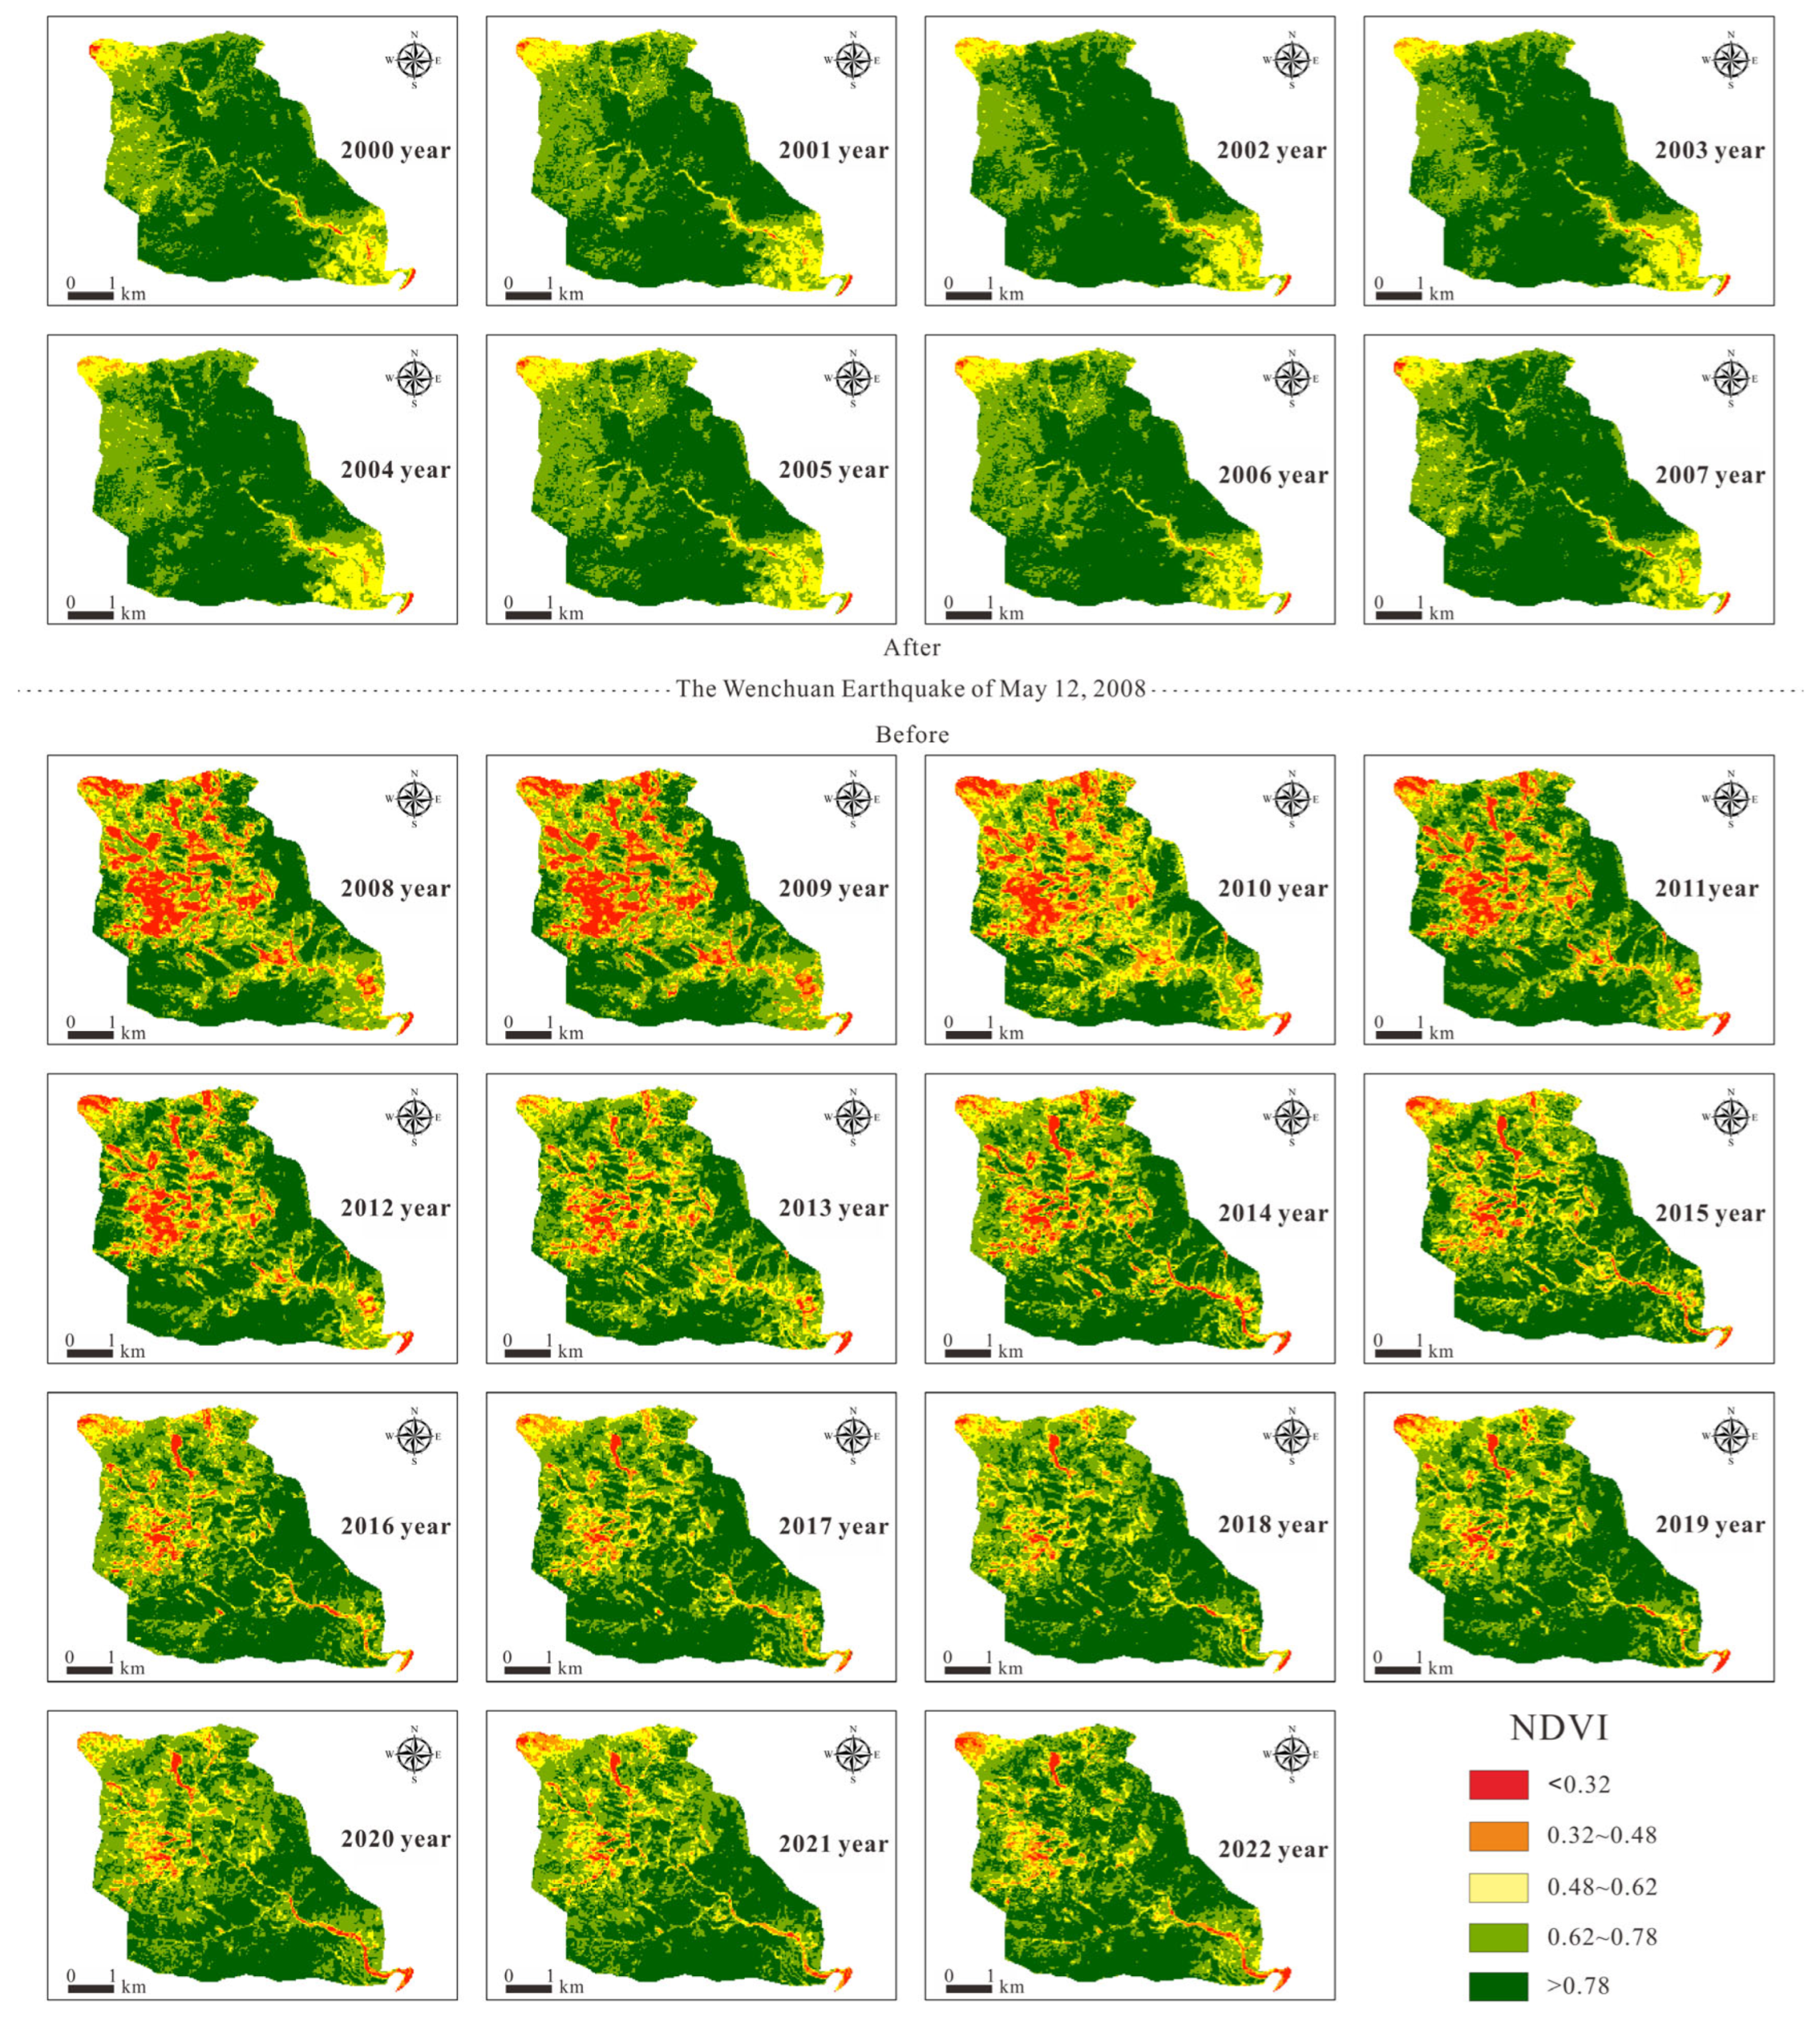
Through data collection and batch downloading of satellite imagery, the annual maximum NDVI values for the Chutou Gully watershed from 2000–2022 were derived via band processing and maximum value composite methods. Selecting the annual maximum NDVI helps to minimize the impact of cloud contamination, snow cover, or other atmospheric effects that may cause artificially low NDVI values on certain dates, thereby enabling a more accurate assessment of vegetation changes in the study area. Specifically, the 2008 maximum NDVI was extracted from imagery acquired after the “5.12” Wenchuan earthquake to better capture vegetation changes following seismic disturbances. The spatial distributions of the annual NDVI values in the Chutou Gully watershed from 2000–2022 are shown in
Figure 3.
4.1.1. Temporal Variation Characteristics of the NDVI in the Chutou Gully Watershed
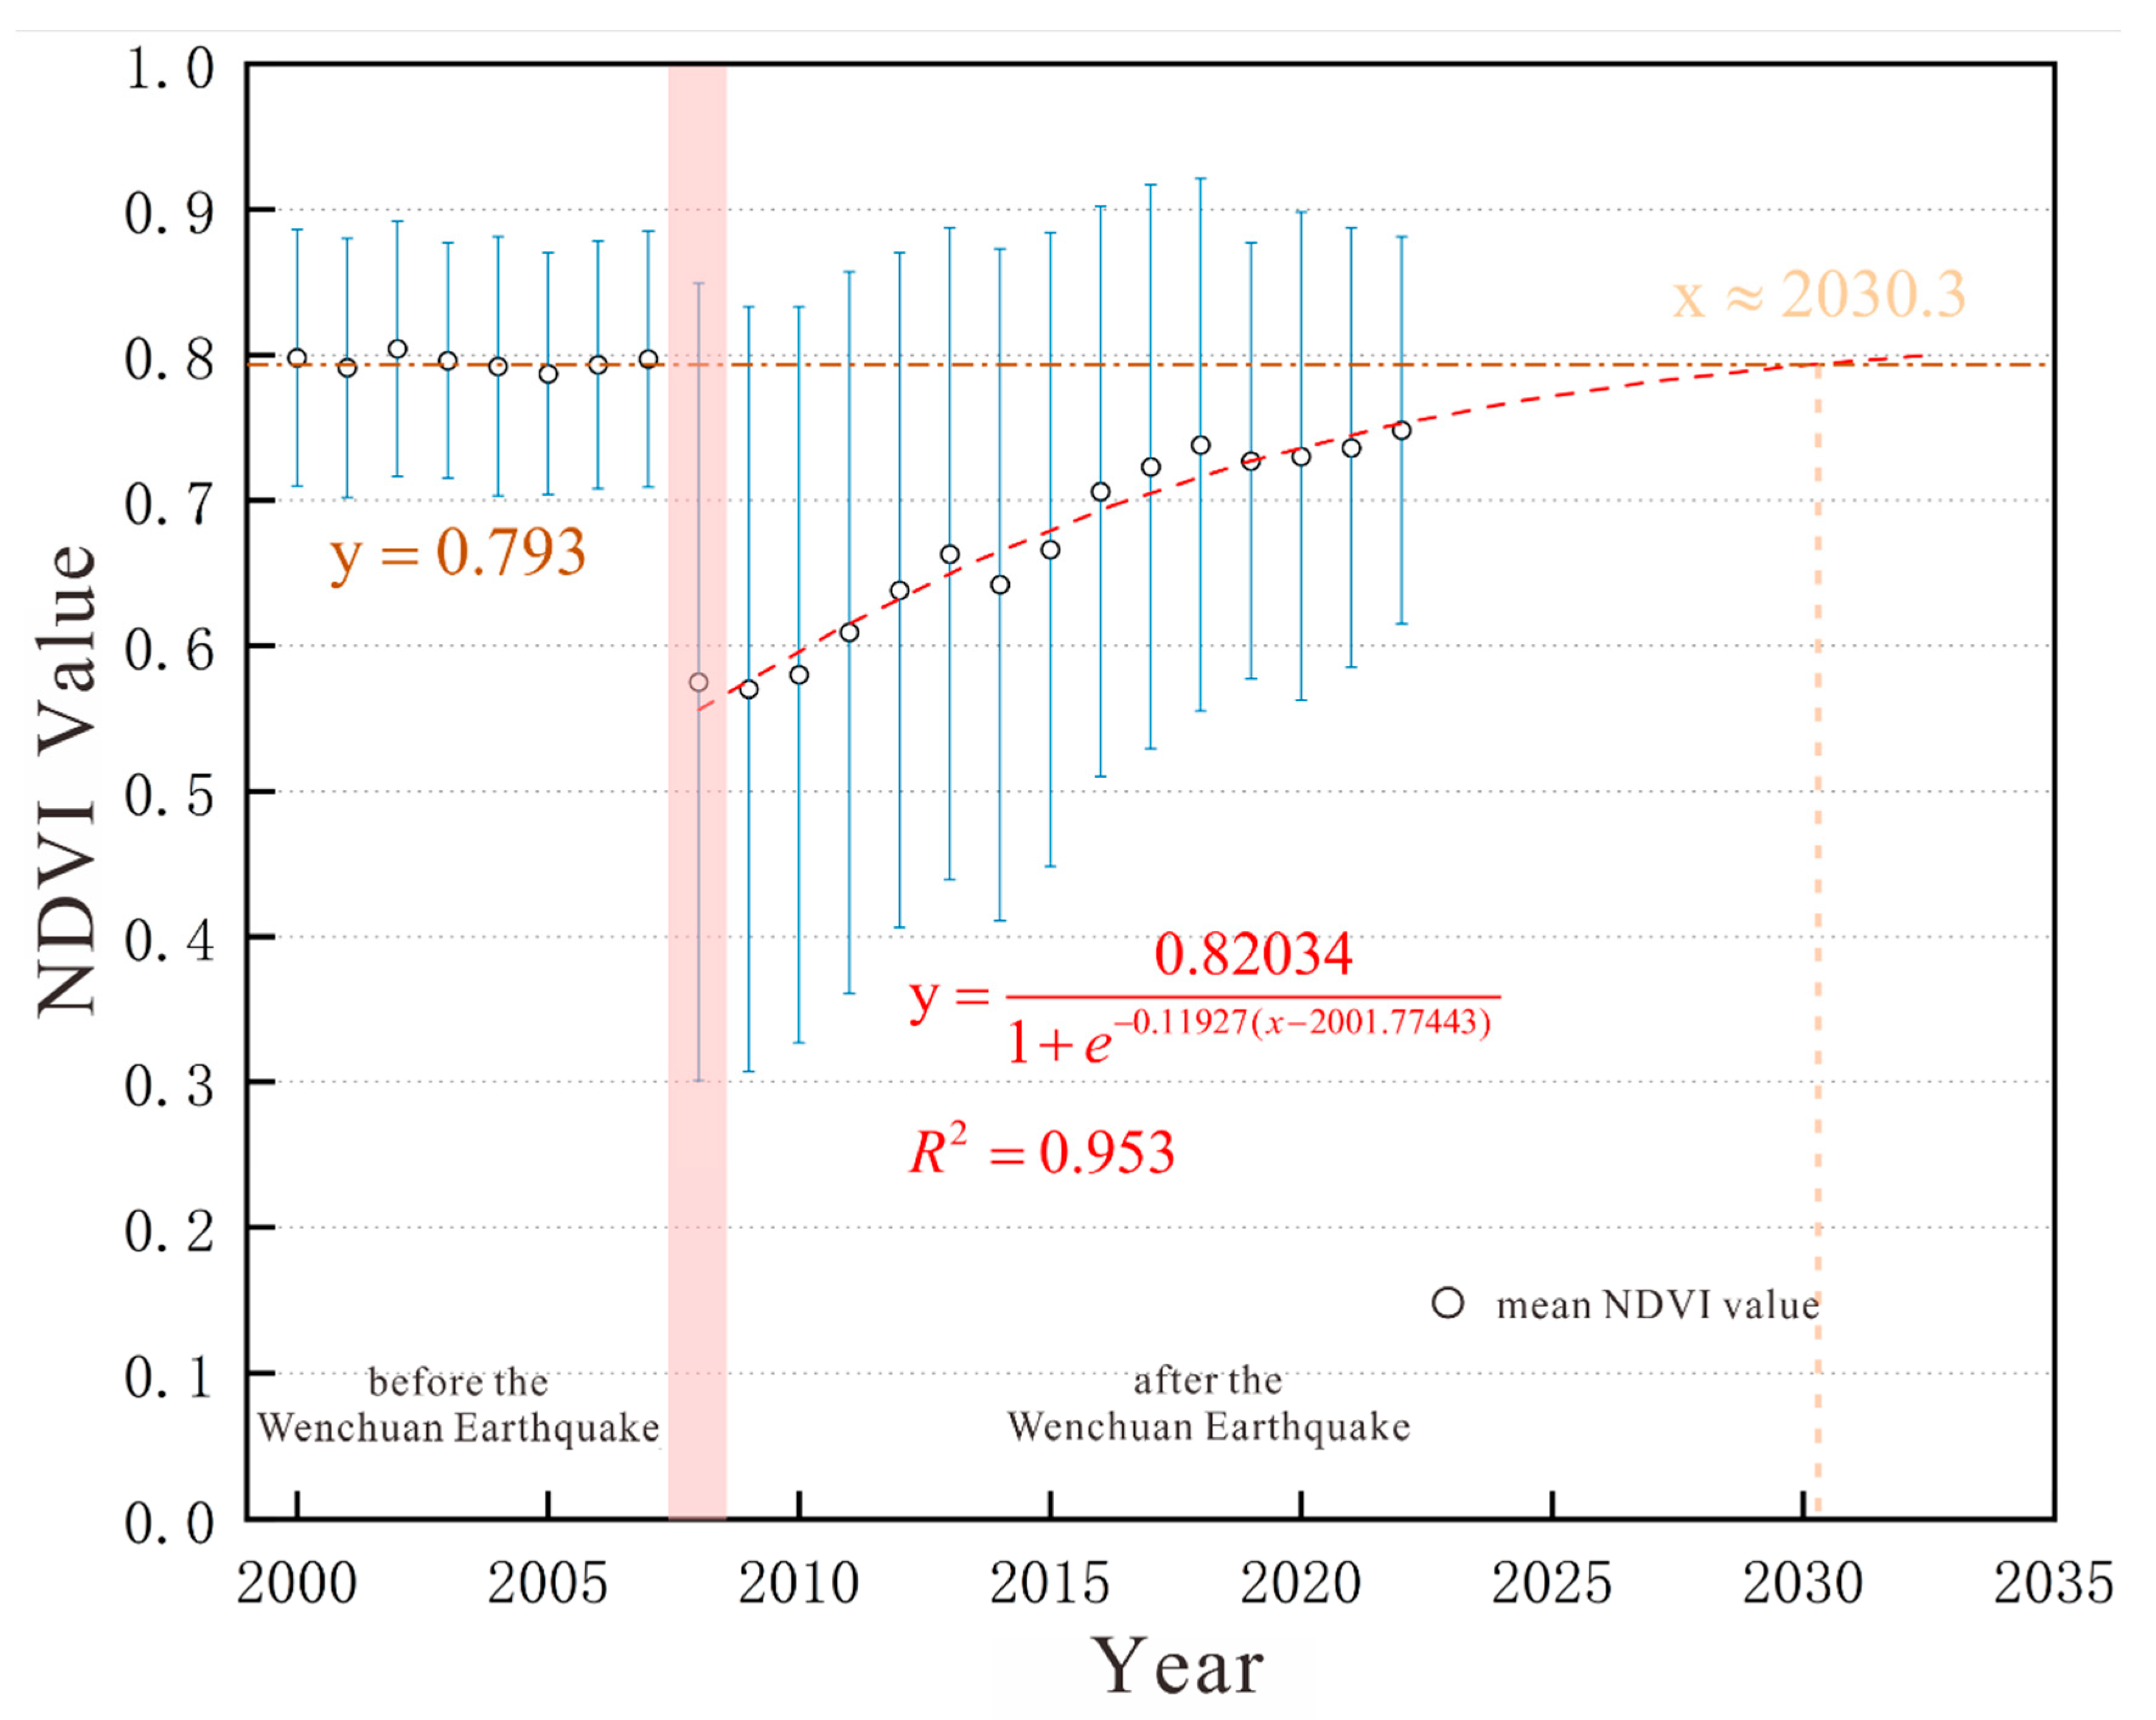
The NDVI values in the Chutou Gully watershed exhibited phase-based fluctuation patterns over the multiyear period. Prior to the earthquake, the average NDVI was 0.793, with a maximum value of 0.804. However, coseismic landslides triggered by the 2008 Wenchuan earthquake caused a sharp decline in the NDVI to 0.575. In the early post-earthquake stage, the vegetation gradually recovered, with the NDVI values continuously increasing. A slight decrease occurred in 2014 due to a debris flow event, followed by a rapid rebound until another decline in 2019, which was again associated with debris flow activity. The area subsequently entered a slow recovery phase. The results suggest that geological hazard events have a significant disturbance effect on the NDVI dynamics, and that the vegetation restoration process after major disturbances follows a typical “disturbance-recovery” alternation pattern.
A Slogistic1 regression model was fitted to the NDVI data from 2008–2022, yielding a high coefficient of determination (R
2 = 0.953). The model results indicate that the NDVI in the Chutou Gully watershed has been in a general state of recovery since the earthquake, with a recovery rate (β) of 0.119 per year. The NDVI is projected to return to the pre-earthquake average level between 2030 and 2031 (
Figure 4). In the long term, vegetation recovered rapidly during the early post-seismic phase, followed by a prolonged period of slow recovery.
The mean NDVI serves as an indicator of the regional vegetation recovery trend, while its standard deviation reflects the stability of the ecosystem [
36]. A larger standard deviation indicates greater instability in the ecological system. As illustrated in the figure, prior to the Wenchuan earthquake, the average standard deviation of the NDVI in the Chutou Gully watershed was 0.0863. After the earthquake, it rose sharply to 0.274, highlighting a significant increase in ecosystem instability due to seismic disturbance. In the following years, as vegetation gradually re-established on slope surfaces, the mean NDVI increased, and the standard deviation correspondingly declined, suggesting a partial improvement in ecological stability. Nevertheless, the current standard deviation of the NDVI remains above the pre-earthquake level, indicating that full vegetation recovery has not yet been achieved. Some areas within the watershed still exhibit limited vegetation cover or sparse growth, reflecting ongoing ecological fragility in localized zones.
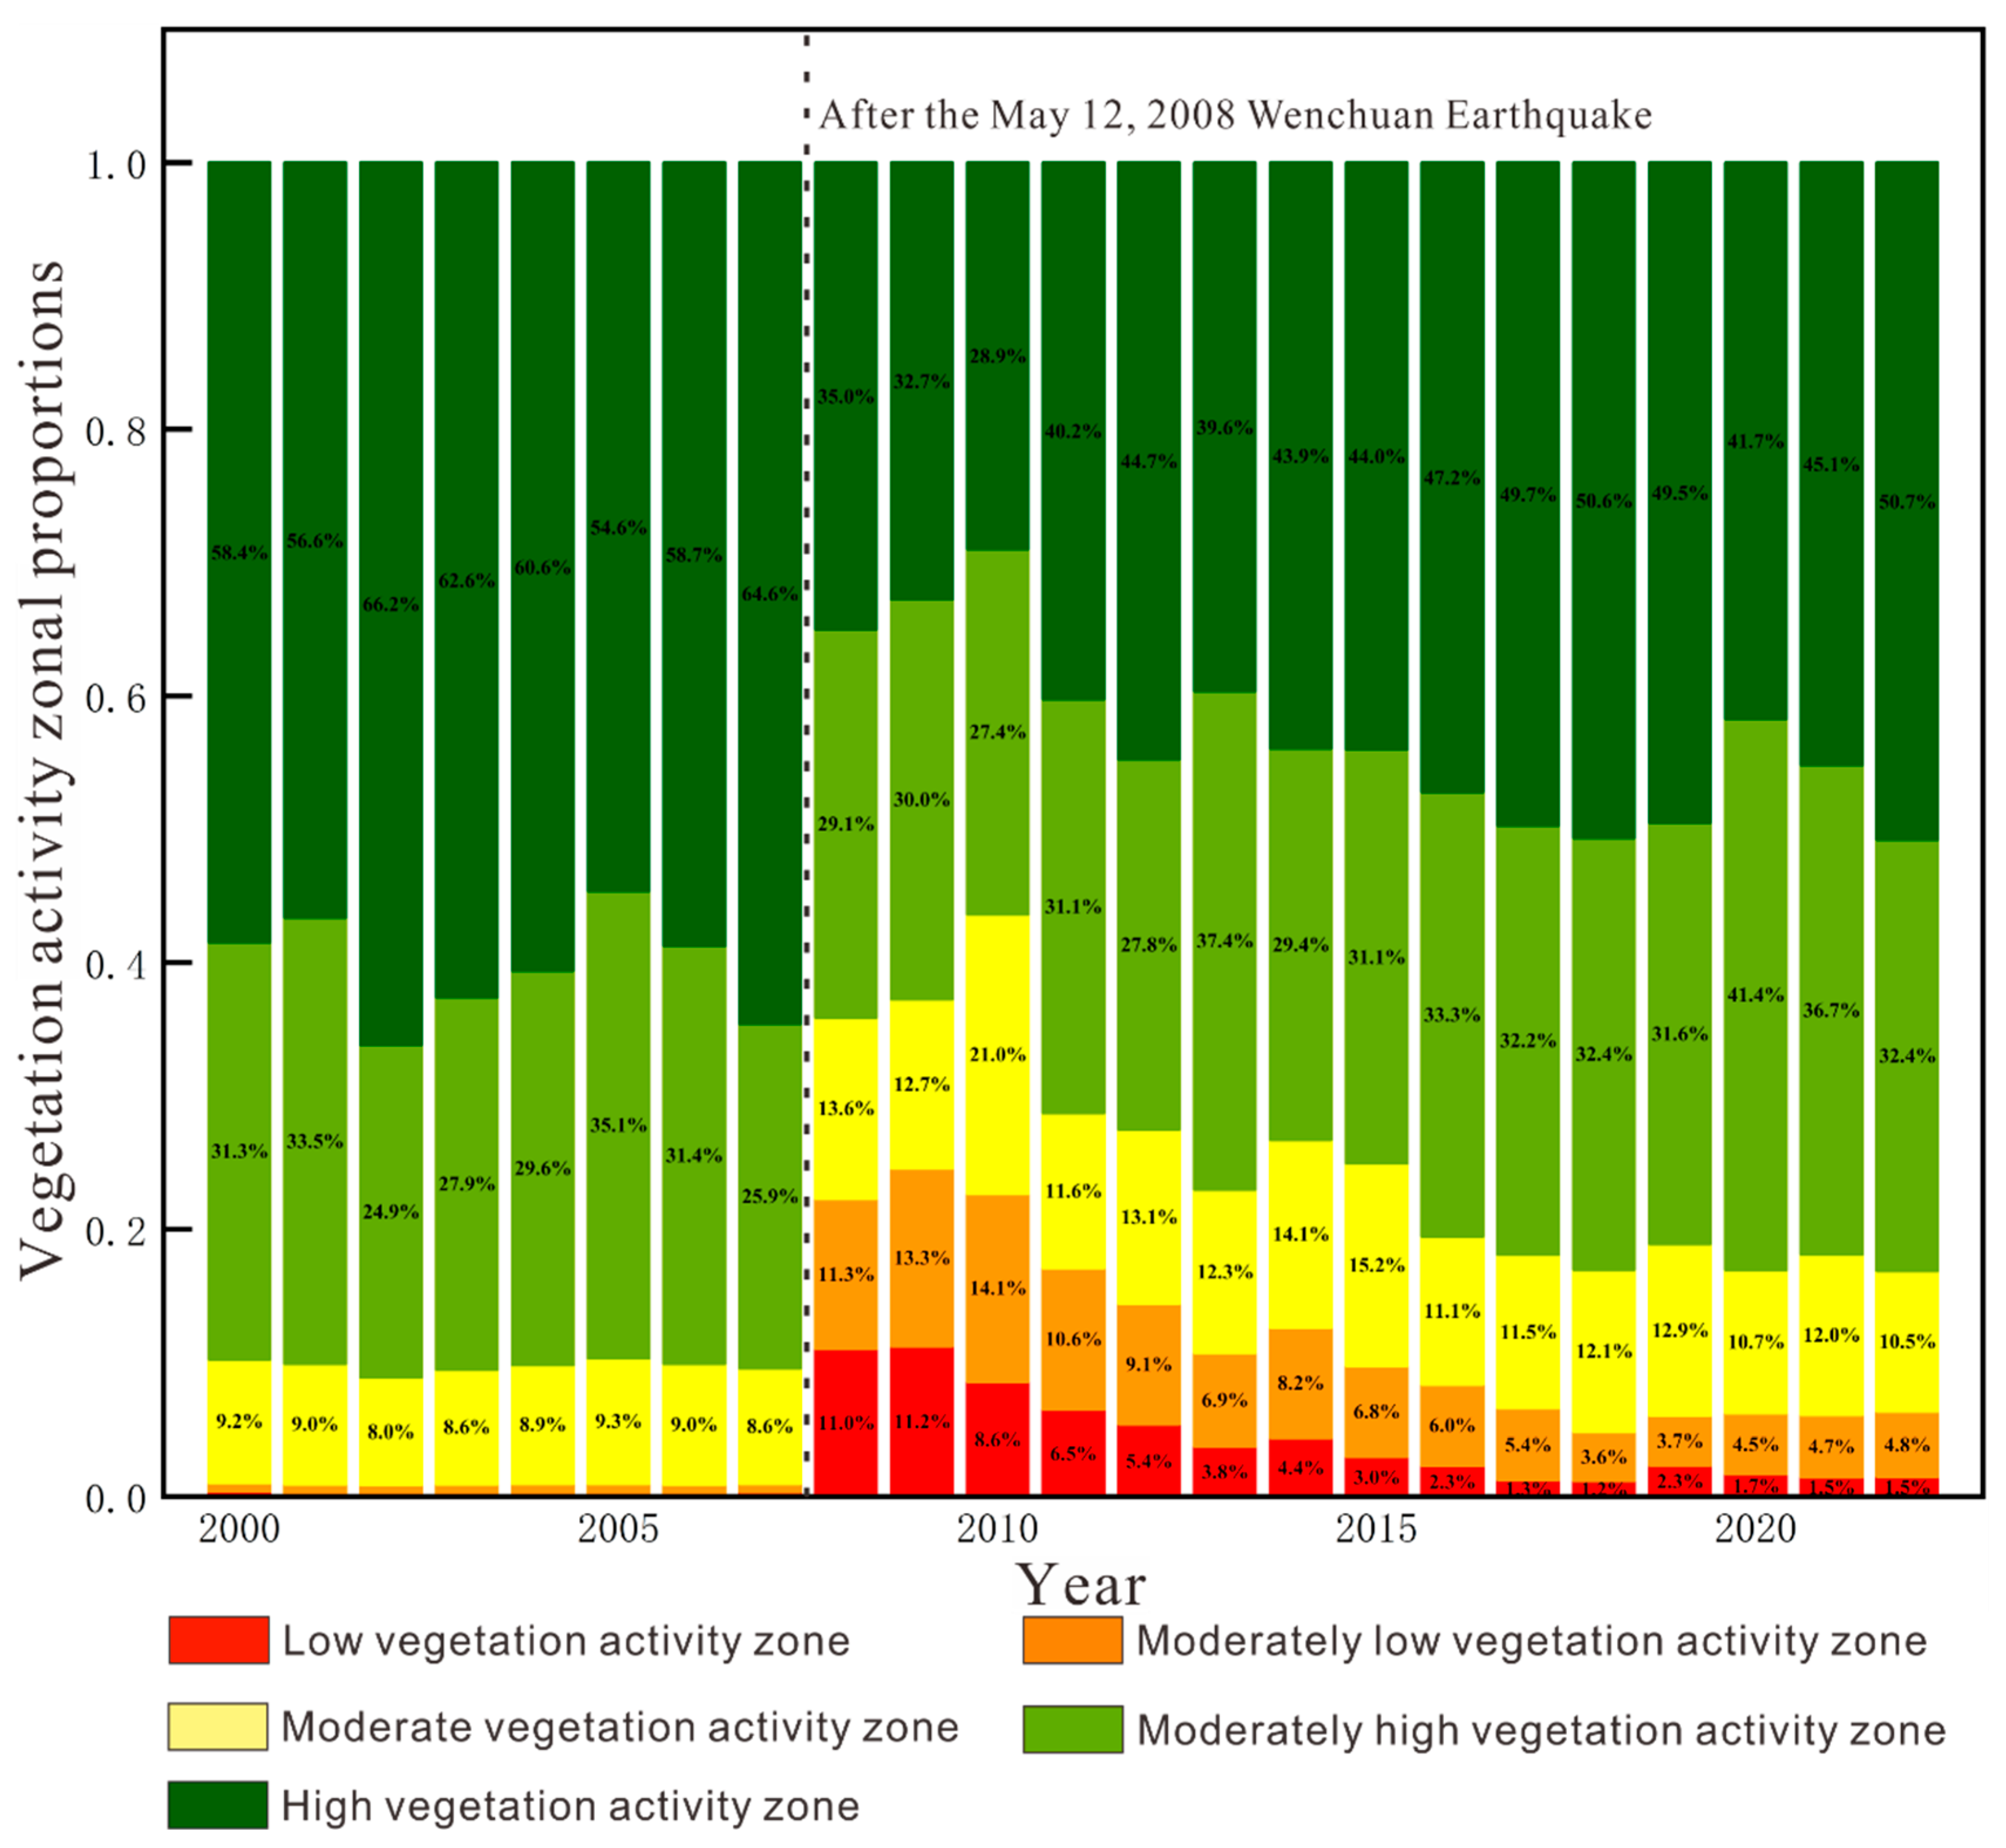
4.1.2. Spatial Distribution and Variation Characteristics of the NDVI in the Chutou Gully Watershed
To examine the spatial pattern of the NDVI in the Chutou Gully watershed, a pixel-based analysis was conducted to generate a multiyear NDVI distribution map from 2000–2022. The NDVI values were categorized into the following five vegetation activity levels: low (<0.32), moderately low (0.32–0.48), moderate (0.48–0.62), moderately high (0.62–0.78), and high vegetation activity zone (>0.78). The spatial distributions of the mean NDVI during the pre-earthquake period (2000–2007) and post-earthquake period (2008–2022) are shown in
Figure 5a,b. The pre-seismic average NDVI was 0.793, whereas the post-seismic average declined to 0.657.
The vegetation activity zoning in the Chutou Gully watershed exhibited a three-phase transition pattern in response to the Wenchuan earthquake (
Figure 6). Prior to the earthquake, the high vegetation activity zone dominated the landscape, accounting for an average of 60%, with a peak of 66.2%, whereas the low and moderately low zones were negligible. Immediately following the seismic event, coseismic landslides and other disturbances triggered an abrupt shift in the vegetation activity structure, as follows: the high zone sharply declined from 64.6% to 35.0%, whereas the low and moderately low zones increased to 11.0% and 11.3%, respectively.
During the recovery phase, the vegetation exhibited a fluctuating recovery trend. Although the proportions of low and moderately low zones gradually decreased, the trajectory was interrupted by secondary disasters such as debris flows, resulting in periodic fluctuations. Moreover, the high-vegetation activity zone exhibited a slow upward trend, with occasional stagnation or slight regression in certain years. These oscillatory dynamics indicate that the post-seismic ecological restoration process in the Chutou Gully watershed is nonlinear but maintains an overall positive recovery trajectory.
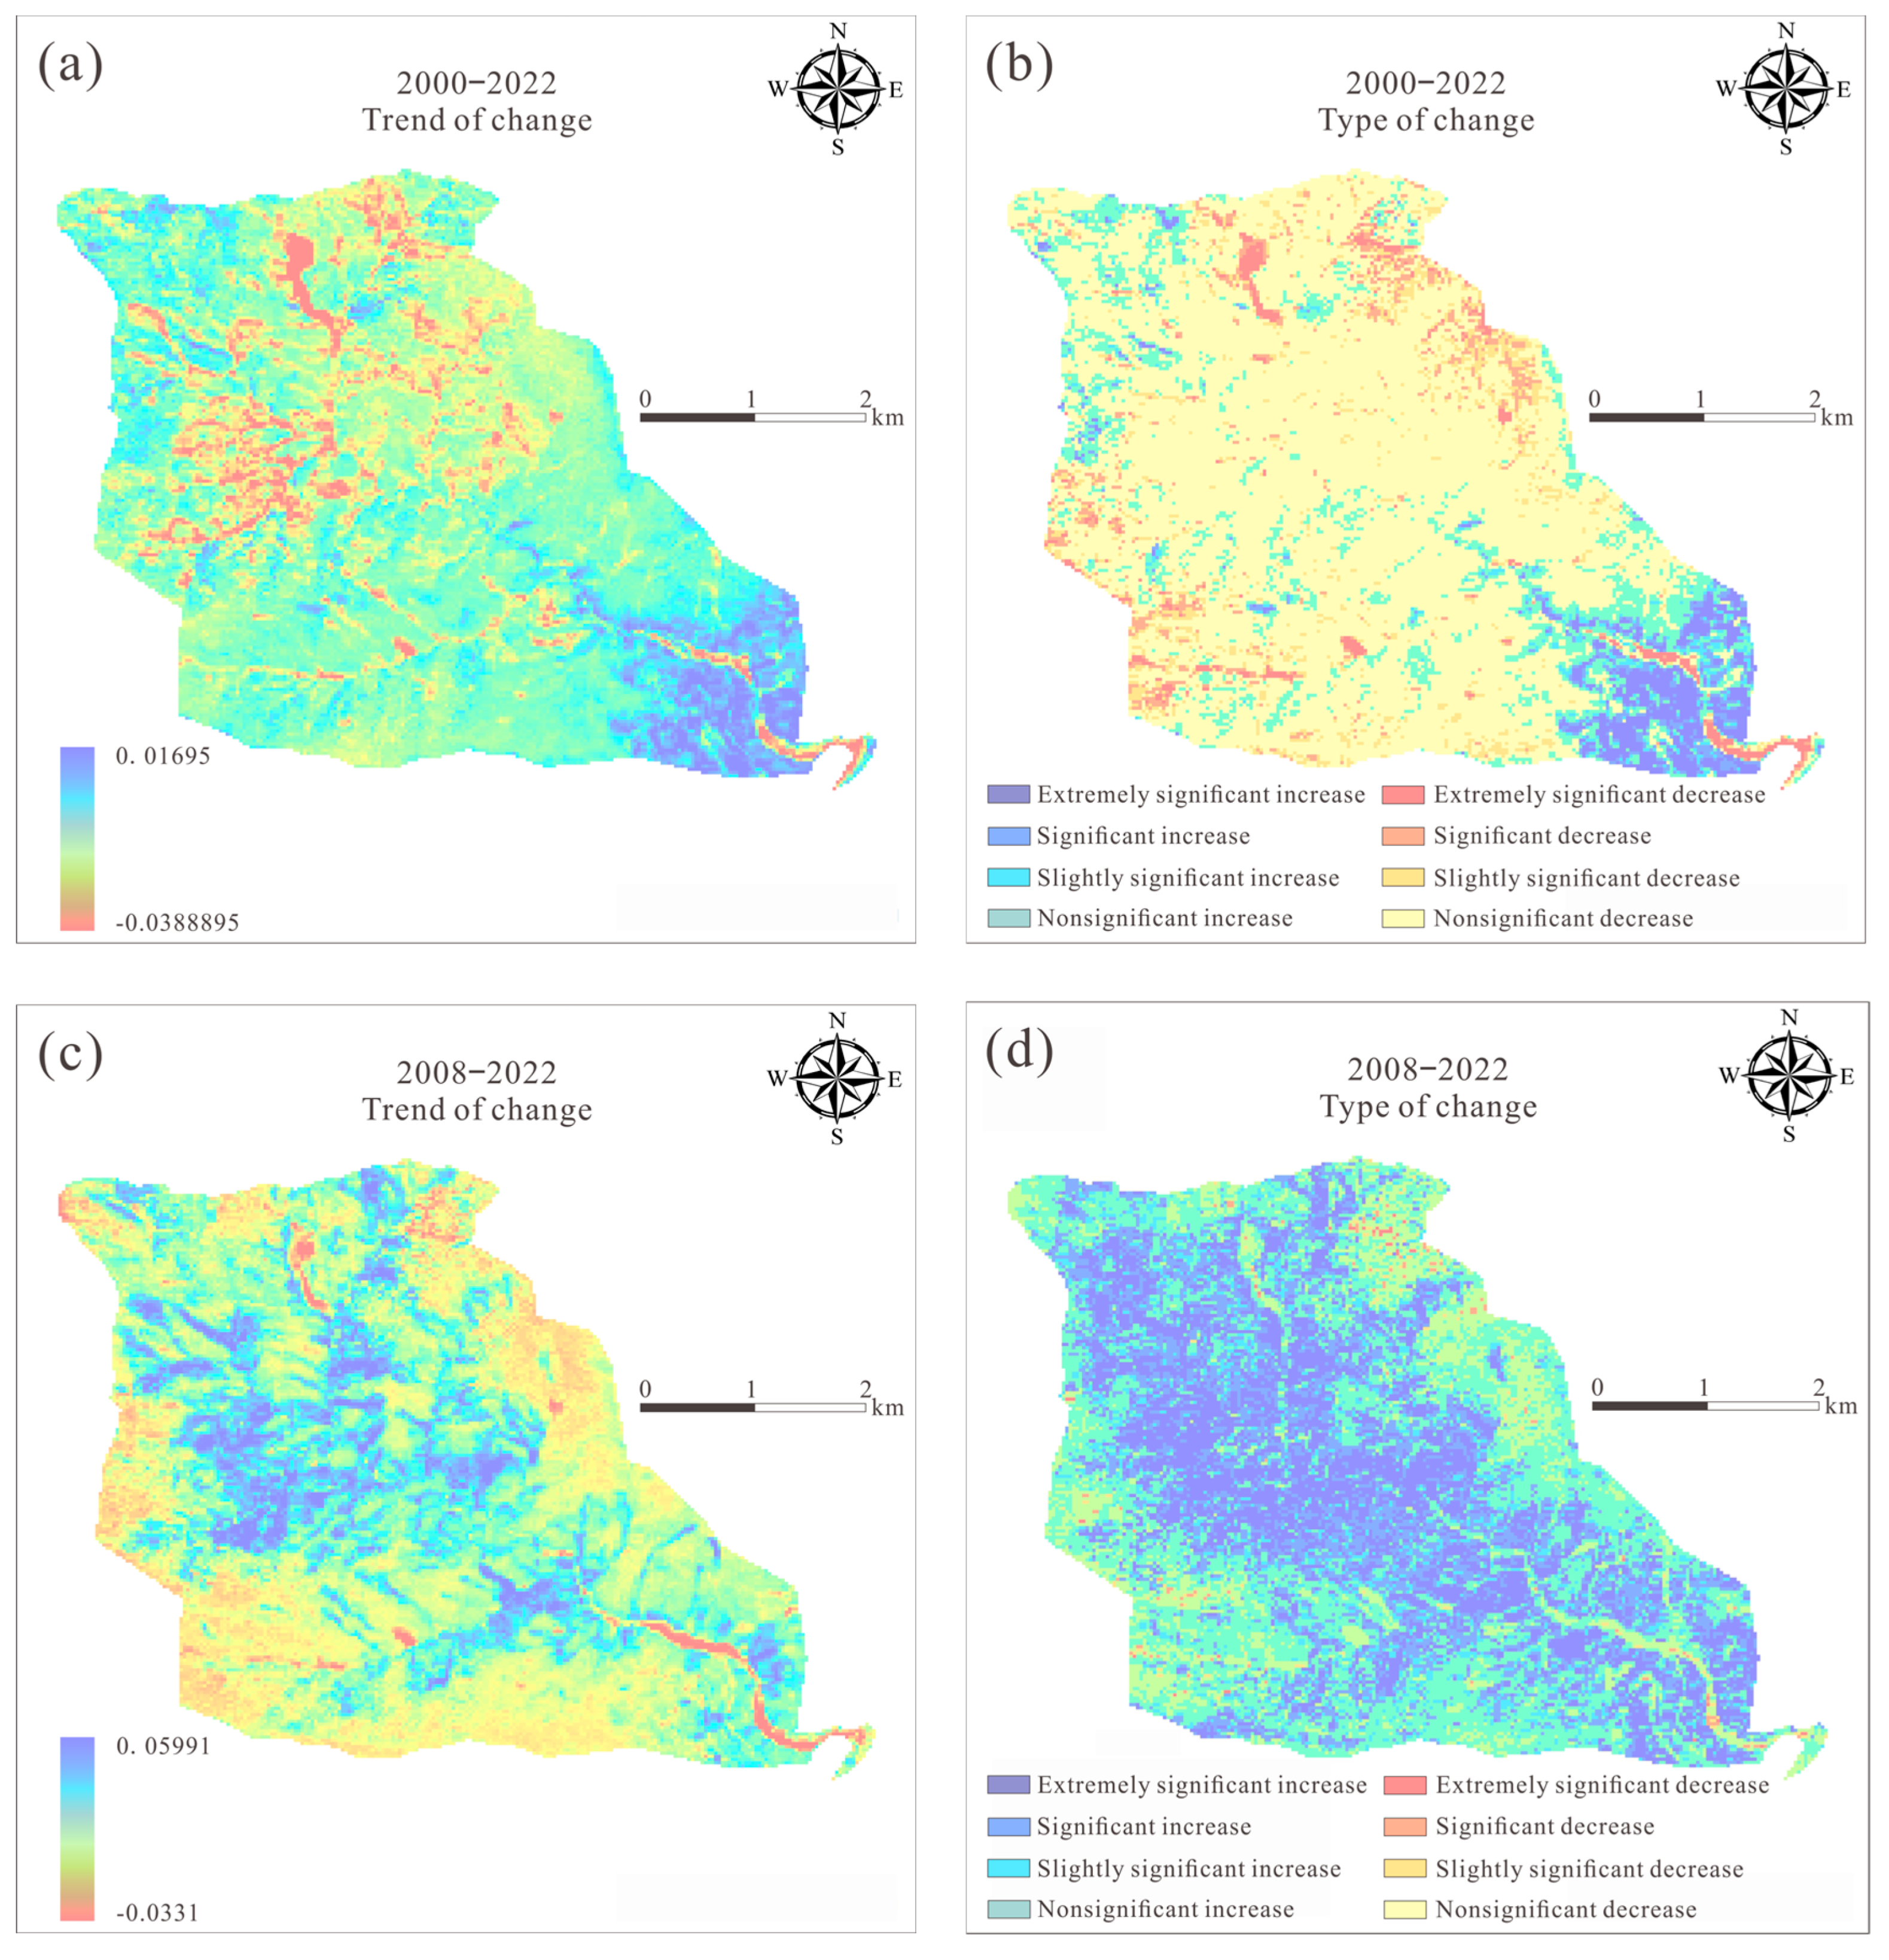
To better examine the long-term spatial variation in the NDVI, Theil–Sen Median trend analysis and the Mann–Kendall test were applied to the annual NDVI data of the Chutou Gully watershed for the following two distinct periods: 2000–2022 and 2008–2022 (
Figure 7).
According to the results of Theil–Sen Median trend analysis and the MK significance test, the NDVI in the Chutou Gully watershed exhibited an overall declining trend from 2000–2022. Specifically, 80.73% of the area showed a decreasing trend, with 2.10% showing an extremely significant decrease, 4.22% showing a significant decrease, 5.34% showing a slightly significant decrease, and 69.07% showing a nonsignificant decrease (
Table 4). These results suggest that the region experienced substantial vegetation loss due to disturbances from geological hazards such as earthquakes and debris flows. However, the large proportion of nonsignificant decreases implies that, despite the disturbances, vegetation has been gradually recovering over the 23-year period.
Further analysis of the 2008–2022 period reveals a reversal in the trend, with NDVI generally increasing across the watershed. An increase was observed in 89.02% of the area, including 23.05% with an extremely significant increase, 22.10% with a significant increase, 8.90% with a slightly significant increase, and 35.02% with a nonsignificant increase. This trend reflects the post-disaster vegetation recovery that has occurred since the 2008 Wenchuan earthquake. Notably, the slopes on both sides of the transport zone exhibited marked increases in NDVI, which aligns with observed patterns of vegetation regeneration. In contrast, the river channels within the transport zone showed a decreasing trend in NDVI, primarily due to sediment deposition from debris flows after 2008, which resulted in a decline in vegetation cover and NDVI values in these zones.
4.2. Spatial Clustering Characteristics of the NDVI in the Chutou Gully Watershed
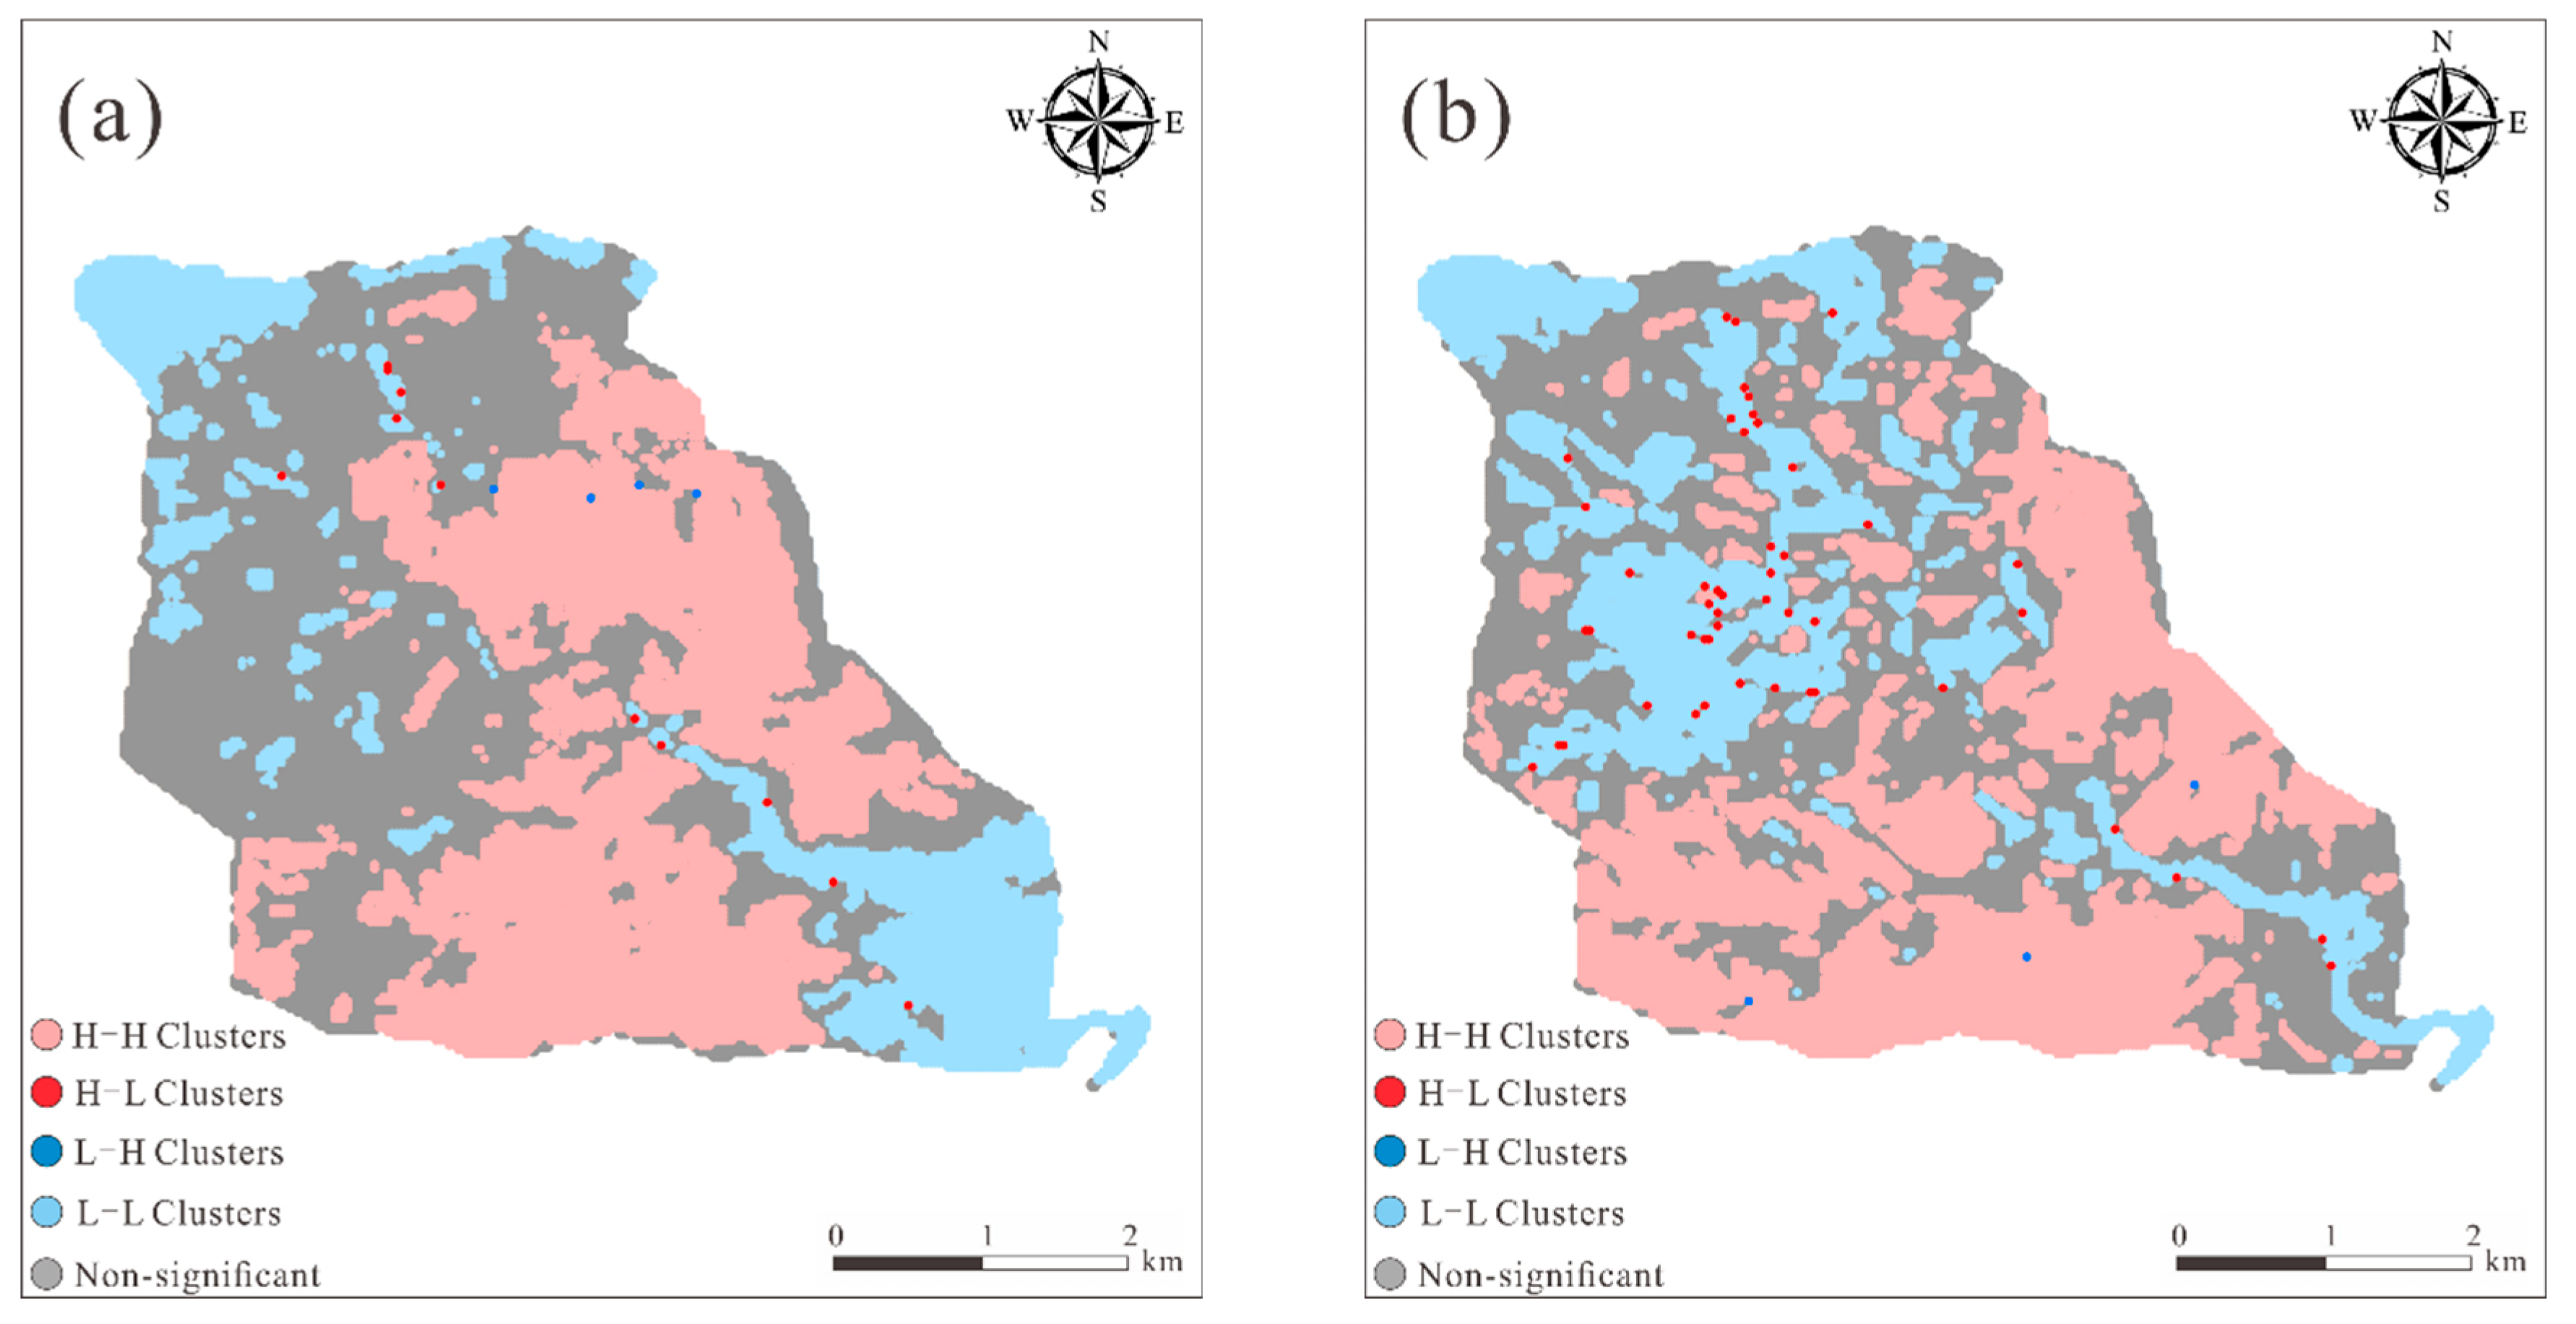
To investigate the spatial clustering characteristics of the NDVI, spatial autocorrelation analysis was performed for the following two time periods: 2000–2007 (pre-earthquake) and 2008–2022 (post-earthquake). The global spatial autocorrelation results revealed that the global Moran’s I values were 0.89 and 0.87, respectively, indicating a strong and significant positive spatial correlation in both periods. The results of the local spatial autocorrelation analysis are presented in
Figure 8.
A comparison of the NDVI clustering patterns between the two periods revealed significant dynamics in the spatial distribution of vegetation in the Chutou Gully watershed. During the pre-earthquake period (2000–2007), H-H clusters were concentrated along both sides of the gully in the source and deposition zones, indicating stable vegetation growth with minimal geological disturbance. The L-L clusters displayed a bimodal spatial distribution. In the Niujuan Gully area, the NDVI remained consistently low because of permanent snow cover in the high-altitude permafrost zone (elevation > 4000 m). In downstream residential areas within the source zone, reduced vegetation cover was attributed mainly to human disturbance.
Following the earthquake, a noticeable shift in clustering patterns was observed. H-H clusters were relocated to high-altitude mountain areas within the source and transport zones, where vegetation was largely unaffected by geological hazards and remained similar to pre-seismic conditions. Moreover, L-L clusters expanded, and new hazard-sensitive areas emerged, including the upper main gully, Datang Gully, Chutou Gully, and river channels within the transport zone. In these regions, secondary debris flows deposit large volumes of material, leading to a decline in the NDVI across the gully areas. The permafrost zone in Niujuan Gully has continued to exhibit persistently low vegetation cover.
Overall, the spatial clustering pattern of the NDVI was dominated by H-H and L-L clusters. Prior to the earthquake, the distribution was spatially differentiated, whereas in the post-earthquake period, clustering exhibited a patchy mosaic structure, with some areas forming large, contiguous zones of high or low vegetation activity [
37].
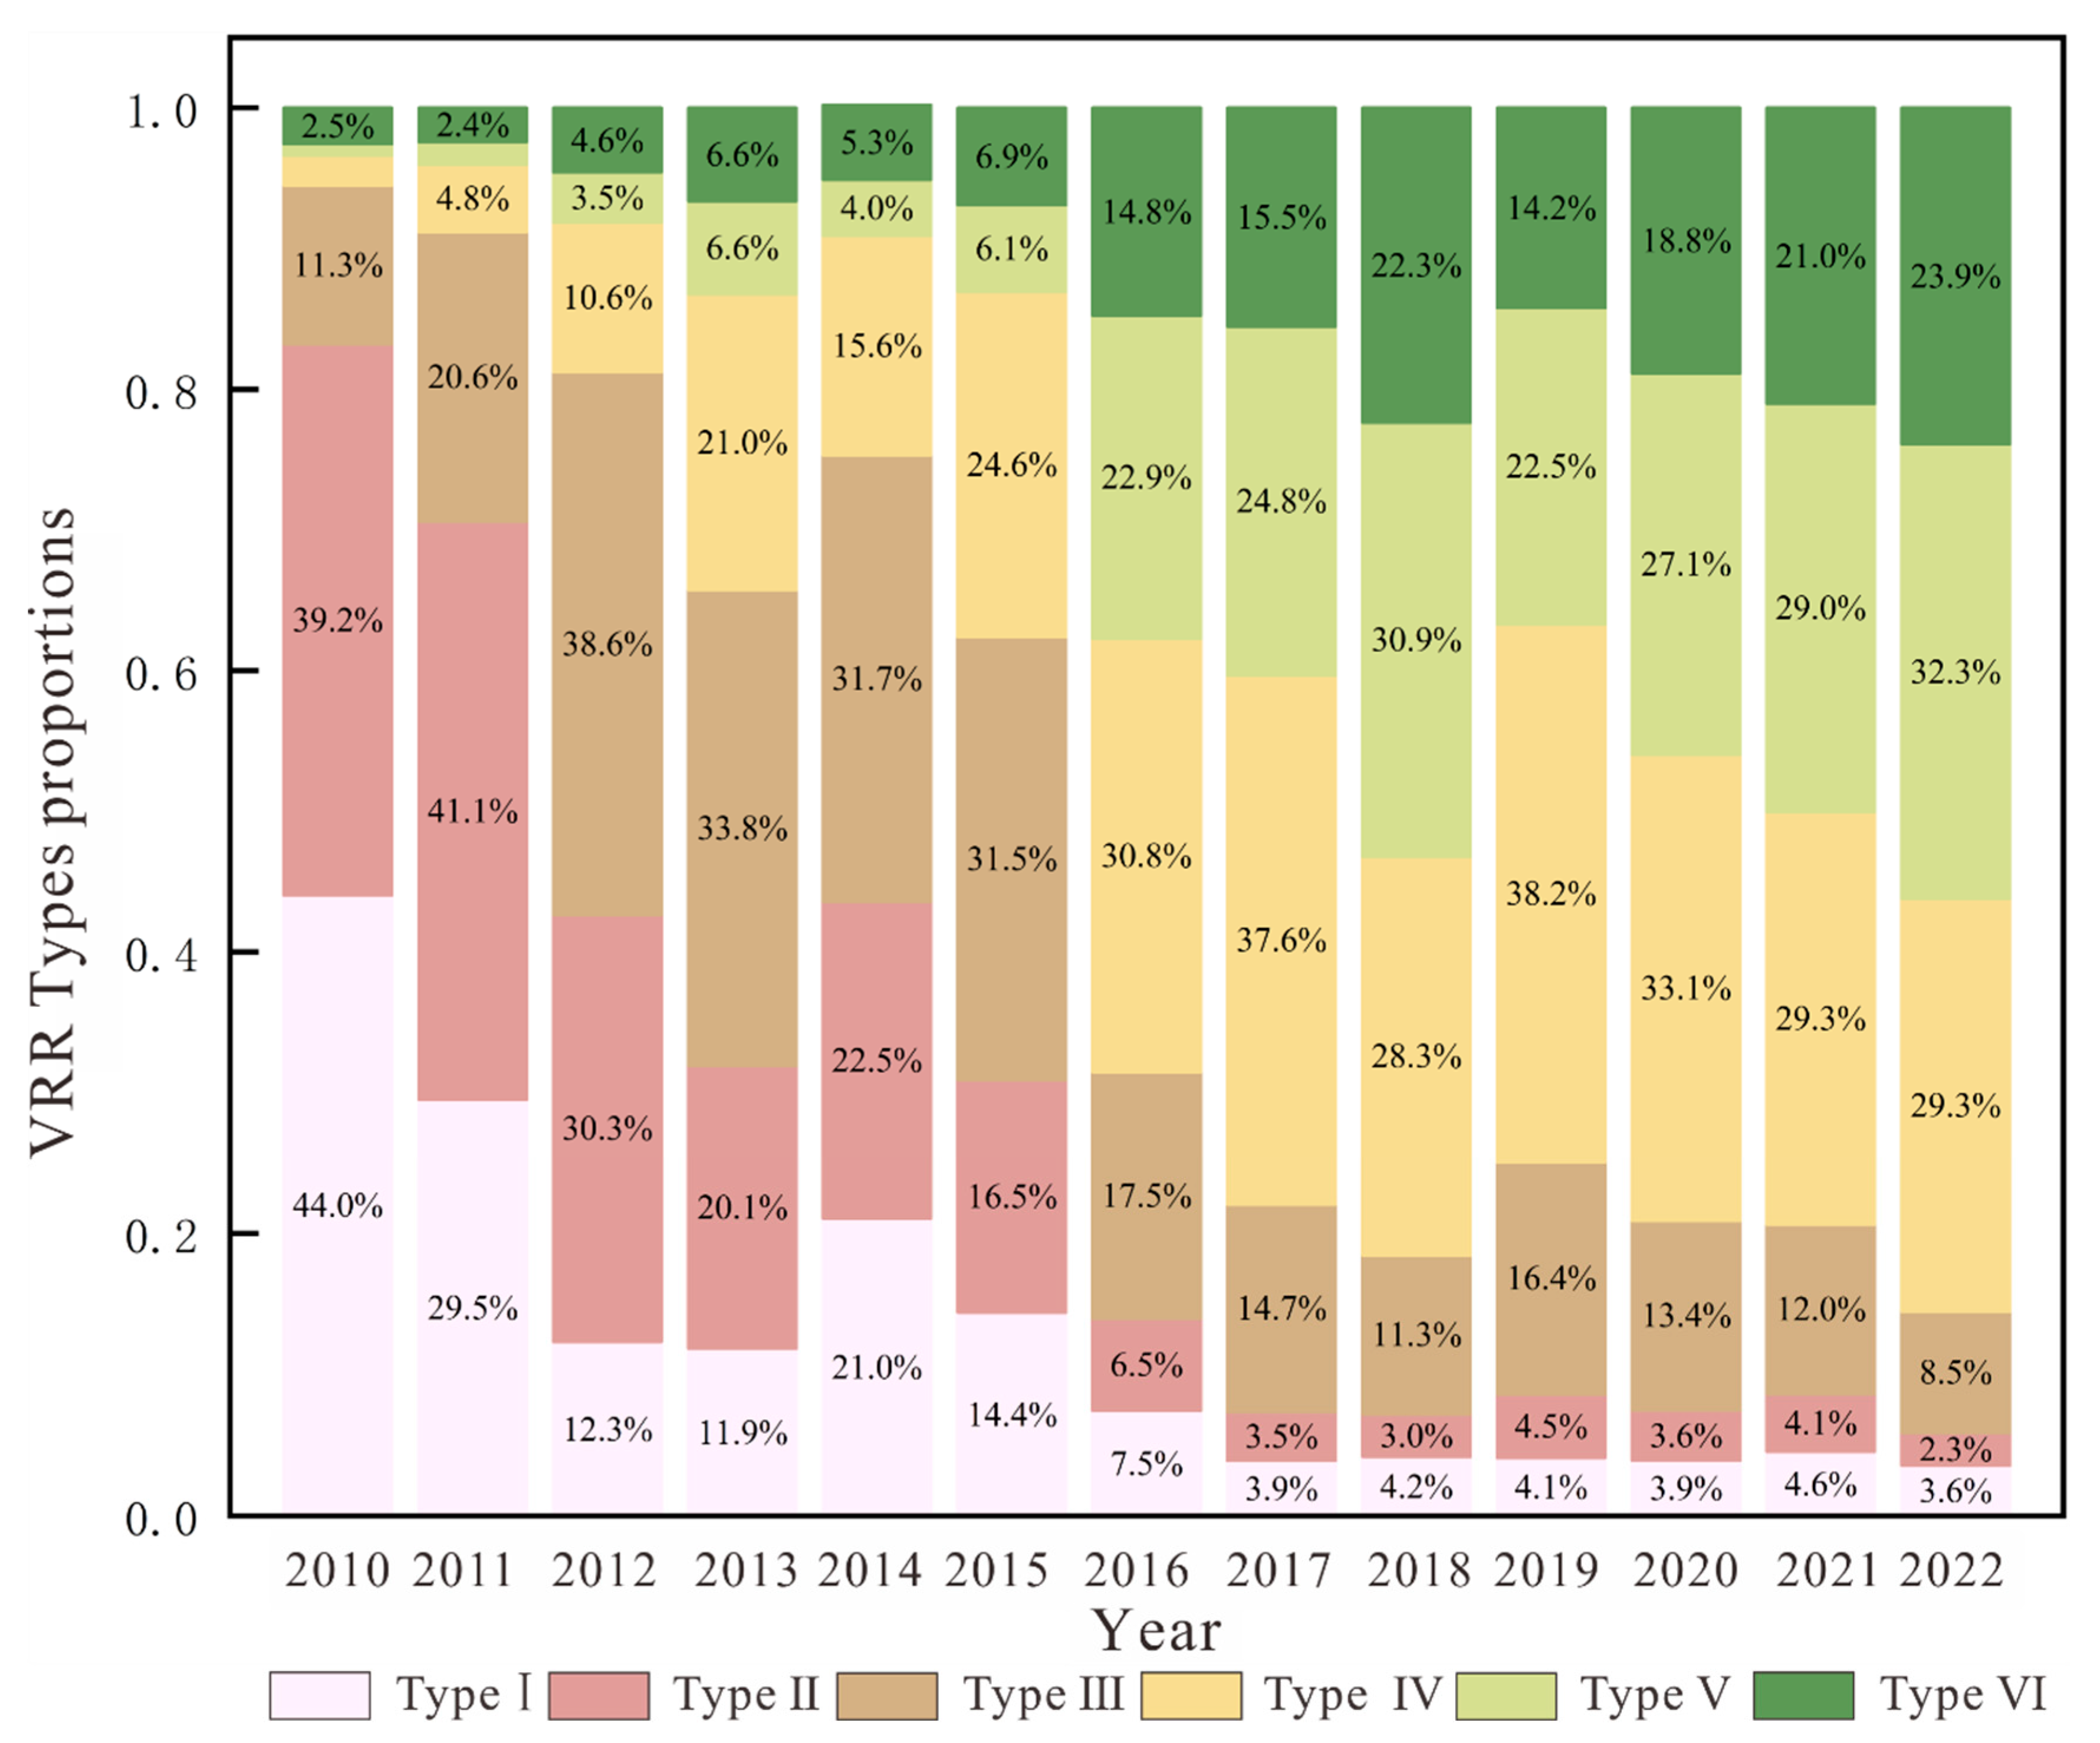
4.3. Vegetation Recovery Rate in the Chutou Gully Watershed
Figure 9 shows the trend of the vegetation recovery rate (VRR) in the Chutou Gully watershed following the earthquake disturbance. On the basis of recovery levels, VRR was classified into six types (Type I–Type VI). In this classification, Type I and Type II represent poor recovery, Type III and Type IV indicate moderate recovery, and Type V and Type VI represent good recovery. Given the upward trend of the NDVI since 2010, this study focuses primarily on vegetation recovery patterns from 2010–2022.
Analysis of VRR data from 2010–2022 revealed significant spatiotemporal heterogeneity in vegetation recovery across the study area. In the early post-seismic stage (2010–2013), the proportion of poorly recovered areas decreased markedly from 83.2% to 32%, indicating a general shift toward ecosystem recovery. Notably, in 2010, low-recovery zones were mainly concentrated in high-altitude regions, which may have experienced less initial earthquake damage (
Figure 10a). However, the debris flow event in 2014 caused a rebound in poorly recovered areas to 43.5%, highlighting the strong disruptive impact of secondary disasters on the recovery process (
Figure 10b,c).
Thereafter, the watershed entered a fluctuating recovery phase. From 2015–2018 (
Figure 10d), vegetation recovery improved significantly, yet consecutive debris flows in 2019 and 2020 led to another decline in recovery levels, especially in the upper reaches of Chutou Gully, where intense debris flow erosion likely damaged the vegetation structure, as this area serves as a primary sediment source zone (
Figure 10e). By 2022, the proportion of well-recovered areas increased to 56.2%. Natural recovery was most evident on stable terrain along both sides of the main river channel, whereas collapsing debris accumulation zones and exposed bedrock areas remained in low-recovery states due to harsh site conditions. These spatiotemporal patterns reflect the cumulative effects of geological hazards and the heterogeneity in vegetation recovery capacity across different zones (
Figure 10f).
4.4. Future Trends in Vegetation Change in the Chutou Gully Watershed
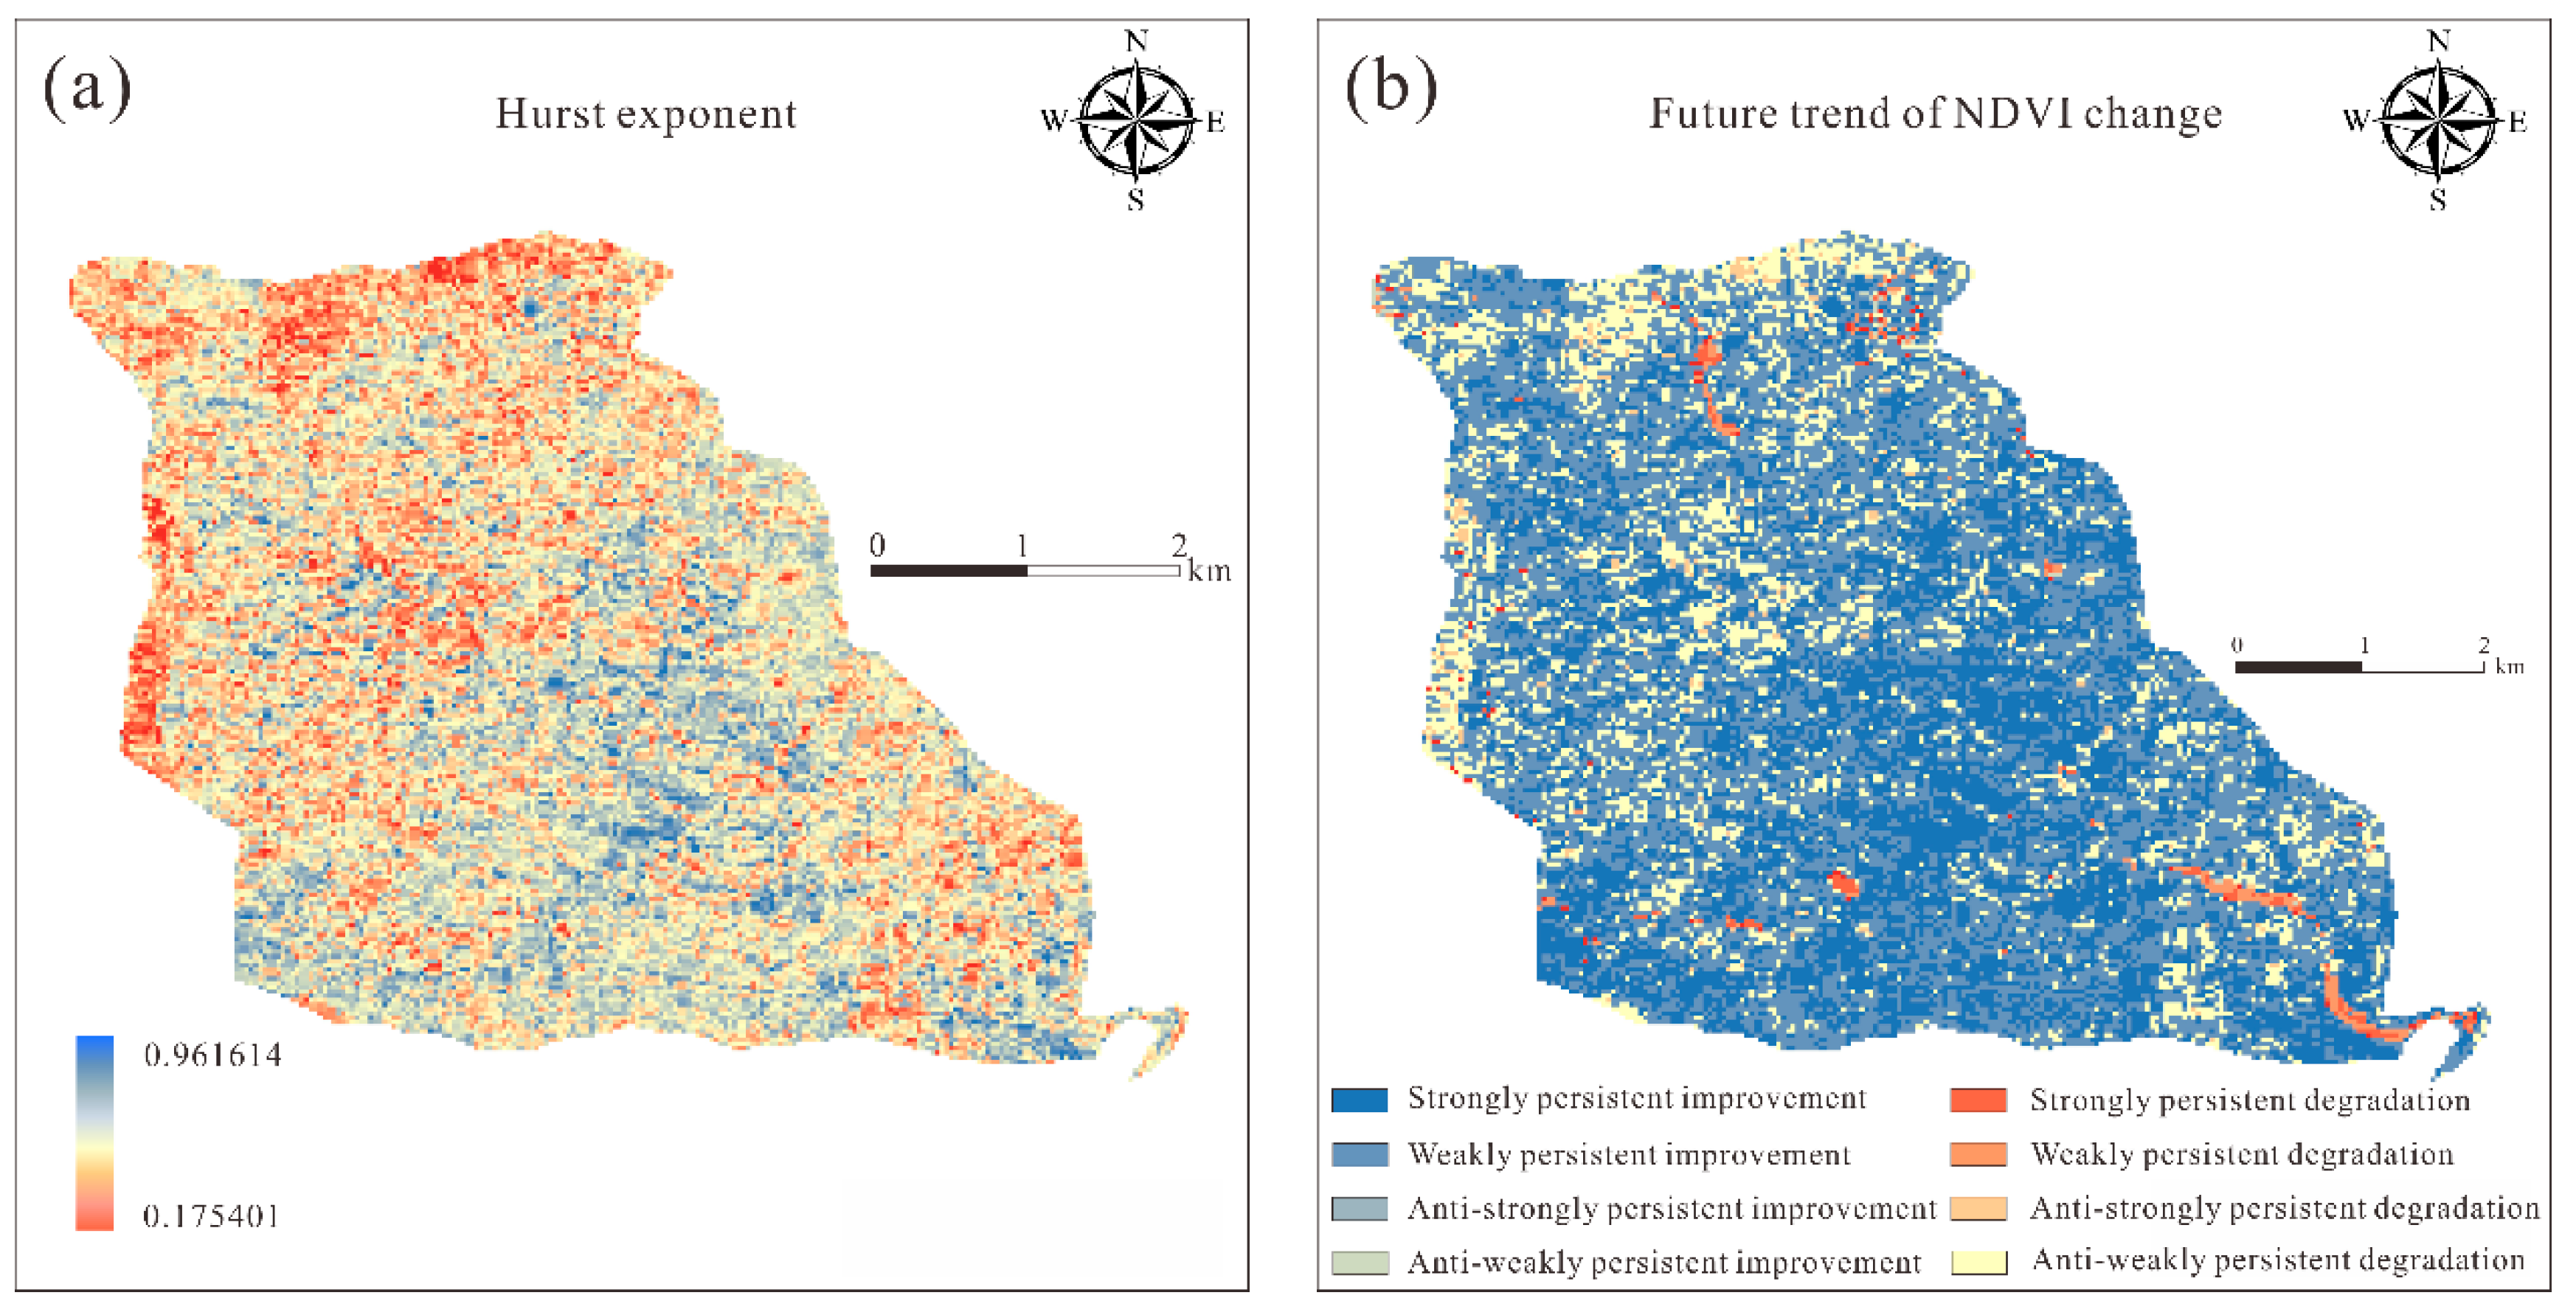
On the basis of the integrated analysis of the Theil–Sen Median trend analysis, the Mann–Kendall test, and the Hurst exponent for the period of 2008–2022, the vegetation change in the Chutou Gully watershed exhibited the following characteristics: the overall trend indicated persistent improvement, with strong persistence of improvement (32.26%) and weak persistence of improvement (48.08%) predominantly distributed along both sides of the gully. This suggests that vegetation recovery in these areas has high spatiotemporal stability.
Notably, degraded zones account for only a small proportion of the watershed, with strong and weak persistence of degradation accounting for just 0.78% and 0.87%, respectively (
Table 5). In the source area, exposed collapse deposits with limited material mobility act as major barriers to vegetation recovery. In the downstream sections of the transport zone, the combined effects of debris flow deposition and road construction led to a sustained decline in the NDVI values (
Figure 11).
Based on the temporal variation of NDVI and the results of the Hurst exponent analysis, the NDVI in the Chutou Gully watershed is projected to exhibit an overall increasing trend in the future. However, the steep gorge terrain and remoteness of the source area pose significant challenges to debris management, while infrastructure development, such as road construction in the downstream transport zone, is a key driver of anticipated vegetation degradation. Overall, vegetation dynamics in the watershed are jointly driven by geological conditions and human activities, underscoring the need for targeted and differentiated ecological restoration strategies in degradation-sensitive areas.
5. Debris Flow Impact Extent and Its Influence on the NDVI
5.1. Spatiotemporal Extent of Debris Flow Impact
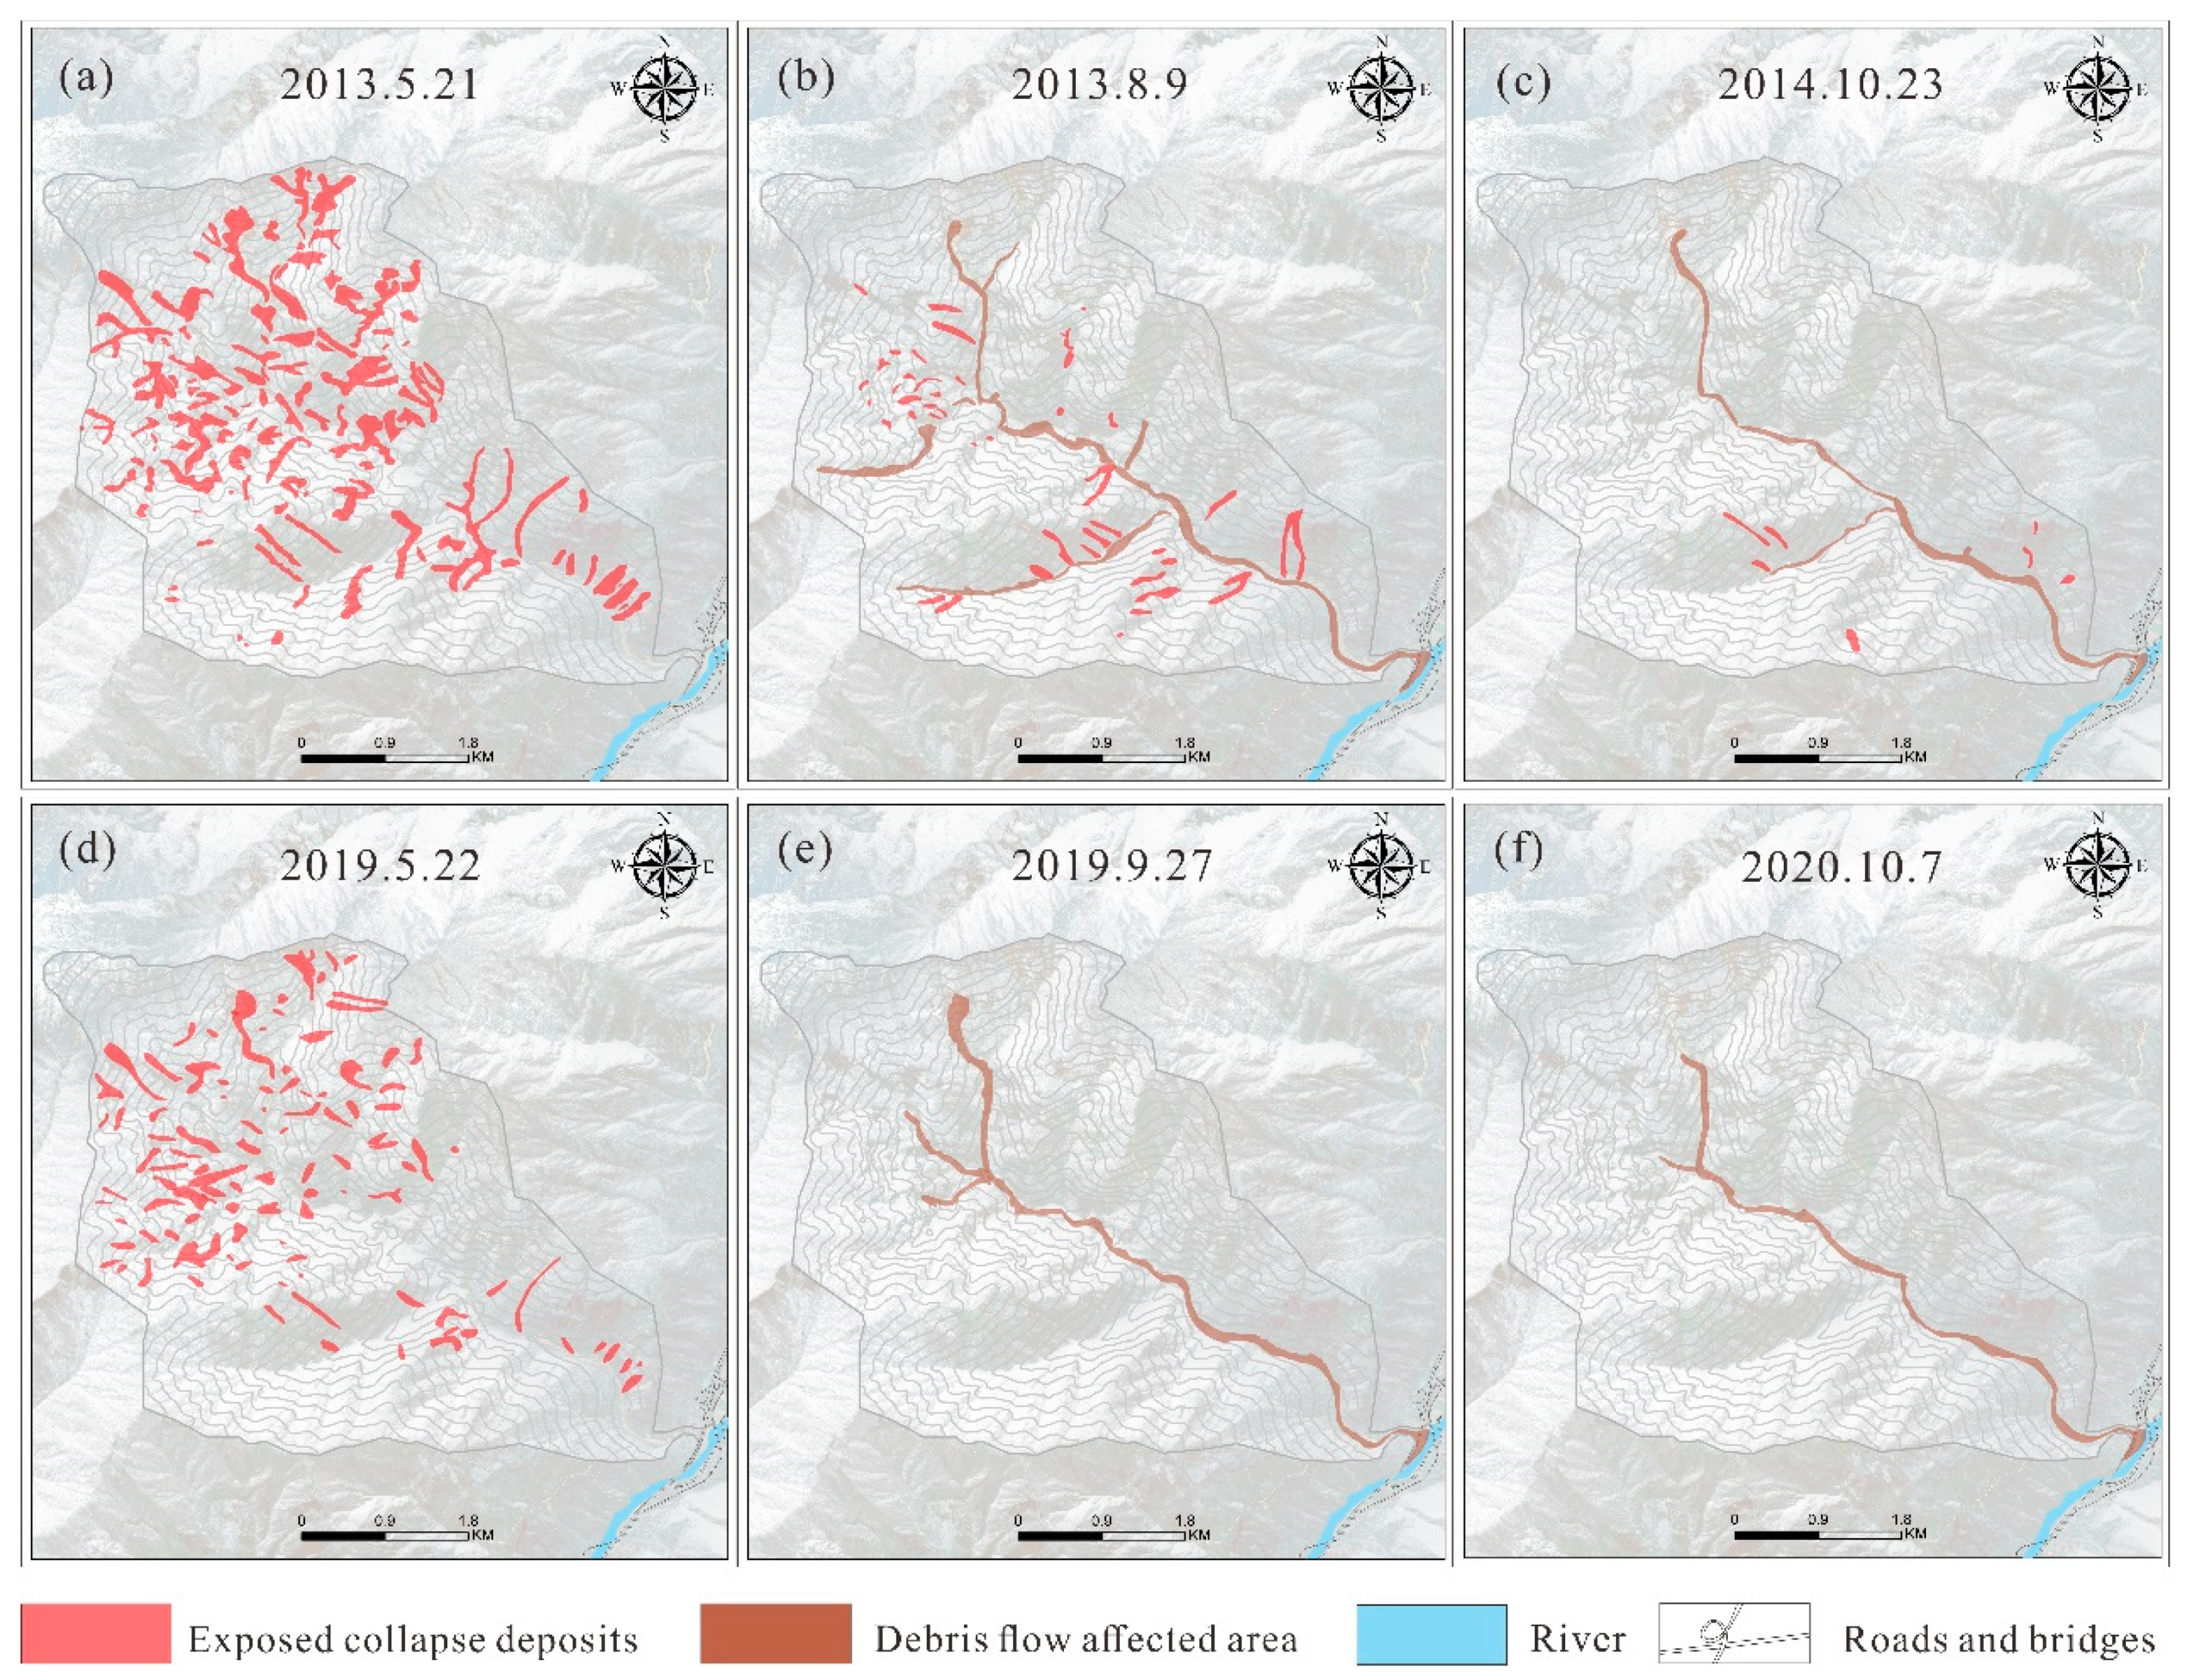
To assess the ecological impacts of four post-earthquake debris flow events in the Chutou Gully watershed, this study employed a multitemporal remote sensing comparative analysis approach to systematically reveal the evolution mechanisms of surface ecological disturbances caused by secondary debris flow hazards. On the basis of the temporal sequence of debris flow occurrences, satellite images captured before and after each of the four events were selected. Using visual interpretation and spatial overlay techniques, the following three key elements were extracted: (1) the spatial distribution of pre-event exposed collapse deposits; (2) the incremental distribution of newly formed collapse deposits following debris flows; and (3) the spatial evolution of debris flow transport zones.
On this basis, a set of dynamic impact maps was developed to illustrate the changing spatial extent of each debris flow event. Specifically, the pre-disaster image from 21 May 2013 was used to visually extract exposed slope failures as potential debris sources (
Figure 12a). The image from 9 August 2013 was then spatially overlaid to identify newly exposed deposits and the impact zone of the 2013 debris flow (
Figure 12b). The image from 23 October 2014 captured a subsequent stage close to the 2013 event; on the basis of previous interpretation results, newly affected areas and fresh debris deposits were extracted through comparison (
Figure 12c). Against the background of natural recovery, the image from 22 May 2019 was used to delineate residual debris sources potentially triggering the 2019 event (
Figure 12d). This analytical method was extended to the 27 September 2019 and 7 October 2020 images, in which debris flow boundaries and new deposit zones for 2019 and 2020 were determined via spatial overlay with prior interpretation results (
Figure 12e,f).
The 2013–2020 debris flow sequence analysis revealed that the study area experienced dynamic contraction in the impact range. The initiation zones of debris flows were widespread in Chutou Gully, Datang Gully, Xiao Gully, and the upper reaches of the main gully in 2013. By 2014, activity was concentrated in the Chutou and Xiao gullies. In 2019, debris flows reappeared in the Chutou, Datang, and upper main gully areas, but by 2020, only a single tributary in Chutou Gully remained active, reflecting a clear trend of spatial adjustment. The evolution of collapse deposits closely corresponded with vegetation recovery. In 2013, owing to unstable vegetation cover and debris flow impacts, large areas of exposed slope failures emerged along both sides of tributaries. By 2014, collapse activity weakened, with only small deposits appearing near ridgelines. After 2019, as the vegetation continued to regenerate, the slopes stabilized, and no new exposed deposits were detected for two consecutive years.
These findings suggest a dual mechanism for the attenuation of debris flow activity. On the one hand, river incision and successive post-seismic debris flows may have transported and depleted the available loose sediment over time; on the other hand, vegetation recovery effectively suppressed the formation of new collapse deposits and progressively limited the extent of the debris flow. This provides compelling evidence for the long-term regulatory role of ecological restoration in mitigating geological hazards [
38,
39].
5.2. Effects of Debris Flow Activity on the NDVI
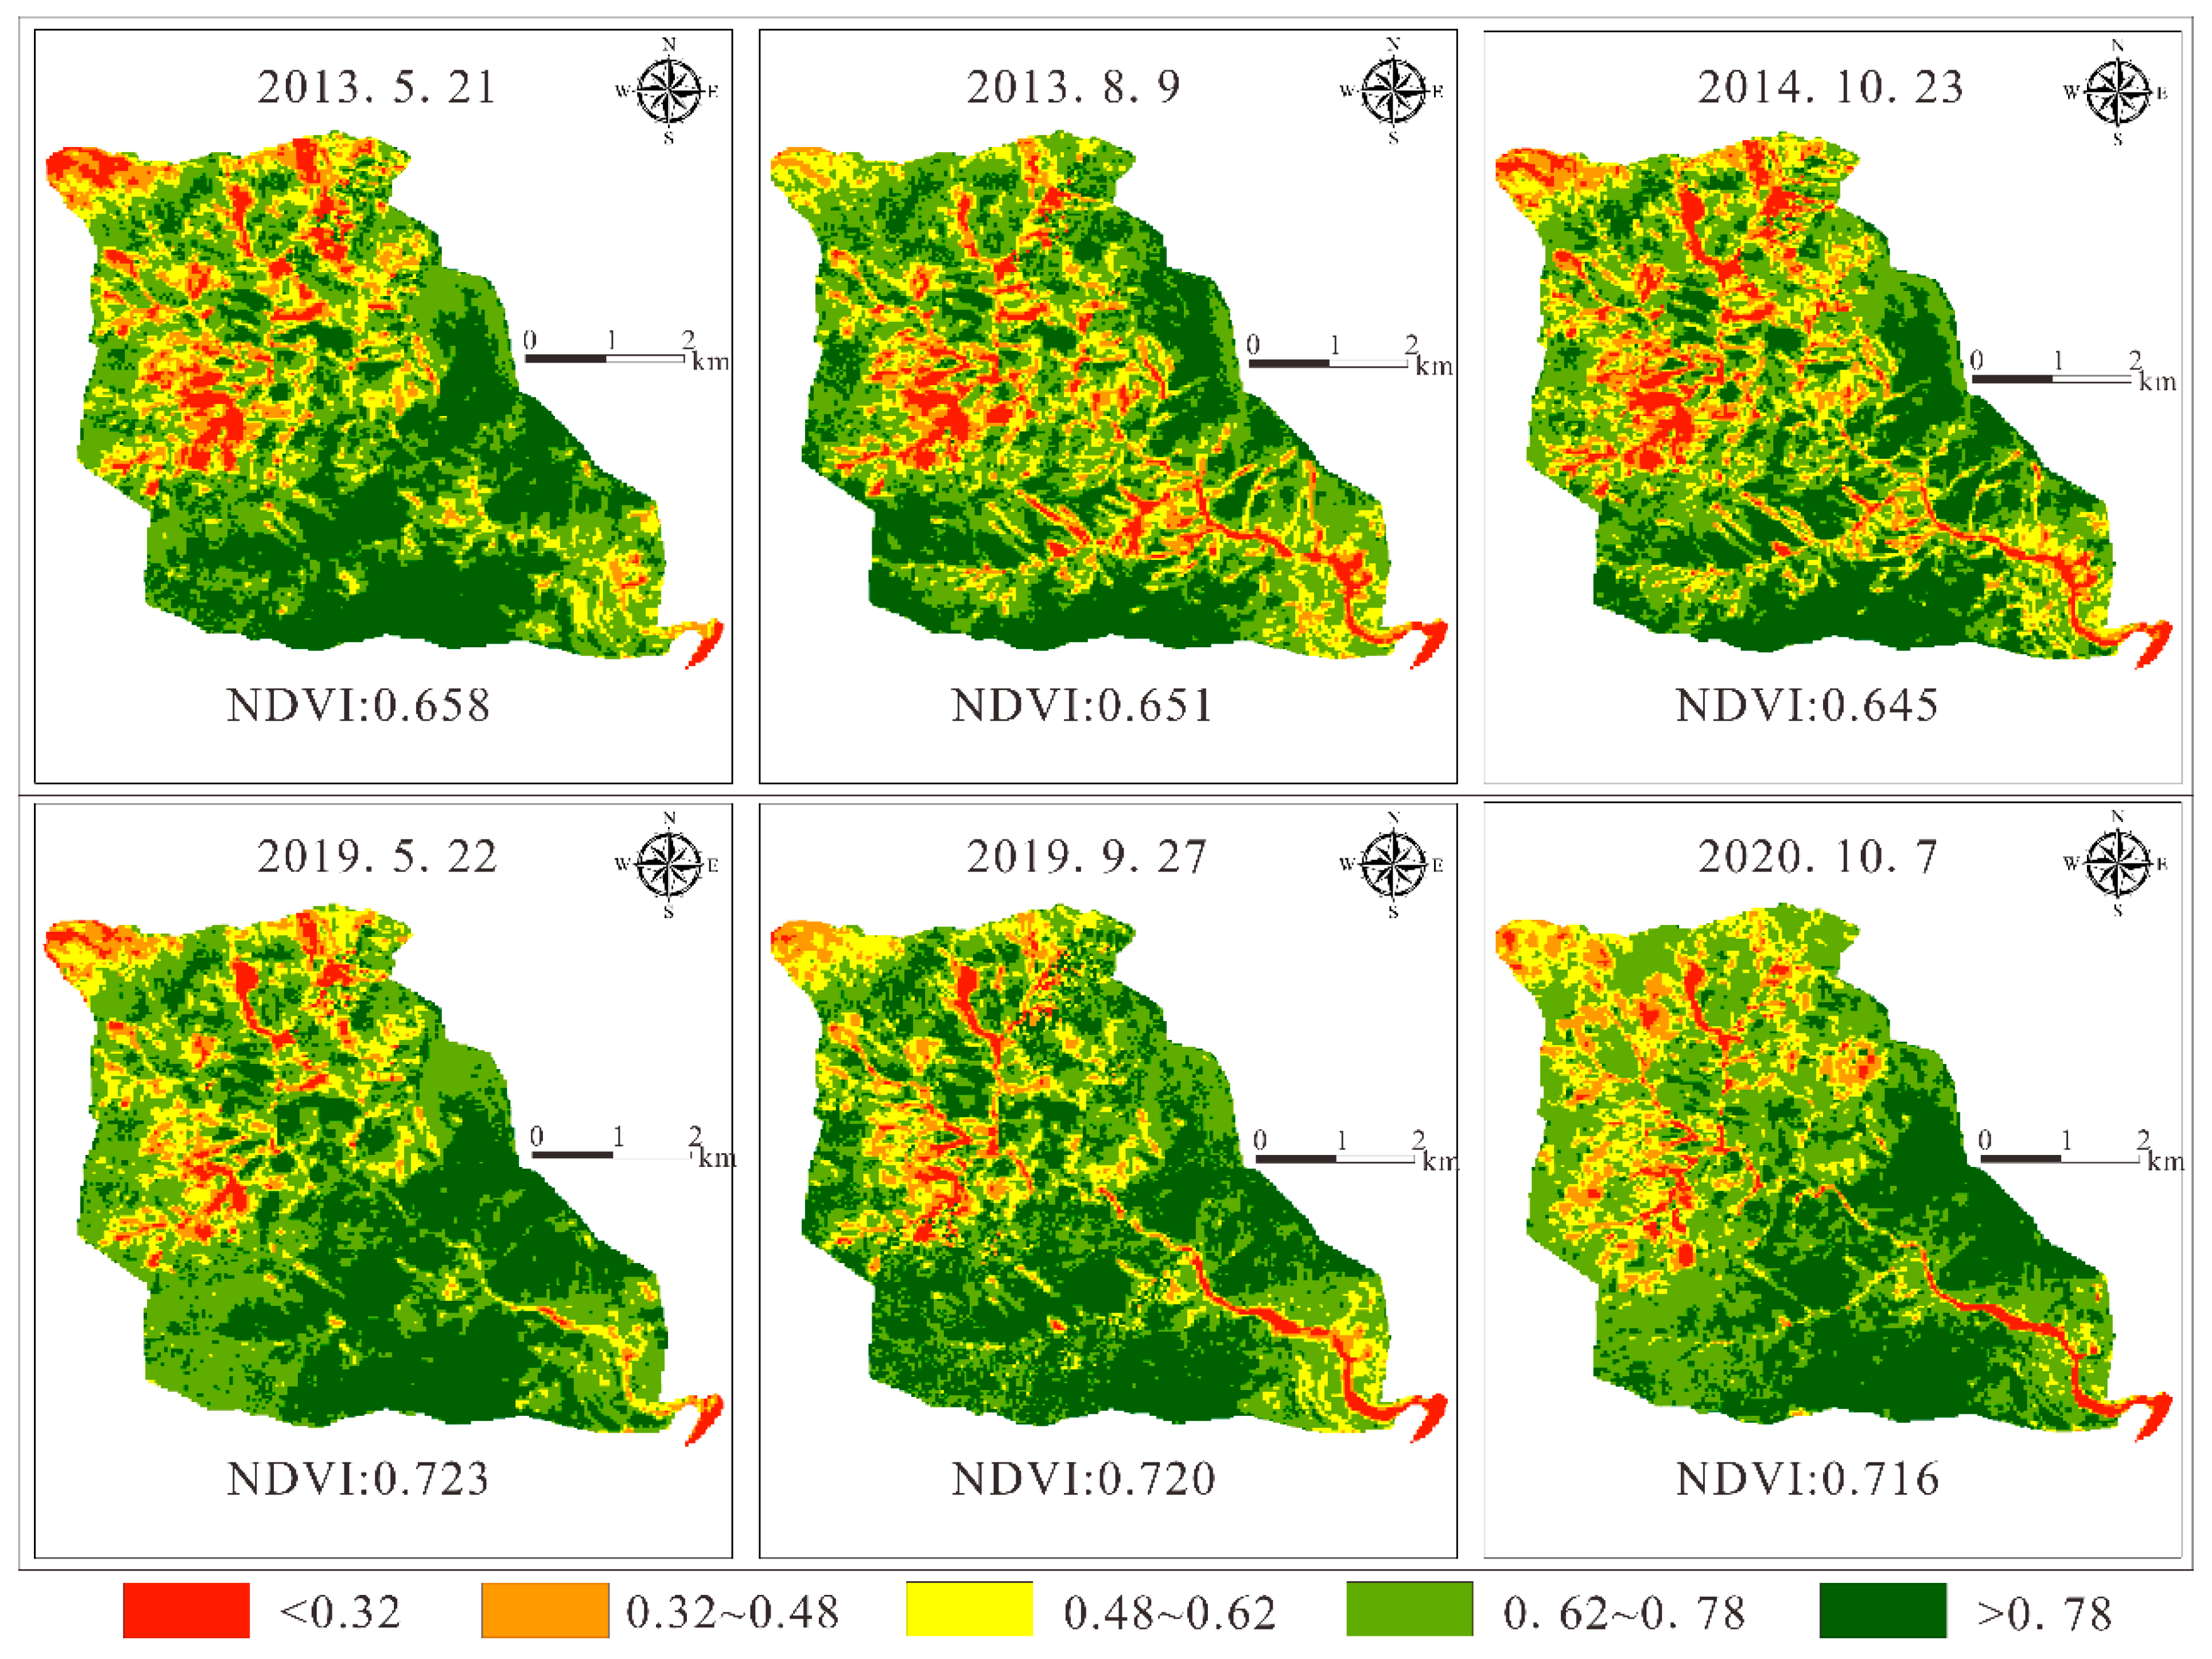
On the basis of the selected imagery dates from the previous section, the NDVI values were extracted and analyzed via multitemporal remote sensing data to generate NDVI spatial distribution maps for the Chutou Gully watershed on representative dates (
Figure 13). On 21 May 2013, the NDVI was 0.658. In August 2013, the first debris flow event caused the expansion of channel deposits and destruction of vegetation cover, resulting in a decrease to 0.651. In October 2014, a second debris flow introduced a small amount of newly exposed bedrock, and the vegetation in the previously impacted areas had not yet recovered. The cumulative disturbance led to a further decline in the NDVI to 0.645. After five years of natural recovery, the NDVI significantly increased to 0.723 in May 2019. The third debris flow, which occurred in September 2019, did not create new exposed areas and caused only a slight decrease to 0.720. The October 2020 event, dominated by loose material transport rather than fresh erosion, did not cause substantial vegetation loss, with the NDVI slightly decreasing to 0.716.
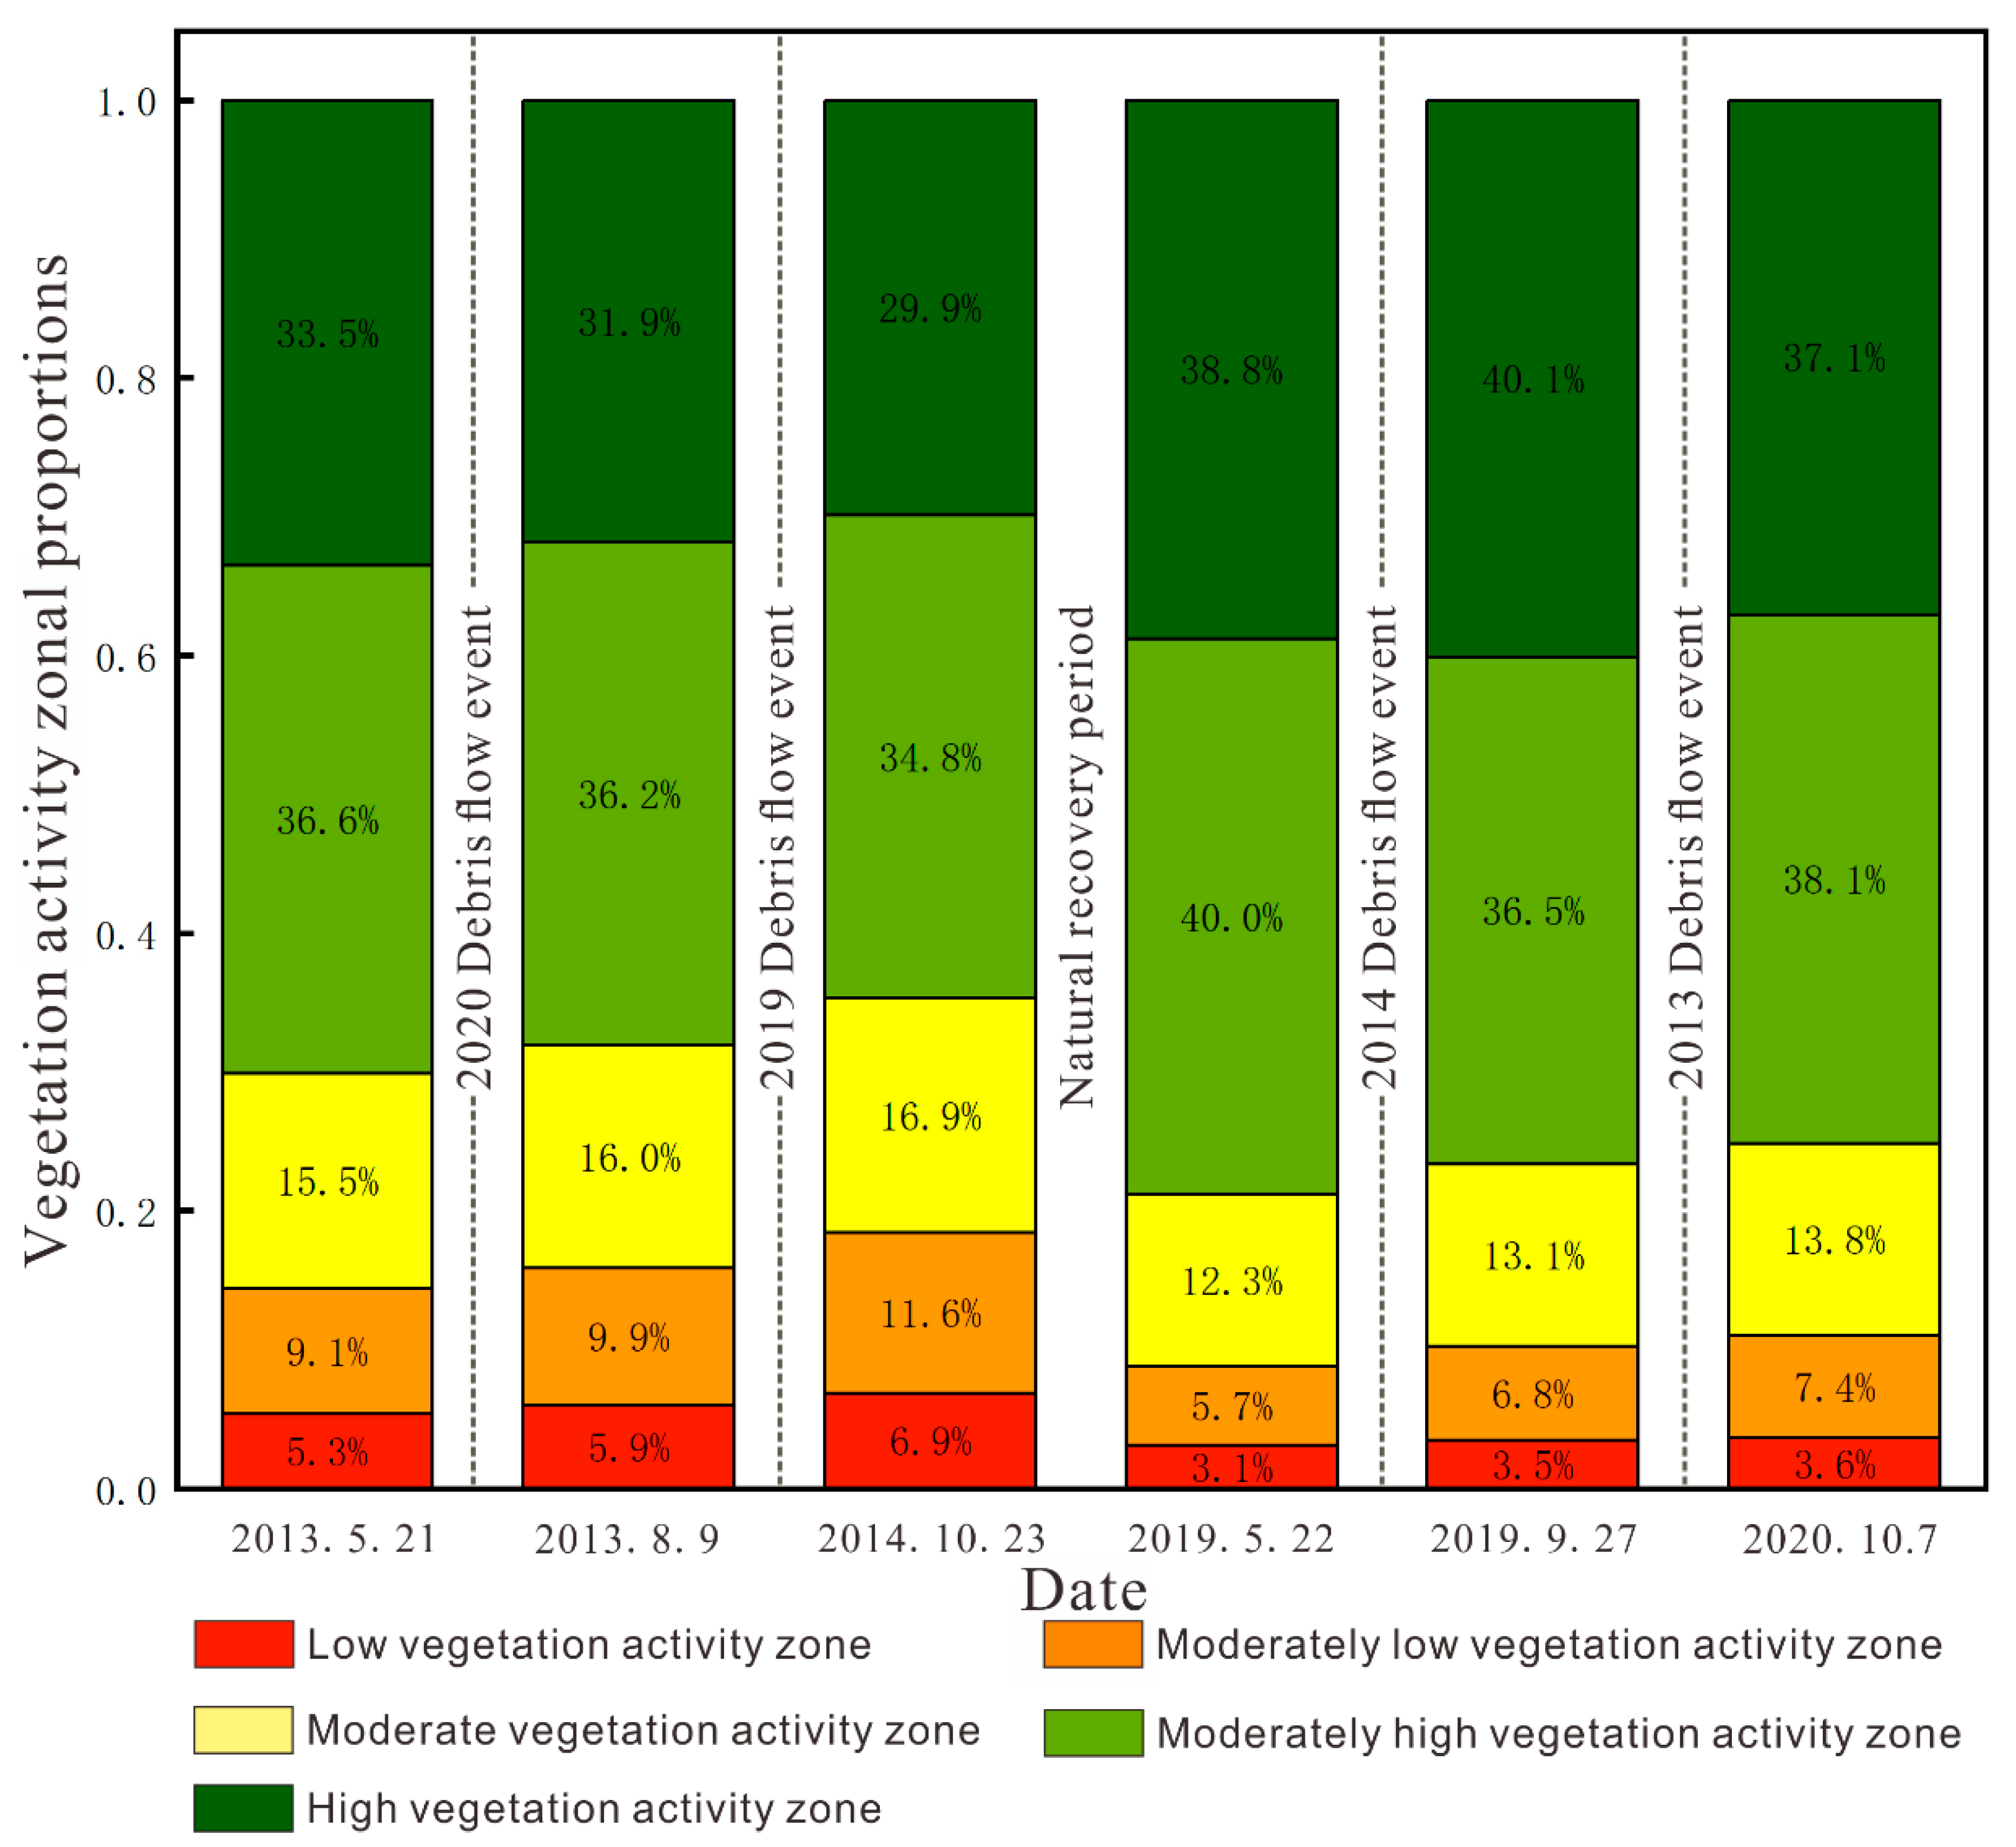
The NDVI values for these selected dates were categorized into vegetation activity levels following the classification method outlined previously. As shown in
Figure 14, the consecutive debris flows from 2013–2014 resulted in significant ecological changes. In addition to newly exposed surfaces and increased channel sediment, the proportion of zones with low and moderately low vegetation activity increased from 14.4% to 18.5%, whereas the proportion of zones with high and moderately high vegetation activity decreased from 70.1% to 64.7%. Over the subsequent five-year natural recovery period, the ecosystem demonstrated strong resilience, with low-activity zones declining steadily to 8.8%, and high-activity zones rising to 78.8%. However, disturbances from 2019–2020 interrupted this trend, with the proportion of low-activity zones rebounding to 11.0% and that of high-activity zones slightly declining to 75.2%.
This evolution process highlights the destructive effects of debris flow disturbances on vegetation activity, with impact intensity inversely correlated with post-disaster recovery time. During the early post-disaster stage (2013–2014), weak ecological foundations resulted in high sensitivity of vegetation, as follows: the proportion of low-activity zones increased by 4.1%, whereas high-activity zones decreased by 5.4%, reflecting the vulnerability of newly regenerated vegetation. In contrast, from 2019–2020, after several years of ecological recovery, the system exhibited enhanced stability through self-repair mechanisms. Even under higher-intensity debris flow events, only minor changes were observed, as follows: low-activity zones increased by 2.2%, and high-activity zones declined by 3.6%, indicating a significant reduction in vegetation loss compared to that in the early phase. This differentiated response suggests a progressive increase in ecosystem resistance over time, where vegetation communities build stronger disaster resilience mechanisms through structural reorganization and functional optimization [
40,
41].
6. Discussion
This study systematically revealed the post-seismic vegetation recovery dynamics and future trends in the Chutou Gully watershed of the Wenchuan earthquake zone, where cascading geological hazards, such as debris flows, exert persistent ecological pressure. By integrating multi-scale remote sensing and spatial analysis techniques, the findings enrich the theoretical framework of post-earthquake ecosystem succession and provide insight into vegetation resilience under complex disturbance regimes. These insights are also essential for informing sustainable ecological planning and land management in mountainous hazard-prone regions.
The results show that the annual NDVI recovery rate in the study area is 0.119, which is notably lower than the recovery rates observed in areas undergoing natural succession without recurrent secondary hazards [
42]. This suggests that frequent disturbances, such as debris flows, significantly inhibit the self-recovery of ecosystems [
43]. Compared to findings from more geomorphologically stable Wenchuan-affected regions—such as those reported by Lv et al. [
44]—the lower recovery rate observed here underscores the cumulative suppressive effect of repeated debris flow events. This highlights the importance of considering not only the initial seismic impact, but also the prolonged influence of secondary hazards when evaluating recovery potential. Such long-term limitations must be addressed to support the sustainability of vegetation restoration in earthquake-impacted environments.
Further analysis revealed that high-frequency hazard events caused temporary declines in NDVI, while extended intervals between events allowed for increased ecosystem resistance, resulting in a cyclical “disturbance–recovery” pattern. This observation is consistent with established theories of ecosystem resilience [
10]. Spatially, low-NDVI clusters shifted progressively toward debris flow channels, indicating degradation of site conditions due to sediment deposition. In contrast, slope areas—benefiting from relative geomorphic stability—showed better recovery outcomes. These patterns confirm previous insights regarding the role of terrain in controlling post-disturbance vegetation heterogeneity [
45]. Understanding these spatial dynamics is fundamental for designing sustainability-oriented restoration strategies adapted to varied topographic conditions.
In terms of methodology, this study constructed a dual-parameter NDVI trend identification and prediction model by combining Theil–Sen trend estimation, Mann–Kendall significance testing, and Hurst exponent analysis. This approach improved the accuracy of long-term trend classification. The Hurst exponent results show that 80.34% of the watershed exhibited a persistent improvement trend, with these areas mainly located along stable slopes. While the direct field validation data were limited, the consistency of these trends with observed protective engineering zones and slope-based recovery areas—as also found in studies such as that by Sun et al. [
46]—provides indirect validation of model reliability. Moreover, the model’s capacity to capture the spatial heterogeneity of resilience is supported by its alignment with geomorphological gradients and historical debris flow pathways.
However, model performance was less accurate in some degradation-prone areas. This contrasts with findings from flatter terrains where prediction accuracy tends to be higher, such as in the work by Jiao et al. [
47]. One likely reason is the complex microtopography of the Chutou Gully watershed, which alters sediment transport patterns and introduces small-scale variability that is not fully captured by the current dataset resolution. Additionally, unquantified anthropogenic activities—such as informal road expansion and construction—may have affected local vegetation dynamics. These discrepancies point to the need for incorporating high-resolution terrain indices and human disturbance indicators in future modeling efforts to better explain localized degradation processes.
From a practical perspective, the destructive influence of debris flows on vegetation appears to diminish over time, indicating that the first five years post-disaster constitute a critical intervention window. During this period, artificial restoration measures—such as seeding and improvement of soil conditions—can effectively accelerate early-stage vegetation recovery [
48]. In the long term, the following distinct spatial trends have emerged: areas with strongly persistent improvement (32.26%) exhibit high natural recovery potential and may be preserved through passive restoration strategies, while weakly persistent degradation zones (0.87%) remain highly sensitive to sediment disturbance and require active ecological engineering measures, such as slope stabilization and erosion control. These findings underscore the importance of tailoring restoration strategies to local vegetation dynamics and disturbance sensitivity within debris flow-affected landscapes.
Despite these contributions, this study has several limitations. First, the 30-m resolution of the NDVI dataset may be insufficient in areas with complex microtopography, potentially leading to pixel mixing and reduced accuracy in characterizing fine-scale vegetation patterns. Incorporating higher-resolution remote sensing data (e.g., UAV or LiDAR imagery) in future research would help overcome this limitation. Second, NDVI alone cannot fully represent changes in vegetation type or community structure. Integrating field investigation data and species-specific remote sensing indicators could enhance ecological interpretation. Finally, while the Hurst exponent effectively characterizes trend persistence, it does not reveal underlying drivers. Future studies should consider multi-factor coupling analyses involving terrain, climate, and human activity to deepen understanding of the mechanisms behind vegetation dynamics. Furthermore, model reliability could be improved through validation with long-term field monitoring or high-resolution imagery comparison.
7. Conclusions
Understanding the long-term ecological impact of the Wenchuan earthquake and its associated cascading geological hazards is essential for evaluating vegetation resilience and informing ecological restoration in seismically active mountainous regions. Based on long-term NDVI time series data (2000–2022) and multi-scale spatial analysis methods, this study systematically examined the vegetation recovery dynamics and future trends in the Chutou Gully watershed. The results revealed that the average NDVI dropped sharply from 0.793 to 0.575 after the earthquake, followed by a gradual recovery at an average annual rate of 0.119. Projections indicate a return to pre-earthquake levels by approximately 2030. This recovery generally follows an alternating “disturbance–recovery” cycle influenced by repeated debris flow events.
Spatially, post-earthquake vegetation degradation was most prominent in gully channels affected by debris flow deposition, while slopes on both sides showed significant recovery due to relative geomorphological stability. From 2010 to 2022, the area classified as poorly recovered declined from 83.2% to 5.8%, while well-recovered areas increased to 56.2%, indicating an improved disaster resistance threshold over time. According to Hurst exponent analysis, 80.34% of the study area shows signs of sustained vegetation improvement, with 32.26% exhibiting strong persistence. However, degradation hotspots persist in collapse accumulation zones and areas affected by human disturbances, where targeted restoration strategies are needed. Importantly, vegetation regrowth not only enhanced ecological stability, but also contributed to the long-term suppression of debris flow reactivation by stabilizing loose sediment sources.
This study contributes to the understanding of post-seismic vegetation resilience and offers a practical methodology for trend analysis in other earthquake-impacted watersheds. However, several limitations should be noted. The 30-m NDVI resolution may be inadequate for capturing fine-scale vegetation changes in rugged terrain. Future work should incorporate high-resolution data and field-based vegetation indicators to better assess structural recovery. Furthermore, while the Hurst exponent identifies persistence, it does not explain underlying drivers. Future studies should adopt multi-factor frameworks—integrating terrain, climate, and anthropogenic influences—to deepen our understanding of vegetation dynamics and support resilient and sustainable ecological management in seismically active regions.


