
Drainage Network Generation for Urban Pluvial Flooding (UPF) Using Generative Adversarial Networks (GANs) and GIS Data

 ,
,  , and
, and 
Abstract

1. Introduction
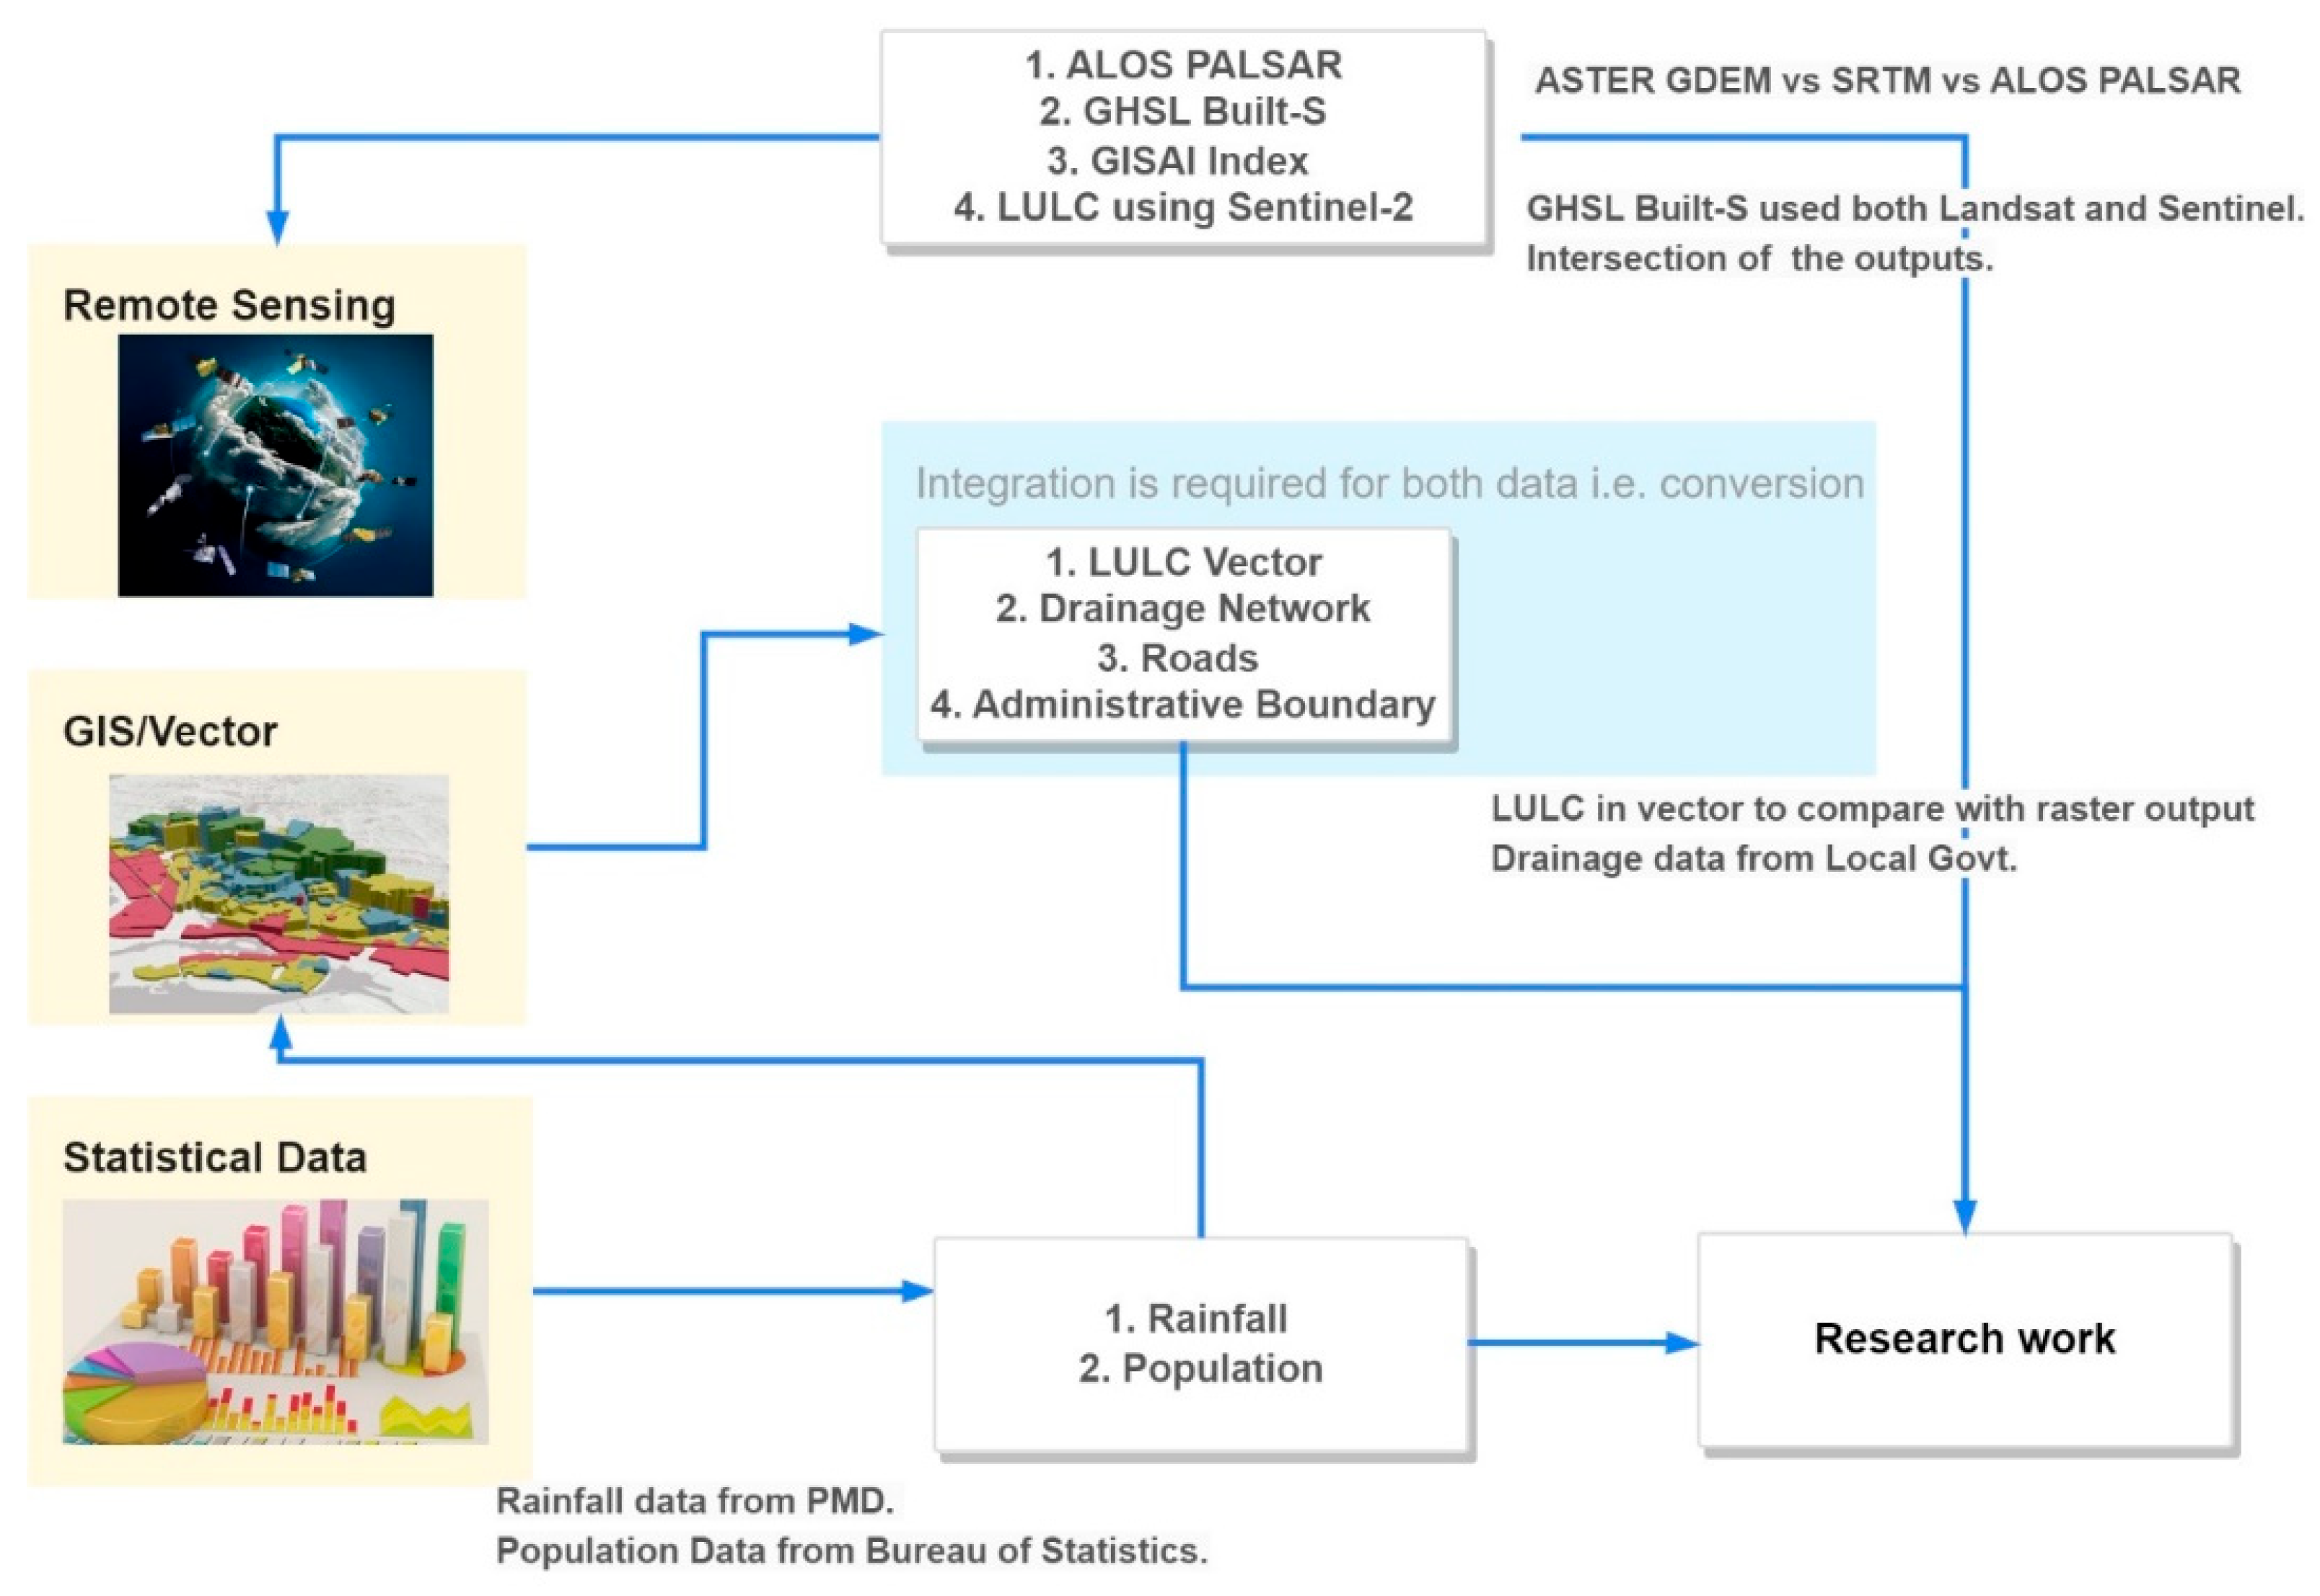
2. Dataset
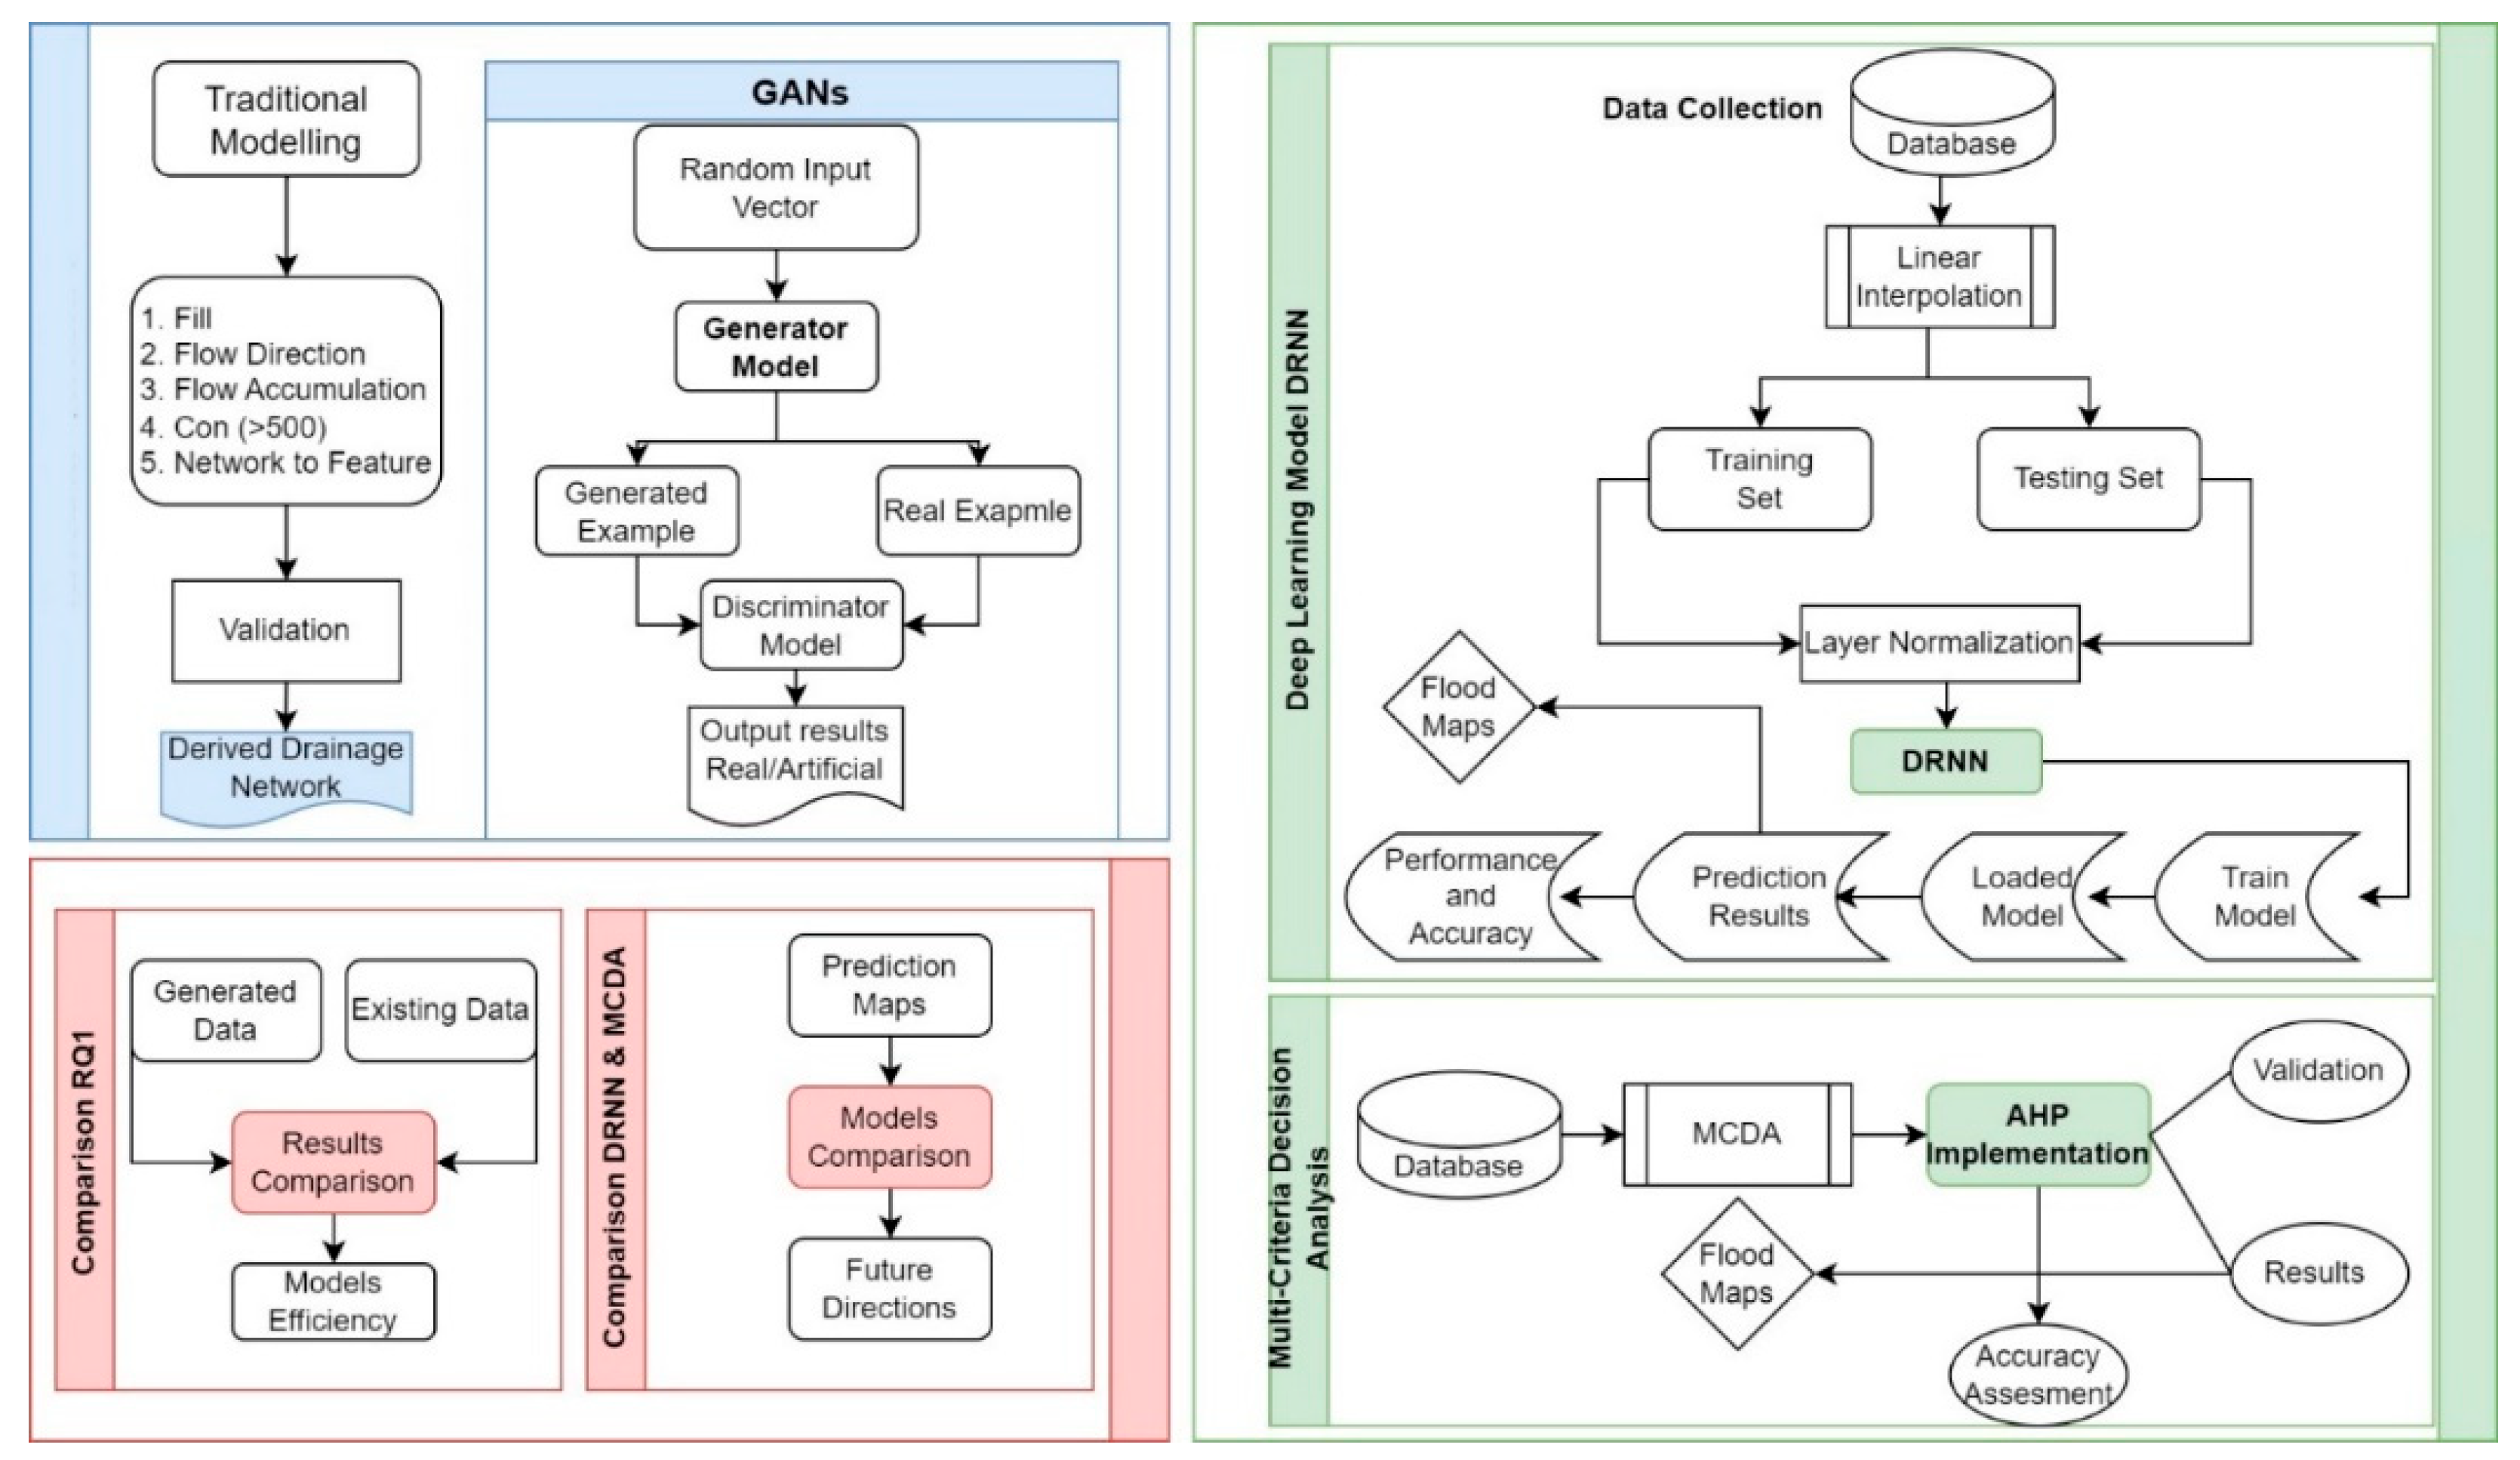
3. Methodology
3.1. Data Collection and Pre-Processing
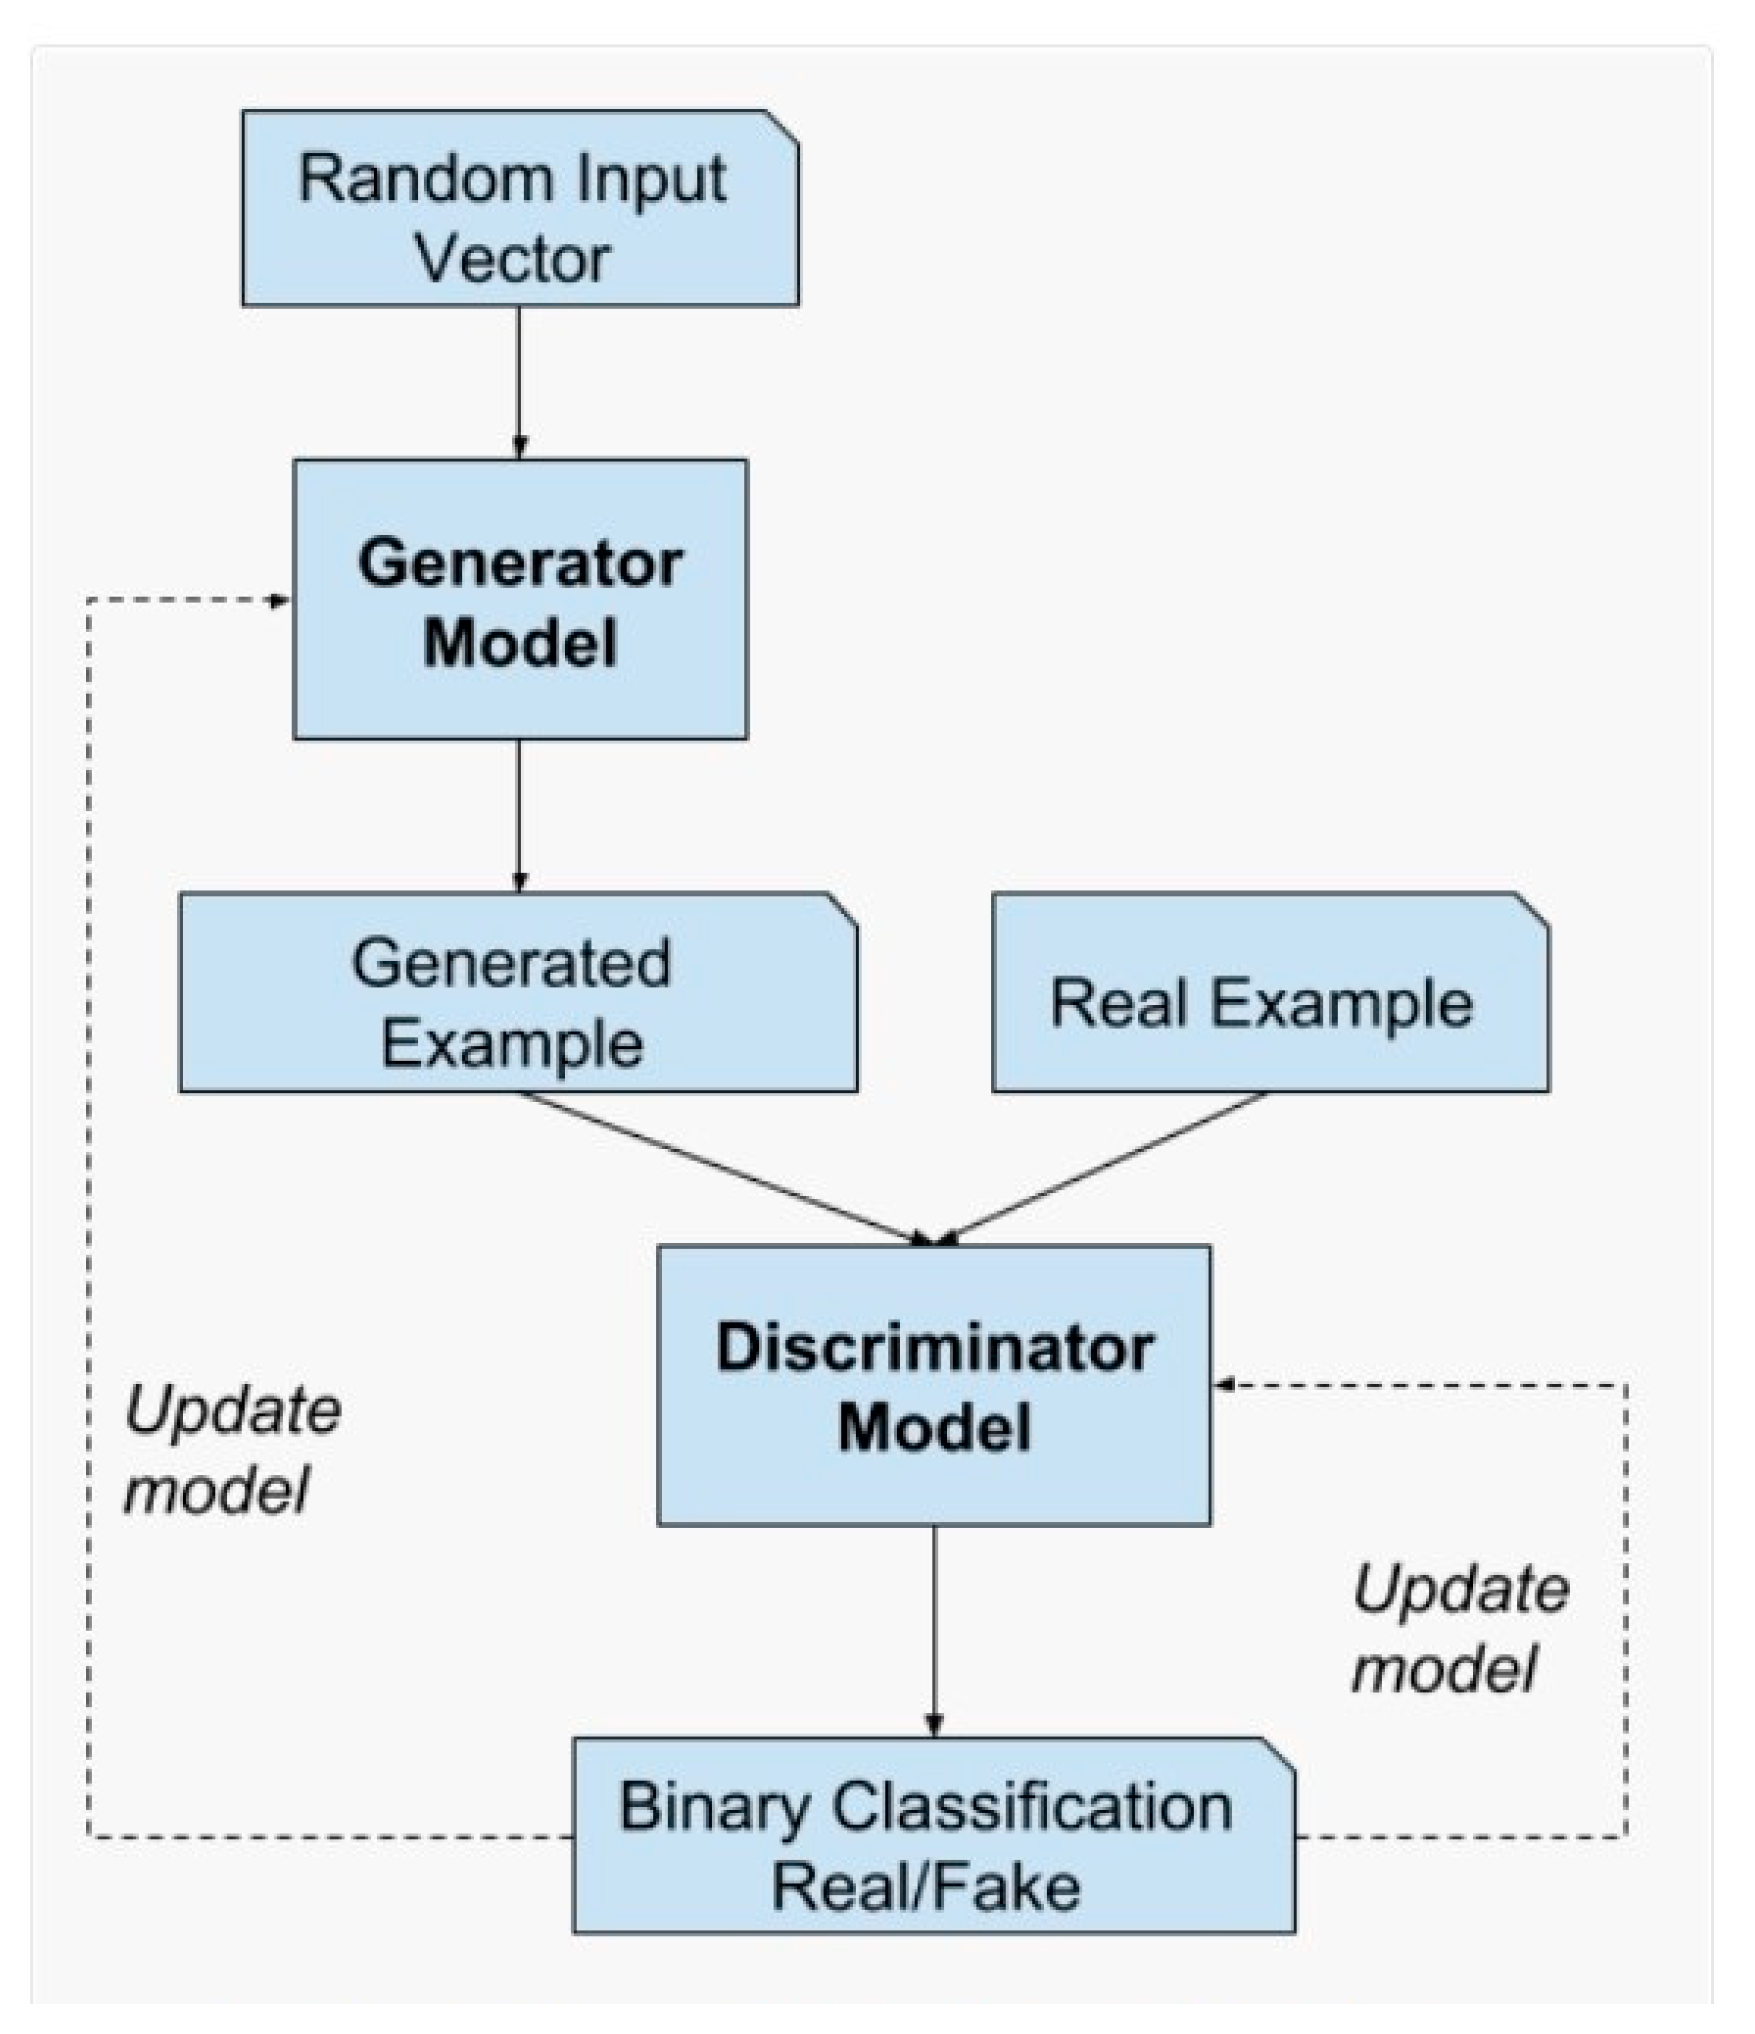
3.2. Synthetic Data Generation with GANs
3.3. Deep Learning Model (DRNN)
3.4. Multi-Criteria Decision Analysis (MCDA)
3.5. Hyper-Parameter Optimization
4. Results
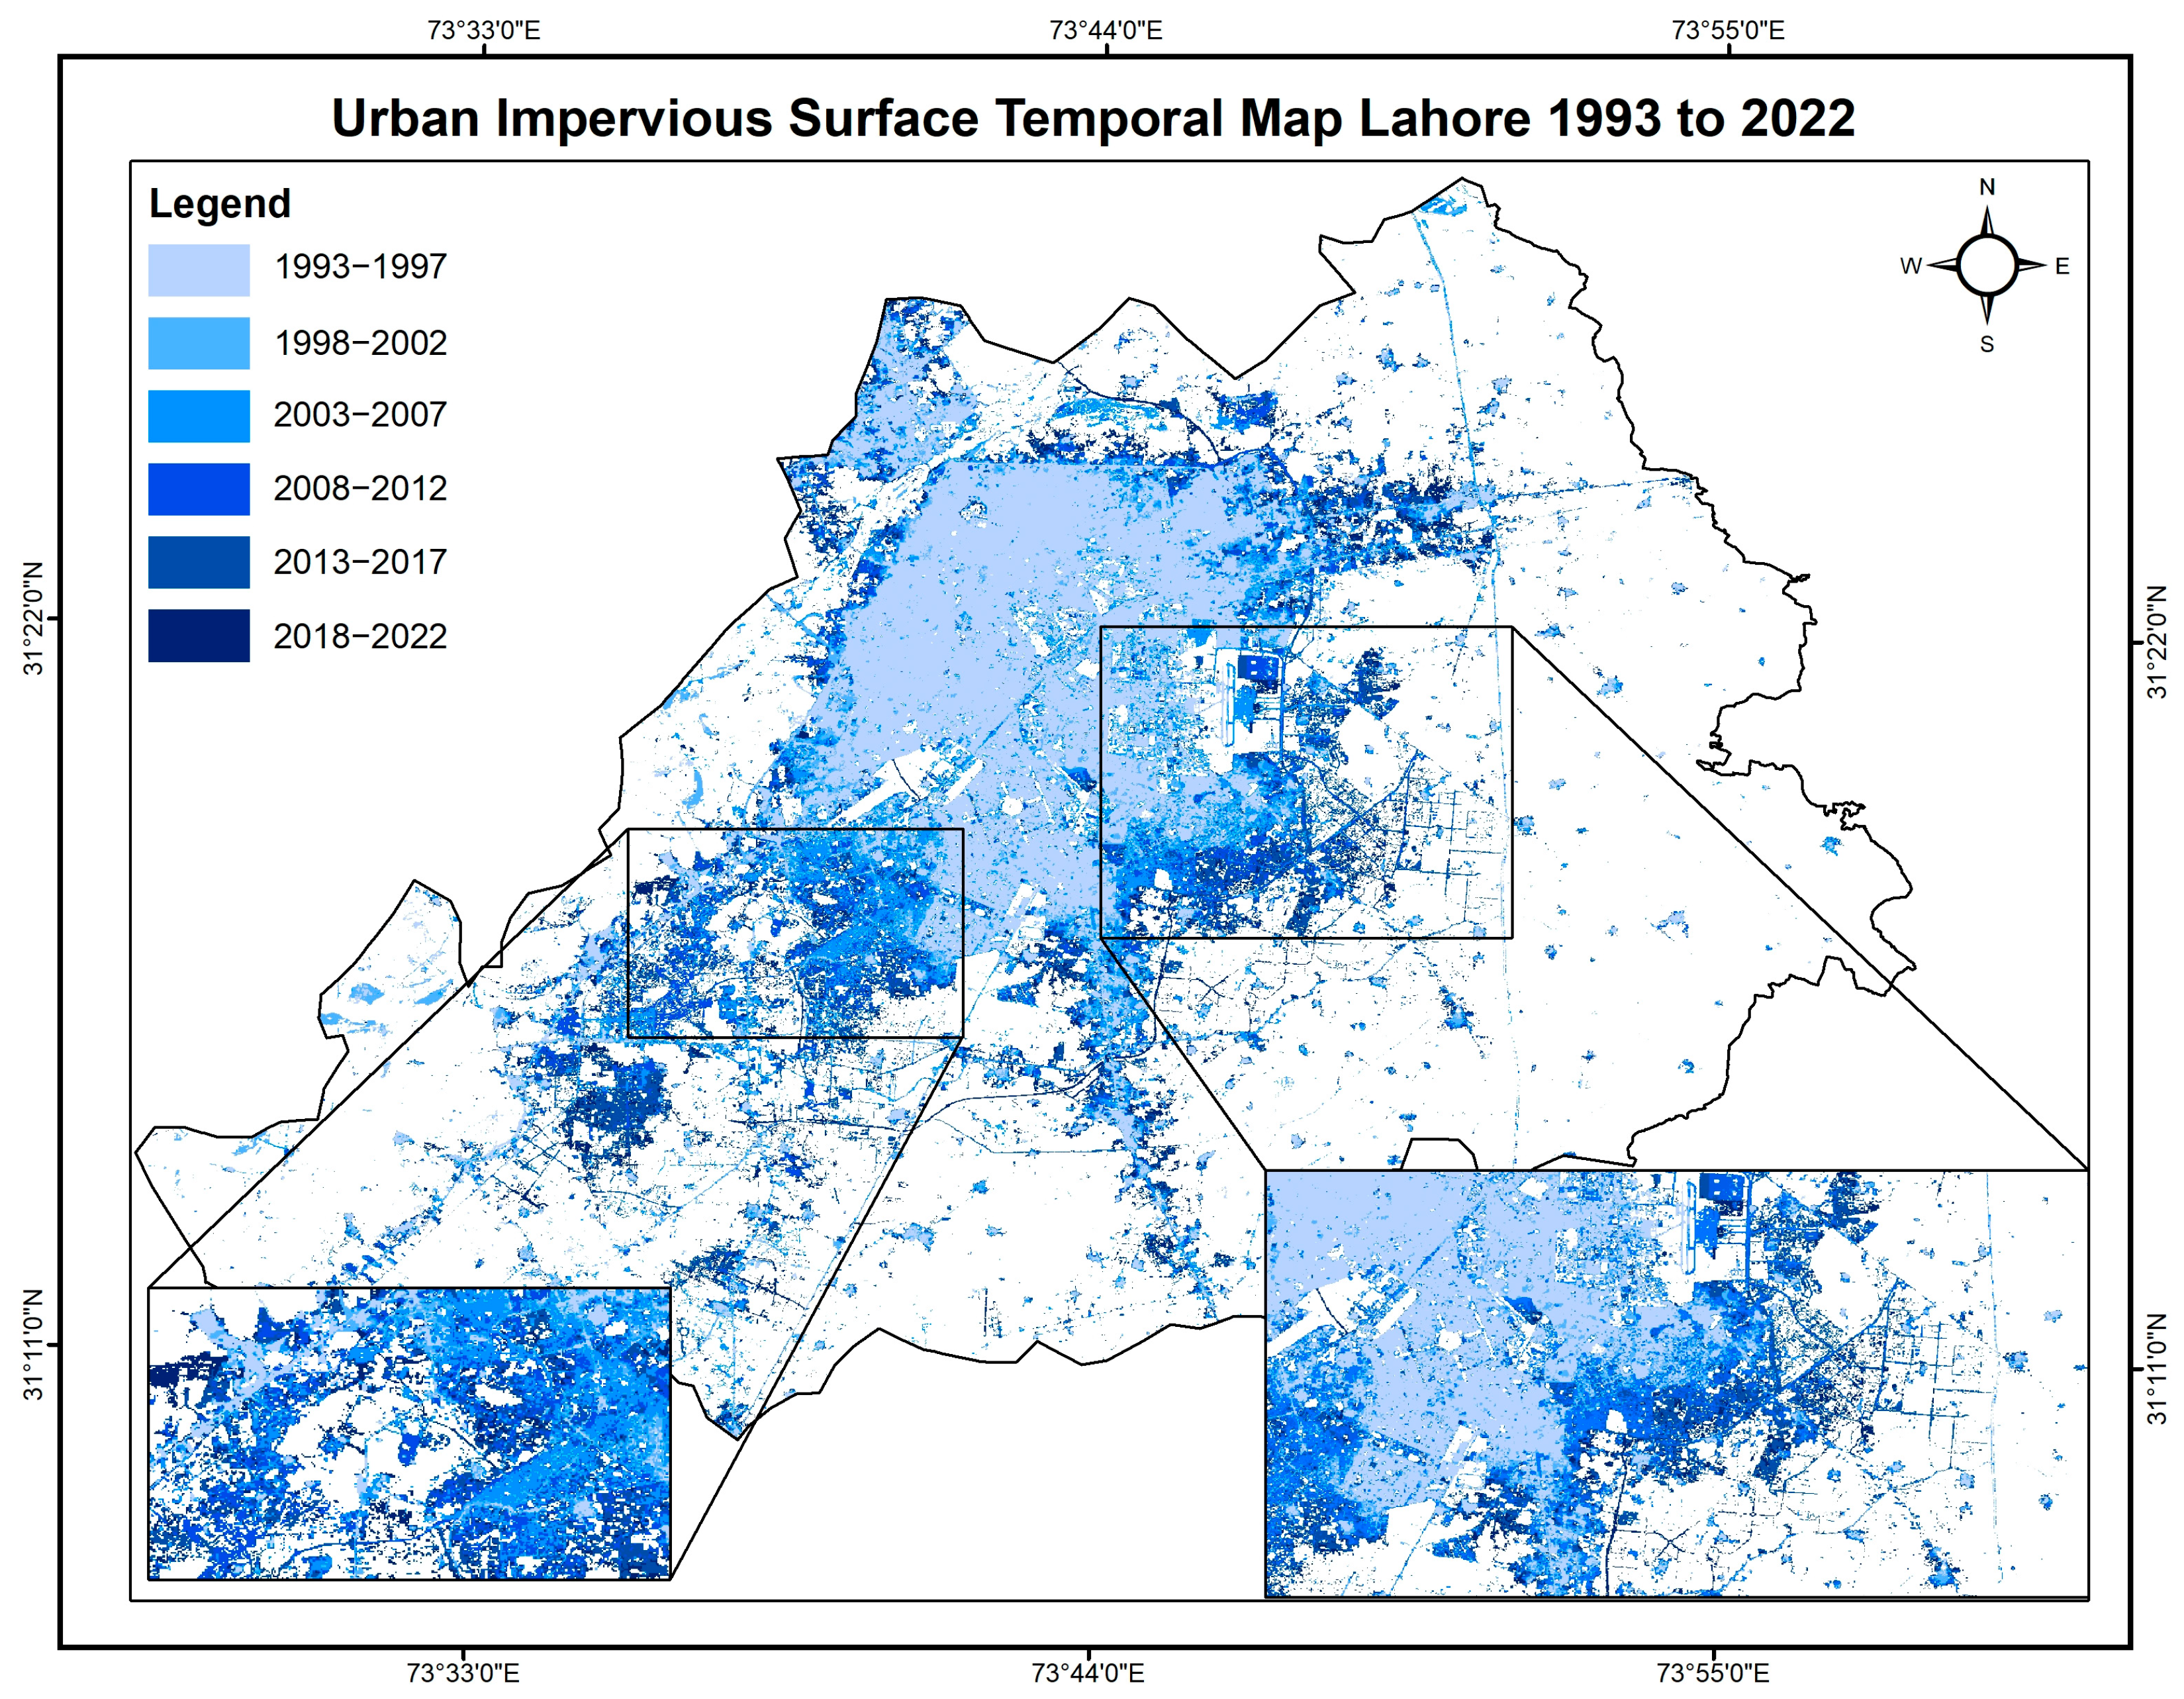
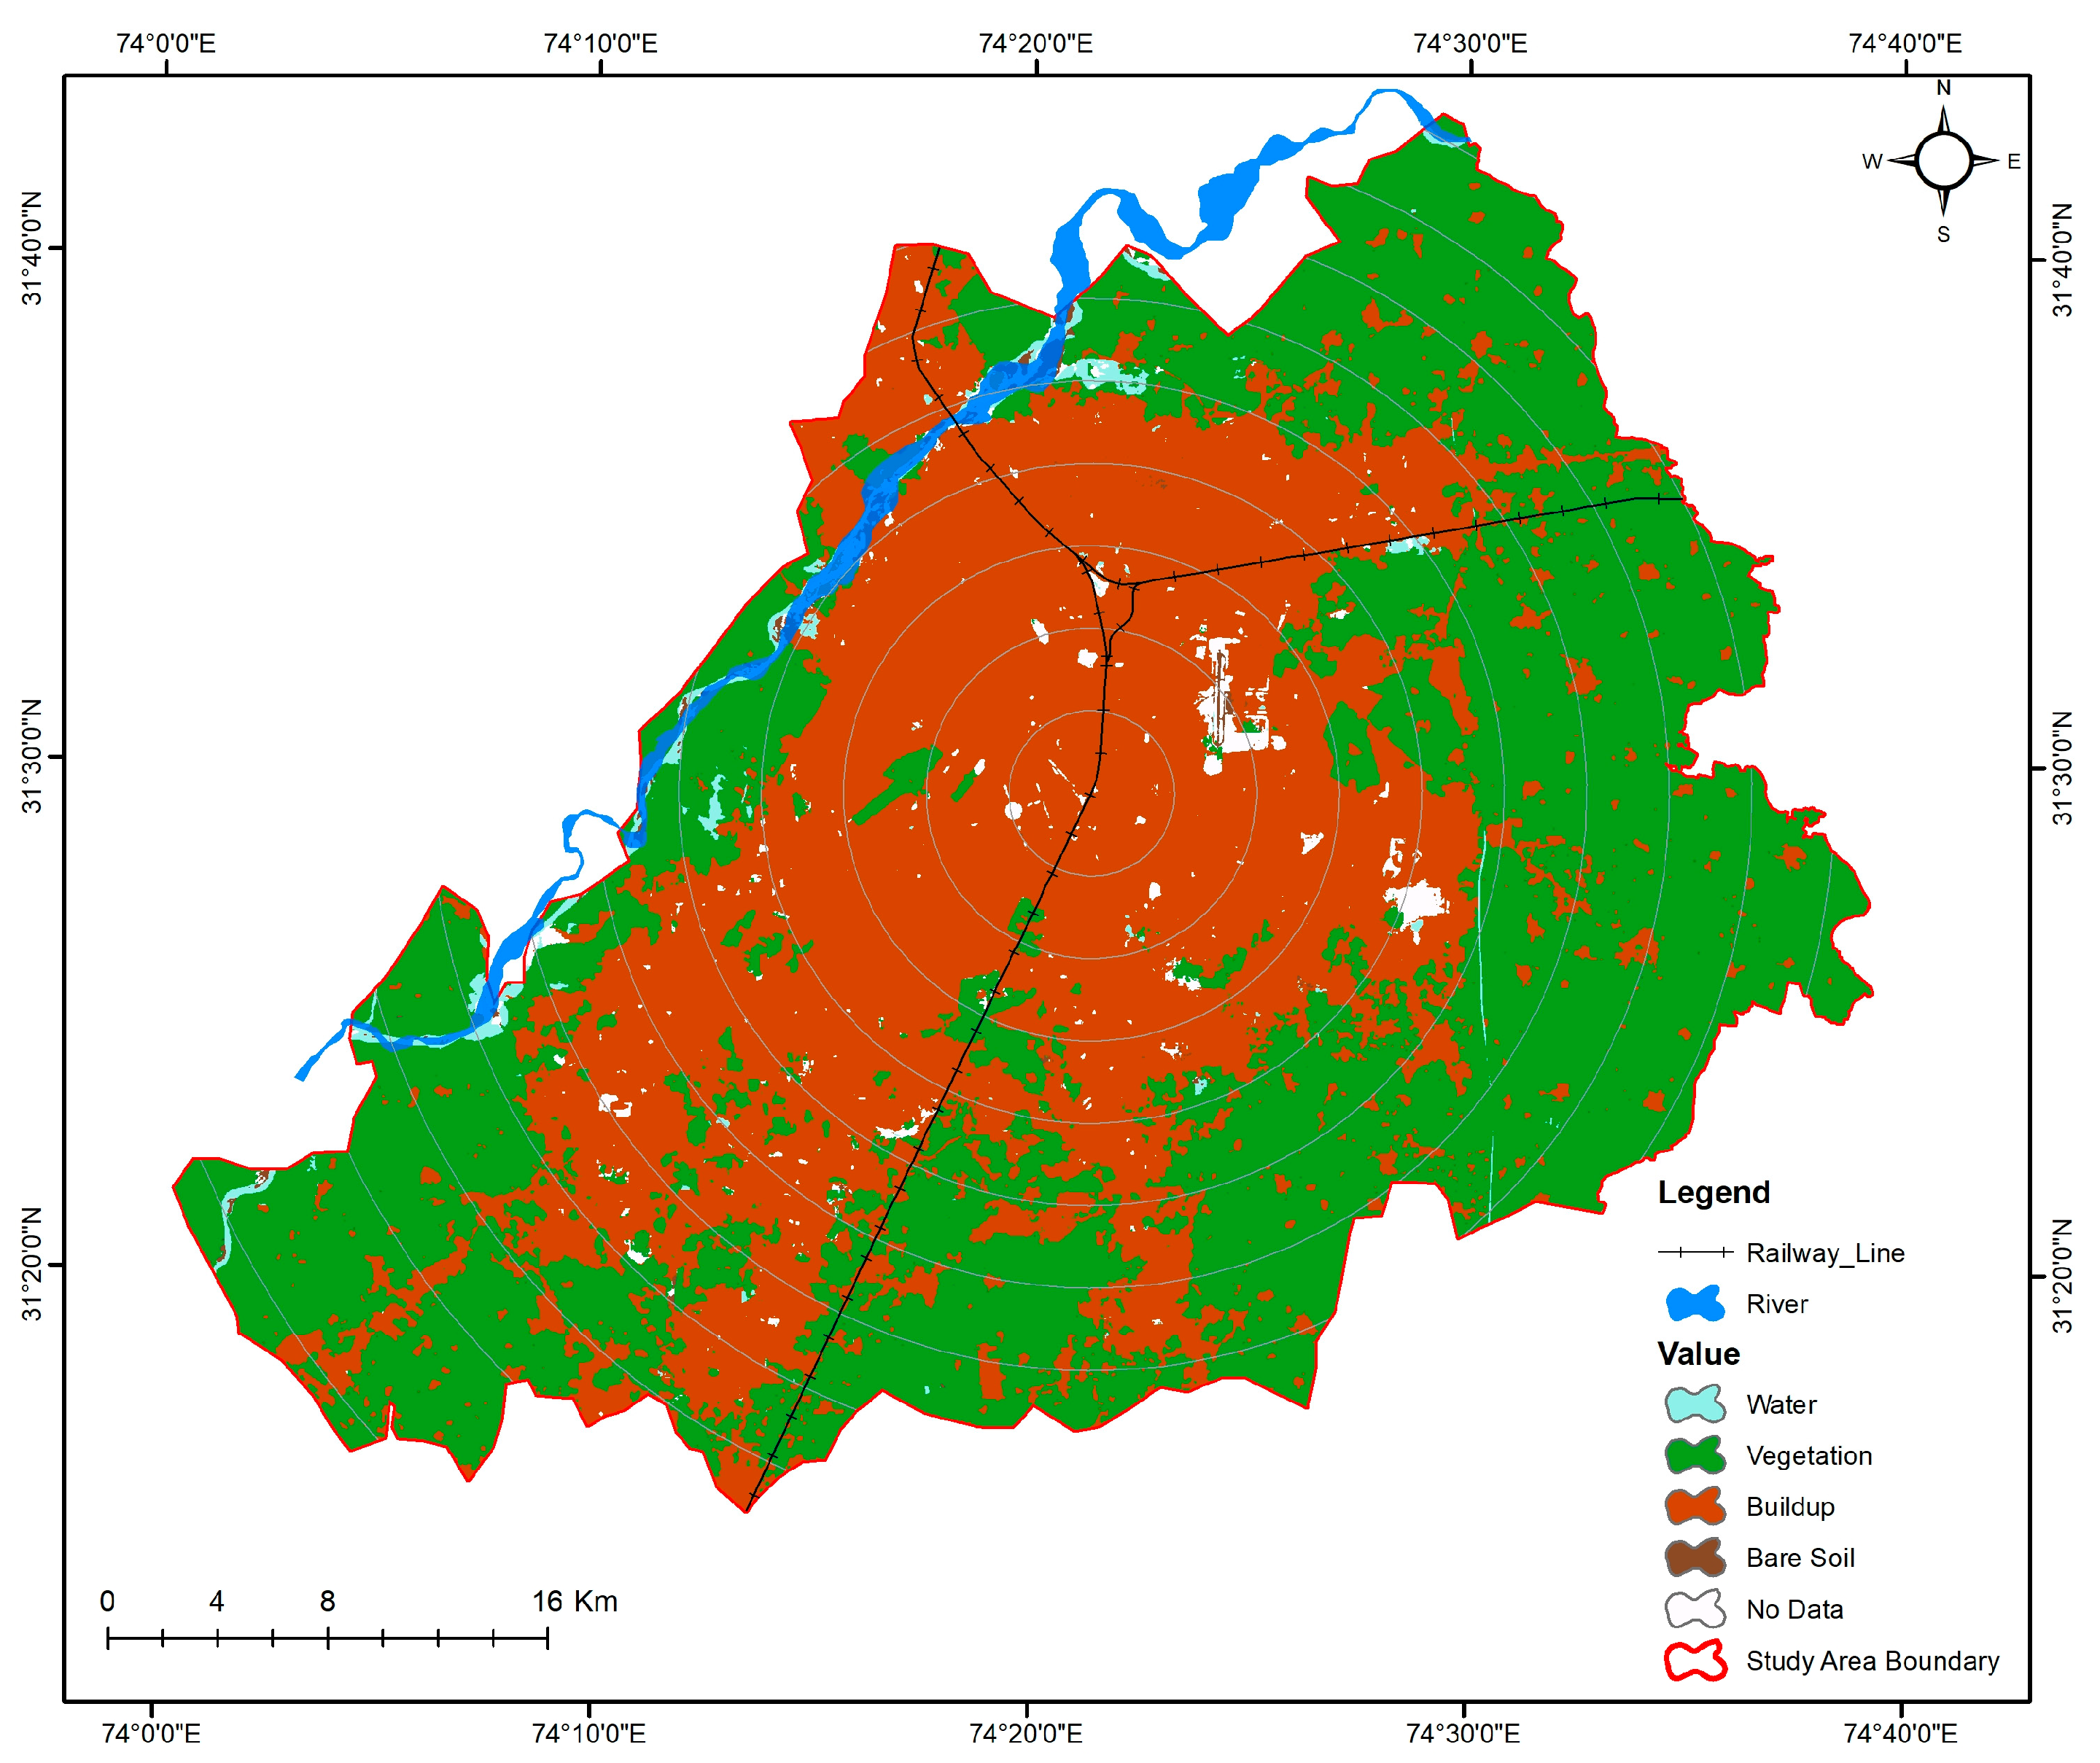
4.1. Impervious Surface Area (ISA) and Land Use/Land Cover (LULC) Analysis
4.2. Drainage Network Extraction and Flood Hotspots Identification
4.3. Synthetic Data Generation with GANs and Data Quality Assessment
4.4. Deep Learning Model (DRNN) Results for Flood Prediction
4.5. Comparison of DRNN and Multi-Criteria Decision Analysis (MCDA) Results
4.6. Uncertainties, Errors, and Model Limitations
5. Discussion
6. Conclusions
Author Contributions
Funding
Institutional Review Board Statement
Informed Consent Statement
Data Availability Statement
Conflicts of Interest
References
- Luo, X.; Hu, Z.; Liu, L. Investigating the Seasonal Dynamics of Surface Water over the Qinghai–Tibet Plateau Using Sentinel-1 Imagery and a Novel Gated Multiscale ConvNet. Int. J. Digit. Earth 2023, 16, 1373–1395. [Google Scholar] [CrossRef]
- Qiu, J.; Cao, B.; Park, E.; Yang, X.; Zhang, W.; Tarolli, P. Flood Monitoring in Rural Areas of the Pearl River Basin (China) Using Sentinel-1 SAR. Remote Sens. 2021, 13, 1384. [Google Scholar] [CrossRef]
- Mason, D.C.; Dance, S.L.; Cloke, H.L. Floodwater Detection in Urban Areas Using Sentinel-1 and WorldDEM Data. J. Appl. Remote Sens. 2021, 15, 32003. [Google Scholar] [CrossRef]
- Jonkman, S.N.; Vrijling, J.K. Loss of Life Due to Floods. J. Flood Risk Manag. 2008, 1, 43–56. [Google Scholar] [CrossRef]
- Zhao, G.; Pang, B.; Xu, Z.; Yue, J.; Tu, T. Mapping Flood Susceptibility in Mountainous Areas on a National Scale in China. Sci. Total Environ. 2018, 615, 1133–1142. [Google Scholar] [CrossRef]
- Huang, M.; Jin, S. Rapid Flood Mapping and Evaluation with a Supervised Classifier and Change Detection in Shouguang Using Sentinel-1 SAR and Sentinel-2 Optical Data. Remote Sens. 2020, 12, 2073. [Google Scholar] [CrossRef]
- Jonkman, S.N. Global Perspectives on Loss of Human Life Caused by Floods. Nat. Hazards 2005, 34, 151–175. [Google Scholar] [CrossRef]
- Li, Y.; Martinis, S.; Wieland, M. Urban Flood Mapping with an Active Self-Learning Convolutional Neural Network Based on TerraSAR-X Intensity and Interferometric Coherence. ISPRS J. Photogramm. Remote Sens. 2019, 152, 178–191. [Google Scholar] [CrossRef]
- Zhang, H.; Qi, Z.; Li, X.; Chen, Y.; Wang, X.; He, Y. An Urban Flooding Index for Unsupervised Inundated Urban Area Detection Using Sentinel-1 Polarimetric SAR Images. Remote Sens. 2021, 13, 4511. [Google Scholar] [CrossRef]
- Mignot, E.; Li, X.; Dewals, B. Experimental Modelling of Urban Flooding: A Review. J. Hydrol. 2019, 568, 334–342. [Google Scholar] [CrossRef]
- Tavus, B.; Kocaman, S.; Gokceoglu, C.; Nefeslioglu, H.A. Considerations on the Use Of Sentinel-1 Data in Flood Mapping in Urban Areas: Ankara (Turkey) 2018 Floods. Int. Arch. Photogramm. Remote Sens. Spat. Inf. Sci. 2018, XLII-5, 575–581. [Google Scholar] [CrossRef]
- Chini, M.; Pelich, R.; Pulvirenti, L.; Pierdicca, N.; Hostache, R.; Matgen, P. Sentinel-1 InSAR Coherence to Detect Floodwater in Urban Areas: Houston and Hurricane Harvey as a Test Case. Remote Sens. 2019, 11, 107. [Google Scholar] [CrossRef]
- Tanim, A.H.; McRae, C.B.; Tavakol-Davani, H.; Goharian, E. Flood Detection in Urban Areas Using Satellite Imagery and Machine Learning. Water 2022, 14, 1140. [Google Scholar] [CrossRef]
- Li, C.; Sun, N.; Lu, Y.; Guo, B.; Wang, Y.; Sun, X.; Yao, Y. Review on Urban Flood Risk Assessment. Sustainability 2023, 15, 765. [Google Scholar] [CrossRef]
- Tanaka, T.; Kiyohara, K.; Tachikawa, Y. Comparison of Fluvial and Pluvial Flood Risk Curves in Urban Cities Derived from a Large Ensemble Climate Simulation Dataset: A Case Study in Nagoya, Japan. J. Hydrol. 2020, 584, 124706. [Google Scholar] [CrossRef]
- Peng, J.; Zhang, J. Urban Flooding Risk Assessment Based on GIS-Game Theory Combination Weight: A Case Study of Zhengzhou City. Int. J. Disaster Risk Reduct. 2022, 77, 103080. [Google Scholar] [CrossRef]
- Parvin, F.; Ali, S.A.; Calka, B.; Bielecka, E.; Linh, N.T.T.; Pham, Q.B. Urban Flood Vulnerability Assessment in a Densely Urbanized City Using Multi-Factor Analysis and Machine Learning Algorithms. Theor. Appl. Climatol. 2022, 149, 639–659. [Google Scholar] [CrossRef]
- Ye, C.; Xu, Z.; Lei, X.; Liao, W.; Ding, X.; Liang, Y. Assessment of Urban Flood Risk Based on Data-Driven Models: A Case Study in Fuzhou City, China. Int. J. Disaster Risk Reduct. 2022, 82, 103318. [Google Scholar] [CrossRef]
- Wu, Z.; Xue, W.; Xu, H.; Yan, D.; Wang, H.; Qi, W. Urban Flood Risk Assessment in Zhengzhou, China, Based on a D-Number-Improved Analytic Hierarchy Process and a Self-Organizing Map Algorithm. Remote Sens. 2022, 14, 4777. [Google Scholar] [CrossRef]
- Li, J.; Mahalov, A.; Hyde, P. Effects of Urbanization on Extreme Rainfall in an Arid/Semiarid Region. Atmos. Sci. Lett. 2020, 21, e966. [Google Scholar] [CrossRef]
- Fowler, H.J.; Ali, H.; Allan, R.P.; Ban, N.; Barbero, R.; Berg, P.; Blenkinsop, S.; Cabi, N.S.; Chan, S.; Dale, M. Towards Advancing Scientific Knowledge of Climate Change Impacts on Short-Duration Rainfall Extremes. Philos. Trans. R. Soc. A 2021, 379, 20190542. [Google Scholar] [CrossRef] [PubMed]
- Ahmad, M.N.; Shao, Z.; Javed, A. Mapping Impervious Surface Area Increase and Urban Pluvial Flooding Using Sentinel Application Platform (SNAP) and Remote Sensing Data. Environ. Sci. Pollut. Res. 2023, 30, 125741–125758. [Google Scholar] [CrossRef] [PubMed]
- Bentivoglio, R.; Isufi, E.; Jonkman, S.N.; Taormina, R. Deep Learning Methods for Flood Mapping: A Review of Existing Applications and Future Research Directions. Hydrol. Earth Syst. Sci. 2022, 26, 4345–4378. [Google Scholar] [CrossRef]
- Bulti, D.T.; Abebe, B.G. A Review of Flood Modeling Methods for Urban Pluvial Flood Application. Model. Earth Syst. Environ. 2020, 6, 1293–1302. [Google Scholar] [CrossRef]
- Chen, J.; Chen, W.; Huang, G. Assessing Urban Pluvial Flood Resilience Based on a Novel Grid-Based Quantification Method That Considers Human Risk Perceptions. J. Hydrol. 2021, 601, 126601. [Google Scholar] [CrossRef]
- Azizi, K.; Meier, C.I. Urban Pluvial Flood Risk Assessment: Challenges and Opportunities for Improvement Using a Community-Based Approach. In Proceedings of the World Environmental and Water Resources Congress 2021, Virtually, 7–11 June 2021; pp. 350–361. [Google Scholar]
- Olsen, A.S.; Zhou, Q.; Linde, J.J.; Arnbjerg-Nielsen, K. Comparing Methods of Calculating Expected Annual Damage in Urban Pluvial Flood Risk Assessments. Water 2015, 7, 255–270. [Google Scholar] [CrossRef]
- Löwe, R.; Urich, C.; Domingo, N.S.; Mark, O.; Deletic, A.; Arnbjerg-Nielsen, K. Assessment of Urban Pluvial Flood Risk and Efficiency of Adaptation Options through Simulations—A New Generation of Urban Planning Tools. J. Hydrol. 2017, 550, 355–367. [Google Scholar] [CrossRef]
- Lara-Benítez, P.; Carranza-García, M.; Luna-Romera, J.M.; Riquelme, J.C. Temporal Convolutional Networks Applied to Energy-Related Time Series Forecasting. Appl. Sci. 2020, 10, 2322. [Google Scholar] [CrossRef]
- Faruq, A.; Arsa, H.P.; Hussein, S.F.M.; Razali, C.M.C.; Marto, A.; Abdullah, S.S. Deep Learning-Based Forecast and Warning of Floods in Klang River, Malaysia. Ingénierie Systèmes Inf. 2020, 25, 365–370. [Google Scholar] [CrossRef]
- Bai, S.; Kolter, J.Z.; Koltun, V. An Empirical Evaluation of Generic Convolutional and Recurrent Networks for Sequence Modeling. arXiv 2018, arXiv:1803.01271. [Google Scholar]
- Siami-Namini, S.; Namin, A.S. Forecasting Economics and Financial Time Series: ARIMA vs. LSTM. arXiv 2018, arXiv:1803.06386. [Google Scholar]
- Gude, V.; Corns, S.; Long, S. Flood Prediction and Uncertainty Estimation Using Deep Learning. Water 2020, 12, 884. [Google Scholar] [CrossRef]
- Song, T.; Ding, W.; Wu, J.; Liu, H.; Zhou, H.; Chu, J. Flash Flood Forecasting Based on Long Short-Term Memory Networks. Water 2019, 12, 109. [Google Scholar] [CrossRef]
- Le, X.-H.; Ho, H.V.; Lee, G.; Jung, S. Application of Long Short-Term Memory (LSTM) Neural Network for Flood Forecasting. Water 2019, 11, 1387. [Google Scholar] [CrossRef]
- Ali, M.H.M.; Asmai, S.A.; Abidin, Z.Z.; Abas, Z.A.; Emran, N.A. Flood Prediction Using Deep Learning Models. Int. J. Adv. Comput. Sci. Appl. 2022, 13. [Google Scholar] [CrossRef]
- Goodfellow, I.; Pouget-Abadie, J.; Mirza, M.; Xu, B.; Warde-Farley, D.; Ozair, S.; Courville, A.; Bengio, Y. Generative Adversarial Networks. Commun. ACM 2020, 63, 139–144. [Google Scholar] [CrossRef]


| Dataset | Source/Resolution | Purpose | Relevance to Study | URL |
|---|---|---|---|---|
| ALOS PALSAR DEM | 12.5 m resolution (Free) | Drainage network extraction | High-resolution terrain modeling | https://www.eorc.jaxa.jp/ALOS/en/dataset/alos_open_and_free_e.htm, accessed on 7 May 2025 |
| ASTER GDEM | 30 m resolution (Comparison) | Elevation data (comparison) | Lower resolution; less accurate | https://asterweb.jpl.nasa.gov/gdem.asp, accessed on 7 May 2025 |
| SRTM DEM | 90 m resolution (Comparison) | Elevation data (comparison) | Coarser resolution; less precise | https://www.earthdata.nasa.gov/data/instruments/srtm, accessed on 7 May 2025 |
| Sentinel-2 Imagery | 10 m resolution (Free) | Land use/land cover classification | Key for understanding urbanization | https://www.esa.int/Applications/Observing_the_Earth/Copernicus/Sentinel-2, accessed on 7 May 2025 |
| GISAI and GHSL Data | Varies | Impervious surface area mapping | Important for runoff analysis | https://data.jrc.ec.europa.eu/collection/ghsl, accessed on 7 May 2025 |
| Precipitation Data | Government sources (Monthly) | Rainfall intensity and variability | Identifies rainfall patterns | https://nwfc.pmd.gov.pk/new/rainfall.php, accessed on 7 May 2025 |
| Slope and Aspect | Derived from DEM | Terrain analysis | Determines water flow direction | Derived |
| Historical UPF Events | 2–3 past events (Synthetic data included) | DRNN model training | Captures temporal flood patterns | https://www.ndma.gov.pk/urbanflooding/sdi, accessed on 7 May 2025 |
| Metric | Value | Description |
|---|---|---|
| SSIM (Structural Similarity Index Measure) | 0.92 | Measures similarity between real and synthetic data (closer to 1 indicates high similarity). |
| RMSE (Root Mean Square Error) | 0.14 | Indicates average deviation of synthetic data from real data (lower is better). |
| MAE (Mean Absolute Error) | 0.11 | Measures average absolute difference between real and synthetic data. |
| Data Coverage (%) | 95% | Percentage of drainage features accurately captured in synthetic data. |
| (a) | |||
| Metric | Real Data Only | Real + Synthetic Data | Improvement (%) |
| Precision | 78% | 85% | +7% |
| Recall | 76% | 83% | +7% |
| F1-Score | 75% | 84% | +9% |
| Accuracy | 77% | 86% | +9% |
| (b) | |||
| Metric | Value | ||
| MSE | 0.087 | ||
| RMSE | 0.295 | ||
| R2 | 0.81 | ||
| Metric | DRNN | MCDA | Difference |
|---|---|---|---|
| Precision | 85% | 78% | +7% |
| Recall | 83% | 75% | +8% |
| F1-Score | 84% | 76% | +8% |
| Area Under Curve (AUC) | 0.88 | 0.81 | +0.07 |
| Source of Uncertainty/Error | Impact on Results | Mitigation Strategies |
|---|---|---|
| Input Data Resolution (DEM, LULC) | Reduced accuracy in small-scale flood mapping | Use higher-resolution datasets (e.g., LiDAR) |
| GAN Data Biases | Potential misclassification due to synthetic data inaccuracy | Expand GAN training dataset diversity |
| DRNN Overfitting | Reduced model generalization to new areas | Implement regularization and cross-validation |
| Precipitation Data Aggregation | Loss of short-term rainfall variability | Integrate real-time rainfall data |
| Computational Cost | Limited application in resource-constrained settings | Develop optimized, lightweight model versions |
Disclaimer/Publisher’s Note: The statements, opinions and data contained in all publications are solely those of the individual author(s) and contributor(s) and not of MDPI and/or the editor(s). MDPI and/or the editor(s) disclaim responsibility for any injury to people or property resulting from any ideas, methods, instructions or products referred to in the content. |
© 2025 by the authors. Licensee MDPI, Basel, Switzerland. This article is an open access article distributed under the terms and conditions of the Creative Commons Attribution (CC BY) license (https://creativecommons.org/licenses/by/4.0/).
Share and Cite
Ahmad, M.N.; Skilodimou, H.D.; Islam, F.; Javed, A.; Bathrellos, G.D. Drainage Network Generation for Urban Pluvial Flooding (UPF) Using Generative Adversarial Networks (GANs) and GIS Data. Sustainability 2025, 17, 4380. https://doi.org/10.3390/su17104380
Ahmad MN, Skilodimou HD, Islam F, Javed A, Bathrellos GD. Drainage Network Generation for Urban Pluvial Flooding (UPF) Using Generative Adversarial Networks (GANs) and GIS Data. Sustainability. 2025; 17(10):4380. https://doi.org/10.3390/su17104380
Chicago/Turabian StyleAhmad, Muhammad Nasar, Hariklia D. Skilodimou, Fakhrul Islam, Akib Javed, and George D. Bathrellos. 2025. "Drainage Network Generation for Urban Pluvial Flooding (UPF) Using Generative Adversarial Networks (GANs) and GIS Data" Sustainability 17, no. 10: 4380. https://doi.org/10.3390/su17104380
APA StyleAhmad, M. N., Skilodimou, H. D., Islam, F., Javed, A., & Bathrellos, G. D. (2025). Drainage Network Generation for Urban Pluvial Flooding (UPF) Using Generative Adversarial Networks (GANs) and GIS Data. Sustainability, 17(10), 4380. https://doi.org/10.3390/su17104380