Abstract
In this research, we present the development and validation of a compact, resource-efficient (low-cost, low-energy), distributed, real-time traffic and air quality monitoring system. Deployed since November 2023 in a small town that relies on burning various fuels and waste for winter heating, the system comprises three IoT units that integrate image processing and environmental sensing for sustainable urban and environmental management. Each unit uses an embedded camera and sensors to process live data locally, which are then transmitted to a central database. The image processing algorithm counts vehicles by type with over 95% daylight accuracy, while air quality sensors measure pollutants including particulate matter (PM), equivalent carbon dioxide (eCO2), and total volatile organic compounds (TVOCs). Data analysis revealed fluctuations in pollutant concentrations across monitored areas, correlating with traffic variations and enabling the identification of pollution sources and their relative impacts. Recorded PM10 daily average levels even reached eight times above the safe 24 h limits in winter, when traffic values were low, indicating a strong link to household heating. This work provides a scalable, cost-effective approach to traffic and air quality monitoring, offering actionable insights for urban planning and sustainable development.
1. Introduction
Air pollution is affecting the world’s climate and ecosystems and has significant negative effects on human health [1,2]. Depending on the location of the pollutant-emitting activities, it is classified as internal or external air pollution [2,3]. Outdoor or external air pollution occurs in open environments and can impact the entire atmosphere. It is primarily driven by fossil fuel combustion for industrial, energy, and transportation needs, particularly in agriculture and mining. Major pollutants include various gases, chemical compounds, and particulate matter (PM) of varying sizes, such as nitrogen oxides (NOx), nitrogen dioxide (NO2), sulfur dioxide (SO2), ozone (O3), carbon monoxide (CO), and hydrocarbons [2]. These pollutants are generally classified as primary (directly emitted) or secondary (formed through atmospheric chemical reactions). The extent of their health impact depends on factors such as concentration and exposure duration, both short-term high exposure and long-term lower-level exposure, can lead to serious consequences [4,5]. Alarmingly, air pollution is the second leading cause of deaths related to noncontagious diseases [2,6].
Among these pollutants, particulate matter (PM)—a complex mixture of solid and liquid particles suspended in the air—is particularly harmful. PM can penetrate deep into the lungs, increasing the risk of cardiovascular disease, lung cancer, and neurological disorders [7,8]. It is generally categorized by size:
- PM10 (particles < 10 µm): can enter the upper respiratory tract.
- PM2.5 (particles < 2.5 µm): can reach deep into the lungs and bloodstream [9].
Urbanization and increased vehicle use have led to rising traffic-related air pollution in many cities. Vehicles emit harmful substances such as NOx, CO2, PM2.5, and PM10. According to the World Health Organization (WHO), air pollution is a major contributor to premature mortality, especially in urban areas where traffic is a dominant source [10].
1.1. Air Quality Monitoring, Current Low-Cost Solutions, Related Works
Current monitoring methods often rely on static sensors placed at fixed locations, but data availability varies greatly [11]. Furthermore, traditional systems are often costly, limiting scalability—particularly in smaller towns and developing regions [12].
As an alternative, various Internet of Things (IoT)-based air quality monitoring systems using micro-sensors for data collection have been proposed. These systems often incorporate open-source technologies for data processing and transmission [13,14,15,16,17,18,19].
Most low-cost IoT air quality monitoring systems are based on the following data acquisition solutions:
- ESP32/ESP8266—Popular for low power consumption, built-in Wi-Fi, and affordability [2,20];
- Arduino boards (e.g., Uno, Nano)—Common in educational and prototype projects [21,22];
- Raspberry Pi (Zero/3/4)—Used when higher processing power or extended connectivity is required (e.g., for edge processing or camera integration) [23,24];
- STM32—Increasingly used in industrial-grade deployments due to low power use and advanced peripherals.
1.2. Traffic Monitoring Solutions, Related Works
There are several automated methods for traffic counting, utilizing different technologies. Common approaches include
- Video cameras with computer vision—cameras installed at key locations analyze video feeds using computer vision algorithms to detect and count vehicles [25,26];
- Inductive loop sensors—electromagnetic sensors embedded in road surfaces [27,28]; these systems typically have the highest implementation costs;
- Acoustic, radar, and LiDAR-based sensors that are based on sound waves, radio waves, and laser to detect moving objects [29,30,31,32,33].
These methods vary in cost, accuracy, and resilience to environmental conditions. In parallel, IoT systems continue to expand across sectors such as health, education, agriculture, and energy. Environmental monitoring remains a key application, offering actionable data for smart city management and public health [2,8,18,34].
1.3. The Paper’s Main Research Goals
This research presents the in-house development of a low-cost, distributed, real-time monitoring system at the University of Petroșani. The system consists of three smart units combining image-based traffic analysis (via embedded cameras and machine learning) with air quality monitoring using IoT-enabled sensors. The objective is to monitor both traffic flow and pollution levels across multiple urban hotspots [35].
The novelty and main contributions of this work include
- The integration of air quality and traffic monitoring into a single compact, deployable system;
- Real-time data processing with minimal user input;
- A user-friendly web interface for data visualization.
1.4. Research Questions
The main research question is whether low-cost, lower-precision sensors—when deployed continuously—can generate more practical insights than occasional high-precision measurements. The system’s insights may assist decision-makers in urban planning, environmental policy, and public health interventions.
- Can low-cost, low-precision IoT sensors combined with image-based traffic analysis provide more actionable air quality data than periodic state-run measurements?
- To what extent can such a system distinguish pollution sources (e.g., traffic vs. household heating) in real-world conditions?
Our long-term field deployment has demonstrated the system’s automated, reliable operation. The collected data revealed meaningful patterns in traffic and pollution, suggesting that such systems could address gaps in existing institutional monitoring.
The remainder of this paper is structured as follows: Section 2 describes the system architecture and components, outlines the deployment and data collection process. Section 3 presents results and analysis. Section 4 discusses the system’s scalability, limitations, and real-world implications. Section 5 concludes the study and proposes directions for future work.
2. Materials and Methods
2.1. Overview of the Chosen Location and the Need for an Alternative Monitoring System
The location chosen for deploying the proposed monitoring system is the Municipality of Petroșani, Hunedoara County, Romania—a former coal-mining region currently undergoing decarbonization but still facing serious air pollution issues [36]. Petroșani, the administrative center of the Jiu Valley conurbation, is situated in southwestern-central Romania in a mountain depression along the Eastern Jiu River [5,37,38].
Due to its elevation (590–650 m) and placement within a mountain basin, Petroșani experiences lower average annual temperatures and slightly higher humidity compared to the national average while being somewhat shielded from extreme meteorological events (Figure 1).

Figure 1.
Monthly weather data averages taken over the last 30 years [meteoblue.com].
The area has a low-altitude mountain climate transitioning into a submontane one. The average annual temperature is 6.8 °C, with a historical low of −31.4 °C recorded on 14 January 1893. July is the warmest month (average 16.7 °C), while January is the coldest (−4.5 °C). Summers include around 50 days with temperatures exceeding 25 °C. Annual precipitation ranges from 700 to 800 mm.
A notable climatic phenomenon is thermal inversion, occurring frequently during winter. During inversion, clouds descend into the valley and, above approximately 800 m (measured from the cloud base), a normal temperature gradient re-establishes. This results in a trapped, colder air layer that retains atmospheric pollutants—hindering dispersion and prolonging pollution events [36].
Despite Romania’s EU membership and the strict European air quality regulations [39], the local air quality situation appears neglected. Although some small-scale renewable energy investments have been made [5], significant action remains limited.
One exception is the “Green Line” ecological public transport project for the Jiu Valley. This EUR 12.2 million project—funded through Regio-POR 2014–2020 and continued through the Regional West Program 2021–2027—includes the acquisition of 26 electric buses, 112 public transport stations, and 34 electric charging stations [40]. Four routes have been planned (one main, three secondary), totaling about 128 km. Current transport demand is 1.58 million trips annually, with a projected increase to 1.75 million by 2030 [41,42].
Local air quality monitoring is limited. Only one station (HD5), part of the National Air Quality Monitoring Network (RNMCA), is located near Vulcan rather than Petroșani (Latitude: 45.3727951, Longitude: 23.2779579). Although the RNMCA has over 100 stations across Romania, many—including HD5—frequently lack continuous data [5,43]. HD5 lies about 8 km from our Monitoring Station 3 and 10 km from Station 2.
The monitoring station placement enabled the observation of pollution patterns previously noted by the local population and reported in earlier studies [5,44]. The general pollution level in cold months was influenced predominantly by residential heating using fossil fuels and waste.
Some weather apps report AQI and PM values for the region, but these sources are undisclosed and likely rely on simulations or interpolated data—especially considering the frequent gaps in HD5’s readings [43].
Although precise pollutant measurements have been taken using professional-grade equipment, such monitoring is infrequent and costly. Limited access to such resources explains the outdated and sparse data for the region [5,36].
Previously, two major pollution sources have been identified: (1) increasing road traffic and vehicular emissions, and (2) the continued burning of fuels—including waste materials such as textiles and shoes—in Petroșani’s historic district [5,36,45].
From these previous studies, we conclude that
- Air pollution remains a serious issue in the Petroșani/Jiu Valley region due to its coal mining legacy and lack of clean energy alternatives.
- Instrumental monitoring reveals persistent pollutants like PM and VOCs, while alternative methods like snow analysis offer sustainable options.
- Geography, human activity, and incomplete decarbonization efforts continue to cause poor air quality across the region.
Installation sites for our system were chosen based on the above observations and view of traffic intersections or roundabouts (Figure 2, Figure 3 and Figure 4).
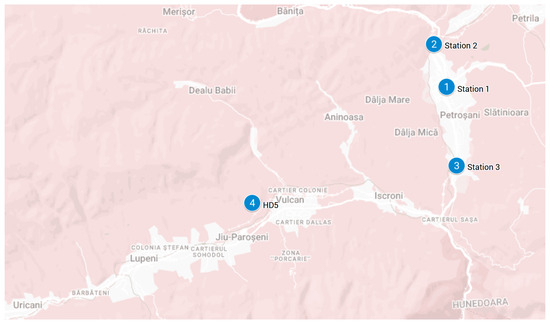
Figure 2.
Map of the Jiu Valley conurbation showing our monitoring stations 1, 2, and 3, along with the existing national HD5 station.
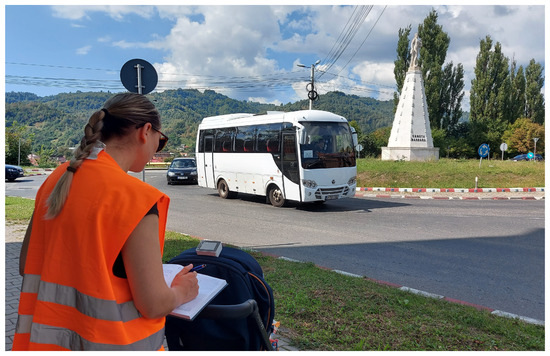
Figure 3.
Traffic and air quality observations adjacent to monitoring station No. 1.
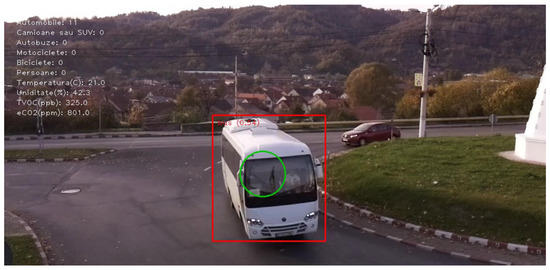
Figure 4.
Image as captured by the first installed monitoring station at location No. 1. with the red box and green circle indicating vehicle detection by the counter algorithm.
2.2. General Considerations and Proposed Monitoring System Concept
The monitoring system is designed to continuously measure air quality, compute vehicle traffic data, and transmit the results to a database server for storage and subsequent analysis. Several major topics across different domains had to be addressed:
- Vehicle counting, with category separation if possible;
- Measurement of airborne pollutant variation over time;
- Data transmission to a database from multiple locations;
- Integration of the above into an autonomous, compact, and robust system.
A robust system should be capable of handling failures gracefully, without crashing. It must recover from errors or unexpected input while maintaining core functionality. This can involve redundant components (e.g., backups), automated error detection, and recovery mechanisms [46,47].
Software engineering principles were applied during development. A key requirement was robustness, especially since physical access to the units would be limited post-deployment. As such, the monitoring systems were designed to be:
- Fault-tolerant and weather-resistant;
- Scalable and easily reproducible;
- Highly available, with minimal downtime.
By capturing air quality data locally every few seconds and processing image data on-device, the amount of transmitted data is reduced to only a few bytes per minute. An alternative approach would involve streaming live video to a central server for processing; however, this would significantly increase bandwidth usage as more devices are added.
2.3. Sensor Selection and Description for the Proposed Monitoring Devices
The CCS811 made by “ams AG”, Premstaetten, Austria is a low-power digital gas sensor that integrates a metal oxide (MOX) element to detect a wide range of volatile organic compounds (VOCs) for indoor air quality monitoring. It features a microcontroller unit (MCU) with an analog-to-digital converter (ADC) and an I2C interface. Built on ams’ proprietary micro-hotplate technology, the CCS811 enables fast cycle times and reduced power consumption. The integrated MCU controls drive modes, processes raw data, and outputs TVOC values or equivalent CO2 (eCO2) levels using embedded algorithms [48].
The BME280 made by Bosch Sensortec GmbH, Reutlingen, Germany, is a digital sensor that measures humidity, pressure, and temperature. It is compact, packaged in a 2.5 × 2.5 mm2 metal-lid LGA case, and has low power consumption, making it suitable for battery-powered applications. It operates within ranges of –40 to +85 °C, 0–100% relative humidity, and 300–1100 hPa [49].
The MiCS-6814 made by SGX Sensortech, Corcelles-Cormondrèche, Switzerland, is a robust MEMS sensor capable of detecting pollutants from vehicle emissions as well as agricultural and industrial sources. It contains three independent sensor chips: one for oxidizing gases (OX), one for reducing gases (RED), and one for ammonia (NH3). However, this sensor was ultimately excluded after several months of field testing due to insufficient signal variation; detected gas levels were too low to provide relevant outdoor readings [50].
For particulate matter detection, we selected the SN-GCJA5 optical sensor made by Panasonic Photo & Lighting Co., Ltd., Saiwai-cho, Takatsuki-city, Osaka, Japan. This sensor uses a laser diode (LD) as the emitter and a photodiode (PD) as the receiver. The PD detects scattered light from airborne particles, and the signal is processed by an embedded MCU using an optimized algorithm. The output is transmitted over I2C and UART interfaces as mass concentration values [51].
2.4. Processing Unit Selection for Local Image Processing
The idea of using a lightweight, mobile processing unit like the Raspberry Pi was inspired by previous projects and the feasibility of implementing onboard object recognition for vehicle counting. This approach enables a compact, non-invasive system (unlike inductive sensors embedded in the road) that is scalable and power-efficient—consuming only 10–12 W per unit and potentially operable using a small solar cell.
We selected the Raspberry Pi 4 made by Raspberry Pi (Trading) Ltd., Cambridge, UK, primarily due to its ability to run object detection models on the CPU. Key advantages include
- Performance: Powered by a quad-core ARM Cortex-A72 processor made by ARM Limited, Cambridge, UK, the Raspberry Pi 4 offers a significant performance boost over previous models. We selected the 4 GB RAM variant to support multitasking and image processing workloads.
- Connectivity: It features built-in dual-band Wi-Fi (2.4 GHz and 5 GHz), Bluetooth 5.0, and Gigabit Ethernet for high-speed wired connections.
- Affordability: The Raspberry Pi 4 delivers strong computing capabilities at a low cost, making it accessible for researchers, students, and professionals.
- Energy Efficiency: Its low power consumption supports continuous operation in remote or energy-constrained setups [52].
Figure 5 shows the system’s component interconnection diagram, and Figure 6 presents images of the assembled hardware.

Figure 5.
Monitoring unit component interconnection diagram.
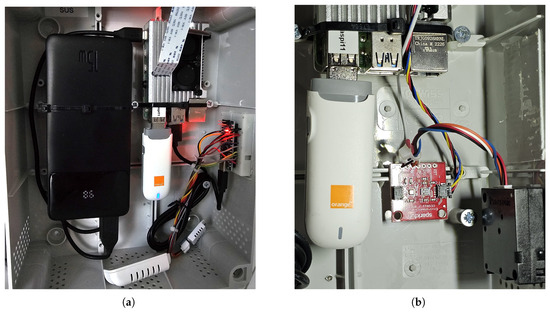
Figure 6.
These images show different stages of development: (a) Analog sensors were used, connected to an Arduino Nano board. (b) Better sensor versions using serial communication directly with Raspberry Pi.
Initially, a small Arduino Nano was used to handle sensors lacking I2C output. However, once these sensors were phased out, the Arduino was removed from the final hardware configuration.
As seen in Figure 6 and Figure 7, the monitoring unit is housed in a rigid case with a ventilation grid at the base. This design protects it from precipitation and physical interference while maintaining airflow for sensor accuracy and cooling. A passive heatsink mounted on the Raspberry Pi is sufficient to keep the processor below 82 °C and prevent thermal throttling.
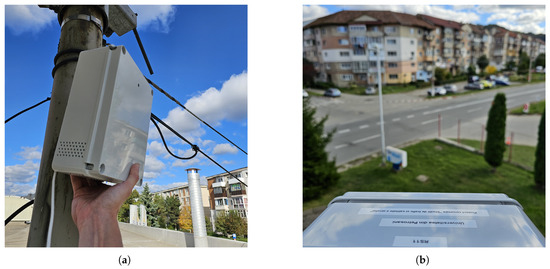
Figure 7.
Installation at location No. 2: (a) Physical positioning. (b) Monitored road section.
We tested the use of a battery power pack but found that it could not simultaneously recharge and power the unit reliably. As such, the system is currently powered either via grid electricity or a solar-based solution. The total power draw is approximately 10 W (up to 12.5 W peak at 5 V, 2–2.5 A). Sensor power requirements were considered during design to avoid overloading the Raspberry Pi’s 5V output rail.
2.5. Programming and Traffic Counter Algorithm of the Proposed System
Two major programming languages were used in the system’s development: C++ 14 and Python v3.9.2. A small C++ program runs in a loop on the Arduino Nano board (used to interface with analog-output sensors). This program interprets the values and sends them to the Raspberry Pi. Upon startup, the system’s first task is to establish an internet connection via a 3G modem, managed by a startup script configured to run once.
The main program, shown in Figure 8, is written in Python and configured as a service that runs automatically when the Raspberry Pi is powered on. Its core functions include
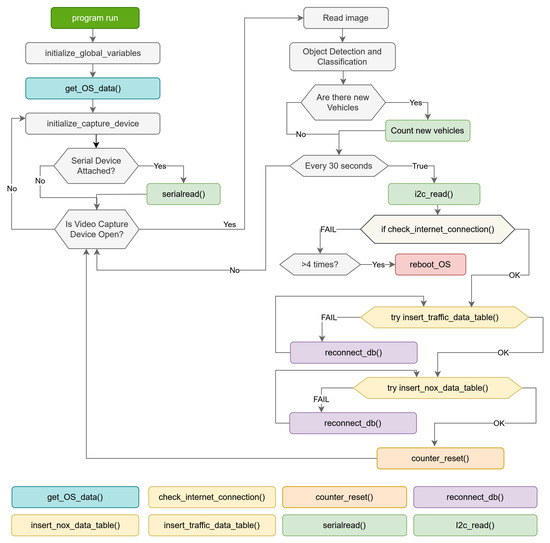
Figure 8.
Main program logic and functions.
- Capturing frames from the Raspberry Pi camera feed;
- Running TensorFlow Lite with the EfficientDet Lite0 model to perform real-time object recognition on each frame;
- Identifying and counting vehicles, with a focus on avoiding multiple counts of the same object in successive frames;
- Reading sensor values received from the auxiliary Arduino Nano;
- Managing connectivity status, database communication, and data transmission.
If the program crashes due to an unhandled exception, the operating system is configured to automatically restart the service.
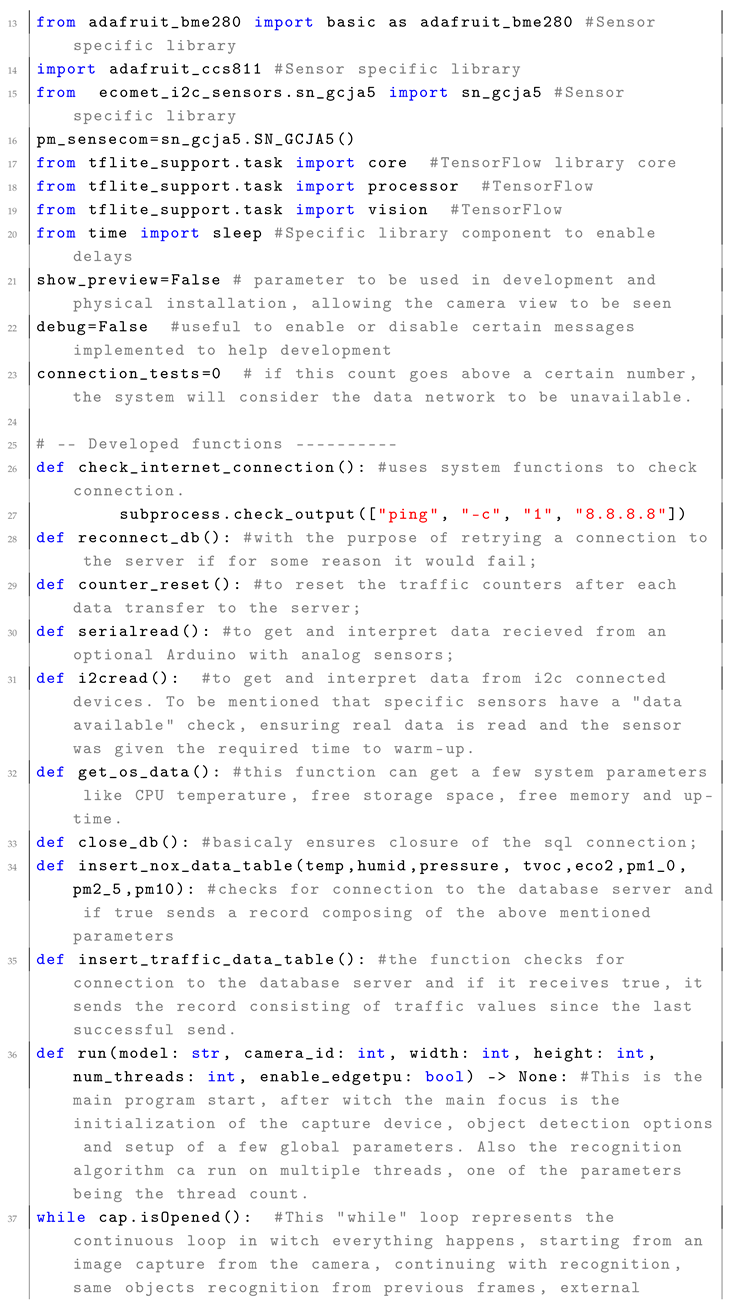
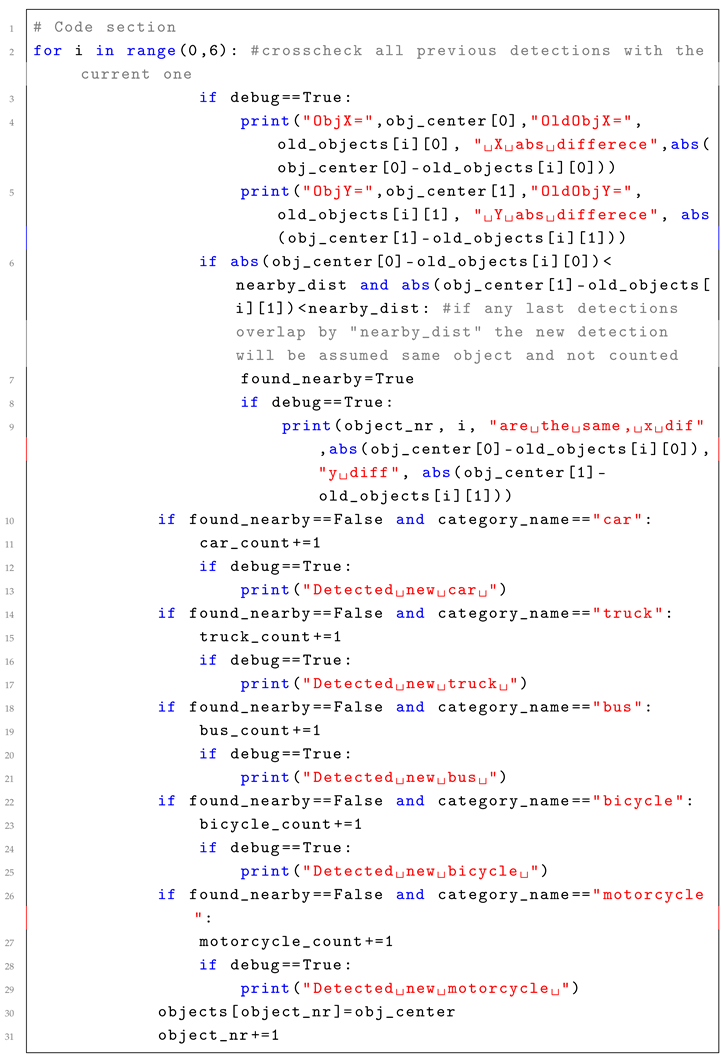
During development, when the monitoring application was run directly for debugging, overlay labels (in Romanian) were added to the captured images. These displayed the number and types of vehicles counted over each 30-s interval, after which the counters reset. Additional sensor data (eCO2, TVOC, temperature, humidity) are also shown (Figure 9 and Figure 10). Specific functions and a counting algorithm written in Python v3.9.2 can be found in Appendix A.
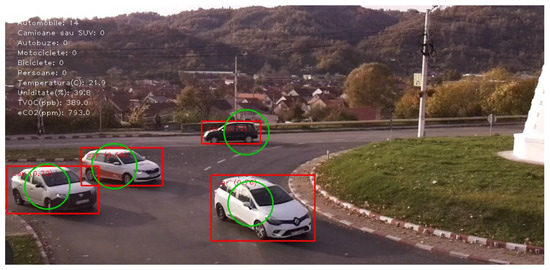
Figure 9.
Captured frame with overlays showing vehicle detection at location 1, red box and green circle indicating detection by the counter algorithm.
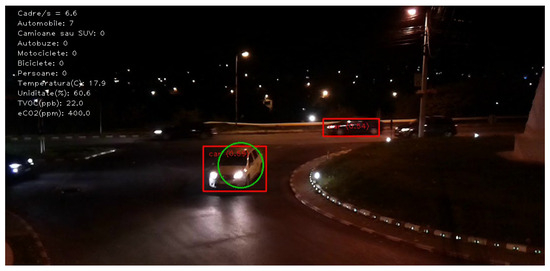
Figure 10.
Nighttime view from device at location 1.
To make the logged air quality and traffic data more accessible, a web application was developed and hosted on the same server as the database. This application allows users to select specific time periods and graph types. It uses the publicly available JavaScript library Chart.js to generate interactive charts, where individual elements can be toggled on or off (Figure 11). This tool allows non-expert users to easily interpret data trends across selected timeframes, though the number of visible samples (x-axis) may be limited by chart resolution.
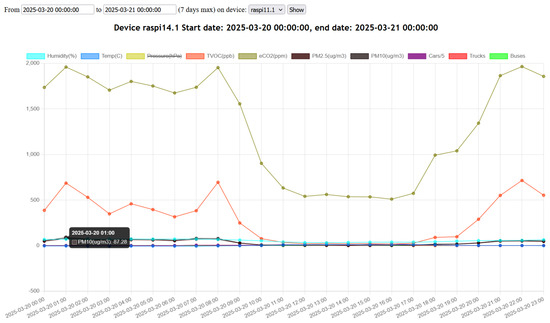
Figure 11.
User interface of the developed web application, graphs with a strikeout are not shown.
Implementing this interface required experience with JavaScript, PHP, and MySQL in order to retrieve values within the specified range and dynamically render them as charts.
2.6. Challenges in the System Development and Validation Process
Loss of connectivity: Continuous internet access is required for real-time data acquisition. Due to variable deployment locations, each unit uses a USB 3G modem with a SIM card connected to a GSM network. Data are sent twice per minute.
In early deployments, internet disconnection occurred approximately every two days, likely due to poor signal coverage. When disconnected, sensor and traffic readings remained unsent. Since the 3G modem failed to reconnect automatically and no Linux-based recovery documentation was available, we implemented a connectivity check followed by a system reboot when needed.
I2C communication issues: The Raspberry Pi 4 occasionally exhibits I2C instability due to “clock stretching”. This was mitigated by reducing the I2C baud rate to a safe value of 20 kHz.
Library conflict: An early Python library version for the SN-GCJA5 PM sensor produced valid data for only 3–4 min. The issue led to the discontinuation of that library’s use.
Traffic counting challenges: Although using OpenCV and TensorFlow Lite with the EfficientDet Lite0 model on the Raspberry Pi is well documented, object tracking across frames is more complex. Counting the same object multiple times must be avoided. Our solution assumes that vehicles maintain approximately consistent positions across frames. As long as the detected object remains in a similar area, the algorithm updates its position rather than recounting it.
To summarize,
- Detected objects in each frame are added to a list with their position and size;
- In the next frame, object positions are compared to the prior list;
- If object radii (scaled down slightly) overlap, it is treated as the same object and updated;
- Otherwise, it is counted as a new object and classified accordingly.
Processing unit stability: The Raspberry Pi has operated continuously for over a year with no stability issues. Internal case temperatures have ranged from –12 to 40 °C (peak in July 2024). No OS-level faults were recorded.
To improve processing speed, the recognition algorithm halts after detecting seven vehicles per frame. This threshold is sufficient for the camera’s field of view and can be increased if needed. During development, a “debug” flag enabled or disabled detailed logging. View from Station 3 is visible in Figure 12 and Figure 13.
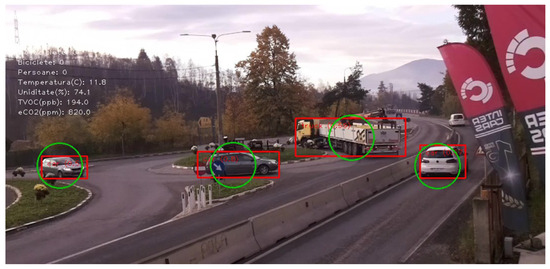
Figure 12.
Captured frame with overlays showing vehicle detection at location 3, red box and green circle indicating detection by the counter algorithm.
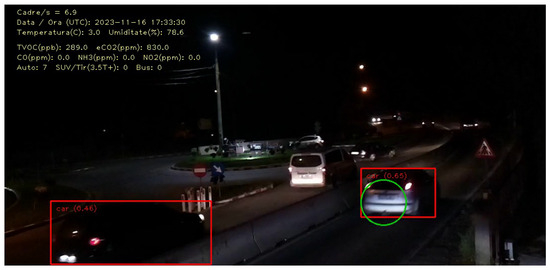
Figure 13.
Same location at night.
Separate database tables were used for traffic and air quality parameters. The structure is shown in Table 1. This modularity allows the system to function in traffic-only or air-quality-only modes if required.

Table 1.
SQL database table structures: air quality table and traffic table.
2.7. Testing and Validation of the Monitoring System’s Accuracy and Effectiveness
Traffic counting accuracy was evaluated through two methods: visual verification by a human operator and comparison against hourly and daily traffic averages reported in independent studies [41]. During daylight hours, the system achieved very good accuracy, with a deviation of fewer than 5 vehicles per 100 (i.e., 95% accuracy). Occasional false positives were observed, where the system overcounted vehicles.
At night, detection accuracy dropped significantly due to the basic camera’s lack of low-light sensitivity. The accuracy was approximately 25%, though this improved in areas with good street lighting. The image processing rate—covering both capture and object recognition—was satisfactory, averaging around 6 frames per second. Vehicle classification by type was acceptable, although the “trucks” category occasionally included SUVs, small platforms, and pickup trucks.
Air quality (AQ) accuracy was verified by placing two identical systems in the same indoor environment (control conditions) for several days to compare sensor output. The readings between the units were nearly identical, with no significant differences or anomalies. Additionally, the outdoor air quality data recorded during the winter months were compared to results from a previous study conducted in the same area and season. The average values were very similar, confirming consistency in performance [36].
To improve temperature and humidity readings, calibration was performed against reference sensors. Each monitoring unit was enclosed in a rigid case, with ventilation grids composed of 4 mm holes around the sensors to enable passive airflow (see Figure 6a). However, it is worth noting that the Raspberry Pi generates a small amount of heat, which slightly raises the internal case temperature and can lower the reported humidity. Additionally, case temperature is influenced by environmental factors such as sunlight exposure, depending on the installation location.
3. Results
A selection of recorded data from three consecutive months (October, November, and December 2024) is presented to demonstrate the system’s functionality in the field. During these periods, we observe a degradation in air quality, primarily caused by the increasing frequency of household heating as temperatures gradually decline.
Nighttime intervals were shaded on the graphs (Figure 14, Figure 15 and Figure 16), revealing low PM10 values in October nights but a noticeable increase in November and December. Notably, PM10 daily average levels in November and December exceeded almost every day the World Health Organization (WHO) air quality guidelines—some days in December exceeding up to eight times the recommended limit of 40 µg/m3 for a 24 h average [53]—with spikes consistently beginning after sunset, when traffic volumes decreased and heating activity increased. Daily 24 h measurement averages are available in Appendix B.1.
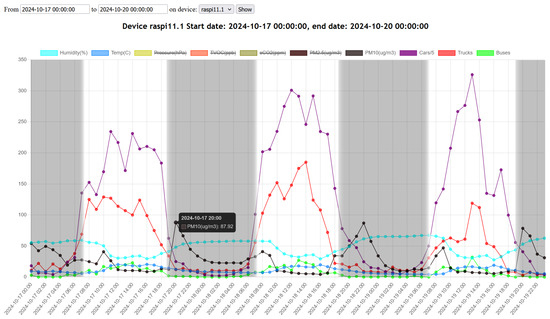
Figure 14.
Measurements taken late in October 2024, graphs with a strikeout are not shown.
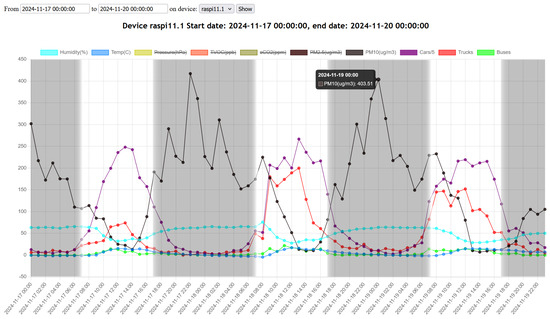
Figure 15.
Measurements taken late in November 2024, graphs with a strikeout are not shown.
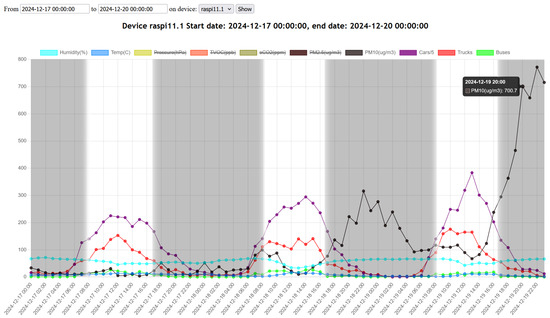
Figure 16.
Measurements taken late in December 2024, graphs with a strikeout are not shown.
The PM2.5 component consistently accounted for approximately 95% of PM10. Therefore, to improve visual clarity, only PM10 values are shown in the selected graphs. Additionally, to prevent distortion of the Y-axis due to volume disparity, traffic data labeled as “Cars” were scaled down by a factor of five.
Variation of PM10. Data from late 2024 show a progressive increase in PM variation (Appendix B.1). Summarized monthly averages can be seen in Table 2, which lists the average, minimum, and maximum for the selected transition months obtained from all readings:

Table 2.
Average, minimum and maximum values of PM10 (µg/m3).
To reject possible abnormal values produced by glitches, we imposed minimum (0.1 µg/m3) and maximum (1000 µg/m3) limits on PM10, outside which values are ignored. Only a couple of records were found above 1000 µg/m3.
Basic statistical analysis like Variability (Std Dev—standard deviation) increases from October to December, suggesting more fluctuation in PM10 levels later in the year (Table 3). The confidence intervals show the range within which the true mean likely falls with 95% certainty.

Table 3.
Monthly statistical summary of PM10 concentrations (µg/m3).
The Pearson/Spearman correlation coefficients were calculated between PM10 levels and traffic counts on hourly averages for two days recorded in November (Appendix B.2) and also represented visually in Figure 15:
- Cars: Pearson correlation: −0.789, Spearman correlation: −0.796;
- Trucks: Pearson correlation: −0.532, Spearman correlation: −0.742;
- Buses: Pearson correlation: −0.618, Spearman correlation: −0.631.
All correlations are negative, meaning as traffic counts increase, PM10 levels tend to decrease, which is counterintuitive and suggests that PM levels might be more influenced by non-traffic sources (e.g., overnight emissions, meteorology). There could be a time lag between emissions and PM accumulation. PM10 levels are higher during low-traffic hours (e.g., night), potentially due to lower dispersion but mainly because of other sources (burning of other fuels for heating). Spearman values (rank-based) are consistently stronger for trucks, suggesting nonlinear relationships.
These extreme PM10 values persisted through the winter. Only in March 2025 did PM10 levels drop below the 24 h WHO guideline, with a daily average of 38.4 µg/m3, a minimum of 1.1 µg/m3, and a maximum of 736 µg/m3.
We also considered the role of meteorological conditions—particularly wind speed and direction—which explain lower-than-expected values on certain days, although there is no possibility of recording wind speed with this system.
The monitoring stations can optionally capture still images via the embedded camera. An unexpected outcome of saving these frames was the ability to generate time-lapse videos, which can visually reveal pollution events. Figure 17 shows visible smoke rising from residential areas, suggesting a direct visual correlation with PM peaks.
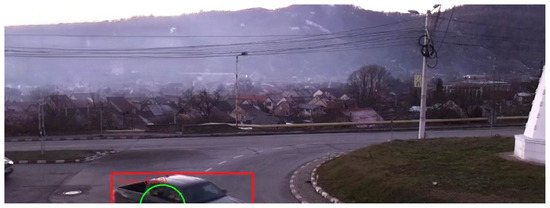
Figure 17.
Captured image showing the primary source of atmospheric pollution in January.
This visual functionality could also support public outreach or urban diagnostics, enhancing the interpretability of pollution events. Generated time-lapse videos were presented when the project received media attention and had the expected impact, raising awareness of the need for finding alternatives for household heating.
A potential use for the time-lapse feature would be to analyze images and data to find the relationship between visible smoke appearing and the time needed to register degradation of air quality. The captions added to the images already show air quality parameters, and this gives the possibility to correlate real-time between visual cues in the image and data.
We consider the main result of the study to be the development and validation of a fully functional, real-time environmental and traffic monitoring system. The data are available through a publicly accessible web interface.
4. Discussion
4.1. System Deployment and Maintenance
The monitoring system and its accompanying web interface have proven effective for real-time data logging. Although not yet packaged as an end-user product, deployment only requires minor adjustments—such as assigning a new device name, copying the preconfigured software, and creating corresponding database tables and GUI entries.
These tasks currently require basic Python programming and Linux OS knowledge, but future versions could include auto-detection and database integration features to simplify deployment. The estimated hardware cost per unit is EUR 200–250, assuming an existing database server. Operational costs such as maintenance, sensor calibration, or software updates are not included.
4.2. Sensor Accuracy and Calibration
Sensor longevity must be considered, as certain components require recalibration or replacement every 1–2 years. Although initial calibrations were performed during setup, periodic recalibration should be scheduled to ensure accuracy over time. From our observation, TVOCs and eCO2 sensors are most prone to drift but benefit from periodic automatic recalibration. Optical PM sensors will eventually accumulate fine particles over the sensing area, degrading their ability to record correct PM values. Our chosen PM sensor is rated to provide accurate readings for up to 5 years. There is always the possibility to install better, higher-grade, and more costly sensors if better accuracy is demanded.
4.3. Scalability and Usability
The system is scalable, with no strict hardware limits beyond network and bandwidth capacity. A modest number of additional nodes can be added without significant reconfiguration. We estimate bandwidth usage for one unit to be very low at 2 kB/minute. The database, on the other hand, would become quite large with 2.1 million entries/year/unit and would probably benefit from a maximum record storage limit of 2 years, or some kind of archival procedure not yet implemented. While the current setup requires some technical knowledge, future updates could enable non-expert deployment.
We propose expanding to a matrix of at least nine units: three in the area most polluted by household heating, another three in the main intersections with the highest traffic, and three devices in areas like parks and university campuses, where air quality levels are expected to be very good. This would take our study further by allowing us to make an AQ map and clearly view differences between monitored areas. The addition of six new units would cost between EUR 1200–1500 for hardware and an estimated time for configuration and deployment between 2 and 4 weeks if we work without external assistance. The integration of the additional units is straightforward, with no modification necessary on the existing systems.
4.4. Cybersecurity and Data Integrity
The monitoring units transmit data to a central server using direct MySQL connections over the local network or internet. Although the data transmitted this way are not encrypted and may be vulnerable to a “man in the middle” attack, the transmitted information consists of non-sensitive environmental data (e.g., sensor readings, timestamps). Access to the server requires proper authentication credentials, and no personal or location-identifiable data are stored on the units. Remote access is limited to predefined operations, and the system does not expose control functions over the network. The devices are practically invisible on the internet, a port scan of a unit does not return any results, and the device does not respond to echo requests (pings). Firmware updates are performed manually to avoid risks associated with remote modification. Images used in this study were manually triggered and are not stored or streamed continuously.
4.5. Connectivity and Reliability
Connection loss occurred 3–4 times weekly but was automatically resolved by watchdog functions. A loss triggers a retry protocol and soft restart, typically resulting in no more than four minutes of lost data per event. To reject possible abnormal readings produced by glitches, we imposed minimum (0.1 µg/m3) and maximum (1000 µg/m3) limits on PM10, outside which values are ignored. Data are recorded raw but for visualization and statistics calculations, values exceeding a certain threshold were discarded.
4.6. Time-Lapse and Visual Feedback
The ability to generate time-lapse visualizations from captured frames, although only used in testing, adds a secondary layer of insight. Visual cues, such as visible smoke plumes, offer intuitive validation of air quality trends and can help communicate findings to the public or policymakers. These visual indications were used when the project received media attention and certainly raised awareness of the need for finding alternatives for household heating. Time-lapse videos can be created upon request of policymakers for future time intervals, which could be used for municipality air quality reports or environmental programs.
5. Conclusions
The monitoring system offers a reliable, real-time perspective on air quality fluctuations and traffic conditions. It provides an efficient, cost-effective, and scalable solution—particularly relevant in contexts where national monitoring networks have limited coverage.
While three monitoring units cannot map pollution patterns with high spatial resolution across a city of 19.5 km2, the study demonstrates the system’s viability over an extended period of time. The high frequency of two readings per minute and strategic placement build an image of air quality and traffic variation throughout the day, thus giving the possibility to report values on a desired time-frames, providing valuable temporal pollution patterns.
Collected data and statistical analysis show that PM levels increase during winter, with notable differences between daytime and nighttime. The case study was focused on PM values to avoid using eCO2 and TVOC data, which tend to be influenced by sensor drift. While traffic contributes slightly during the day, PM10 concentrations rise significantly at night, implicating household heating as the dominant source.
We recommend ongoing monitoring to enable local authorities to evaluate the impact of ecological transport projects such as the “Green Line” and to assess progress toward goals like transport decarbonization and improved air quality. Our study shows that, at least during the winter, household heating—not traffic—is the primary contributor to local air pollution.
This research not only supports but also provides a strong rationale for future initiatives targeting cleaner residential heating solutions, better spatial monitoring, and informed environmental planning.
The developed monitoring system successfully combines real-time traffic and AQ monitoring with a user-friendly interface, using affordable components, distinguishing it from traditional air quality networks, and it has proven to be a reliable source of data over time. Future long-term benefits include data-driven policy-making to support sustainable urban and environmental management.
Author Contributions
Conceptualization, project administration, resources, C.R.L.; Investigation, data curation, C.R.L., A.N. and L.B.; Development, writing, review and editing, L.B.; Validation, C.R.L. and A.N. All authors have read and agreed to the published version of the manuscript.
Funding
This research was funded through the UNIVERSITY OF PETROSANI Scientific Research Contract (CIFC 6-CCGUEUST) No. 4282, dated 31 May 2023, led by Csaba LORINŢ. Topic: Comparative study of urban geology, human ecology, and traffic patterns with an impact on air quality in Petroșani Municipality within the context of decarbonization of mining areas.
Institutional Review Board Statement
Not applicable.
Informed Consent Statement
Not applicable.
Data Availability Statement
Public access to live and stored data is available at http://dev.upet.ro/aer (accessed on 21 March 2025). Because of changes to system versions, only data recorded by the last variant are accessible.
Conflicts of Interest
The authors declare no conflicts of interest. The funders had no role in the design of the study; in the collection, analyses, or interpretation of data; in the writing of the manuscript; or in the decision to publish the results.
Abbreviations
The following abbreviations are used in this manuscript:
| AQ | Air Quality |
| DIY | Do It Yourself |
| eCO2 | Equivalent Carbon Dioxide |
| GUI | Graphical User Interface |
| I2C | Inter-Integrated Circuit |
| IAQ | Indoor Air Quality |
| IoT | Internet of Things |
| JS | JavaScript |
| OS | Operating System |
| PM | Particulate matter |
| TVOC | Total Volatile Organic Compounds |
| UART | Universal asynchronous receiver-transmitter |
Appendix A
Appendix A.1. Main Program Code
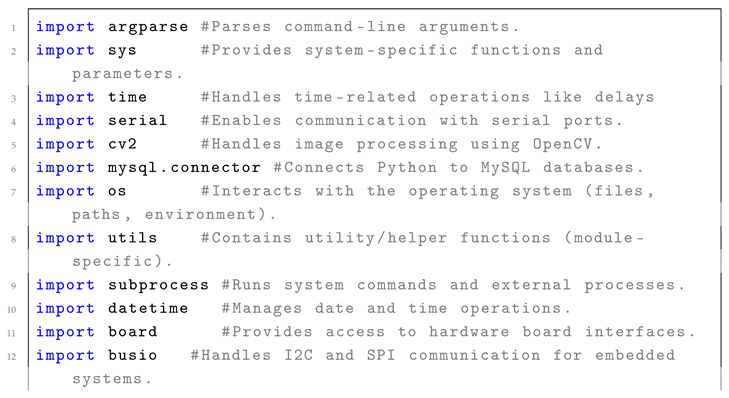
Specific Python libraries and used and developed functions are mentioned in the following code segments:
 |
 |
 |
Appendix A.2. Traffic Counting Algorithm
 |
Appendix B
Appendix B.1. Weather and PM10 Daily Averages
| Date | Humidity (%) | Temp (°C) | Pressure (hPa) | PM10, 24 h Avg. (µg/m3) | PM10 min. (µg/m3) | PM10 max. (µg/m3) |
| 16 Oct. 2024 | 40.45 | 17.93 | 955.77 | 38.4 | 4.59 | 225.25 |
| 17 Oct. 2024 | 47.24 | 12.39 | 957.44 | 30.53 | 5.14 | 216.88 |
| 18 Oct. 2024 | 49.09 | 11.07 | 955 | 27.61 | 1.98 | 179.15 |
| 19 Oct. 2024 | 51.83 | 9.31 | 954.7 | 20.95 | 3.13 | 125.5 |
| 20 Oct. 2024 | 51.07 | 9.87 | 958.27 | 36 | 2.89 | 255.77 |
| 21 Oct. 2024 | 48.82 | 10.38 | 961 | 62.57 | 2.24 | 393.81 |
| 22 Oct. 2024 | 47.27 | 10.8 | 959.59 | 84.73 | 3.92 | 354.12 |
| 23 Oct. 2024 | 46.27 | 10.74 | 959.62 | 90.45 | 2.93 | 439.27 |
| 24 Oct. 2024 | 56.12 | 9.49 | 961.51 | 113.5 | 8.85 | 401.49 |
| 25 Oct. 2024 | 54.32 | 11.76 | 957.69 | 80.19 | 6.97 | 427.23 |
| 26 Oct. 2024 | 47.84 | 11.95 | 955.94 | 71.76 | 3.79 | 750.98 |
| 27 Oct. 2024 | 47.31 | 12.89 | 954.73 | 93.87 | 4.74 | 488.33 |
| 28 Oct. 2024 | 50.28 | 15.61 | 953.93 | 86.52 | 5.02 | 310.73 |
| 29 Oct. 2024 | 51.65 | 14.47 | 954.66 | 69.58 | 7.1 | 604.45 |
| 30 Oct. 2024 | 53.18 | 12.44 | 954.51 | 71.21 | 2.12 | 452.51 |
| 31 Oct. 2024 | 54.83 | 14.81 | 954.08 | 47.47 | 1.46 | 556.84 |
| 01 Nov. 2024 | 53.49 | 13.3 | 952.96 | 51.61 | 3.28 | 268.9 |
| 02 Nov. 2024 | 53.42 | 11.97 | 950.62 | 46.4 | 0.67 | 271.87 |
| 03 Nov. 2024 | 56.65 | 9.31 | 957.22 | 55.36 | 0.17 | 428.09 |
| 04 Nov. 2024 | 53.14 | 4.95 | 955.07 | 91.07 | 2.82 | 349.37 |
| 05 Nov. 2024 | 52.79 | 5.02 | 958.97 | 98.96 | 6.6 | 551.25 |
| 06 Nov. 2024 | 48.08 | 6.34 | 959.97 | 163.01 | 5.75 | 797.74 |
| 07 Nov. 2024 | 41.66 | 7.21 | 962.08 | 201.46 | 1.82 | 760.98 |
| 08 Nov. 2024 | 45.67 | 5.71 | 960.34 | 207.97 | 7.94 | 793.33 |
| 13 Nov. 2024 | 52.63 | 6.95 | 954.07 | 38.95 | 6.27 | 156.65 |
| 14 Nov. 2024 | 55.17 | 5.57 | 951.19 | 35.9 | 6.06 | 213.94 |
| 15 Nov. 2024 | 57.91 | 4.19 | 949.97 | 41.52 | 4.91 | 553.52 |
| 16 Nov. 2024 | 53.88 | 4.22 | 952.5 | 109.76 | 4.69 | 727.07 |
| 17 Nov. 2024 | 54.18 | 4.24 | 944.21 | 160.83 | 4.86 | 772.16 |
| 18 Nov. 2024 | 52.19 | 5.02 | 942.43 | 156.56 | 1.04 | 799.8 |
| 19 Nov. 2024 | 48.79 | 6.02 | 943.47 | 132.33 | 1.34 | 751.66 |
| 20 Nov. 2024 | 52.06 | 10.19 | 930.22 | 16.21 | 0.17 | 144.14 |
| 21 Nov. 2024 | 64.42 | 1.62 | 934.27 | 57.18 | 0 | 369.49 |
| 22 Nov. 2024 | 67.22 | 2.77 | 931.12 | 35.45 | 0.17 | 360.94 |
| 23 Nov. 2024 | 62.13 | 1.44 | 947.17 | 37.14 | 0.31 | 377.03 |
| 24 Nov. 2024 | 55.59 | 1.46 | 960.13 | 132.32 | 7.12 | 611.01 |
| 25 Nov. 2024 | 56.11 | 6.32 | 956.64 | 159.79 | 4.89 | 768.37 |
| 26 Nov. 2024 | 59.51 | 6.09 | 949.7 | 196.62 | 17.67 | 791.24 |
| 27 Nov. 2024 | 59.66 | 7.83 | 952.56 | 99.04 | 6.45 | 770.33 |
| 28 Nov. 2024 | 61.24 | 7.68 | 952.09 | 109.69 | 10.85 | 462.06 |
| 29 Nov. 2024 | 66.97 | 6.51 | 950.03 | 61.66 | 0.67 | 427.64 |
| 30 Nov. 2024 | 66.28 | 6.15 | 955.2 | 140.86 | 31.43 | 517.92 |
| 01 Dec. 2024 | 58.05 | 8.17 | 956.67 | 40.81 | 1.65 | 269.35 |
| 02 Dec. 2024 | 54.07 | 5.55 | 953.24 | 60.32 | 2.43 | 599.96 |
| 03 Dec. 2024 | 59.71 | 3.45 | 948.04 | 142.68 | 3.3 | 618.78 |
| 04 Dec. 2024 | 58.94 | 5.6 | 948.7 | 128.66 | 16.35 | 398.93 |
| 05 Dec. 2024 | 59.8 | 6.22 | 952.12 | 33.93 | 2.02 | 223.01 |
| 06 Dec. 2024 | 61.92 | 5.3 | 947.14 | 27.9 | 0 | 254.51 |
| 07 Dec. 2024 | 67.85 | 5.45 | 941.78 | 68.31 | 6.17 | 285.27 |
| 08 Dec. 2024 | 64.66 | 5.29 | 937.99 | 58.66 | 9.38 | 334.69 |
| 09 Dec. 2024 | 61.15 | 7.12 | 940.43 | 63.98 | 1.17 | 389.68 |
| 10 Dec. 2024 | 64.03 | 4.84 | 946.84 | 96.56 | 21.34 | 432.79 |
| 11 Dec. 2024 | 59.45 | 5.87 | 949.21 | 65.68 | 3.56 | 444.31 |
| 12 Dec. 2024 | 56.32 | 3.75 | 954.05 | 24.07 | 3.85 | 177.67 |
| 13 Dec. 2024 | 49.81 | 4.29 | 958.73 | 33.68 | 3.51 | 324.42 |
| 14 Dec. 2024 | 51.9 | 4.22 | 952.09 | 30.06 | 8.81 | 290.98 |
| 15 Dec. 2024 | 58.03 | 4.1 | 947.58 | 27.9 | 3.25 | 328.25 |
| 16 Dec. 2024 | 56.56 | 6.41 | 955.64 | 10.43 | 0.17 | 181.43 |
| 17 Dec. 2024 | 57.45 | 9.95 | 954.54 | 16.6 | 0.67 | 132.77 |
| 18 Dec. 2024 | 56.05 | 7.64 | 953.56 | 85.03 | 3.1 | 654.41 |
| 19 Dec. 2024 | 60.43 | 5.08 | 945.4 | 214.27 | 44.82 | 798.76 |
| 20 Dec. 2024 | 61.38 | 4.01 | 936.73 | 318.18 | 97.64 | 799.08 |
| 21 Dec. 2024 | 65.38 | 5.75 | 942.38 | 69.37 | 3.77 | 612.34 |
| 22 Dec. 2024 | 56.35 | 4.3 | 940.93 | 42.28 | 1.76 | 324.42 |
| 23 Dec. 2024 | 57.02 | 3.52 | 931.76 | 75.25 | 5.86 | 419.02 |
| 24 Dec. 2024 | 65.74 | 4.16 | 935.76 | 147.72 | 23.12 | 723.03 |
| 25 Dec. 2024 | 60.83 | 5.87 | 950.84 | 61.73 | 1.65 | 436.97 |
| 26 Dec. 2024 | 59.13 | 5.76 | 958.83 | 101.88 | 9.39 | 491.25 |
| 27 Dec. 2024 | 57.84 | 4.76 | 957.06 | 109.27 | 7.31 | 459.28 |
| 28 Dec. 2024 | 56.4 | 5.24 | 954.86 | 116.11 | 12.9 | 647.46 |
| 29 Dec. 2024 | 62.58 | 3.45 | 955.71 | 94.06 | 20.89 | 679.32 |
| 30 Dec. 2024 | 53.62 | 5.79 | 956.96 | 119.93 | 1.62 | 734.23 |
| 31 Dec. 2024 | 60.86 | 1.7 | 958.48 | 169.74 | 7.8 | 581.02 |
Appendix B.2. Traffic Count and Hourly Average PM10
| Date, Hour | PM10 (µg/m3) | Cars | Trucks | Buses |
| 17 Nov. 2024, 00:00 | 301.95 | 63 | 6 | 0 |
| 17 Nov. 2024, 01:00 | 216.99 | 31 | 7 | 0 |
| 17 Nov. 2024, 02:00 | 172.43 | 36 | 4 | 0 |
| 17 Nov. 2024, 03:00 | 211.71 | 21 | 11 | 0 |
| 17 Nov. 2024, 04:00 | 175.20 | 40 | 9 | 0 |
| 17 Nov. 2024, 05:00 | 174.95 | 31 | 7 | 0 |
| 17 Nov. 2024, 06:00 | 110.35 | 63 | 12 | 0 |
| 17 Nov. 2024, 07:00 | 107.05 | 180 | 22 | 0 |
| 17 Nov. 2024, 08:00 | 113.87 | 278 | 27 | 1 |
| 17 Nov. 2024, 09:00 | 84.83 | 546 | 29 | 4 |
| 17 Nov. 2024, 10:00 | 83.31 | 845 | 33 | 8 |
| 17 Nov. 2024, 11:00 | 41.40 | 997 | 65 | 14 |
| 17 Nov. 2024, 12:00 | 24.82 | 1179 | 69 | 13 |
| 17 Nov. 2024, 13:00 | 22.56 | 1241 | 74 | 7 |
| 17 Nov. 2024, 14:00 | 13.11 | 1212 | 47 | 9 |
| 17 Nov. 2024, 15:00 | 39.24 | 888 | 33 | 2 |
| 17 Nov. 2024, 16:00 | 88.41 | 788 | 18 | 3 |
| 17 Nov. 2024, 17:00 | 190.97 | 553 | 15 | 4 |
| 17 Nov. 2024, 18:00 | 170.18 | 377 | 7 | 4 |
| 17 Nov. 2024, 19:00 | 290.31 | 170 | 7 | 2 |
| 17 Nov. 2024, 20:00 | 227.20 | 89 | 9 | 2 |
| 17 Nov. 2024, 21:00 | 213.00 | 67 | 0 | 1 |
| 17 Nov. 2024, 22:00 | 417.07 | 36 | 1 | 1 |
| 17 Nov. 2024, 23:00 | 359.78 | 33 | 3 | 0 |
| 18 Nov. 2024, 00:00 | 226.35 | 18 | 6 | 0 |
| 18 Nov. 2024, 01:00 | 199.25 | 12 | 3 | 0 |
| 18 Nov. 2024, 02:00 | 310.63 | 14 | 3 | 1 |
| 18 Nov. 2024, 03:00 | 236.98 | 8 | 7 | 0 |
| 18 Nov. 2024, 04:00 | 185.34 | 53 | 7 | 0 |
| 18 Nov. 2024, 05:00 | 152.08 | 57 | 8 | 0 |
| 18 Nov. 2024, 06:00 | 159.13 | 130 | 11 | 1 |
| 18 Nov. 2024, 07:00 | 174.51 | 278 | 49 | 3 |
| 18 Nov. 2024, 08:00 | 224.95 | 260 | 38 | 3 |
| 18 Nov. 2024, 09:00 | 177.18 | 1034 | 180 | 15 |
| 18 Nov. 2024, 10:00 | 123.21 | 995 | 159 | 8 |
| 18 Nov. 2024, 11:00 | 87.95 | 1117 | 174 | 22 |
| 18 Nov. 2024, 12:00 | 51.66 | 1001 | 189 | 17 |
| 18 Nov. 2024, 13:00 | 13.24 | 1333 | 200 | 15 |
| 18 Nov. 2024, 14:00 | 10.18 | 1182 | 128 | 9 |
| 18 Nov. 2024, 15:00 | 10.38 | 1060 | 74 | 13 |
| 18 Nov. 2024, 16:00 | 30.13 | 1082 | 61 | 14 |
| 18 Nov. 2024, 17:00 | 81.46 | 699 | 43 | 4 |
| 18 Nov. 2024, 18:00 | 162.24 | 334 | 32 | 1 |
| 18 Nov. 2024, 19:00 | 129.05 | 267 | 19 | 0 |
| 18 Nov. 2024, 20:00 | 209.82 | 192 | 16 | 1 |
| 18 Nov. 2024, 21:00 | 301.03 | 131 | 15 | 0 |
| 18 Nov. 2024, 22:00 | 234.09 | 98 | 25 | 1 |
| 18 Nov. 2024, 23:00 | 358.96 | 50 | 12 | 0 |
References
- Sharma, A.; Mitra, A.; Sharma, S.; Roy, S. Estimation of Air Quality Index from Seasonal Trends Using Deep Neural Network. In Artificial Neural Networks and Machine Learning—ICANN 2018: 27th International Conference on Artificial Neural Networks, Rhodes, Greece, 4–7 October 2018; Proceedings, Part III; Springer International Publishing: Cham, Switzerland, 2018; pp. 511–521. [Google Scholar] [CrossRef]
- Taştan, M.; Gökozan, H. Real-Time Monitoring of Indoor Air Quality with Internet of Things-Based E-Nose. Appl. Sci. 2019, 9, 3435. [Google Scholar] [CrossRef]
- Leung, D.Y.C. Outdoor-indoor air pollution in urban environment: Challenges and opportunity. Front. Environ. Sci. 2015, 2, 69. [Google Scholar] [CrossRef]
- Călămar, A.N.; Găman, G.A.; Pupăzan, D.; Toth, L.; Kovacs, I. Analysis of Environmental Components by Monitoring Gas Concentrations in the Environment. Environ. Eng. Manag. J. (EEMJ) 2017, 16, 1249–1414. [Google Scholar] [CrossRef]
- Rezmerița, E.; Radu, S.M.; Călămar, A.N.; Lorinț, C.; Florea, A.; Nicola, A. Urban Air Quality Monitoring in Decarbonization Context; Case Study–Traditional Coal Mining Area, Petroșani, Romania. Sustainability 2022, 14, 8165. [Google Scholar] [CrossRef]
- Neira, M.; Prüss-Ustün, A.; Mudu, P. Reduce air pollution to beat NCDs: From recognition to action. Lancet 2018, 392, 1178–1179. [Google Scholar] [CrossRef]
- Kampa, M.; Castanas, E. Human health effects of air pollution. Environ. Pollut. 2008, 151, 362–367. [Google Scholar] [CrossRef] [PubMed]
- Taştan, M. IoT Based Wearable Smart Health Monitoring System. Celal Bayar Üniv. Fen Bilim. Derg. 2018, 14, 343–350. [Google Scholar] [CrossRef]
- Dockery, D.W.; Pope, C.A. Acute Respiratory Effects of Particulate Air Pollution. Annu. Rev. Public Health 1994, 15, 107–132. [Google Scholar] [CrossRef]
- World Health Organization. Ambient Air Pollution: A Global Assessment of Exposure and Burden of Disease. 2021. Available online: https://www.who.int/publications/i/item/9789241511353 (accessed on 4 February 2025).
- Liu, C.; Chen, R.; Sera, F.; Vicedo-Cabrera, A.M.; Guo, Y.; Tong, S.; Coelho, M.S.; Saldiva, P.H.; Lavigne, E.; Matus, P.; et al. Ambient Particulate Air Pollution and Daily Mortality in 652 Cities. N. Engl. J. Med. 2019, 381, 705–715. [Google Scholar] [CrossRef]
- Garnica-Monroy, R.; Garibay-Bravo, V.; Gonzalez-Gonzalez, A.; Martínez Salgado, H.; Hernández-Reyes, M. Spatial Analysis of Exposure to Traffic-Related Air Pollution in Mexico: Implications for Urban Planning to Improve Public Health. Appl. Spat. Anal. Policy 2021, 15, 647–665. [Google Scholar] [CrossRef]
- Pitarma, R.; Marques, G.; Caetano, F. Monitoring Indoor Air Quality to Improve Occupational Health. In New Advances in Information Systems and Technologies—Volume 2 [Proceedings of the WorldCIST’16, Recife, Pernambuco, Brazil, 22–24 March 2016]; Rocha, Á., Correia, A.M.R., Adeli, H., Reis, L.P., Teixeira, M.M., Eds.; Advances in Intelligent Systems and Computing; Springer: Berlin/Heidelberg, Germany, 2016; Volume 445, pp. 13–21. [Google Scholar] [CrossRef]
- Abdulwahhab, R.S. Air Quality Monitoring System: Towards IoT based system for Air Pollutant Concentration Prediction. In Proceedings of the 10th International Conference on Advanced Computer Information Technologies, ACIT 2020, Deggendorf, Germany, 16–18 September 2020; pp. 311–316. [Google Scholar] [CrossRef]
- Hofman, J.; Nikolaou, M.E.; Do, T.H.; Qin, X.; Bonet, E.R.; Philips, W.; Deligiannis, N.; Manna, V.P.L. Mapping Air Quality in IoT Cities: Cloud Calibration and Air Quality Inference of Sensor Data. In Proceedings of the 2020 IEEE Sensors, Rotterdam, The Netherlands, 25–28 October 2020; pp. 1–4. [Google Scholar] [CrossRef]
- John, R.; Kureshi, R.R.; Thakker, D.; Mishra, B.K. Internet of Things (IoT) and Indoor Air Quality (IAQ) Monitoring in the Health Domain. In Proceedings of the IoT’21: 11th International Conference on the Internet of Things, St. Gallen, Switzerland, 8–12 November 2021; pp. 215–218. [Google Scholar] [CrossRef]
- Genuino, N.D.F.; Go, B.G.; Samson, A.A.; de Guzman, J.A.; Rosales, M.D.; Reyes, J.G.T.; Lomboy, M.F.T.C.; Hizon, J.R.E. WSN and IoT-Based Real-Time Indoor Air Quality Monitoring System for Hospital Facilities. In Proceedings of the 9th IEEE World Forum on Internet of Things, WF-IoT 2023, Aveiro, Portugal, 12–27 October 2023; pp. 1–6. [Google Scholar] [CrossRef]
- Aserkar, A.; Godla, S.; El-Ebiary, Y.; Krishnamoorthy; Venkata, J.; Ramesh, J. Real-time Air Quality Monitoring in Smart Cities using IoT-enabled Advanced Optical Sensors. Int. J. Adv. Comput. Sci. Appl. 2024, 15, 840. [Google Scholar] [CrossRef]
- Rojas González, L.; Montilla-Rosero, E. Evaluation of In-Situ Low-Cost Sensor Network in a Tropical Valley, Colombia. Sensors 2025, 25, 1236. [Google Scholar] [CrossRef] [PubMed]
- Bandara, N.S.; Hettiarachchi, S.; Athukorala, P. AirSPEC: An IoT-empowered Air Quality Monitoring System integrated with a Machine Learning Framework to Detect and Predict defined Air Quality parameters. arXiv 2021, arXiv:2111.14125. [Google Scholar] [CrossRef]
- Alvarez-Campana, M.; López, G.; Vázquez, E.; Villagra, V.; Berrocal, J. Smart CEI Moncloa: An IoT-based Platform for People Flow and Environmental Monitoring on a Smart University Campus. Sensors 2017, 17, 2856. [Google Scholar] [CrossRef] [PubMed]
- Marques, G.; Roque Ferreira, C.; Pitarma, R. A System Based on the Internet of Things for Real-Time Particle Monitoring in Buildings. Int. J. Environ. Res. Public Health 2018, 15, 821. [Google Scholar] [CrossRef]
- Kumar, S.; Jasuja, A. Air quality monitoring system based on IoT using Raspberry Pi. In Proceedings of the 2017 International Conference on Computing, Communication and Automation (ICCCA), Greater Noida, India, 5–6 May 2017; pp. 1341–1346. [Google Scholar] [CrossRef]
- Faiazuddin, S.; Lakshmaiah, M.; Alam, K.T.; Ravikiran, M. IoT based Indoor Air Quality Monitoring system using Raspberry Pi4. In Proceedings of the 2020 4th International Conference on Electronics, Communication and Aerospace Technology (ICECA), Coimbatore, India, 5–7 November 2020; pp. 714–719. [Google Scholar] [CrossRef]
- Tituana, D.; Yoo, S.G.; Andrade, R. Vehicle Counting using Computer Vision: A Survey. In Proceedings of the 2022 IEEE 7th International Conference for Convergence in Technology (I2CT), Mumbai, India, 7–9 April 2022; pp. 1–8. [Google Scholar] [CrossRef]
- Premaratne, P.; Jawad Kadhim, I.; Blacklidge, R.; Lee, M. Comprehensive review on vehicle Detection, classification and counting on highways. Neurocomputing 2023, 556, 126627. [Google Scholar] [CrossRef]
- Lamas Seco, J.J. Advanced Techniques for Traffic Monitoring Using Inductive Sensors. 2016. Available online: https://ruc.udc.es/dspace/handle/2183/16992 (accessed on 20 March 2025).
- Gheorghiu, R.A.; Iordache, V.; Stan, V.A. Urban traffic detectors–comparison between inductive loop and magnetic sensors. In Proceedings of the 2021 13th International Conference on Electronics, Computers and Artificial Intelligence (ECAI), Pitesti, Romania, 1–3 July 2021; pp. 1–4. [Google Scholar]
- Marciniuk, K.; Szczodrak, M.; Czyżewski, A. An application of acoustic sensors for the monitoring of road traffic. In Proceedings of the 2018 Signal Processing: Algorithms, Architectures, Arrangements, and Applications (SPA), Poznan, Poland, 21–22 September 2018; pp. 208–212. [Google Scholar]
- Barbagli, B.; Manes, G.; Facchini, R.; Manes, A. Acoustic sensor network for vehicle traffic monitoring. In Proceedings of the 1st International Conference on Advances in Vehicular Systems, Technologies and Applications, Venice, Italy, 24–29 June 2012; pp. 24–29. [Google Scholar]
- Sánchez-Oro, J.; Fernández-López, D.; Cabido, R.; Montemayor, A.S.; Pantrigo, J.J. Radar-based road-traffic monitoring in urban environments. Digit. Signal Process. 2013, 23, 364–374. [Google Scholar] [CrossRef]
- Zhang, F.; Clarke, D.; Knoll, A. Vehicle detection based on LiDAR and camera fusion. In Proceedings of the 17th International IEEE Conference on Intelligent Transportation Systems (ITSC), Qingdao, China, 8–11 October 2014; pp. 1620–1625. [Google Scholar] [CrossRef]
- Zhang, J.; Xiao, W.; Coifman, B.; Mills, J.P. Vehicle tracking and speed estimation from roadside lidar. IEEE J. Sel. Top. Appl. Earth Obs. Remote Sens. 2020, 13, 5597–5608. [Google Scholar] [CrossRef]
- Rathore, P.; Rao, A.S.; Rajasegarar, S.; Vanz, E.; Gubbi, J.; Palaniswami, M. Real-time urban microclimate analysis using internet of things. IEEE Internet Things J. 2017, 5, 500–511. [Google Scholar] [CrossRef]
- Lorinț, C.; Traistă, E.; Marchiș, D.; Aurelian, N.; Itu, R.; Lorand, B.; Rezmeriță, E. Cercetări Comparate de Geologie Urbană, Ecologie Umană și Studii de Trafic cu Impact Asupra Calității Aerului în Municipiul Petroșani în Contextul Decarbonizării Zonelor Miniere. Contract/Grant de Cercetare Nr. 4282/31.05.2023, (CIFC 6-CCGUEUST). 2023.
- Lorinț, C.; Traistă, E.; Florea, A.; Marchiș, D.; Radu, S.M.; Nicola, A.; Rezmerița, E. Spatiotemporal Distribution and Evolution of Air Pollutants Based on Comparative Analysis of Long-Term Monitoring Data and Snow Samples in Petroșani Mountain Depression, Romania. Sustainability 2025, 17, 3141. [Google Scholar] [CrossRef]
- Popescu, F.D.; Radu, S.M.; Andras, A.; Brinas, I.; Marita, M.O.; Radu, M.A.; Brinas, C.L. Stability Assessment of the Dam of a Tailings Pond Using Computer Modeling–Case Study: Coroiești, Romania. Appl. Sci. 2024, 14, 268. [Google Scholar] [CrossRef]
- Oncia, S.; Mihai Valentin, H.; Popescu, C. Sustainable development of the petrosani city, the hunedoara county, based on GIS analysis. J. Environ. Prot. Ecol. 2013, 14, 232–239. [Google Scholar]
- European Commission. EU Air Quality Standards. 2025. Available online: https://environment.ec.europa.eu/topics/air/air-quality/eu-air-quality-standards_en (accessed on 18 March 2025).
- ADR VEST. Green Line Project Jiu Valley. 16 October 2024. Available online: https://www.vest.ro/noutati/proiectul-green-line-valea-jiului-linia-verde-de-autobuze-electrice-pentru-transport-public-ntre-petrila-petro-ani-aninoasa-vulcan-lupeni-i-uricani-va-fi-finalizat-prin-programul-regional-vest-2021-2027# (accessed on 18 March 2025).
- Nicola, A.; Vitan, C.D.; Rezmerița, E.; Dării, V. Studiu de Trafic Pentru Sistematizarea Circulației Rutiere în Municipiul Petroșani. Contract Nr. 85/13.05.2023. 2023.
- S.C. Green Business S.R.L. Studiu de Fezabilitate: Linie Verde de Autobuze Electrice Între Petrila-Petroșani-Aninoasa-Vulcan-Lupeni-Uricani; S.C. Green Business S.R.L.: București, Romania, 2018. [Google Scholar]
- National Air Quality Monitoring Network. Available online: https://www.calitateaer.ro/ (accessed on 18 March 2025).
- Lorinț, C.; Danciu, C.; Traistă, E.; Florea, A.; Rezmerița, E. Aspects regarding the impact of cloth waste burning in the historical residential areas of the Petroșani municipality. MATEC Web Conf. 2024, 389, 00083. [Google Scholar] [CrossRef]
- Călămar, A.N.; Simion, A.; Toth, L.; Simion, S.; Nicolescu, C. Improving the Method of Calculating the Ecological Footprint Generated by Road Traffic-Case Study. Environ. Eng. Manag. J. (EEMJ) 2019, 18, 781–788. [Google Scholar]
- Khalili, M.; Zhang, X.; Cao, Y.; Polycarpou, M.M.; Parisini, T. Distributed Fault-Tolerant Control of Multiagent Systems: An Adaptive Learning Approach. IEEE Trans. Neural Netw. Learn. Syst. 2020, 31, 420–432. [Google Scholar] [CrossRef]
- Arvidsson, M.; Gremyr, I. Principles of robust design methodology. Qual. Reliab. Eng. Int. 2008, 24, 23–35. [Google Scholar] [CrossRef]
- ams AG. CCS811: Ultra-Low Power Digital Gas Sensor for Monitoring Indoor Air Quality. 2016. Available online: https://cdn.sparkfun.com/assets/learn_tutorials/1/4/3/CCS811_Datasheet-DS000459.pdf (accessed on 19 December 2023).
- Bosch Sensortec. BME280: Combined Humidity and Pressure Sensor. 2018. Available online: https://www.bosch-sensortec.com/media/boschsensortec/downloads/datasheets/bst-bme280-ds002.pdf (accessed on 19 December 2023).
- SGX Sensortech. MiCS-6814: Gas Sensor. 2014. Available online: https://www.sgxsensortech.com/content/uploads/2015/02/1143_Datasheet-MiCS-6814-rev-8.pdf (accessed on 19 December 2023).
- Panasonic Corporation. SN-GCJA5: Laser Type Particulate Matter Sensor. 2020. Available online: https://industrial.panasonic.com/ww/products/pt/dust-sensor/models/SN-GCJA5 (accessed on 19 December 2023).
- Raspberry Pi. Available online: https://www.raspberrypi.org/products/raspberry-pi-4-model-b/ (accessed on 19 December 2023).
- World Health Organization. WHO Global Air Quality Guidelines: Particulate Matter (PM2.5 and PM10), Ozone, Nitrogen Dioxide, Sulfur Dioxide and Carbon Monoxide; World Health Organization: Geneva, Switzerland, 2021. Available online: https://www.ncbi.nlm.nih.gov/books/NBK574594/ (accessed on 4 March 2025).
Disclaimer/Publisher’s Note: The statements, opinions and data contained in all publications are solely those of the individual author(s) and contributor(s) and not of MDPI and/or the editor(s). MDPI and/or the editor(s) disclaim responsibility for any injury to people or property resulting from any ideas, methods, instructions or products referred to in the content. |
© 2025 by the authors. Licensee MDPI, Basel, Switzerland. This article is an open access article distributed under the terms and conditions of the Creative Commons Attribution (CC BY) license (https://creativecommons.org/licenses/by/4.0/).