Abstract
The inertia control ability of photovoltaic power stations is weak. This leads to the problem that photovoltaic power stations cannot provide effective physical inertia support in the grid-connected system. In this paper, a photovoltaic power station controlled by a synchronous generator and virtual synchronous power generation is taken as the research object. A station-level dynamic inertia control model with synchronous machine and inverter control parameters coordinated is established. Firstly, the weakening of system inertia after a high-proportion photovoltaic grid connection is analyzed. Inertia compensation analysis based on an MW-level synchronous unit is carried out. According to the principle of virtual synchronous control of inverter, the virtual inertia control method and physical mechanism of a grid-connected inverter in a photovoltaic station are studied. Secondly, the inertia characteristics of the DC side of the grid-connected inverter are analyzed. The cooperative inertia control method of the photovoltaic grid-connected inverter and synchronous machine is established. Then, the influence of inertia on the system frequency is studied. The frequency optimization of the grid-connected parameter optimization of a photovoltaic station based on inertia control is carried out. Finally, aiming at the grid-connected control parameters, the inertia control parameter setting method of the photovoltaic station is carried out. The neural network predictive control model is established. At the same time, the grid-connected control model of the MW-level synchronous machine is embedded. The control system has the inertia characteristics of the synchronous generator and the fast-response dynamic characteristics of the power inverter.
1. Introduction
At present, new energy power generation presents a pattern of “large-scale centralized development, long-distance transmission” and “distributed development, local access”. The sending end system is increasing in complexity with the installed capacity of new energy. The safe and stable operation of the power system, the balance of power and electricity, and the consumption and transmission of electricity are facing great challenges. One of the main contradictions is to deal with the “double high” challenge to ensure the safe and stable operation of the power system, which will become the new normal of the power system [1]. The supporting ability of new energy units to power system operation is not as good as that of conventional units. The problems of rotational inertia, frequency characteristics, voltage stability, and even three defense lines caused by a high proportion of renewable energy access are becoming more and more prominent. The anti-disturbance ability and accident recovery ability of the power grid are facing severe tests.
The growing adoption of renewable and sustainable energy sources has significantly increased the integration of non-inertial power electronics-based systems into modern power grids. While virtual synchronous generator (VSG) technology has demonstrated promising progress in addressing the inherent limitations of fast-response non-inertial inverters, notable differences persist compared to conventional synchronous generators. Unlike traditional units that store rotational kinetic energy for inertial response during frequency fluctuations, VSG systems simulate this behavior through active power adjustments, enabling their participation in both primary and secondary frequency regulation processes. There are still some defects in the anti-interference ability and resilience of the virtual synchronous control system. For the virtual synchronous control method, there are mainly virtual synchronous generator control strategies based on proportional–integral–differential (PID) control. PID control is widely used in engineering practice because of its simplicity and easy implementation. In [2], a PID controller for VSG system is proposed. The dynamic response and steady-state performance of the system are improved by adjusting the control parameters. The simulation results show that the control strategy shows good robustness when the grid frequency fluctuates. In [3], the particle swarm optimization (PSO) algorithm was used to optimize the damping parameters and moment of inertia parameters so as to control the voltage and frequency deviation.
Fuzzy control has low requirements for the system model and good adaptability; as such, it is gradually being favored by researchers. In [4], the control system of VSG is designed using fuzzy logic control. Fuzzy rules are used to deal with nonlinearity and uncertainty. This method can effectively improve the stability and reliability of the virtual synchronous generator under different load conditions. In the face of external interference or parameter changes of the system, the sliding mode control shows its superiority. In [5,6,7], a virtual synchronous generator control strategy based on sliding mode control is proposed. Accurate tracking of the system is achieved by designing a sliding surface. This method shows strong anti-interference ability and fast dynamic response in simulation experiments. With the deepening of research, more and more scholars are beginning to pay attention to the combination of multiple control strategies.
Reference [8] introduced an integrated MPC-PID framework employing real-time optimization strategies to enhance system dynamic stability. Simulation validations demonstrate the hybrid approach’s superior responsiveness during load fluctuations and operational disturbances. Different from small-signal stability, large-disturbance stability analysis focuses on the performance of the system when encountering large-scale disturbances (such as faults or sudden load changes). According to the dynamic characteristics of VSG, the Lyapunov method is used to analyze the large disturbance stability in [9]. A stability criterion based on the Lyapunov function is proposed. The results show that VSG can effectively resist frequent large disturbances and maintain the stable operation of the system. In order to improve the versatility of the analysis, many scholars are committed to promoting the stability criterion. In [10], a stability analysis method based on generalized H ∞ theory is proposed. Considering a variety of uncertain factors, the accuracy and practicability of stability analysis are improved. Different VSG control strategies have been proposed in [11], with analysis based on PID control, fuzzy control, and sliding mode control. The research shows that these control strategies can effectively improve the dynamic response and stability of VSG. Combined with the traditional desynchronization control, the anti-interference ability of the system can be further improved.
Reference [12] proposed a variety of stability analysis methods for VSG, including small signal stability and large disturbance stability analysis. The results show that reasonable parameter design can significantly improve the stability of the system. It provides theoretical support for the engineering application of VSG. Reference [13] proposed a variety of control methods based on state feedback and predictive control and compared and analyzed the performance of these methods under different operating conditions. These studies provide a reference for the selection of control schemes for VSG in practical applications. References [14,15,16] improved the reliability of the system by using multi-agent reinforcement learning method. Reference [17] studied the response characteristics of VSG under different grid conditions. The results were verified by the actual experimental results, which provides support for theoretical research.
The above research has greatly improved the stability of the system and has a good reference value. However, most of these studies take energy storage as the main body. The frequency signal under the grid disturbance is used as the input to improve the frequency modulation strategy. The inertia weakening caused by the new energy grid connection is not quantified. There is no effective compensation for inertia weakening. Thus, the inertia weakening problem still exists.
However, the above methods struggle to solve the real inertia shortage problem of the system. The anti-interference energy of the system still needs to be improved. In order to realize the inertia control of photovoltaic station system, this study is based on the physical characteristics of new energy synchronous machines. The inertia characteristics are studied in depth, and the role of the new energy synchronous machine in providing inertia support is analyzed. The frequency response model of single machine system of new energy synchronizer is established. The ability of the new energy synchronizer in terms of frequency response and disturbance suppression is analyzed. The frequency response model of a multi-machine system connected to the grid through a new energy synchronizer is further constructed. The potential impact of a new energy synchronous machine on improving the critical permeability of new energy is analyzed. By increasing the synchronous unit in the photovoltaic station, we determine the control strategy of a photovoltaic grid-connected synchronous unit and realize the optimization of system control parameters for multi-AC collection. Finally, the system inertia control is realized to maintain the frequency stability of the sending end system under disturbance.
The main structure of this paper is as follows: Part 1 analyzes the current research status. Part 2 establishes the dynamic virtual inertia model of the photovoltaic inverter. Part 3 establishes the inertia model of the PV station in the AC collection mode of the inverter and the MW-level synchronizer. Part 4 performs coordinated inertia control on the photovoltaic grid-connected inverter and the synchronizer. Part 5 establishes the neural network predictive control model of the inertia parameters of the photovoltaic power station. Part 6 simulates and verifies the proposed control method, which proves the effectiveness of the proposed method. The last part is the conclusion.
2. Rural Regional Integrated Energy System Model
The simulated rotor kinetic energy in the virtual synchronous generator control can be expressed as follows [18,19,20]:
where J is the moment of inertia of the rotor and ωm is the rotor speed. Through the differentiation of Equation (1) with damping integration, the swing dynamics are mathematically expressed as follows:
where Pin is the input power. Pout is the output power. The damping coefficient of active power is expressed by D.
In Equation (2), can be defined as follows:
where ωgrid is the grid frequency. The virtual phase θm can be obtained by calculating the ωm integral, as follows:
According to the swing equation, when the disturbance causes two reverse torques to be unbalanced, the torque on the rotor is not equal to zero, resulting in acceleration or deceleration, as in the following Equation (5):
where Tm is the mechanical torque. Te is the electrical torque. Electrical torque is the rotational torque generated by the interaction between electric energy and magnetic field. Ta is acceleration torque. For finite angular velocity changes, it can be assumed that ωm = ωm,0, as follows:
where Pm is mechanical power, Pe is electric power, and Sr is rated power.
Assuming that Pm is a constant and the frequency is adjusted by the load side, Pe can be expressed as follows:
where , , and are the reference power values at the steady state, respectively; PD represents the reference power value on the load side. PFFC is the power value representing the frequency change control. PSIC indicates the power value of the inertial control. KD is the damping factor; its physical meaning represents the electric load that changes its active power via the frequency change. KFCC = KFCC(t − t0) is the proportional control coefficient of the frequency control. KSIC = KSIC(t − t0) is the proportional control coefficient of the inertial control. t0 represents the time delay, and the electric power can be expressed as follows:
where is the perturbation term and Pm is equal to Pe0 in the steady state.
The swing equation can be expressed as follows:
It is assumed that KFFC and KSIC are determined by the unit combination with time constant constraints, so that the unit inertia control and frequency change control are decoupled. Therefore, the differential equation can be solved as follows:
According to the above formula, both the inertia control and frequency control will affect the frequency change in the transient process of the system. The response time and power ramp rate of the inertia control and frequency control are constrained as a complex time-varying term. By increasing the system moment of inertia H, the fast inertia reserve based on the frequency deviation control can alleviate the influence of the power imbalance.
3. Inertia Compensation Model of Photovoltaic Station Based on Synchronous Machine
In order to improve the inertial support capability of photovoltaic stations, in this paper, a grid-connected control method of adding a DC motor to drive a synchronous generator in a photovoltaic station is proposed. In order to determine the inertia demand in the process of the grid connection of photovoltaic stations with MW-level synchronous units, we first compared photovoltaic stations with synchronous units with the same rated power output. In a power system with N synchronous units connected to the grid, the system inertia Hsys(0) can be expressed as follows [21,22,23]:
where is the inertia constant of the permanent magnet synchronous generator i in the system, is the output rated capacity of the first synchronous unit in the system, and is the total rated output capacity of i synchronous units in the system.
If large-scale photovoltaics are integrated into the power system, this part of the photovoltaic power station cluster is taken as a whole. At this time, the inertia Hsys(1) after the grid connection can be expressed as follows:
where is the equivalent inertia of the virtual inertia control of the photovoltaic station, while is the rated installed capacity of the photovoltaics in the station.
This paper proposes a control strategy that uses a shared energy storage device to compensate for the weakening of the photovoltaic grid-connected inertia. The control topology is shown in Figure 1.
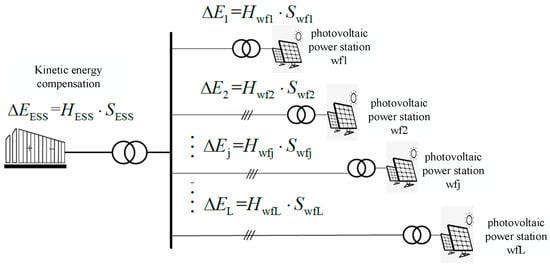
Figure 1.
Inertia compensation model of a photovoltaic power station.
Hwfj, Swfj, and Ej in the diagram represent the virtual inertia, rated capacity, and kinetic energy weakening of the photovoltaic power station j (j = 1, 2…L), respectively; ΔEESS, HESS, and SESS are the compensation kinetic energy, virtual inertia, and rated capacity of shared energy storage, respectively.
When the corresponding synchronous unit is added to the photovoltaic station, the equivalent inertia of the system can be expressed as follows:
where is the total installed capacity of the photovoltaic and synchronous units in the system, while is the compensation kinetic energy of the system. The compensation kinetic energy is provided by the synchronous unit in the station. After the inertia compensation based on the MW-level synchronous machine control, the grid inertia is as follows:
The kinetic energy to be compensated by the step unit after the photovoltaic access is expressed as follows:
The control of an AC-integrated photovoltaic power station with an MW-level synchronous machine and a virtual synchronous control inverter is shown in Figure 2. The DC power in the photovoltaic power station drives the MW-level synchronous generator to generate electricity. In this control block diagram, distributed renewable energy generation is connected to the main grid through an inverter controlled by virtual synchronization.
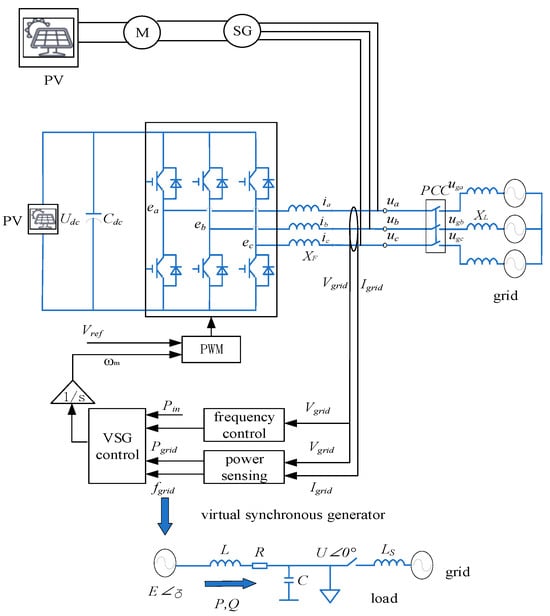
Figure 2.
Photovoltaic grid-connected AC collection control system with a synchronous unit.
4. Cooperative Inertia Control of a Photovoltaic Grid-Connected Inverter and Synchronous Machine
4.1. Synchronous Generator Control Model
The DC motor controller in the photovoltaic station includes a speed control mode and torque control mode. According to the operation mode command of the total controller, the speed closed-loop and torque closed-loop control of the permanent magnet synchronous motor are realized, respectively. The AC/DC rectifier can realize the controllable rectification from AC to DC. According to the voltage command of the main controller, the excitation voltage of the synchronous generator is quickly adjusted to change the excitation current. The quasi-synchronous grid-connected device is used to detect the three-phase voltage at the motor end, as well as the three-phase voltage and the three-phase current at the grid side. The amplitude difference, phase difference, frequency difference, and reactive power of the three-phase voltage between the motor end and the grid side are fed back. Once the amplitude difference, phase difference, and frequency difference meet the requirements of grid connection, we send the grid-connected closing command to the grid-connected cabinet to achieve no impact on the current grid connection. The total controller is divided into two stages, namely pre-grid control and post-grid control.
4.1.1. Control Before Grid Connection
- (1)
- We receive the phase difference and frequency difference of the quasi-synchronous grid-connected device, output the speed command through the PI controller, and then superimpose the rated speed as the speed command input of the permanent magnet synchronous motor controller. At this time, the permanent magnet synchronous motor controller is in speed control mode. The phase difference and frequency difference are achieved by fine-tuning the speed to meet the grid-connected requirements.
- (2)
- We receive the amplitude difference of the quasi-synchronous grid-connected device and output the voltage command through the PI controller. Using the DC voltage command input of the AC/DC rectifier cabinet, the excitation voltage of the synchronous generator is quickly adjusted to change the excitation current. The three-phase voltage amplitude of the synchronous generator meets the grid-connected requirements.
- (3)
- Switching the control mode of the permanent magnet synchronous motor controller after the grid-connected closing command, the DC voltage command of the AC/DC rectifier cabinet is switched to the reactive power closed loop.
4.1.2. Control After Grid Connection
Photovoltaic power generation is first boosted to a certain voltage level through the DC/DC controller and then transmitted to the DC bus or DC transmission line. Energy storage is connected to the DC bus or DC transmission line through bidirectional DC/DC to smooth or store new energy power generation. The DC bus is powered by the drive converter to drive the motor. The motor and synchronous generator rotate coaxially to generate electricity.
The grid-connected equations of the new energy synchronous generator set are as follows [24,25]:
where is the rotor speed deviation of the motor in the photovoltaic station, is the rotor speed deviation of the generator in the photovoltaic station, is the power angle deviation of the motor in the photovoltaic station, is the power angle deviation of the generator in the photovoltaic station, is the mechanical torque of the motor in the photovoltaic station, is the mechanical torque of the generator in the photovoltaic station, is the inertial time constant of the motor in the photovoltaic station, and is the inertia time constant of the generator in the photovoltaic station. is the damping coefficient of the motor in the photovoltaic station, is the damping coefficient of the generator in the photovoltaic station, and is the rated speed of the synchronous machine in the photovoltaic station. The system control logic is shown in Figure 3.
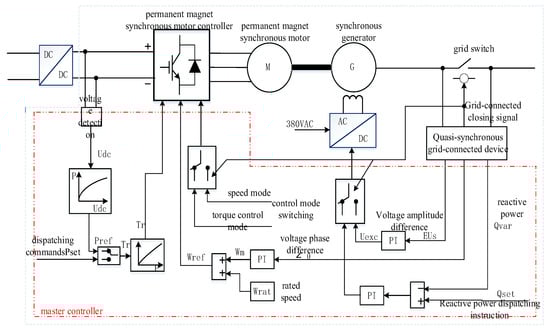
Figure 3.
System control logic diagram.
4.2. Inertia Time Constant of the Photovoltaic Station
The system is analyzed using droop control. Figure 4 shows the droop control diagram, where Pm and P are the rated power and the output electromagnetic power, respectively. 1/D and 1/M are the reactive frequency and reactive voltage recovery coefficient of the power grid, respectively. The cut-off frequency of the low-pass filter in the droop control loop is given.
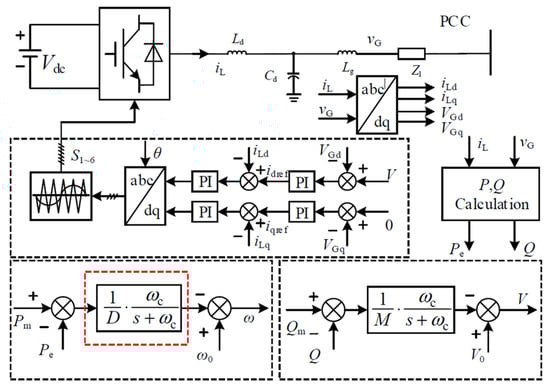
Figure 4.
Droop control schematic diagram.
According to Figure 4, the expression of the system frequency under the droop mechanism can be obtained as follows:
Without considering the change in the input power command, the linearized equation can be obtained as follows:
According to the droop mechanism, the system frequency changes when the load is disturbed. The power variation caused by the frequency change of the system can be expressed as follows:
where and are the transient power and steady-state power, respectively. Equation (22) shows that under the action of the droop mechanism, the power responding to the frequency change of the system is composed of two parts; the transient part corresponds to the inertial effect of the system, and the steady-state part corresponds to the damping part of the system. The transient power can be expressed as follows:
The transient support energy is expressed as follows:
Therefore, the inertial time constant corresponding to the droop control is defined as follows:
It can be seen from Equations (22)–(24) that the droop control simulation power grid has a certain inertia effect. Equation (25) shows the relationship between the equivalent inertia coefficient and the droop coefficient D and the cut-off frequency ωc.
4.3. Inertia Control Parameter Adjustment
According to the system structure diagram and the inertial equation, the equivalent Heffron–Philips model can be obtained, as shown in Figure 5. The key factors that may cause the virtual inertia instability of the system are identified, and the stability of the system is improved by adjusting the control parameters.
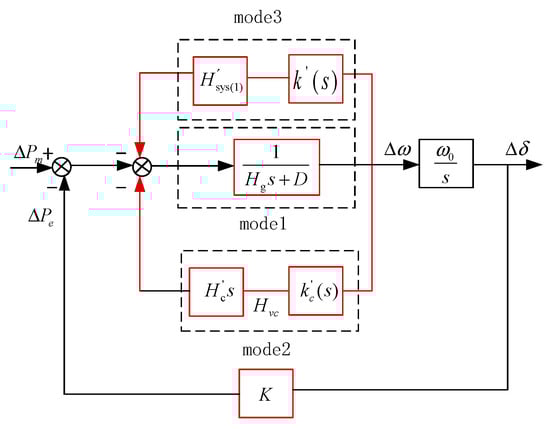
Figure 5.
Heffron–Philips model.
According to the equivalent model shown in Figure 4, the mathematical expression of the equivalent Heron–Philips model of the system can be obtained by using the electric torque analysis method, as follows:
where is the equivalent inertial time coefficient of the system, TD is the equivalent damping time coefficient of the system, and TS is the equivalent synchronization time coefficient of the system. are expressed as follows:
It can be seen from Figure 4 and Equation (27) that the inertia time constant of the system is mainly controlled by the following two methods: (1) Corresponding to the droop control of low inertia grid, the droop mechanism of the grid-side frequency outer loop control can slow down the frequency change and provide frequency support for the system. (2) Corresponding to the rotor inertia effect (inherent inertia and control), the rotor speed of the synchronous machine increases or decreases instantaneously, providing transient support for the system frequency (through the role of virtual control). In the case of low inertia, the inertia is adjusted by the synchronous generator to maintain the transient frequency stability of the system.
5. Inertia Parameter Neural Network Predictive Control Model of a Photovoltaic Power Station
5.1. Inertia Dynamic Predictive Control Model of a Photovoltaic Power Station Considering Synchronous Machine AC Collection
The neural network method is used to optimize the control parameters of the multi-AC collection system. The input layer is the inertia change in the AC collection system and the frequency change rate. The input layer is represented by xi.
The hidden layer input of the neural network and the corresponding Gaussian function of the hidden layer are expressed as follows:
where netj represents the input weighted sum of the jth neuron. x represents the input vector. cj represents the center vector of the jth hidden layer neuron. bj represents the width parameter of the jth hidden layer neuron.
After passing through the hidden layer, the output equation of the system inertia parameters is as follows:
The output layer of the neural network is . After the output layer, the output results of system inertia and frequency change rate can be expressed as follows:
In order to obtain the inertia optimization parameters of the photovoltaic power station, the state space equation is used to represent the inertia control system of the photovoltaic power station. The state space equation model of the system is as follows:
where Xc(t) is the state vector of photovoltaic power station, Uc(t) is the input vector of photovoltaic power station, and Yc(t) is the output vector of photovoltaic power station. The derivative of the state vector is defined as Fc(·). In addition, the output vector is a function of the state vector and the input vector, defined as Gc(·). The subscript c denotes the algorithm of realizing control in the controller in continuous time. Under discontinuous conditions, Equations (27) and (28) can be expressed as follows:
where k is the number of steps and Ts is the sampling time. Equations (29) and (30) can predict the next state when the input vector and the control vector are known. The main goal of predictive control is to define a series of control vectors to make the output track the reference trajectory as much as possible. In traditional model predictive control, the system model or the state space model of the system is used to predict the future output. The predictive controller defines a control strategy. We minimize the function in a specific time range, which is defined as follows:
where R(·) denotes the reference vector. NH denotes the maximum horizontal step time. γ is a discount factor (0 < γ < 1). We define the importance of the future frequency stability and ensure the convergence of the cost function at an infinite level. The variable wu is the gain vector of the control effort.
5.2. Station-Level Inertia Dynamic Predictive Controller
Applying model predictive control to optimization problems requires an accurate model of the system.
Figure 6 is a fully connected multi-layer feedforward neural network. The goal of neural network is to predict the training process of the next state as accurately as possible. In this process, the random control vector is used to model and measure the next state value, Figure 7 is the block diagram of the neural network predictive controller.
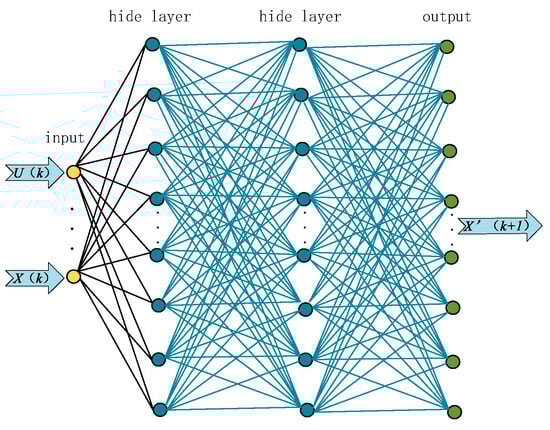
Figure 6.
Feedforward optimization neural network.
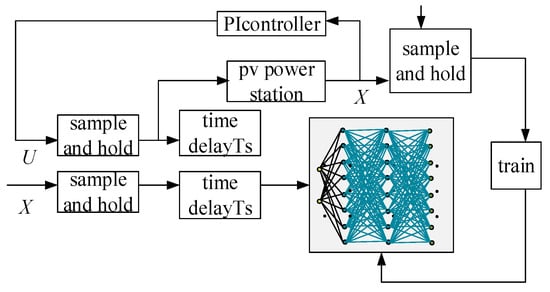
Figure 7.
System parameter neural network optimization process.
The neural network’s primary objective focuses on maximizing prediction precision for subsequent states. During operation, randomized control vectors are introduced into the model while quantifying the resultant state values. As shown in Figure 8, the neural network input includes a state vector and a control vector, and its output is the estimation of the next state. We constructed a neural network prediction update method, as shown in Figure 9. The neural network prediction process of the inertia parameters of photovoltaic power station is as follows.
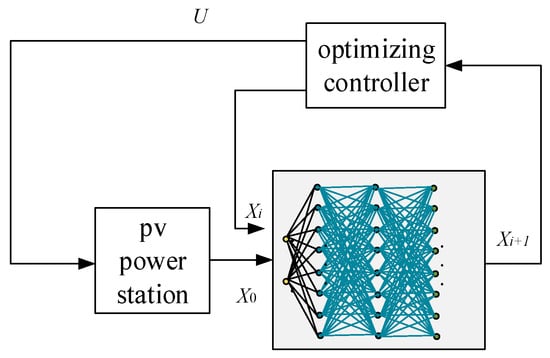
Figure 8.
Neural network predictive controller block diagram.
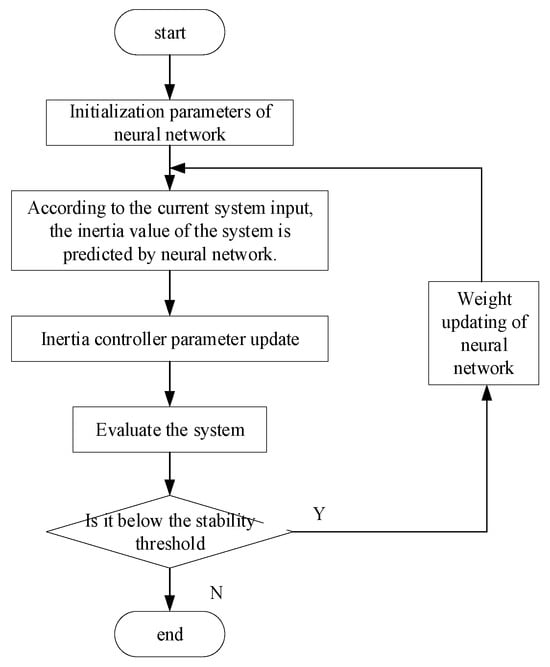
Figure 9.
Neural network prediction update steps.
6. Example Analysis
In this paper, the MATLAB/Simulink simulation platform is used for simulation verification, and the simulation system is shown in Figure 10. The parameters of the synchronous generators of each photovoltaic station in the system are shown in Table 1. The system simulation parameters are shown in Table 2.
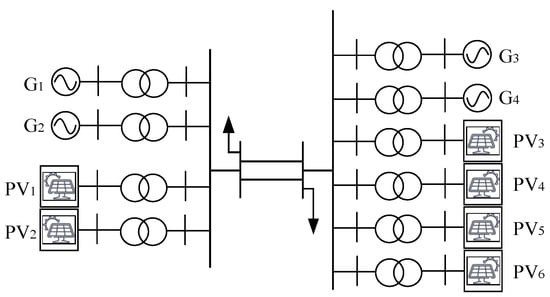
Figure 10.
Multi-photovoltaic station AC collection simulation system.

Table 1.
System parameters.
Table 2.
Control parameter.
The number of model iterations is set to 200 times, and the network is initialized before training. The learning rate is 0.0001 and the batch size is 256. Figure 11 shows how the accuracy of the training set and the test set changes with the number of iterations. The final accuracy of the training set and the verification set is 99.49% and 99.09%, respectively.
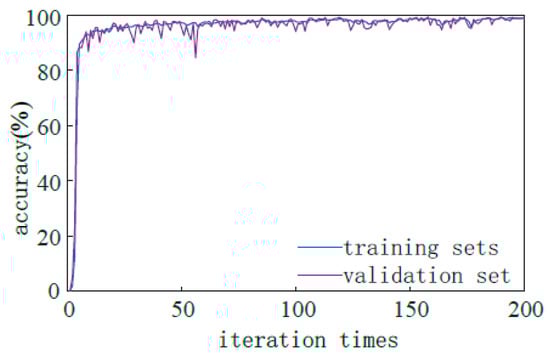
Figure 11.
Results of the training set and test set calculation.
After the system reaches a stable state, this paper compares and analyzes the system performance under four different control strategies, namely frequency droop control and inertia control without the DC system (Case 1), only inertia control (Case 2), only frequency droop control (Case 3), and frequency coordinated control (Case 4).
After the system is stable, a sudden increase of 80 MW and a sudden decrease of 800 W are also simulated and compared. The corresponding simulation results are shown in Figure 12 and Figure 13 and Figure 14 and Figure 15, respectively. Among them, Figure 12 and Figure 13 are the comparison of the frequency characteristics under different control modes (in the case of a sudden load increase), while Figure 14 and Figure 15 are the comparison of the frequency characteristics under different control modes (in the case of a sudden load decrease).
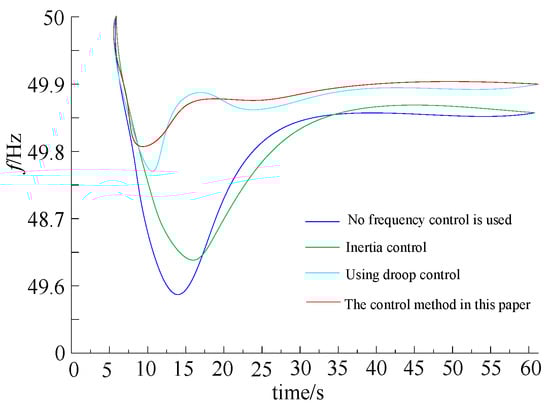
Figure 12.
System frequency when load increases.
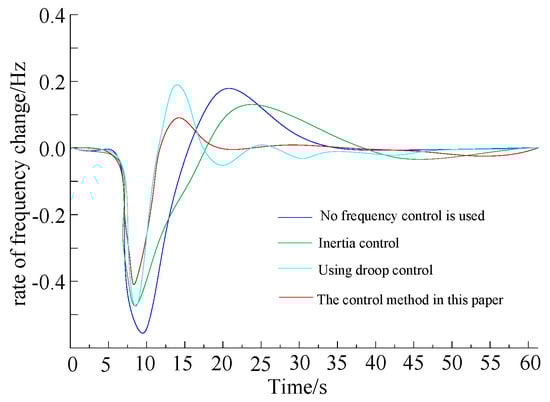
Figure 13.
Load increases the frequency change rate in the sending AC system.
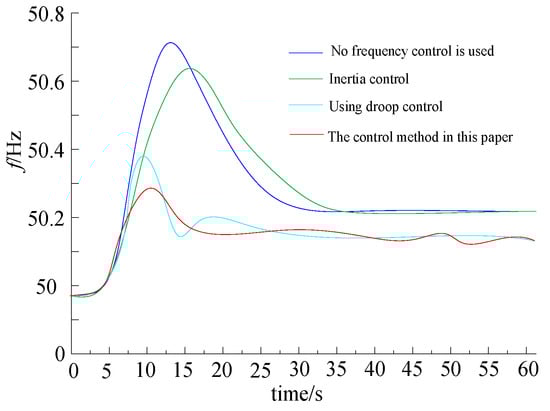
Figure 14.
System frequency when load decreases.
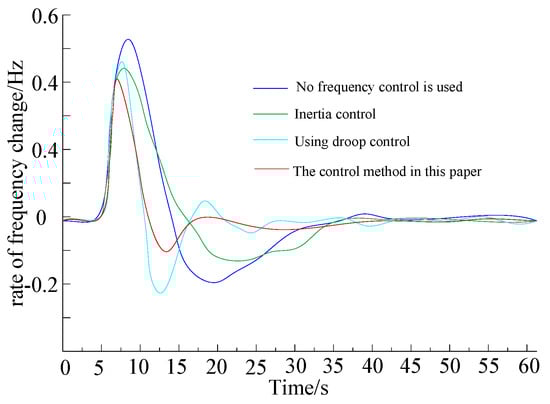
Figure 15.
Load reduction the frequency change rate in the sending AC system.
In the case of a sudden increase and sudden decrease in load power, when the DC frequency droop control and inertia control are not put into operation, the DC system does not respond to the system frequency change, the DC transmission power remains unchanged, and it cannot participate in the system frequency modulation. At this time, the frequency characteristic of the sending end system is the worst. When only inertia control is used, the maximum deviation value (the absolute value of the difference between the minimum value or the maximum value and the rated value) of the frequency of the sending end system is improved. However, the steady-state value of the system frequency is not improved. When frequency coordinated control is adopted, the maximum deviation value and steady-state value of the frequency of the sending end system are improved the most (to 0.39 Hz and 0.10 Hz, respectively) when the load increases suddenly. When the load is suddenly reduced, the frequency deviation reaches 0.41 Hz and 0.09 Hz, respectively. The system tends to stabilize after 35 s.
In order to verify the effectiveness of the proposed method in the sending end system for transient overvoltage control and improving the system support capability, the inertia control of multi-AC collection in the process of the grid connection of a photovoltaic station in Northwest China is verified. The grid-connected and outgoing system of the photovoltaic station is shown in Figure 16. When the sending channel of the sending end system fails, the regulation ability of the grid-connected photovoltaic power generation system with synchronous characteristics can be used to absorb the excess reactive power of the system and suppress the overvoltage.
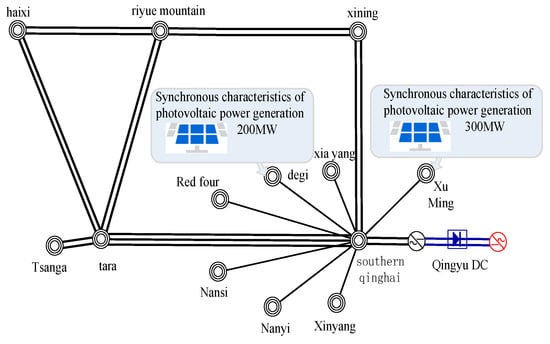
Figure 16.
Configuration scheme of an active support system for photovoltaic station delivery.
In the case of centralized access to new energy in the area near the Qingyu DC, the new energy grid-connected power electronic equipment is subject to measurement, filtering, and other links. There is a certain delay in the active and reactive power response in the rapid change in system voltage. Reactive power reverse regulation will occur during the rapid change in voltage that causes bipolar blocking of DC continuous commutation failure. The increase in the overvoltage situation leads to the transient voltage of some new energy stations exceeding 1.3 p.u., resulting in disconnection or equipment damage. However, with the increase in new energy installation and DC power, the DC transmission capacity and the output of new energy in the near area cannot be decoupled. It is necessary to optimize the arrangement of DC power according to the balance demand of Qinghai and the demand of new energy transmission in operation, and to increase the inertia control in the photovoltaic station.
Under the typical operation mode, the transmission power of Qingyu is 4 million kilowatts. When the Qingyu DC is blocked after three consecutive commutation failures, the transient voltage rise is up to 0.28 p.u. When the DC continuous commutation of the sending system fails, the bus voltage of the blocking fault is shown in Figure 17. By using the control method based on renewable energy synchronous units, the active and reactive power output of the active support system of the photovoltaic station is shown in Figure 18 and Figure 19.
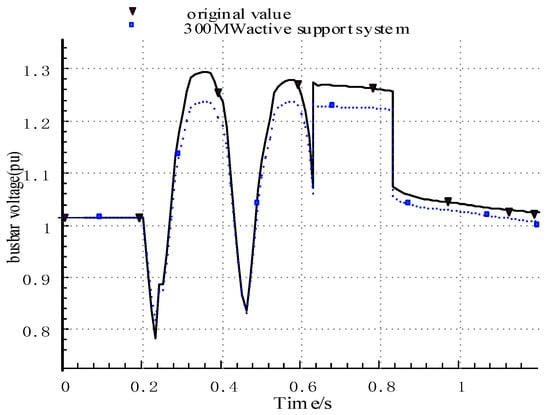
Figure 17.
Blocking fault bus voltage after continuous commutation failure of outgoing DC.
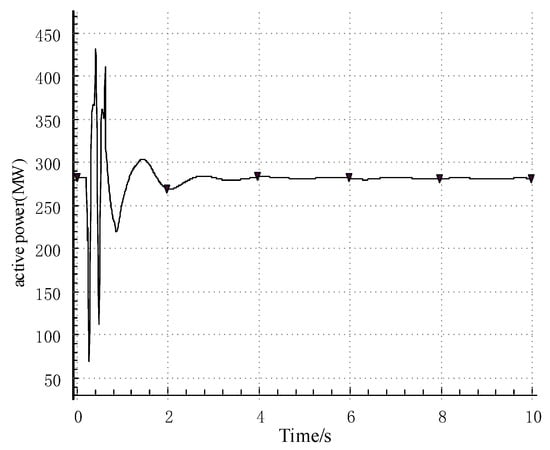
Figure 18.
Active power of the new energy active support system.
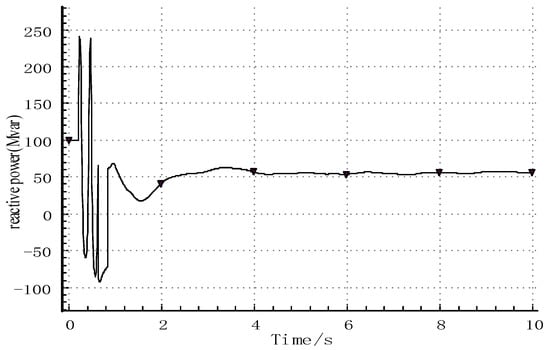
Figure 19.
Reactive power of the new energy active support system.
Compared with the original photovoltaic model, the transient pressure rise in the new energy unit is reduced from 0.28 p.u. to 0.24 p.u. after the photovoltaic power station is transformed into a synchronous photovoltaic power generation grid-connected system. It shows that the installation of synchronous photovoltaic power generation grid-connected system has an inhibitory effect on the temporary overvoltage problem of new energy units in the near area of Qingyu DC.
When the Qingyu DC transmission power is 4 million kilowatts, the maximum frequency deviation of the system reaches 0.221 Hz when the Qingyu DC bipolar blocking fault occurs. The 800 MW photovoltaic power station at Xuming in the area near the DC is transformed into a synchronous photovoltaic power generation grid-connected system. The system frequency after the fault is shown in Figure 20, and the active power of the synchronous photovoltaic power generation grid-connected system is shown in Figure 21.
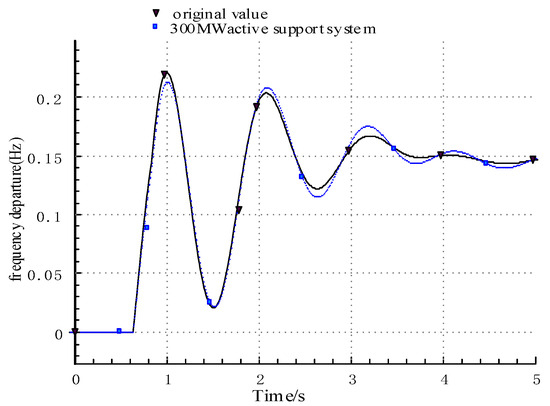
Figure 20.
The system frequency changes after the configuration of the new energy active support system.
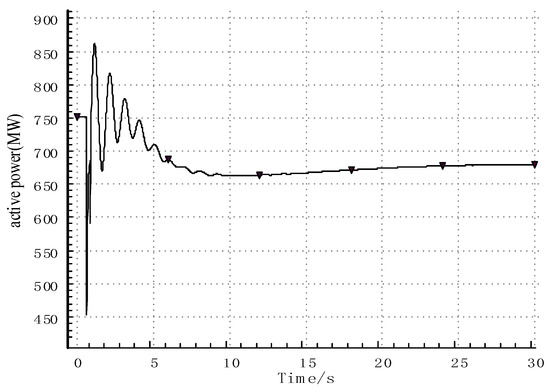
Figure 21.
Active power of the new energy active support system after the fault.
After adopting the new energy synchronous machine control strategy, the active power overshoot and adjustment time are significantly reduced, and the fractional-order virtual inertia is introduced to optimize the open-loop frequency characteristics of the system. The ability to suppress disturbances is enhanced, and the ability to respond quickly to changes in input signals is improved. This effectively improves the dynamic performance of the system. The active power overshoot and adjustment time are further reduced to accurately adapt to the current state of the system. In the face of external disturbances, it can quickly restore stability and achieve an optimal balance between the dynamic performance and the steady-state performance of the system.
Compared with the original photovoltaic grid-connected control, the 800 MW photovoltaic power station is transformed into a synchronous photovoltaic power generation grid-connected system. After the fault, with the increase in the system frequency, the synchronous photovoltaic power generation grid-connected system participates in the primary frequency modulation control. The maximum frequency deviation of the system is reduced from 0.221 Hz to 0.213 Hz.
7. Conclusions
Through simulation analysis, it can be obtained that the proposed scheme can make the photovoltaic power station provide transient support, steady-state rotational inertia support, system frequency modulation, and other services for power system operation. It instantaneously provides more than three times the overload capacity, while the instantaneous response time is less than 10 ms. The “low inertia and weak support” characteristics of new energy are greatly improved.
The simulation results show that the proposed simulation controller is superior to the typical inertial controller and the non-inertial controller in terms of the lowest frequency and the frequency change rate. Compared with the typical and non-inertial controllers, the percentage improvement of the frequency change rate of the proposed controller is about 16.56% and 20.93%, respectively. In addition, compared with typical and non-inertial controllers, the proposed controller improves the lowest frequency by 16.03% and 28.2%, respectively.
Author Contributions
Conceptualization, S.L.; Methodology, L.Y., W.Z. and S.L.; Software, L.Y.; Formal analysis, C.L.; Resources, C.L.; Data curation, W.Z., C.L. and Y.Q.; Writing—original draft, W.Z. and Y.Q.; Supervision, L.Y.; Project administration, S.L. All authors have read and agreed to the published version of the manuscript.
Funding
This work was supported by the State Grid Qinghai Electric Power Company Science and Technology Project (522830240001).
Institutional Review Board Statement
Not applicable.
Informed Consent Statement
Not applicable.
Data Availability Statement
The original contributions presented in this study are included in the article. Further inquiries can be directed to the corresponding author.
Conflicts of Interest
Authors Libin Yang, Wanpeng Zhou and Chunlai Li are employed by State Grid Qinghai Electric Power Company. The remaining authors declare that the research was conducted in the absence of any commercial or financial relationships that could be construed as a potential conflict of interest.
References
- Arif, S.; Rabbi, A.E.; Ahmed, S.U.; Hossain Lipu, M.S.; Jamal, T.; Aziz, T.; Sarker, M.R.; Riaz, A.; Alharbi, T.; Hussain, M.M. Enhancement of Solar PV Hosting Capacity in a Remote Industrial Microgrid: A Methodical Techno-Economic Approach. Sustainability 2022, 14, 8921. [Google Scholar] [CrossRef]
- Mohanty, D.; Giri, A.; Panda, S. Frequency regulation by optimized fuzzy based self-adaptive virtual inertia control for microgrid with variable renewable penetration. J. Energy Storage 2024, 104, 114433. [Google Scholar] [CrossRef]
- Ghany, M.A.; Syam, F.A.; Aly, A.M.; Abido, M.A.; Ibrahim, S.O. Load frequency and virtual inertia control for power system using fuzzy self-tuned PID controller with high penetration of renewable energy. J. Electr. Syst. Inf. Technol. 2024, 11, 50. [Google Scholar]
- Zhang, H.; Wang, X.; Wang, W.; Cui, Y. The technology of virtual inertia control considering the state of charge of hybrid energy storage. J. Phys. Conf. Ser. 2024, 2823, 012030. [Google Scholar] [CrossRef]
- Arias, M.B.; Bae, S. Solar Photovoltaic Power Prediction Using Big Data Tools. Sustainability 2021, 13, 13685. [Google Scholar] [CrossRef]
- Li, Y.; Zhang, H.; Liang, X.; Huang, B. Event-triggered based distributed cooperative energy management for multienergy systems. IEEE Trans. Ind. Inform. 2019, 15, 2008–2022. [Google Scholar] [CrossRef]
- Bakare, M.S.; Abdulkarim, A.; Shuaibu, A.N.; Muhamad, M.M. Predictive energy control for grid-connected industrial PV-battery systems using GEP-ANFIS. e-Prime—Adv. Electr. Eng. Electron. Energy 2024, 9, 100647. [Google Scholar] [CrossRef]
- Bakir, Y.N.; de Pablo, S.; Martinez-Rodrigo, F.; Aljawary, Z.A.; Lucas, L.C.H.-D. Nearest Vector Control Method Applied to an MMC for PV Generation. Energies 2024, 17, 1795. [Google Scholar] [CrossRef]
- Villena-Ruiz, R.; Honrubia-Escribano, A.; Hernández, J.C.; Gómez-Lázaro, E. Assessment of the synthetic inertial response of an actual solar PV power plant. Int. J. Electr. Power Energy Syst. 2024, 157, 109875. [Google Scholar] [CrossRef]
- Hasen, S.A.; Aydın, Ö.; Ayasun, S.; Sönmez, Ş. Impact of virtual inertia and damping control on stability delay margins of load frequency control systems with renewable energy sources. Electr. Eng. 2023, 106, 323–341. [Google Scholar] [CrossRef]
- Li, Y.; Gao, D.W.; Gao, W.; Zhang, H.; Zhou, J. Double-Mode Energy Management for Multi-Energy System via Distributed Dynamic Event-Triggered Newton-Raphson Algorithm. IEEE Trans. Smart Grid 2020, 11, 5339–5356. [Google Scholar] [CrossRef]
- Alsafasfeh, Q.; Saraereh, O.A.; Khan, I.; Kim, S. Solar PV Grid Power Flow Analysis. Sustainability 2019, 11, 1744. [Google Scholar] [CrossRef]
- Boopathi, R.; Indragandhi, V. Comparative analysis of control techniques using a PV-based SAPF integrated grid system to enhance power quality. e-Prime—Adv. Electr. Eng. Electron. Energy 2023, 5, 100222. [Google Scholar] [CrossRef]
- Yang, H.; Yuan, J.; Li, C.; Zhao, G.; Sun, Z.; Yao, Q.; Bao, B.; Vasilakos, A.V.; Zhang, J. BrainIoT: Brain-Like Productive Services Provisioning With Federated Learning in Industrial IoT. IEEE Internet Things J. 2022, 9, 2014–2024. [Google Scholar] [CrossRef]
- Niu, Z.; Yang, H.; Yao, Q.; Wu, B.; Yin, S.; Shen, S.; Wei, B.; Zhang, J.; Vasilakos, A.V. Reliable Low-Latency Routing for VLEO Satellite Optical Network: A Multiagent Reinforcement Learning Approach. IEEE Internet Things J. 2025, 12, 2309–2321. [Google Scholar] [CrossRef]
- Niu, Z.; Yang, H.; Yao, Q.; Yu, A.; Yin, S.; Shen, S.; Wei, B.; Zhang, J.; Vasilakos, A.V. HAP Networking Enables Highly Reliable Space-Air-Ground Optical Interconnect: An Integrated Network Perspective. IEEE Netw. 2025, 39, 224–231. [Google Scholar] [CrossRef]
- Ebrahim, M.A.; Ward, S.A.; El-Gohary, M.F.; Mohamad, M.A.; Eid, M.M.; Alharbi, A.H.; Khafaga, D.S. AI-based voltage and power quality control of high-penetration grid-connected photovoltaic power plant. Front. Energy Res. 2023, 11, 1178521. [Google Scholar] [CrossRef]
- Li, Y.; Gao, D.W.; Gao, W.; Zhang, H.; Zhou, J. A Distributed Double-Newton Descent Algorithm for Cooperative Energy Management of Multiple Energy Bodies in Energy Internet. IEEE Trans. Ind. Inform. 2021, 17, 5993–6003. [Google Scholar] [CrossRef]
- Hussain, M.I.; Kim, J.T. Performance Evaluation of Photovoltaic/Thermal (PV/T) System Using Different Design Configurations. Sustainability 2020, 12, 9520. [Google Scholar] [CrossRef]
- Ma, Y.F.; Li, J.Y.; Wang, Z.J.; Zhao, S.Q.; Guo, R.S. Assessment method of regional equivalent inertia of new energy power system based on measurement data. J. Electr. Technol. 2024, 39, 5406–5421. [Google Scholar]
- Fu, Y.; Zhen, D.F.; Zhang, X.Y.; Zhao, X.Y.; Wang, Y.D. Transient electric quantity inertia control strategy for wind turbines in DC microgrid. High Volt. Technol. 2022, 48, 156–165. [Google Scholar]
- Zhang, X.Y.; Li, L.F.; Fu, Y. Stability analysis and regional collaborative control of controllable inertia optical storage interconnection system. High Volt. Technol. 2021, 47, 1694–1705. [Google Scholar]
- Cao, J.B.; Wang, L.; Huang, H.; Wu, J.; Gao, Y.; Li, X. Virtual inertial control strategy for multi port converter in DC microgrid. Power Grid Technol. 2021, 45, 2604–2615. [Google Scholar]
- Li, T.C.; Yan, P.; Hu, X.K.; Liang, B.; Zeng, S.; Yang, S. Research on energy storage assisted frequency modulation control strategy in photovoltaic high proportion system. Acta Energiae Solaris Sin. 2023, 44, 282–291. [Google Scholar]
- Zhang, Q.Y.; Xie, J.; Pan, X.P.; Liu, M.T.; Xiao, Y.Z.; Feng, L.N. Short-term optimal scheduling model of wind-solar-hydro complementary power generation considering dynamic frequency response. Acta Energiae Solaris Sin. 2023, 44, 516–524. [Google Scholar]
Disclaimer/Publisher’s Note: The statements, opinions and data contained in all publications are solely those of the individual author(s) and contributor(s) and not of MDPI and/or the editor(s). MDPI and/or the editor(s) disclaim responsibility for any injury to people or property resulting from any ideas, methods, instructions or products referred to in the content. |
© 2025 by the authors. Licensee MDPI, Basel, Switzerland. This article is an open access article distributed under the terms and conditions of the Creative Commons Attribution (CC BY) license (https://creativecommons.org/licenses/by/4.0/).