
Balancing Solar Potential and Environmental Risk: A GIS-Based Site-Selection Approach for Concentrated Solar Power in Tibet

Abstract
1. Introduction
1.1. Research on Index Selection of CSP Power Stations
1.2. Research on the Location Selection of CSP Using GIS-MCDM
2. Methodology
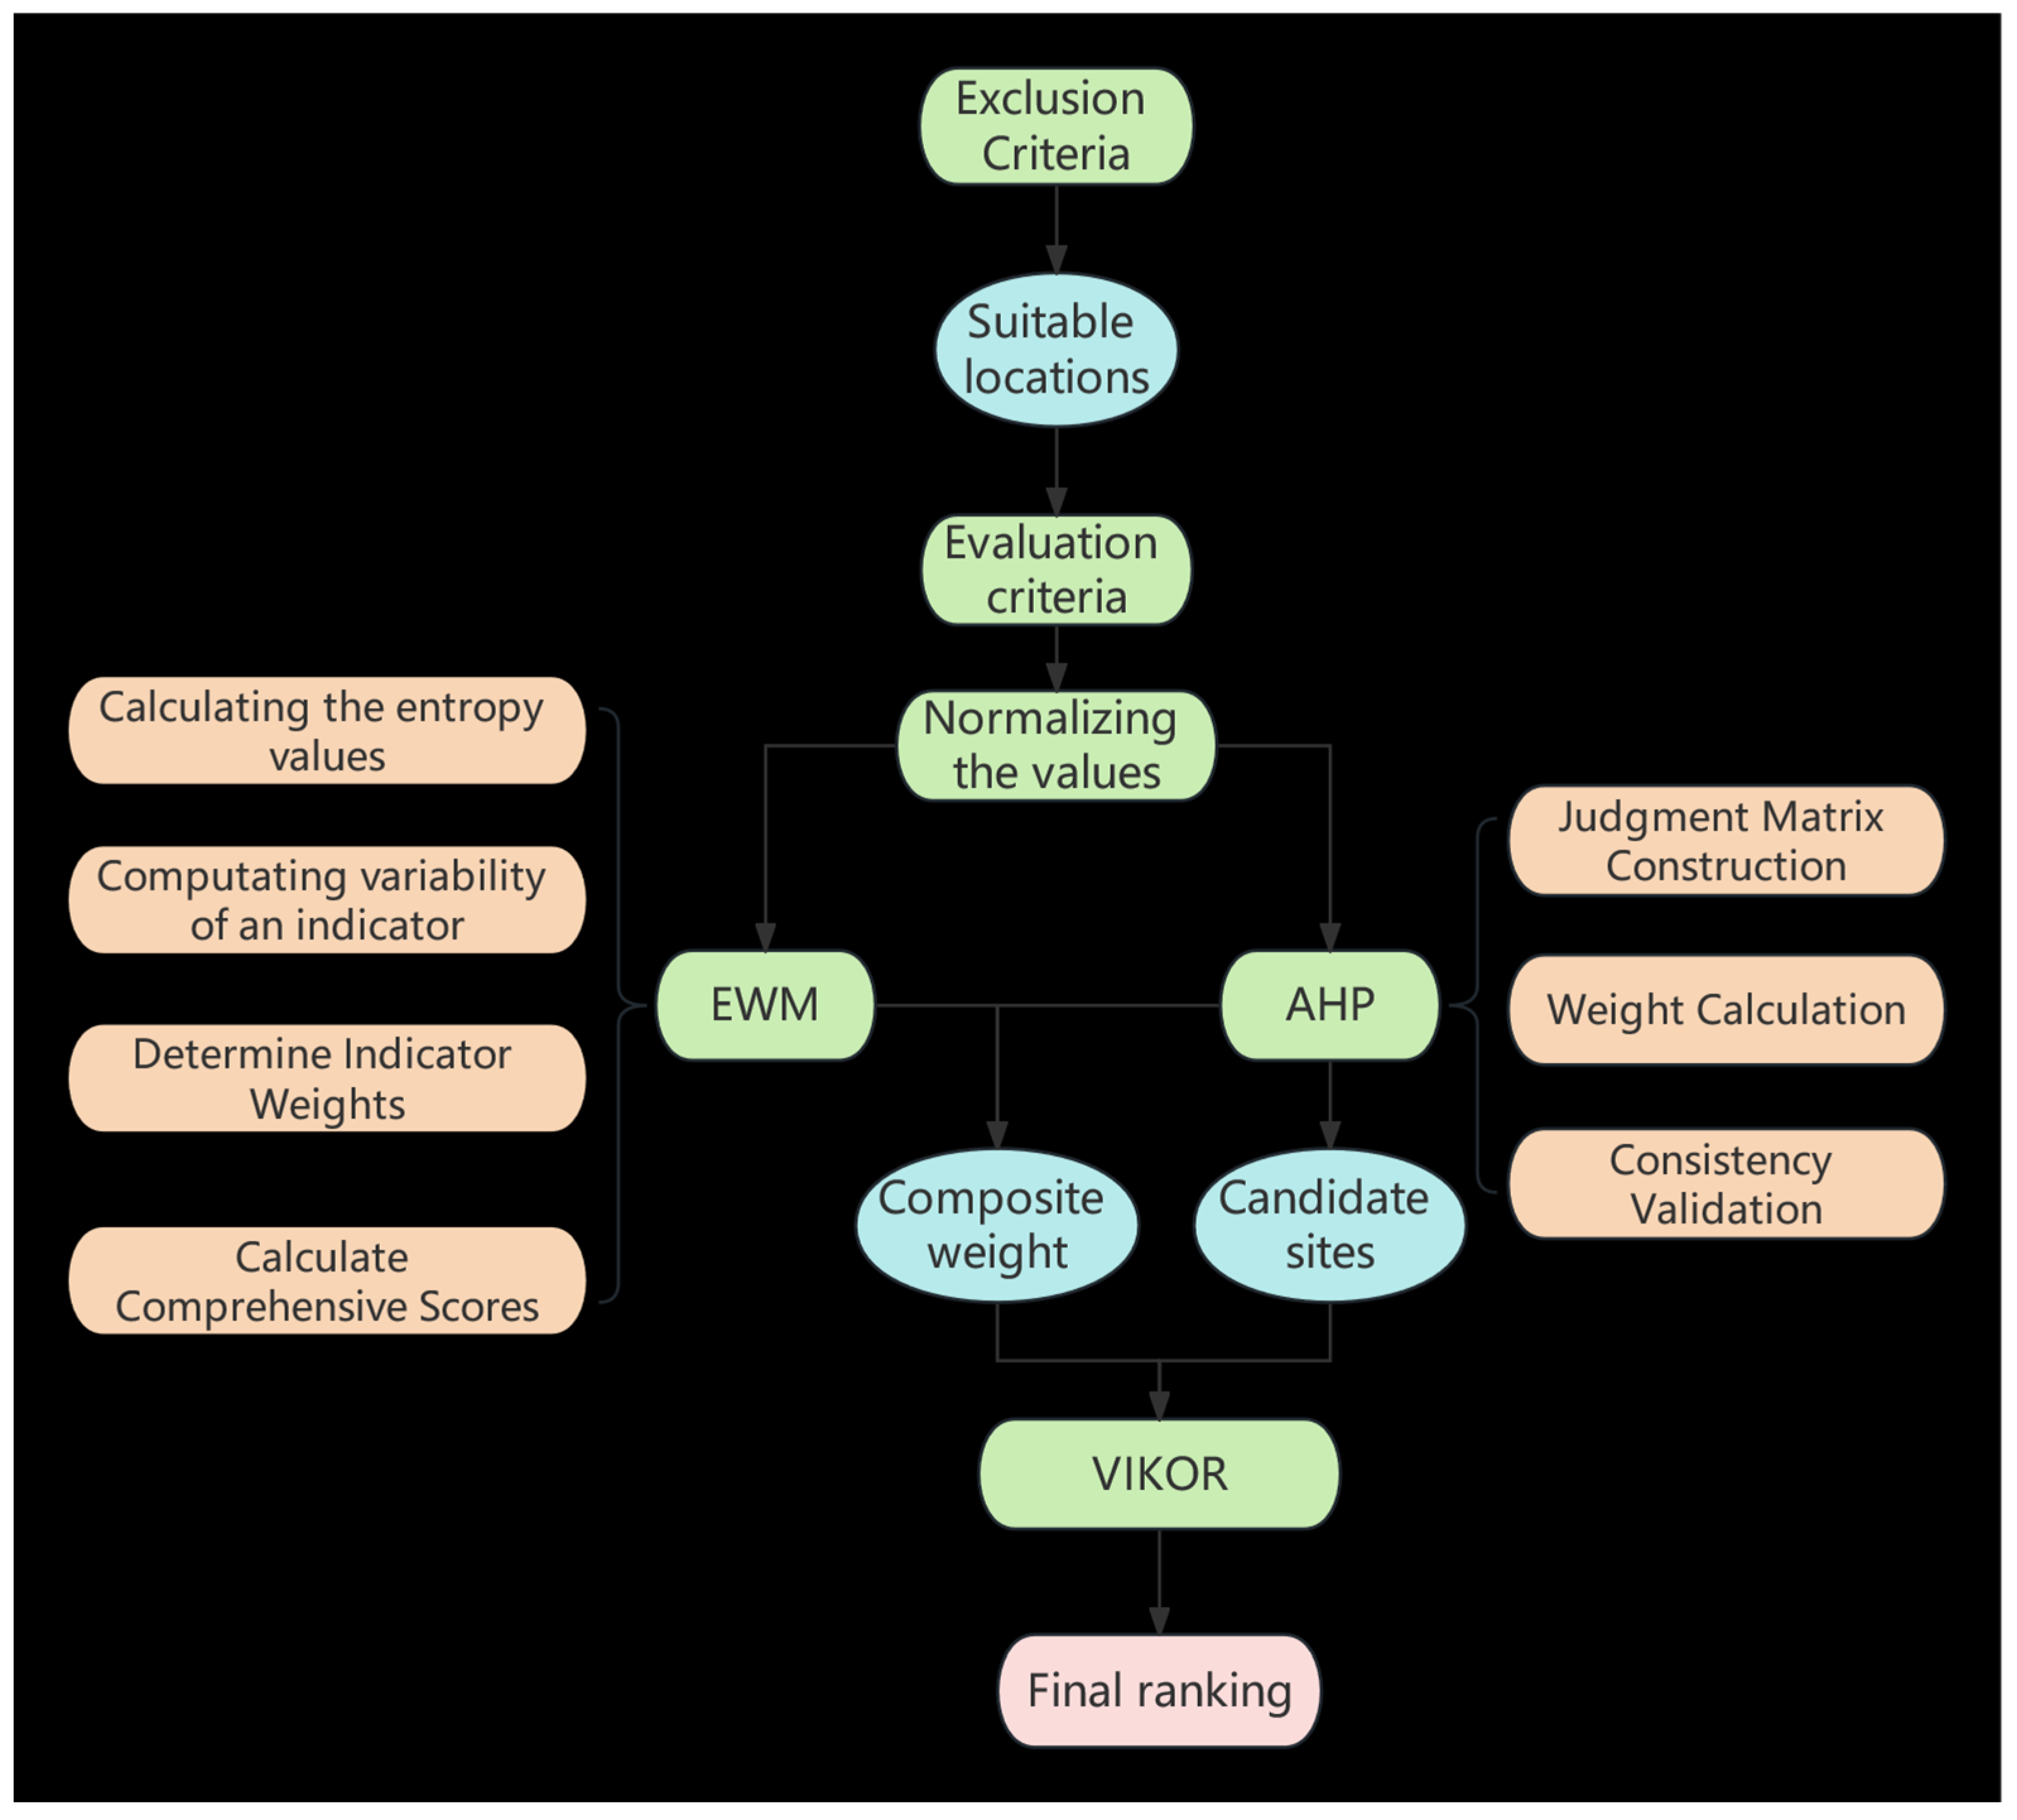
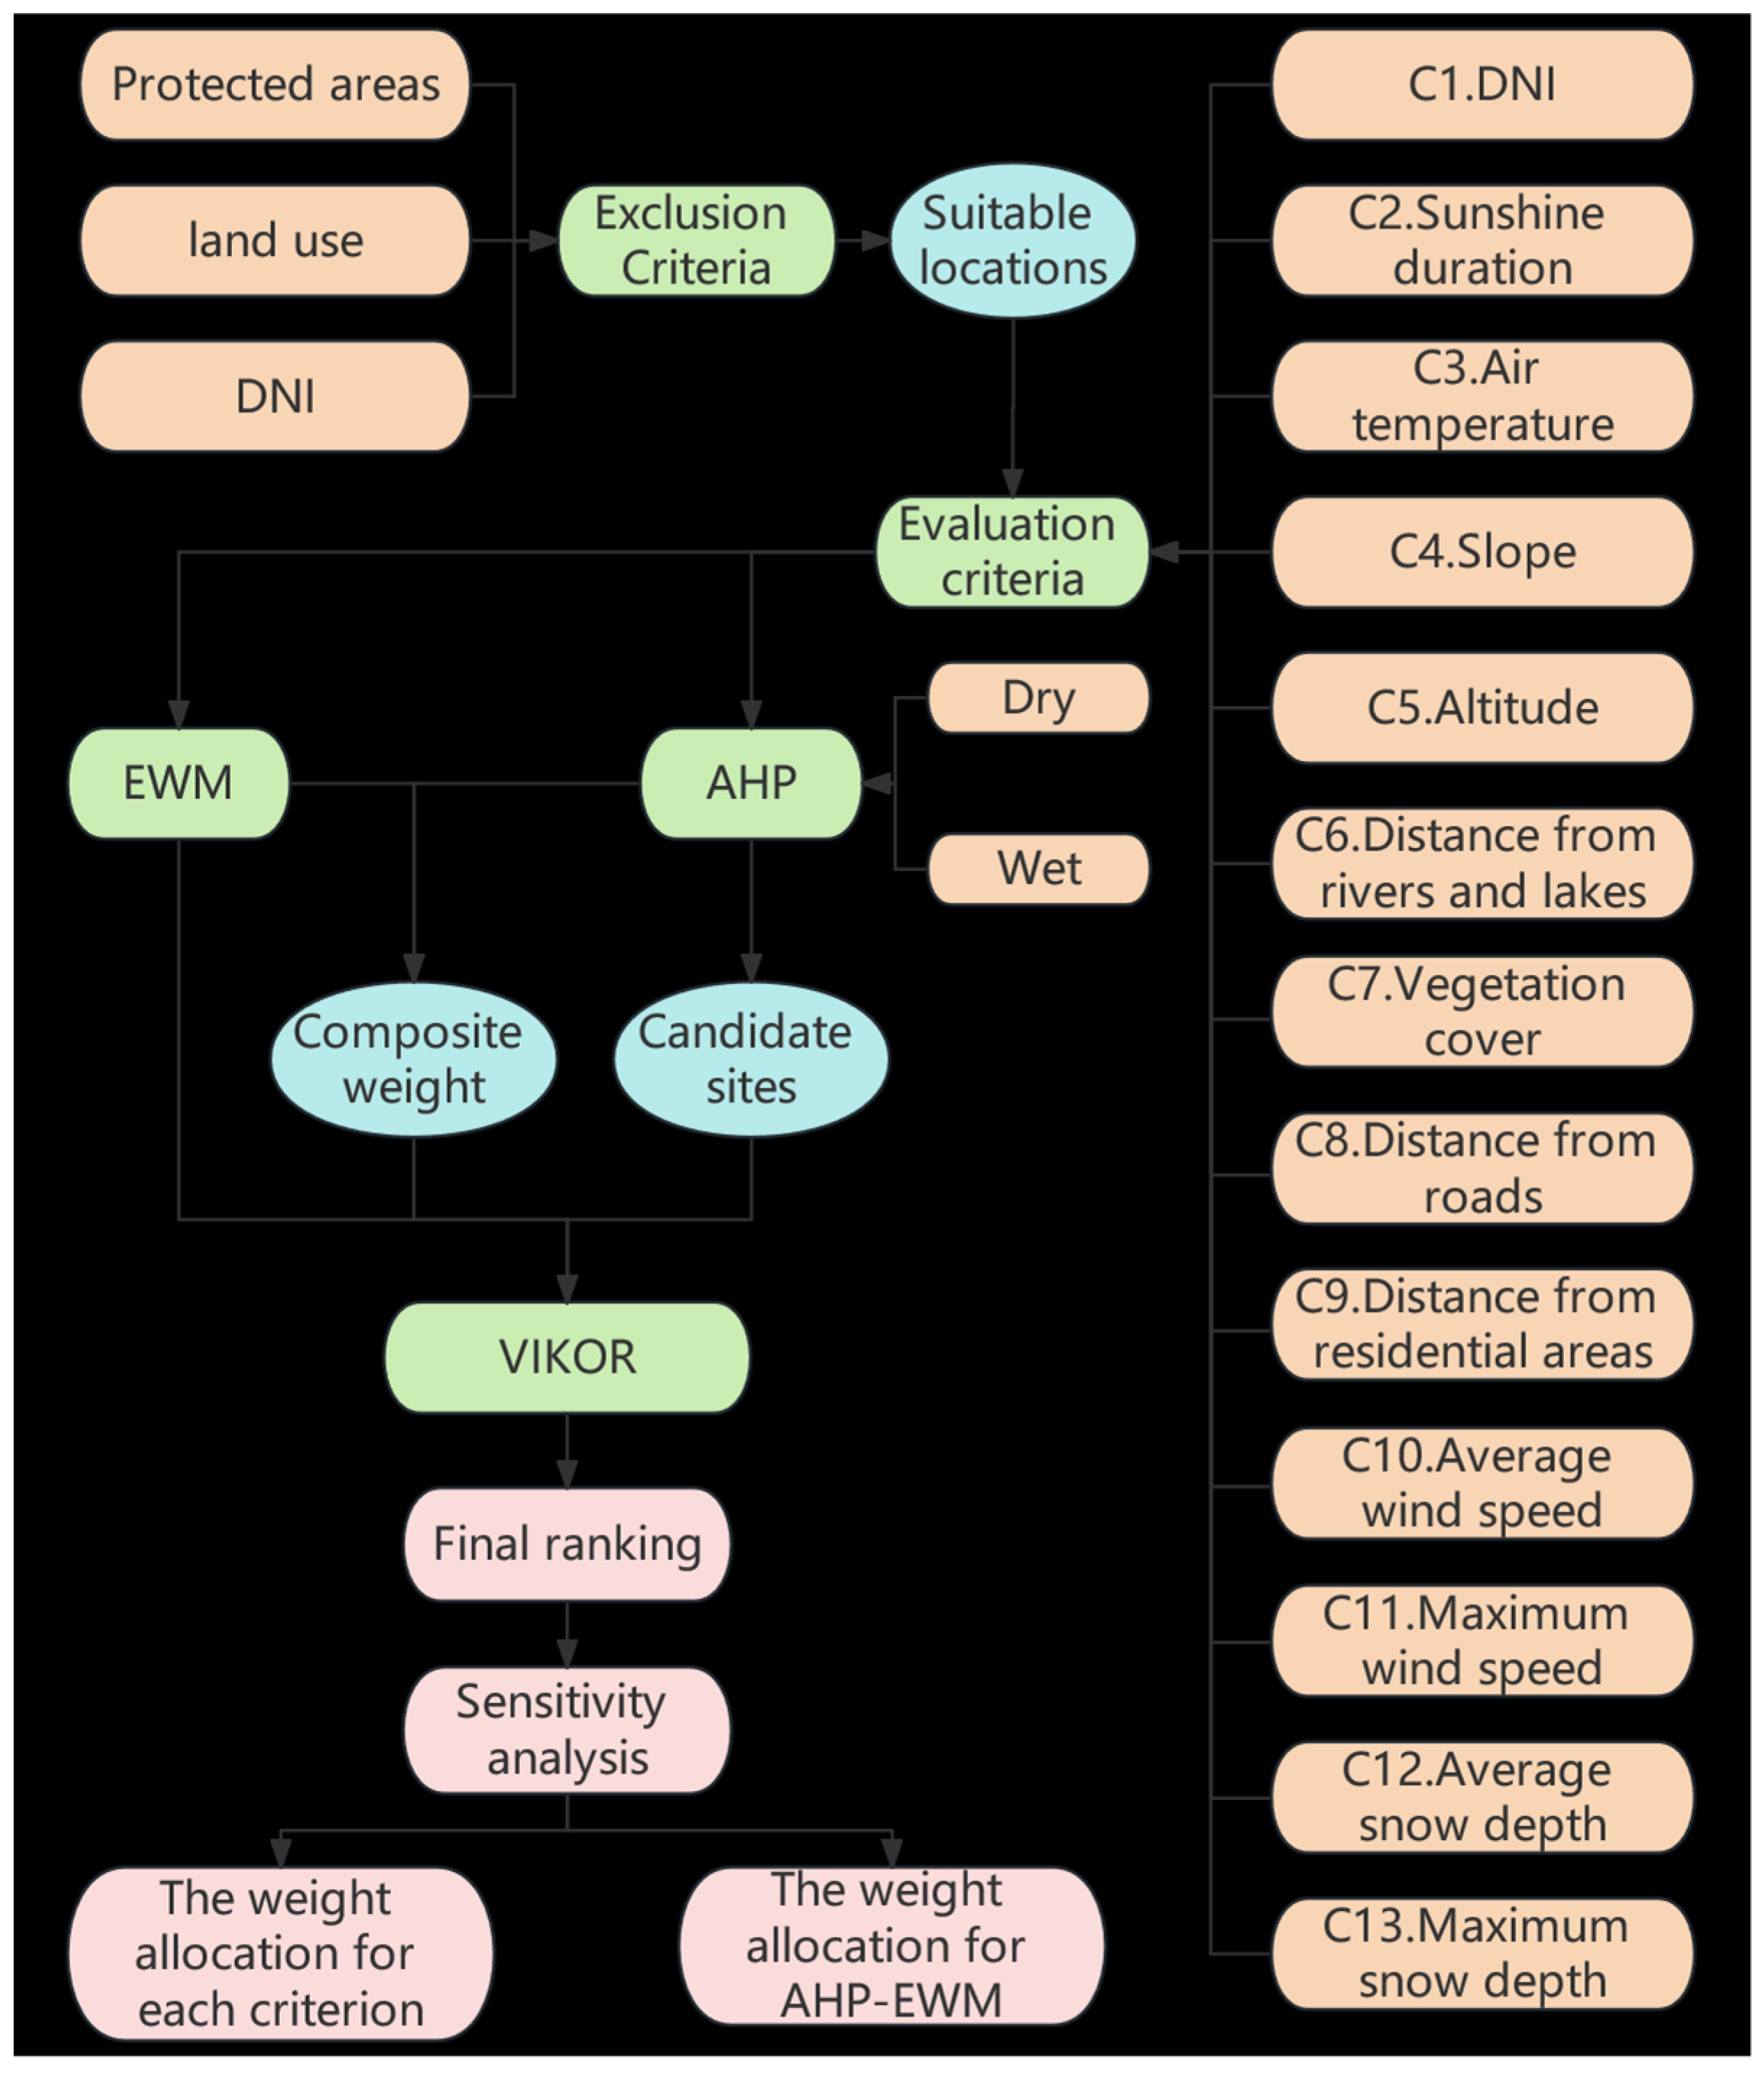
2.1. Site-Selection Framework
2.2. Analytic Hierarchy Process (AHP)
2.3. Entropy Weight Method (EWM)
- (1)
- Data normalization
- (2)
- Normalizing the values (Pij)
- (3)
- Calculating the entropy values (ej)
- (4)
- Calculating the variability of an indicator
- (5)
- Determining the indicator weights
- (6)
- Calculating the comprehensive scores (zij)
2.4. Hybrid AHP-EWM Weighting
3. Case Study
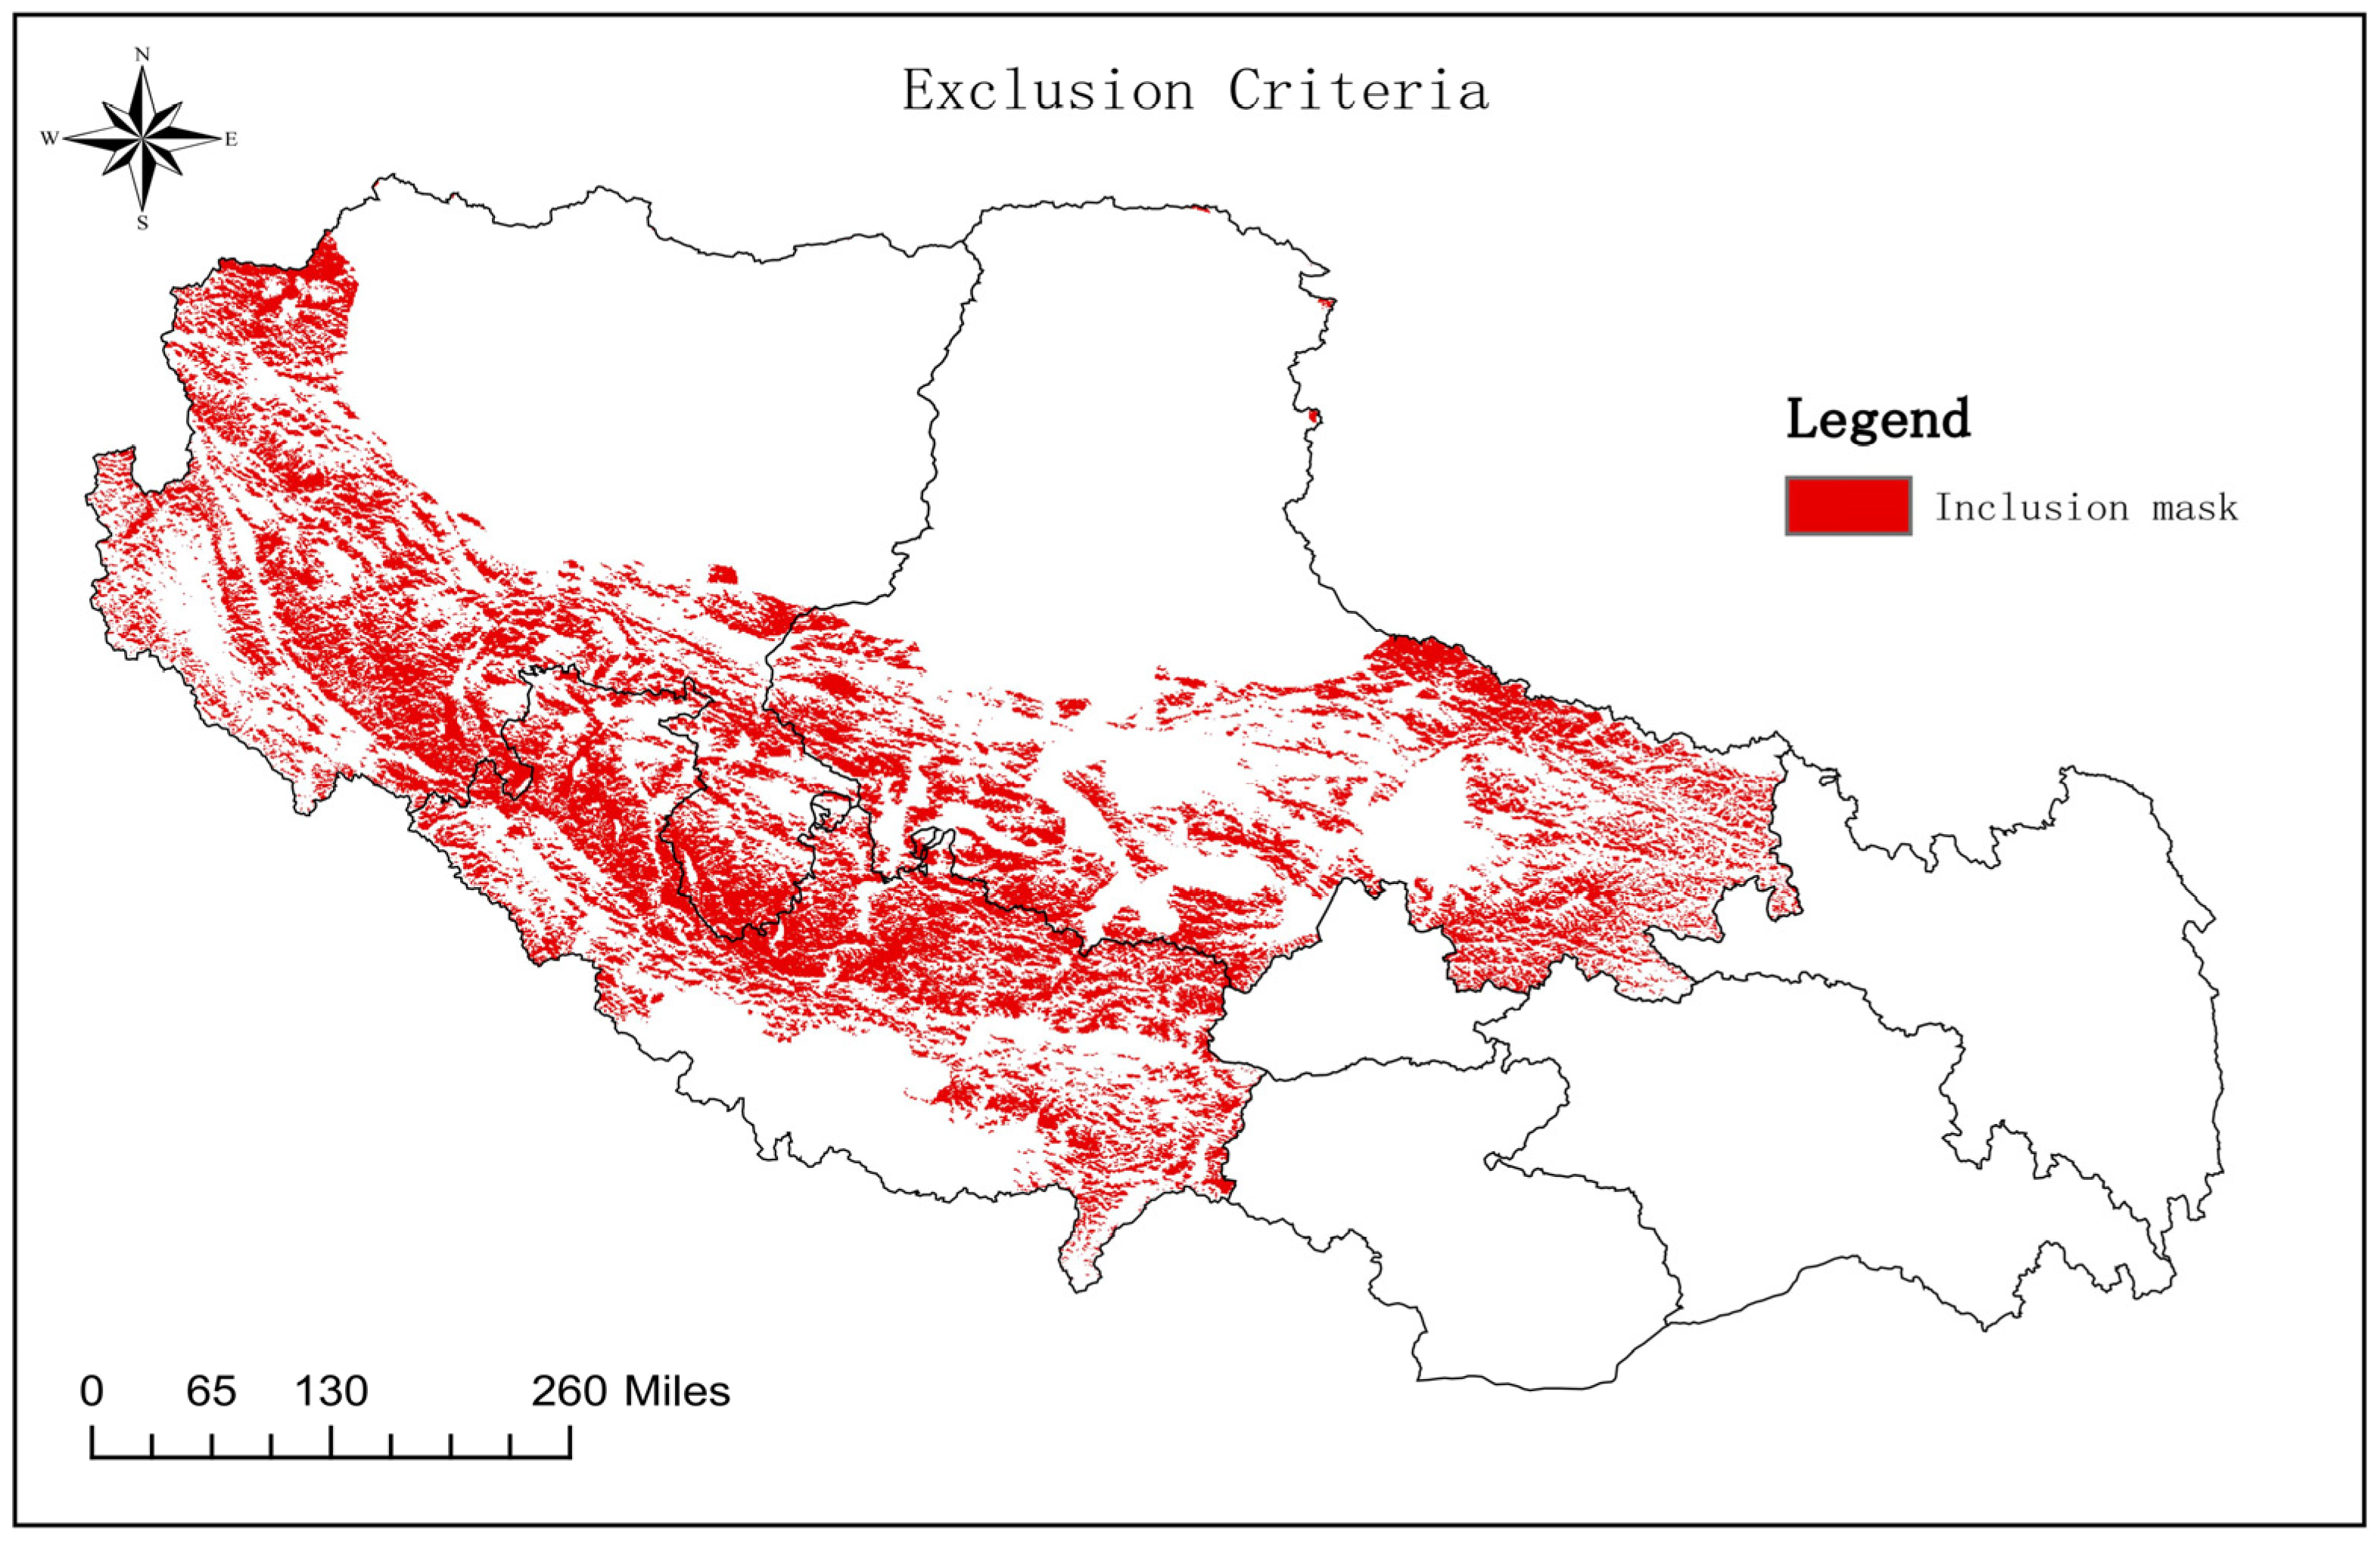
3.1. Study Area
3.2. CSP Site-Selection Framework Based on MCDM and GIS
- (1)
- Criteria Definition
- (2)
- Data Processing
- (3)
- Weight Assignment
- (4)
- Site Screening and Ranking
- (5)
- Validation
3.3. Evaluation Index of Site-Selection Planning
3.3.1. Exclusion Criteria
3.3.2. Evaluation Criteria
- (1)
- Climatic conditions
- (2)
- Geographical conditions
- (3)
- Natural Resources
- (4)
- Infrastructural and social factors
- (5)
- Special local weather conditions
3.4. Weight Calculation and Selection of Candidate Points
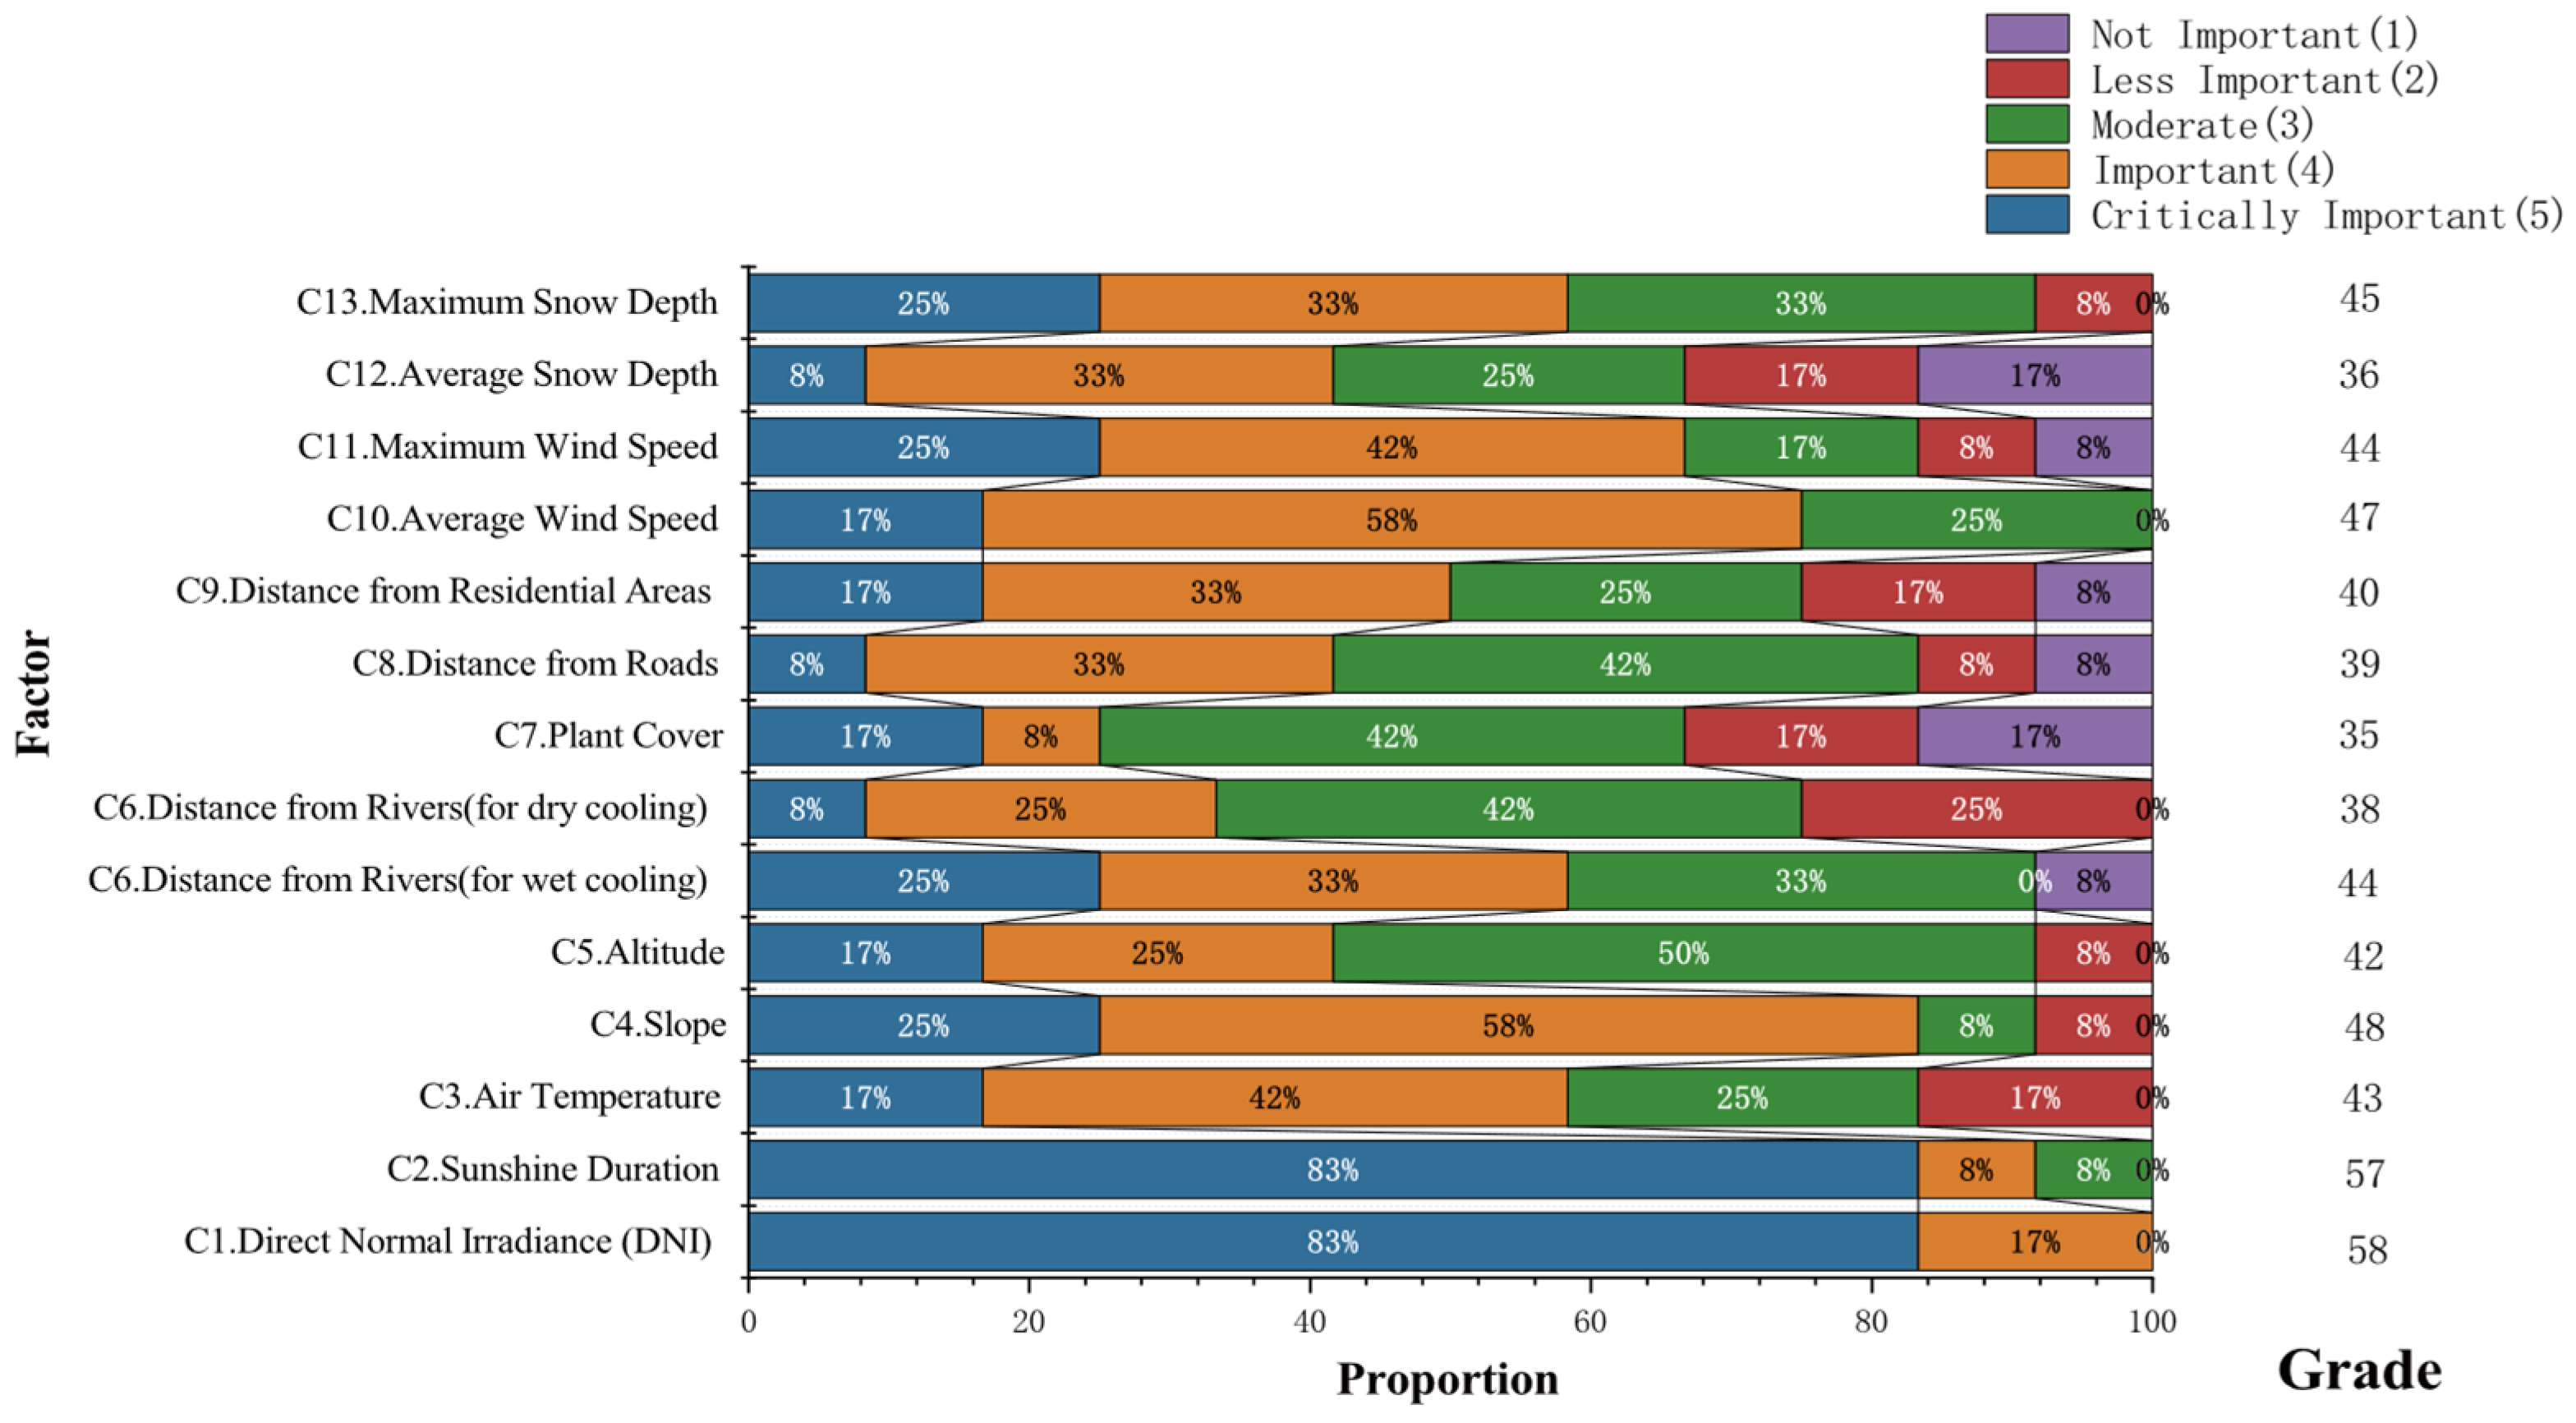
3.4.1. Weights Determined Using AHP
- (1)
- Expert questionnaires distribution and collection:
- (2)
- Weights calculated based on the results of expert questionnaire:
3.4.2. Selection of Candidate Points
- (1)
- Data Normalization
- (2)
- Candidate Site Screening
3.5. Weights Determined Using EWM
- (1)
- Data-Driven Weight Calculation
- (2)
- Contrast with Traditional Criteria
3.6. Hybrid AHP-EWM Weight Integration
3.7. Ranking of Suitable Points
4. Discussion and Analysis
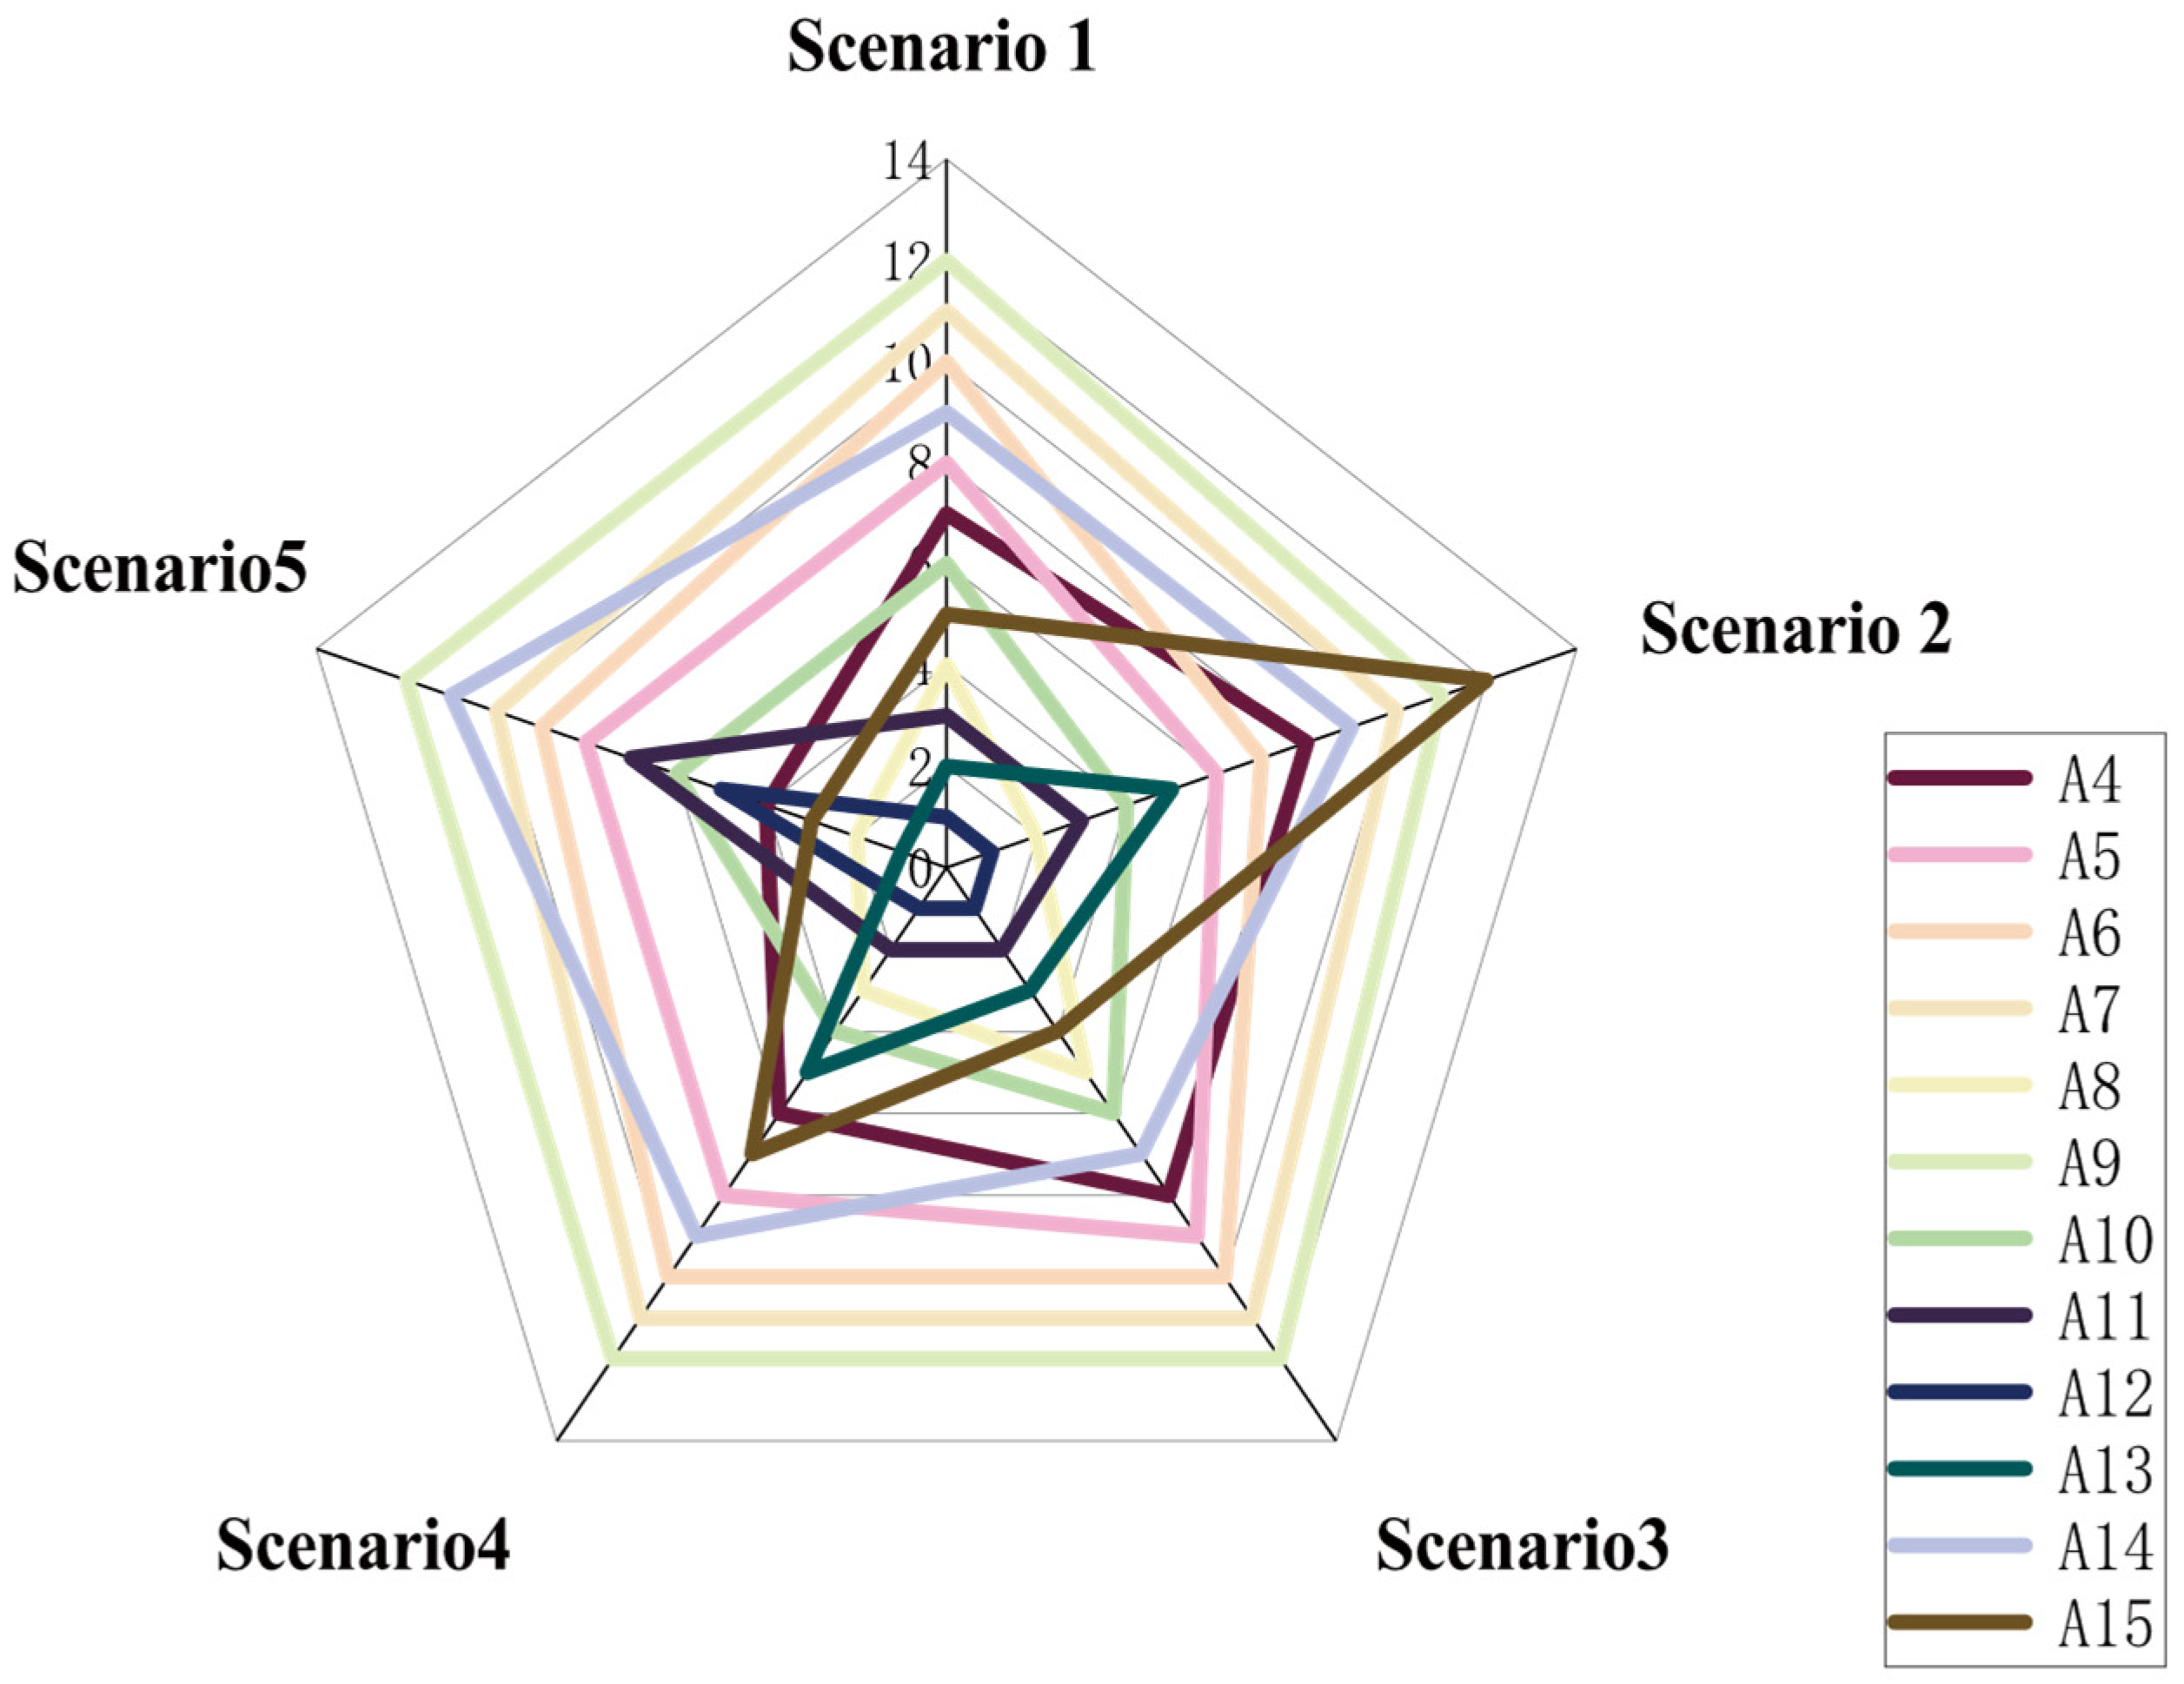
4.1. Sensitivity Analyses of Standard Weights
4.2. Sensitivity Analysis of Weight Allocation in AHP-EWM
- (1)
- Key conflicts and stability analysis:
- (2)
- Stability of A12 and A11:
- (3)
- A5’s Solar Dependency:
5. Conclusions and Future Works
- Innovation in the Evaluation System:
- Validation of Method Integration Effectiveness:
- Impact of Cooling Modes and Optimization Recommendations:
Author Contributions
Funding
Institutional Review Board Statement
Informed Consent Statement
Data Availability Statement
Conflicts of Interest
Abbreviations
| AHP | Analytic hierarchy process |
| AHP-EWM | Analytic hierarchy process–entropy weight method |
| CI | Consistency index |
| CR | Consistency ratio |
| CSP | Concentrated solar power |
| DEM | Digital elevation model |
| DNI | Direct normal irradiance |
| EWM | Entropy weight method |
| GHI | Global horizontal irradiation |
| GIS | Geographic information system |
| MCDM | Multi-criteria decision-making |
| RI | Random consistency index |
| VIKOR | VlseKriterijumska Optimizacija I Kompromisno Resenje |
References
- Yan, X.; Jiamei, P.; Jiahai, Y.; Guohao, Z. Concentrated solar power: Technology, economy analysis, and policy implications in China. Environ. Sci. Pollut. Res. 2022, 29, 1324–1337. [Google Scholar]
- Ren, L.; Zhao, X.; Yu, X.; Zhang, Y. Cost-benefit evolution for concentrated solar power in China. J. Clean. Prod. 2018, 190, 471–482. [Google Scholar]
- Luceño Sánchez, J.A.; Martín, M.; Macchietto, S. Optimal Concentrated Solar Plant (CSP) location accounting for social and environmental impact: A three-location study in Spain. In Proceedings of the 33rd European Symposium on Computer Aided Process Engineering, Athens, Greece, 18–21 June 2023; pp. 3031–3036. [Google Scholar]
- Guerras, L.S.; Martín, M. On the water footprint in power production: Sustainable design of wet cooling towers. Appl. Energy 2020, 263, 114620. [Google Scholar] [CrossRef]
- Hamiche, A.M.; Stambouli, A.B.; Flazi, S. A review of the water-energy nexus. Renew. Sustain. Energy Rev. 2016, 65, 319–331. [Google Scholar] [CrossRef]
- Heras, J.; Martín, M. Social issues in the energy transition: Effect on the design of the new power system. Appl. Energy 2020, 278, 115654. [Google Scholar] [CrossRef]
- Chu, C.-T.; Hawkes, A.D. A geographic information system-based global variable renewable potential assessment using spatially resolved simulation. Energy 2020, 193, 177–187. [Google Scholar] [CrossRef]
- Dupont, E.; Koppelaar, R.; Jeanmart, H. Global available solar energy under physical and energy return on investment constraints. Appl. Energy 2020, 257, 113968. [Google Scholar] [CrossRef]
- Falter, C.; Scharfenberg, N.; Habersetzer, A. Geographical Potential of Solar Thermochemical Jet Fuel Production. Energies 2020, 13, 802. [Google Scholar] [CrossRef]
- Omer, S.B. Location selection factors of concentrated solar power plant investments. Sustain. Energy Grids Netw. 2020, 22, 100319. [Google Scholar]
- Aqachmar, Z.; Allouhi, A.; Jamil, A.; Gagouch, B.; Kousksou, T. Parabolic trough solar thermal power plant Noor I in Morocco. Energy 2019, 178, 572–584. [Google Scholar] [CrossRef]
- Giamalaki, M.; Tsoutsos, T. Sustainable siting of solar power installations in Mediterranean using a GIS/AHP approach. Renew. Energy 2019, 141, 64–75. [Google Scholar] [CrossRef]
- Kasra, M.; Hossein, K. The potential and deployment viability of concentrated solar power (CSP) in Iran. Energy Strategy Rev. 2019, 24, 358–369. [Google Scholar]
- Yunna, W.; Shuai, G.; Haobo, Z.; Min, G. Decision framework of solar thermal power plant site selection based on linguistic Choquet operator. Appl. Energy 2014, 136, 303–311. [Google Scholar]
- Thomas, W.; Stefan, H. Creating a spatial multi-criteria decision support system for energy related integrated environmental impact assessment. Environ. Impact Assess. Rev. 2015, 52, 2–8. [Google Scholar]
- Keabile, T.; Mulalu, M. Assessment of the concentrated solar power potential in Botswana. Renew. Sustain. Energy Rev. 2019, 109, 294–306. [Google Scholar]
- Aly, A.; Jensen, S.S.; Pedersen, A.B. Solar power potential of Tanzania: Identifying CSP and PV hot spots through a GIS multicriteria decision making analysis. Renew. Energy 2017, 113, 159–175. [Google Scholar] [CrossRef]
- Alisa, Y.; Andrea, D.B.; Bruno, C.; Martin, K.P.; Nicolas, R. GIS-based assessment of photovoltaic (PV) and concentrated solar power (CSP) generation potential in West Africa. Renew. Sustain. Energy Rev. 2018, 81, 2088–2103. [Google Scholar]
- Deshmukh, R.; Wu, G.C.; Callaway, D.S.; Phadke, A. Geospatial and techno-economic analysis of wind and solar resources in India. Renew. Energy 2019, 134, 947–960. [Google Scholar] [CrossRef]
- Ghasemi, G.; Noorollahi, Y.; Alavi, H.; Marzband, M.; Shahbazi, M. Theoretical and technical potential evaluation of solar power generation in Iran. Renew. Energy 2019, 138, 1250–1261. [Google Scholar] [CrossRef]
- Omitaomu, O.A.; Nagendra, S.; Bhaduri, B.L. Mapping suitability areas for concentrated solar power plants using remote sensing data. J. Appl. Remote Sens. 2015, 9, 097697. [Google Scholar] [CrossRef]
- Enjavi-Arsanjani, M.; Hirbodi, K.; Yaghoubi, M. Solar Energy Potential and Performance Assessment of CSP Plants in Different Areas of Iran. Energy Procedia 2015, 69, 2039–2048. [Google Scholar] [CrossRef]
- Köberle, A.; Gernaat, D.E.H.J.; Vuuren, D.P.V. Assessing current and future techno-economic potential of concentrated solar power and photovoltaic electricity generation. Energy 2015, 89, 739–756. [Google Scholar] [CrossRef]
- Abdulrahman, B.; Al-Khayat, M.; Al-Qattan, A.; Rajab, A.; Al-Failkawi, F.; Al-Matar, A.A. Thermal efficiency and performance analysis of 50 MW concentrated solar power plant. Sustain. Energy Technol. Assess. 2024, 65, 103783. [Google Scholar] [CrossRef]
- Jbaihi, O.; Ouchani, F.Z.; Merrouni, A.A.; Cherkaoui, M.; Ghennioui, A.; Maâroufi, M. An AHP-GIS based site suitability analysis for integrating large-scale hybrid CSP+PV plants in Morocco: An approach to address the intermittency of solar energy. J. Clean. Prod. 2022, 369, 133250. [Google Scholar] [CrossRef]
- Mingze, Z.; Xincong, L. Location Evaluation of Multi-station Integration Based on AHP-Entropy Weight Method. In Proceedings of the 2020 IEEE Sustainable Power and Energy Conference (iSPEC), Chengdu, China, 23–25 November 2020. [Google Scholar]
- Yuyang, Z.; Long, C. Evaluation Model of Location Light Pollution Level Based on Analytic Hierarchy Process and Entropy Weight Method. In E3S Web of Conferences, Proceedings of the 5th International Conference on Environmental Prevention and Pollution Control Technol-ogies (EPPCT 2023), Chengdu, China, 21–23 April 2023; EDP Sciences: Ulysse, France, 2023. [Google Scholar]
- Feng, Z.; Li, G.; Wang, W.; Zhang, L.; Xiang, W.; He, X.; Zhang, M.; Wei, N. Emergency logistics centers site selection by multi-criteria decision-making and GIS. Int. J. Disaster Risk Reduct. 2023, 96, 103921. [Google Scholar] [CrossRef]
- Nguyen, X.T.; Ašonja, A.; Do, D.T. Enhancing Handheld Polishing Machine Selection: An Integrated Approach of Marcos Methods and Weight Determination Techniques. Appl. Eng. Lett. J. Eng. Appl. Sci. 2023, 8, 131–138. [Google Scholar] [CrossRef]
- Merrouni, A.A.; Elalaoui, F.E.; Ghennioui, A.; Mezrhab, A.; Mezrhab, A. A GIS-AHP combination for the sites assessment of large-scale CSP plants with dry and wet cooling systems. Case study: Eastern Morocco. Sol. Energy 2018, 166, 2–12. [Google Scholar] [CrossRef]
- Podvezko, V. Application of AHP technique. J. Bus. Econ. Manag. 2009, 10, 181–189. [Google Scholar] [CrossRef]
- Kong, H.; Wang, J.; Cao, J.; Zhou, M.; Fan, Y. Surface Solar Radiation Resource Evaluation of Xizang Region Based on Station Observation and High-Resolution Satellite Dataset. Remote Sens. 2024, 16, 1405. [Google Scholar] [CrossRef]
- Fatima-Zahra, O.; Ouafae, J.; Ahmed, A.M.; Mohammed, M.; Abdellatif, G. Yield analysis and economic assessment for GIS-mapping of large scale solar PV potential and integration in Morocco. Sustain. Energy Technol. Assess. 2021, 47, 101540. [Google Scholar]
- Yafeng, Y.; Hongrui, W.; Yong, Z.; Li, Z. Three-way decision approach for water ecological security evaluation and regulation coupled with VIKOR: A case study in Beijing-Tianjin-Hebei region. J. Clean. Prod. 2022, 379, 134666. [Google Scholar]
- Yusuf, T.İ.; Sevcan, K.; Büşra, B. An integrated AHP-modified VIKOR model for financial performance modeling in retail and wholesale trade companies. Decis. Anal. 2022, 3, 100077. [Google Scholar]
- Sofia, S.; Dimitra, G.V. A systematic review of site-selection procedures of PV and CSP technologies. Energy Rep. 2023, 9, 2947–2979. [Google Scholar]


| Scale | Definition |
|---|---|
| 1 | Equal importance |
| 3 | Moderate importance of one over another |
| 5 | Essential or strong importance of one over another |
| 7 | Very strong importance of one over another |
| 9 | Extreme importance of one over another |
| 2, 4, 6, 8 | Intermediate values between the two adjacent judgments; used when the preference is between the two integer values |
| 1/x | Reciprocal of the given value; used when comparing the opposite direction |
| n | 1 | 2 | 3 | 4 | 5 | 6 | 7 | 8 | 9 | 10 | 11 | 12 | 13 | 14 | 15 |
| RI | 0 | 0 | 0.52 | 0.89 | 1.12 | 1.26 | 1.36 | 1.41 | 1.46 | 1.49 | 1.52 | 1.54 | 1.56 | 1.58 | 1.59 |
| Factors | Serial Number | Normalized Value | Range | Unit | Data Sources | |
|---|---|---|---|---|---|---|
| Climate | DNI | C1 | 0.5–0.7 | 1390–1746 | kWh/m2/year | Geospatial Data Cloud (https://www.gscloud.cn/) |
| 0.7–0.9 | 1746–2102 | |||||
| 0.9–1.0 | 2102–2280 | |||||
| Sunshine duration | C2 | 0.6–0.8 | 3157–3760 | h | Geospatial Data Cloud (https://www.gscloud.cn/) | |
| 0.8–0.9 | 3760–4061 | |||||
| 0.9–1.0 | 4061–4362 | |||||
| Air temperature | C3 | 0.4–0.5 | −10.1–4.3 | °C | National Earth System Science Data Center (https://www.geodata.cn/) | |
| 0.5–0.6 | −4.3–1.5 | |||||
| Geographical conditions | Slope | C4 | 0.7–0.8 | 19.47–12.98 | ° | Geospatial Data Cloud (https://www.gscloud.cn/) |
| 0.8–0.9 | 12.98–6.49 | |||||
| 0.9–1.0 | 6.49–0 | |||||
| Altitude | C5 | 0.55–0.6 | 4680–5103 | m | Geospatial Data Cloud (https://www.gscloud.cn/) | |
| 0.6–0.65 | 5103–5525 | |||||
| 0.65–0.7 | 5525–5948 | |||||
| Resource | Distance from rivers and lakes | C6 | 0.8–0.9 | 67.97–33.986 | km | Geospatial Remote Sensing Ecology Network (http://www.gisrs.cn/) |
| 0.9–0.95 | 33.98–16.99 | |||||
| 0.95–1.0 | 16.993–0 | |||||
| Vegetation cover | C7 | 0–0.92 | Geospatial Remote Sensing Ecology Network (http://www.gisrs.cn/) | |||
| Infrastructure and social factors | Distance from roads | C8 | 0.8–0.9 | 56,562–28281 | m | Geospatial Remote Sensing Ecology Network (http://www.gisrs.cn/) |
| 0.9–0.95 | 28,281–14140 | |||||
| 0.95–1.0 | 14,140–0 | |||||
| Distance from residential areas | C9 | 0–0.2 | 0–81,262 | km | Geospatial Remote Sensing Ecology Network (http://www.gisrs.cn/) | |
| 0.2–0.4 | 1625.25–81.26 | |||||
| 0.4–0.6 | 243.78–162.52 | |||||
| Special local environment | Average wind speed | C10 | 0–0.25 | 2.30–2.70 | m/s | Meteonorm 8 |
| 0.25–0.5 | 2.70–3.10 | |||||
| 0.5–0.75 | 3.10–3.50 | |||||
| 0.75–1.0 | 3.50–3.90 | |||||
| Maximum wind speed | C11 | 0–0.25 | 3.20–3.70 | m/s | Meteonorm 8 | |
| 0.25–0.5 | 3.70–4.20 | |||||
| 0.5–0.75 | 4.20–4.70 | |||||
| 0.75–1.0 | 4.70–5.20 | |||||
| Average snow depth | C12 | 0–0.25 | 0.10–0.55 | m | Meteonorm 8 | |
| 0.25–0.5 | 0.55–1.00 | |||||
| 0.5–0.75 | 0.99–1.45 | |||||
| 0.75–1.0 | 1.45–1.90 | |||||
| Maximum snow depth | C13 | 0–0.25 | 0.60–3.05 | m | Meteonorm 8 | |
| 0.25–0.5 | 3.05–5.50 | |||||
| 0.5–0.75 | 5.50–7.95 | |||||
| 0.75–1.0 | 7.95–10.40 | |||||
| Dry | Wet | ||||||||||||||||||||||||||||
|---|---|---|---|---|---|---|---|---|---|---|---|---|---|---|---|---|---|---|---|---|---|---|---|---|---|---|---|---|---|
| C1 | C2 | C3 | C4 | C5 | C6 | C7 | C8 | C9 | C10 | C11 | C12 | C13 | Weight | C1 | C2 | C3 | C4 | C5 | C6 | C7 | C8 | C9 | C10 | C11 | C12 | C13 | Weight | ||
| C1 | 1 | 1 | 6 | 4 | 7 | 8 | 9 | 8 | 7 | 5 | 6 | 9 | 6 | 0.25 | C1 | 1 | 1 | 6 | 4 | 7 | 6 | 9 | 8 | 7 | 5 | 6 | 9 | 6 | 0.25 |
| C2 | 1 | 1 | 6 | 4 | 6 | 8 | 9 | 7 | 7 | 4 | 6 | 8 | 5 | 0.24 | C2 | 1 | 1 | 6 | 4 | 6 | 6 | 9 | 7 | 7 | 4 | 6 | 8 | 5 | 0.24 |
| C3 | 1/6 | 1/6 | 1 | 1/2 | 1 | 3 | 4 | 2 | 2 | 1/2 | 1 | 3 | 1/2 | 0.05 | C3 | 1/6 | 1/6 | 1 | 1/2 | 1 | 1 | 4 | 2 | 2 | 1/2 | 1 | 3 | 1/2 | 0.05 |
| C4 | 1/4 | 1/4 | 2 | 1 | 3 | 4 | 6 | 5 | 4 | 1 | 2 | 5 | 2 | 0.10 | C4 | 1/4 | 1/4 | 2 | 1 | 3 | 2 | 6 | 5 | 4 | 1 | 2 | 5 | 2 | 0.09 |
| C5 | 1/7 | 1/6 | 1 | 1/3 | 1 | 2 | 3 | 2 | 2 | 1/3 | 1/2 | 3 | 1/2 | 0.04 | C5 | 1/7 | 1/6 | 1 | 1/3 | 1 | 1/2 | 3 | 2 | 2 | 1/3 | 1/2 | 3 | 1/2 | 0.04 |
| C6 | 1/8 | 1/8 | 1/3 | 1/4 | 1/2 | 1 | 2 | 1 | 1/2 | 1/4 | 1/3 | 2 | 1/3 | 0.02 | C6 | 1/6 | 1/6 | 1 | 1/2 | 2 | 1 | 4 | 3 | 2 | 1/2 | 1 | 4 | 1 | 0.05 |
| C7 | 1/9 | 1/9 | 1/4 | 1/6 | 1/3 | 1/2 | 1 | 1/2 | 1/2 | 1/5 | 1/5 | 1 | 1/4 | 0.02 | C7 | 1/9 | 1/9 | 1/4 | 1/6 | 1/3 | 1/4 | 1 | 1/2 | 1/2 | 1/5 | 1/5 | 1 | 1/4 | 0.02 |
| C8 | 1/8 | 1/7 | 1/2 | 1/5 | 1/2 | 1 | 2 | 1 | 1 | 1/4 | 1/3 | 2 | 1/3 | 0.03 | C8 | 1/8 | 1/7 | 1/2 | 1/5 | 1/2 | 1/3 | 2 | 1 | 1 | 1/4 | 1/3 | 2 | 1/3 | 0.02 |
| C9 | 1/7 | 1/7 | 1/2 | 1/4 | 1/2 | 2 | 2 | 1 | 1 | 1/3 | 1/2 | 2 | 1/2 | 0.03 | C9 | 1/7 | 1/7 | 1/2 | 1/4 | 1/2 | 1/2 | 2 | 1 | 1 | 1/3 | 1/2 | 2 | 1/2 | 0.03 |
| C10 | 1/5 | 1/4 | 2 | 1 | 3 | 4 | 5 | 4 | 3 | 1 | 2 | 5 | 2 | 0.09 | C10 | 1/5 | 1/4 | 2 | 1 | 3 | 2 | 5 | 4 | 3 | 1 | 2 | 5 | 2 | 0.09 |
| C11 | 1/6 | 1/6 | 1 | 1/2 | 2 | 3 | 5 | 3 | 2 | 1/2 | 1 | 4 | 1 | 0.06 | C11 | 1/6 | 1/6 | 1 | 1/2 | 2 | 1 | 5 | 3 | 2 | 1/2 | 1 | 4 | 1 | 0.05 |
| C12 | 1/9 | 1/8 | 1/3 | 1/5 | 1/3 | 1/2 | 1 | 1/2 | 1/2 | 1/5 | 1/4 | 1 | 1/4 | 0.02 | C12 | 1/9 | 1/8 | 1/3 | 1/5 | 1/3 | 1/4 | 1 | 1/2 | 1/2 | 1/5 | 1/4 | 1 | 1/4 | 0.02 |
| C13 | 1/6 | 1/5 | 2 | 1/2 | 2 | 3 | 4 | 3 | 2 | 1/2 | 1 | 4 | 1 | 0.06 | C13 | 1/6 | 1/5 | 2 | 1/2 | 2 | 1 | 4 | 3 | 2 | 1/2 | 1 | 4 | 1 | 0.06 |
| CI: 0.05 | CR: 0.02 | CI: 0.03 | CR: 0.01 | ||||||||||||||||||||||||||
| Factor | A4 | A5 | A6 | A7 | A8 | A9 | A10 | A11 | A12 | A13 | A14 | A15 |
|---|---|---|---|---|---|---|---|---|---|---|---|---|
| C1. DNI | 0.67 | 0.77 | 0.71 | 0.69 | 0.67 | 0.51 | 0.71 | 0.69 | 0.73 | 0.66 | 0.69 | 0.8 |
| C2. Sunshine Duration | 0.89 | 0.96 | 0.81 | 0.78 | 0.9 | 0.6 | 0.88 | 0.98 | 0.88 | 0.95 | 0.98 | 0.96 |
| C3. Air Temperature | 0.49 | 0.46 | 0.44 | 0.43 | 0.52 | 0.43 | 0.5 | 0.53 | 0.59 | 0.58 | 0.54 | 0.46 |
| C4. Slope | 0.9 | 0.87 | 0.84 | 0.84 | 0.9 | 0.7 | 0.94 | 0.98 | 0.83 | 0.97 | 0.99 | 0.97 |
| C5. Altitude | 0.6 | 0.66 | 0.65 | 0.63 | 0.58 | 0.64 | 0.62 | 0.59 | 0.57 | 0.55 | 0.59 | 0.6 |
| C6. Distance from Rivers and Lakes | 0.95 | 0.93 | 0.93 | 0.93 | 0.95 | 0.95 | 0.95 | 1 | 1 | 0.95 | 0.95 | 0.95 |
| C7. Vegetation Cover | 0.8 | 0.78 | 0.92 | 0.89 | 0.79 | 0.88 | 0.72 | 0.76 | 0.78 | 0.88 | 0.54 | 0.74 |
| C8. Distance from Roads | 1 | 0.93 | 0.95 | 0.92 | 0.91 | 0.9 | 1 | 0.98 | 1 | 0.96 | 0.99 | 0.84 |
| C9. Distance from Residential Areas | 0.35 | 0.54 | 0.42 | 0.42 | 0.32 | 0.23 | 0.21 | 0.31 | 0.35 | 0.14 | 0.24 | 0.16 |
| C10. Average Wind Speed | 0.50 | 0.81 | 0.81 | 0.81 | 0.19 | 0.00 | 0.69 | 0.88 | 0.81 | 0.50 | 1.00 | 0.25 |
| C11. Maximum Wind Speed | 0.15 | 0.85 | 0.80 | 0.75 | 0.00 | 0.00 | 0.70 | 0.90 | 0.85 | 0.20 | 1.00 | 0.10 |
| C12. Average Snow Depth | 0.72 | 0.17 | 0.17 | 0.06 | 0.50 | 0.00 | 0.06 | 0.06 | 0.00 | 0.00 | 0.17 | 1.00 |
| C13. Maximum Snow Depth | 1.00 | 0.04 | 0.16 | 0.05 | 0.57 | 0.03 | 0.04 | 0.03 | 0.03 | 0.00 | 0.20 | 0.72 |
| A1 | A2 | A3 | A4 | A5 | A6 | A7 | A8 | A9 | A10 | A11 | A12 | A13 | A14 | A15 | |
|---|---|---|---|---|---|---|---|---|---|---|---|---|---|---|---|
| Average Wind Speed/m/s | 2.6 | 2.6 | 3.7 | 3.1 | 3.6 | 3.6 | 3.6 | 2.6 | 2.3 | 3.4 | 3.7 | 3.6 | 3.1 | 3.9 | 2.7 |
| Maximum Wind Speed/m/s | 3.2 | 3.2 | 5.1 | 3.5 | 4.9 | 4.8 | 4.7 | 3.2 | 3.2 | 4.6 | 5 | 4.9 | 3.6 | 5.2 | 3.4 |
| Average Snow Depth/mm | 2255.9 | 41.4 | 24.3 | 1.4 | 0.4 | 0.4 | 0.2 | 1 | 0.1 | 0.2 | 0.2 | 0.1 | 0.1 | 0.4 | 1.9 |
| Maximum Snow Depth/mm | 5870.3 | 231.5 | 135.2 | 9.4 | 1 | 2.2 | 1.1 | 6.2 | 0.9 | 1 | 0.9 | 0.9 | 0.6 | 2.6 | 7.7 |
| ej | gj | wj | |
|---|---|---|---|
| C1 | 0.96 | 0.04 | 0.04 |
| C2 | 0.96 | 0.04 | 0.04 |
| C3 | 0.85 | 0.15 | 0.13 |
| C4 | 0.95 | 0.05 | 0.04 |
| C5 | 0.92 | 0.08 | 0.07 |
| C6 | 0.81 | 0.19 | 0.17 |
| C7 | 0.95 | 0.05 | 0.04 |
| C8 | 0.94 | 0.06 | 0.05 |
| C9 | 0.89 | 0.11 | 0.09 |
| C10 | 0.88 | 0.12 | 0.11 |
| C11 | 0.86 | 0.14 | 0.12 |
| C12 | 0.95 | 0.05 | 0.05 |
| C13 | 0.95 | 0.05 | 0.05 |
| Dry | Wet | |
|---|---|---|
| C1 | 0.15 | 0.15 |
| C2 | 0.14 | 0.14 |
| C3 | 0.09 | 0.09 |
| C4 | 0.07 | 0.07 |
| C5 | 0.06 | 0.05 |
| C6 | 0.10 | 0.11 |
| C7 | 0.03 | 0.03 |
| C8 | 0.04 | 0.04 |
| C9 | 0.06 | 0.06 |
| C10 | 0.10 | 0.10 |
| C11 | 0.09 | 0.09 |
| C12 | 0.03 | 0.03 |
| C13 | 0.05 | 0.05 |
| Site | A4 | A5 | A6 | A7 | A8 | A9 | A10 | A11 | A12 | A13 | A14 | A15 | |
|---|---|---|---|---|---|---|---|---|---|---|---|---|---|
| AHP (dry) | Si | 0.42 | 0.29 | 0.46 | 0.50 | 0.36 | 0.71 | 0.36 | 0.31 | 0.35 | 0.30 | 0.36 | 0.25 |
| Ri | 0.11 | 0.07 | 0.11 | 0.13 | 0.11 | 0.25 | 0.08 | 0.10 | 0.07 | 0.12 | 0.10 | 0.04 | |
| Qi | 0.35 | 0.11 | 0.38 | 0.47 | 0.29 | 1.00 | 0.20 | 0.19 | 0.19 | 0.25 | 0.24 | 0.00 | |
| rank | 9 | 2 | 10 | 11 | 8 | 12 | 5 | 4 | 3 | 7 | 6 | 1 | |
| AHP (wet) | Si | 0.42 | 0.30 | 0.47 | 0.51 | 0.37 | 0.71 | 0.37 | 0.29 | 0.34 | 0.31 | 0.36 | 0.26 |
| Ri | 0.11 | 0.07 | 0.11 | 0.13 | 0.11 | 0.25 | 0.08 | 0.10 | 0.07 | 0.12 | 0.10 | 0.04 | |
| Qi | 0.35 | 0.12 | 0.39 | 0.48 | 0.29 | 1.00 | 0.21 | 0.17 | 0.16 | 0.26 | 0.25 | 0.00 | |
| rank | 9 | 2 | 10 | 11 | 8 | 12 | 5 | 4 | 3 | 7 | 6 | 1 | |
| EWM | Si | 0.49 | 0.54 | 0.60 | 0.62 | 0.43 | 0.50 | 0.51 | 0.40 | 0.35 | 0.41 | 0.58 | 0.55 |
| Ri | 0.12 | 0.17 | 0.17 | 0.17 | 0.12 | 0.13 | 0.12 | 0.11 | 0.11 | 0.12 | 0.12 | 0.12 | |
| Qi | 0.37 | 0.85 | 0.96 | 1.00 | 0.26 | 0.49 | 0.41 | 0.13 | 0.00 | 0.22 | 0.59 | 0.48 | |
| rank | 5 | 10 | 11 | 12 | 4 | 8 | 6 | 2 | 1 | 3 | 9 | 7 | |
| AHP-EWM | Si | 0.46 | 0.42 | 0.53 | 0.57 | 0.40 | 0.60 | 0.44 | 0.35 | 0.35 | 0.36 | 0.47 | 0.40 |
| Ri | 0.08 | 0.11 | 0.11 | 0.11 | 0.08 | 0.15 | 0.08 | 0.09 | 0.08 | 0.08 | 0.10 | 0.08 | |
| Qi | 0.22 | 0.38 | 0.60 | 0.66 | 0.10 | 1.00 | 0.18 | 0.05 | 0.01 | 0.03 | 0.38 | 0.11 | |
| rank | 7 | 8 | 10 | 11 | 4 | 12 | 6 | 3 | 1 | 2 | 9 | 5 |
| A4 | A5 | A6 | A7 | A8 | A9 | A10 | A11 | A12 | A13 | A14 | A15 | |
|---|---|---|---|---|---|---|---|---|---|---|---|---|
| Scenario 1 | 7 | 8 | 10 | 11 | 4 | 12 | 6 | 3 | 1 | 2 | 9 | 5 |
| Scenario 2 | 8 | 6 | 7 | 10 | 2 | 11 | 4 | 3 | 1 | 5 | 9 | 12 |
| Scenario3 | 8 | 9 | 10 | 11 | 5 | 12 | 6 | 2 | 1 | 3 | 7 | 4 |
| Scenario4 | 6 | 8 | 10 | 11 | 3 | 12 | 4 | 2 | 1 | 5 | 9 | 7 |
| Scenario5 | 4 | 8 | 9 | 10 | 2 | 12 | 6 | 7 | 5 | 1 | 11 | 3 |
| Standard deviation | 1.67 | 1.10 | 1.30 | 0.55 | 1.30 | 0.45 | 1.10 | 2.07 | 1.79 | 1.79 | 1.41 | 3.56 |
| Ranking | 1 | 2 | 3 | 4 | 5 | 6 | 7 | 8 | 9 | 10 | 11 | 12 |
|---|---|---|---|---|---|---|---|---|---|---|---|---|
| AHP (0%) EWM (100%) | A12 | A11 | A13 | A8 | A4 | A10 | A15 | A9 | A14 | A5 | A6 | A7 |
| AHP (30%) EWM (70%) | A12 | A11 | A13 | A8 | A15 | A10 | A4 | A14 | A9 | A5 | A6 | A7 |
| AHP (40%) EWM (60%) | A12 | A11 | A13 | A8 | A15 | A10 | A4 | A14 | A5 | A6 | A7 | A9 |
| AHP (50%) EWM (50%) | A12 | A13 | A11 | A8 | A15 | A10 | A4 | A5 | A14 | A6 | A7 | A9 |
| AHP (60%) EWM (40%) | A12 | A15 | A13 | A11 | A8 | A10 | A4 | A5 | A14 | A6 | A7 | A9 |
| AHP (70%) EWM (30%) | A15 | A11 | A12 | A13 | A10 | A5 | A8 | A4 | A14 | A6 | A7 | A9 |
| AHP (100%) EWM (0%) | A15 | A5 | A12 | A11 | A10 | A14 | A13 | A8 | A4 | A6 | A7 | A9 |
Disclaimer/Publisher’s Note: The statements, opinions and data contained in all publications are solely those of the individual author(s) and contributor(s) and not of MDPI and/or the editor(s). MDPI and/or the editor(s) disclaim responsibility for any injury to people or property resulting from any ideas, methods, instructions or products referred to in the content. |
© 2025 by the authors. Licensee MDPI, Basel, Switzerland. This article is an open access article distributed under the terms and conditions of the Creative Commons Attribution (CC BY) license (https://creativecommons.org/licenses/by/4.0/).
Share and Cite
Yu, M.; Zhao, L.; Chen, Z.; Wu, J. Balancing Solar Potential and Environmental Risk: A GIS-Based Site-Selection Approach for Concentrated Solar Power in Tibet. Sustainability 2025, 17, 4895. https://doi.org/10.3390/su17114895
Yu M, Zhao L, Chen Z, Wu J. Balancing Solar Potential and Environmental Risk: A GIS-Based Site-Selection Approach for Concentrated Solar Power in Tibet. Sustainability. 2025; 17(11):4895. https://doi.org/10.3390/su17114895
Chicago/Turabian StyleYu, Mingkun, Lei Zhao, Zuliang Chen, and Jingyu Wu. 2025. "Balancing Solar Potential and Environmental Risk: A GIS-Based Site-Selection Approach for Concentrated Solar Power in Tibet" Sustainability 17, no. 11: 4895. https://doi.org/10.3390/su17114895
APA StyleYu, M., Zhao, L., Chen, Z., & Wu, J. (2025). Balancing Solar Potential and Environmental Risk: A GIS-Based Site-Selection Approach for Concentrated Solar Power in Tibet. Sustainability, 17(11), 4895. https://doi.org/10.3390/su17114895