Article

A Two-Stage Sustainable Optimal Scheduling Strategy for Multi-Contract Collaborative Distributed Resource Aggregators

by
Lei Su
1,2,3,
Wanli Feng
1,2,3,
Cao Kan
1,2,3,
Mingjiang Wei
1,2,3,
Rui Su
4,
Pan Yu
4 and
Ning Zhang
4,*
1
State Grid Hubei Electric Power Research Institute, Wuhan 430000, China
2
Hubei Key Laboratory of Regional New Power Systems and Rural Energy System Configuration, Wuhan 430000, China
3
Hubei Engineering Research Center of the Construction and Operation Control Technology of New Power Systems, Wuhan 430000, China
4
School of Electrical Engineering and Automation, Anhui University, Hefei 230601, China
*
Author to whom correspondence should be addressed.
Sustainability 2025, 17(15), 6767; https://doi.org/10.3390/su17156767
Submission received: 25 June 2025 / Revised: 15 July 2025 / Accepted: 22 July 2025 / Published: 25 July 2025

Abstract

To address the challenges posed by the instability of renewable energy output and load fluctuations on grid operations and to support the low-carbon sustainable development of the energy system, this paper integrates artificial intelligence technology to establish an economic stability dispatch framework for distributed resource aggregators. A phased multi-contract collaborative scheduling model oriented toward sustainable development is proposed. Through intelligent algorithms, the model dynamically optimises decisions across the day-ahead and intraday phases: During the day-ahead scheduling phase, intelligent algorithms predict load demand and energy output, and combine with elastic performance-based response contracts to construct a user-side electricity consumption behaviour intelligent control model. Under the premise of ensuring user comfort, the model generates a 24 h scheduling plan with the objectives of minimising operational costs and efficiently integrating renewable energy. In the intraday scheduling phase, a rolling optimisation mechanism is used to activate energy storage capacity contracts and dynamic frequency stability contracts in real time based on day-ahead prediction deviations. This efficiently coordinates the intelligent frequency regulation strategies of energy storage devices and electric vehicle aggregators to quickly mitigate power fluctuations and achieve coordinated control of primary and secondary frequency regulation. Case study results indicate that the intelligent optimisation-driven multi-contract scheduling model significantly improves system operational efficiency and stability, reduces system operational costs by 30.49%, and decreases power purchase fluctuations by 12.41%, providing a feasible path for constructing a low-carbon, resilient grid under high renewable energy penetration.

1. Introduction

In recent years, distributed power sources have increasingly been integrated into distribution grids due to their flexible generation methods, minimal environmental impact, and ability to reduce carbon emissions [1]. While this has brought changes to the operational modes of distribution grids, it has also had a certain impact on their reliability. This is because most distributed power sources are renewable energy sources such as wind power and photovoltaic power, whose random and uncontrollable output poses challenges to the safe, stable, and economical operation of power systems [2]. To address these challenges and promote the low-carbon sustainable development of energy systems, Distributed Resource Aggregator (DRA) technology has emerged. This technology enables the efficient integration of distributed power generation units, energy storage devices, electric vehicle aggregators (EVAs), and controllable loads through the coordinated control of an energy management system (EMS). This not only reduces system instability caused by the fluctuating output of distributed power generation units but also significantly enhances the grid’s ability to accommodate high proportions of renewable energy and improves system stability [3]. Additionally, it optimises resource allocation and reduces system operating costs [4,5,6]. Additionally, through sustainable flexibility resources, it can participate in diverse trading scenarios such as the electricity spot market [7], ancillary services market [8], and capacity market [9]. The risk of price fluctuations in a single market can be mitigated through multi-market trading. For example, when spot market prices decline, ancillary service revenues can offset losses [10]. Cross-market operations also enable virtual power plants to adopt more trading strategies, such as transferring energy across time periods via energy storage during periods of power surplus, or prioritising frequency regulation capabilities during high-price periods in the ancillary services market [11].
In distributed resource aggregators, the controllable load includes different types of users, whose respective utilities depend not only on their own economic behaviour but are also influenced by the behaviour of other users, which makes the decision problem complex [12]. Reference [13] proposes that traditional demand response only uses fixed incentives as a means, assuming that users’ behaviour is completely rational and fully informed, and ignoring users’ electricity consumption preferences, which clearly does not reflect reality. This paper mentions a flexible demand response method that takes into account the wishes of users and uses evolutionary game theory to promote the dynamic process of commercial and industrial users participating in demand response, thereby overcoming the fixed settings of traditional methods for user participation in demand response.
Due to the fluctuating and uncertain nature of distributed power generation units, the amplitude, frequency, and distribution characteristics of their output fluctuations are weakly correlated with the trend of grid load fluctuations [14]. This uncertainty poses challenges for grid frequency regulation, and the limitations on frequency regulation capacity also constrain the grid’s ability to accommodate clean energy. Energy storage devices possess the ability to regulate grid frequency and participate in the ancillary services market [15]. Leveraging their rapid and flexible regulation advantages, energy storage systems adjust their charging and discharging states in real time according to grid requirements, thereby fulfilling their intended functions and earning corresponding compensation. This expands the profit channels for commercial and industrial energy storage while contributing to the safe and stable operation of the power system. The study [16] proposes that energy storage devices can assist users through energy efficiency optimisation and power optimisation. They can monitor and predict energy demand in real time, helping users achieve optimal energy usage patterns. It also proposes energy storage capacity contracts for load balancing or frequency regulation, but lacks demand-side participation. The study [17] proposes a virtual power plant coordination system involving photovoltaic systems and electric vehicles, which reduces power purchase costs while minimising energy waste. However, the system does not incorporate a contract mechanism.
Among the units that can participate in frequency regulation within aggregators, in addition to traditional energy storage systems, there are also EVs. Compared to traditional energy storage devices, EVs do not require additional investment, and most EVs are idle most of the time [18]. By managing the charging and discharging of EVs in an orderly manner, EVs can participate in frequency regulation in the power market during idle periods, thereby achieving peak shaving and frequency regulation [19], and complementing distributed power generation units to compensate for user-side load usage [20]. A large number of electric vehicles connected to the grid for charging, with electric vehicle aggregators acting as agents, can participate in power market transactions by integrating EVA charging and frequency regulation, enabling profits in the day-ahead market and intraday ancillary service market [21]. The current research status indicates that the time-of-use electricity prices provided by the day-ahead energy market can serve as incentive signals to guide electric vehicles to charge during off-peak hours based on different time-of-use electricity prices. This approach reduces charging costs through day-ahead optimised scheduling while achieving peak shaving and valley filling [22]. However, the actual requirements for revenue settlement are relatively complex. The study [23] proposes implementing scheduling based on different charging behaviours of electric vehicles to achieve more accurate frequency regulation signals and higher frequency regulation revenues. None of the aforementioned research methods have considered the issue of electric vehicle charging regulation under the simultaneous influence of day-ahead and intraday scheduling.
This study’s method organically couples multiple contracts within a unified optimisation framework to achieve synergistic benefits between contracts; this reduces power purchase and equipment operating costs while using hierarchical contract responses to progressively suppress power and frequency fluctuations, ultimately achieving simultaneous improvements in system operating costs and dynamic stability. The main contributions of this study are as follows:
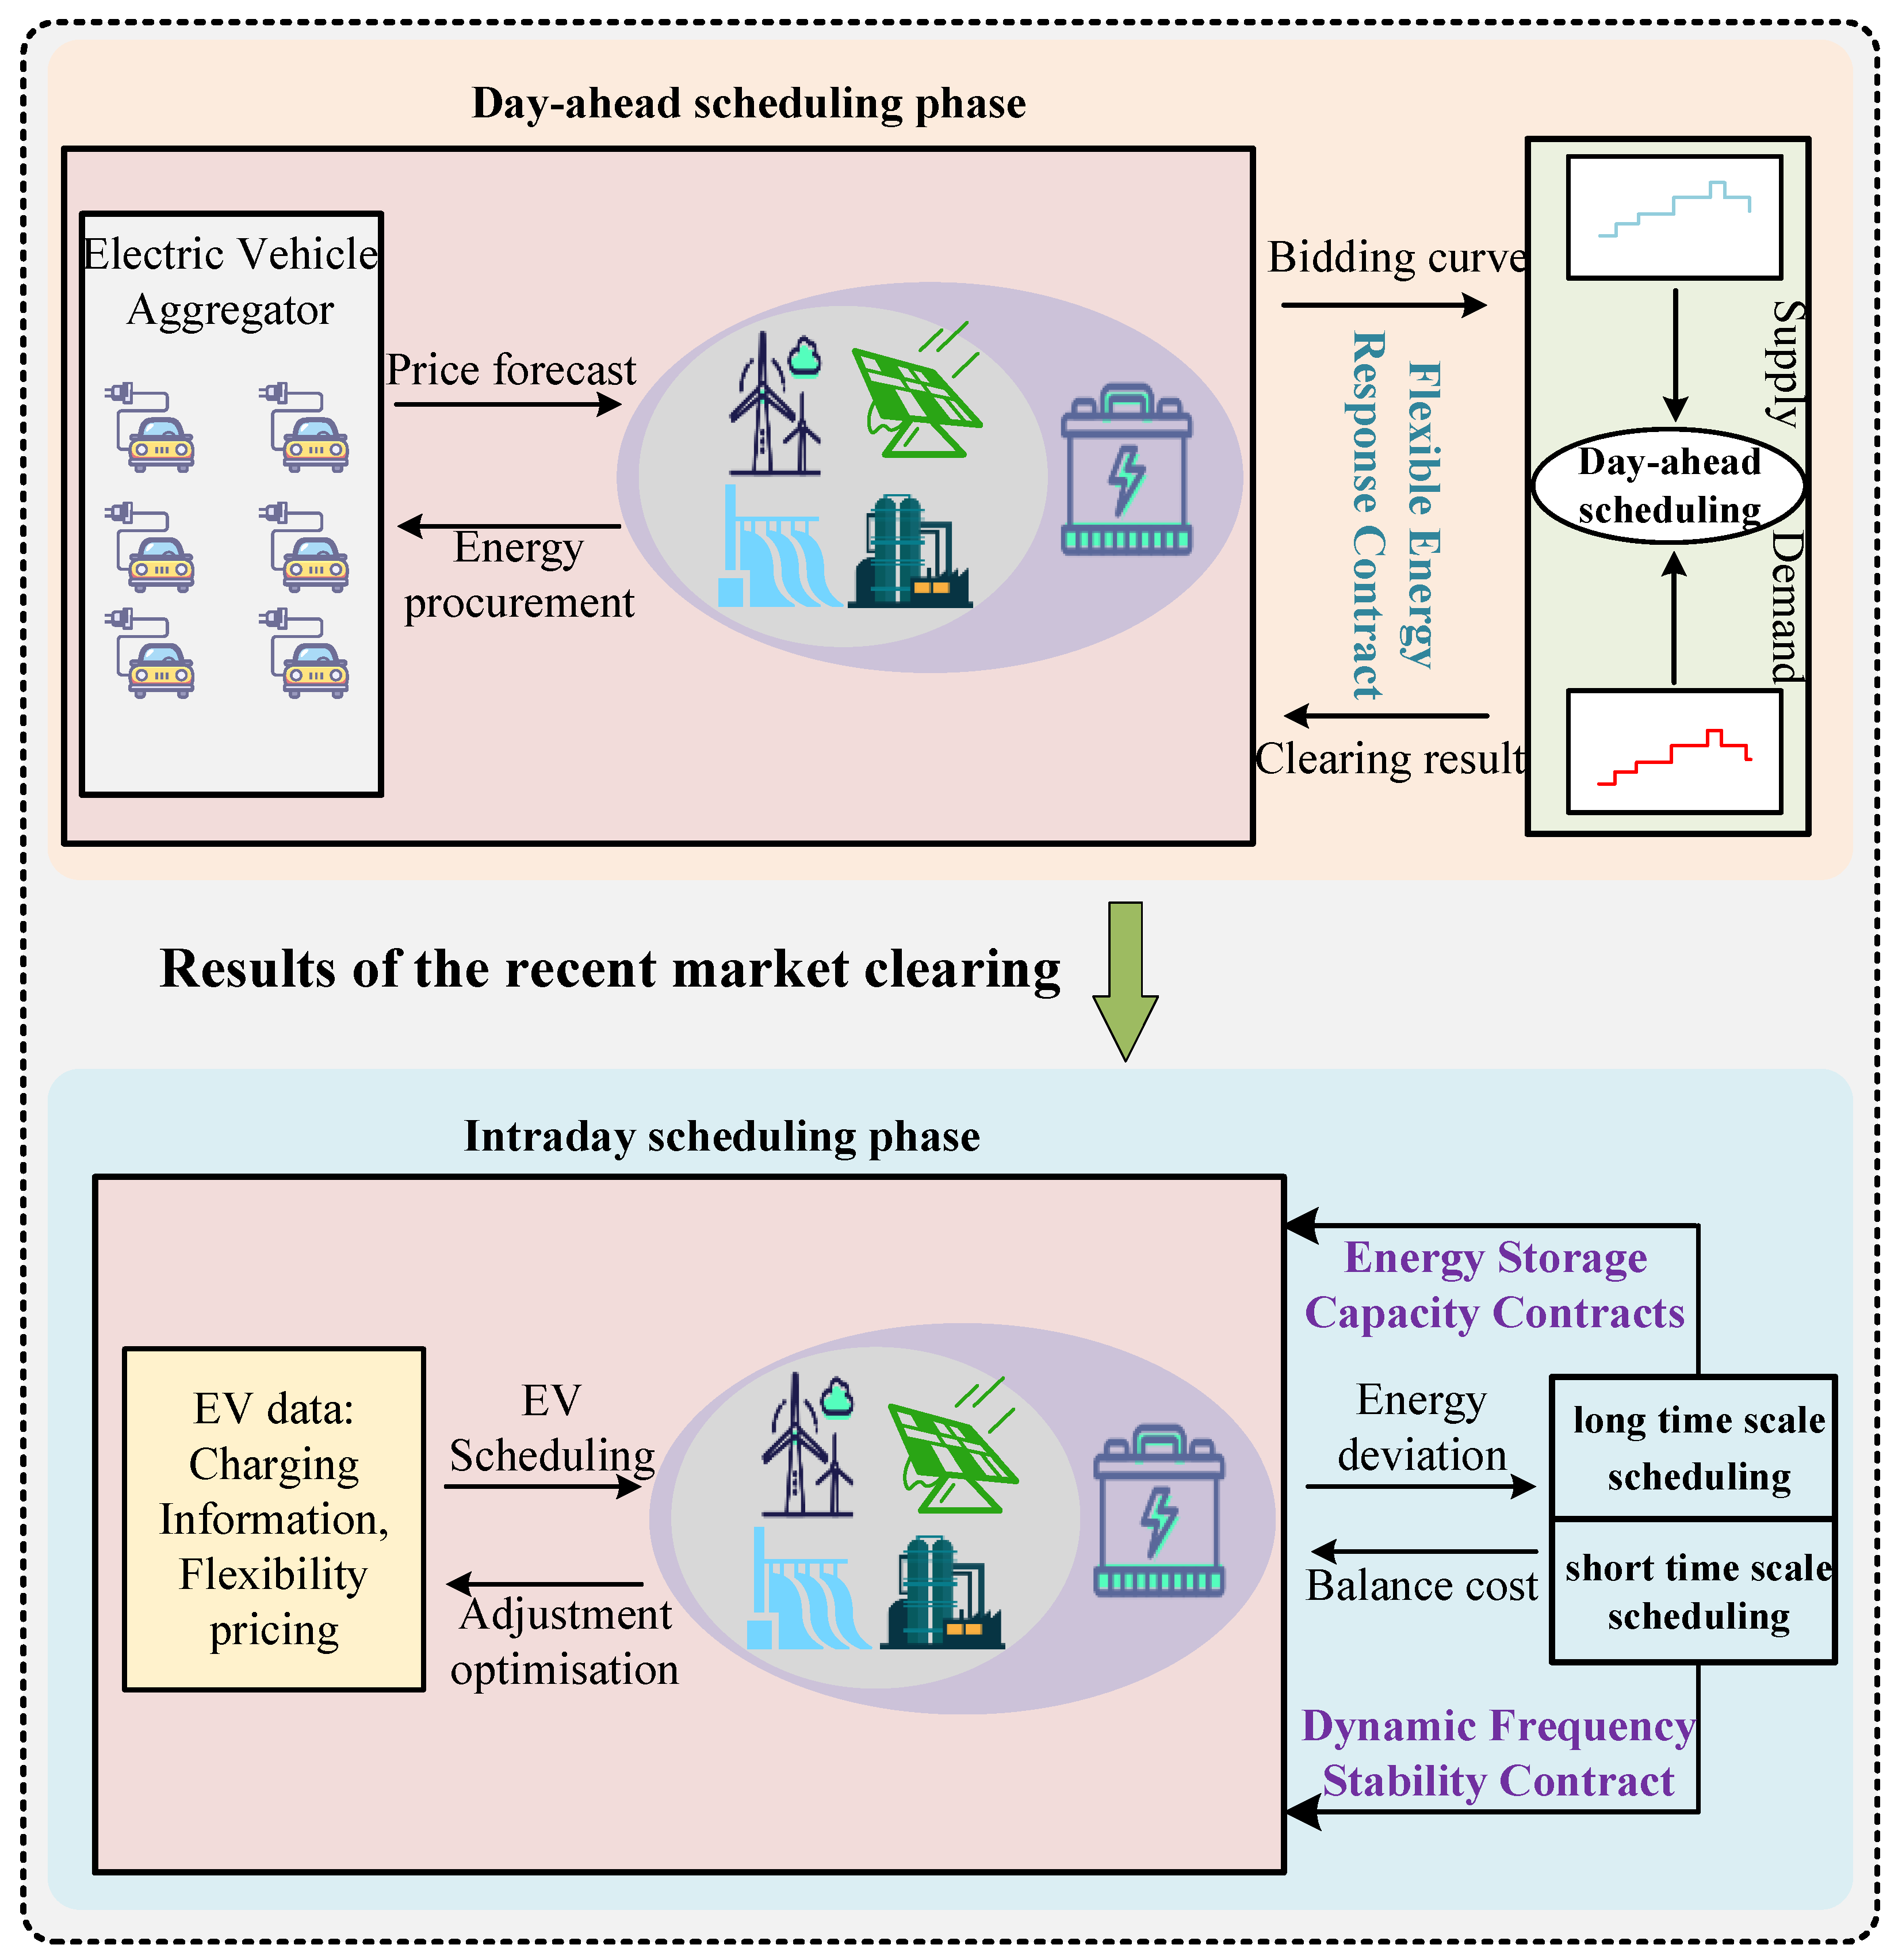
  • By constructing a multi-contract coordinated scheduling framework, the elastic performance response, energy storage capacity, and dynamic frequency stability contracts are organically coupled within a unified model, achieving synergistic benefits among contracts;
  • Based on this, user preference assessment and elastic performance response contracts are introduced during the day-ahead scheduling phase to dynamically incentivise demand-side participation, achieving significant optimisation of operational costs;
  • In intraday scheduling, the long-term energy storage capacity contract is first used to mitigate large fluctuations, followed by the short-term dynamic frequency stability contract for minute-level fine-tuning, ultimately effectively enhancing the system’s fluctuation stability.
In summary, this paper presents a study on the economic stability of DRA under the influence of time-sharing multiple contracts. Firstly, the basic principles of several contracts as well as the rules and constraints are introduced, and the target objects of contract signing, the contract contents as well as the reward and punishment system are sorted out. Secondly, a joint day-ahead-intraday long-time-intraday short-time scheduling optimisation model of DRA is established; then, the model is divided into three time scales, i.e., 24 h, 1 h, and 15 min, to solve the problem; finally, the reasonableness and validity of the model proposed in this paper are verified through the arithmetic examples.

2. Fundamental Principle

2.1. DRA Fundamentals

The research in this paper focuses on the DRA hierarchical dispatch problem, which involves the impact of multiple contracts. In this paper, we consider that the aggregation units of the DRA include wind turbines, photovoltaic units, hydroelectric units, thermal units, energy storage devices, electric vehicle aggregators, and loads, which are unified, controlled, and managed by the EMS [24]. With the forecast information of electricity price and wind, PV and hydro, thermal power output, and then based on the internal rules of the electricity market, the EMS develops appropriate bidding strategies (bidding power and bidding quantity) to control the energy storage devices, EV charging and discharging behaviours, as well as the demand-side behaviours. Through mathematical modelling, these factors are incorporated into the distributed resource hierarchical optimal dispatch to obtain the best dispatch result at each level.

2.2. Energy Storage Capacity Contracts

An energy storage capacity contract is an agreement between an energy storage operator and a grid operator that specifies the capacity reservation, charging and discharging power limitations, and usage priority of the energy storage for a specific period of time. Its core objective is to optimise the balance between energy supply and demand and enhance system stability by planning ahead for the call of energy storage resources. As the energy storage battery has the characteristics of rapid response and high control accuracy [25], in this context, to explore the participation of energy storage in grid frequency regulation has a certain degree of necessity, and the scientific and reasonable allocation of energy storage capacity is an important part of the planning of the energy storage application, and also promotes the basis of its entry into the frequency regulation market, as follows. Figure 1 is the schematic diagram of the energy storage equipment for primary frequency regulation.
When the system load experiences a phased increase, the load-frequency characteristic curve will transition from L 1 ( Δ f ) to L 2 ( Δ f ) . Based on the power frequency static characteristics G ( Δ f ) of traditional synchronous power sources, the units will autonomously increase their output to suppress frequency drops. The system operating point will shift from the initial steady-state point a to the transient point b, with the corresponding frequency deviation decreasing from O to a negative offset Δ f 1 . Based on the principle of energy storage battery simulated droop control proposed in Reference [26], by configuring the virtual load factor coefficient of the energy storage unit, its output power P E participates in the system’s primary frequency regulation. When grid supply exceeds load demand, the grid frequency trends upward, at which point the energy storage unit should be controlled to absorb excess power; when grid supply is less than load demand, the grid frequency trends downward, at which point the energy storage unit should be controlled to release power. In the energy storage, participation in a frequency control method to determine the basis, through the simulation of traditional power sag characteristics is to establish the frequency increment and energy storage power of the intrinsic link, to achieve energy storage participation in a frequency control. The benefit gained from energy storage participation in primary FM is the real-time power benefit, as shown in Equation (1) below, i.e., energy storage gains by participating in charging and discharging arbitrage in the real-time power market.
R e n e r g y = t = 1 T m = 1 M τ r e s e r v e ( t ) Q r e s e r v e , m ( t )
In the formula, R e n e r g y indicates the real-time power benefit; τ r e s e r v e ( t ) indicates the power price of moment t; indicates the power capacity of the energy storage system participating in one frequency adjustment at moment t. By predicting the power generation of wind, solar, hydro, and thermal power stations, as well as user load, while taking into account the volatility of new energy output, it is possible to commit in advance to the capacity of the energy storage system to participate in primary frequency regulation. If, after actual frequency regulation, the actual frequency regulation amount exceeds the committed frequency regulation amount, a reward is given; otherwise, a penalty is imposed. Based on the above analysis, the following formula is proposed to describe this, as shown in Equation (2):
C e s = λ E S t = 1 T m = 1 M ( Q r e s e r v e , m ( t ) Q r e s e r v e ( t ) )
where C e s represents the incentive or penalty received for fulfilling the energy storage capacity contract; λ E S represents the capacity deviation penalty factor; and Q r e s e r v e ( t ) represents the FM capacity committed in advance based on the day-ahead dispatch forecast generation and load.

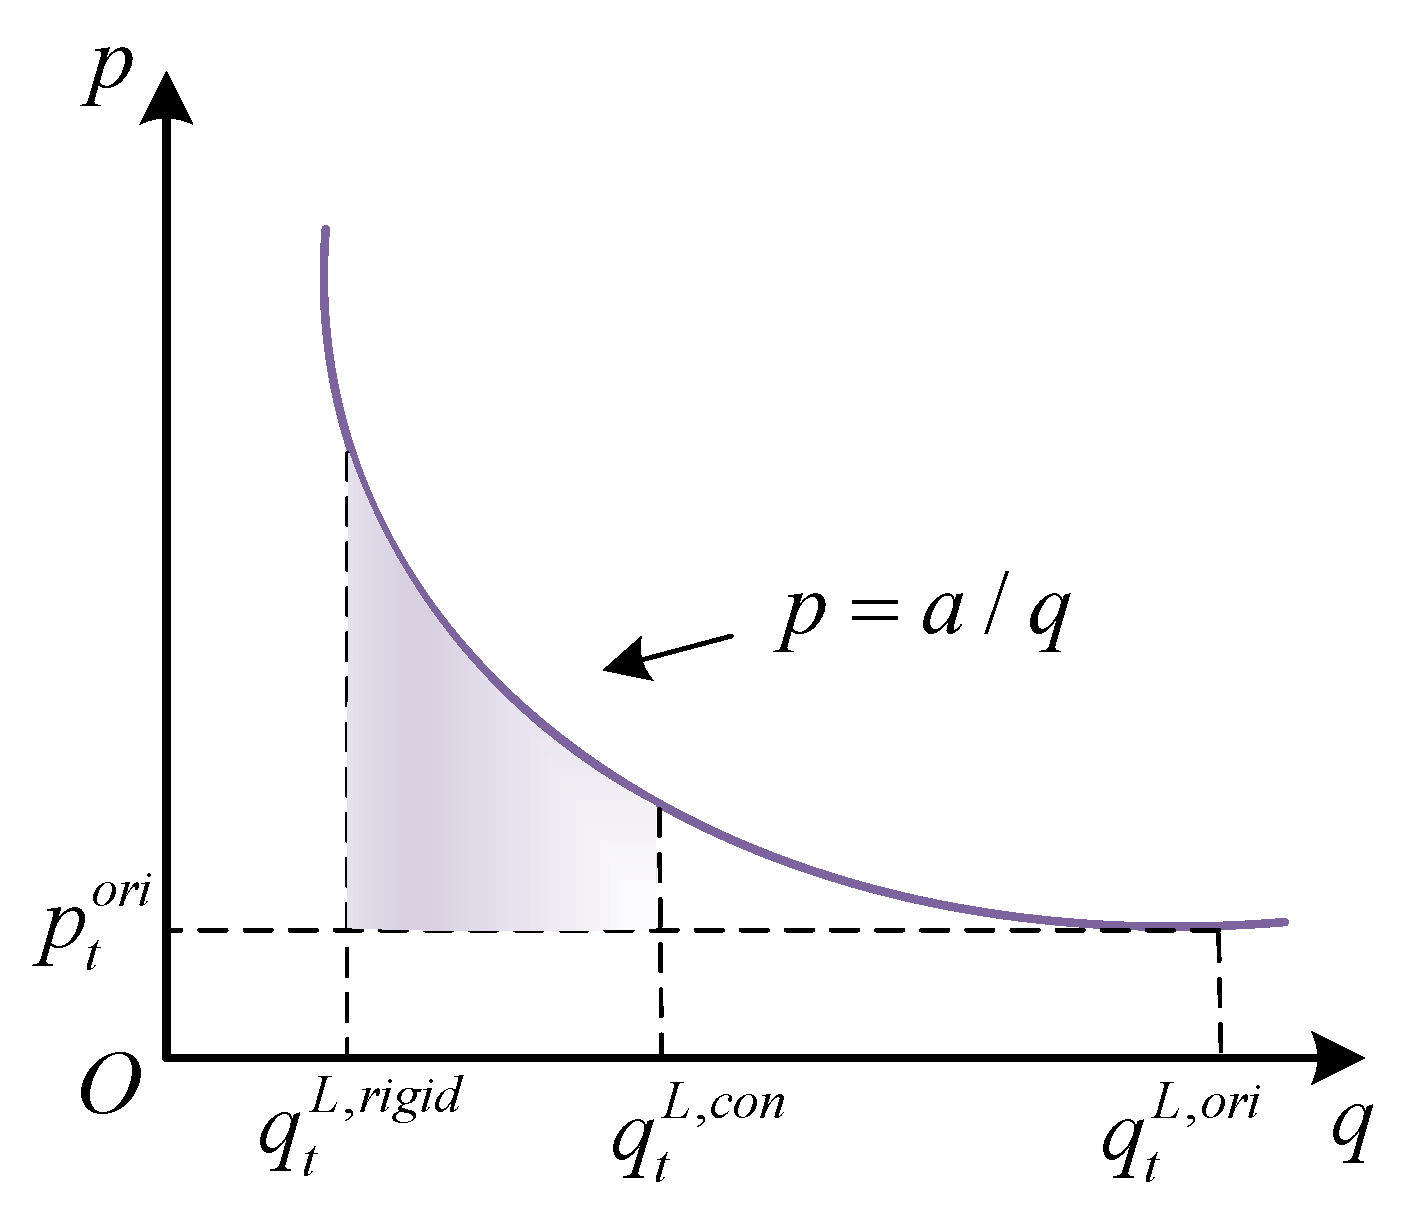
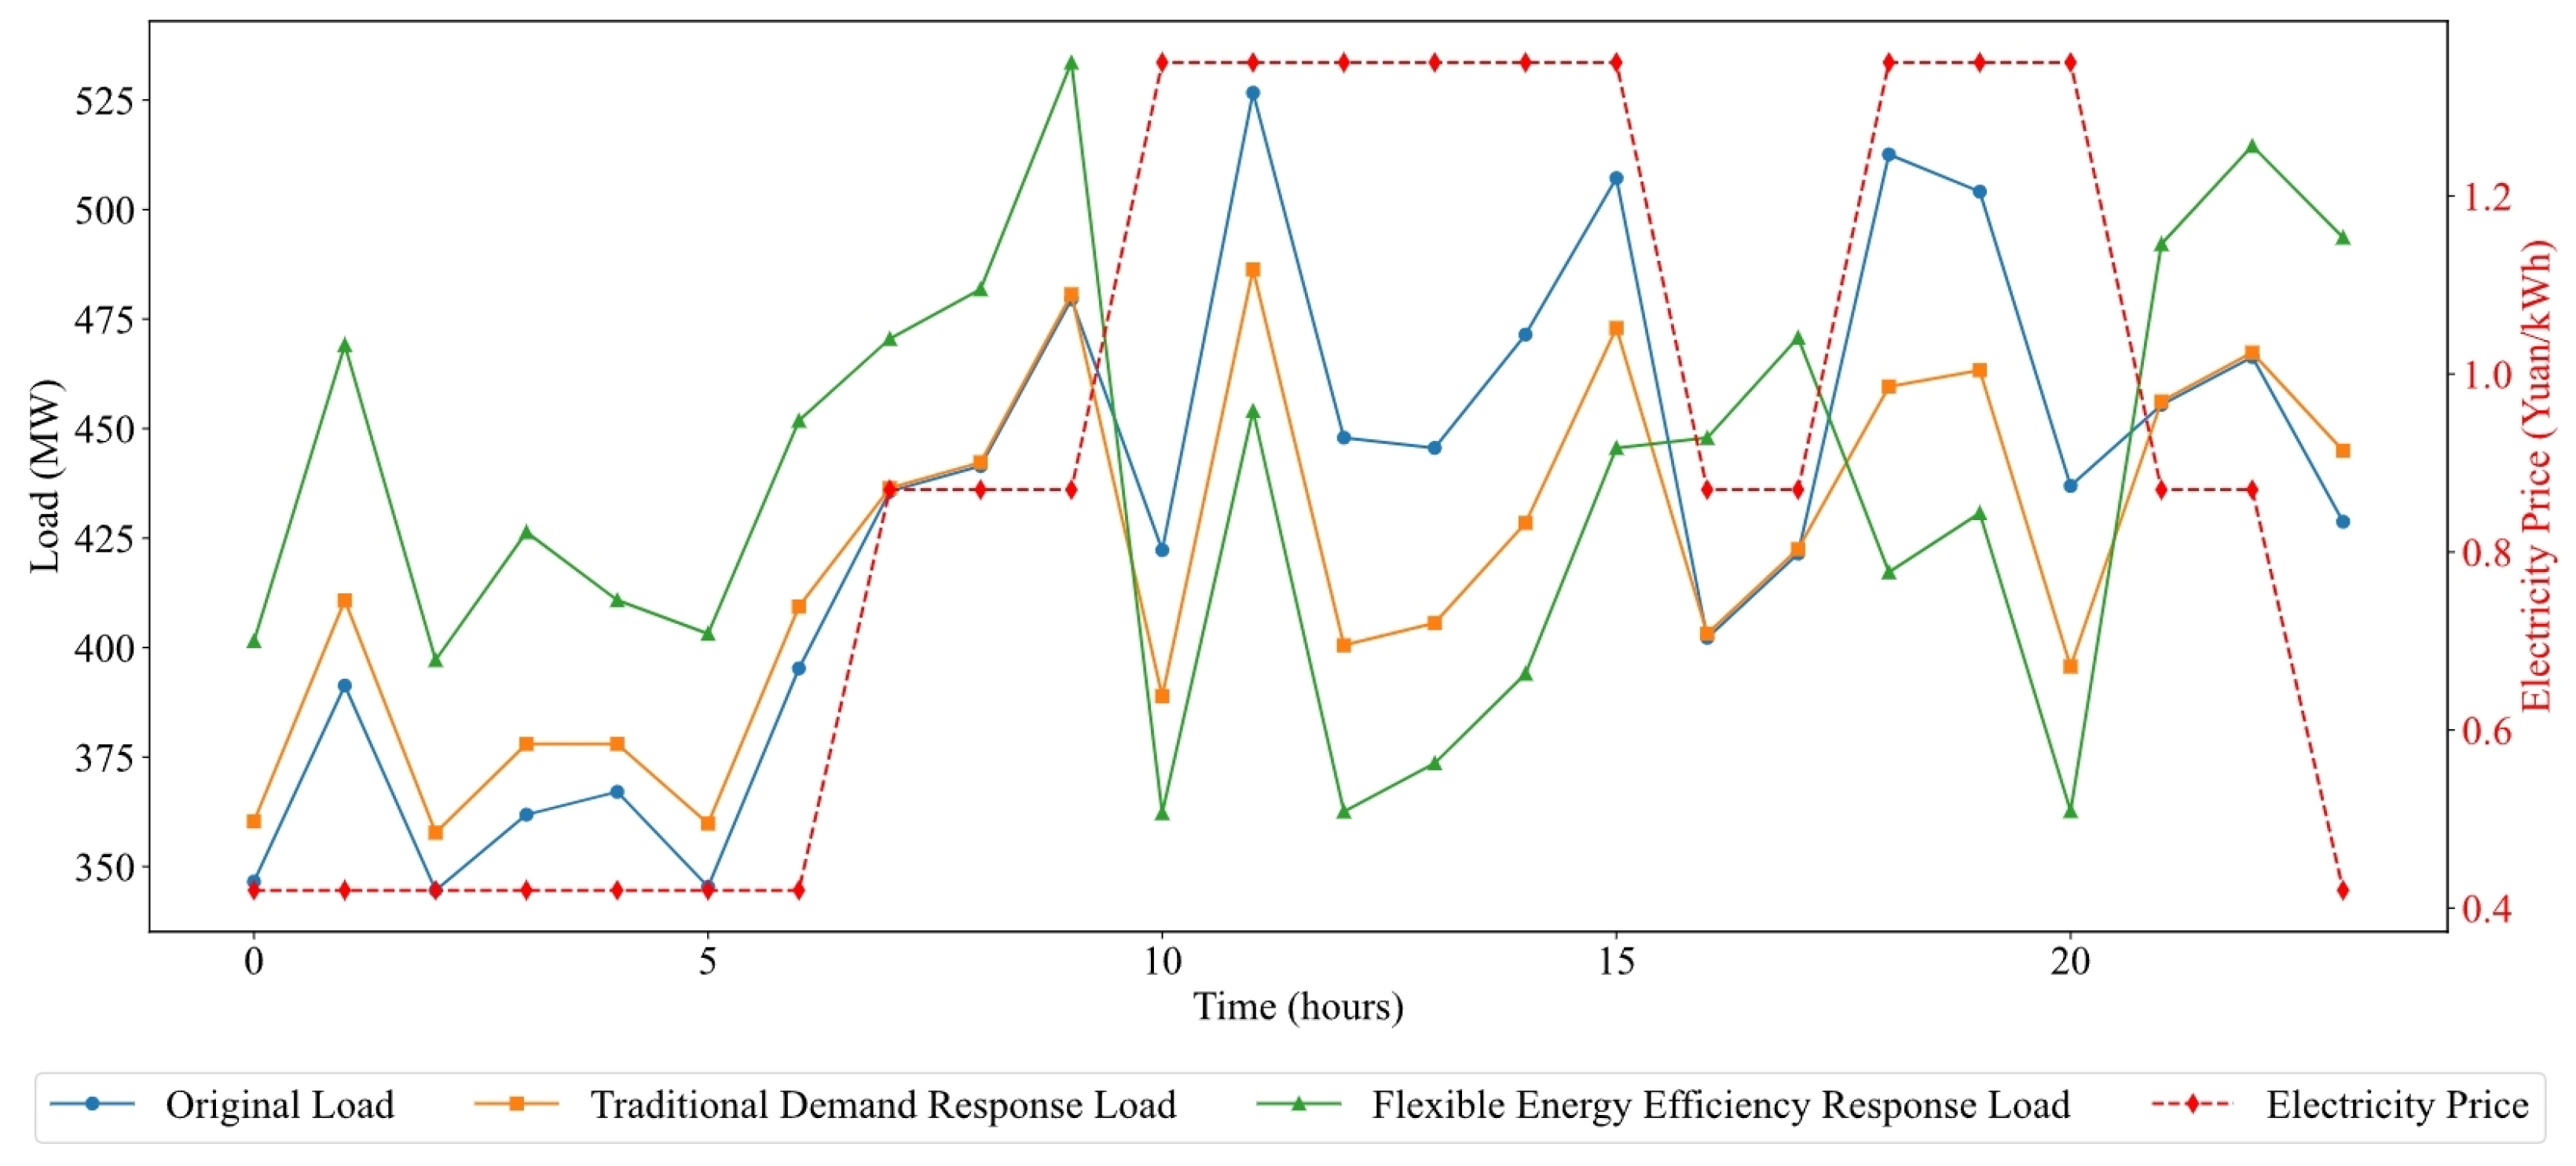
2.3. Flexible Energy Efficiency Response Contract

Flexible Energy Efficiency Response Contracts are agreements between electricity consumers and grid operators whereby consumers respond to grid demand signals by adjusting their electricity consumption behaviour (e.g., load shedding, time shifting) in exchange for financial compensation or tariff concessions. Its core objective is to enhance demand-side flexibility and alleviate the conflict between supply and demand, which is of positive significance for reducing system operating costs and improving customer energy efficiency.
The participation of residential electricity load in demand-side tariff response should be controlled within a certain range, as electricity resources have the attribute of public goods, which must ensure the basic use of electricity by ordinary residents, i.e., the non-adjustable part of the residential load is regarded as rigid load. Regarding television sets, lighting, and computers, their power cuts will cause great inconvenience, and thus do not participate in the response; while for flexible loads such as air conditioners, washing machines, water heaters, and electric vehicles, their short-time outages or power-down operation have less impact on users, and can participate in demand-side response [27].
In energy efficiency response, user willingness must be considered, which can be used to represent the user’s experience valuation of their own energy use after participating in demand response under the premise of meeting the rigid energy demand; the more energy used to participate in energy efficiency response, the greater the impact of the user’s daily energy use, the worse the user experience. Therefore, the experience valuation function is introduced here to represent the user’s willingness to use electricity to reflect the real-life user’s choice trend. The experience valuation of demand-side users can be represented by the demand–price function. The commonly used function is p = ( q / a ) 1 / ε , where p is expressed as the energy demand of users, q as the energy price of users, a as the demand–price constant, and ε as the demand–price elasticity coefficient. Reference [27] points out that the common elasticity range is mostly between −0.8 and −1.2. To make the model easier to solve and better reflect user response characteristics, we take ε = 1 here. The function image is shown in Figure 2 below:
In the figure, the area of the surrounded area R w i s h indicates the user’s consumption valuation; the larger the area, the better the user’s experience of electricity use, i.e., the higher the willingness, the consumption valuation is shown in the following Equation (3), in which p t o r i indicates the selling price of electricity in the t time period, q t L , o r i indicates the original electric load in the t time period, q t L , r i g i d indicates the rigid electric load in the t time period, and q t L , c o n indicates the actual consumption of electric load in the t time period. In order to further incentivise customers to execute the contract, the compensation tariff is set to be proportional to the amount of electricity they respond to, i.e., the more they respond, the more they will be compensated, and the compensation tariff and the revenue received are shown in Equations (4) and (5) below:
R w i s h = q t L , r i g i d q t L , c o n ( p p t o r i ) d q
p t s u b = δ 0 p t o r i q t L , D R q t L , o r i
R r o u = p t s u b q t L , D R = ( δ 0 p t o r i q t L , D R q t L , o r i ) q t L , D R = t = 1 T a δ 0 ( q t L , D R q t L , o r i ) 2
where p t s u b denotes the compensatory tariff for the t period; q t L , D R denotes the actual load responded to by the customer during the t period; δ 0 denotes the compensation rate; and R r o u denotes the benefit brought about by the fulfilment of the flexible energy efficiency contract. In guiding users to participate in this contract, load shifting and reduction will inevitably alter users’ electricity consumption habits, thereby causing some dissatisfaction among users. To address this, the concept of user adaptation costs is introduced to measure the costs incurred by users for participating in this contract. User loads can be categorised into flexible loads with high elasticity and rigid loads with low elasticity. The adaptation cost refers to the costs incurred from participating in demand response transfer or reduction of rigid loads. Based on the above analysis, the following formula is proposed to describe this, as shown in Equation (6):
C r i g i d = t = 1 T p a q t L , r i g i d q t L , r i g i d
where C r i g i d denotes the cost of non-adaptation, i.e., the penalty cost of defaulting on the flexible energy efficiency response contract; p a denotes the cost of non-adaptation per unit of deviated electricity; and q t L , r i g i d denotes the rigid load after participating in demand response.

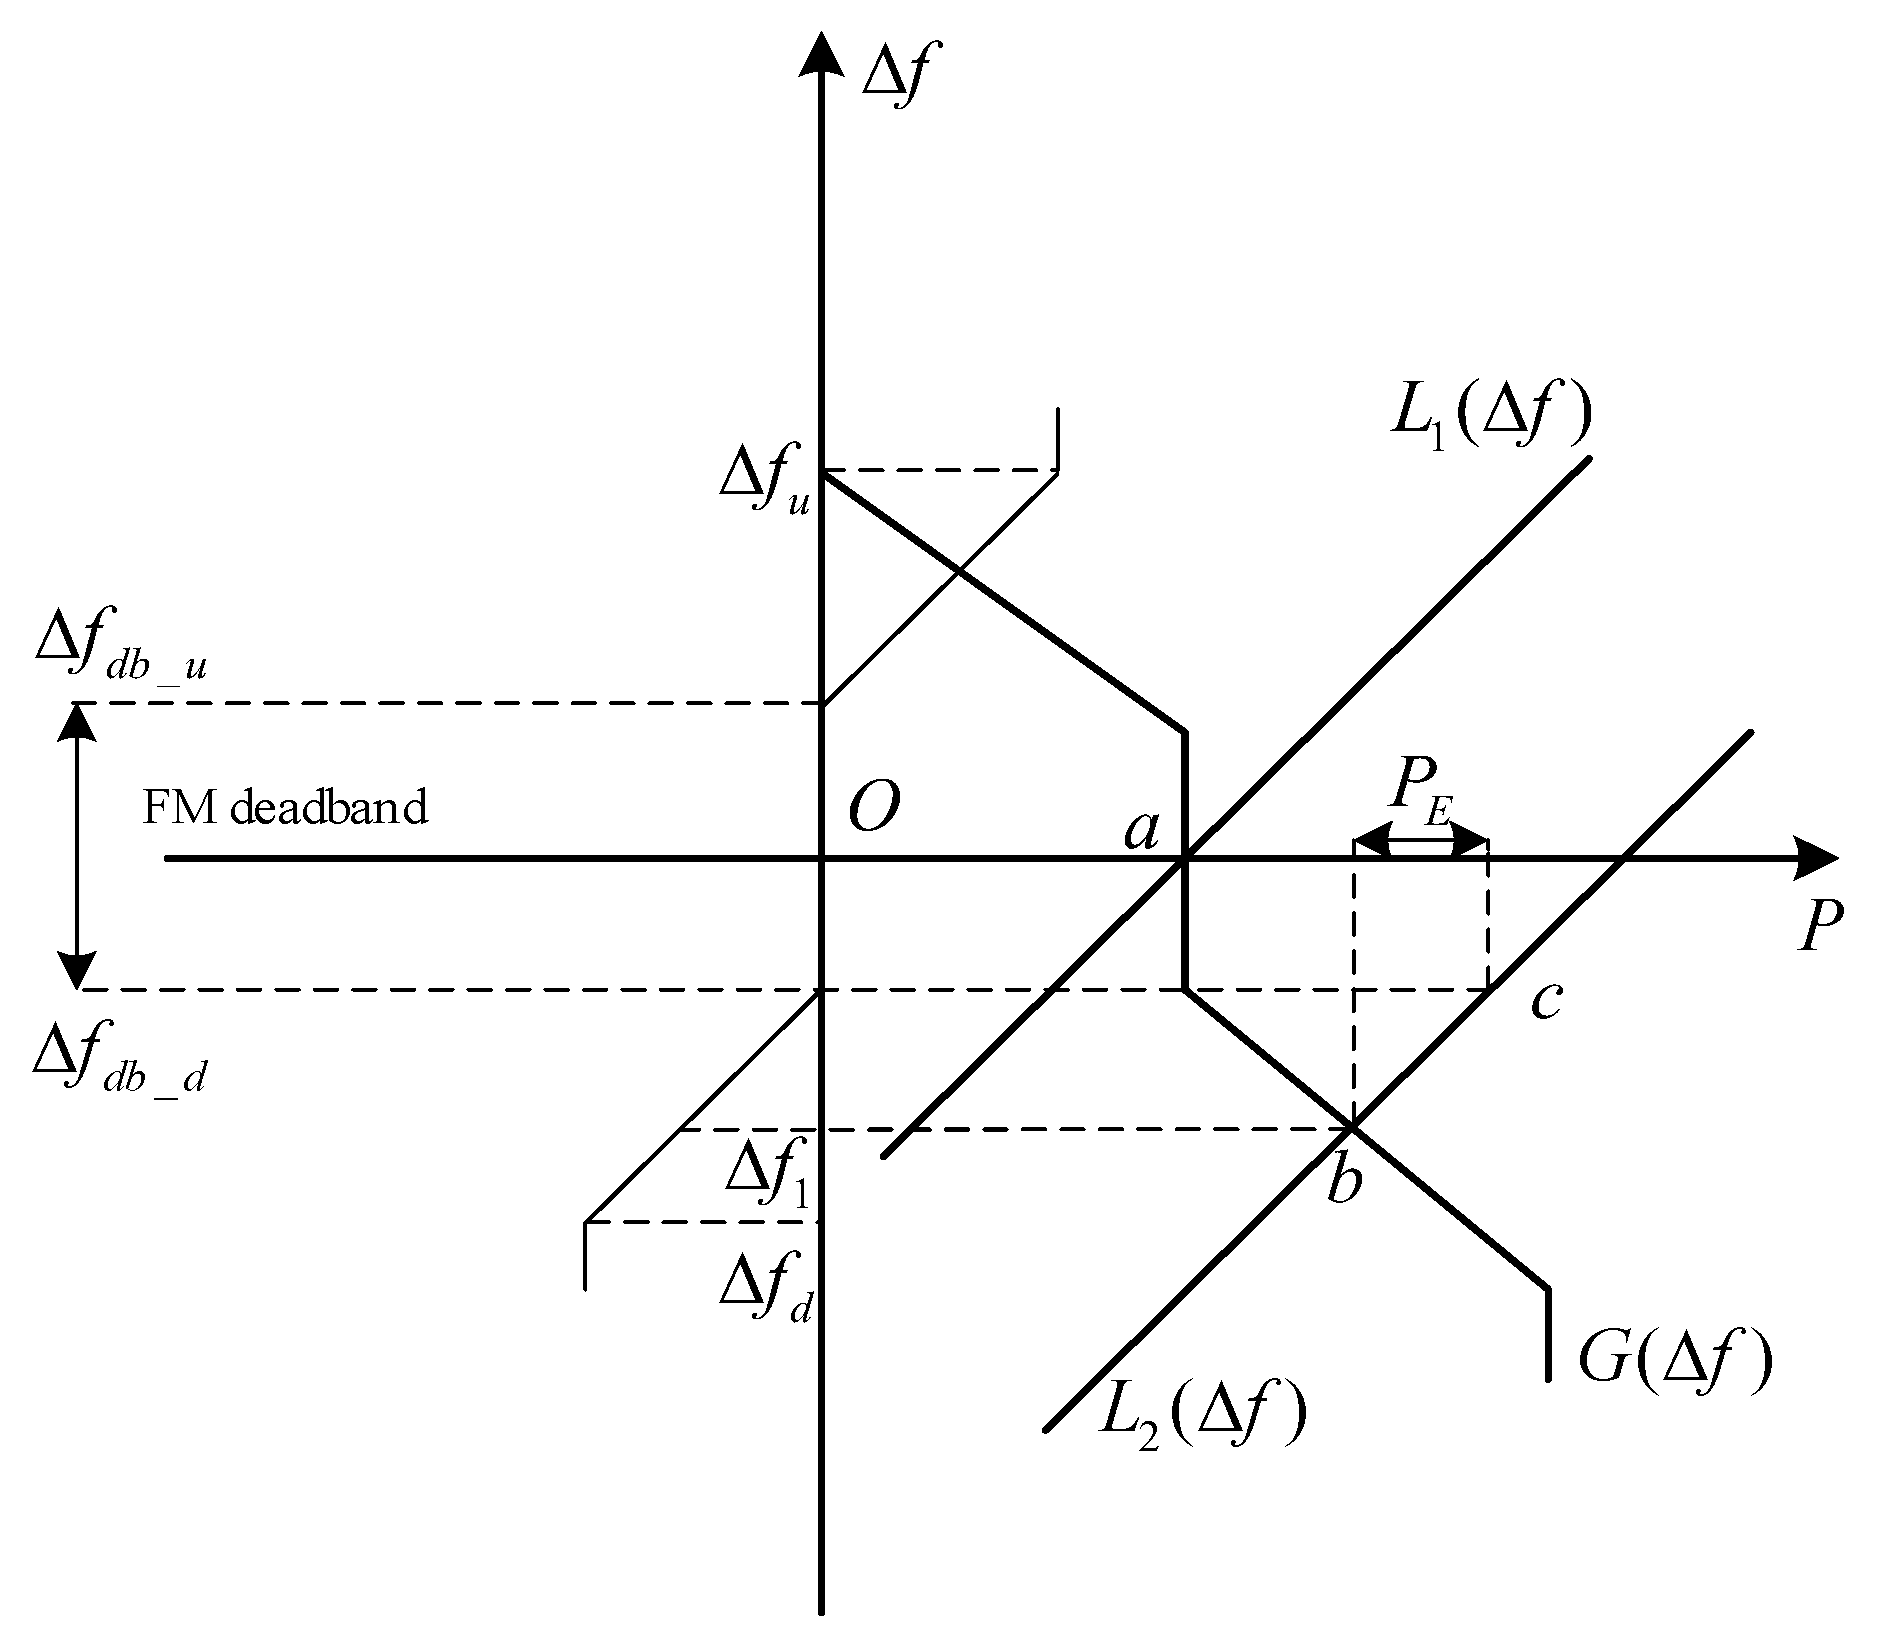
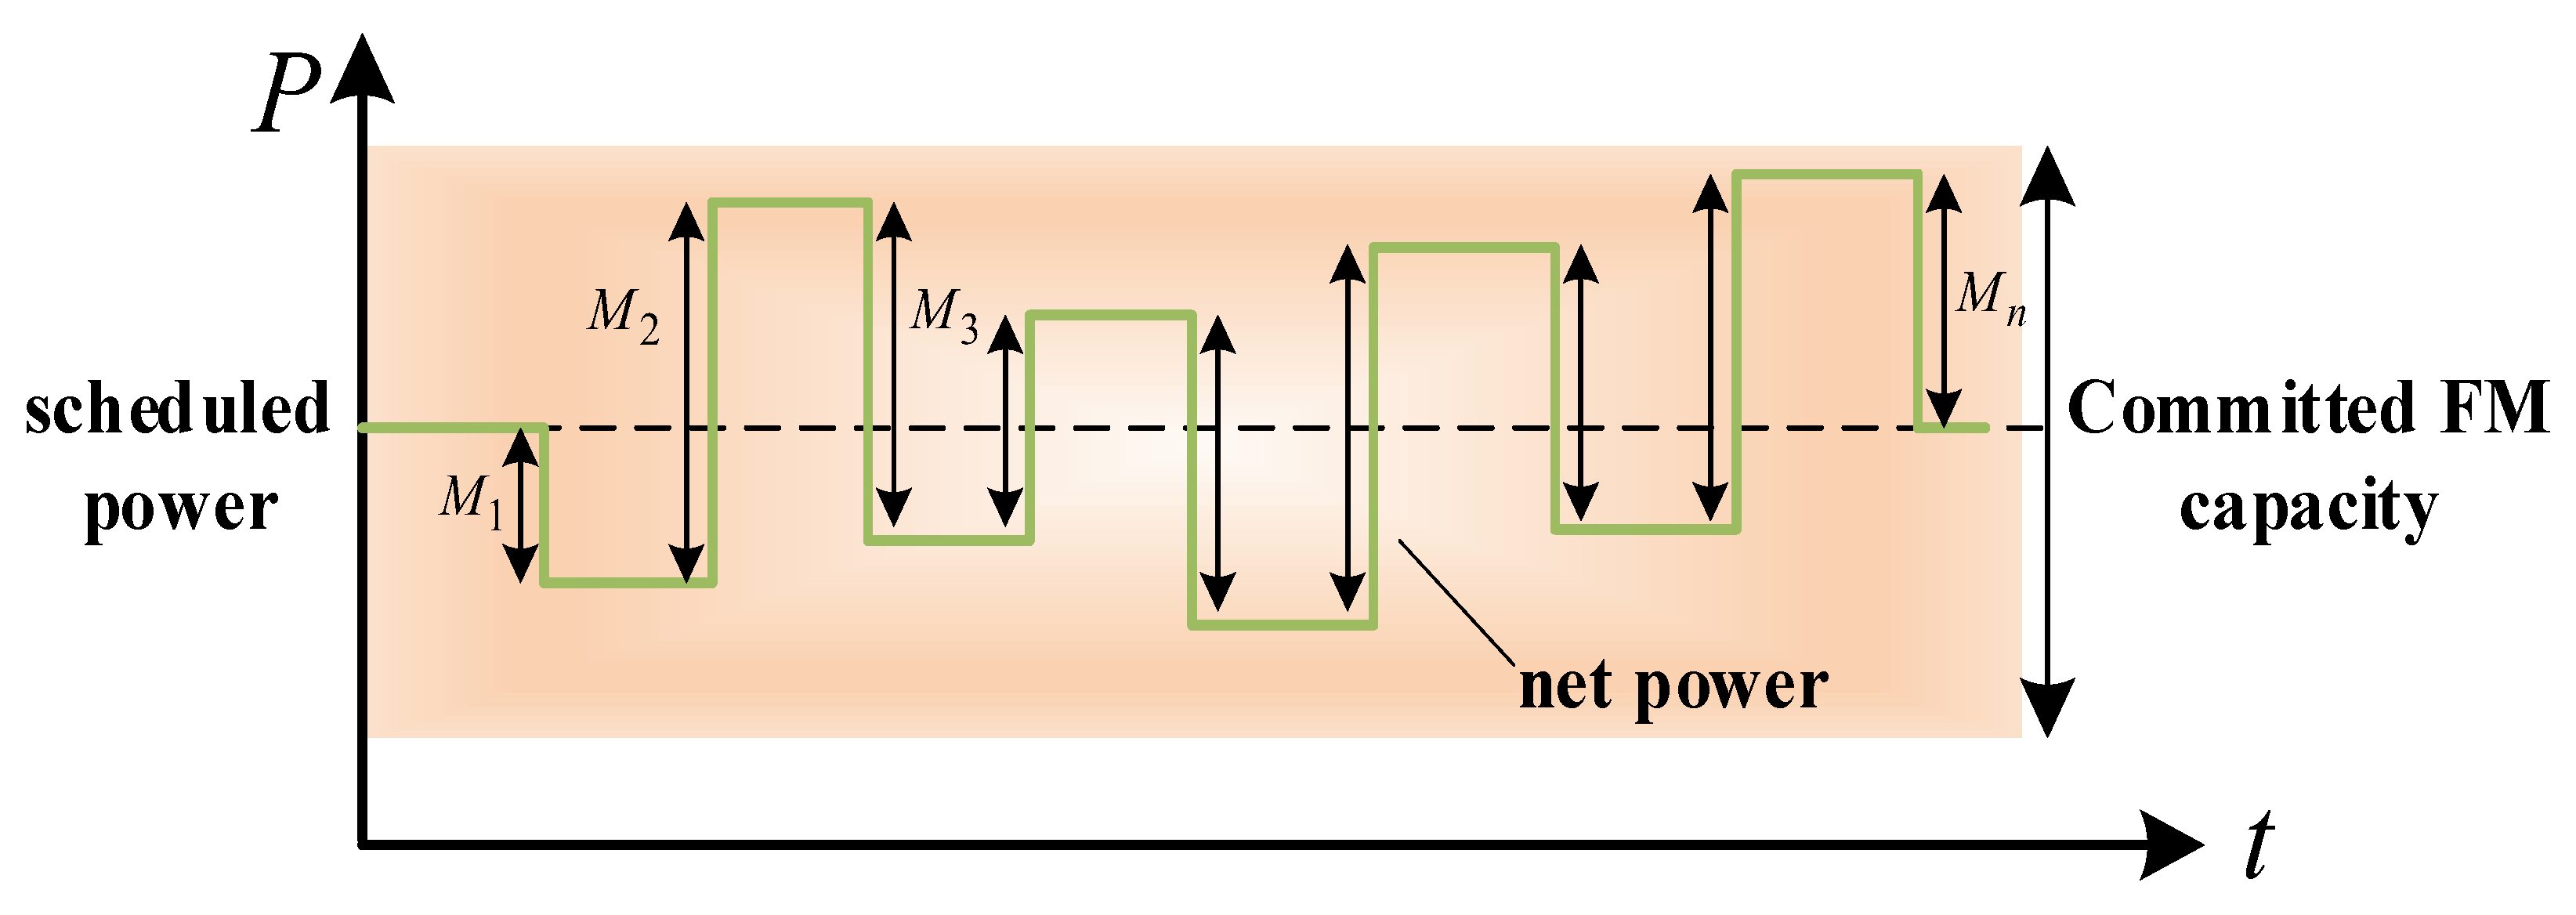
2.4. Dynamic Frequency Stability Contract

Dynamic frequency stabilisation contract is an agreement between an energy supplier and a grid operator that commits to provide services such as frequency regulation, voltage support, spare capacity, etc., in order to maintain the stable operation of the grid [7]. Its core objective is to ensure the safety and reliability of the power system. This paper investigates the use of electric vehicle aggregators to provide dynamic frequency regulation services. After completing their pre-day charging plans, electric vehicle aggregators convert available capacity space into dispatchable resources and access the secondary frequency regulation market through capacity bidding. The technical approach is illustrated in Figure 3 below.
The power system generates Area Control Errors (ACEs) in real-time operation [28], followed by the generation of FM signals by the system operator to act on the load service providers to direct the EVs to change their original charging power. In the electricity market, FM signals are issued at regular intervals to dispatch the winning resources and complete the frequency regulation. The process of participating in frequency modulation resources also needs to take into account mileage costs, which essentially reflect the impact of power regulation intensity on equipment depreciation, and is equal to the superposition of the absolute value of the difference between the two neighbouring points of the FM resource’s actual FM output in a given period of time, M 1 , M 2 , … M n , as illustrated in Figure 4 below.
The EV aggregator’s revenue in the secondary FM market consists of capacity revenue and mileage revenue, as shown in Equations (7)–(10) below:
F R C = t = 1 T r C ( t ) p R C ( t )
F R M = t = 1 T r M ( t ) p R M ( t )
p R M ( t ) = p R C ( t ) M ( t )
M ( t ) = i = 1 n A r e g , t ( i ) A r e g , t ( i 1 )
In the formula, F R C and F R M denote the capacity gain and mileage gain of the EVA, respectively; p R C ( t ) and p R M ( t ) denote the FM capacity and mileage committed to be provided by the EVA, respectively; r C ( t ) and r M ( t ) denote the capacity price and mileage price of the time period, respectively; M ( t ) denotes the number of FM mileage; and A r e g , t ( i ) denotes the FM indication signal. The power range of upward and downward FM can be committed in advance by the day-ahead scheduling prediction, and if the committed FM range is exceeded during the actual FM process, it will be penalised. Based on the above analysis, the following formula is proposed to describe the situation as shown in Equation (11):
C F R , p e n a t l y = λ F R t = 1 T n = 1 N max 0 , P n , t R U p R C ( t ) + max 0 , P n , t R D p R C ( t )
where C F R , p e n a t l y denotes the penalty cost associated with defaulting on that contract; λ F R denotes the frequency deviation penalty coefficient; and P n , t R U , P n , t R D denotes upward and downward power adjustments.

3. Model Framework Design

3.1. Problem Description

In this paper, we propose a multi-timescale optimal scheduling strategy from two scales: day-ahead scheduling and intra-day rolling scheduling. The day-ahead scheduling is hourly scheduling, which takes into account the contract constraints to obtain the 24 h day-ahead operation plan of each device; the intraday scheduling complies with the day-ahead plan and the contract constraints, and is divided into hourly long-time scale scheduling and minute short-time scale scheduling, which is optimised to reduce the system volatility through the rolling optimisation.
A two-layer scheduling model is established by the above analysis, in which the first layer is the day-ahead scheduling phase. In this layer, the system acquires data from various sources of information for forecasting and decision making. These data include charging and discharging information from EV aggregators, power production from distributed power generating units, loads, and energy storage device capacity. Then, based on this information, the power balance in the intraday phase is predicted, and if there is an imbalance between load and demand, the rules in the flexible response contract are used to reduce operating costs by influencing the power consumption habits on the customer side. The second layer is the intraday scheduling phase, where it is divided into long time scale scheduling and short time scale scheduling, and the system uses day-ahead clearing results to adjust its strategy, and the storage capacity contract and the dynamic frequency stability contract work together in the system to reduce the power purchased from the grid by committing to the primary FM capacity predicted by the storage device and the secondary FM capacity reserved by the EV aggregator in advance through the day-ahead clearing results of rate of change. The two-tier modelling framework constructed in this paper is shown in Figure 5 below:

3.2. Objective Function

3.2.1. Day-Ahead Scheduling Phase

Day-ahead Scheduling has been optimised with the goal of minimising EMS’s daily operating costs, and the objective function was established as shown in Equation (12):
F 1 = min C g r i d + C b e s s + C e v + C a b a n R D R C g r i d = t = 1 T ( λ g r i d , t P g r i d , t ) C b e s s = t = 1 T m = 1 M λ m , t ( P m , t c + P m , t d ) C e v = t = 1 T n = 1 N λ e v , t P n , t c C a b a n = t = 1 T λ a b a n , t P a b a n , t R D R = t = 1 T q t L , r i g i d q t L , c o n ( p p t o r i ) d q + a δ 0 ( q t L , D R q t L , o r i ) 2 p a q t L , r i g i d q t L , r i g i d
In the formula: F 1 represents the daily operating cost; C g r i d , C b e s s , C e v , and C a b a n , respectively, represent the electricity purchase cost, energy storage equipment operating cost, electric vehicle aggregator charging expenses, wind and solar curtailment penalty fees; λ g r i d , t and P g r i d , t represent the electricity price and electricity purchase volume at time t; λ m , t represents the unit operating cost of energy storage equipment m at time t; λ e v , t represents the charging price for electric vehicles at time t; P m , t c and P m , t d represent the charging and discharging power of energy storage equipment m at time t; P n , t c represents the pre-day charging power of electric vehicles n at time t; λ a b a n , t and P a b a n , t , respectively, represent the unit penalty cost and curtailed wind and solar power quantities at time t; R D R represents the total benefits generated by the elasticity performance response contract during this phase.

3.2.2. Intraday Long Time Scale Scheduling Phase

In the intraday scheduling model, power fluctuations of different energies are smoothed out by combining long-term and short-term scales. The long-term scale follows the operating status of each device in the day-ahead plan, adjusting the operating power of the devices according to the power fluctuations of distributed energy and load to smooth out the power fluctuations of electrical energy, and the objective function was established as shown in Equation (13):
F 2 , l o n g = min Δ C g r i d + C b e s s + C e v + C a b a n R E S R E S = t = 1 T m = 1 M τ r e s e r v e ( t ) Q r e s e r v e , m ( t ) + λ E S ( Q r e s e r v e , m ( t ) Q r e s e r v e ( t ) ) Δ C g r i d = t = 1 T μ g r i d , t Δ P g r i d , t 2 + λ g r i d , t P g r i d , t
In the formula: F 2 , l o n g is the objective function of the intraday long-term scale model, Δ C g r i d represents the penalty cost for changes in purchased power; μ g r i d , t represents the unit penalty cost for changes in purchased power; Δ P g r i d , t represents the amount of change in purchased power; R E S represents the total benefit brought by fulfilling the energy storage capacity contract during this phase.

3.2.3. Intraday Short Time Scale Scheduling Phase

The operating power on short-term time scales is adjusted according to the scheduling on long-term time scales. This is achieved by modifying the purchased power and the curtailed wind and solar power, while introducing electric vehicle aggregators to mitigate power fluctuations during extended scheduling periods. The unidirectional charging and discharging characteristics of traditional energy storage systems limit their application in rapid bidirectional regulation. EVA, however, can mitigate rapid power fluctuations by flexibly adjusting load characteristics, and the objective function was established as shown in Equation (14):
F 2 , s h o r t = min C g r i d + C b e s s + Δ C e v + C a b a n R F R R F R = t = 1 T p R C ( t ) r C ( t ) + M ( t ) r M ( t ) λ F R n = 1 N max ( 0 , P n , t R U p R C ( t ) ) + max ( 0 , P n , t R D p R C ( t ) ) Δ C e v = t = 1 T n = 1 N μ n , t ( P n , t R U + P n , t R D ) 2
In the formula: F 2 , s h o r t is the objective function of the intraday short-term scale model, Δ C e v represents the penalty cost for changes in electric vehicle charging power, where N represents the number of electric vehicles, P n , t R U and P n , t R D , respectively, represent the upward and downward frequency power adjustments of electric vehicle n at time t, μ n , t represents the unit penalty cost for power changes, and R F R represents the total benefit brought by the dynamic frequency stabilisation contract during this phase.

3.3. Restrictive Condition

In order to address the constraints that distributed resource aggregators must satisfy during the two stages of day-ahead scheduling and intraday scheduling, this paper develops the following model Equations (15)–(21):

3.3.1. Purchased Power

P g r i d , t min P g r i d , t P g r i d , t max R g r i d , t d o w n P g r i d , t P g r i d , t 1 R g r i d , t u p
where P g r i d , t min , P g r i d , t max denote the minimum and maximum purchased power, respectively; R g r i d , t d o w n , R g r i d , t u p denote the upper and lower limits of the power purchase creep rate, respectively.

3.3.2. Purchased Power

0 < P l , t wind P l , max wind 0 < P f , t p v P f , max p v 0 < P s , t w a t e r P s , max w a t e r 0 < P o , t f i r e P o , max f i r e
where P l , t wind , P f , t p v , P s , t w a t e r , P o , t f i r e are the outputs of wind, photovoltaic, hydroelectric, and thermal power plants, respectively, at the moment of time; and P l , max wind , P l , max pv , P l , max water , P l , max fire are the maximum outputs, respectively.

3.3.3. Wind and Light Reductions

μ a b a n P a b a n min P a b a n , t μ a b a n P a b a n max
where μ a b a n indicates whether the wind and light abandonment flag, P a b a n min , P a b a n max indicates the minimum and maximum power for wind and light abandonment, respectively.

3.3.4. Energy Storage Equipment

The energy storage device operator enters into an energy storage capacity contract with the grid operator, and therefore the device operates to satisfy the charge/discharge mutual exclusion constraints, the power constraints, and the state-of-charge constraints as follows:
0 μ m , t c + μ m , t d 1 μ m , t c P m c , min P m , t c μ m , t c P m c , max μ m , t d P m d , min P m , t d μ m , t d P m d , max S O C t = S O C t 1 + η c P m , t c P m , t d η d S O C min S O C t S O C max S O C t S O C min + Q r e s e r v e ( t ) S O C 0 = S O C T
where μ m , t c , μ m , t d denotes a charging and discharging flag of the energy storage device m, respectively, and if the energy storage device is in a charging state, it is μ m , t c = 1 , μ m , t d = 0 , and conversely if it is in a discharging state, it is μ m , t c = 0 , μ m , t d = 1 ; P m , t c , P m , t d denotes the charging and discharging power at the t moment, respectively; P m c , m i n , P m c , m a x , P m d , m i n , P m d , m a x denotes the charging and discharging minimum and maximum power, respectively; S O C t denotes the loading state of the t moment; S O C m i n , S O C m a x denotes the energy storage device’s minimum and maximum capacity; η c , η d denote the charging and discharging efficiency; S O C 0 , S O C T denote the initial and final state capacity of the energy storage device, respectively.

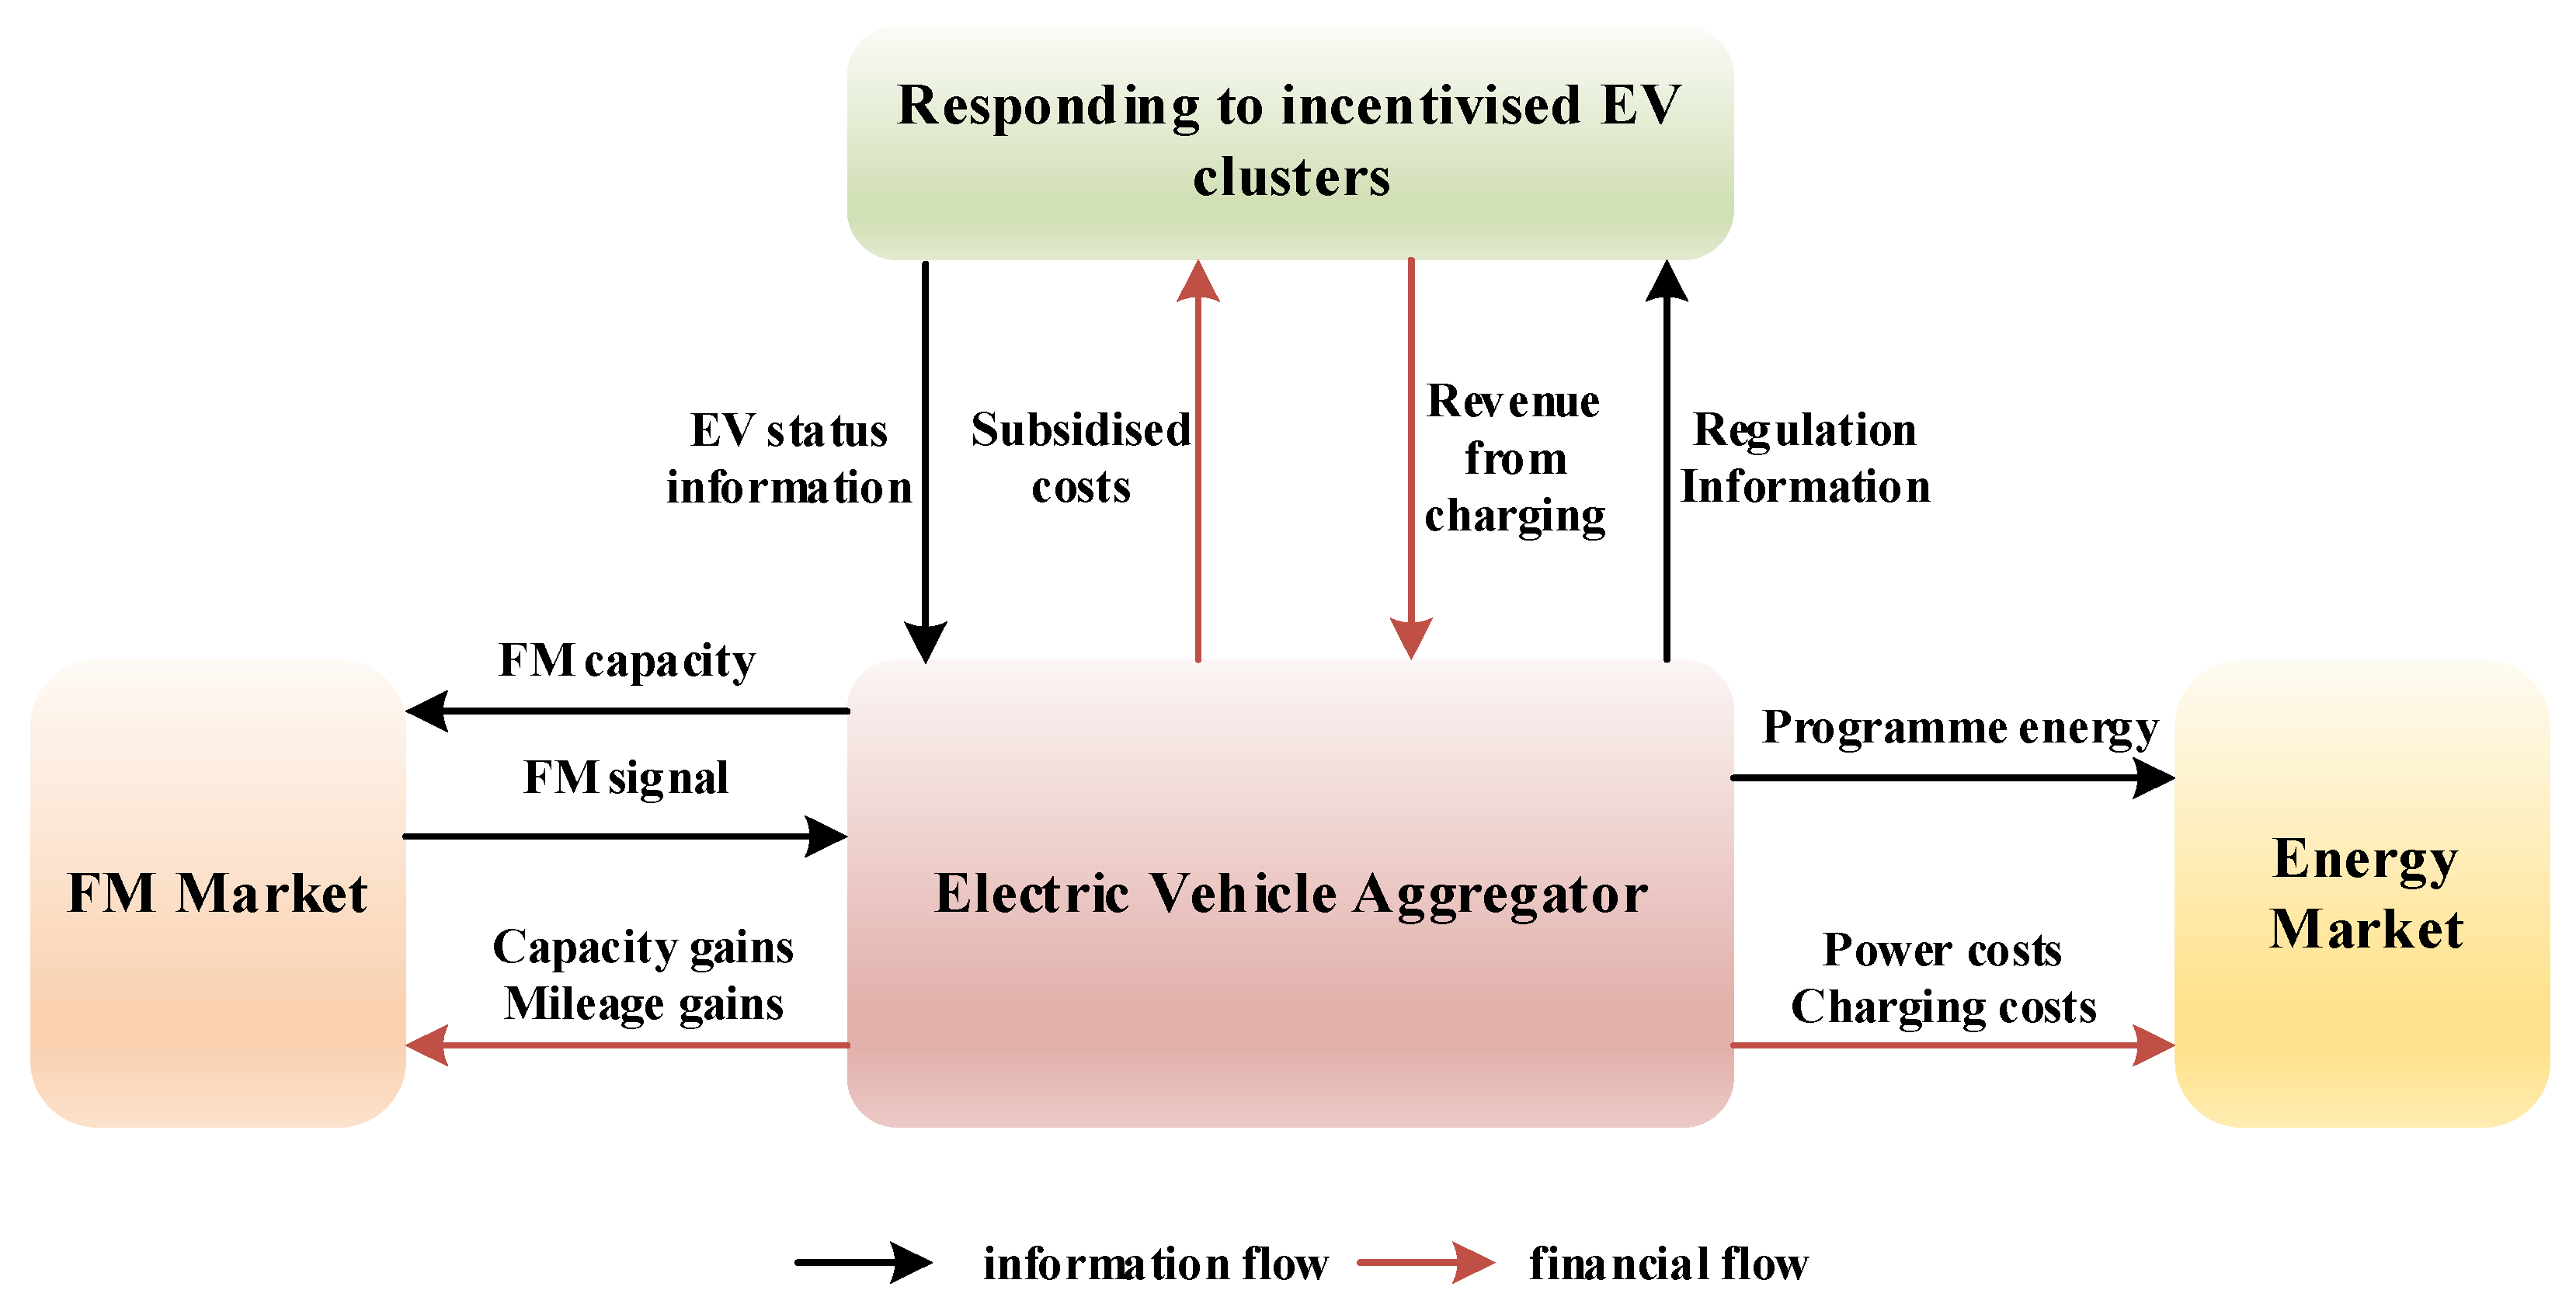
3.3.5. Electric Vehicle Aggregators

The EV aggregator enters into a dynamic frequency stabilisation contract with the grid operator, which also needs to satisfy the charging and discharging mutual exclusion constraints, the power constraints, and the state-of-charge constraints during operation as follows:
S n , t e v = S n , t 1 e v + η n c P n , t c P n , t d η n d S n e v , min S n , t e v S n e v , max 0 P n , t c P n c , max P n , t c + p R C ( t ) P n c , max 0 P n , t R U p R C ( t ) 0 P n , t R D p R C ( t ) 0 P n , t R U + M p b i n 1 n ( t ) M 1 0 P n , t R D + M p b i n 2 n ( t ) M 1 p b i n 1 n ( t ) + p b i n 2 n ( t ) 1
where S n , t e v denotes the storage power of the n th EV at the t moment; S n e v , m i n , S n e v , m a x denote the minimum and maximum storage power; η n c , η n d denote the charging and discharging efficiency; P n , t c , P n , t d denote the charging and discharging power; P n c , m a x denotes the maximum charging power before the day, and the EV aggregator quotes the remaining capacity based on the charging plan before the day, so the sum of the charging plan before the day. The sum of the capacity and the committed capacity should not exceed the maximum charging power of the EV aggregator at the current moment; p b i n 1 n ( t ) and p b i n 2 n ( t ) are auxiliary binary variables, and M is a penalty factor, so that the EV can only offer three FM scenarios: only upward FM power; only downward FM power; and neither upward FM power nor downward FM power.

3.3.6. Users

Electricity consumers and the grid operator sign a flexible energy efficiency response contract, both of which need to satisfy rigid load constraints, response power constraints, and experience valuation constraints during the day-ahead scheduling phase as follows:
P t L , D R P t 1 L , D R P r a m p L , D R 0 P t L , D R P t L , o r i P t L , r i g i d P t L , c o n = P t L , D R + P t L , r i g i d 0 P t L , D R P max L , D R t = 1 T P t L , D R P t a t a l L , D R
where P r a m p L , D R is the maximum rate of change in load curtailment; P m a x L , D R is the maximum curtailment allowed by the user at the t moment; and P t a t a l L , D R is the cumulative minimum curtailment agreed in the contract.

3.3.7. DRA Internal Power Balance Constraint
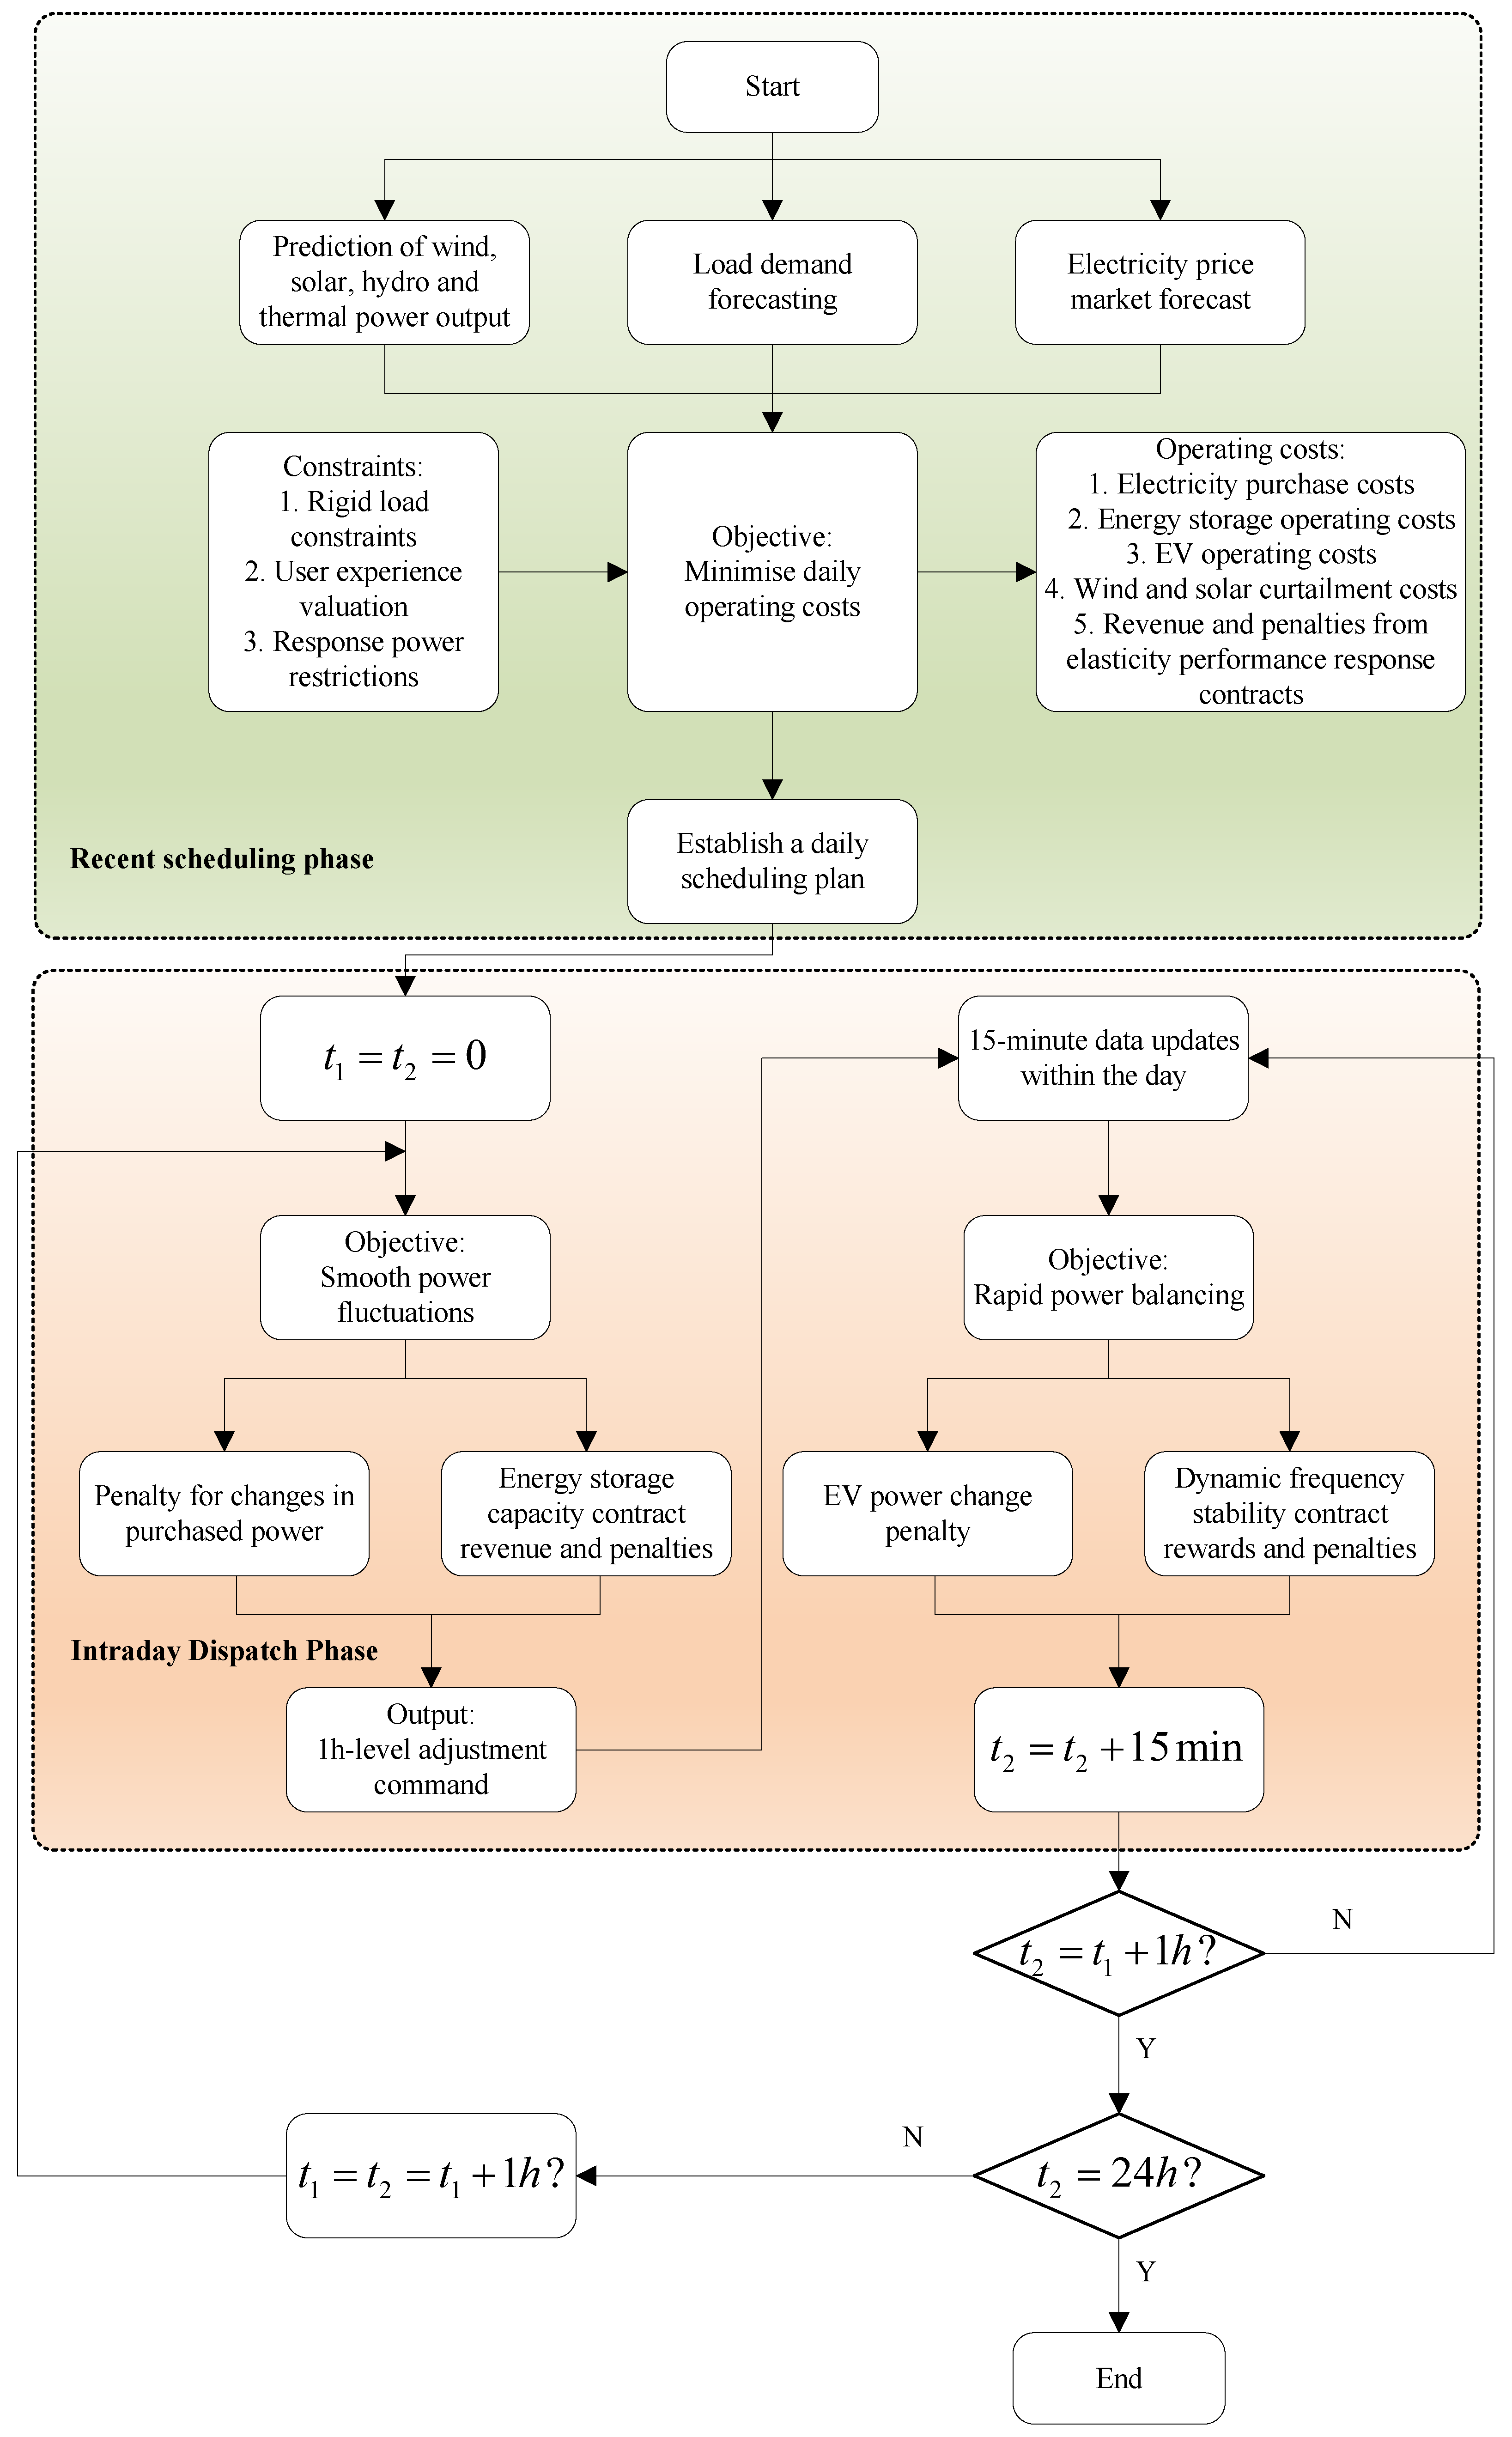
For any moment t is satisfied:
P g r i d , t + P l , t w i n d + P f , t p v + P s , t w a t e r + P o , t f i r e = P m , t c P m , t d + P n , t c + P n , t R U P n , t R D + P a b a n , t

4. Solution Process

This paper investigates a two-stage, multi-timescale optimisation scheduling model for a wind-solar-hydro-thermal integrated energy system. The day-ahead scheduling is economically oriented, while the intraday scheduling focuses on real-time stability. Through robust modelling, hierarchical control, and multi-energy complementarity, the model achieves efficient, economical, and stable operation. In the day-ahead scheduling phase, the time scale is a 24 h cycle with a resolution of 1 h. The objective is to determine the economically optimal plan based on forecast data (generation output of distributed power generation units and user-side load) to specify unit start/stop operations and demand-side resource allocation. In the intraday scheduling phase, it is divided into long-term scheduling and short-term scheduling, with a time scale of a 1 h rolling window and a resolution of 15 min. The objective is to influence the frequency regulation power of energy storage devices and electric vehicle aggregators through contract responses, correct the deviation from the day-ahead plan, smooth out real-time power fluctuations, and ensure dynamic supply–demand balance. The solution flowchart for this paper is shown in Figure 6 below:

5. Case Study Analysis

5.1. Model Parameters

To validate the superiority of the aforementioned model, this paper references the design parameters of a pumped-storage power plant in Gansu Province and local electric vehicle ownership statistics to better reflect actual on-site data. Additionally, it references the actual electricity generation and load data from a single day in a specific location in Gansu Province and predicts the electricity generation and load for the following day, as shown in Figure 7. The detailed parameters of each device and contract in the example system are listed in Table 1. This paper constructs mathematical models and constraints based on the Python version 3.12 (64-bit). platform in an environment with an Intel Core i7-GTX1050 CPU (Qingdao Thunderobot Technology Co., Ltd., Qingdao, China) and a clock speed of 1.8 GHz, and uses the scipy solver for the solution.

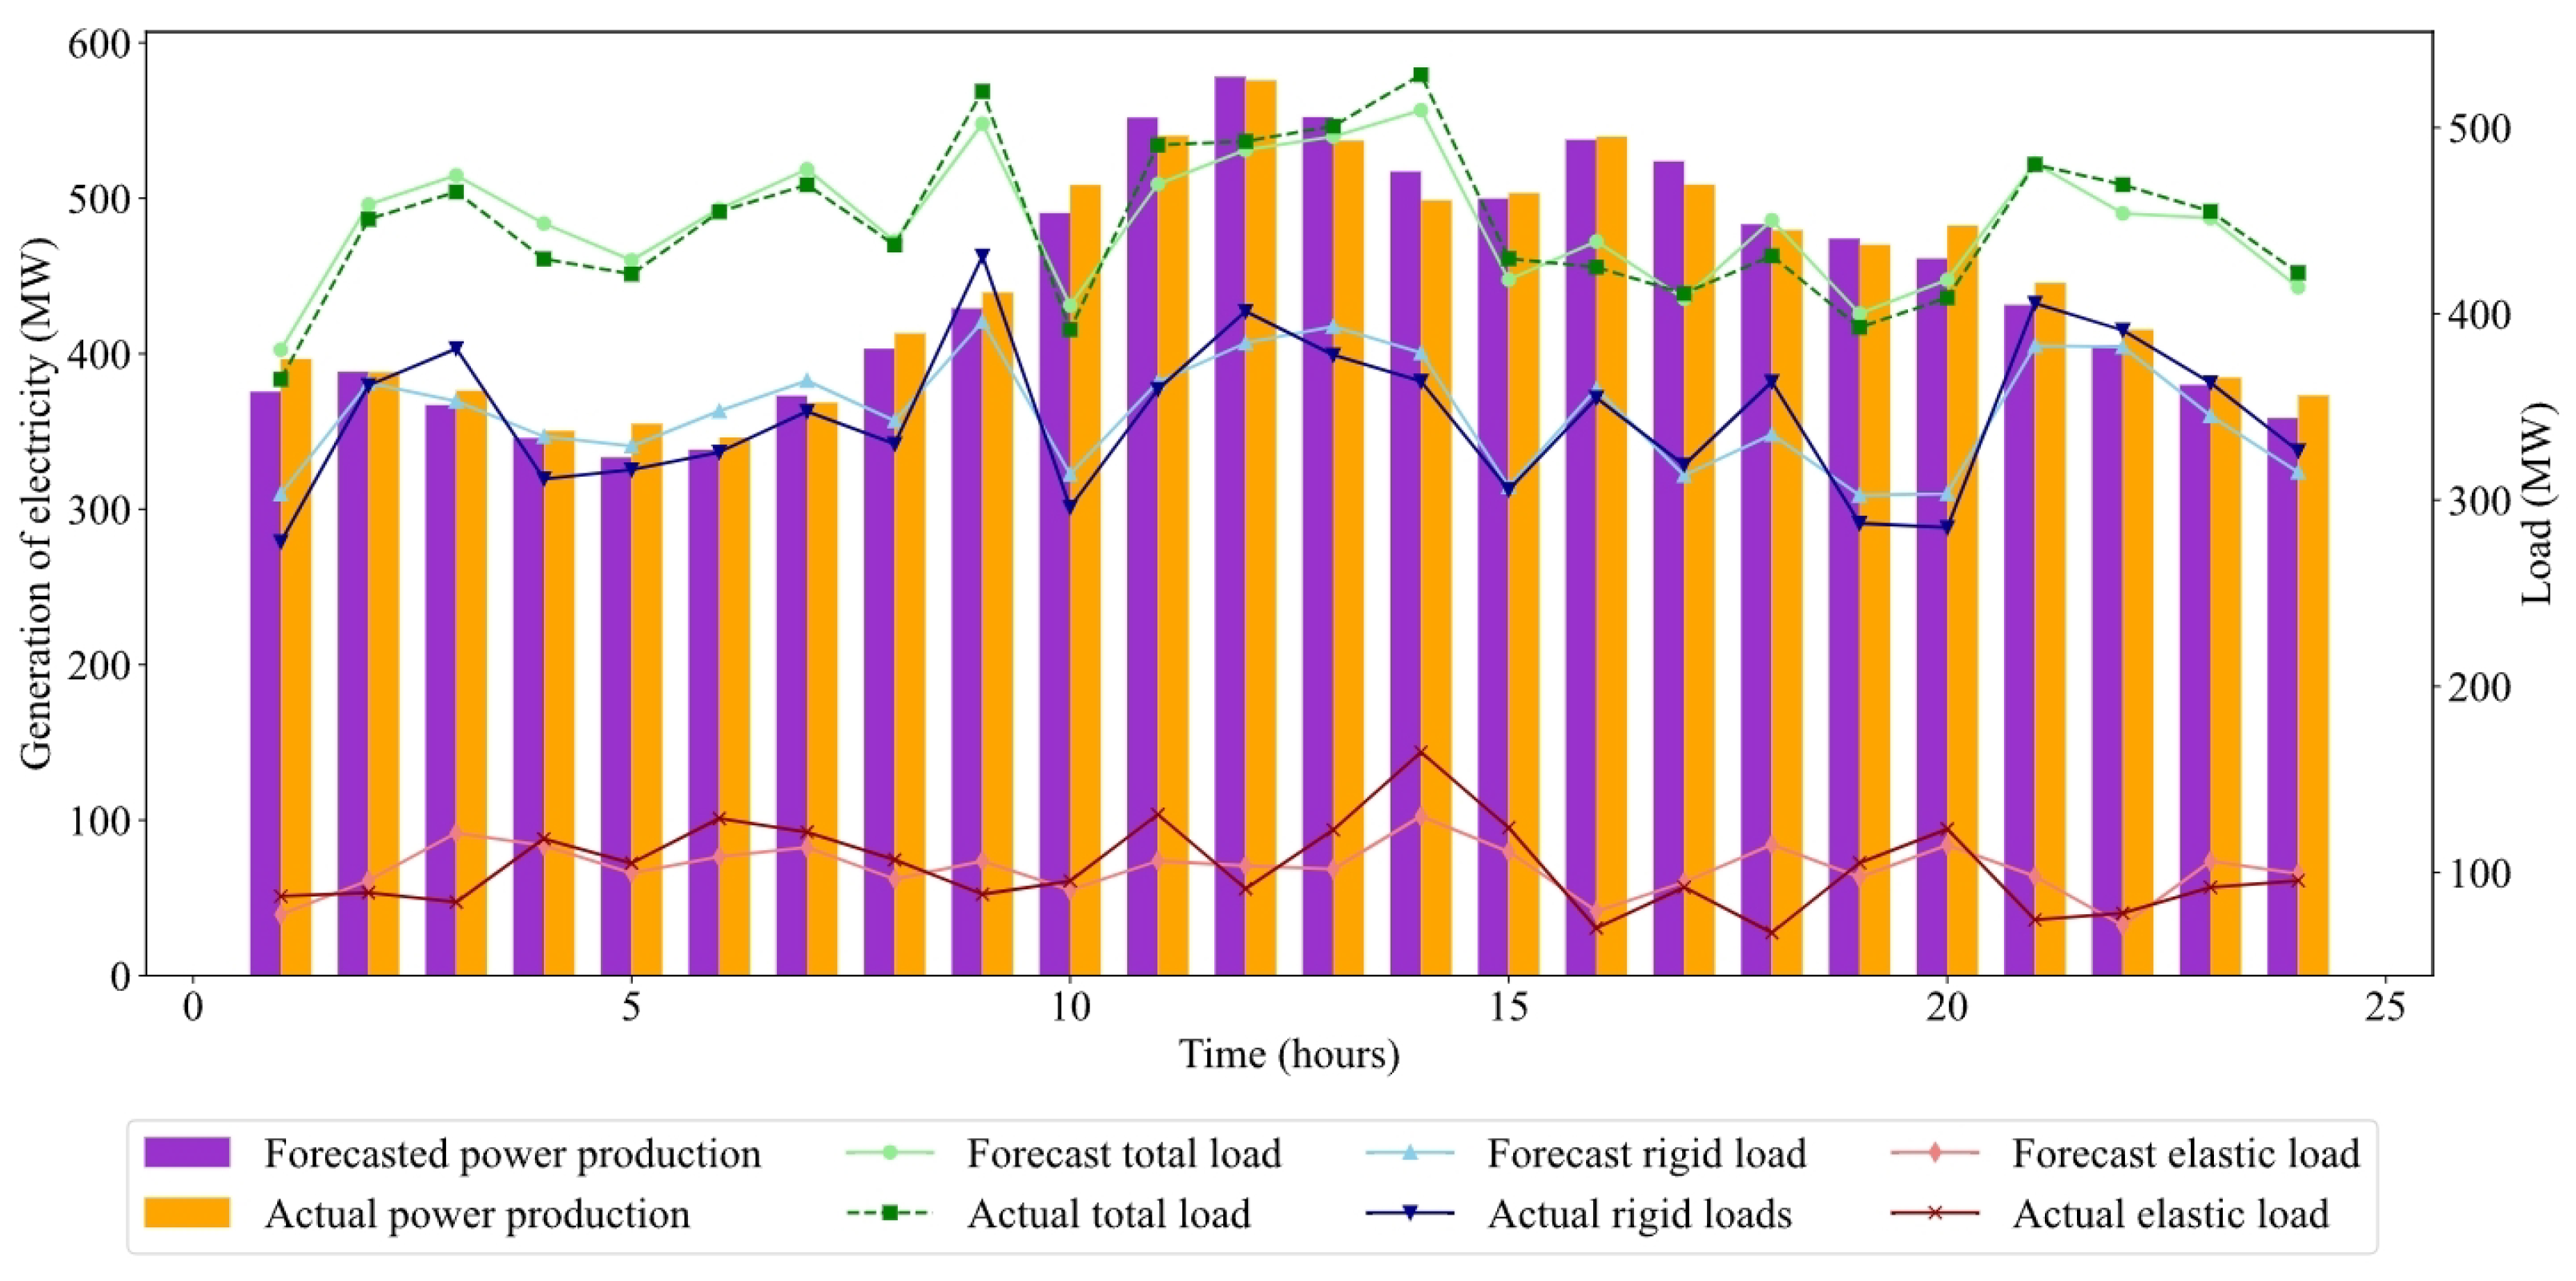
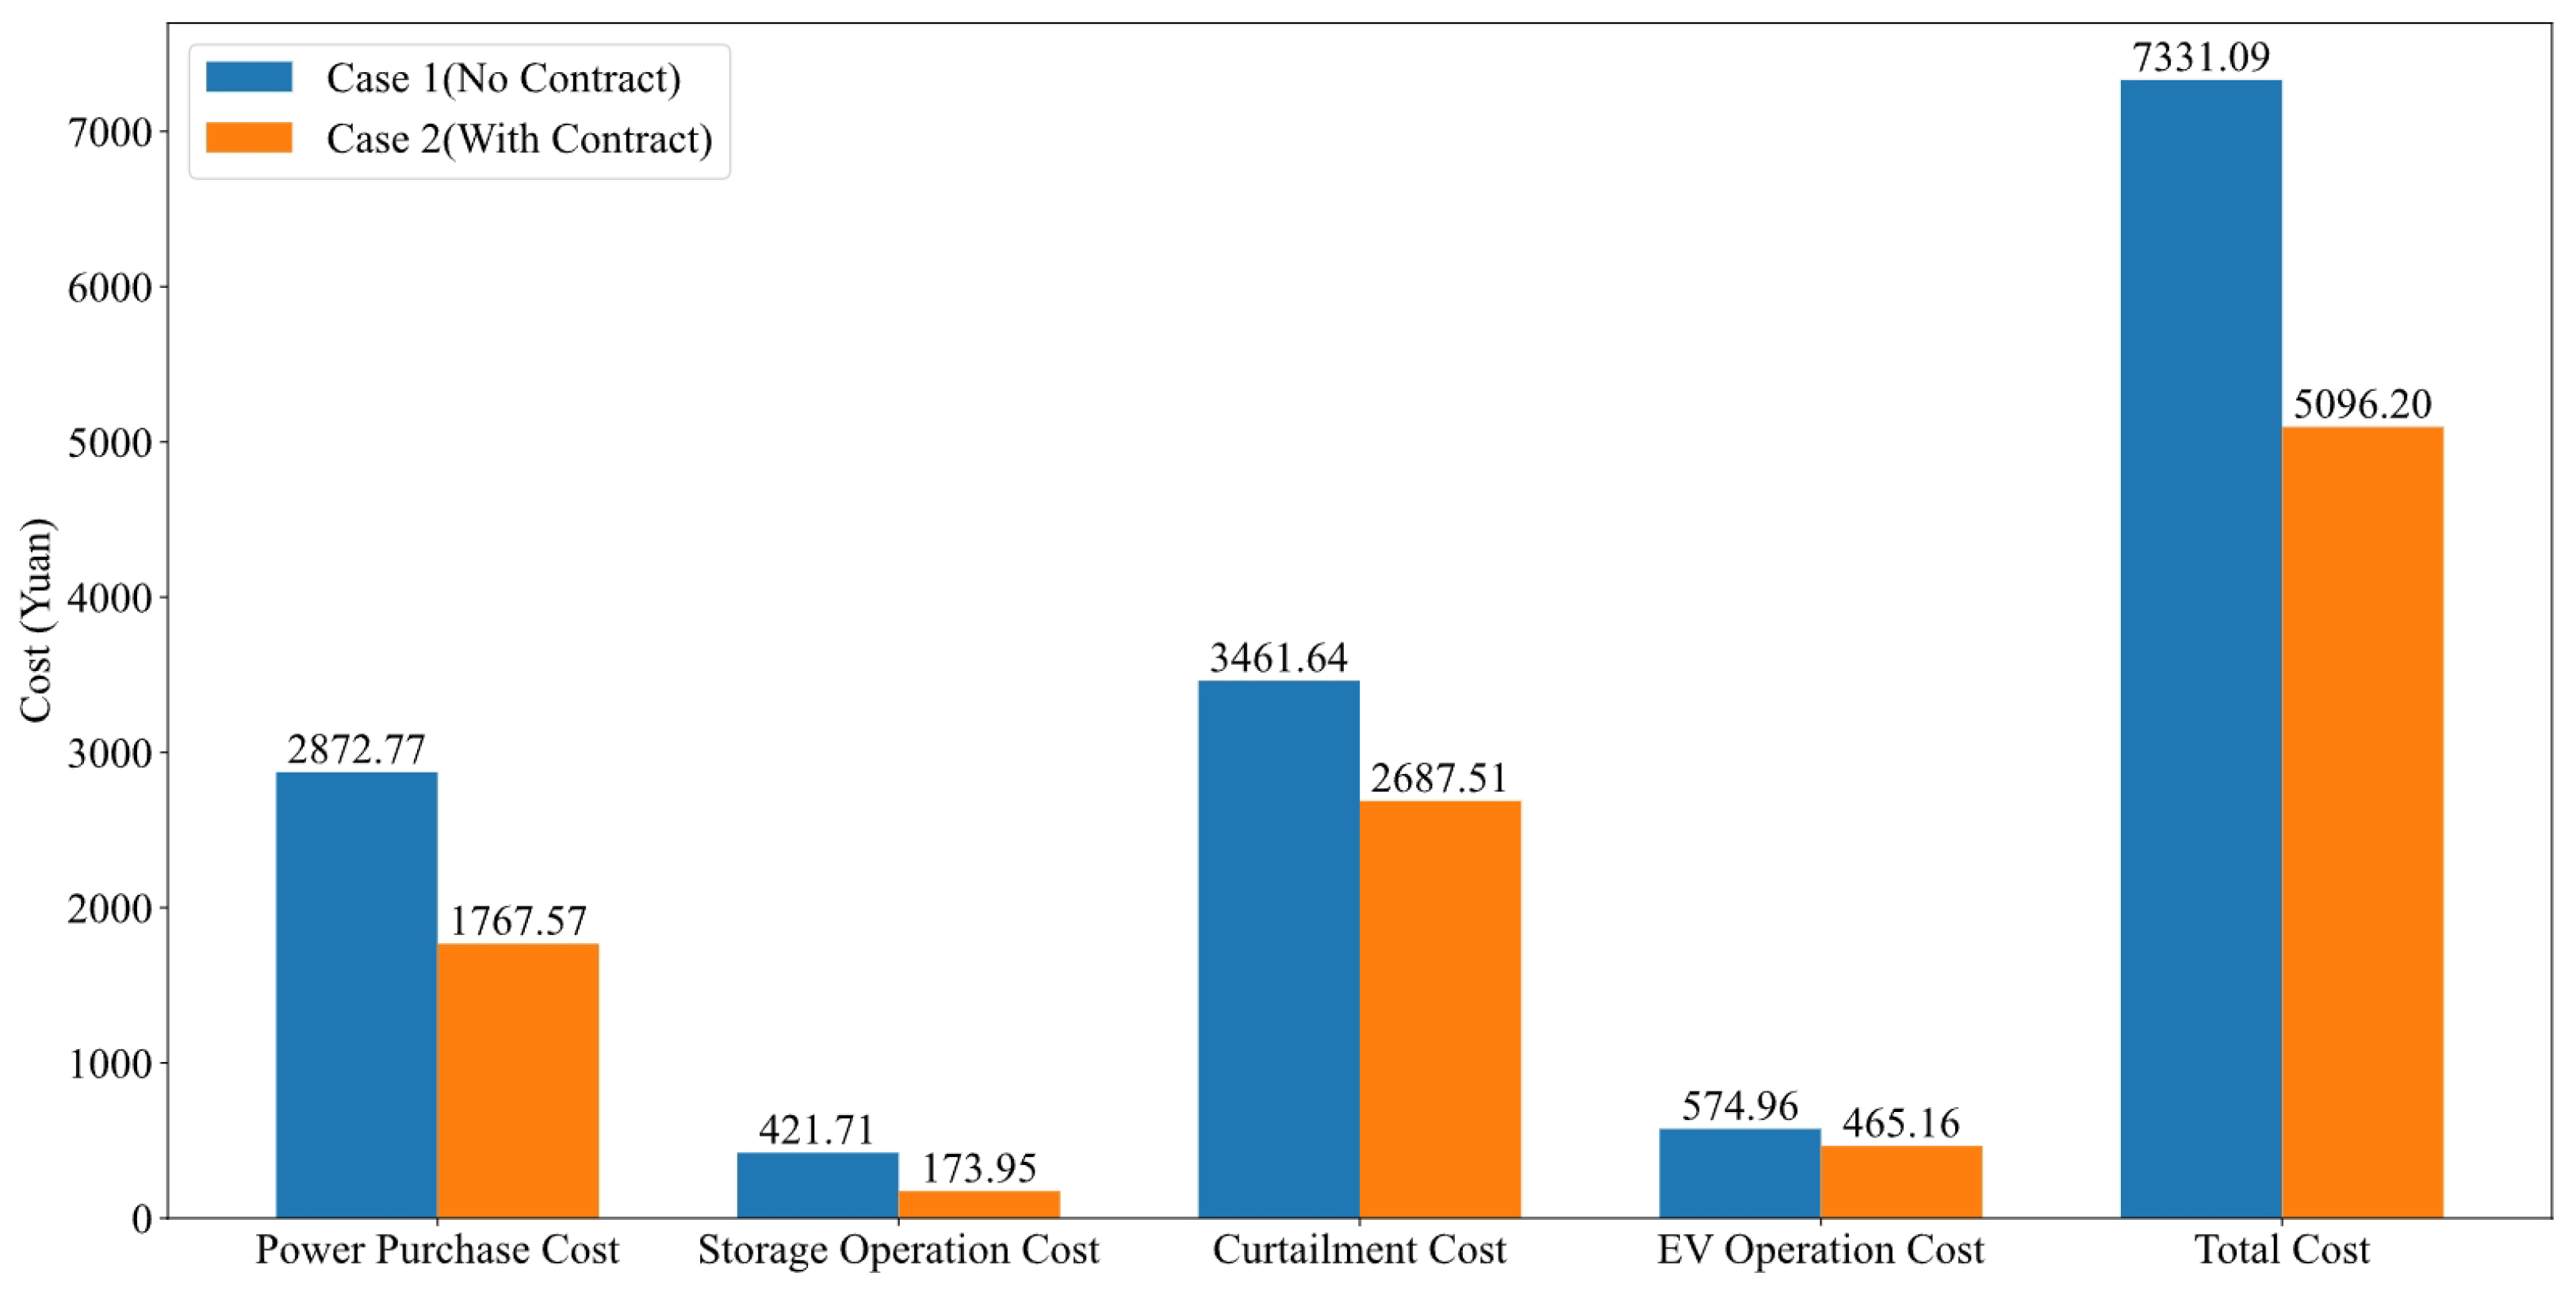
5.2. Optimisation Results and Analysis

This paper aims to verify whether the addition of three types of contracts can reduce electricity purchase costs and volatility. Therefore, two scenarios are set up as follows: Scenario 1 considers only the minimisation of day-ahead costs without contract constraints; Scenario 2 adds the effects of energy storage capacity contracts, elasticity efficiency contracts, and dynamic frequency stability contracts to Scenario 1. This paper examines the utility of contracts from two perspectives. First, it compares traditional demand response where electricity prices are increased during peak load periods and decreased during off-peak periods to incentivise users to shift demand with the elasticity-based energy efficiency response contracts discussed in this paper, which incorporate user electricity consumption preferences into traditional demand response contracts. Second, it compares changes in electricity purchase power between scenarios with and without contracts.

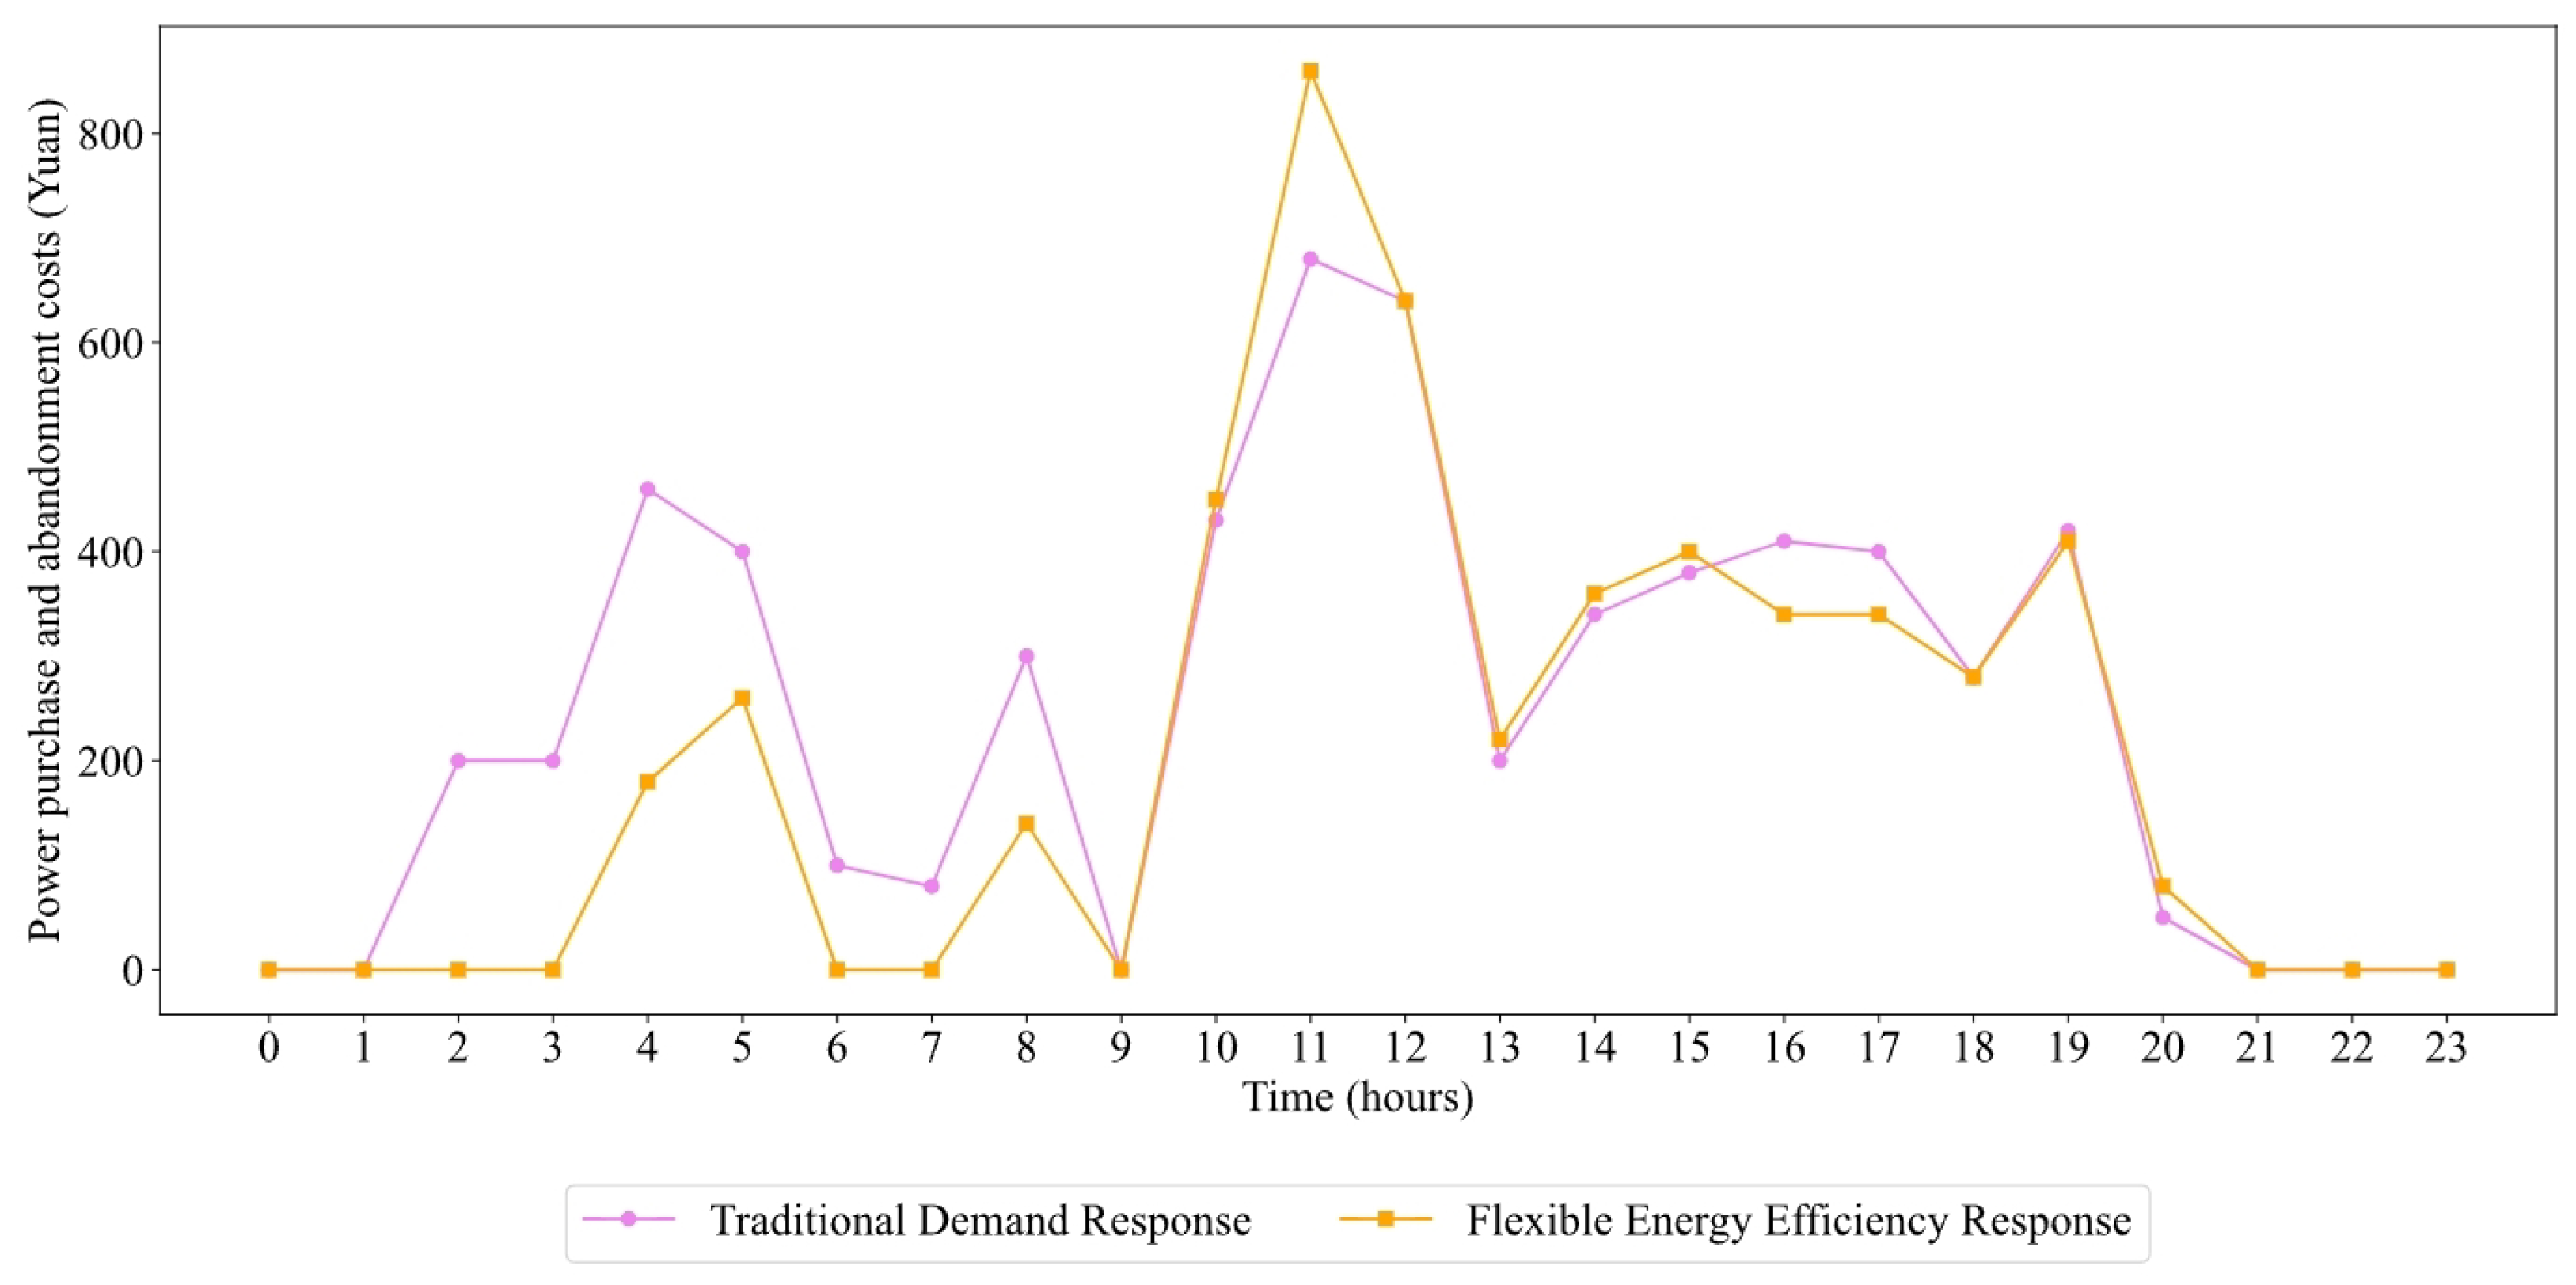
5.2.1. Operating Cost Analysis

In recent dispatching operations, traditional demand response has merely relied on adjusting electricity prices to achieve peak shaving and valley filling, without considering users’ electricity consumption preferences. The elastic energy efficiency response contract mentioned in this paper addresses this shortcoming by replacing the traditional fixed compensation tariff with a dynamic compensation tariff, incentivising higher compensation rates for larger load volumes. As shown in Figure 8, the contract results in a significant reduction in electricity purchase costs and curtailment penalty costs. This is because, during peak periods, incentive measures on the user side are more effective, leading to better peak shaving results and reduced costs for purchasing electricity from the grid; during off-peak periods, more users are encouraged to consume electricity at that time, resulting in better valley filling effects and reduced curtailment costs. However, an abnormal phenomenon occurs during the periods from 10:00 to 15:00 and 20:00 to 21:00. This is because, under the elasticity-based efficiency response mechanism, the compensation tariff is linked to the incentivised load volume. During these exceptional peak periods, users aggressively reduce their load volume to obtain higher compensation tariffs, resulting in excess electricity generation that must be curtailed, hence the phenomenon.
As shown in Figure 9, the superiority of the elastic energy efficiency response contract in load shifting at the user side is more evident. It can be observed that, when electricity prices are low, the load usage under the elastic energy efficiency response is the highest, followed by the traditional demand response, with the lowest load usage being the original load without user-side response. When electricity prices rise, the load usage under the elastic energy efficiency response decreases rapidly to the lowest among the three. It can be concluded that, under the conditions of meeting user preferences and implementing dynamic compensation electricity prices, peak shaving and valley filling becomes more pronounced and achieves the best results.
As shown in Figure 10, the comparison of various cost items under two scenarios—considering contracts and not considering contracts—is presented in the day-ahead scheduling process. From the above data and bar chart comparison, it can be observed that the power purchase cost has decreased by 38.47%, attributed to the dynamic incentives provided by the elasticity performance response contract during the day-ahead phase, which guide users to shift peak loads and reduce market power purchases during high-price periods, thereby achieving the most direct cost savings. The operating costs of energy storage equipment decreased by 58.75%, as the load curve became smoother, reducing the number of deep charge/discharge cycles for energy storage. This, in turn, suppressed the daily battery operational losses and related maintenance costs at the day-ahead planning level. The costs associated with curtailed power penalties decreased by 22.36%, as more balanced load forecasting and response enabled renewable energy output to be more fully utilised, thereby reducing penalties for curtailed wind and solar power. The operational costs of electric vehicle aggregators decreased by 19.10%, as the flexible response adjusted the EV’s pre-day charging curve, reducing charging loads during high-price periods and thereby lowering electricity purchase and charging operational costs. In summary, this demonstrates that the contract plays a certain role in reducing operational costs in pre-day scheduling.

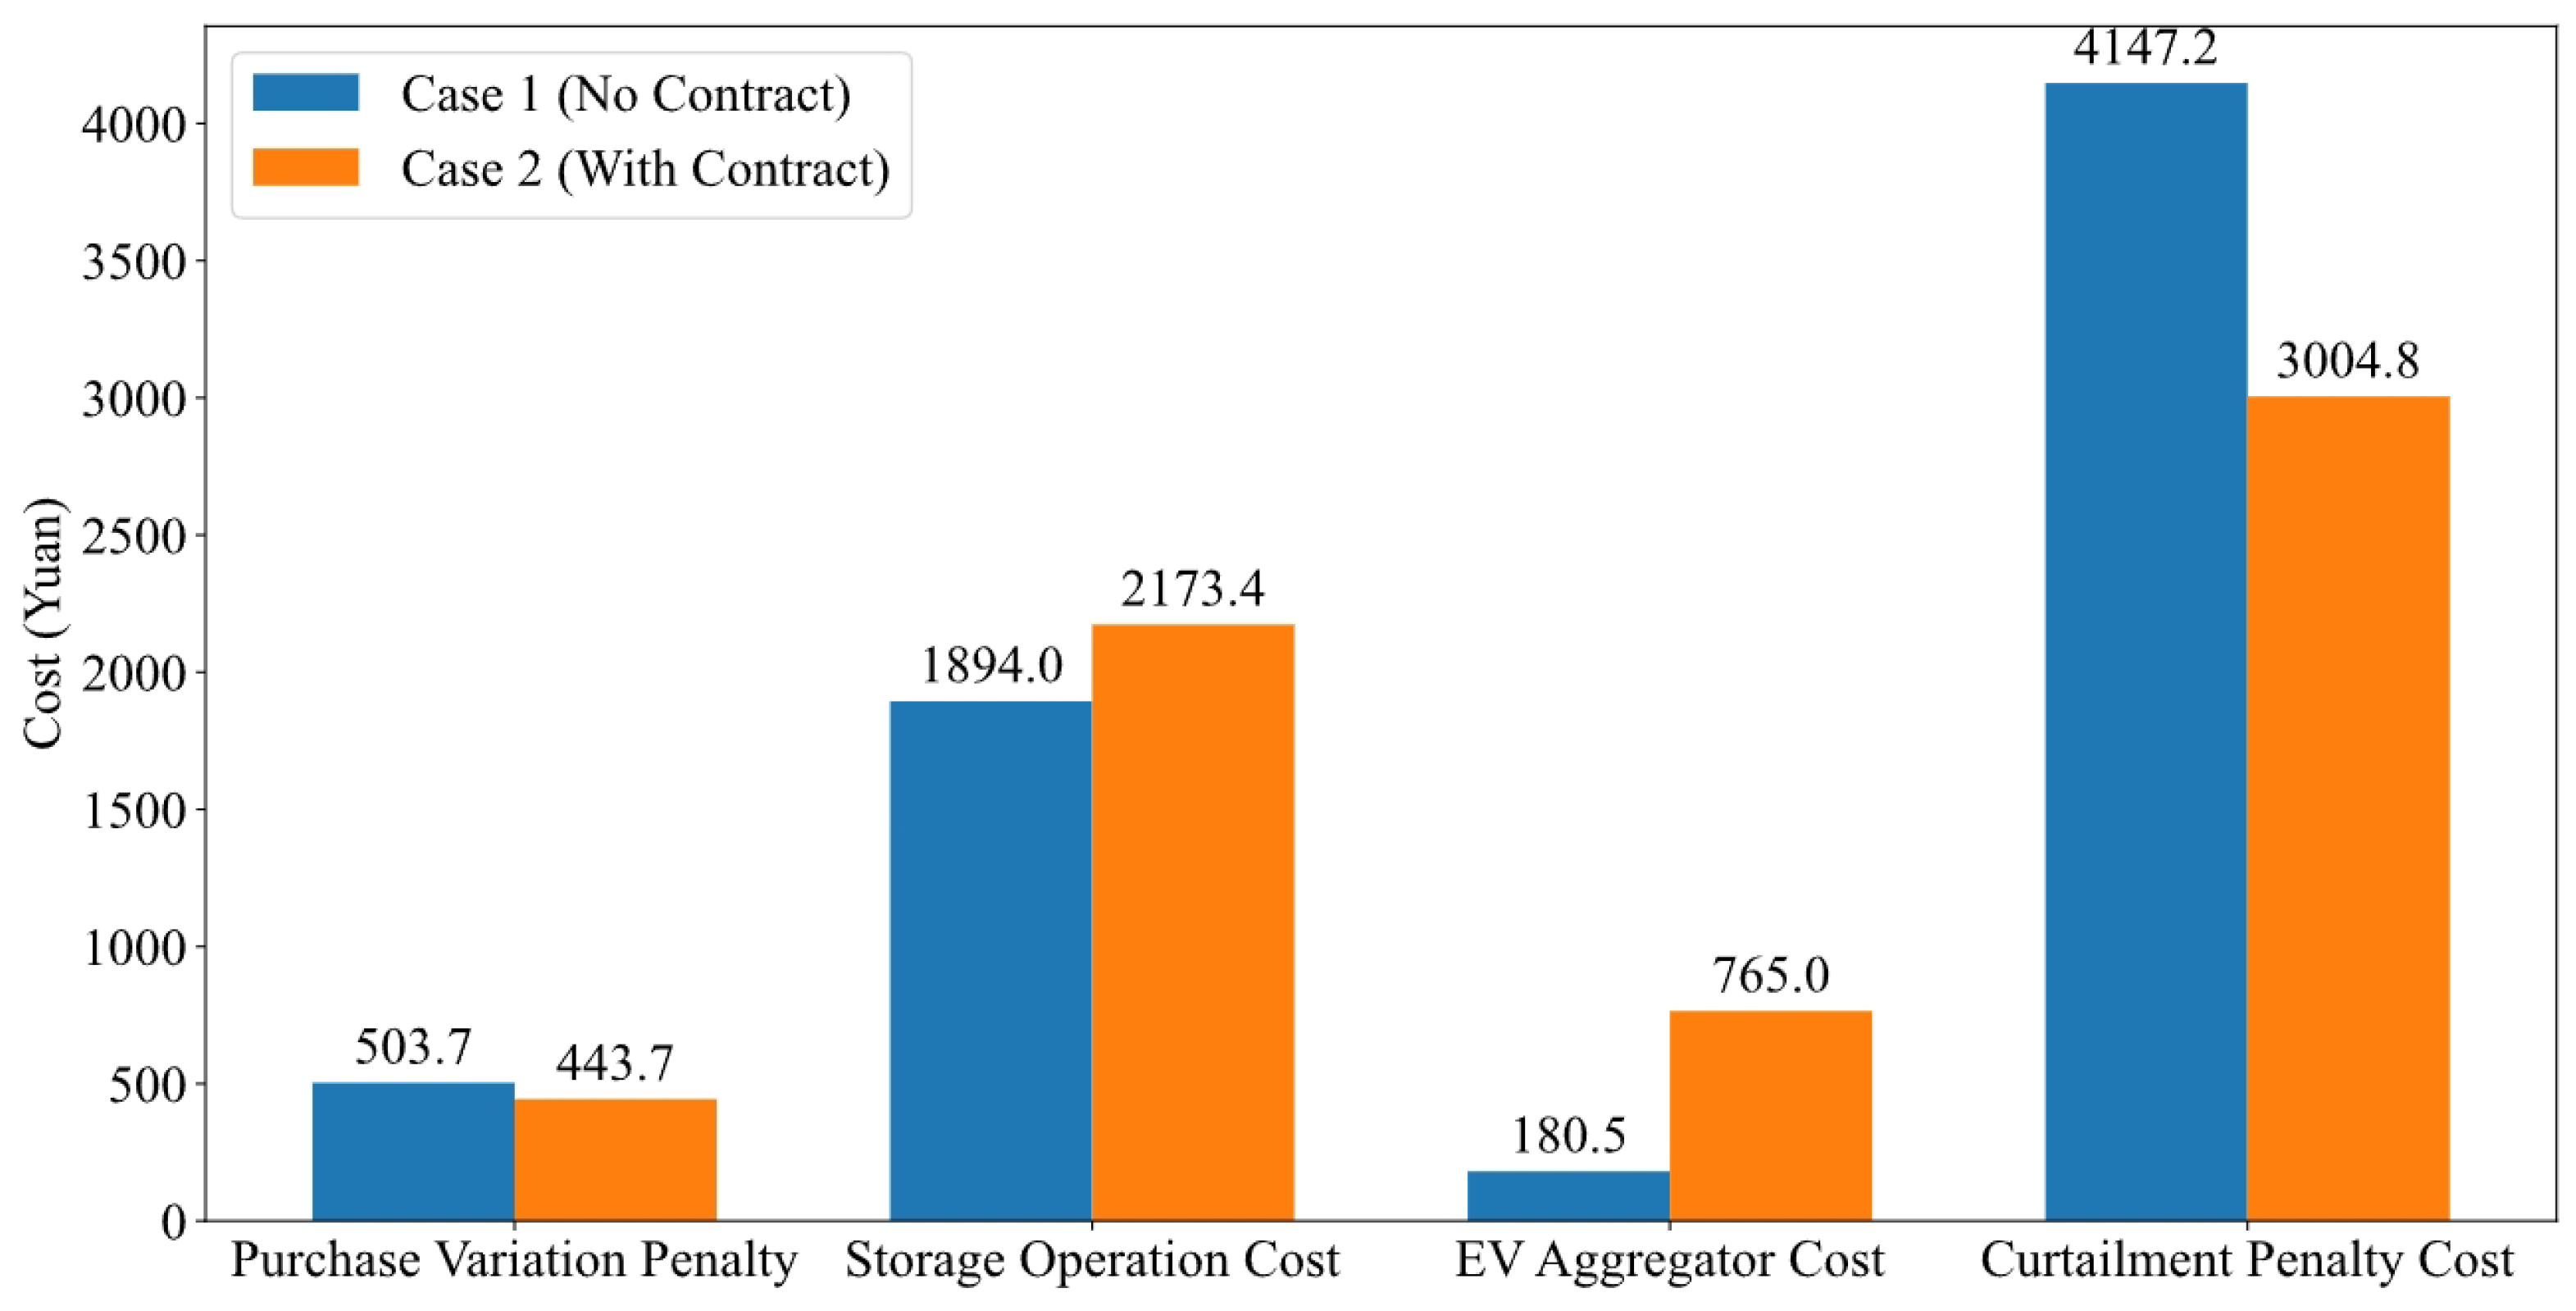
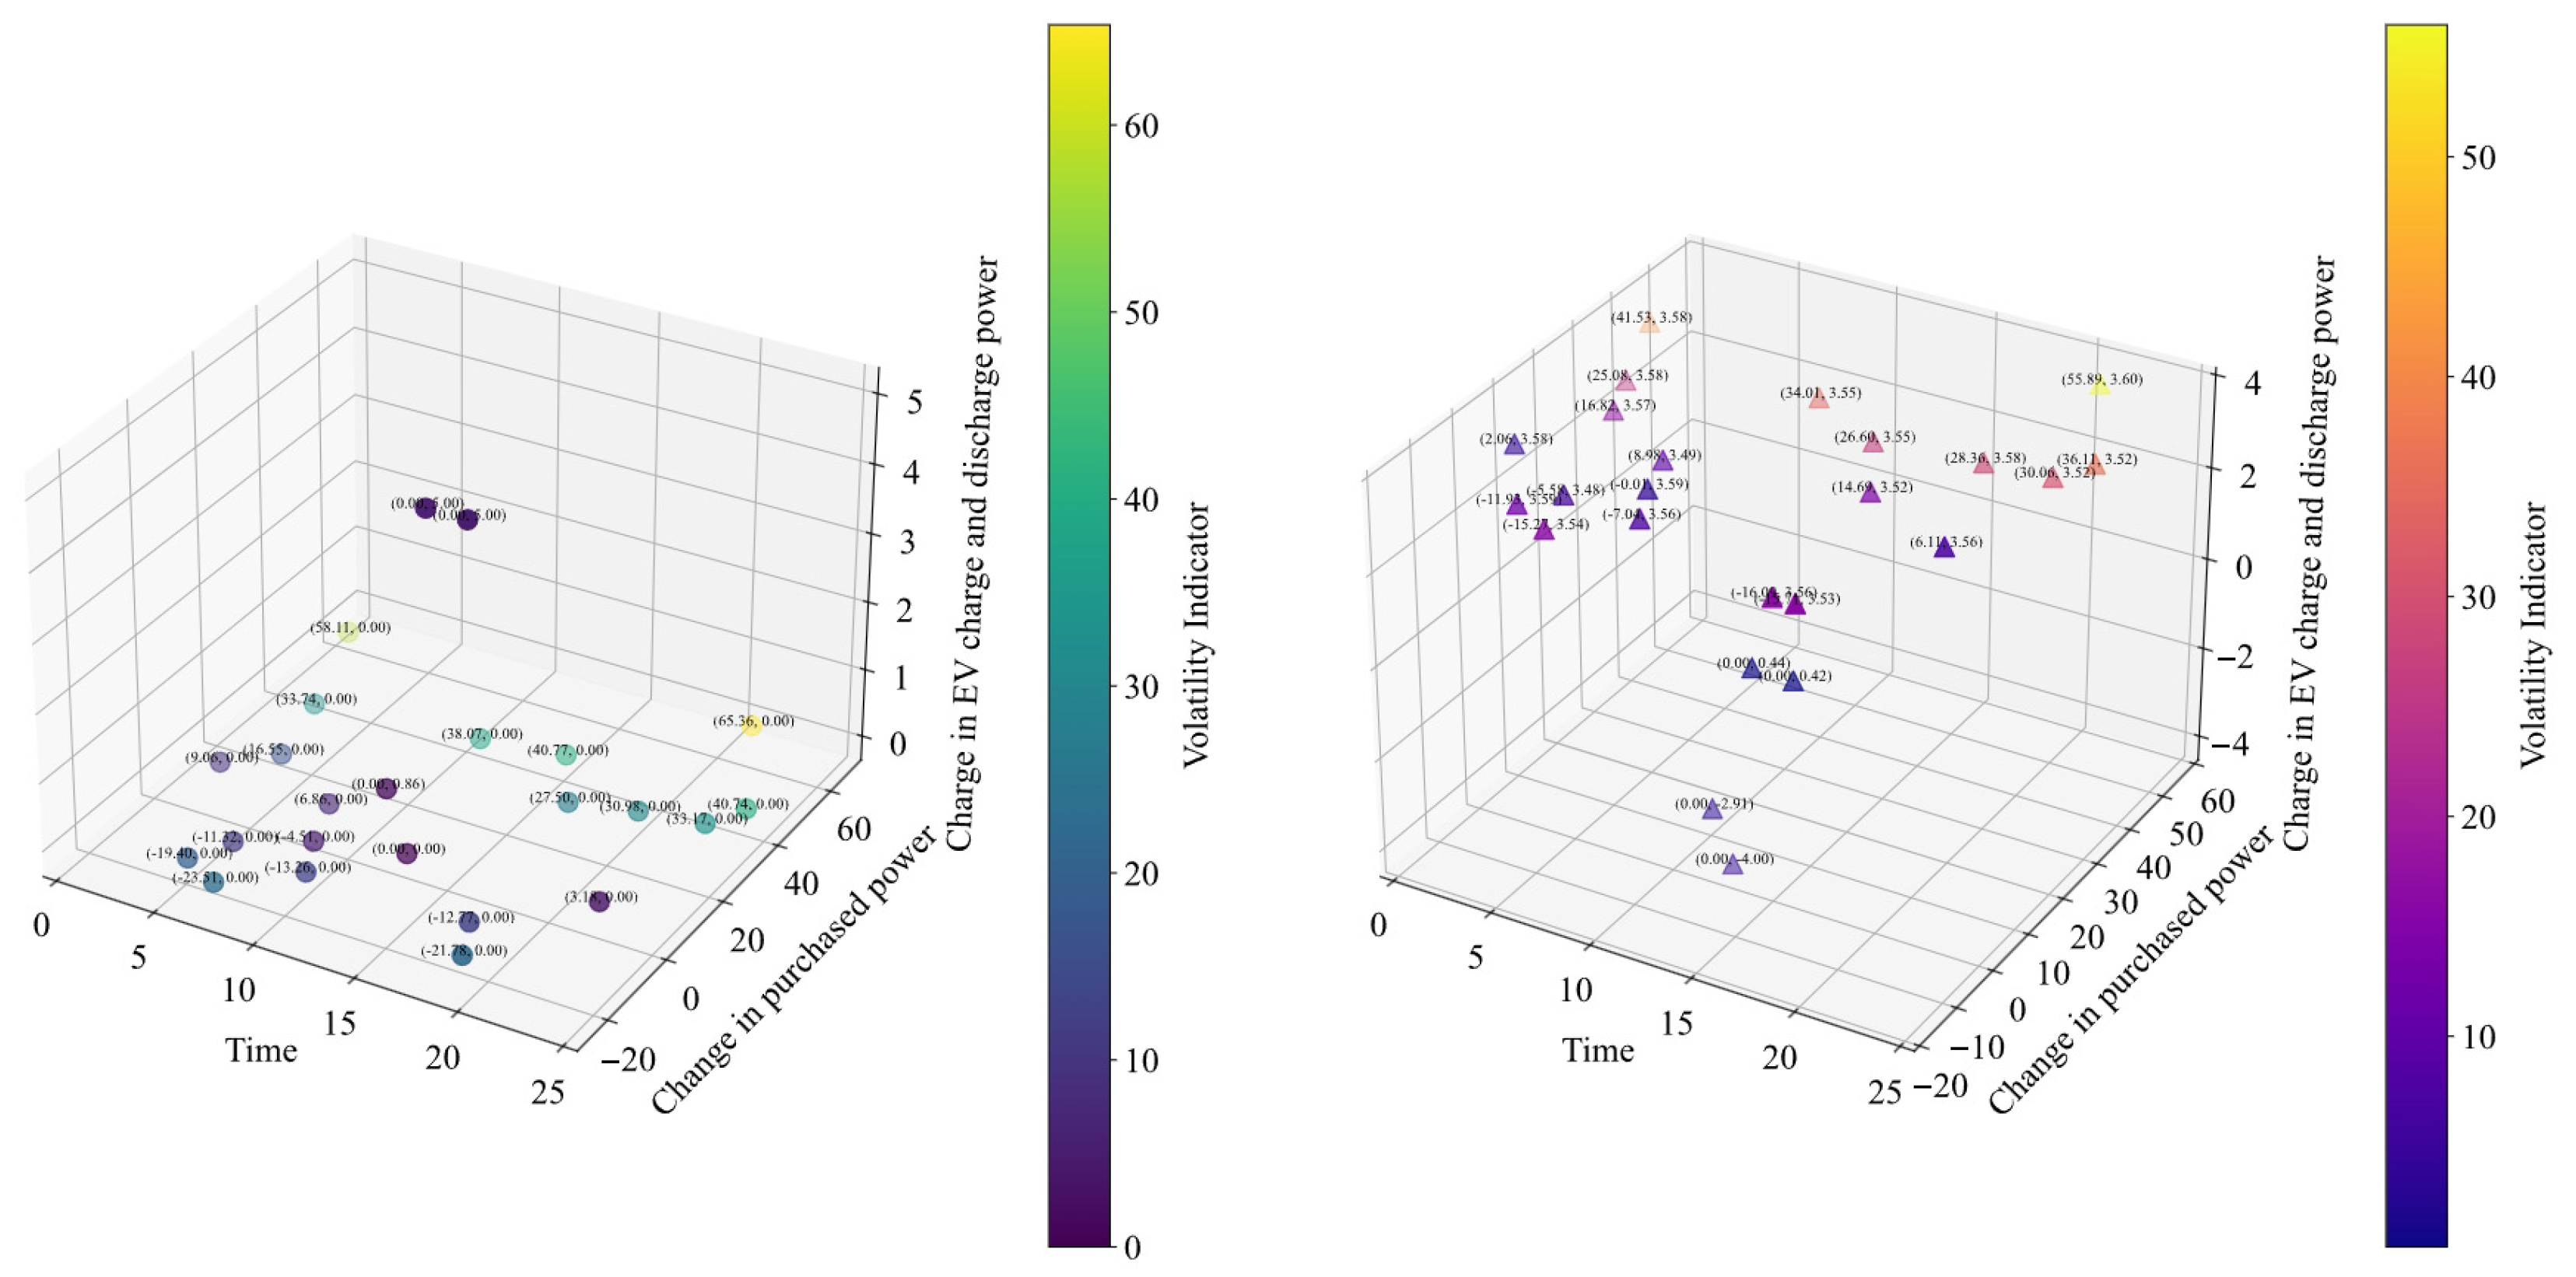
5.2.2. Frequency Modulation Results Analysis

In intraday dispatch, it is necessary to verify whether the system’s volatility decreases after incorporating energy storage capacity contracts and dynamic frequency regulation contracts. First, by using the predicted power generation and load levels from the day-ahead dispatch, the power purchase requirement from the grid can be calculated in advance. This is then compared with the power purchase requirement from the grid in the intraday dispatch. If the difference between the two is small, it indicates that the system’s volatility is low. By comparing the cost items in Figure 11, it can be observed that the operational cost of the energy storage equipment in Case 1 is lower than that in Case 2. This is because the energy storage capacity contract pre-specifies reserving 10 MWh to participate in primary frequency regulation, meaning that, during power balancing, the system maintains a state where charging is not fully completed and discharging is not fully depleted, resulting in slightly lower operational costs compared to Case 1. As shown in the figure above, under the contract’s influence, the penalty cost for power purchase changes decreased by 12.41%, the penalty cost for EV power changes increased by 76.41%, and the total cost decreased by 5.03%. This indicates that the dynamic frequency stabilization contract sacrifices EV power change costs to achieve greater system stability.
As shown in Figure 12 below, the simulation experiment illustrates the relationship between power purchase changes, EV charging and discharging power, and each time point in a three-dimensional space. It can be concluded that, without considering the contract’s influence, only three time points in a day see changes in EV power, and these changes are minimal. In the right figure, it can be observed that, at each time point, EVs adjust their charging and discharging power to reduce power purchase changes from the grid. Finally, as shown in the fluctuation indicator diagram in the figure, the number of lighter-coloured small spheres in the left diagram is significantly greater than the number of lighter-coloured small triangles in the right diagram, proving that the contract plays a certain role in reducing system fluctuations during intraday scheduling.

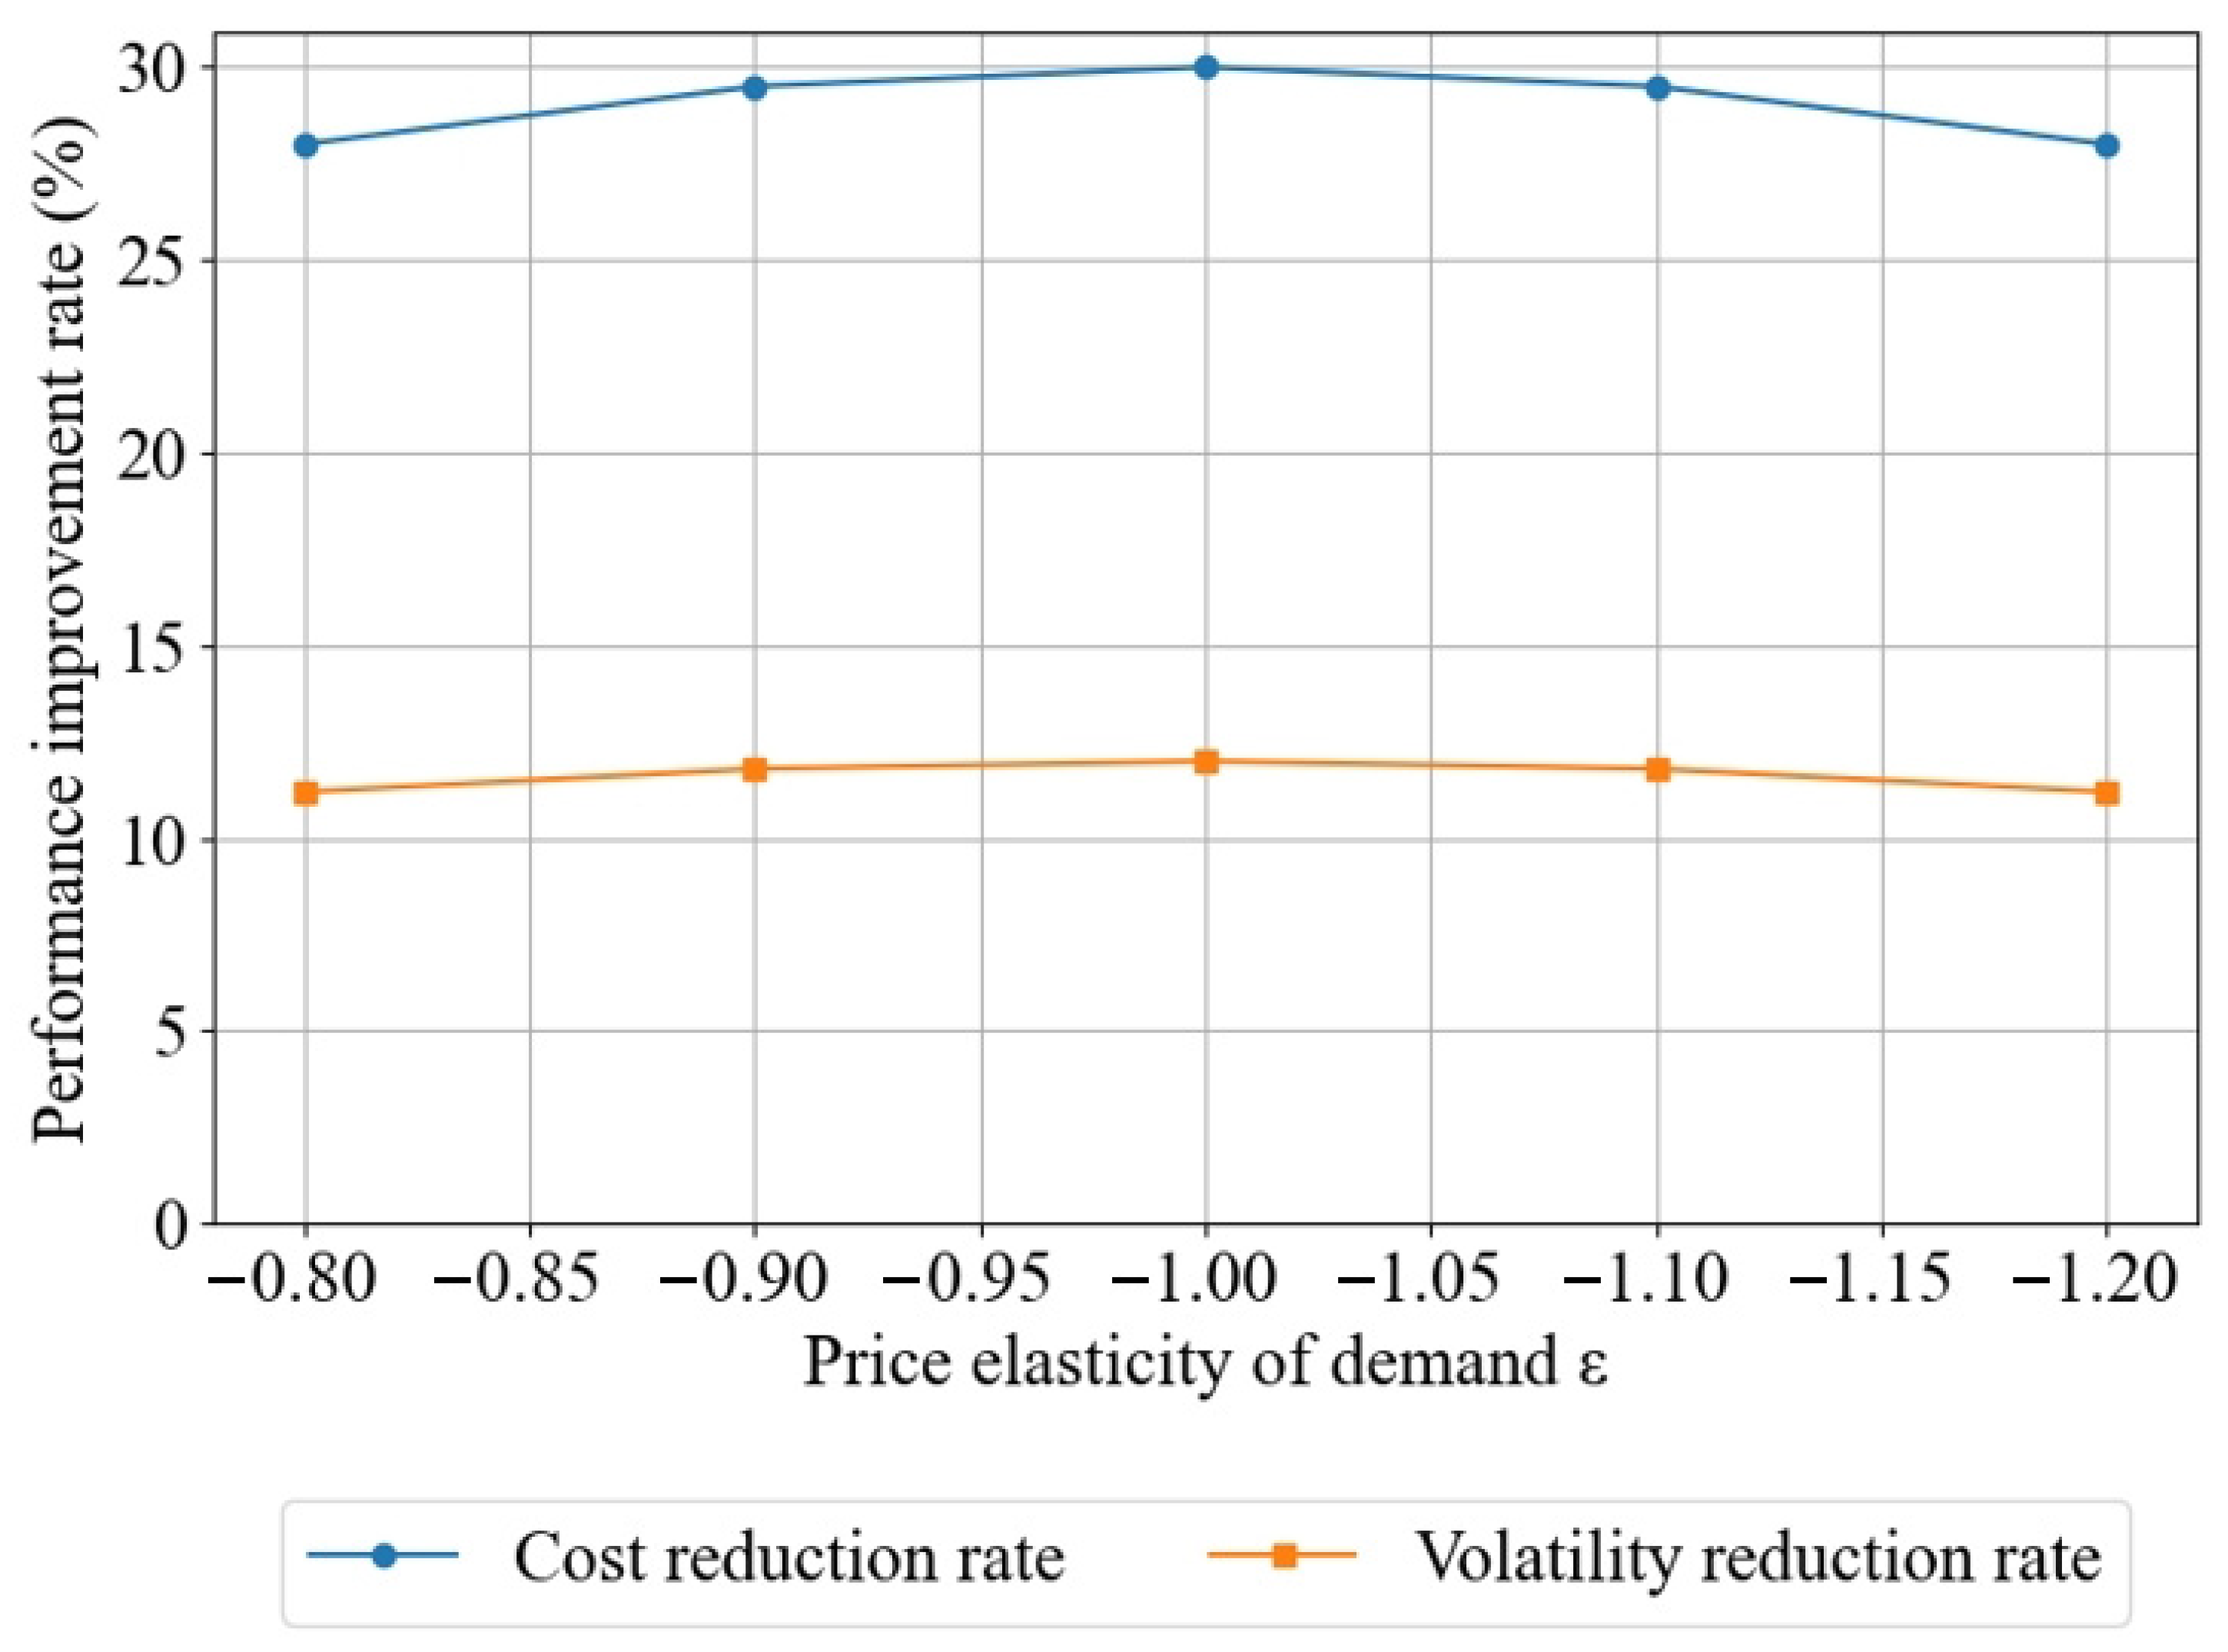
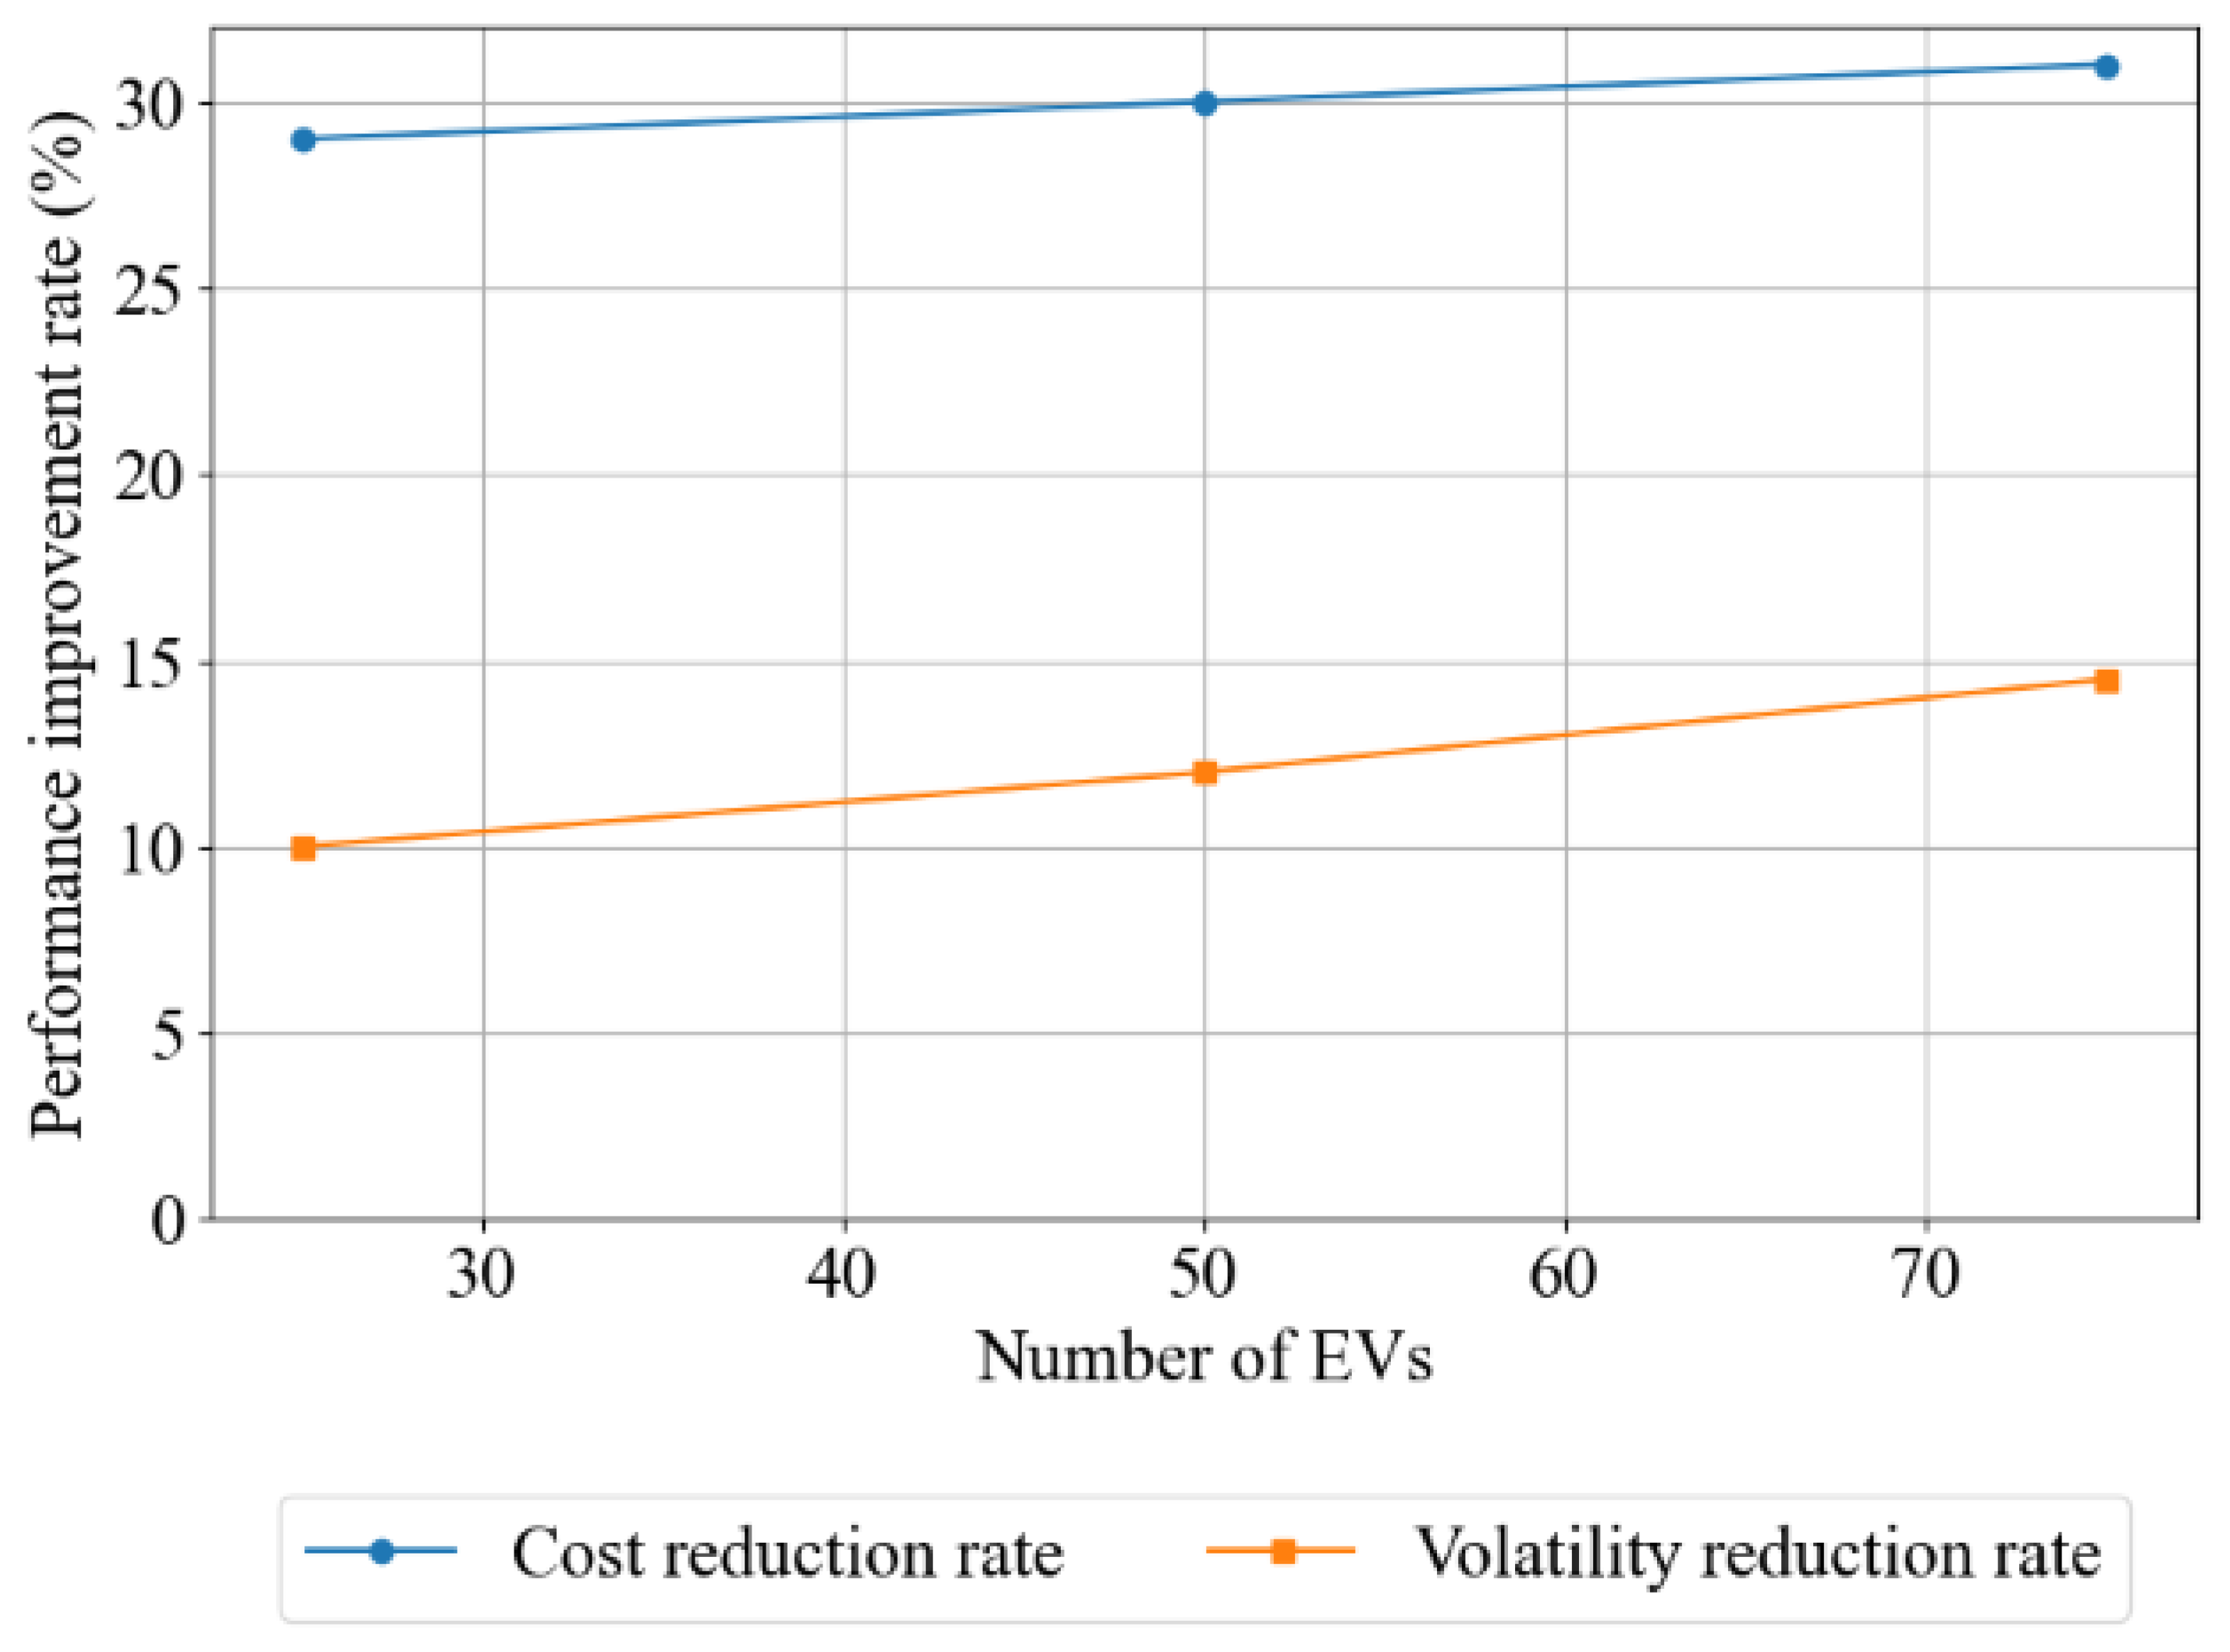
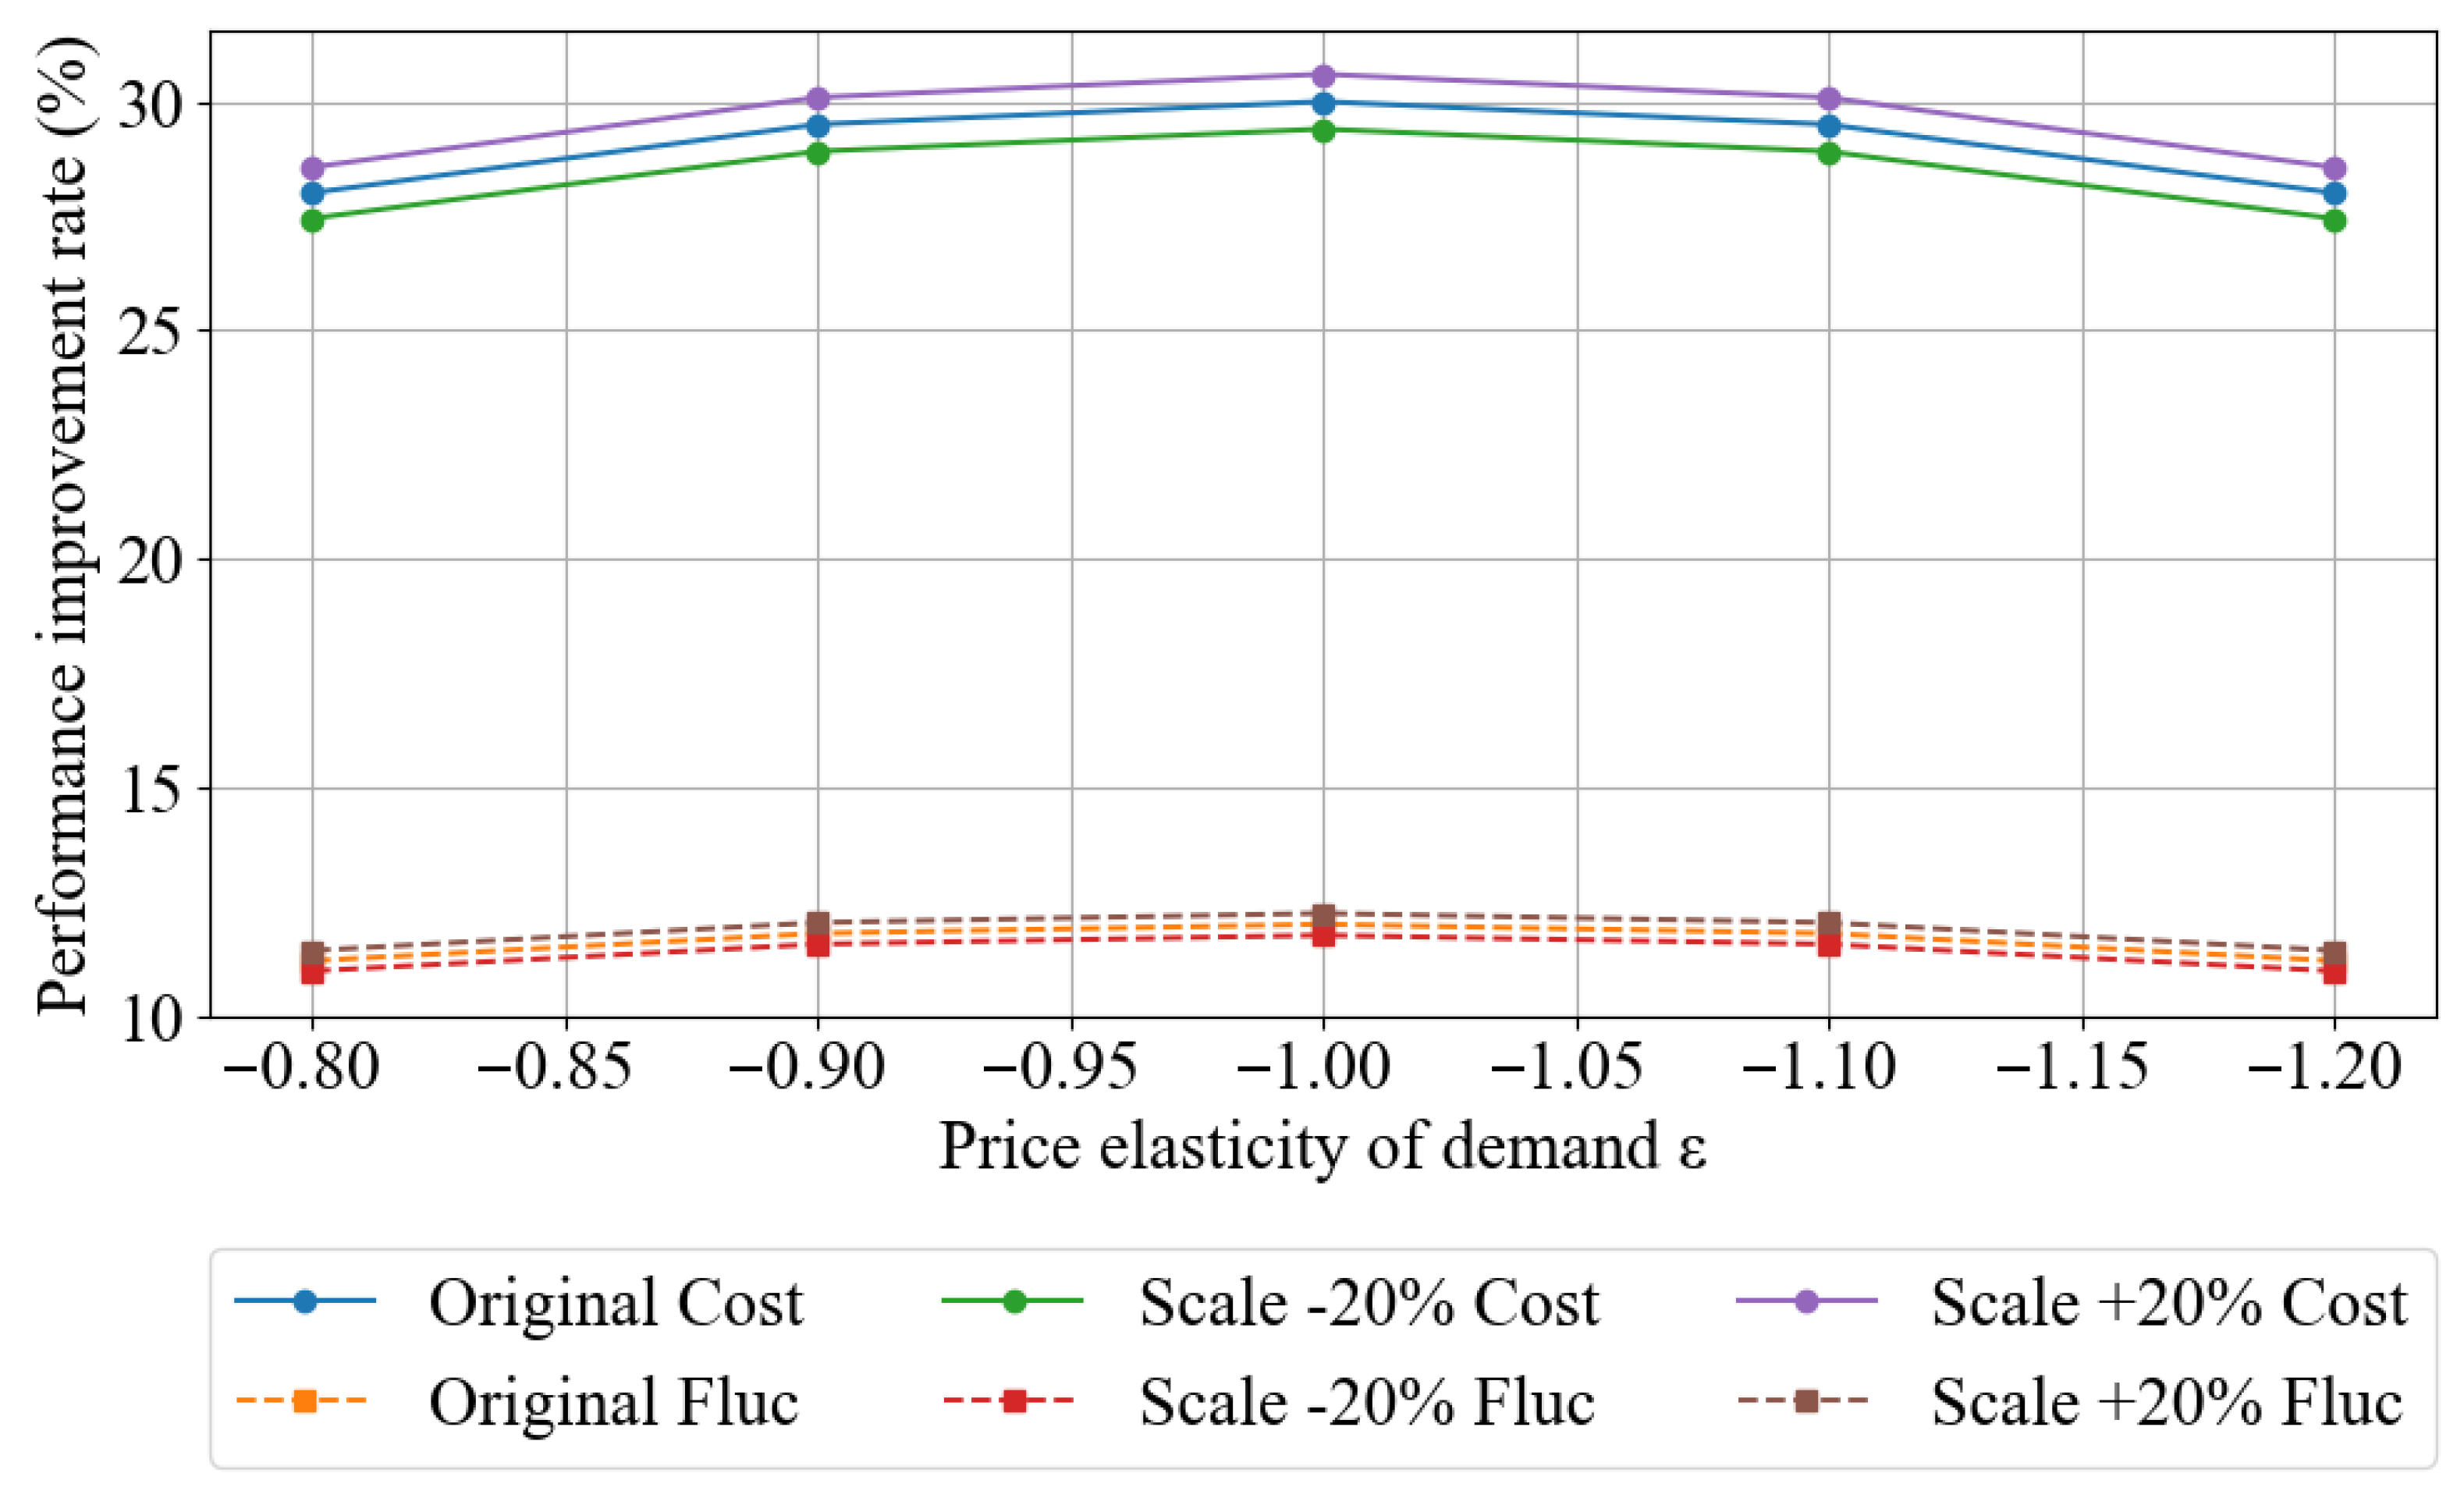
5.2.3. Sensitivity Analysis

Sensitivity analysis of user demand elasticity to ε . As ε increases, users become more sensitive to price changes, and the system can effectively utilise demand response to peak shaving and valley filling, with the peak occurring at ε = 1 . When the absolute value of the demand–price coefficient continues to increase, the cost reduction rate and power consumption fluctuation rate begin to decrease. This is because the compensation tariff is related to the incentivised load volume. Users, in an effort to obtain higher compensation tariffs, aggressively reduce their load volume, leading to excess power generation at that moment and resulting in power curtailment. This phenomenon is illustrated in Figure 13 below.
For the EV penetration sensitivity analysis, the number of EVs was set to 25, 50, and 75, representing 50%, 100%, and 150% penetration rates relative to the baseline. When the number of EVs increases to 75, the additional frequency regulation capacity results in stronger minute-level fluctuation suppression, with the fluctuation reduction rate improving to 13.8% and the cost reduction rate also slightly increasing to 31.1%. When the number of EVs decreases to 25, available frequency regulation resources decline, resulting in a drop in fluctuation suppression to 10.8% and cost savings decreasing to 29.2%; Overall, this indicates that the system has low sensitivity to EV aggregators. While increasing the number of EVs can further enhance system stability, the marginal benefits diminish, and cost savings remain relatively stable, as shown in Figure 14 below.
Sensitivity analysis of price signals shows that, even when the peak-to-off-peak difference changes, the cost reduction rate and volatility reduction rate only vary within a narrow range. When price signals are amplified (stronger incentives), the system can slightly further tap into users’ off-peak potential, resulting in slight improvements in both cost and volatility. When the peak-to-off-peak difference narrows (weaker incentives), performance declines slightly. This indicates that the scheduling framework described in this paper is not overly sensitive to fluctuations in electricity prices and has good market adaptability, as shown in Figure 15 below.

6. Conclusions

This paper addresses the issue of economic stability in systems incorporating distributed resource aggregators by introducing the concept of time-of-use multi-contracts. It proposes a multi-scale optimisation scheduling strategy spanning day-ahead, intraday long-term, and intraday short-term timeframes, and concludes that, in day-ahead scheduling, traditional demand response contracts do not account for users’ electricity consumption preferences and offer fixed incentives, resulting in higher operational costs compared to systems operating under elastic performance-based response contracts. In intraday scheduling, energy storage capacity contracts are applied at the long-term time scale, while dynamic frequency stability contracts are applied at the short-term time scale. When power fluctuations occur during the intraday scheduling phase, adjustments are first made at the hourly long-term time scale to address the power fluctuations, followed by fine-tuning at the minute-level short-term time scale, ultimately achieving system stability.
The limitation of this model is that all incentive and penalty parameters of the contracts are treated as constants. In actual markets, contract terms may be dynamically adjusted based on electricity prices, load conditions, or regulatory policies. This model does not incorporate uncertainty or adaptive optimisation mechanisms for contract parameters, so it is only applicable to scheduling scenarios where parameters remain relatively stable within the scheduling cycle for small and medium-sized distributed resource aggregators.It should be noted that this paper does not consider whether conflicts may arise between contracts. In future research, it will be necessary to consider whether contracts within a scheduling interval may conflict with contracts in another scheduling interval, thereby affecting the system’s operational costs and stability. In future work, it may be possible to design a conflict prioritisation or compensation mechanism to enable contract incentives and penalty instructions to be adaptively allocated during rolling scheduling.

Author Contributions

Conceptualization, L.S. and W.F.; methodology, L.S.; software, C.K.; validation, M.W.; formal analysis, N.Z.; investigation, P.Y.; resources, P.Y.; data curation, L.S.; writing—original draft preparation, R.S.; writing—review and editing, R.S.; visualization, L.S.; supervision, N.Z.; project administration, L.S.; funding acquisition, L.S. All authors have read and agreed to the published version of the manuscript.

Funding

This work was supported in part by the Research on Key Technologies for the Development of an Active Balancing Cooperative Control System for Distribution Networks and the National Natural Science Foundation of China under Grant 521532240029, 62203004.

Institutional Review Board Statement

Not applicable.

Informed Consent Statement

Not applicable.

Data Availability Statement

The data used in this study was simulated and generated based on the electricity generation and consumption within a day of a certain village in Gansu Province that was publicly queried online. All simulation parameters and configurations are described in detail in the article. No external datasets were used or generated.

Conflicts of Interest

The authors declare no conflicts of interest.

References

  1. Zeng, M.L.; Wei, G.; Zhu, L. Planning of electric vehicle charging-swapping-storage integrated station in AC/DC distribution network. Autom. Electr. Power Syst. 2021, 18, 52–60. [Google Scholar]
  2. Zhao, H.T.; Wang, B.; Pan, Z.G. Research and application of park-level multi-energy virtual power plants supporting cloud-cluster-end multi-level synergetic dispatch. Autom. Electr. Power Syst. 2021, 5, 111–121. [Google Scholar]
  3. Yang, L.B.; Cao, Y.; Wei, W. Configuration method of energy storage for wind farms considering wind power uncertainty and wind curtailment constraint. Autom. Electr. Power Syst. 2020, 16, 45–52. [Google Scholar]
  4. Tian, L.T.; Cheng, L.; Guo, J.B. A review on the study of management and interaction mechanism for distributed energy in virtual power plants. Power Syst. Technol. 2020, 6, 2097–2108. [Google Scholar]
  5. Li, M.Y.; Dong, Z. Pricing mechanism and optimal scheduling of virtual power plants containing distributed renewable energy and demand response loads. Integr. Intell. Energy 2024, 10, 12–17. [Google Scholar]
  6. Ju, L.W.; Li, H.H.; Zhao, J.W. Multi-objective stochastic scheduling optimization model for connecting a virtual power plant to wind-photovoltaic-electric vehicles considering uncertainties and demand response. Energy Convers. Manag. 2016, 1, 160–177. [Google Scholar] [CrossRef]
  7. Zhou, Y.Z.; Sun, G.Q.; Huang, W.J. Strategic bidding model for virtual power plant in different electricity markets considering electric vehicles and demand response. Power Syst. Technol. 2017, 6, 1759–1767. [Google Scholar]
  8. Zhang, K.J.; Ding, G.F.; Wen, M. Review of optimal dispatching technology and market mechanism design for virtual power plants. Integr. Intell. Energy 2022, 2, 60–72. [Google Scholar]
  9. Fan, S.; Liu, J.; Wu, Q. Optimal coordination of virtual power plant with photovoltaics and electric vehicles: A temporally coupled distributed online algorithm. Appl. Energy 2020, 277, 115583. [Google Scholar] [CrossRef]
  10. Zhang, W.G.; Song, J.; Guo, M.X. Load Balancing Management Strategy for Virtual Power Plants Considering Charging Demand of Electric Vehicles. Integr. Intell. Energy 2022, 9, 118–126. [Google Scholar]
  11. Sharma, S.; Abhyankar, A.R. Loss allocation for weakly meshed distribution system using analytical formulation of shapley value. IEEE Trans. Power Syst. 2017, 2, 1369–1377. [Google Scholar] [CrossRef]
  12. Li, Y.; Liu, W.J.; Shahidehpour, M. Optimal operation strategy for integrated natural gas generating unit and power-to-gas conversion facilities. IEEE Trans. Sustain. Energy 2018, 4, 1870–1879. [Google Scholar] [CrossRef]
  13. Mei, J.; Chen, C.; Wang, J.H. Coalitional game theory based local power exchange algorithm for networked microgrids. Appl. Energy 2019, 9, 133–141. [Google Scholar] [CrossRef]
  14. Wang, H.; Jia, Y.W.; Shi, M.G. A mutually beneficial operation framework for virtual power plants and electric vehicle charging stations. IEEE Trans. Smart Grid 2023, 6, 4634–4648. [Google Scholar] [CrossRef]
  15. Liu, J.H.; Liu, F. Research on optimized dispatching strategy of cascade hydropower-pumping-storage-wind-photovoltaic multi-energy complementary system based on deep reinforcement learning. Guangdong Electr. Power 2024, 5, 10–22. [Google Scholar]
  16. Zhang, N.; Yan, J.; Hu, C.G. Price-Matching-Based Regional Energy Market with Hierarchical Reinforcement Learning Algorithm. IEEE Trans. Ind. Inform. 2024, 9, 11103–11114. [Google Scholar] [CrossRef]
  17. Lin, Y.X.; Gao, H. Load prediction method of charging station based on SSA-VMD-BiLSTM model. Guangdong Electr. Power 2024, 6, 53–61. [Google Scholar]
  18. Wang, H.; Shi, M.; Xie, P.; Lai, C.S.; Li, K.; Jia, Y. Electric Vehicle Charging Scheduling Strategy for Supporting Load Flattening Under Uncertain Electric Vehicle Departures. J. Mod. Power Syst. Clean Energy 2023, 5, 1634–1645. [Google Scholar] [CrossRef]
  19. Wang, H.; Member, G.S.; Jia, Y.; Shi, M. A hybrid incentive program for managing electric vehicle charging flexibility. IEEE Trans. Smart Grid 2023, 1, 476–488. [Google Scholar] [CrossRef]
  20. Clegg, S.; Mancarella, P. Integrated Electrical and Gas Network Flexibility Assessment in Low-Carbon Multi-Energy Systems. IEEE Trans. Sustain. Energy 2016, 2, 718–731. [Google Scholar] [CrossRef]
  21. Li, Y.; Gao, D.W.; Gao, W.; Zhang, H.; Zhou, J. A Distributed Double-Newton Descent Algorithm for Cooperative Energy Management of Multiple Energy Bodies in Energy Internet. IEEE Trans. Ind. Inform. 2021, 9, 5993–6003. [Google Scholar] [CrossRef]
  22. Liu, Z.; Huang, B.; Li, Y.; Sun, Q.; Pedersen, T.B.; Gao, D.W. Pricing Game and Blockchain for Electricity Data Trading in Low-Carbon Smart Energy Systems. IEEE Trans. Ind. Inform. 2024, 4, 6446–6456. [Google Scholar] [CrossRef]
  23. Yang, L.; Li, X.; Sun, M.; Sun, C. Hybrid Policy-Based Reinforcement Learning of Adaptive Energy Management for the Energy Transmission-Constrained Island Group. IEEE Trans. Ind. Inform. 2023, 11, 10751–10762. [Google Scholar] [CrossRef]
  24. Yang, L.; Sun, Q.; Zhang, N.; Li, Y. Indirect Multi-Energy Transactions of Energy Internet with Deep Reinforcement Learning Approach. IEEE Trans. Power Syst. 2022, 5, 4067–4077. [Google Scholar] [CrossRef]
  25. Jiang, X.Y.; Sun, C.; Cao, L.L. Peer-to-peer energy trading with energy path conflict management in energy local area network. IEEE Trans. Smart Grid 2022, 3, 2269–2278. [Google Scholar] [CrossRef]
  26. Zhang, N.; Sun, M.; Yang, L.; Li, Y. Event-Triggered Distributed Hybrid Control Scheme for the Integrated Energy System. IEEE Trans. Sustain. Energy 2022, 2, 835–846. [Google Scholar] [CrossRef]
  27. Xin, A.; Hu, H.Y.; Hu, J.J.; Wang, K.Y.; Wang, H.Y.; Wang, Z. Distributionally Robust Bidding Strategy of Energy-Regulation Market for Electric Vehicle Aggregator based on Scenario Tree Probabilities. Electr. Power Constr. 2023, 12, 174–184. [Google Scholar]
  28. Gao, S.; Dai, R.X. Charging Control Strategy for Electric Vehicle Aggregation Participating in Frequency Regulation Ancillary Service Market. Autom. Electr. Power Syst. 2023, 18, 60–67. [Google Scholar]
Figure 1. Participation of energy storage devices in primary FM.
Sustainability 17 06767 g001
Figure 2. Reflected graph of user demand–price function.
Sustainability 17 06767 g002
Figure 3. Participation of EV aggregators in secondary FM.
Sustainability 17 06767 g003
Figure 4. Schematic of FM capacity and FM mileage.
Sustainability 17 06767 g004
Figure 5. Framework diagram of DRA under the influence of time-sharing multiple contracts.
Sustainability 17 06767 g005
Figure 6. Flowchart of model solving.
Sustainability 17 06767 g006
Figure 7. Comparison of daily forecasts and actual intraday values.
Sustainability 17 06767 g007
Figure 8. Comparison of power purchase and abandonment costs under two types of demand response.
Sustainability 17 06767 g008
Figure 9. Load volume usage during the day.
Sustainability 17 06767 g009
Figure 10. Comparison of cost items for day-ahead scheduling.
Sustainability 17 06767 g010
Figure 11. Comparison of cost items for intraday scheduling.
Sustainability 17 06767 g011
Figure 12. (Left): power variation without considering the contract, (Right): power variation considering the contract.
Sustainability 17 06767 g012
Figure 13. Cost and volatility reduce sensitivity to ε .
Sustainability 17 06767 g013
Figure 14. Cost and volatility reduce sensitivity to EV penetration rate.
Sustainability 17 06767 g014
Figure 15. Sensitivity to peak-to-off-peak electricity price differences.
Sustainability 17 06767 g015
Table 1. Value of parameters.
Parameter CategoryParameter NameNumerical Values
Number of energy storage devices5 units
Energy storage equipmentSingle unit energy capacity50 MWh
Charging and discharging efficiency0.95
Number of EVs50 vehicles
Single vehicle capacity20 MWh
Electric Vehicle AggregatorInitial charge state0.5
Charging and discharging efficiency0.9
SOC lower limit/upper limit5%/95%
Demand response incentives3.2 MWh
Non-compliance cost for rigid load reduction1.5 MWh
Penalty costs for wind and solar power curtailment5 MWh
Contract parametersEnergy Storage Capacity Contract Rewards3.2 MWh
Penalties for non-fulfilment of energy storage capacity contracts5 MWh
EV frequency modulation capacity or mileage contract rewards1.5 MWh
Penalty for exceeding frequency modulation capacity5 MWh
Disclaimer/Publisher’s Note: The statements, opinions and data contained in all publications are solely those of the individual author(s) and contributor(s) and not of MDPI and/or the editor(s). MDPI and/or the editor(s) disclaim responsibility for any injury to people or property resulting from any ideas, methods, instructions or products referred to in the content.

