Article

Multi-Scale Analysis of Green Space Patterns in Thermal Regulation Using Boosted Regression Tree Model: A Case Study in Central Urban Area of Shijiazhuang, China

Department of Urban and Rural Planning, School of Landscape Architecture, Beijing Forestry University, Beijing 100083, China
*
Author to whom correspondence should be addressed.
Sustainability 2025, 17(11), 4874; https://doi.org/10.3390/su17114874
Submission received: 28 March 2025 / Revised: 30 April 2025 / Accepted: 20 May 2025 / Published: 26 May 2025
(This article belongs to the Special Issue A Systems Approach to Urban Greenspace System and Climate Change)

Abstract

:
Multi-scale thermal regulation of urban green spaces is critical for climate-adaptive planning. Addressing the limited research on key indicators and cross-scale synergies in high-density areas, this study developed an integrated framework combining multi-granularity grids and boosted regression tree (BRT) modeling to investigate nonlinear scale-dependent relationships between landscape parameters and land surface temperature (LST) in the central urban area of Shijiazhuang. Key findings: (1) Spatial heterogeneity and scale divergence: Vegetation coverage (FVC) and green space area (AREA) showed decreasing contributions at larger scales, while configuration metrics (e.g., aggregation index (AI), edge density (ED)) exhibited positive scale responses, confirming a dual mechanism with micro-scale quality dominance and macro-scale pattern regulation. (2) Threshold effects quantification: The BRT model revealed peak marginal cooling efficiency (0.8–1.2 °C per 10% FVC increment) within 30–70% FVC ranges, with minimum effective green patch area thresholds increasing from 0.6 ha (micro-scale) to 3.5 ha (macro-scale). (3) Based on multi-scale cooling mechanism analysis, a three-tier matrix optimization framework for green space strategies is established, integrating “micro-level regulation, meso-level connectivity, and macro-level anchoring”. This study develops a green space optimization paradigm integrating machine learning-driven analysis, multi-scale coupling, and threshold-based management, providing methodological tools for mitigating urban heat islands and enhancing climate resilience in high-density cities.

1. Introduction

Under the dual pressures of global climate change and rapid urbanization, the urban heat island (UHI) effect has emerged as a critical threat to the sustainability of human settlements [1,2,3]. Urban temperature rise driven by altered underlying surfaces, expansion of spatial structures, and increased anthropogenic heat emissions has led to environmental degradation and public health risks [4,5,6]. Consequently, optimizing urban thermal environments has become a critical priority and a shared focus among urban planners, developers, and residents. Urban green spaces, recognized as essential ecological regulators, have demonstrated significant heat mitigation potential [7,8]. Existing studies confirm strong correlations between their landscape patterns (e.g., morphological features, spatial configurations) and thermal regulation efficiency [9,10,11]. While existing studies confirm the cooling effects of blue-green infrastructure [8], focusing on green spaces offers broader applicability, particularly in arid regions where artificial water bodies entail high costs and unstable diurnal cooling efficiency. Consequently, rational utilization and planning of urban green space layouts are critical for improving their heat mitigation capabilities in cities [12,13].
Research into the cooling effects of green space patterns shows that the analyses between land surface temperature (LST) and landscape metrics now increasingly prioritize nonlinear analytical frameworks over traditional linear models [14,15]. Machine learning algorithms now offer innovative tools to decipher complex nonlinear interactions among UHI drivers [16,17], such as the Random Forest (RF) model [18], gradient-boosted decision tree (GBDT) model [19,20], and boosted regression tree (BRT) model [21,22,23]. Among these, the BRT model excels in handling multidimensional nonlinear data and identifying critical thresholds, providing dual qualitative-quantitative decision support for planning. The BRT model, which integrates Classification and Regression Trees (CART) with gradient boosting, iteratively constructs decision trees to optimize residual fitting. Unlike Random Forest or gradient boosting, BRT excels in interpretability by quantifying variable contributions and threshold-specific responses through partial dependence plots, thereby effectively addressing nonlinear interactions in urban thermal studies. Previous studies have demonstrated its capability to identify dominant drivers of surface temperature (e.g., building density and green space indicators) and quantify the cooling intensity of green space characteristics across diverse climatic contexts. In temperate megacities such as Beijing and Shanghai, building density dominates surface temperature elevation, while vegetation coverage exhibits a nonlinear cooling trend [21,23]. In tropical cities, including Chennai, Dhaka, and Kolkata, the surface temperature is primarily driven by the Normalized Difference Built-up Index (NDBI), albedo, and normalized difference vegetation index (NDVI) [22]. BRT-generated contribution diagrams (e.g., variable importance plots and partial dependence curves) provide quantifiable criteria for optimizing green space configurations.
Current research on the scale effects of urban thermal environments primarily focuses on grid unit division and regional comparative analysis, with existing studies predominantly adopting binary spatial hierarchies such as city-suburban or regional-urban frameworks [24,25]. However, the interactive dynamics between multi-scale landscape metrics and cross-scale pattern recognition in central urban areas still lack systematic investigation. Enhancing research on green space cooling effects across varying grid granularities can, therefore, provide direct guidance for multi-level urban green space system planning.
This study investigates the nonlinear interactions and scale dependency between green space landscape patterns and LST in the central urban area of Shijiazhuang City, a high-density temperate city in China. Characterized by the structural scarcity of green resources and aggravated thermal environments, Shijiazhuang serves as a representative case for studying heat island dynamics in high-density urban contexts. Leveraging multi-source remote sensing data, we identified critical cooling indicators and their marginal effects across multiple spatial scales. A multi-granularity grid system (100 m, 300 m, 600 m, 900 m) was developed to quantify scale effects, with the BRT model employed to decode LST–green space landscape patterns relationships at each granularity. The derived multi-scale optimization strategy matrix provides scientific decision-making support for green space system planning and heat mitigation measures in compact urban areas.
The research objectives of this study are as follows:
  • To reveal the scale-specific characteristics and nonlinear dynamics of landscape regulation indicators;
  • To decipher the scale dependency of green space cooling mechanisms;
  • To formulate adaptive optimization strategies for green space configurations in central urban areas, addressing multi-level green space system planning needs.

2. Materials and Methods

2.1. Materials

2.1.1. Study Area

Shijiazhuang, the capital city of Hebei Province, occupies the central-southern region of the province, straddling both the Taihang Mountain range and the North China Plain. Its geographic coordinates range from 37°27′ to 38°47′ N latitude and 113°30′ to 115°20′ E longitude, covering a total administrative area of 15,848 km2. As of 2024, Shijiazhuang hosts a permanent population of 11.2335 million, with an urbanization rate of 72.28%. As a strategic hub within the Beijing–Tianjin–Hebei urban cluster, the city features transportation infrastructure density levels that are exceptionally high in northern China, accompanied by an annual urban built-up area expansion rate of 3.2% over the past decade. This study focuses on Shijiazhuang’s central urban area (encompassing Yuhua, Chang’an, Qiaoxi, and Xinhua Districts), totaling 359.56 km2. The area exemplifies high-density contiguous development while exhibiting a spatially imbalanced green space system—a disparity between fragmented inner-city green zones and extensive natural green spaces in peripheral regions.
The Köppen–Geiger climate classification system divides global climates into 5 major categories and 30 subtypes based on seasonal variations in temperature and precipitation [26]. According to the latest global maps of the Köppen–Geiger climate classification, Shijiazhuang City belongs to the BSk type, defined as a cold, semi-arid steppe climate featuring cold, dry winters and hot, rainy summers (Figure 1). Influenced by the combined effects of altered urban surface properties and blocked ventilation corridors, Shijiazhuang′s summer peak temperatures consistently concentrate in June, July, and August, often exceeding 35 °C. With the increasing frequency of extreme heat events in recent summers, the city stands as a representative case for studying thermal environments in high-density urban areas.

2.1.2. Datasets

This study synthesizes two remote sensing datasets to assess thermal environments and green space distribution. Landsat 8 OLI/TIRS imagery (30 m spatial resolution) was acquired from the United States Geological Survey (USGS) Earth Explorer platform (https://earthexplorer.usgs.gov/ (accessed on 22 January 2025)) to retrieve LST, with priority given to scenes exhibiting <5% cloud cover and minimal atmospheric distortion for temporal consistency. Simultaneously, Sentinel-2 multispectral imagery (10 m spatial resolution) was obtained from the Copernicus Open Access Hub (https://dataspace.copernicus.eu/ (accessed on 24 January 2025)) to delineate green spaces with enhanced spatial precision, as detailed in Table 1. All datasets underwent radiometric calibration and geometric correction to mitigate sensor-specific and topographic errors.
The central urban boundary of Shijiazhuang was used to project and clip datasets. Aligning with prior research and practical requirements for green space system planning, four grid scales (100 m, 300 m, 600 m, and 900 m) were selected to analyze multi-scale cooling benefits. Fishnet segmentation was performed in ArcGIS 10.8 to generate grids across the study area, with rigorous quality control to minimize null-value grids and ensure statistical robustness.

2.2. Methods

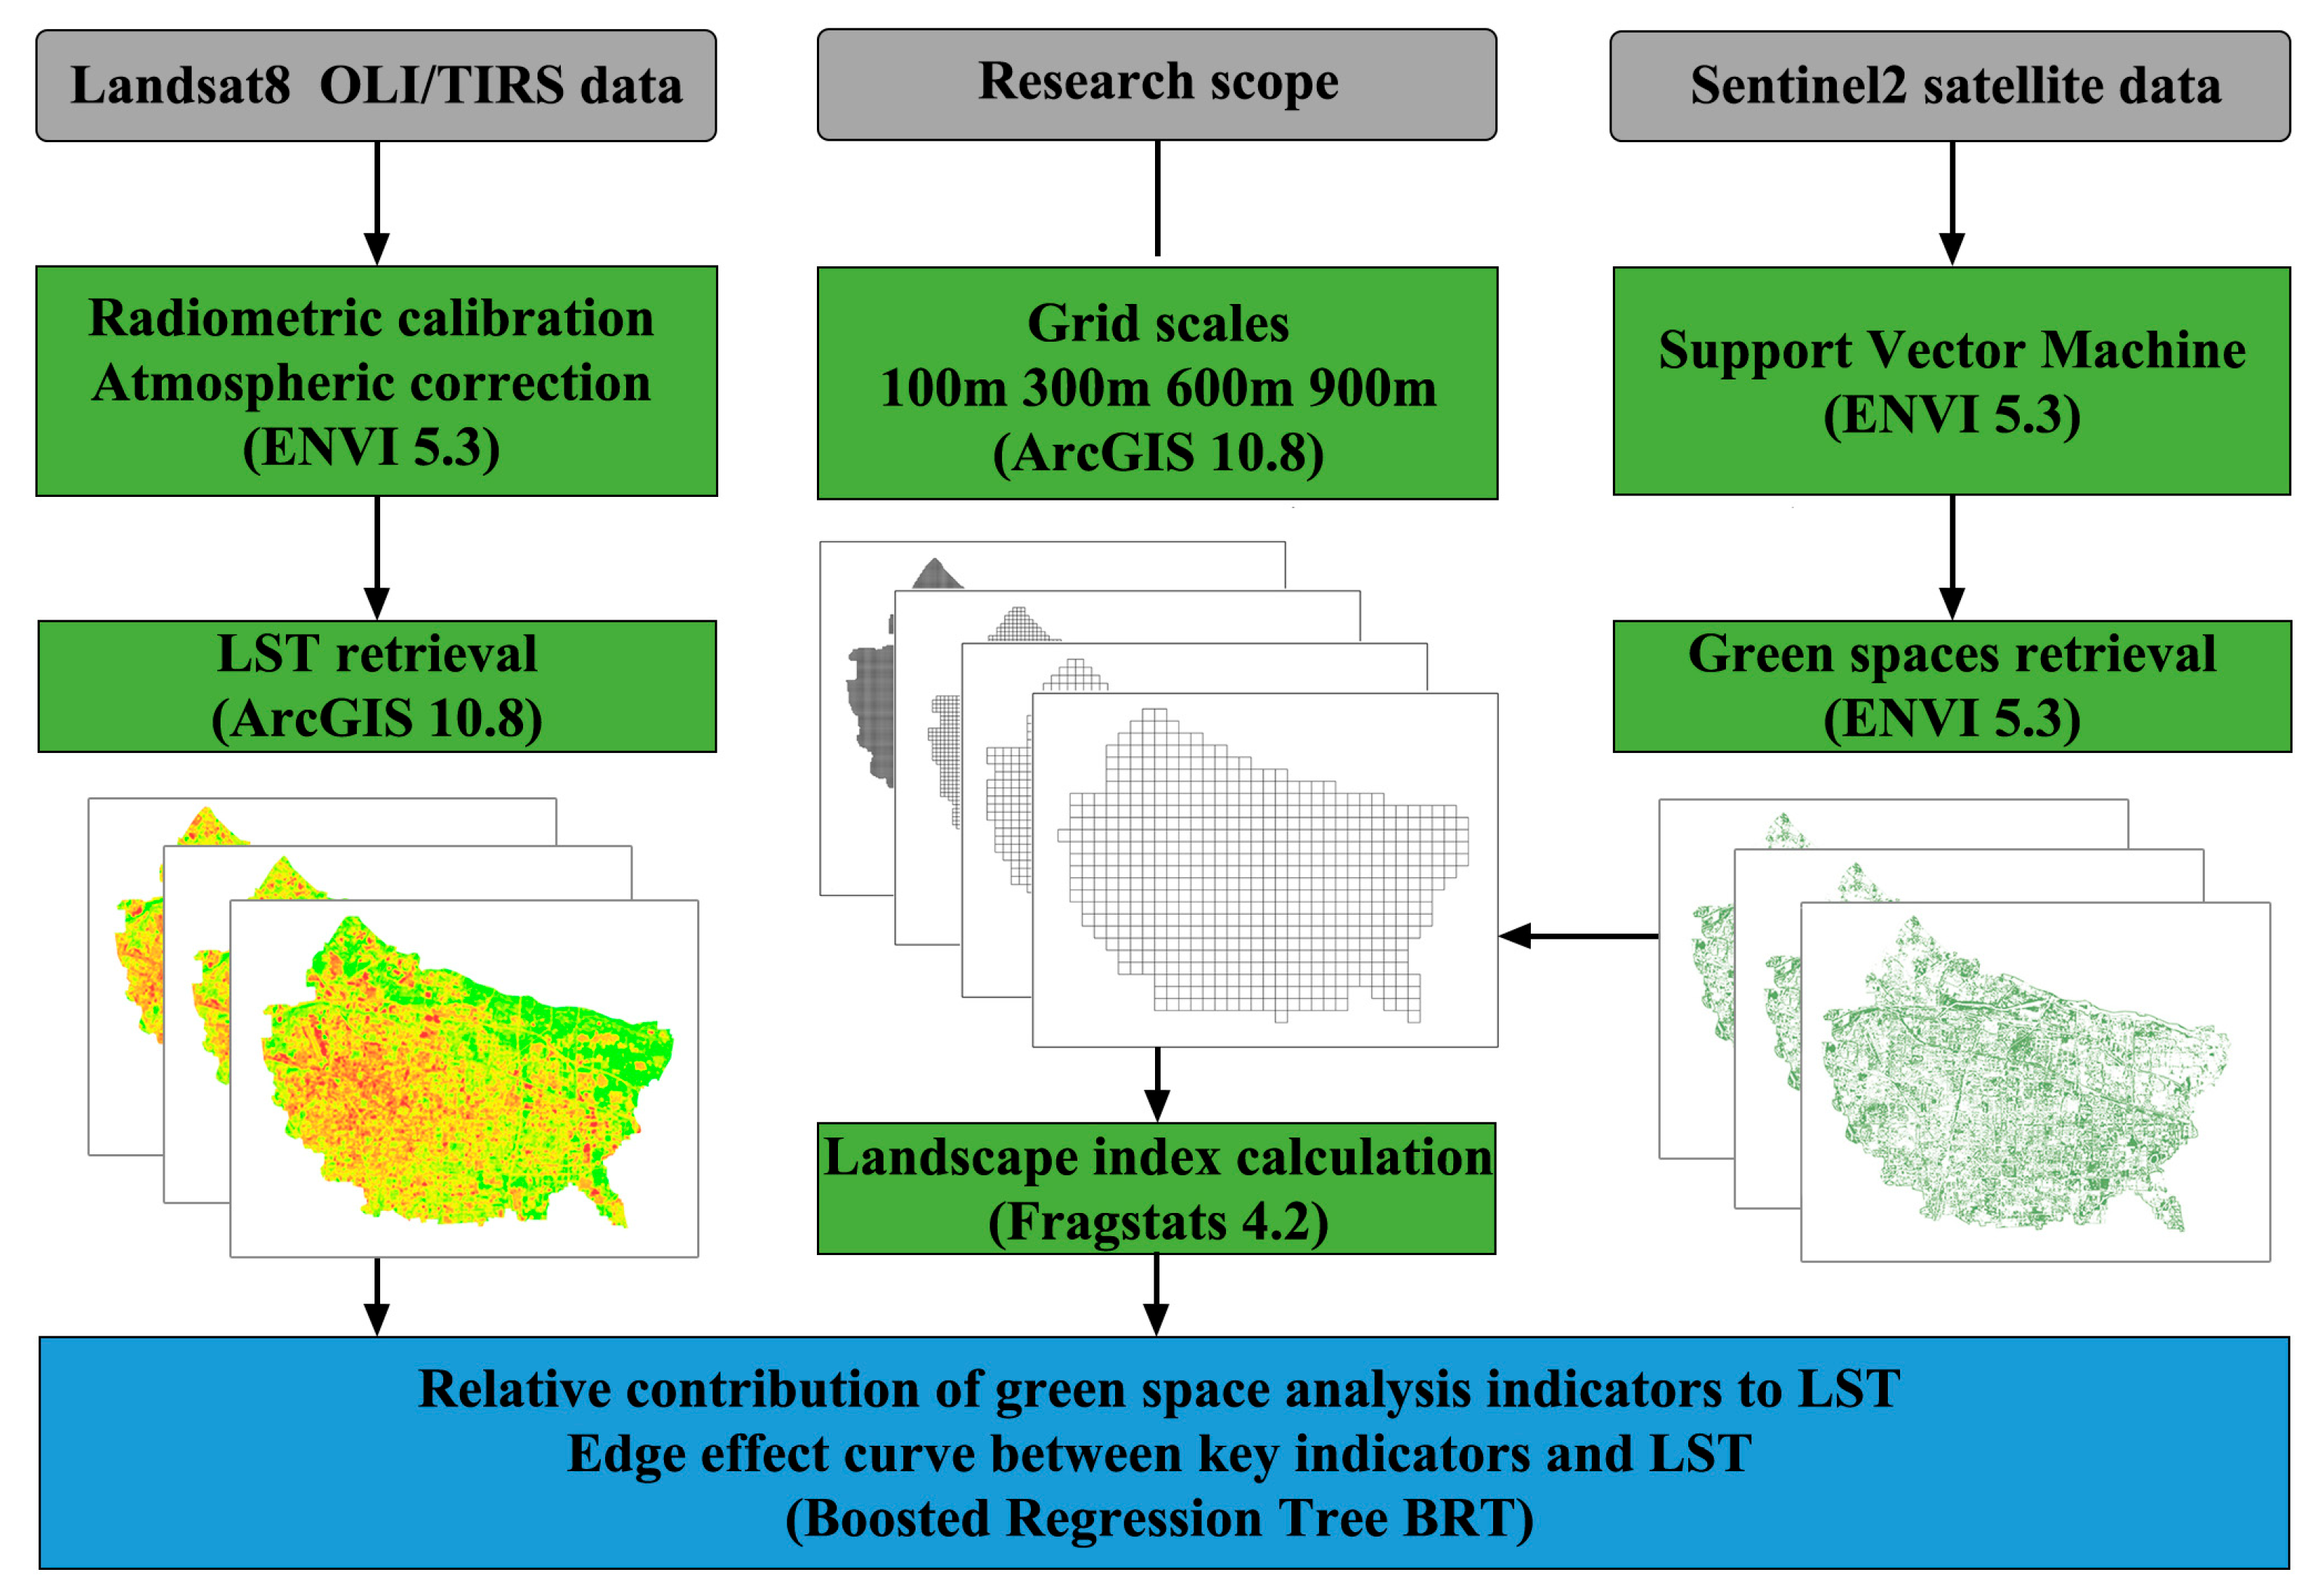
2.2.1. Research Process

First, LST and green space distribution were calculated using ArcGIS 10.8 and ENVI 5.3. Second, landscape metrics were quantified with Fragstats 4.2. Third, multi-scale grids (100 m, 300 m, 600 m, 900 m) were generated to partition the study area into statistical units. To meet multi-scale analysis requirements, the original 30 m resolution data were resampled into 100 m, 300 m, 600 m, and 900 m grid systems using the cubic convolution interpolation method (CUBLC) in ArcGIS 10.8, ensuring optimal preservation of spatial distribution accuracy in the resampled data. Finally, the BRT model was applied to assess cooling contributions and marginal effects of landscape metrics (Figure 2).

2.2.2. Green Space Extraction and Landscape Metric Selection

In the context of UHI effect and heat mitigation research, green spaces are defined as land-use types predominantly covered by trees, shrubs, or herbaceous vegetation [27]. This study employed high-resolution Sentinel-2 satellite imagery to extract green spaces through a supervised classification workflow. After preprocessing steps (radiometric calibration and atmospheric correction), a support vector machine (SVM) model in ENVI 5.3 was applied to classify land cover into six categories: forest, grassland, cropland, water, impervious surfaces, and bare land. Green spaces were subsequently delineated by aggregating forest and grassland classes. The classified data were validated for overall accuracy (OA) using the verification samples (Points of Interest (POI)) from the SWM model, yielding a refined 10 m resolution green space distribution map.
Building upon established research frameworks for green space landscape indicators [28,29,30,31,32,33,34], seven landscape metrics were selected across three dimensions—green space quality, pattern, and morphology (Table 2). The quality dimension was represented by fractional vegetation cover (FVC) derived from the normalized difference vegetation index (NDVI). For spatial patterns, three metrics were prioritized: area (AREA) to identify minimum effective cooling units and mitigate inefficient cooling effects of fragmented green patches; edge density (ED) measures boundary complexity, while patch density (PD) evaluates spatial dispersion and distinguishes cooling efficiencies across clustered versus scattered urban configurations. Morphological analysis incorporated three indices: coefficient of variation in patch size (AREA_CV) to capture nonlinear responses to size heterogeneity, landscape shape index (LSI) to evaluate contour regularity for shape optimization, and aggregation index (AI) to measure spatial connectivity for enhancing cold source network continuity. Metrics emphasizing multi-class interactions (e.g., Shannon diversity index, SHDI) were excluded to focus on cooling-specific mechanisms. All selected metrics were computed in Fragstats 4.2, ensuring alignment with thermal optimization objectives and green space planning frameworks.

2.2.3. Land Surface Temperature Retrieval Methodology

This study employs the mono-window algorithm (MWA) to retrieve LST from Landsat 8 data, focusing on three key parameters: top-of-atmosphere (TOA) brightness temperature, vegetation index, and land surface emissivity [35]. The workflow is structured as follows:
First, TOA brightness temperature was derived through radiometric calibration and Planck equation conversion. Spectral radiance (L) was calculated from digital number (DN) values using calibration coefficients specific to Landsat 8 Band 10 [35]:
L = G A I N S × D N + B L A S E S
where L is the spectral radiance, and GAINS and BLASES are calibration coefficients specific to Landsat 8 Band 10 (Thermal Infrared 1, TIRS1). GAINS = 3.342 × 10⁻⁴ W/(m2 ⋅sr⋅μm)/DN. BLASES = 0.1 W/(m2⋅sr⋅μm)/DN.
Next, derive brightness temperature (T) from radiance using the Planck equation [36,37].
T = C 2 l n C 1 / L + 1
where C1 = 774.89 W/(m2⋅sr⋅μm); C2 = 1321.08 K (calibration constants for Landsat 8 Band 10).
The normalized difference vegetation index (NDVI) was calculated using reflectance values from Band 4 (Red) and Band 5 (Near-Infrared, NIR) [38]:
N D V I = N I R R E D N I R + R E D
Land surface emissivity (LSE) is determined using Sobrino’s LSE model [35], which integrates NDVI and vegetation fractional cover (PV) [39]:
ε = 0.979 0.035 ρ R 0.986 + 0.004 P V 0.99 N D V I < 0.2 0.2 N D V I 0.5 N D V I > 0.5
P V = ( N D V I N D V I m i n N D V I m a x N D V I m i n ) 2
where global thresholds NDVImax = 0.5 and NDVImin = 0.2 are adopted.
Final LST is derived by correcting brightness temperature (T) with emissivity (ε) [40]:
L S T = T 1 + λ × T ρ × l n ε
where λ = 10.90 μm (central wavelength of Band 10), ρ = hc/σ = 1.438 × 10⁻² K, σ = 1.38 × 10⁻²³ J/K, h (Planck constant) = 6.626 × 10⁻³⁴ J/s. c (speed of light) = 2.998 × 10⁸ m/s.

2.2.4. BRT Model Construction

To address the complex nonlinear relationships between urban thermal environments and green space landscape metrics, this study employed a BRT model, which integrates multiple weak classifiers (regression trees) through gradient boosting algorithms. This study constructed a model with land surface temperature as the response variable and multidimensional green space landscape metrics as predictor variables. The model fitting was implemented using the gbm package in R 4.3.3 [41].
The BRT model synergistically merges boosting algorithms with Classification and Regression Tree (CART) methodologies [42], enhancing prediction accuracy through the strategic aggregation of multiple simplified decision trees. Its mathematical formulation is defined as the cumulative output of M CART models:
f M X = m = 1 M T m X , γ m
where Tm(X,γm) represents the m-th regression tree, X denotes the predictor variables (green space metrics), and γm parameterizes the split points and terminal node values of each tree.
Prior to model execution, six core parameters must be optimized during training: the number of iterations (nt), tree complexity (tc), learning rate (lr), bag fraction (bf), loss function type (distribution), and cross-validation folds (cv.folds) [43]. Tree complexity, defined as the number of terminal nodes per decision tree, determines the interaction order among environmental predictors. In BRT, all trees maintain identical node structures and terminate growth upon reaching predefined tc thresholds without pruning [44]. The learning rate (lr) governs convergence speed—lower lr values slow convergence but improve stability, while higher values introduce noise and reduce function smoothness [45]. Typical parameterization includes nt > 1000, tc = 1–16, lr = 0.001–0.1, bf = 0.75, and the Gaussian loss function. Given the critical influence of tc and lr on predictive accuracy, 70% of the dataset was randomly selected for model construction, with the remaining 30% used to compute prediction deviance. The BRT analysis was executed in R 4.3.3 using the gbm package [41], configured with a learning rate of 0.01 and 10-fold cross-validation to ensure robust model interpretation and predictive capability.
The validation process examined model performance across two dimensions: goodness-of-fit and predictive deviation. The goodness-of-fit analysis quantified the model’s data variability capture capacity through the coefficient of determination (R2), which gauges explanatory power. Predictive deviation evaluation utilized three error metrics—MSE, RMSE, and MAE—to quantify disparities between model predictions and actual observations. Computational formulae for these metrics are provided in Appendix B.

3. Results

3.1. Spatial Distribution of Green Spaces in Shijiazhuang

The land cover classification was performed using the SWM model in ENVI5.3, with verification samples (Points of Interest, POI) validating the classified data. The achieved overall accuracy (OA) of 94.8% demonstrates sufficient reliability for subsequent research. From 2022 to 2024, the overall distribution of green spaces in Shijiazhuang’s central urban area exhibited minimal structural changes, maintaining a fragmented and linear spatial pattern dominated by scattered patches and corridors (Figure 3). Core green patches primarily consisted of comprehensive parks, which served as major urban green hubs. Linear green spaces were predominantly distributed along transportation infrastructure (e.g., railways and expressways) and riparian buffers, including the Hutuo and Taiping River corridors, while smaller point-like green spaces comprised auxiliary greenbelts and street-level vegetation. Peri-urban regions featured more aggregated green spaces, particularly in forested areas, orchards, and riparian zones adjacent to the Hutuo and Taiping Rivers. However, urban expansion and land development activities led to a gradual reduction in larger green patches within these peripheral zones.
Overall, Shijiazhuang’s green space configuration remained spatially fragmented, with high-density clusters concentrated along road networks and park peripheries. Despite the abundance of green patches, their dispersed arrangement hindered the formation of an integrated green network system.

3.2. Analysis of Thermal Environment in Shijiazhuang

The land surface temperature LST retrieval results indicate significant thermal variations across the study area from 2022 to 2024. Spatially, LST values in Shijiazhuang’s central urban area remained relatively stable, with annual mean temperatures of 47.33 °C, 45.87 °C, and 44.49 °C, respectively. Median temperatures and distribution ranges showed minimal interannual fluctuations, suggesting no pronounced temporal trend in LST over this period. However, extreme LST values were observed annually, likely linked to localized weather events or environmental anomalies.
Spatial analysis revealed distinct thermal patterns. High-temperature zones clustered predominantly in the city center and southern regions, where urban core areas exhibited contiguous high-LST patches, while southern zones displayed a transition from scattered hotspots to linear or aggregated thermal corridors. Low-temperature areas were concentrated in northern peri-urban regions, including the Hutuo River, Taiping River basins, and adjacent farmland. To accommodate multi-scale analysis, the original 30 m resolution LST data were resampled to 100 m, 300 m, 600 m, and 900 m grid systems using cubic convolution resampling (CUBLC) (Figure 4).

3.3. Multi-Scale Thermal Regulation Mechanisms of Urban Green Space Configuration in Shijiazhuang

Based on cross-validation results, the optimal parameters for our model were determined as 1700 iterations (nt), tree complexity (tc) of 4, learning rate (lr) of 0.01, bagging fraction (bf) of 0.6, and the loss function was specified as Gaussian. Calibration procedures were completed prior to evaluating the BRT model’s performance using three statistical measures: MSE, RMSE, and MAE, which jointly characterize prediction accuracy and goodness-of-fit. As shown in Table 3, all evaluation metrics fell within acceptable ranges, confirming the model’s reliability in simulating cooling contribution rates and marginal effects of green landscape metrics across multiple grid scales.

3.3.1. Cooling Contributions of Green Space Landscape Metrics Across Grid Scales

Multi-scale analysis based on the BRT model (Table A1, Figure 5) revealed significant variations in the cooling efficiency of green space landscape metrics in Shijiazhuang’s central urban area during summers from 2022 to 2024. The green space quality metric consistently dominated cooling effects, but its contribution rate decreased markedly with increasing grid granularity. For instance, in 2024, its contribution declined from 45.45% at the 100 m grid scale to 31.21% at the 900 m grid scale, aligning with findings from Hangzhou and Baltimore [46,47]. This pattern arises because vegetation transpiration, driven by latent heat flux exchange, predominantly regulates microclimates at finer scales (100–300 m), whereas urban morphology parameters (e.g., building density, impervious surface ratio) exert greater influence on thermal environments at coarser scales (600–900 m) [48].
Spatial pattern and morphology metrics exhibited positive scale-dependent responses. Among them, AREA, ED, and AI showed the most pronounced gradient variations in thermal regulation. For instance, in 2024, the cooling contributions of AREA, ED, and AI increased from 100 m to 900 m grid scales, with relative cooling contribution rates of 14.8%, 4.38%, and 5.38%, respectively. The cross-scale stability of AREA validated the ecological superiority of large green patches: expansive patches facilitate temperature gradient attenuation through advective cooling from vegetation-driven cold air masses [49,50]. In contrast, fragmented green patches suffered reduced thermal stability due to edge effects and heightened interference from urban interfaces [51].
ED and AI demonstrated synergistic cooling enhancement, with combined contribution rates rising from 20.41% at 100 m to 27.24% at 900 m. This synergy stems from (1) improved connectivity in large green patches, amplifying cooling benefits through regional cold-air corridors that enhance urban ventilation efficiency [52,53], and (2) increased edge density at broader scales, which enhances shadow provision by tree canopies and energy exchange between vegetation and adjacent surfaces [47,54]. Notably, PD displayed an inverse scale response—consistent with observations in Bangkok and Jakarta [55]—where moderate fragmentation at micro-scales improves thermal comfort via homogeneous shadow distribution, while excessive fragmentation at macro-scales destabilizes thermal regulation.
LSI exhibited the lowest cooling contribution (mean 4.2%), underscoring that green space scale and connectivity optimization should be prioritized in planning. At larger scales, maintaining morphological diversity enhances ecological functionality, whereas overly complex configurations at community scales should be avoided to ensure thermal stability.

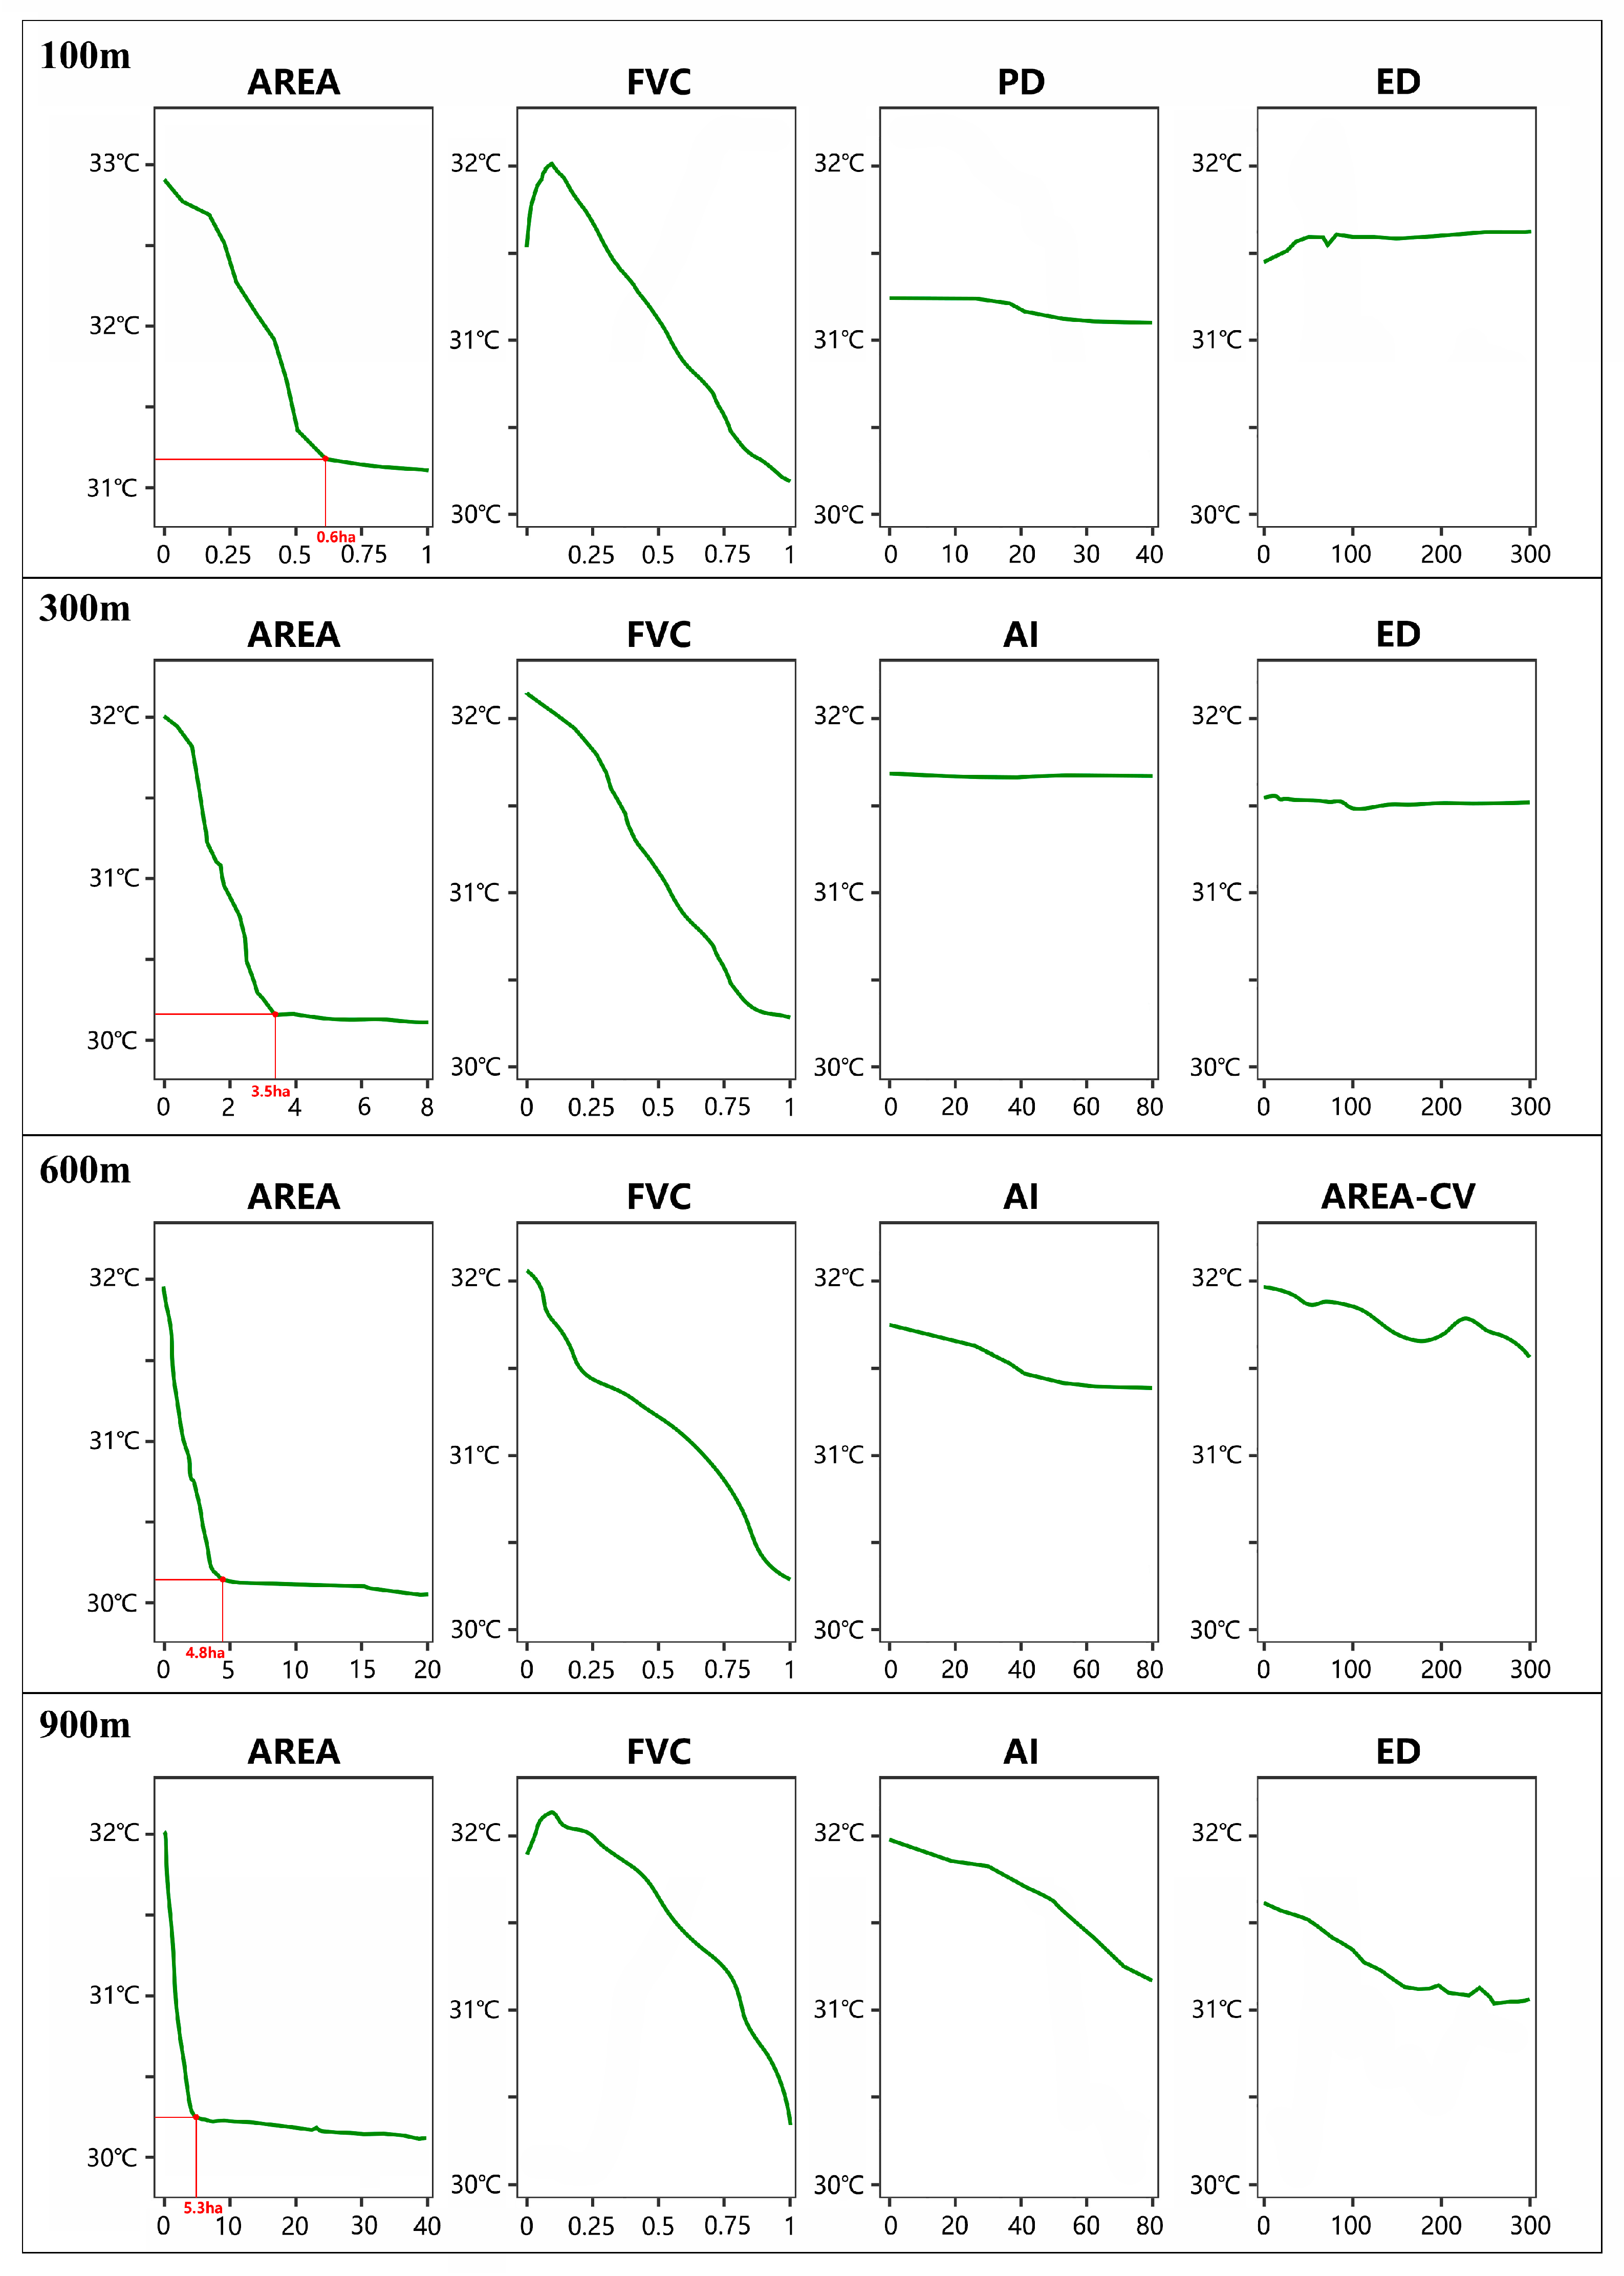
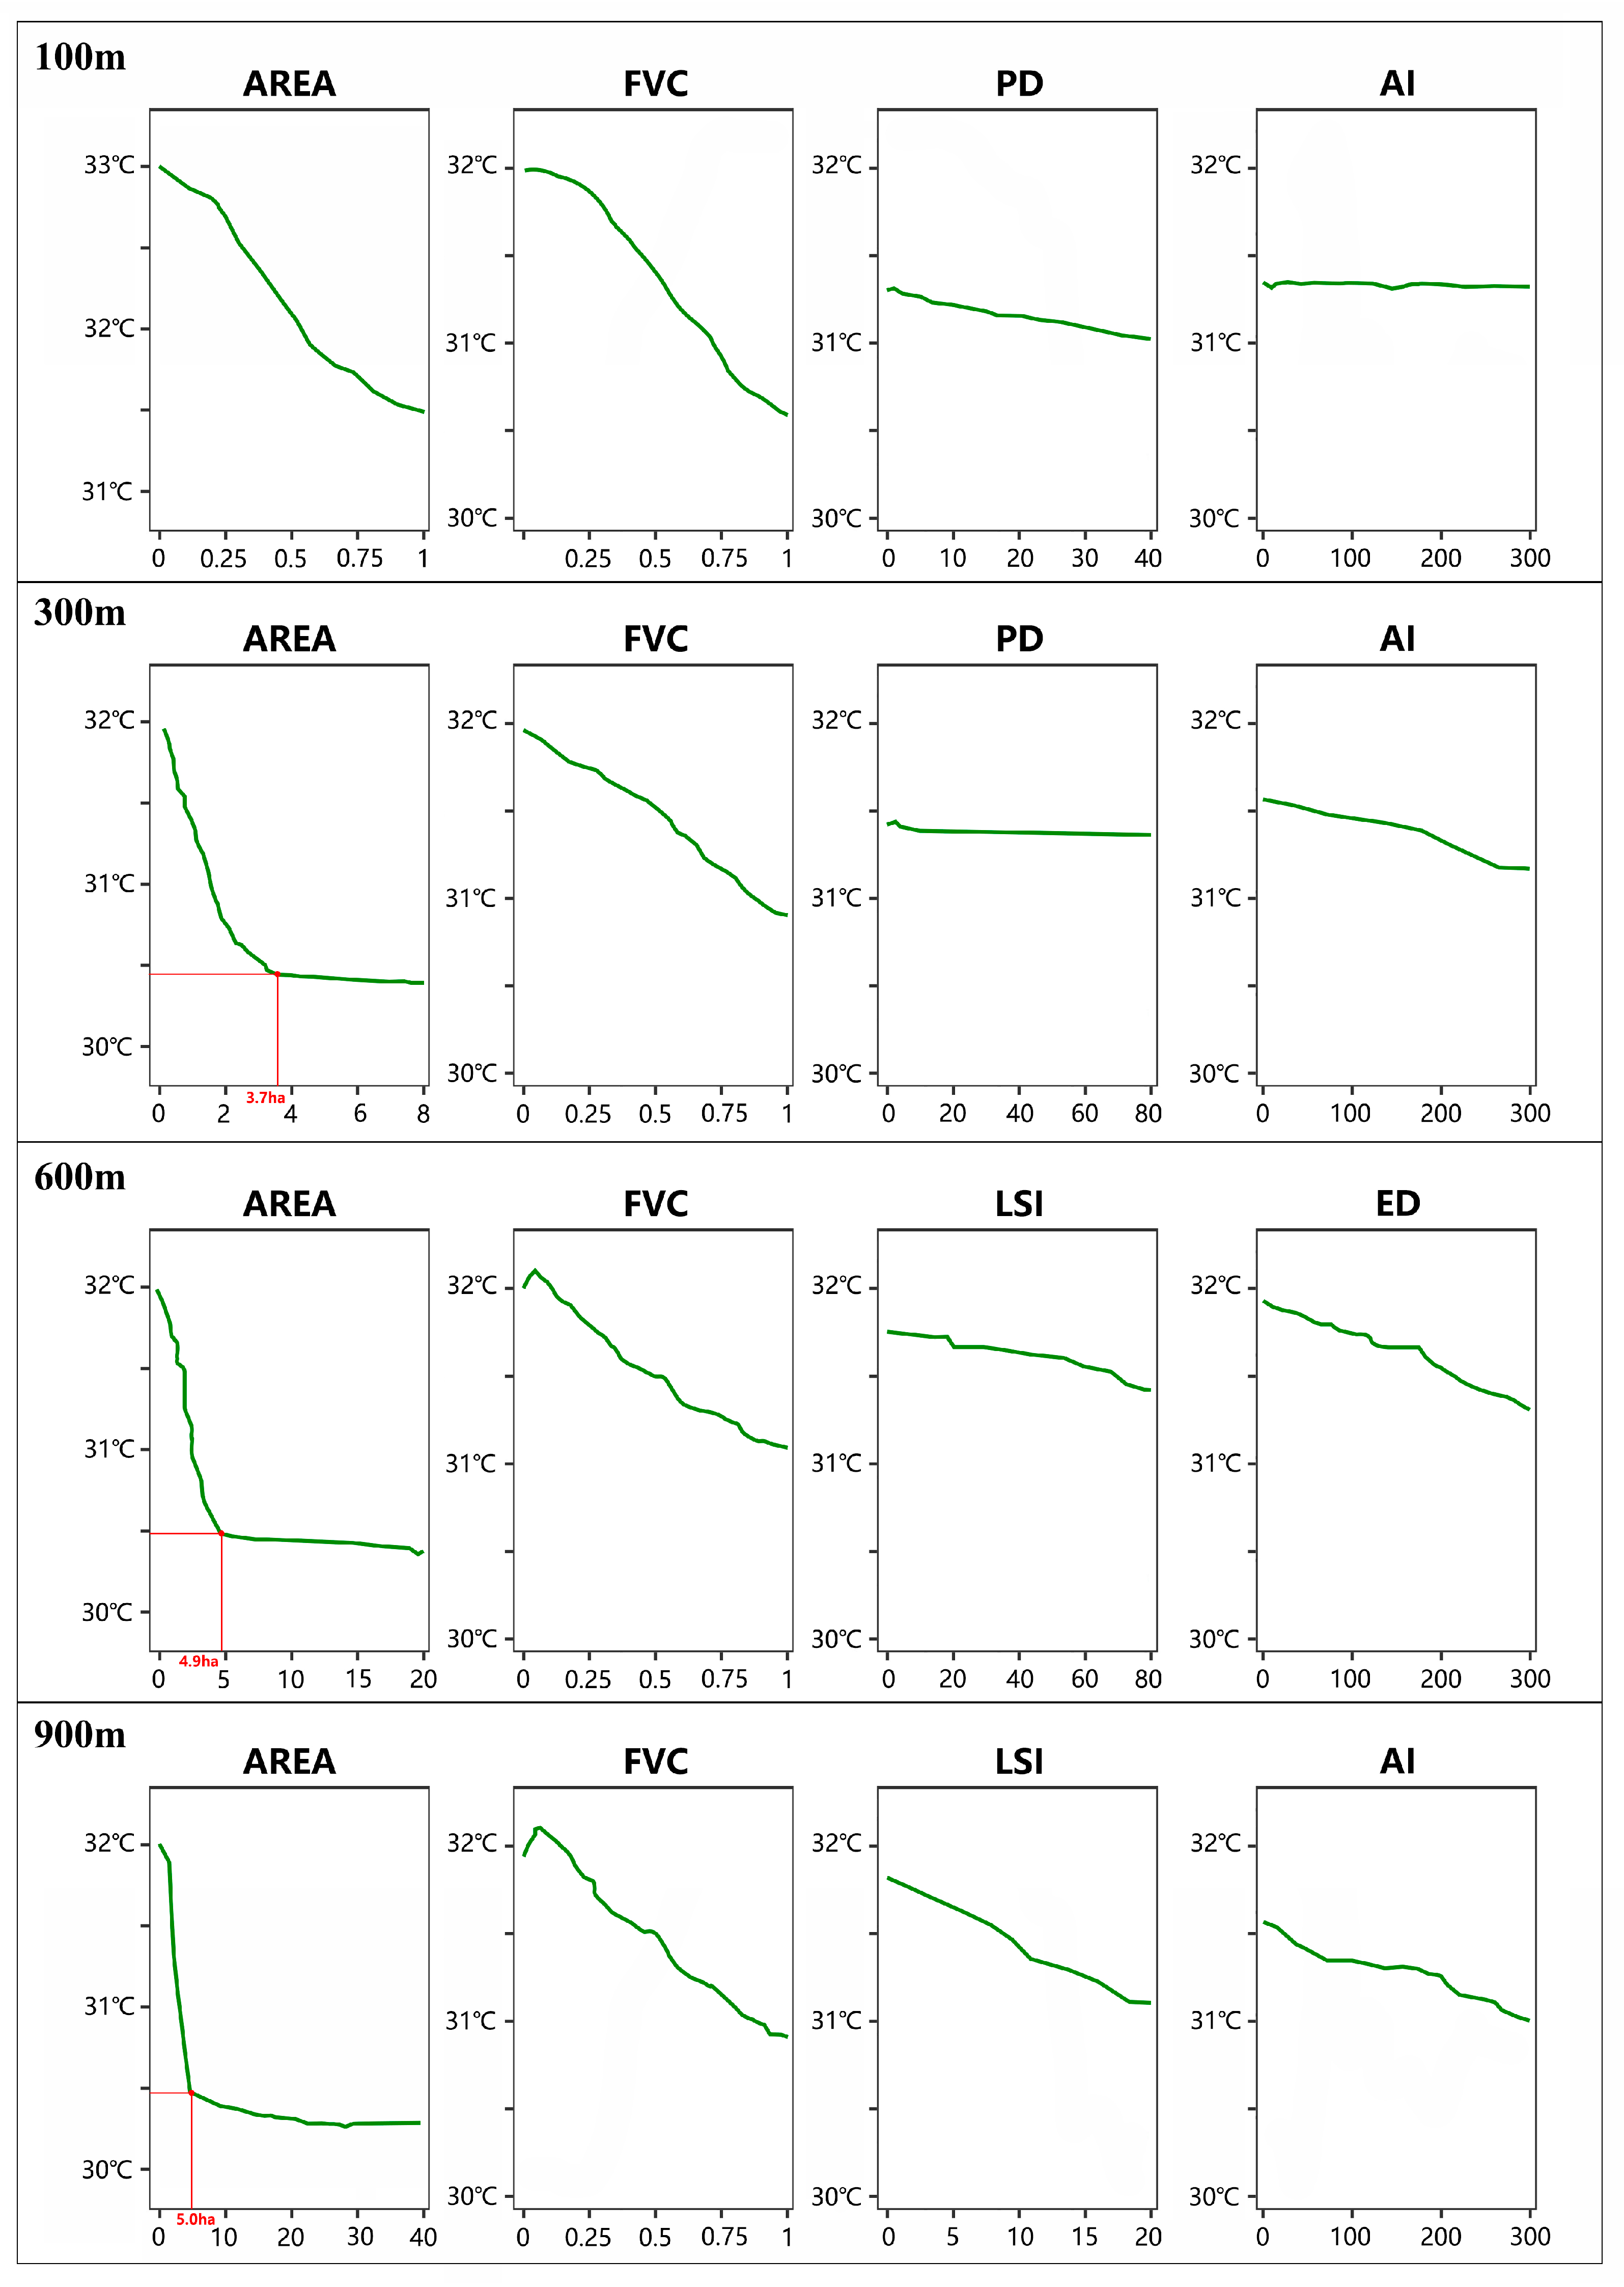
3.3.2. Marginal Effects Analysis of Key Green Space Landscape Metrics

This study integrated the BRT model with marginal effect curves to identify critical cooling efficiency thresholds and spatial response patterns of key green space metrics (Figure 6, Figure 7 and Figure 8). FVC, AREA, ED, and AI emerged as dominant factors, exhibiting significant scale-dependent heterogeneity. AREA’s marginal effects provided quantitative thresholds for green space planning, while other metrics offered qualitative guidance.
For FVC, the marginal cooling effect followed a three-stage “inverted U-shaped” curve. When FVC was below 30% (grassland-dominated), LST decreased by 0.4–0.6 °C per 10% increase in coverage. Within the 30–70% range (tree canopy-dominated), cooling efficiency peaked at 0.8–1.2 °C/10%, driven by enhanced shading and latent heat flux from tree transpiration. However, beyond 70%, marginal benefits declined to 0.3 °C/10% due to humidity-induced thermal inertia. Mechanistically, low FVC (<30%) relies on albedo regulation from sparse vegetation, while intermediate FVC (30–70%) benefits from synergistic shading (0.15 °C/m2 canopy expansion) and evapotranspiration [56].
AREA thresholds exhibited scale-dependent gradients. At the 100 m grid scale, cooling efficiency declined significantly beyond 0.6 ha, aligning with optimal community green space thresholds (0.5–0.7 ha) observed in Shanghai [23]. At coarser scales (300–900 m), the minimum effective AREA increased to 3.5–5.3 ha, comparable to the 5.3 ha absolute threshold reported for Beijing [57]. These findings provide actionable constraints for cost-effective green space interventions in high-density urban areas.
ED and AI demonstrated spatial synergy: (1) ED’s marginal benefits increased exponentially with scale, contrasting with linear patterns in tropical climates like Bangkok. This divergence may stem from enhanced evapotranspiration at green space edges under Shijiazhuang’s semi-arid conditions. (2) Synergistic cooling occurred when high AI (≥85.2) facilitated airflow and heat dissipation through connected green networks, while complex edges amplified heat exchange frequency.

4. Discussion

4.1. Multi-Scale Cooling Mechanisms of Summer Green Spaces in Central Shijiazhuang

4.1.1. Vegetation-Driven Physiological Regulation

Green space quality, as the core driver of urban cooling efficiency, demonstrates significant potential for optimizing vegetation configurations. Notably, FVC exhibits a critical threshold effect: beyond 70% FVC, the marginal cooling efficiency declines to approximately 0.3 °C per 10% increase, aligning with nonlinear threshold patterns observed in Beijing [58]. To mitigate diminishing marginal effects, we recommend prioritizing tree-dominated mixed vegetation communities in heat island cores while limiting grassland proportions to <35%. For Shijiazhuang’s semi-arid summer climate, native species with high transpiration efficiency (e.g., Sophora japonica and Fraxinus chinensis) should be prioritized to enhance air humidity and local thermal comfort. In non-accessible green corridors (e.g., protective belts), constructing multi-layered “forest-like” communities (trees-shrubs-grass) can amplify cooling isolation. These findings reaffirm the centrality of the “vegetation-first” principle in thermal regulation for high-density urban areas.

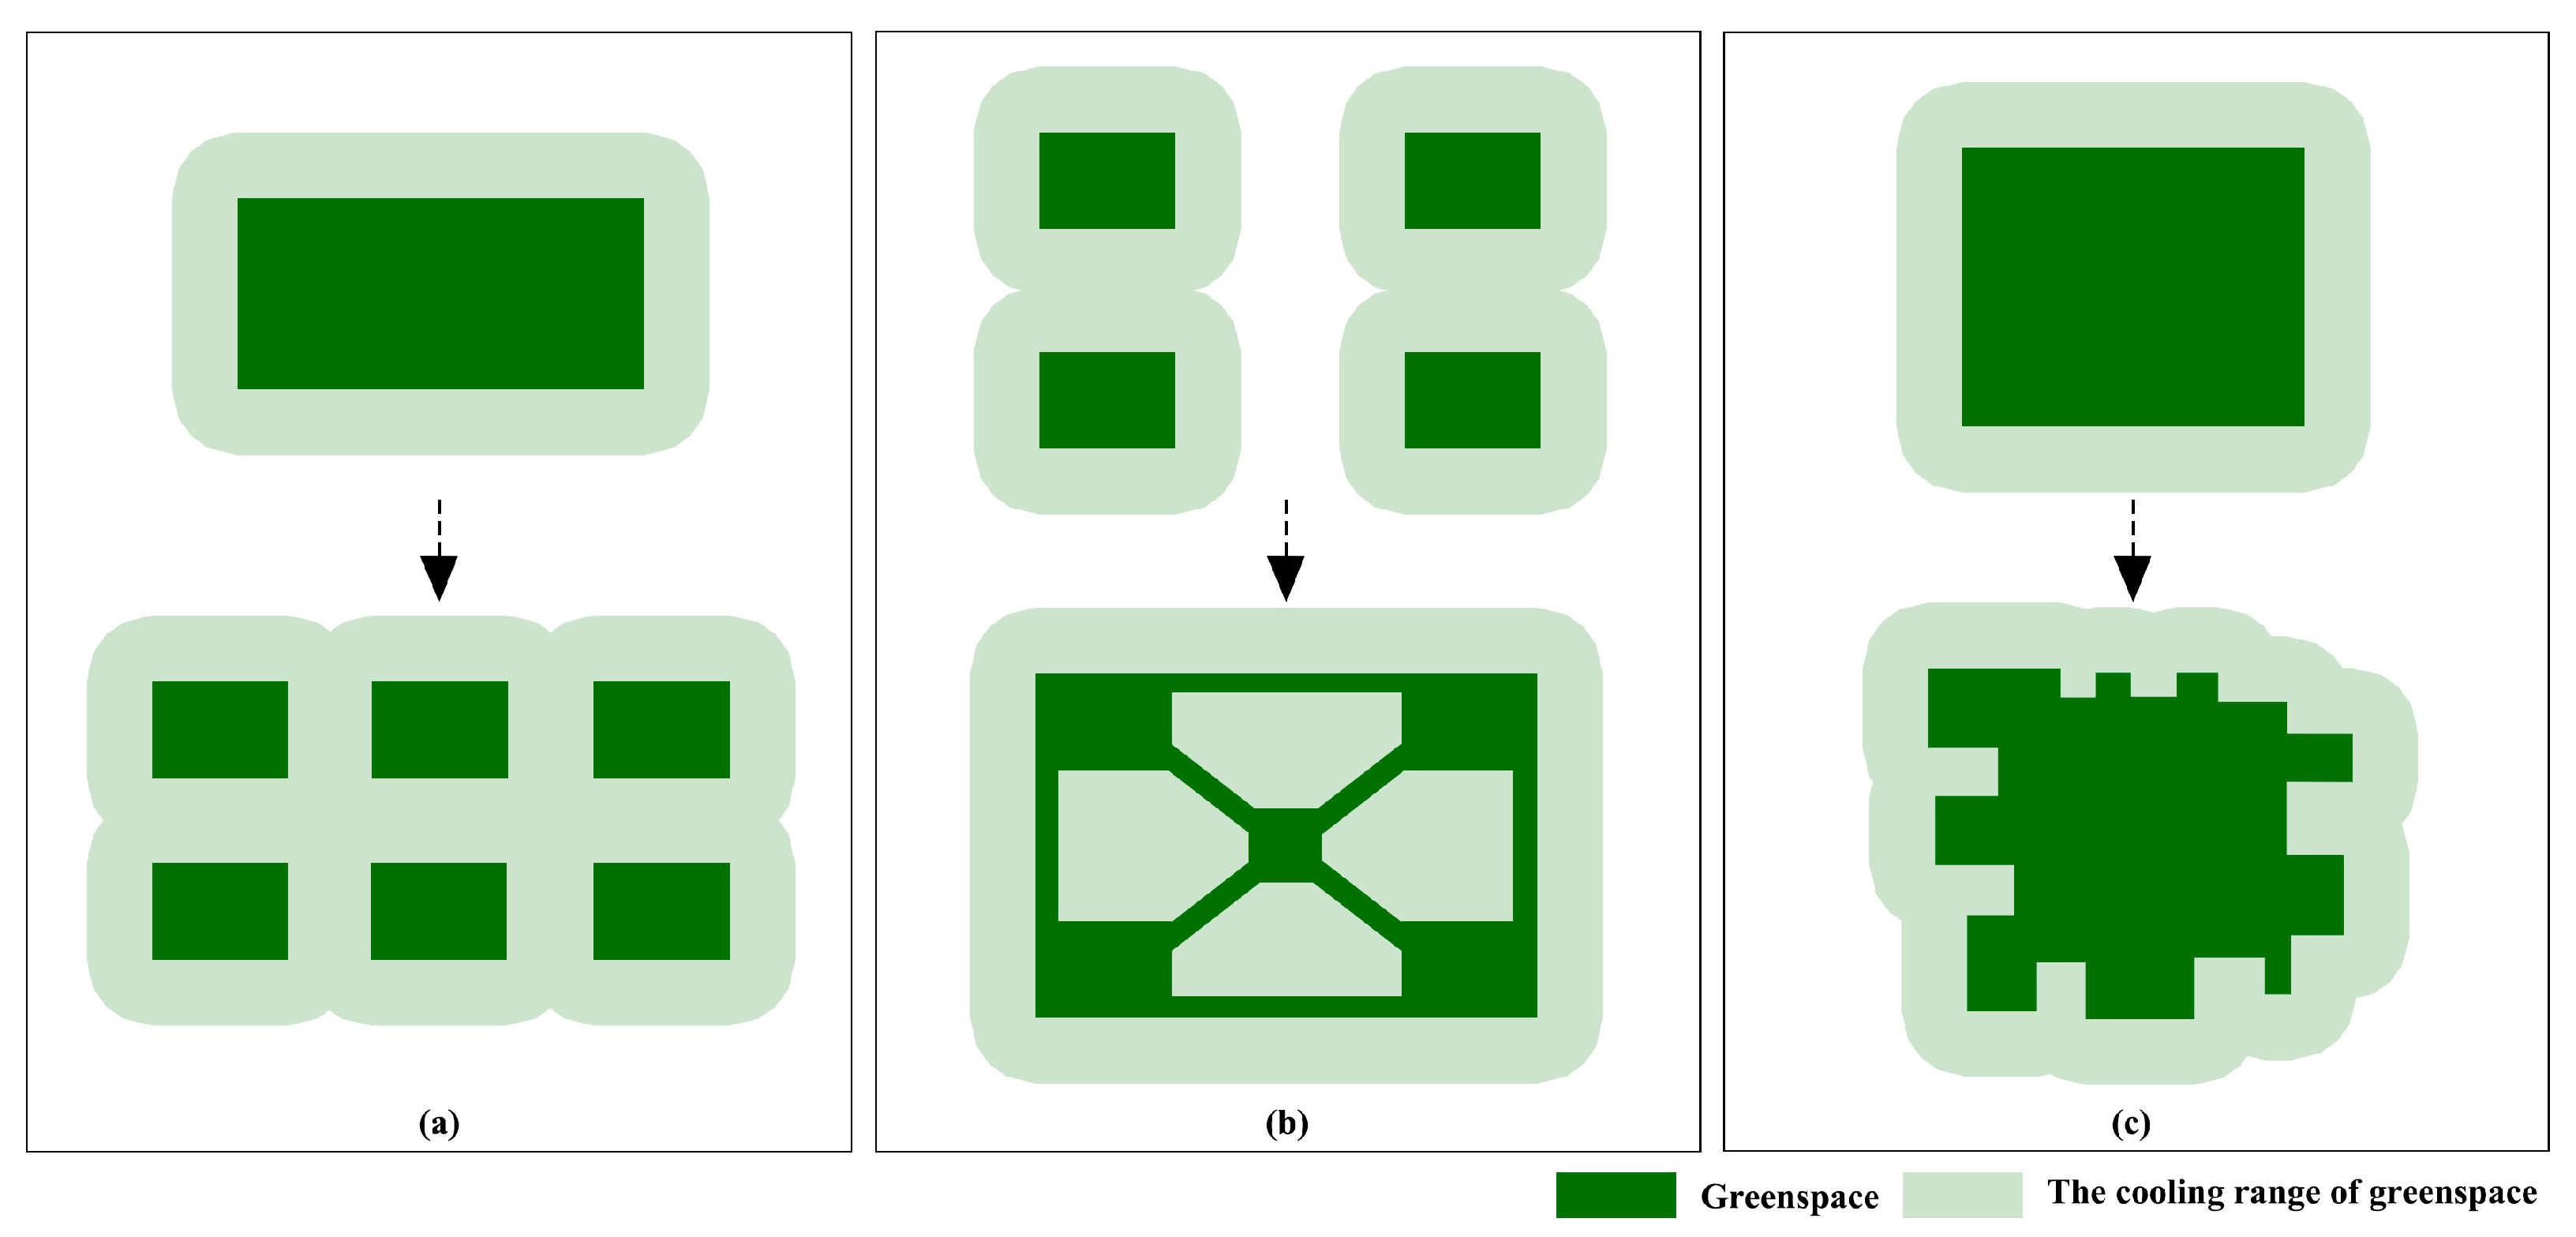
4.1.2. Scale-Dependent Synergy of Green Space Morphology and Patterns

The thermal regulation efficacy of green space metrics exhibits pronounced scale dependency (Figure 9). At micro-scales (100–300 m), FVC and PD dominate cooling, where discretely distributed vegetation patches improve microclimates through evenly dispersed shadows, with cooling efficiency positively correlated to PD. At meso-scales (300–900 m), AREA and AI emerge as key drivers, as contiguous green patches form regional cooling cores through stable cold-air diffusion, significantly reducing LST in surrounding areas. At macro-scales (>900 m), the coupling of ED and AI becomes critical: complex edge morphologies enhance turbulent mixing and latent heat exchange, while wedge-shaped green corridors channel cool air into urban interiors, fragmenting heat islands and improving thermal environments.
Based on multi-scale cooling contributions, we propose a three-tiered intervention framework:
  • Micro-scale (100–300 m): implement “vegetation optimization–patch dispersion” strategies, leveraging vertical greening systems and pocket parks to enhance local thermal resilience;
  • Meso-scale (300–900 m): establish “cold source patch–blue-green corridor” networks, integrating riverine and road greenways to connect park systems and block heat island expansion;
  • Macro-scale (>900 m): deploy “cold source anchoring–edge enhancement” tactics, designating peri-urban blue-green spaces as structural cold sources and aligning wedge-shaped ventilation corridors with dominant wind directions for systemic thermal mitigation.
The three-tier optimization framework proposed in this study, through the matrix-based strategy mapping in Figure 10, translates theoretical thresholds into planning guidelines, providing a quantifiable multi-scale collaborative paradigm for green space system planning in compact cities. In the green space optimization matrix strategy diagram, the following apply:
  • The vertical axis represents the cooling contribution rates of green space landscape metrics (based on BRT model results); the horizontal axis indicates planning implementation priorities (determined by metric threshold sensitivity);
  • A color gradient from dark to light illustrates strategic intervention priority intensity;
  • Arrow directions reflect the logic of “scale progression-strategy synergy”: micro-scale (FVC/PD-dominated) focuses on green space’s quality enhancement, meso-scale (AREA/AI-dominated) emphasizes green space system connectivity reinforcement, and macro-scale (ED/AI-synergized) anchors suburbs cold source networks;
  • Asterisks denote strategies requiring cross-scale coordination.

4.2. Climate-Adaptive Mechanisms of Summer Green Spaces in Central Shijiazhuang

Under Shijiazhuang’s summer conditions—characterized by intense solar radiation and low humidity—green spaces exhibit unique climate-responsive cooling mechanisms. First, the exponential marginal benefits of ED observed in this study contrast with linear patterns in tropical humid climates (e.g., Bangkok) [55], potentially driven by enhanced edge evapotranspiration under high insolation. Evapotranspiration rates at green-hardscape interfaces exceed those in core green areas, suggesting that increasing edge density in green space peripheries could amplify cooling efficiency. Second, the synergy between FVC and AI reveals that spatially continuous high-coverage green spaces form a dual cooling pathway combining vegetative transpiration and corridor ventilation, further amplified by summer aridity. Streamlined green morphologies aligned with prevailing winds reduce airflow resistance, enhancing local wind speeds and evaporative cooling. However, low humidity may constrain transpiration efficiency, necessitating integrated blue-green infrastructure designs (e.g., riparian vegetation coupled with water bodies) to elevate local humidity and optimize cooling [8].

4.3. Coordinated Mechanisms and Implementation Pathways for Green Space Planning

4.3.1. Collaborative Mechanisms for Green Space Planning and Construction

Building on the multi-scale optimization strategy matrix (Figure 10), a coordinated management framework should integrate data-driven governance, spatial adaptability, and industrial synergies. Key mechanisms include the following:
  • Cross-departmental evaluation platform: Integrate multi-source data (natural resources, ecology, urban development) and embed BRT-derived thresholds (e.g., FVC ≥ 70%, AREA ≥ 3.5 ha) into mandatory urban renewal checklists;
  • “Heat Mitigation Quota” system: This policy links green space contributions to land rights through the Green Tax mechanism that incentivizes environmental accountability [59]. It mandates developers in high-temperature zones to construct cooling-source green spaces or offset environmental impacts from urban development via carbon credit trading;
  • Green-industrial synergy: Prioritize temperature-sensitive industries (e.g., data centers, tech hubs) in cooling corridors, achieving industrial decarbonization and thermal environment improvement.

4.3.2. Fiscal Policy Incentives and Market-Based Regulation

To ensure the implementation and sustainability of matrix-driven strategies, a tiered policy toolkit should be designed:
  • Fiscal leverage: Provide “cooling subsidies” to enterprises meeting multi-scale thresholds, such as property tax reductions (up to 30%) for communities achieving vegetation coverage standards (FVC > 70%) and special bond interest discounts for green infrastructure projects in cooling corridors;
  • Development rights trading: Establish a “Green Space Bank” mechanism, allowing high-density development zones to invest in large-scale green space construction in peripheral areas through transfer payments [60]. Upon remote sensing verification of cooling efficacy, these investments qualify for floor area ratio (FAR) incentives;
  • Green finance innovation: Issue Cooling Performance Bonds (CPBs) to guide private capital participation in multi-scale green network development [60].

4.4. Limitations and Future Research Directions

4.4.1. Limitations and Constraints

This study systematically reveals the cooling mechanisms and marginal effect thresholds of multi-scale green space patterns using summer multi-source remote sensing data from 2022 to 2024, yet several limitations persist. First, the current model lacks transient response mechanisms to extreme climate events (e.g., heatwaves), potentially underestimating dynamic fluctuations in ecological services under high-stress environments. Second, the singular focus on green space cooling effects neglects spatial coupling mechanisms between built-up morphology, water bodies, and other land cover types. This study proposed that the “threshold-based management” paradigm addresses empirical limitations in traditional planning; this omission may compromise the precision of multi-element synergistic regulation strategies. Additionally, the reliance on static summer data limits the characterization of seasonal variations in thermal regulation efficiency, particularly in transitional climates like Shijiazhuang’s semi-arid steppe environment.

4.4.2. Future Research Directions

To address these limitations, future research should expand to multidimensional coupling analyses. First, incorporating seasonal vegetation phenology and diurnal–nocturnal thermal variations could develop all-weather dynamic models of green space thermal regulation, enhancing adaptability to extreme weather scenarios. Second, given the significant socioeconomic drivers of green space distribution (e.g., population density, land tenure, and policy interventions), integrating multi-source datasets—such as nighttime light imagery and mobile signaling data—is urgently needed to quantify spatiotemporal interactions among LST, green space patterns, and socioeconomic factors [61]. This integration would advance socially actionable decision-making tools for climate-adaptive planning. Finally, extending the BRT framework to incorporate 3D urban morphology parameters (e.g., building height-to-width ratios, sky view factor) and blue-green infrastructure synergy indices could refine the mechanistic understanding of cross-scale thermal regulation in high-density cities.

5. Conclusions

This study advances urban thermal environment research by applying machine learning algorithms, specifically the BRT model, to unravel the multi-scale thermal regulation mechanisms of green space patterns. Our findings facilitate a paradigm shift in green space planning from “empirical decision-making” to “threshold-driven management”. The key conclusions are as follows:
  • The cooling efficiency of green spaces exhibits pronounced spatial heterogeneity and scale dependence, with quality metrics (e.g., FVC and AREA) showing declining contributions at larger scales, while configuration metrics (e.g., AI and ED) demonstrate positive scale responses, validating the “micro-scale quality dominance vs. macro-scale pattern regulation” mechanism;
  • The BRT model quantitatively identifies critical thresholds: FVC achieves peak marginal cooling efficiency (0.8–1.2 °C per 10% increase) within the 30–70% range, while AREA’s minimum effective cooling threshold escalates from 0.6 ha (micro-scale) to 3.5 ha (macro-scale);
  • Based on multi-scale cooling mechanism analysis, a three-tier matrix optimization framework for green space strategies is established, integrating “micro-level regulation, meso-level connectivity, and macro-level anchoring”.
The methodological innovation of this study lies in establishing a systematic framework that couples BRT modeling with multi-granularity grid analysis, which mechanistically deciphers the nonlinear cooling mechanisms of urban green space patterns characterized by “micro-scale quality dominance and macro-scale pattern regulation”. Threshold-quantified optimization matrices further bridge theoretical insights to planning implementation, providing an integrated solution from thermal mechanism elucidation to actionable strategies for mitigating heat island effects in high-density urban systems.

Author Contributions

Conceptualization, H.L. and Y.Q.; methodology, H.L. and Y.Q.; software, H.L.; validation, H.L.; formal analysis, H.L.; investigation, H.L.; resources, H.L., Y.Q.; data curation, H.L.; writing—original draft preparation, H.L.; writing—review and editing, H.L. and Y.Q.; visualization, H.L.; supervision, Y.Q.; project administration, H.L. and Y.Q. All authors have read and agreed to the published version of the manuscript.

Funding

This research received no external funding.

Institutional Review Board Statement

Not applicable.

Informed Consent Statement

Not applicable.

Data Availability Statement

The Landsat 8 OLI/TIRS satellite images utilized in this study are publicly available from the United States Geological Survey (USGS) Earth Explorer platform at https://earthexplorer.usgs.gov/ (accessed on 22 January 2025). Sentinel-2 datasets were obtained through the Copernicus Data Space Ecosystem at https://dataspace.copernicus.eu/ (accessed on 24 January 2025).

Conflicts of Interest

The authors declare no conflicts of interest.

Appendix A

Table A1. Cooling contribution rate of green space landscape metrics (unit: %).
Green Space IndicatorGreen Space QualityGreen Space PatternGreen Space Shape
FVCAREAEDPDAREA-CVLSIAI
2022100 m38.6613.3711.6413.576.527.478.77
300 m41.0111.1813.098.867.337.4411.09
600 m36.0114.4812.116.149.38.8113.15
900 m32.1418.1313.212.111.229.1714.03
2023100 m43.7513.099.6412.848.075.746.87
300 m39.0915.1411.6610.3810.177.386.18
600 m36.9114.3411.424.929.5211.0711.82
900 m38.817.3412.531.688.1310.0111.51
2024100 m45.4515.267.0410.028.944.738.56
300 m36.819.667.6211.118.775.7210.32
600 m37.5520.3211.454.047.7211.667.26
900 m31.2125.0611.421.864.212.3113.94

Appendix B

The coefficient of determination (R2) ranges from 0 to 1, with values approaching 1 indicating stronger explanatory capacity and superior data-model alignment. MSE quantifies the squared difference between predicted and observed values, where minimized values denote reduced error magnitude. As a core regression indicator, RMSE estimates the prediction error scale, with lower values reflecting higher accuracy. MAE calculates the mean absolute deviation between predictions and observations, where diminished values correlate with improved model precision.
Table A2. Summary of BRT model evaluation parameters.
ParameterFormula
R2 R 2 = 1 i = 0 m ( y i y i ^ ) 2 i = 0 m ( y i y ¯ ) 2
MSE M S E = 1 m i = 1 m ( y i y i ^ ) 2
RMSE R M S E = 1 m i = 1 m ( y i y i ^ ) 2
MAE M A E = 1 m i = 1 m y i y i ^
In these formulas, y i represents observed values, y ^ denotes predicted values, y ¯ is the mean of observed values, and m indicates sample size.

References

  1. Briegel, F.; Makansi, O.; Brox, T.; Matzarakis, A.; Christen, A. Modelling long-term thermal comfort conditions in urban environments using a deep convolutional encoder-decoder as a computational shortcut. Urban Clim. 2023, 47, 101359. [Google Scholar] [CrossRef]
  2. Kuang, W.; Dou, Y. Investigating the Patterns and Dynamics of Urban Green Space in China’s 70 Major Cities Using Satellite Remote Sensing. Remote Sens. 2020, 12, 1929. [Google Scholar] [CrossRef]
  3. Safarrad, T.; Ghadami, M.; Dittmann, A.G. Effects of COVID-19 Restriction Policies on Urban Heat Islands in Some European Cities: Berlin, London, Paris, Madrid, and Frankfurt. Int. J. Environ. Res. Public Health 2022, 19, 6579. [Google Scholar] [CrossRef] [PubMed]
  4. Cao, Q.; Yu, D.; Georgescu, M.; Wu, J.; Wang, W. Impacts of future urban expansion on summer climate and heat-related human health in eastern China. Environ. Int. 2018, 112, 134–146. [Google Scholar] [CrossRef] [PubMed]
  5. Sippel, S.; Meinshausen, N.; Fischer, E.M.; Székely, E.; Knutti, R. Climate change now detectable from any single day of weather at global scale. Nat. Clim. Change 2020, 10, 35–41. [Google Scholar] [CrossRef]
  6. Liu, H.; Huang, B.; Zhan, Q.; Gao, S.; Li, R.; Fan, Z. The influence of urban form on surface urban heat island and its planning implications: Evidence from 1288 urban clusters in China. Sustain. Cities Soc. 2021, 71, 102987. [Google Scholar] [CrossRef]
  7. Yao, L.; Li, T.; Xu, M.; Xu, Y. How the landscape features of urban green space impact seasonal land surface temperatures at a city-block-scale: An urban heat island study in Beijing, China. Urban For. Urban Green. 2020, 52, 126704. [Google Scholar] [CrossRef]
  8. Tan, X.; Sun, X.; Huang, C.; Yuan, Y.; Hou, D. Comparison of cooling effect between green space and water body. Sustain. Cities Soc. 2021, 67, 102711. [Google Scholar] [CrossRef]
  9. Masoudi, M.; Tan, P.Y.; Liew, S.C. Multi-city comparison of the relationships between spatial pattern and cooling effect of urban green spaces in four major Asian cities. Ecol. Indic. 2019, 98, 200–213. [Google Scholar] [CrossRef]
  10. Gao, Y.; Zhao, J.; Yu, K. Effects of block morphology on the surface thermal environment and the corresponding planning strategy using the geographically weighted regression model. Build. Environ. 2022, 216, 109037. [Google Scholar] [CrossRef]
  11. Yu, Z.; Guo, X.; Zeng, Y.; Koga, M.; Vejre, H. Variations in land surface temperature and cooling efficiency of green space in rapid urbanization: The case of Fuzhou city, China. Urban For. Urban Green. 2018, 29, 113–121. [Google Scholar] [CrossRef]
  12. Zhang, Y.; Ge, J.; Wang, S.; Dong, C. Optimizing urban green space configurations for enhanced heat island mitigation: A geographically weighted machine learning approach. Sustain. Cities Soc. 2025, 119, 106087. [Google Scholar] [CrossRef]
  13. Liu, F.; Liu, J.; Zhang, Y.; Hong, S.; Fu, W.; Wang, M.; Dong, J. Construction of a cold island network for the urban heat island effect mitigation. Sci. Total Environ. 2024, 915, 169950. [Google Scholar] [CrossRef]
  14. Park, S.; Park, J.; Lee, S. Unpacking the nonlinear relationships and interaction effects between urban environment factors and the urban nighttime heat index. J. Clean. Prod. 2023, 428, 139407. [Google Scholar] [CrossRef]
  15. Shao, L.; Liao, W.; Li, P.; Luo, M.; Xiong, X.; Liu, X. Drivers of global surface urban heat islands: Surface property, climate background, and 2D/3D urban morphologies. Build. Environ. 2023, 242, 110581. [Google Scholar] [CrossRef]
  16. Shen, Z.; Xu, X.; Xu, S.; Sun, D. A comparative study of land development patterns and regional thermal environments (RTEs) in typical urban agglomerations of China and America: A case study of Beijing-Tianjin-Hebei (BTH) and Boswash. Sci. Total Environ. 2022, 803, 149735. [Google Scholar] [CrossRef]
  17. Zheng, S.; Chen, X.; Liu, Y. Impact of urban renewal on urban heat island: Study of renewal processes and thermal effects. Sustain. Cities Soc. 2023, 99, 104995. [Google Scholar] [CrossRef]
  18. Hou, H.; Longyang, Q.; Su, H.; Zeng, R.; Xu, T.; Wang, Z.-H. Prioritizing environmental determinants of urban heat islands: A machine learning study for major cities in China. Int. J. Appl. Earth Obs. Geoinf. 2023, 122, 103411. [Google Scholar] [CrossRef]
  19. Bansal, P.; Quan, S.J. Examining temporally varying nonlinear effects of urban form on urban heat island using explainable machine learning: A case of Seoul. Build. Environ. 2024, 247, 110957. [Google Scholar] [CrossRef]
  20. Chen, P. Inequality in heat: The role of spatial patterns of urban green infrastructure. Urban Clim. 2024, 53, 101820. [Google Scholar] [CrossRef]
  21. Zhang, Z.; Luan, W.; Yang, J.; Guo, A.; Su, M.; Tian, C. The influences of 2D/3D urban morphology on land surface temperature at the block scale in Chinese megacities. Urban Clim. 2023, 49, 101553. [Google Scholar] [CrossRef]
  22. Lu, L.; Fu, P.; Dewan, A.; Li, Q. Contrasting determinants of land surface temperature in three megacities: Implications to cool tropical metropolitan regions. Sustain. Cities Soc. 2023, 92, 104505. [Google Scholar] [CrossRef]
  23. Sun, L.; Xie, C.; Qin, Y.; Zhou, R.; Wu, H.; Che, S. Study on temperature regulation function of green spaces at community scale in high-density urban areas and planning design strategies. Urban For. Urban Green. 2024, 101, 128511. [Google Scholar] [CrossRef]
  24. Li, W.; Han, C.; Li, W.; Zhou, W.; Han, L. Multi-scale effects of urban agglomeration on thermal environment: A case of the Yangtze River Delta Megaregion, China. Sci. Total Environ. 2020, 713, 136556. [Google Scholar] [CrossRef] [PubMed]
  25. Xiao, R.; Cao, W.; Liu, Y.; Lu, B. The impacts of landscape patterns spatio-temporal changes on land surface temperature from a multi-scale perspective: A case study of the Yangtze River Delta. Sci. Total Environ. 2022, 821, 153381. [Google Scholar] [CrossRef]
  26. Beck, H.E.; Zimmermann, N.E.; McVicar, T.R.; Vergopolan, N.; Berg, A.; Wood, E.F. Present and future Köppen-Geiger climate classification maps at 1-km resolution. Sci. Data 2018, 5, 180214. [Google Scholar] [CrossRef]
  27. Wong, N.H.; Tan, C.L.; Kolokotsa, D.D.; Takebayashi, H. Greenery as a mitigation and adaptation strategy to urban heat. Nat. Rev. Earth Environ. 2021, 2, 166–181. [Google Scholar] [CrossRef]
  28. Richards, D.R.; Fung, T.K.; Belcher, R.N.; Edwards, P.J. Differential air temperature cooling performance of urban vegetation types in the tropics. Urban For. Urban Green. 2020, 50, 126651. [Google Scholar] [CrossRef]
  29. Teshnehdel, S.; Akbari, H.; Di Giuseppe, E.; Brown, R.D. Effect of tree cover and tree species on microclimate and pedestrian comfort in a residential district in Iran. Build. Environ. 2020, 178, 106899. [Google Scholar] [CrossRef]
  30. Kong, F.; Yin, H.; James, P.; Hutyra, L.R.; He, H.S. Effects of spatial pattern of greenspace on urban cooling in a large metropolitan area of eastern China. Landsc. Urban Plan. 2014, 128, 35–47. [Google Scholar] [CrossRef]
  31. Peng, J.; Xie, P.; Liu, Y.; Ma, J. Urban thermal environment dynamics and associated landscape pattern factors: A case study in the Beijing metropolitan region. Remote Sens. Environ. 2016, 173, 145–155. [Google Scholar] [CrossRef]
  32. Xie, M.; Wang, Y.; Chang, Q.; Fu, M.; Ye, M. Assessment of landscape patterns affecting land surface temperature in different biophysical gradients in Shenzhen, China. Urban Ecosyst. 2013, 16, 871–886. [Google Scholar] [CrossRef]
  33. Li, J.; Song, C.; Cao, L.; Zhu, F.; Meng, X.; Wu, J. Impacts of landscape structure on surface urban heat islands: A case study of Shanghai, China. Remote Sens. Environ. 2011, 115, 3249–3263. [Google Scholar] [CrossRef]
  34. Xu, J.; Yu, Y.; Zhou, W.; Yu, W.; Wu, T. Effects of the Spatial Pattern of Forest Vegetation on Urban Cooling in Large Metropolitan Areas of China: A Multi-Scale Perspective. Forests 2024, 15, 1778. [Google Scholar] [CrossRef]
  35. Jimenez, J.-C.; Sobrino, J. A generalized single-channel method for retrieving land surface temperature from remote sensing data. J. Geophys. Res. 2003, 108. Correction in J. Geophys. Res. 2004, 109, D08112. [Google Scholar] [CrossRef]
  36. Chander, G.; Markham, B.L.; Helder, D.L. Summary of current radiometric calibration coefficients for Landsat MSS, TM, ETM+, and EO-1 ALI sensors. Remote Sens. Environ. 2009, 113, 893–903. [Google Scholar] [CrossRef]
  37. Weng, Q. Thermal infrared remote sensing for urban climate and environmental studies: Methods, applications, and trends. ISPRS J. Photogramm. Remote Sens. 2009, 64, 335–344. [Google Scholar] [CrossRef]
  38. Rouse, J.W.; Haas, R.H.; Schell, J.A.; Deering, D.W. Monitoring vegetation systems in the Great Plains with ERTS. In Proceedings of the Third Earth Resources Technology Satellite-1 Symposium, Washington, DC, USA, 10–14 December 1974. [Google Scholar]
  39. Carlson, T.N.; Ripley, D.A. On the relation between NDVI, fractional vegetation cover, and leaf area index. Remote Sens. Environ. 1997, 62, 241–252. [Google Scholar] [CrossRef]
  40. Weng, Q.; Lu, D.; Schubring, J. Estimation of land surface temperature–vegetation abundance relationship for urban heat island studies. Remote Sens. Environ. 2004, 89, 467–483. [Google Scholar] [CrossRef]
  41. Ridgeway, G. Generalized Boosted Models: A Guide to the gbm Package. Update 2007, 1. 2007. Available online: http://www.saedsayad.com/docs/gbm2.pdf (accessed on 24 January 2025).
  42. Elith, J.; Leathwick, J.R.; Hastie, T. A working guide to boosted regression trees. J. Anim. Ecol. 2008, 77, 802–813. [Google Scholar] [CrossRef] [PubMed]
  43. Shah, D.; De Wolf, E.; Paul, P.; Madden, L. Predicting Fusarium Head Blight Epidemics with Boosted Regression Trees. Phytopathology 2014, 104. [Google Scholar] [CrossRef] [PubMed]
  44. De’ath, G. Boosted Trees for Ecological Modeling and Prediction. Ecology 2007, 88, 243–251. [Google Scholar] [CrossRef] [PubMed]
  45. Zhang, Y.; Chen, H.; Reich, P. Forest productivity increases with evenness, species richness and trait. J. Ecol. 2012, 100, 742–749. [Google Scholar] [CrossRef]
  46. Wu, Y.; Hou, H.; Wang, R.; Murayama, Y.; Wang, L.; Hu, T. Effects of landscape patterns on the morphological evolution of surface urban heat island in Hangzhou during 2000–2020. Sustain. Cities Soc. 2022, 79, 103717. [Google Scholar] [CrossRef]
  47. Zhou, W.; Wang, J.; Cadenasso, M.L. Effects of the spatial configuration of trees on urban heat mitigation: A comparative study. Remote Sens. Environ. 2017, 195, 1–12. [Google Scholar] [CrossRef]
  48. Jing, C.; Li, S.; Cao, S.; Ma, X. Study on influencing factors and influencing strength of urban green space relieving heat island effect—Taking Beijing as an example. IOP Conf. Ser. Earth Environ. Sci. 2020, 601, 012033. [Google Scholar] [CrossRef]
  49. Gioia, A.; Paolini, L.; Malizia, A.; Oltra-Carrió, R.; Sobrino, J.A. Size matters: Vegetation patch size and surface temperature relationship in foothills cities of northwestern Argentina. Urban Ecosyst. 2014, 17, 1161–1174. [Google Scholar] [CrossRef]
  50. Chang, C.-R.; Li, M.-H. Effects of urban parks on the local urban thermal environment. Urban For. Urban Green. 2014, 13, 672–681. [Google Scholar] [CrossRef]
  51. Li, H.; Li, Y.; Wang, T.; Wang, Z.; Gao, M.; Shen, H. Quantifying 3D building form effects on urban land surface temperature and modeling seasonal correlation patterns. Build. Environ. 2021, 204, 108132. [Google Scholar] [CrossRef]
  52. Ezimand, K.; Aghighi, H.; Ashourloo, D.; Shakiba, A. The analysis of the spatio-temporal changes and prediction of built-up lands and urban heat islands using multi-temporal satellite imagery. Sustain. Cities Soc. 2024, 103, 105231. [Google Scholar] [CrossRef]
  53. Rahimi, E.; Barghjelveh, S.; Dong, P. Quantifying how urban landscape heterogeneity affects land surface temperature at multiple scales. J. Ecol. Environ. 2021, 45, 22. [Google Scholar] [CrossRef]
  54. Li, X.; Zhou, W. Optimizing urban greenspace spatial pattern to mitigate urban heat island effects: Extending understanding from local to the city scale. Urban For. Urban Green. 2019, 41, 255–263. [Google Scholar] [CrossRef]
  55. Estoque, R.C.; Murayama, Y.; Myint, S.W. Effects of landscape composition and pattern on land surface temperature: An urban heat island study in the megacities of Southeast Asia. Sci. Total Environ. 2017, 577, 349–359. [Google Scholar] [CrossRef] [PubMed]
  56. Li, J.; Liu, N. The perception, optimization strategies and prospects of outdoor thermal comfort in China: A review. Build. Environ. 2020, 170, 106614. [Google Scholar] [CrossRef]
  57. Zhou, W.; Yu, W.; Zhang, Z.; Cao, W.; Wu, T. How can urban green spaces be planned to mitigate urban heat island effect under different climatic backgrounds? A threshold-based perspective. Sci. Total Environ. 2023, 890, 164422. [Google Scholar] [CrossRef]
  58. Yan, L.; Jia, W.; Zhao, S. The Cooling Effect of Urban Green Spaces in Metacities: A Case Study of Beijing, China’s Capital. Remote Sens. 2021, 13, 4601. [Google Scholar] [CrossRef]
  59. Yao, B.; Li, C.; Huang, R. Study on the Dynamic Analysis of the Evolutionary Game and Influence Effect of Green Taxation in Promoting the Development of New Energy Industry. J. Compr. Bus. Adm. Res. 2024, 1–10. [Google Scholar] [CrossRef]
  60. Nureen; Nuta, A.C. Envisioning the Invisible: Unleashing the Interplay Between Green Supply Chain Management and Green Human Resource Management: An Ability-Motivation-Opportunity Theory Perspective Towards Environmental Sustainability. J. Compr. Bus. Adm. Res. 2024, 1, 55–64. [Google Scholar] [CrossRef]
  61. Bressane, A.; Loureiro, A.I.S. Political and socioeconomic drivers of urban green space management: Insights from a case study in a Metropolitan Region of an Emerging Economy. Urban For. Urban Green. 2025, 104, 128591. [Google Scholar] [CrossRef]
Figure 1. Study area: (a) climatic zone of Shijiazhuang; (b) administrative area of Shijiazhuang; (c) central urban area of Shijiazhuang.
Sustainability 17 04874 g001
Figure 2. Flowchart of the followed methodology.
Sustainability 17 04874 g002
Figure 3. Urban green spaces spatial distribution.
Sustainability 17 04874 g003
Figure 4. LST spatial distribution.
Sustainability 17 04874 g004
Figure 5. Cooling contribution rate of green space landscape metrics (unit: %).
Sustainability 17 04874 g005
Figure 6. Marginal effects of key landscape metrics on LST (2022).
Sustainability 17 04874 g006
Figure 7. Marginal effects of key landscape metrics on LST (2023).
Sustainability 17 04874 g007
Figure 8. Marginal effects of key landscape metrics on LST (2024).
Sustainability 17 04874 g008
Figure 9. Synergistic cooling mechanisms of green space morphological patterns: (a) increasing PD; (b) enhancing AI; (c) elevating ED.
Sustainability 17 04874 g009
Figure 10. Multi-scale green space optimization matrix for planning strategies.
Sustainability 17 04874 g010
Table 1. Basic information on remote sensing images.
Data SourcesImage Number/NAMECloud CoverDateResolution
Landsat8 dataLC81240342022164LGN004.90%13 June 202230 m
LC81240342023199LGN004.64%18 July 2023
LC81240342024202LGN000.79%20 July 2024
Sentinel2 dataRemote sensing image of Shijiazhuang City in 20220.48%21 July 202210 m
Remote sensing image of Shijiazhuang City in 20230.01%16 July 2023
Remote sensing image of Shijiazhuang City in 20240.42%20 July 2024
Table 2. Green space analysis indicator system.
Indicator TypeIndicator NameCalculation
Green space qualityFVC F V C = ( N D V I N D V I m i n N D V I m a x N D V I m i n ) 2
Green space patternAREAConducted statistics using ArcGIS 10.8
ED E D = S A R E A , Where S is the circumference of green patch
PDCalculated through Fragstats 4.2
Green space shapeAREA-CVCalculated through Fragstats 4.2
LSICalculated through Fragstats 4.2
AICalculated through Fragstats 4.2
Table 3. Performance metrics of the BRT model.
YearGrid ScaleRMSEMAEMSER2
2022100 m1.00320.79551.0064 0.1542
300 m1.26370.99421.5969 0.1619
600 m1.3915 1.07141.9363 0.1619
900 m1.29950.91981.6887 0.1619
2023100 m1.0370 0.82731.0753 0.2770
300 m1.2038 0.88791.4491 0.3057
600 m1.18360.95231.4009 0.3057
900 m1.20190.96011.4446 0.4674
2024100 m2.06511.62054.2647 0.3209
300 m1.26370.99411.5967 0.3860
600 m1.13350.77631.2848 0.4210
900 m1.00320.07141.0064 0.5289
Disclaimer/Publisher’s Note: The statements, opinions and data contained in all publications are solely those of the individual author(s) and contributor(s) and not of MDPI and/or the editor(s). MDPI and/or the editor(s) disclaim responsibility for any injury to people or property resulting from any ideas, methods, instructions or products referred to in the content.

