
Circular Economy Index: A New Methodology for Evaluating Circularity in Municipalities

 ,
, 
 , and
, and
Abstract
1. Introduction
- Refine the methodology for assessing the CE at the municipal level, improving upon the initial opinion-based approach by developing more accurate and reliable measurement tools.
- Address data gaps by advocating for the development of a more comprehensive statistical framework that captures relevant CE metrics at the regional level.
- RQ1: What trends and tendencies do a bibliographical analysis of CE assessment methodologies at the municipal level reveal?
- RQ2: What are the global institutional practices for assessing the CE at various levels?
- RQ3: What are the data gaps and challenges to measuring the CE at the municipal level?
- Advanced data collection—by addressing the current data gaps, this research will help improve CE assessments and support better decision-making at the municipal level.
- Empower municipalities—a clear and comparable framework for local CE assessments enables municipalities to track their progress and identify opportunities for improvement.
- Influence policy—sophisticated methodologies can contribute to more effective local and national policies for promoting and implementing CE practices.
2. Methodological Approach and Design
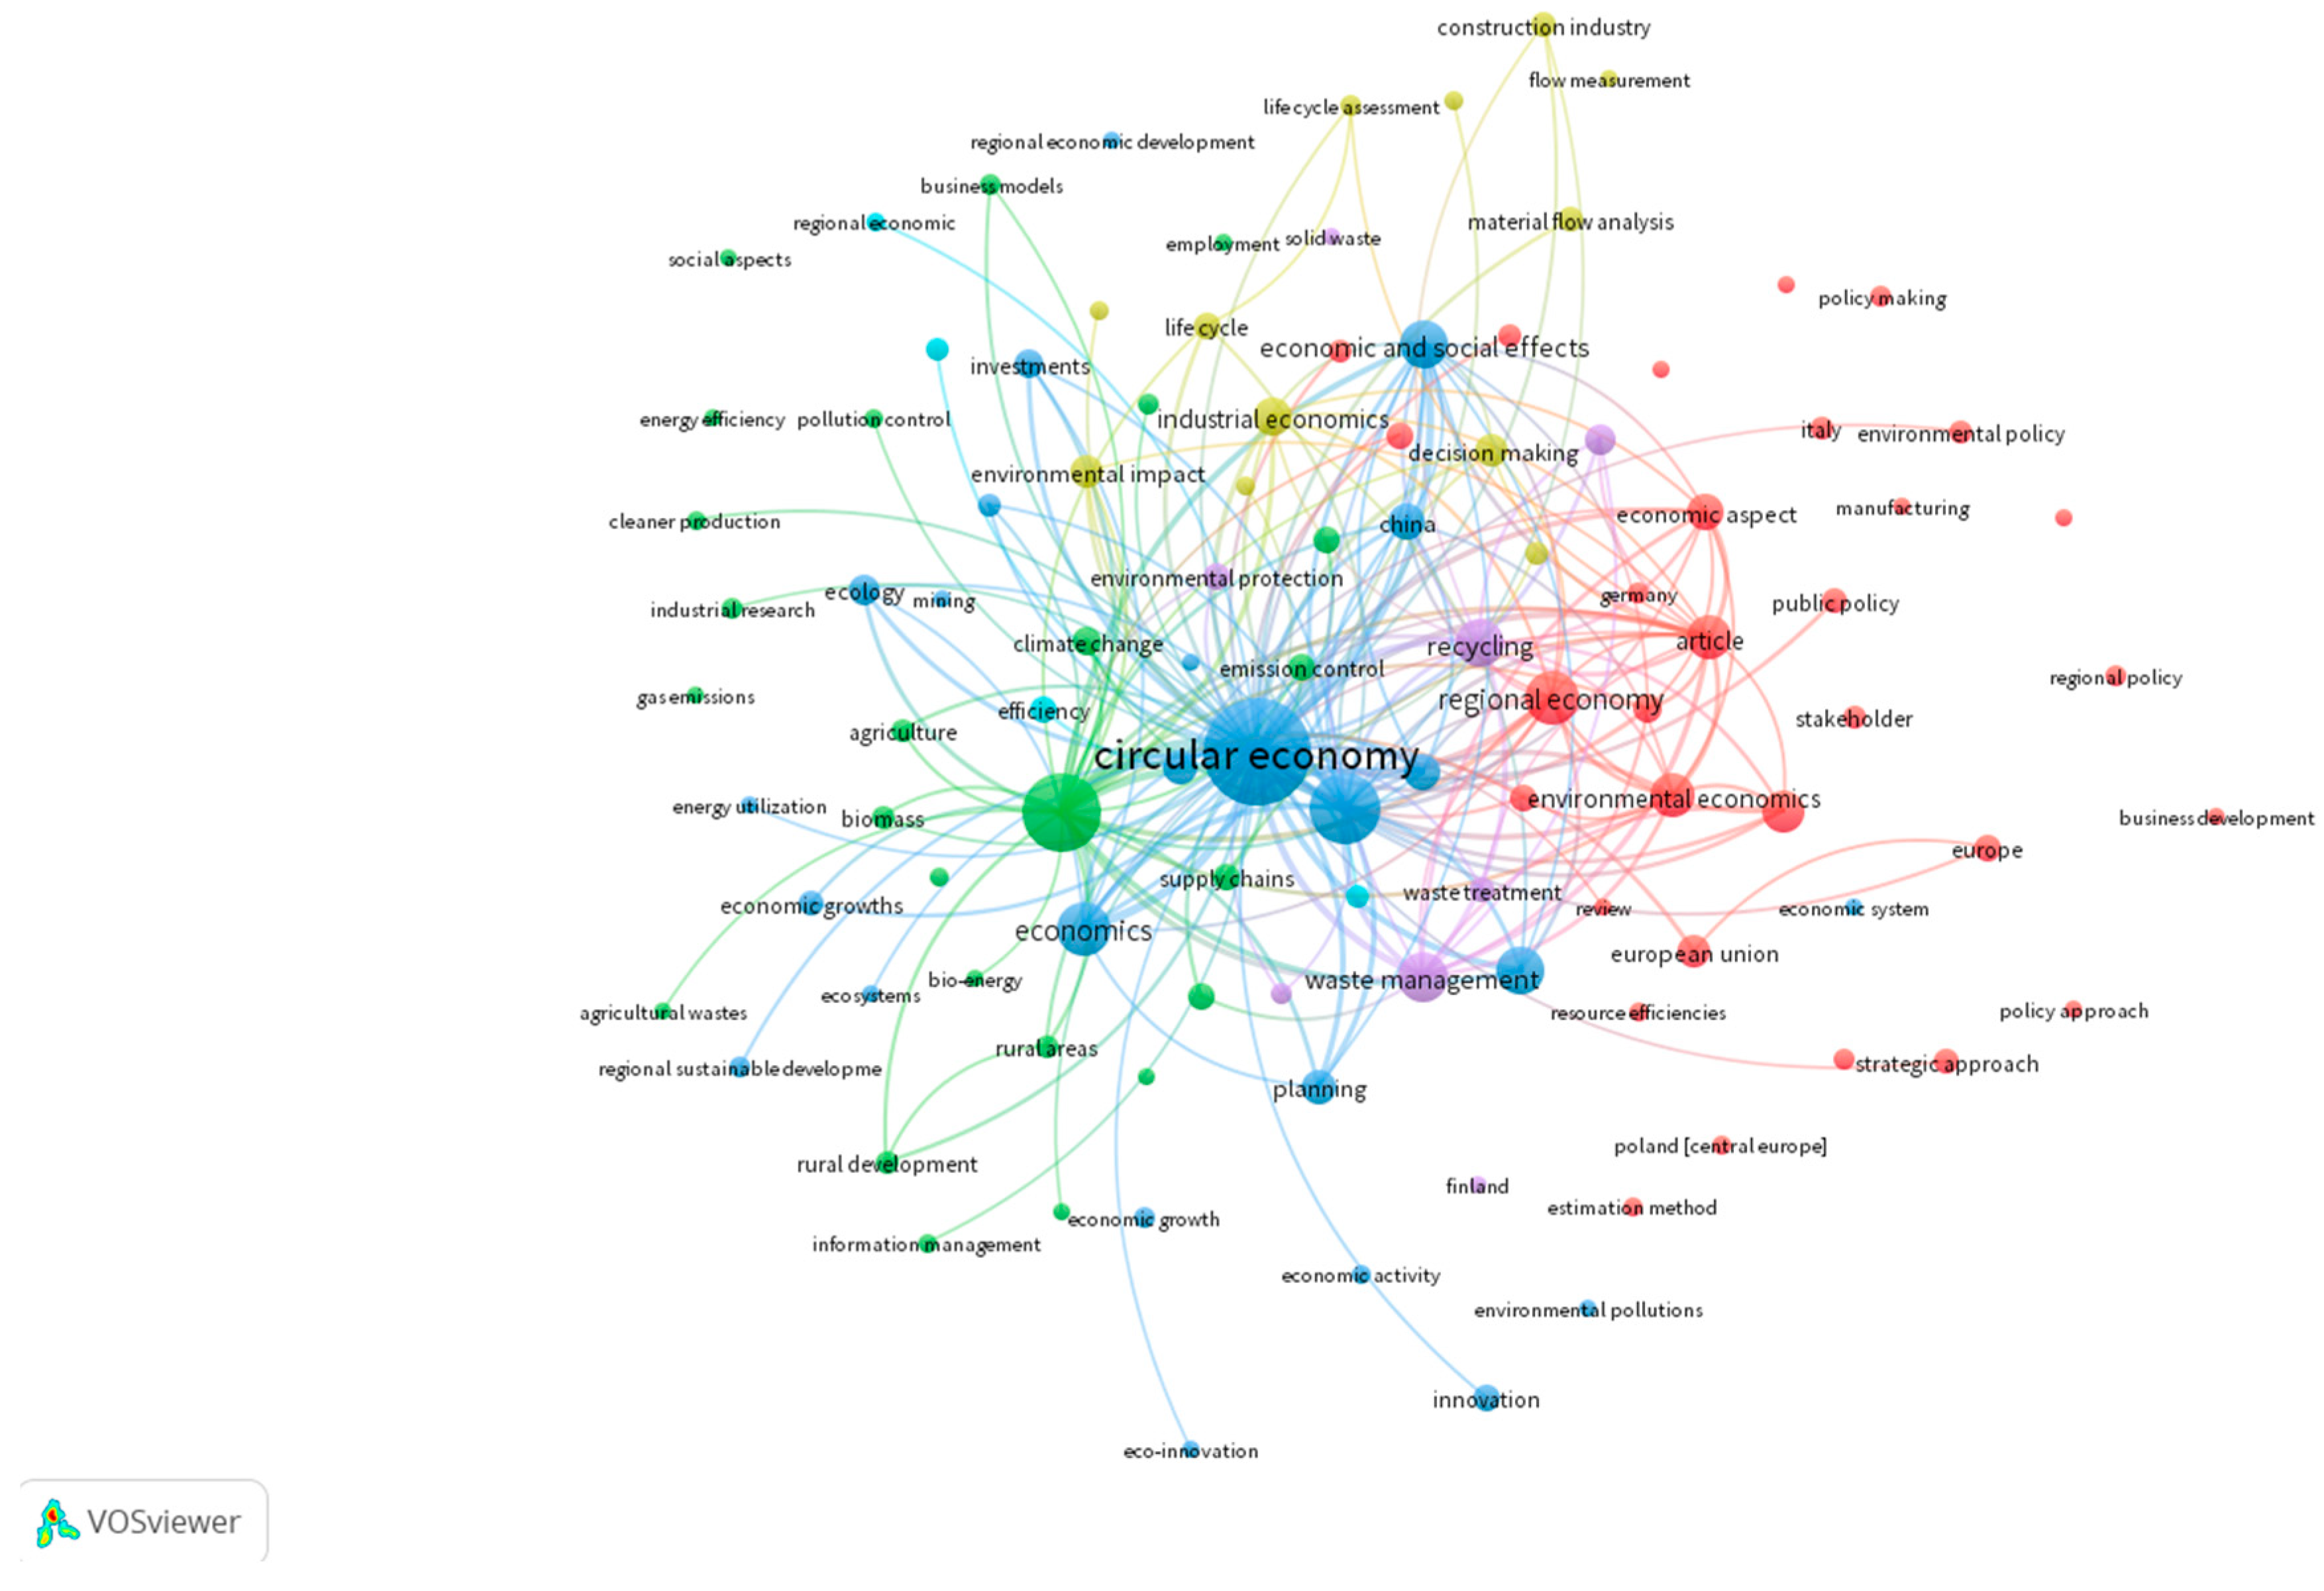
- Literature review. A substantive bibliographical analysis was performed to review the theoretical background and practices applied to assess the CE at national, regional, and municipal levels. Also, an analysis of applicable EU and national legislation, including policy documents, formed a crucial part of the research to create relatable content and facilitate participation in the survey.
- Research design. More than 20 scholars and other experts were involved in developing the research design, comprising the following stages and components:
- Defining CE criteria in municipalities;
- Developing a composite index formula for a single CE metric;
- Creating two comparable questionnaires—one for the representatives of municipal governments and the other for citizens;
- Gathering statistics for CE-related metrics;
- Establishing a materiality matrix to leverage survey results;
- Carrying out the survey and compiling data for further analysis;
- Calculating results and creating additional sub-categories to explore specific areas.
- The CE index was calculated using the composite indicator with a weighted average formula, which is considered one of the most reasonable methods as it allows for the consideration of the level of importance of each selected criterion. This mathematical method has been utilized by other researchers in the calculation of the CE index [9,10,11,12].The calculation of the CE index involves the use of two values. The level of importance for each CE criterion is determined by the value B, while the evaluation from municipalities or citizens is represented by the value V. The level of importance ranges from 1 to 5, while the evaluation ranges from 0 to 5, with both values required to be integers.Initially, a list of CE criteria was compiled and categorized into sub-categories. Each criterion must be in at least one sub-category, allowing for the possibility of a criterion being present in multiple sub-categories. Evaluations for each CE criterion were obtained from surveyed parties.The level of importance is determined by scholars and experts, with the possibility of varying levels of importance for a single CE criterion depending on the category in which it is placed.The index for each sub-category is calculated according to the following formula:where i is the number of criteria in a specific sub-category.After calculation, the index was rounded to the nearest integer. The minimum value of the CE index was 0, and the maximum value was 1000.
- Survey. During the period from June to July 2024, a nationwide online survey was carried out to address all 43 local municipalities and a sample of 3223 responses from individuals representing a population of 1.527 million.Residents were surveyed in July 2024 in cooperation with «Norstat Latvija». The survey was conducted online (CAWI) using a closed, representative respondent panel. In total, 3223 questionnaires were completed covering all Latvian municipalities. The survey asked residents about the activities of the municipality and their own activities in the field of CE.After completing the survey, data were compiled to analyze the results and calculate the index values. In addition to the initial idea to calculate a single composite index value, based on the survey results, additional sub-categories were created to explore specific areas. The final results were solely based on the survey results, without statistical avenues.The subjectivity of this research was reduced by combining the results from both stakeholders—municipalities that provide public services and individuals. For example, when questioning residents’ awareness of the CE within their municipality and the municipality’s contribution to informing the public, these differences are clearly noticeable (Figure 2).The average and excellent awareness ratings between the two respondent groups aligned, but there was a discrepancy of more than two times in the ratings for very good versus poor awareness, with the municipalities’ view being significantly more optimistic than that of the residents. The indexing algorithm helps to level out these differences, allowing for a more objective assessment.
- Index presentation. Once completed, the survey results were presented to diverse target audiences and platforms to inform the main participants—administrations of the local municipalities—as well as raise awareness of the research and its subject.
3. Results
3.1. Theoretical Background
- CE 1.0 (1970–the 1990s)—the focus is on the “output side”, i.e., waste management and the introduction of preventive and life-cycle-thinking-focused concepts like cleaner production and industrial ecology.
- CE 2.0 (1990–2010s)—the integration of input and output strategies for eco-efficiency and the framing of environmental problems as economic opportunities.
- CE 3.0 (2010s–)—the focus is on maximizing value retention in response to resource depletion and decoupling growth from resource use.
- The European Commission [19] defines the CE as dealing with waste minimization and recovery, the implementation of low-carbon processes, resource-efficient usage, ecological and energy transition, and sustainable pathways to economic competitiveness. In the new CE Action Plan, approved in March 2020 [20], there is no concise definition of the CE. Instead, it focuses on sustainability, resource management, social inclusivity, and global collaboration, elaborating on the evolving scope of the CE.
- Kirchherr et al., in their revisited edition of the conceptualization of CE, provide the following meta-definition: “The circular economy is a regenerative economic system which necessitates a paradigm shift to replace the “end of life” concept with reducing, alternatively reusing, recycling, and recovering materials throughout the supply chain, with the aim to promote value maintenance and sustainable development, creating environmental quality, economic development, and social equity, to the benefit of current and future generations. It is enabled by an alliance of stakeholders (industry, consumers, policymakers, academia) and their technological innovations and capabilities” [21]. This aims to promote value maintenance and sustainable development, creating environmental quality, economic development, and social equity to benefit current and future generations.
- The most recent definition from the renowned Ellen MacArthur Foundation describes the CE as “a systems solution framework that tackles global challenges like climate change, biodiversity loss, waste, and pollution. It is based on three principles, driven by design: eliminate waste and pollution, circulate products and materials (at their highest value), and regenerate nature” [22].
- Geng and Doberstein, focusing on the Chinese implementation of the concept, describe the CE as the “realization of [a] closed-loop material flow in the whole economic system” [23]. This definition emphasizes the closed-loop system where materials are continuously cycled within the economy.
- Yuan et al. state that “the core of [the CE] is the circular (closed) flow of materials and the use of raw materials and energy through multiple phases” [23]. This definition underscores the multiple life cycles of materials and energy in the CE.
- Bocken et al. characterize the CE by defining it as “design and business model strategies [that are] slowing, closing, and narrowing resource loops” [24]. This definition emphasizes the role of design and business models in achieving circularity.
- Geissdoerfer et al. defined the CE as “a regenerative system in which resource input and waste, emission, and energy leakage are minimized by slowing, closing, and narrowing material and energy loops. This can be achieved through long-lasting design, maintenance, repair, reuse, remanufacturing, refurbishing, and recycling” [8].
- In May 2024, the International Organization of Standardisation (ISO) released a new standard, ISO 59004:2024, “Circular economy—Vocabulary, principles, and guidance for implementation”, where the CE is defined as an “economic system that uses a systemic approach to maintain a circular flow of resources, by recovering, retaining or adding to their value, while contributing to sustainable development” [25]. It is doubtful that with this attempt, the persistent lack of a unified CE definition will be resolved. This definition contains a multi-level cascade of terms with separate definitions, making it rather arduous to puzzle out all the components into one comprehensive and meaningful statement.
- Most recently, acknowledging a great variety of CE definitions, the Organisation for Economic Co-operation and Development (OECD), in their report “Monitoring Progress towards a Resource-Efficient and Circular Economy”, proposed a common language headline definition of the CE as being “an economy where the value of materials in the economy is maximized and maintained for as long as possible; the input of materials and their consumption is minimized; the generation of waste is prevented and negative environmental impacts reduced throughout the life-cycle of materials” [26]. This definition highlights the three interrelated features of the CE and is designed for international use.
3.2. Global Practices of Assessing CE
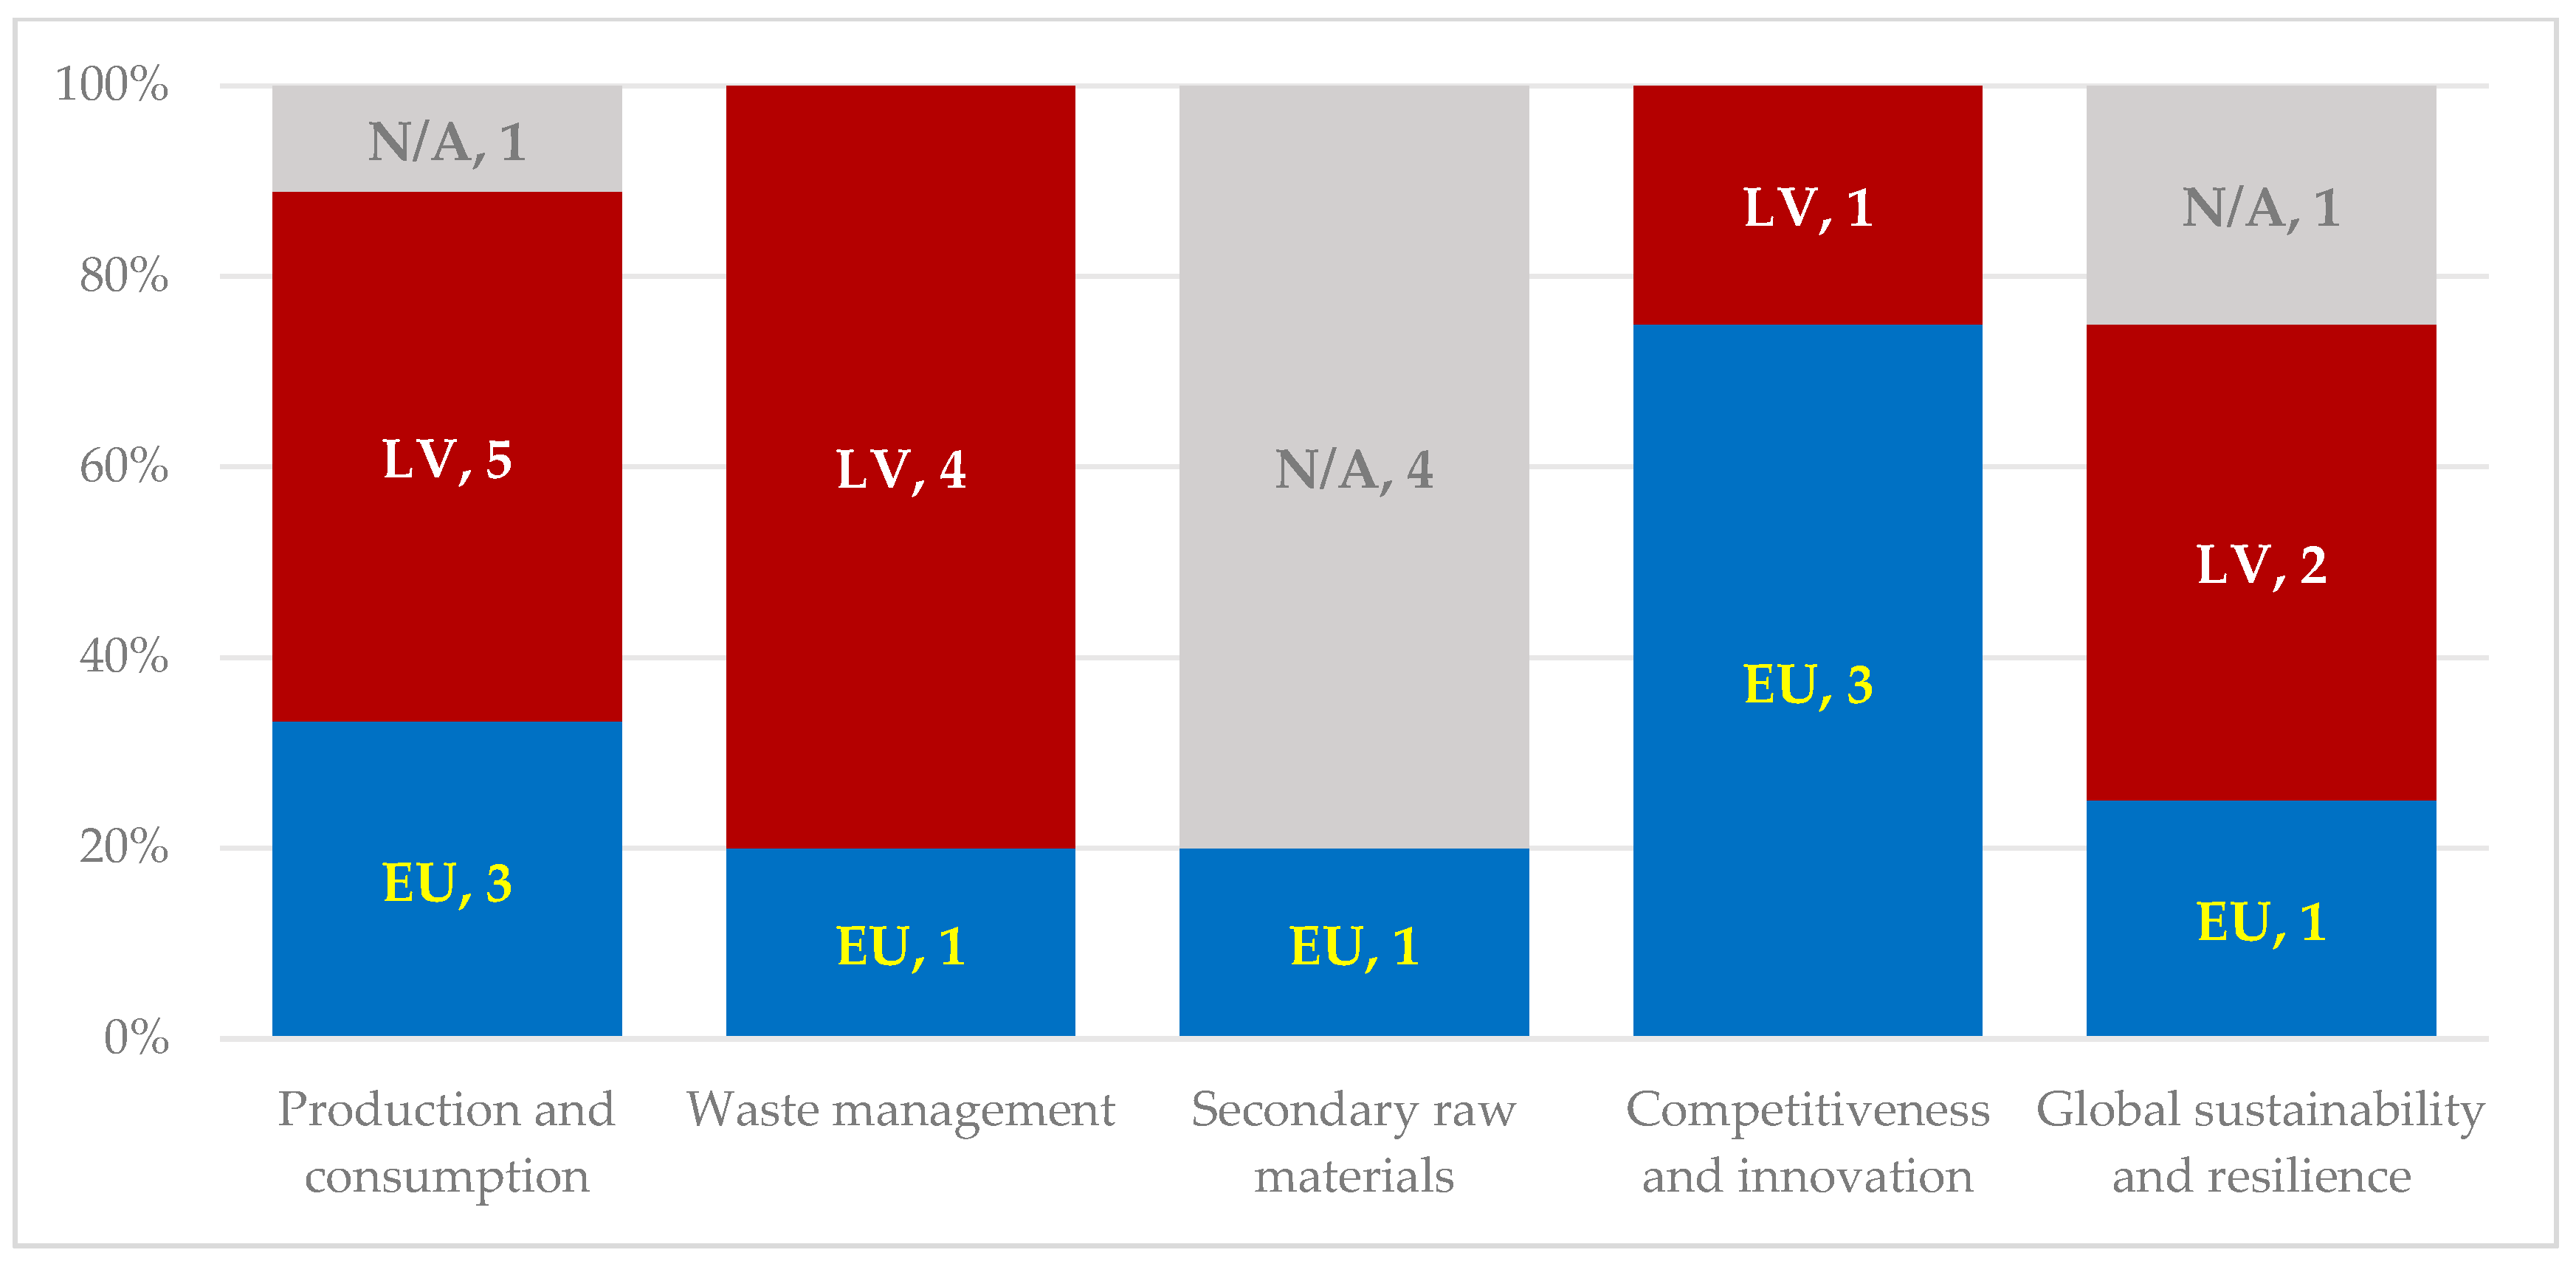
3.2.1. Eurostat Monitoring Framework
3.2.2. OECD and UNECE Practice Guidelines
- The lack of an agreed definition of the CE does not allow a robust and comprehensive indicator framework to be built, and different definitions of the CE may result in different ways and indicators to measure it.
- Incomplete information—data gaps and inconsistent statistical reporting derived from some dimensions of the CE are not being reflected in statistical databases [37] A strong focus on waste but little on closing loops—indicators like waste collection and recycling rates may give a misleading indication of progress towards a CE, as they do not necessarily show how the primary consumption of materials is reduced or optimized. It has also been identified that statistics on waste and material flow are not enough to assess such CE-related aspects, including material losses and the quality of recycling [38,39,40].
- Available indicators are mostly data-driven rather than objective-driven, resulting in an over-representation of sectors with a greater availability of data (e.g., waste or energy-related indicators).
- The lack of a systemic approach to CE indicators—indicators should measure and control several factors (e.g., from urban planning to material consumption) instead of limiting them to very specific sectors such as waste management [36].
3.2.3. Case Studies of Sweden and Italy
- (1)
- Waste recycling and utilization;
- (2)
- Collected waste;
- (3)
- The emission of air pollutants;
- (4)
- Infrastructure, mechanisms, and culture;
- (5)
- Waste tax;
- (6)
- The investment and waste management costs;
- (7)
- Clean transport;
- (8)
- Renewable energy.
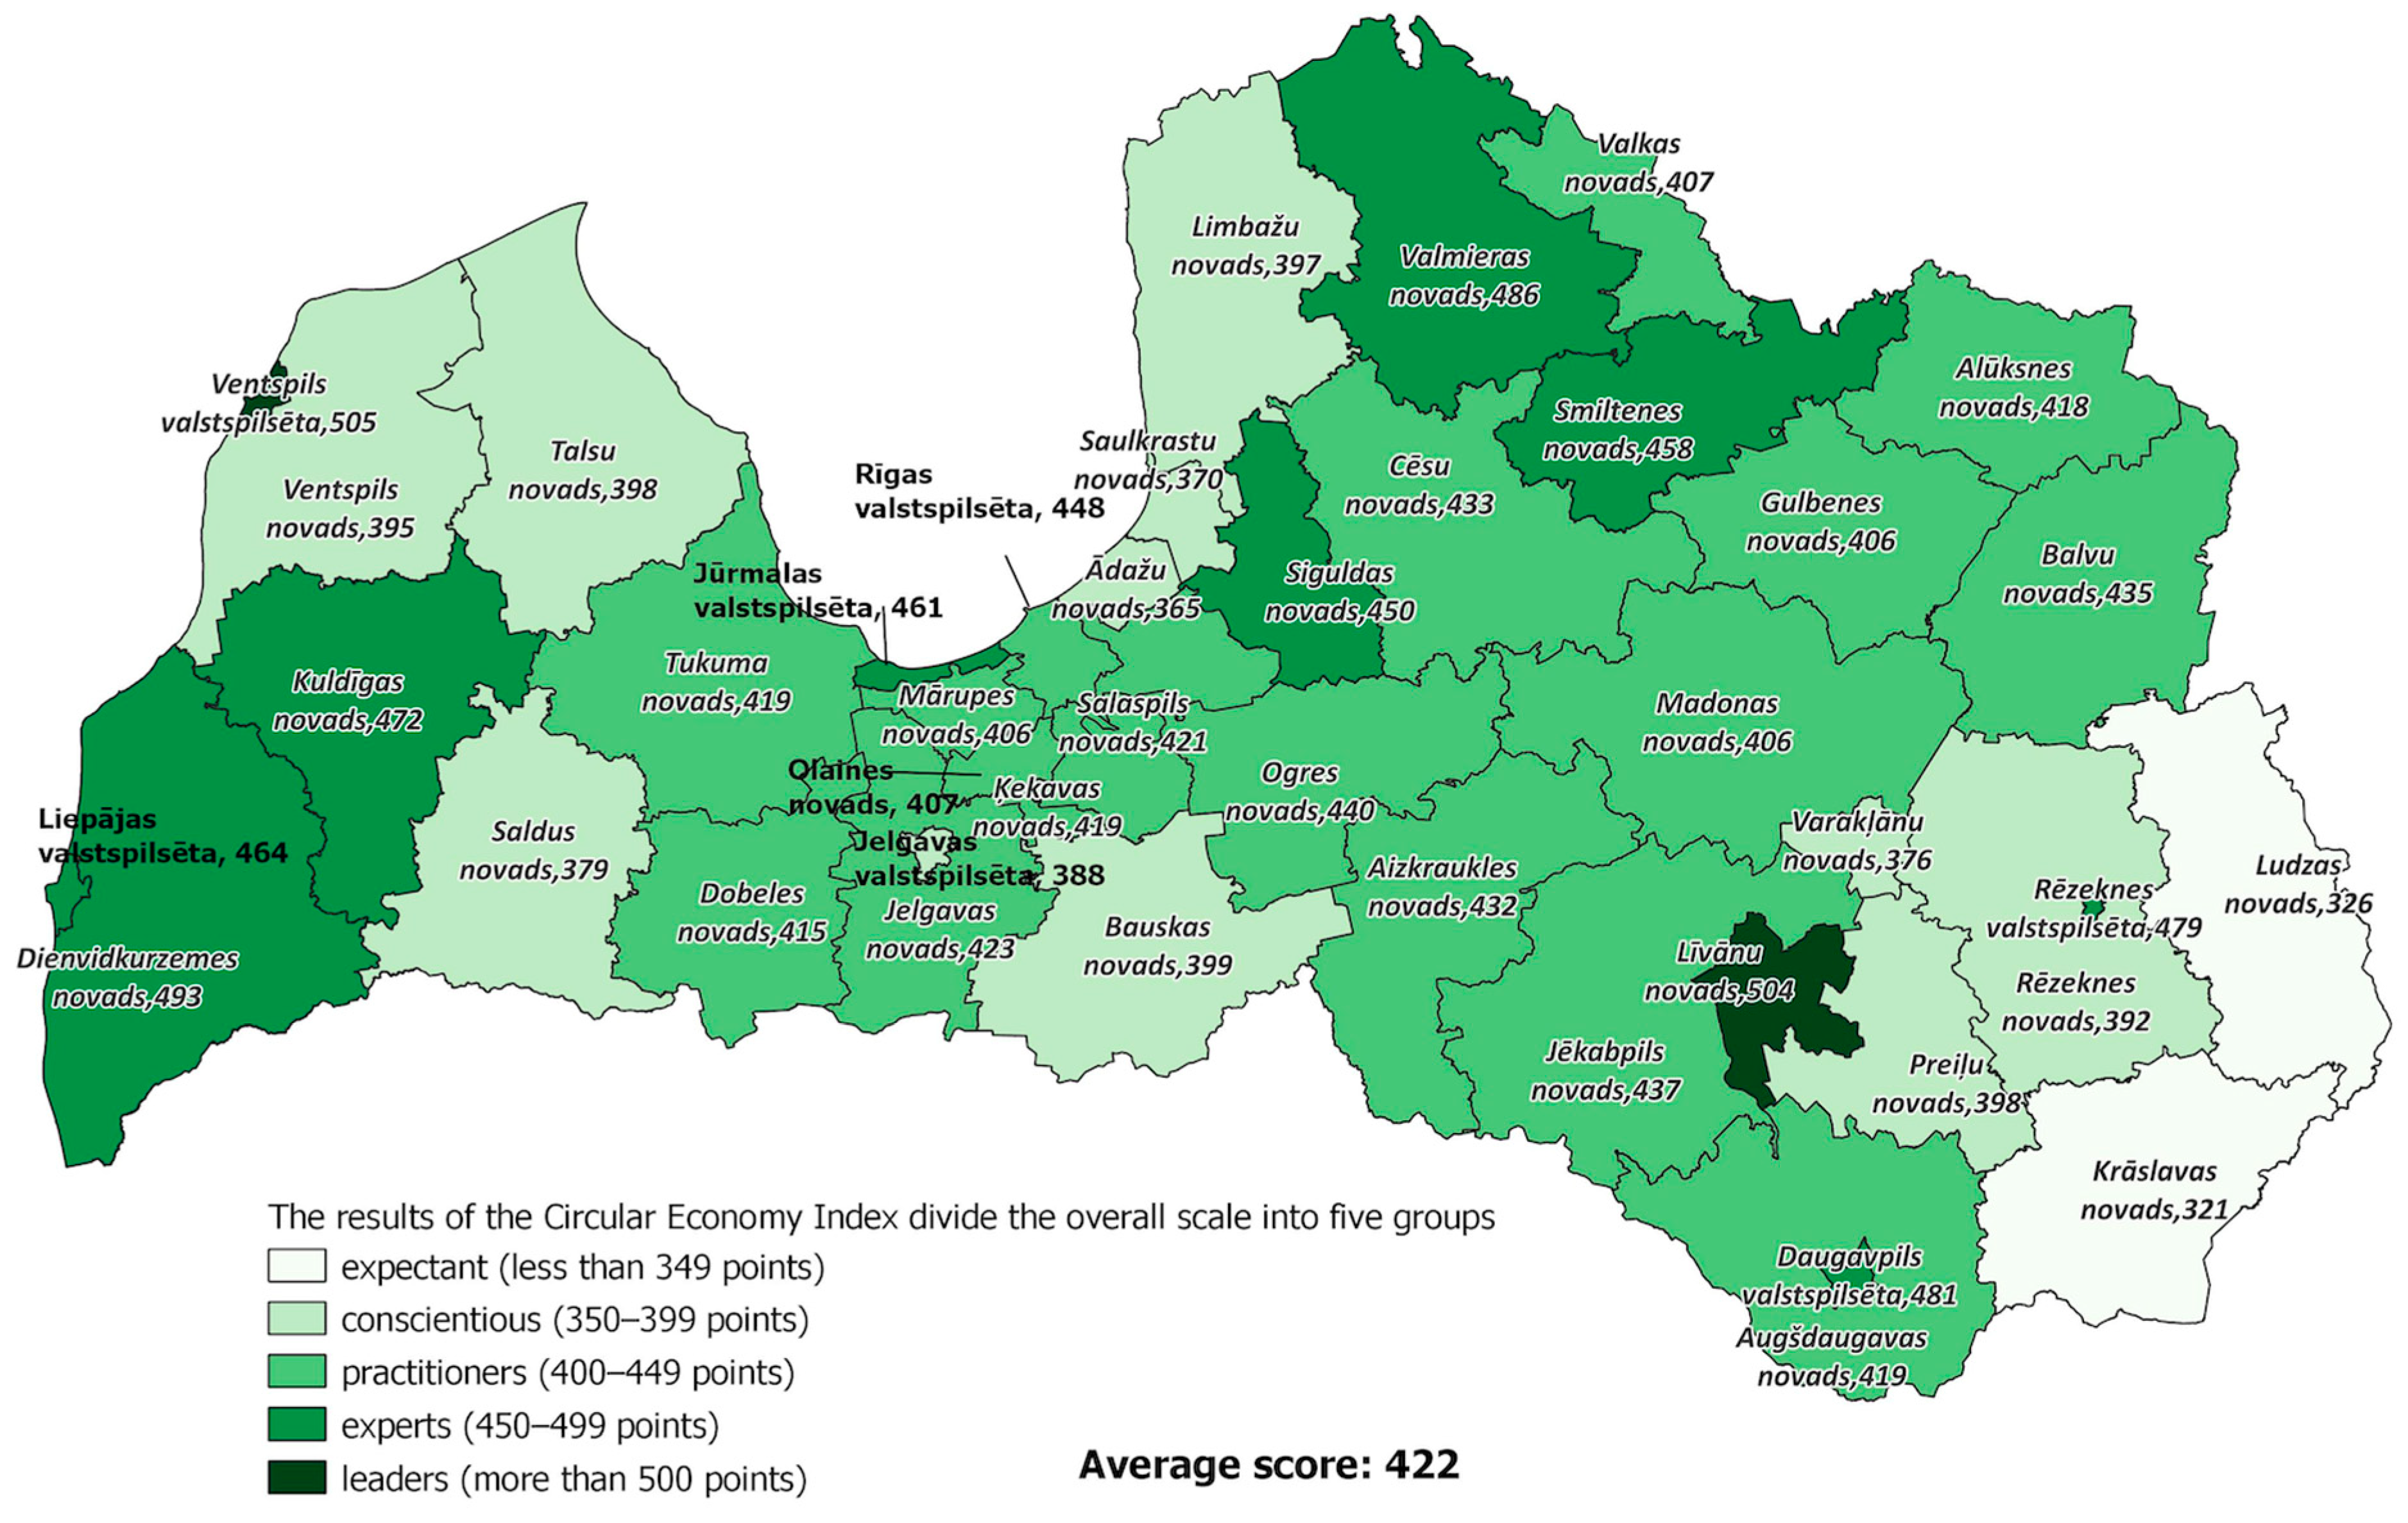
3.3. The CE Index in Latvian Municipalities
- International research methods were evaluated, and a synthesis of these methods was applied to develop the CE index.
- Latvia’s unique characteristics and the role of local governments in the CE and their importance were established and implemented in the CE index.
- A sustainable and flexible method for tracking results was developed and applied.
- A performance improvement tool was developed along with the CE index.
- Leaders (more than 500 points)—the highest results were obtained in circularity; residents were involved in achieving circularity goals and obtained an understanding of the importance of circularity in well-being and sustainability.
- Experts (450–499 points)—manage elements of the CE, implement them in practice, and explain their efforts to residents.
- Practitioners (400–449 points)—implement significant CE initiatives at the municipal level and widely engage residents.
- Conscientious (350–399 points)—implement CE principles and explain them to residents.
- Expectants (less than 349 points)—evaluate opportunities to integrate the CE into municipal functions.
- (1)
- Resource management: (everyday resource conservation; principles of smart management; procurement and service usage in the municipality; support for specific initiatives and business models; the level of green procurement; solving waste management problems; public transport accessibility; utilizing recycled materials in tourism, flood protection systems, construction, and city maintenance; and implementing CE principles in municipal public cultural, sports, and other events);
- (2)
- Economics/business transformation: (principles of smart management; support for specific measures and business forms; shared and collaborative service support; support for shared and co-working services; and municipal initiatives to foster a CE);
- (3)
- Public engagement: (information initiatives organized by the municipality; the availability of information about municipality activities in the field of CE);
- (4)
- Skillful management: (an approved CE implementation strategy/action plan; the integration of CE principles into municipal activities; engagement and support in building a CE; contributions to climate solutions; achieving climate neutrality in municipal management; and priorities in road and traffic planning).
4. Discussion
5. Conclusions
- A self-assessment of processes and results in the work of the municipality;
- Following the dynamics of their performance by years or periods and comparing it with the results of other local governments;
- Receiving expert recommendations on priority processes to be improved (considering both the requirements of the European Green Deal and the interests of residents and businesses);
- Popularizing success stories and examples of good practice;
- Better understanding of the role of the CE in the performance of local government functions and cooperation with stakeholders;
- Developing recommendations on how to motivate local governments to act more responsibly, support mechanisms, and attract funding.
- Understanding and gaining knowledge of the CE;
- General recommendations by index category;
- Recommendations for policymakers and institutions;
- Educational events and the exchange of good practice and experiences for popularization.
Author Contributions
Funding
Institutional Review Board Statement
Informed Consent Statement
Data Availability Statement
Acknowledgments
Conflicts of Interest
References
- Kirchherr, J.; Reike, D.; Hekkert, M. Conceptualizing the Circular Economy: An Analysis of 114 Definitions. Resour. Conserv. Recycl. 2017, 127, 221–232. [Google Scholar] [CrossRef]
- Constitutional Assembly. The Constitution of the Republic of Latvia 1922; Latvijas Vēstnesis: Riga, Latvia, 1993; Available online: https://likumi.lv/ta/en/en/id/57980-the-constitution-of-the-republic-of-latvia (accessed on 12 December 2023).
- Calisto Friant, M.; Reid, K.; Boesler, P.; Vermeulen, W.J.V.; Salomone, R. Sustainable Circular Cities? Analysing Urban Circular Economy Policies in Amsterdam, Glasgow, and Copenhagen. Local Environ. 2023, 28, 1331–1369. [Google Scholar] [CrossRef]
- Droege, H.; Raggi, A.; Ramos, T.B. Overcoming Current Challenges for Circular Economy Assessment Implementation in Public Sector Organisations. Sustainability 2021, 13, 1182. [Google Scholar] [CrossRef]
- Bîrgovan, A.L.; Lakatos, E.S.; Szilagyi, A.; Cioca, L.I.; Pacurariu, R.L.; Ciobanu, G.; Rada, E.C. How Should We Measure? A Review of Circular Cities Indicators. Int. J. Environ. Res. Public Health 2022, 19, 5177. [Google Scholar] [CrossRef]
- Paoli, F.; Pirlone, F.; Spadaro, I. Indicators for the Circular City: A Review and a Proposal. Sustainability 2022, 14, 11848. [Google Scholar] [CrossRef]
- Williams, J. Circular Cities: Challenges to Implementing Looping Actions. Sustainability 2019, 11, 423. [Google Scholar] [CrossRef]
- Geissdoerfer, M.; Savaget, P.; Bocken, N.M.P.; Hultink, E.J. The Circular Economy—A New Sustainability Paradigm? J. Clean. Prod. 2017, 143, 757–768. [Google Scholar] [CrossRef]
- Musyarofah, S.A.; Tontowi, A.E.; Masruroh, N.A.; Wibowo, B.S.; Warmadewanthi, I.D.A.A.; Nasution, A.H.; Bhawika, G.W.; Handiwibowo, G.A.; Rusydi, M.K. Developing a Circular Economy Index to Measure the Macro Level of Circular Economy Implementation in Indonesia. Manag. Syst. Prod. Eng. 2023, 31, 208–215. [Google Scholar] [CrossRef]
- Moraga, G.; Huysveld, S.; Mathieux, F.; Blengini, G.A.; Alaerts, L.; Van Acker, K.; De Meester, S.; Dewulf, J. Circular Economy Indicators: What Do They Measure? Resour. Conserv. Recycl. 2019, 146, 452–461. [Google Scholar] [CrossRef]
- De Pascale, A.; Arbolino, R.; Szopik-Depczyńska, K.; Limosani, M.; Ioppolo, G. A Systematic Review for Measuring Circular Economy: The 61 Indicators. J. Clean. Prod. 2021, 281, 124942. [Google Scholar] [CrossRef]
- De Oliveira Frascareli, F.C.; Furlan, M.; Mariano, E.B.; Jugend, D. A Macro-Level Circular Economy Index: Theoretical Proposal and Application in European Union Countries. Environ. Dev. Sustain. 2023, 26, 18297–18331. [Google Scholar] [CrossRef]
- van Eck, N.J.; Waltman, L. VOSViewer, version 16.2; Visualizing Scientific Landscapes; Leiden University’s Centre for Science and Technology Studies (CWTS): Leiden, The Netherlands, 2023. [Google Scholar]
- Waltman, L.; Van Eck, N.J.; Noyons, E.C.M. A Unified Approach to Mapping and Clustering of Bibliometric Networks. J. Informetr. 2010, 4, 629–635. [Google Scholar] [CrossRef]
- Heshmati, A.; Rashidghalam, M. Assessment of the Urban Circular Economy in Sweden. J. Clean. Prod. 2021, 310, 127475. [Google Scholar] [CrossRef]
- Ghinoi, S.; Silvestri, F.; Spigarelli, F.; Tassinari, M. A Methodological Proposal for Developing a Municipality Indicator of Circular Economy (MICE). Resour. Conserv. Recycl. 2024, 211, 107871. [Google Scholar] [CrossRef]
- Huttmanová, E.; Chovancová, J.; Petruška, I.; Sallaku, K. Circular Economy in Action: Examining the Decoupling of Economic Growth and Material Use across EU Countries. Eur. J. Sustain. Dev. 2024, 13, 13. [Google Scholar] [CrossRef]
- Reike, D.; Vermeulen, W.J.V.; Witjes, S. The Circular Economy: New or Refurbished as CE 3.0?—Exploring Controversies in the Conceptualization of the Circular Economy through a Focus on History and Resource Value Retention Options. Resour. Conserv. Recycl. 2018, 135, 246–264. [Google Scholar] [CrossRef]
- European Commission. Communication from the Commission of the European Parliament, the Council, the European Economic and Social Committee and the Committee of the Regions. Closing the Loop—An EU Action Plan for the Circular Economy; European Commission: Brussels, Belgium, 2015. [Google Scholar]
- European Commission. Communication from the Commission of the European Parliament, the Council, the European Economic and Social Committee and the Committee of the Regions. A New Circular Economy Action Plan: For a Cleaner and More Competitive Europe; European Commission: Brussels, Belgium, 2020. [Google Scholar]
- Kirchherr, J.; Yang, N.-H.N.; Schulze-Spüntrup, F.; Heerink, M.J.; Hartley, K. Conceptualizing the Circular Economy (Revisited): An Analysis of 221 Definitions. Resour. Conserv. Recycl. 2023, 194, 107001. [Google Scholar] [CrossRef]
- Ellen MacArthur Foundation. What Is a Circular Economy? Available online: https://www.ellenmacarthurfoundation.org/topics/circular-economy-introduction/overview (accessed on 22 November 2023).
- Yuan, Z.; Bi, J.; Moriguichi, Y. The Circular Economy: A New Development Strategy in China. J. Ind. Ecol. 2006, 10, 4–8. [Google Scholar] [CrossRef]
- Bocken, N.M.P.; De Pauw, I.; Bakker, C.; Van Der Grinten, B. Product Design and Business Model Strategies for a Circular Economy. J. Ind. Prod. Eng. 2016, 33, 308–320. [Google Scholar] [CrossRef]
- ISO 59004:2024; Circular Economy—Vocabulary, Principles and Guidance for Implementation. ISO: Geneva, Switzerland, 2025.
- OECD. Monitoring Progress Towards a Resource-Efficient and Circular Economy; OECD: Paris, France, 2024; ISBN 978-92-64-32481-7. [Google Scholar]
- National People’s Congress (NPC). National People’s Congress of the Circular Economy Promotion Law of the People’s Republic of China; National People’s Congress: Beijing, China, 2008.
- European Parliament. Directive 2008/98/EC of the European Parliament and of the Council of 19 November 2008 on Waste and Repealing Certain Directives; European Parliament: Strasbourg, France, 2008. [Google Scholar]
- Uvarova, I.; Atstaja, D.; Volkova, T.; Grasis, J.; Ozolina-Ozola, I. The Typology of 60R Circular Economy Principles and Strategic Orientation of Their Application in Business. J. Clean. Prod. 2023, 409, 137189. [Google Scholar] [CrossRef]
- EUROSTAT. Circular Economy: Policy Context. Available online: https://ec.europa.eu/eurostat/web/circular-economy/information-data/policy-context (accessed on 3 January 2025).
- EUROSTAT. Circular Economy: Information on Data. Available online: https://ec.europa.eu/eurostat/web/circular-economy/information-data (accessed on 3 January 2025).
- EUROSTAT. Circular Economy: Monitoring Framework. Available online: https://ec.europa.eu/eurostat/web/circular-economy/monitoring-framework (accessed on 3 January 2025).
- OECD. The Circular Economy in Cities and Regions: Synthesis Report; OECD Urban Studies; OECD: Paris, France, 2020; ISBN 978-92-64-64295-9. [Google Scholar]
- OECD. An International Review of National and Subnational Circular Economy Monitoring Frameworks: Lessons and Ways Forward for Italy; OECD Regional Development Papers; OECD: Paris, France, 2024; Volume 74. [Google Scholar]
- Blomsma, F.; Brennan, G. The Emergence of Circular Economy: A New Framing Around Prolonging Resource Productivity. J Ind. Ecol. 2017, 21, 603–614. [Google Scholar] [CrossRef]
- OECD. OECD–Nordic Innovation Webinars on the Circular Economy in Cities and Regions; OECD: Paris, France, 2020. [Google Scholar]
- Etkins, P.; Domenech, T.; Drummond, P.; Bleischwitz, R.; Hughes, N.; Lotti, L. The Circular Economy: What, Why, How and Where; Background Paper for an OECD/EC Workshop on 5 July 2019 Within the Workshop Series “Managing Environmental and Energy Transitions for Regions and Cities”; OECD: Paris, France, 2019; Available online: https://www.researchgate.net/publication/374740327_The_circular_economy_What_why_how_and_where (accessed on 10 January 2025).
- Saidani, M.; Yannou, B.; Leroy, Y.; Cluzel, F.; Kendall, A. A Taxonomy of Circular Economy Indicators. J. Clean. Prod. 2019, 207, 542–559. [Google Scholar] [CrossRef]
- Haupt, M.; Vadenbo, C.; Hellweg, S. Do We Have the Right Performance Indicators for the Circular Economy?: Insight into the Swiss Waste Management System. J. Ind. Ecol. 2017, 21, 615–627. [Google Scholar] [CrossRef]
- European Environment Agency. Circular Economy in Europe: Developing the Knowledge Base; Publications Office: Luxembourg, 2016.
- United Nations Economic Commission for Europe. Conference of European Statisticians’ Guidelines for Measuring Circular Economy: Part A: Conceptual Framework, Indicators and Measurement Framework; Conference of European Statisticians Statistical Standards and Studies; United Nations: New York, NY, USA, 2024; ISBN 978-92-1-358668-6. [Google Scholar]
- Völker, T.; Kovacic, Z.; Strand, R. Indicator Development as a Site of Collective Imagination? The Case of European Commission Policies on the Circular Economy. Cult. Organ. 2020, 26, 103–120. [Google Scholar] [CrossRef]
- Saeima, Local Government Law 2022. Available online: https://likumi.lv/ta/en/en/id/336956-local-government-law (accessed on 12 December 2023).
- European Parliament. Research Service Circular Economy: Definition, Importance and Benefits. Available online: https://www.europarl.europa.eu/topics/en/article/20151201STO05603/circular-economy-definition-importance-and-benefits (accessed on 8 January 2025).
- Central Statistical Bureau, Republic of Latvia. Oficiālās Statistikas Portāls: Latvijas Oficiālā Statistika. Available online: https://stat.gov.lv/lv (accessed on 6 January 2025).


| Thematic Area | Indicator | Sub-Indicators (Measurement) |
|---|---|---|
| Production and consumption | Material consumption | Material footprint (tonnes per capita) |
| Resource productivity (index 2000 = 100) | ||
| Green public procurement | The share of public procurement procedures above the EU thresholds (in number and value), which include environmental elements | |
| Waste generation | Total waste generation per capita(kg per capita) | |
| The generation of waste, excluding major mineral waste per GDP unit (kg per thousand EUR; chain-linked volumes (2010)) | ||
| Generation of municipal waste per capita (kg per capita) | ||
| Food waste (kg per capita) | ||
| Generation of packaging waste per capita (kg per capita) | ||
| Generation of plastic packaging waste per capita (kg per capita) | ||
| Waste management | Overall recycling rates | The recycling rate of municipal waste (percentage) |
| The recycling rate of all waste excluding major mineral waste (percentage) | ||
| Recycling rate for specific waste streams | The recycling rate of overall packaging (percentage) | |
| The recycling rate of plastic packaging (percentage) | ||
| The recycling rate of WEEE when separately collected (percentage) | ||
| Secondary raw materials | Contribution of recycled materials to raw materials demand | Circular material use rate (percentage) |
| End-of-live recycling input rates (EOL-RIRs) for aluminum (percentage) | ||
| Trade in recyclable raw materials | Imports from non-EU countries (thousand tonnes) | |
| Exports to non-EU countries (thousand tonnes) | ||
| Intra-EU trade (thousand tonnes) | ||
| Competitiveness and innovation | Private investment, jobs, and gross value added related to circular economy sectors | Private investments (the percentage of gross domestic product (GDP) at current prices) |
| Persons employed (percentage of total employment) | ||
| The gross value added (percentage of gross domestic product (GDP) at current prices) | ||
| Innovation | Patents related to waste management and recycling (number) | |
| Global sustainability and resilience | Global sustainability from circular economy | Consumption footprint (index 2010 = 100) |
| GHG emissions from production activities (kg per capita) | ||
| Resilience from circular economy | Material import dependency (percentage) | |
| EU self-sufficiency for raw materials, aluminum (percentage) |
| ID | Variable Name | Description | Area of Interest |
|---|---|---|---|
| 1 | Farmhouses | No. Farmhouses/municipal land | Green enterprise |
| 2 | 50,001 certified firms | No. of firms awarded with 50,001 certificates/firms × 100 | |
| 3 | Environmentally certified firms | No. of firms awarded with environmental certificates/firms × 100 | |
| 4 | Cars | Cars/inhabitants × 1.000 | Sustainable mobility |
| 5 | Railway stations | No. of railway stations/municipal area | |
| 6 | Solar energy | Installed kW of solar plants/inhabitants | Sustainable energy |
| 7 | Non-solar renewable energy | Installed kW of non-solar renewable energy/inhabitants | |
| 8 | Energy projects | Cohesion funds granted in 2007–2020 for energy projects/inhabitants | |
| 9 | Organic utilized agriculture area (UAA) | Organic UAA/UAA | Biodiversity and resource saving |
| 10 | Environment projects | Cohesion funds granted in 2007–2020 for environmental projects/inhabitants | |
| 11 | Protected territory | Protected land/municipal land | |
| 12 | CO2eq | CO2eq/inhabitants × 1.000 | Emissions and pollution |
| 13 | Municipal solid waste (MSW) generation | MSW/inhabitants | |
| 14 | MSW recycling | MSW sorted/MSW |
Disclaimer/Publisher’s Note: The statements, opinions and data contained in all publications are solely those of the individual author(s) and contributor(s) and not of MDPI and/or the editor(s). MDPI and/or the editor(s) disclaim responsibility for any injury to people or property resulting from any ideas, methods, instructions or products referred to in the content. |
© 2025 by the authors. Licensee MDPI, Basel, Switzerland. This article is an open access article distributed under the terms and conditions of the Creative Commons Attribution (CC BY) license (https://creativecommons.org/licenses/by/4.0/).
Share and Cite
Atstaja, D.; Liepa, I.; Vembris, A.; Rivza, B.; Osipova, S.; Cudecka-Purina, N. Circular Economy Index: A New Methodology for Evaluating Circularity in Municipalities. Sustainability 2025, 17, 4867. https://doi.org/10.3390/su17114867
Atstaja D, Liepa I, Vembris A, Rivza B, Osipova S, Cudecka-Purina N. Circular Economy Index: A New Methodology for Evaluating Circularity in Municipalities. Sustainability. 2025; 17(11):4867. https://doi.org/10.3390/su17114867
Chicago/Turabian StyleAtstaja, Dzintra, Inga Liepa, Aivars Vembris, Baiba Rivza, Sanita Osipova, and Natalija Cudecka-Purina. 2025. "Circular Economy Index: A New Methodology for Evaluating Circularity in Municipalities" Sustainability 17, no. 11: 4867. https://doi.org/10.3390/su17114867
APA StyleAtstaja, D., Liepa, I., Vembris, A., Rivza, B., Osipova, S., & Cudecka-Purina, N. (2025). Circular Economy Index: A New Methodology for Evaluating Circularity in Municipalities. Sustainability, 17(11), 4867. https://doi.org/10.3390/su17114867