
Eco-Innovation and Earnings Management: Unveiling the Moderating Effects of Financial Constraints and Opacity in FTSE All-Share Firms


Abstract
1. Introduction
2. Literature Review and Hypothesis Development
2.1. Understanding Earnings Management
2.2. Previous Studies on Eco-Innovation
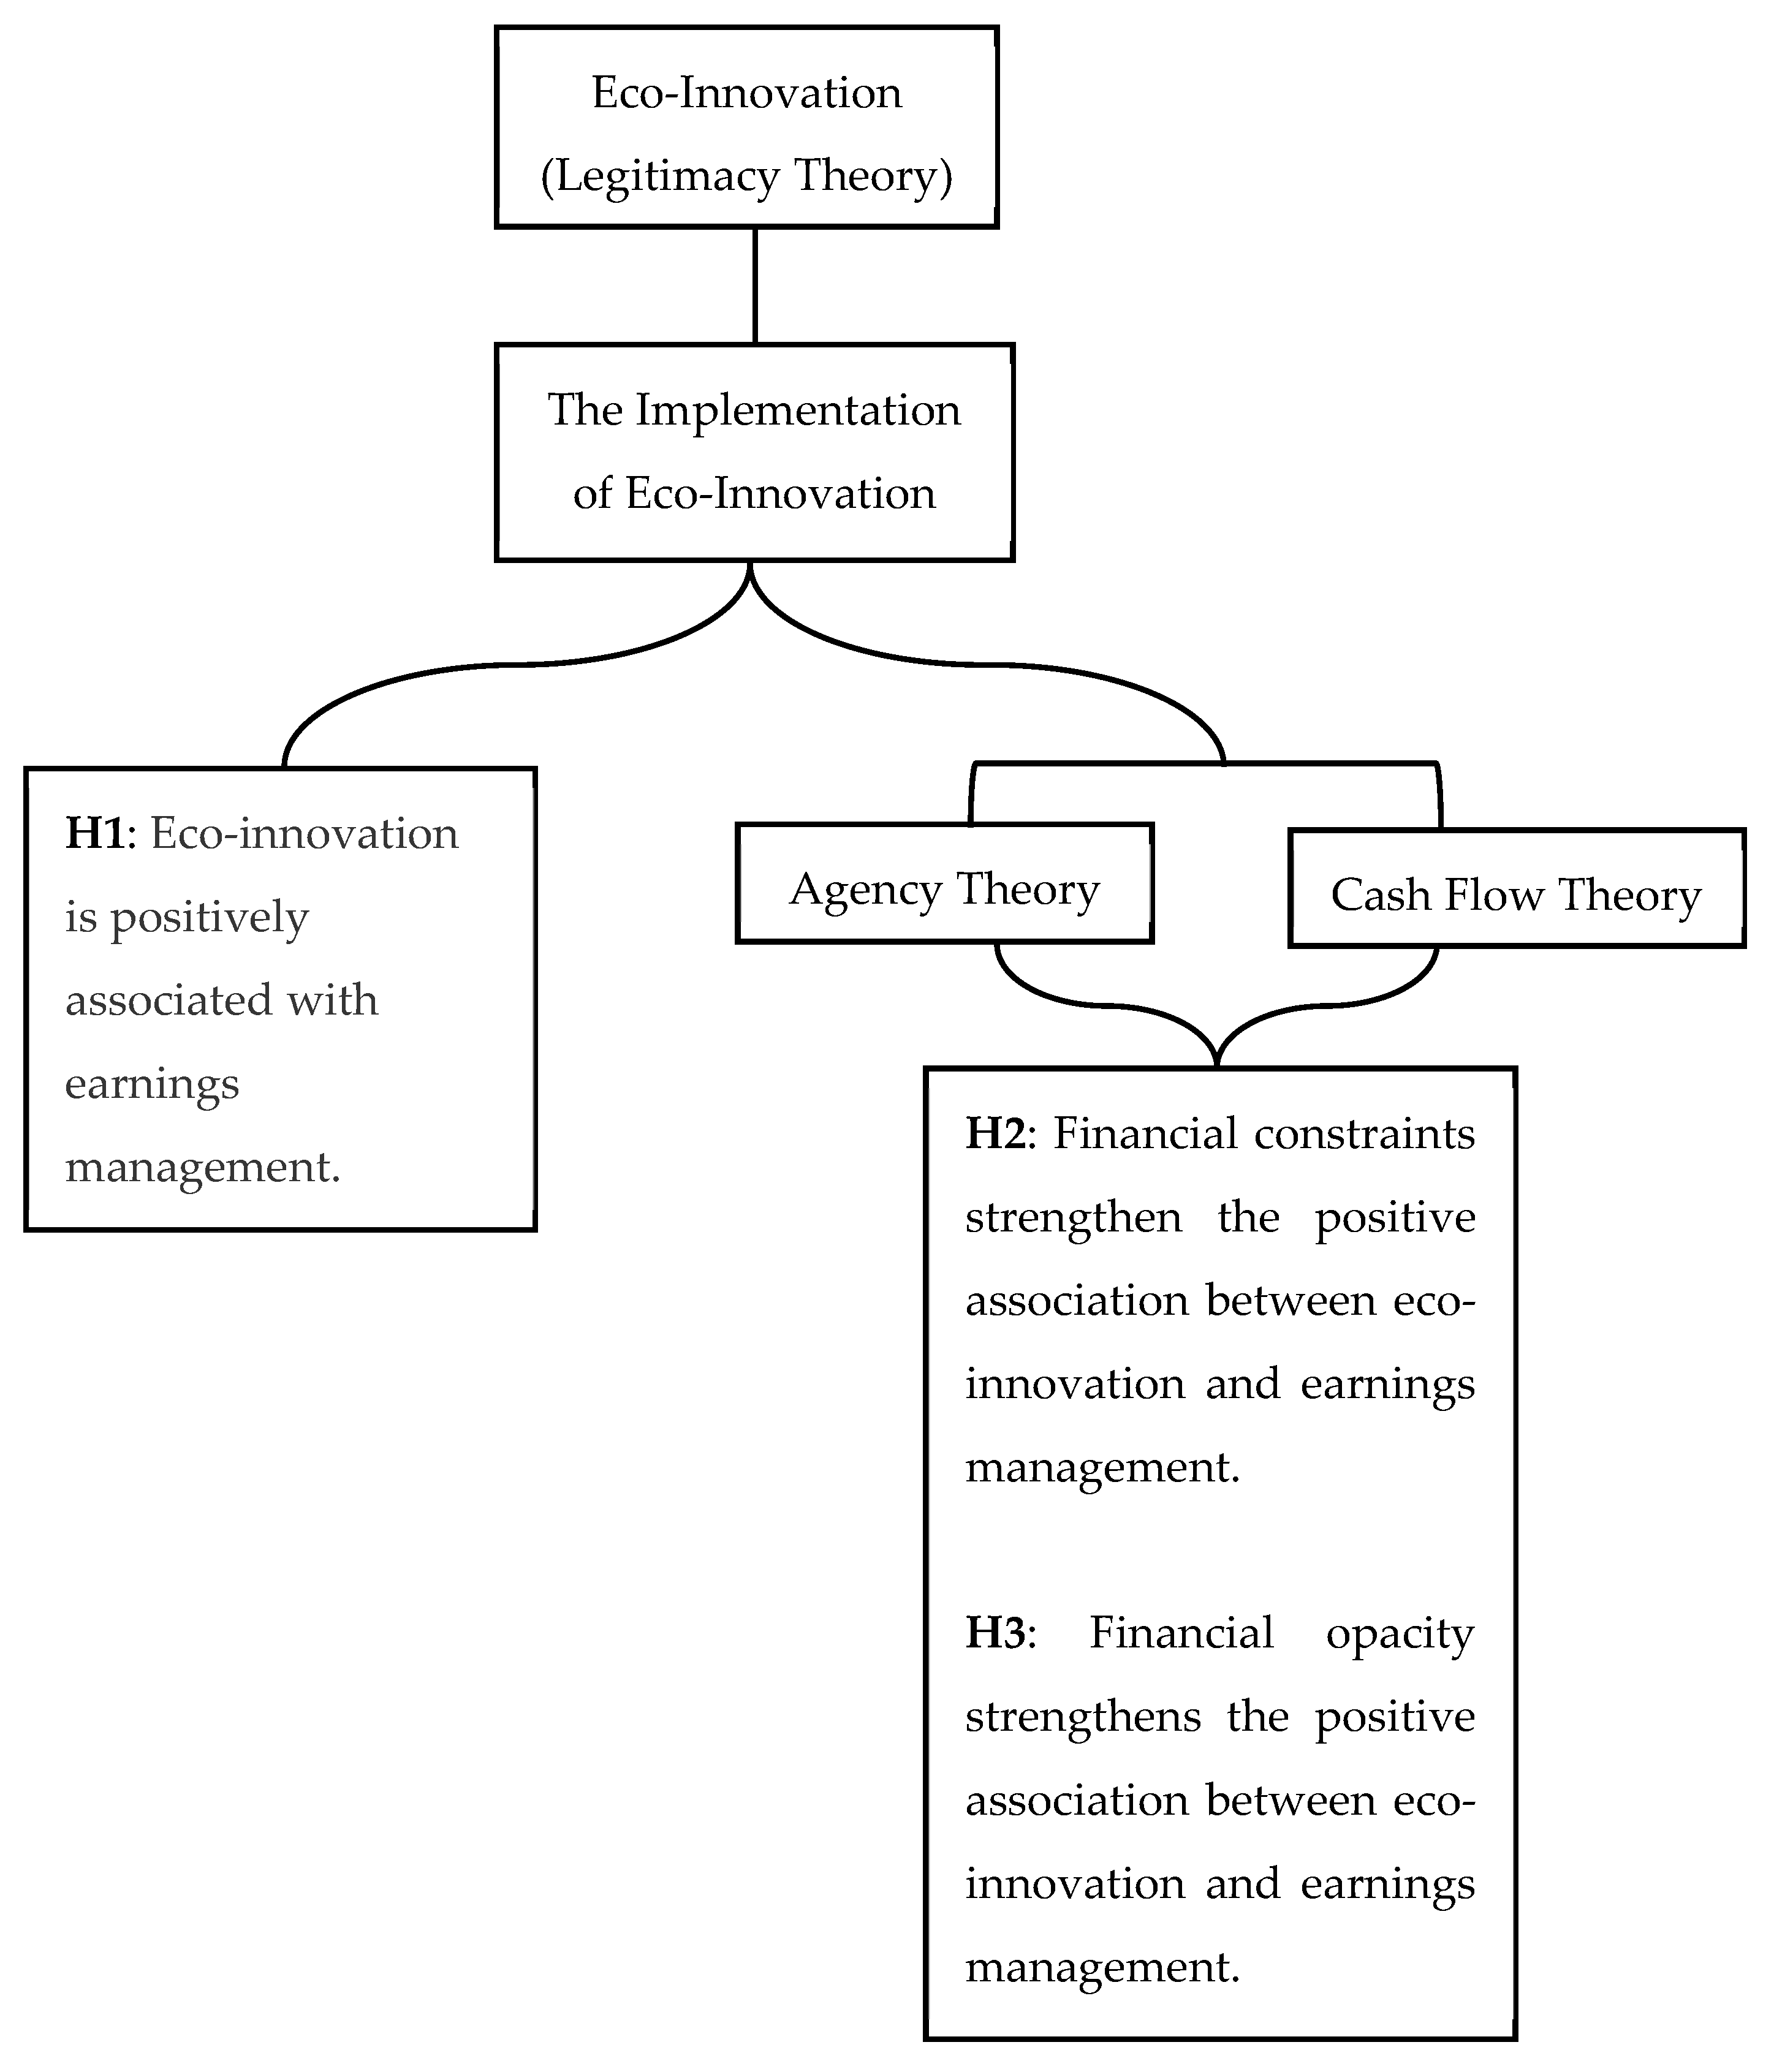
2.3. Theoretical Underpinning
2.4. Hypothesis Development
2.4.1. Eco-Innovation and Earnings Management
2.4.2. The Moderating Effect of Financial Constraint
2.4.3. The Moderating Effect of Financial Opacity
3. Research Design and Data
3.1. Sample Selection
3.2. Variable Measurement
3.2.1. Dependent Variable
3.2.2. Independent Variable
3.2.3. Control Variables
3.3. Regression Model Estimation
3.4. Data Analysis Strategy
3.4.1. Baseline Regression
3.4.2. Moderation Analysis
3.4.3. Robustness Checks
3.4.4. Endogeneity and Selection Bias Corrections
4. Empirical Result
4.1. Descriptive Statistics
4.1.1. Distribution by Industry and Year
4.1.2. Summary Statistics, Variance Inflation Factors, and Correlation Matrix
4.2. Eco-Innovation and Earnings Management (Hypothesis 1)
4.3. The Role of Financial Constraint as an Interaction Variable (Hypothesis 2)
4.4. The Role of Financial Opacity as an Interaction Variable
4.5. The Role of ESG Performance as an Interaction Variable
4.6. Robustness Test
An Alternative Measure of Earnings Management
4.7. Endogeneity Test
4.7.1. Entropy Balance
4.7.2. Propensity Score Matching (PSM)
4.7.3. Heckman Sample Selection Bias Estimation
5. Conclusions
Author Contributions
Funding
Institutional Review Board Statement
Informed Consent Statement
Data Availability Statement
Acknowledgments
Conflicts of Interest
References
- Healy, P.M.; Wahlen, J.M. A review of the earnings management literature and its implications for standard setting. Account. Horiz. 1999, 13, 365–383. [Google Scholar] [CrossRef]
- Dechow, P.; Ge, W.; Schrand, C. Understanding earnings quality: A review of the proxies, their determinants and their consequences. J. Account. Econ. 2010, 50, 344–401. [Google Scholar] [CrossRef]
- Horbach, J.; Rammer, C.; Rennings, K. Determinants of eco-innovations by type of environmental impact—The role of regulatory push/pull, technology push and market pull. Ecol. Econ. 2012, 78, 112–122. [Google Scholar] [CrossRef]
- Kammerer, D. The effects of customer benefit and regulation on environmental product innovation. Empirical evidence from appliance manufacturers in Germany. Ecol. Econ. 2009, 68, 2285–2295. [Google Scholar] [CrossRef]
- Popp, D. International innovation and diffusion of air pollution control technologies: The effects of NOX and SO2 regulation in the US, Japan, and Germany. J. Environ. Econ. Manag. 2006, 51, 46–71. [Google Scholar] [CrossRef]
- Horbach, J. Determinants of environmental innovation—New evidence from German panel data sources. Res. Policy 2008, 37, 163–173. [Google Scholar] [CrossRef]
- Porter, M.E.; van der Linde, C. Toward a New Conception of the Environment-Competitiveness Relationship. J. Econ. Perspect. 1995, 9, 97–118. [Google Scholar] [CrossRef]
- Jones, J.J. Earnings Management During Import Relief Investigations. J. Account. Res. 1991, 29, 193–228. [Google Scholar] [CrossRef]
- Dechow, P.M.; Sloan, R.G.; Sweeney, A.P. Detecting Earnings Management. Account. Rev. 1995, 70, 193–225. Available online: https://www.jstor.org/stable/248303 (accessed on 19 October 2024).
- Kasznik, R. On the Association between Voluntary Disclosure and Earnings Management. J. Account. Res. 1999, 37, 57–81. [Google Scholar] [CrossRef]
- Kothari, S.P.; Leone, A.J.; Wasley, C.E. Performance matched discretionary accrual measures. J. Account. Econ. 2005, 39, 163–197. [Google Scholar] [CrossRef]
- Stickney, C.P.; Weil, R.L.; Schipper, K.; Francis, J. Financial Accounting: An Introduction to Concepts, Methods and Uses, 13th ed.; South-Western College Publishing: Cincinnati, OH, USA, 2009. [Google Scholar]
- Schipper, K. Commentary on earnings management. Account. Horiz. 1989, 3, 91–102. Available online: https://research.ebsco.com/linkprocessor/plink?id=92191a7a-bac2-34fa-b9cd-93e3846e5609 (accessed on 19 October 2024).
- Boachie, C.; Mensah, E. The effect of earnings management on firm performance: The moderating role of corporate governance quality. Int. Rev. Financ. Anal. 2022, 83, 102270. [Google Scholar] [CrossRef]
- Graham, J.R.; Harvey, C.R.; Rajgopal, S. The economic implications of corporate financial reporting. J. Account. Econ. 2005, 40, 3–73. [Google Scholar] [CrossRef]
- Jensen, M.C.; Meckling, W.H. Theory of the firm: Managerial behaviour, agency costs and ownership structure. J. Financ. Econ. 1976, 3, 305–360. [Google Scholar] [CrossRef]
- Jia, W.; Lin, Z. The impact of earnings information quality on enterprise innovation: A test of mediating effect based on debt heterogeneity. Commer. Res. 2020, 6, 135–143. Available online: http://www.crjournal.org.cn/EN/Y2020/V62/I6/135 (accessed on 19 October 2024).
- Chouaibi, J.; Zouari, G.; Khlifi, S. How does the real earnings management affect firms innovative? Evidence from US firms. Int. J. Law Manag. 2019, 61, 151–169. [Google Scholar] [CrossRef]
- Zhang, W.; Hu, P.; Wang, J.J.; Li, Z.; Zheng, H.; Gao, X. Equity incentive plans and R&D investment manipulation: Evidence from China. Account. Financ. 2022, 62, 4157–4183. [Google Scholar] [CrossRef]
- Yang, Y.; Zhu, Y.; Li, Y.; Zheng, Z.; Han, Y. The effect of CEO succession on green technology innovation: The mediating effect of earnings management. Environ. Dev. Sustain. 2023, 27, 7503–7544. [Google Scholar] [CrossRef]
- Díaz-García, C.; González-Moreno, Á.; Sáez-Martínez, F.J. Eco-innovation: Insights from a literature review. Innovation 2015, 17, 6–23. [Google Scholar] [CrossRef]
- Rennings, K. Redefining innovation—Eco-innovation research and the contribution from ecological economics. Ecol. Econ. 2000, 32, 319–332. [Google Scholar] [CrossRef]
- Xavier, A.F.; Naveiro, R.M.; Aoussat, A.; Reyes, T. Systematic literature review of eco-innovation models: Opportunities and recommendations for future research. J. Clean. Prod. 2017, 149, 1278–1302. [Google Scholar] [CrossRef]
- Halila, F.; Rundquist, J. The development and market success of eco-innovations: A comparative study of eco-innovations and “other” innovations in Sweden. Eur. J. Innov. Manag. 2011, 14, 278–302. [Google Scholar] [CrossRef]
- Carrillo-Hermosilla, J.; Río González, P.; Könnölä, T. Eco-Innovation: When Sustainability and Competitiveness Shake Hands; Palgrave Macmillan: London, UK, 2009. [Google Scholar] [CrossRef]
- Kemp, R.; Foxon, T. Typology of Eco-Innovation. In MEI Project: Measuring Eco-Innovation; European Commission: Brussels, Belgium, 2007; Available online: https://lab.unu-merit.nl/wp-content/uploads/2021/05/MEI-D2-Typology-of-eco-innovation-1.pdf (accessed on 19 October 2024).
- Demirel, P.; Kesidou, E. Stimulating different types of eco-innovation in the UK: Government policies and firm motivations. Ecol. Econ. 2011, 70, 1546–1557. [Google Scholar] [CrossRef]
- Porter, M.E.; van der Linde, C. Green and Competitive–Ending the Stalemate. Harv. Bus. Rev. 1995, 73, 120–134. Available online: https://hbr.org/1995/09/green-and-competitive-ending-the-stalemate (accessed on 19 October 2024).
- OECD. Sustainable Manufacturing and Eco-Innovation: Framework, Practices and Measurement; Synthesis Report; OECD Publishing: Paris, France, 2009; Available online: https://sostenibilidadyprogreso.org/files/entradas/43423689.pdf (accessed on 19 October 2024).
- Almubarak, W.I.; Chebbi, K.; Ammer, M.A. Unveiling the Connection among ESG, Earnings Management, and Financial Distress: Insights from an Emerging Market. Sustainability 2023, 15, 12348. [Google Scholar] [CrossRef]
- Albitar, K.; Al-Shaer, H.; Liu, Y.S. Corporate commitment to climate change: The effect of eco-innovation and climate governance. Res. Policy 2023, 52, 104697. [Google Scholar] [CrossRef]
- Amin, M.R.; Akindayomi, A.; Sarker, M.S.R.; Bhuyan, R. Climate policy uncertainty and corporate tax avoidance. Financ. Res. Lett. 2023, 58, 104581. [Google Scholar] [CrossRef]
- Jiang, H.; Hu, W.; Jiang, P. Does ESG performance affect corporate tax avoidance? Evidence from China. Financ. Res. Lett. 2024, 61, 105056. [Google Scholar] [CrossRef]
- Souguir, Z.; Lassoued, N.; Khanchel, I.; Bouzgarrou, H. Environmental performance and corporate tax avoidance: Greenwashing policy or eco-responsibility? The moderating role of ownership structure. J. Clean. Prod. 2024, 434, 140152. [Google Scholar] [CrossRef]
- OECD/Eurostat. Oslo Manual: Guidelines for Collecting and Interpreting Innovation Data, 3rd ed.; OECD Publishing: aris, France, 2005. [Google Scholar] [CrossRef]
- Wagner, M. Empirical influence of environmental management on innovation: Evidence from Europe. Ecol. Econ. 2008, 66, 392–402. [Google Scholar] [CrossRef]
- Frondel, M.; Horbach, J.; Rennings, K. End-of-pipe or cleaner production? An empirical comparison of environmental innovation decisions across OECD countries. Bus. Strategy Environ. 2007, 16, 571–584. [Google Scholar] [CrossRef]
- Brunnermeier, S.B.; Cohen, M.A. Determinants of environmental innovation in US manufacturing industries. J. Environ. Econ. Manag. 2003, 45, 278–293. [Google Scholar] [CrossRef]
- Cleff, T.; Rennings, K. Determinants of environmental product and process innovation. Eur. Environ. 1999, 9, 191–201. [Google Scholar] [CrossRef]
- Green, K.; McMeekin, A.; Irwin, A. Technological trajectories and R&D for environmental innovation in UK firms. Futures J. Policy Plan. Futures Stud. 1994, 26, 1047–1059. [Google Scholar] [CrossRef]
- Bansal, P.; Roth, K. Why companies go green: A model of ecological responsiveness. Acad. Manag. J. 2000, 43, 717–736. [Google Scholar] [CrossRef]
- Chen, Y. The Positive Effect of Green Intellectual Capital on Competitive Advantages of Firms. J. Bus. Ethics 2008, 77, 271–286. [Google Scholar] [CrossRef]
- Eccles, R.G.; Ioannou, I.; Serafeim, G. The Impact of Corporate Sustainability on Organizational Processes and Performance. Manag. Sci. 2014, 60, 2835–2857. [Google Scholar] [CrossRef]
- Chen, Y.; Lai, S.; Wen, C. The Influence of Green Innovation Performance on Corporate Advantage in Taiwan. J. Bus. Ethics 2006, 67, 331–339. [Google Scholar] [CrossRef]
- Suchman, M.C. Managing Legitimacy-Strategic and Institutional Approaches. Acad. Manag. Rev. 1995, 20, 571–610. [Google Scholar] [CrossRef]
- Babiak, K.; Trendafilova, S. CSR and environmental responsibility: Motives and pressures to adopt green management practices. Corp. Soc.-Responsib. Environ. Manag. 2011, 18, 11–24. [Google Scholar] [CrossRef]
- Chen, Y. The Driver of Green Innovation and Green Image: Green Core Competence. J. Bus. Ethics 2008, 81, 531–543. [Google Scholar] [CrossRef]
- Kabir, M.d.N.; Miah, M.D.; Rahmanc, S.; Alam, M.d.S.; Sarker, T. Financial Constraints and Environmental Innovations: Evidence from Global Data; Elsevier: Amsterdam, The Netherlands, 2024. [Google Scholar] [CrossRef]
- Zhao, J.; Cheng, X.; Guo, J. How do aspirations work? Financial performance shortfalls and firms’ green innovation. Bus. Strategy Environ. 2025, 34, 724–748. [Google Scholar] [CrossRef]
- Kim, J.; Li, Y.; Zhang, L. Corporate tax avoidance and stock price crash risk: Firm-level analysis. J. Financ. Econ. 2011, 100, 639–662. [Google Scholar] [CrossRef]
- Bayar, O.; Huseynov, F.; Sardarli, S. Corporate Governance, Tax Avoidance, and Financial Constraints. Financ. Manag. 2018, 47, 651–677. [Google Scholar] [CrossRef]
- Edwards, A.; Schwab, C.; Shevlin, T. Financial Constraints and Cash Tax Savings. Account. Rev. 2016, 91, 859–881. [Google Scholar] [CrossRef]
- Sharma, S.; Henriques, I. Stakeholder influences on sustainability practices in the Canadian forest products industry. Strateg. Manag. J. 2005, 26, 159–180. [Google Scholar] [CrossRef]
- Bansal, P.; Clelland, I. Talking trash: Legitimacy, impression management, and unsystematic risk in the context of the natural environment. Acad. Manag. J. 2004, 47, 93–103. [Google Scholar] [CrossRef]
- Abad, D.; Cutillas-Gomariz, M.F.; Sánchez-Ballesta, J.P.; Yagüe, J. Real earnings management and information asymmetry in the equity market. Eur. Account. Rev. 2018, 27, 209–235. [Google Scholar] [CrossRef]
- Dahiya, S.; Iannotta, G.; Navone, M. Firm opacity lies in the eye of the beholder. Financ. Manag. 2017, 46, 553–592. [Google Scholar] [CrossRef]
- Yeh, Y.M.C.; Chen, H.W.; Wu, M.C. Can information transparency improve earnings quality attributes? Evidence from an enhanced disclosure regime in Taiwan. Emerg. Mark. Financ. Trade 2014, 50, 237–253. [Google Scholar] [CrossRef]
- Whited, T.M.; Wu, G. Financial Constraints Risk. Rev. Financ. Stud. 2006, 19, 531–559. [Google Scholar] [CrossRef]
- Feng, Z.; Wang, Y.; Wang, W. Corporate carbon reduction and tax avoidance: International evidence. J. Contemp. Account. Econ. 2024, 20, 100416. [Google Scholar] [CrossRef]
- Delgado, F.J.; Fernández-Rodríguez, E.; García-Fernández, R.; Landajo, M.; Martínez-Arias, A. Tax avoidance and earnings management: A neural network approach for the largest European economies. Financ. Innov. 2023, 9, 19–25. [Google Scholar] [CrossRef]
- D’Amico, E.; Coluccia, D.; Fontana, S.; Solimene, S. Factors Influencing Corporate Environmental Disclosure. Bus. Strategy Environ. 2016, 25, 178–192. [Google Scholar] [CrossRef]
- Abdou, H.A.; Ellelly, N.N.; Elamer, A.A.; Hussainey, K.; Yazdifar, H. Corporate governance and earnings management nexus: Evidence from the UK and Egypt using neural networks. Int. J. Financ. Econ. 2021, 26, 6281–6311. [Google Scholar] [CrossRef]
- Thanasas, G.; Filiou, A.; Smaraidos, V. The impact of corporate governance on earnings management in emerging economies: The Greek evidence. Int. J. Comp. Manag. 2018, 1, 317. [Google Scholar] [CrossRef]
- Velte, P. Sustainable institutional investors, corporate sustainability performance, and corporate tax avoidance: Empirical evidence for the European capital market. Corp. Soc. Responsib. Environ. Manag. 2023, 30, 2406–2418. [Google Scholar] [CrossRef]
- Haque, T.; Pham, T.P.; Yang, J. Geopolitical risk, financial constraints, and tax avoidance. J. Int. Financ. Mark. Inst. Money 2023, 88, 101858. [Google Scholar] [CrossRef]
- Panousi, V.; Papanikolaou, D. Investment, Idiosyncratic Risk, and Ownership. J. Financ. 2012, 67, 1113–1148. [Google Scholar] [CrossRef]
- Li, D. Financial Constraints, R&D Investment, and Stock Returns. Rev. Financ. Stud. 2011, 24, 2974–3007. [Google Scholar] [CrossRef]
- Duchin, R. Cash Holdings and Corporate Diversification. J. Financ. 2010, 65, 955–992. [Google Scholar] [CrossRef]
- Dhaliwal, D.S.; Radhakrishnan, S.; Tsang, A.; Yang, Y.G. Nonfinancial Disclosure and Analyst Forecast Accuracy: International Evidence on Corporate Social Responsibility Disclosure. Account. Rev. 2012, 87, 723–759. [Google Scholar] [CrossRef]
- Bhattacharya, U.; Daouk, H.; Welker, M. The World Price of Earnings Opacity. Account. Rev. 2003, 78, 641–678. [Google Scholar] [CrossRef]
- Choi, H.; Choi, B.; Byun, J. The relationship between Corporate Social Responsibility and Earnings Management: Accounting for Endogeneity. Investment Manag. Financ. Innov. 2018, 15, 69–84. [Google Scholar] [CrossRef]
- Marquis, C.; Qian, C. Corporate Social Responsibility Reporting in China: Symbol or Substance? Organ. Sci. 2014, 25, 127–148. [Google Scholar] [CrossRef]
- Ioannou, I.; Serafeim, G. Corporate Sustainability: A Strategy? Harv. Bus. Sch. Account. Manag. 2019, 19, 65. [Google Scholar] [CrossRef]
- McMullin, J.L.; Schonberger, B. Entropy-balanced accruals. Rev. Account. Stud. 2020, 25, 84–119. [Google Scholar] [CrossRef]
- Hainmueller, J. Entropy Balancing for Causal Effects: A Multivariate Reweighting Method to Produce Balanced Samples in Observational Studies. Political Anal. 2012, 20, 25–46. [Google Scholar] [CrossRef]
- Heckman, J.J. Sample Selection Bias as a Specification Error. Econometrica 1979, 47, 153–161. [Google Scholar] [CrossRef]

| Criteria | Number of Firm-Years |
|---|---|
| Refinitiv Eikon | 1878 |
| Less: | |
| Utility Firms (SIC codes 6000–6999) | 60 |
| Financial Firms (SIC codes 4000–4999) | 200 |
| Others (SIC codes between 4000–4999 and 6000–6999) | 9 |
| Final sample | 1609 |
| Dependent Variables | Description | Source |
|---|---|---|
| Discretionary accruals (DACC) | a proxy to represent earnings management, using the Kothari model | Refinitiv Eikon |
| Independent Variable | ||
| Eco-innovation Score (EIS) | reflects a company’s capacity to reduce the environmental costs and burdens for its customers and thereby creating new market opportunities through new environmental technologies and processes or eco-designed products. The range score is between 0–100 | Refinitiv Eikon |
| Control Variables | ||
| Return on assets (ROA) | measured as income after taxes for the fiscal period divided by the average total assets | Refinitiv Eikon |
| Size (SIZE) | measured by the natural logarithm of total assets | Refinitiv Eikon |
| Leverage (LEV) | measured by total debt divided by total assets | Refinitiv Eikon |
| Market-to-book ratio (MTB) | measured by company market capitalisation divided by book value capitalisation | Refinitiv Eikon |
| Asset-income ratio (AIN) | measured by total assets divided by net income before taxes | Refinitiv Eikon |
| Liquidity (LIQ) | measured as current assets divided by current liabilities | Refinitiv Eikon |
| Firm age (AGE) | measured by the natural logarithm of year t minus the date of incorporation plus 1 | Refinitiv Eikon |
| Big 4 (BIG4) | a dummy variable to denote whether the auditor is affiliated with one of the BIG 4 auditor firms (1) or not (0) | Refinitiv Eikon |
| Board size (BODSIZE) | measured by the natural logarithm of the number of board members | Refinitiv Eikon |
| Board independence (BODIND) | measured by the proportion of independent directors on the board | Refinitiv Eikon |
| Capital Intensity (CAP_INTENS) | Measured by firm capital divided by total sales | Refinitiv Eikon |
| Panel A: Distribution by Year | ||||
| year | Freq. | Percent | Cum. | |
| 2014 | 90 | 5.59 | 5.59 | |
| 2015 | 148 | 9.20 | 14.79 | |
| 2016 | 158 | 9.82 | 24.61 | |
| 2017 | 170 | 10.57 | 35.18 | |
| 2018 | 171 | 10.63 | 45.80 | |
| 2019 | 184 | 11.44 | 57.24 | |
| 2020 | 224 | 13.92 | 71.16 | |
| 2021 | 227 | 14.11 | 85.27 | |
| 2022 | 237 | 14.73 | 100.00 | |
| Total | 1609 | 100.00 | ||
| Panel B: Distribution by Industry | ||||
| Freq. | Percent | Cum. | ||
| Consumer Nondurables | 143 | 8.89 | 8.89 | |
| Consumer Durables | 12 | 0.75 | 9.63 | |
| Manufacturing | 211 | 13.11 | 22.75 | |
| Oil, Gas, and Coal Extraction and Products | 75 | 4.66 | 27.41 | |
| Chemicals and Allied Products | 64 | 3.98 | 31.39 | |
| Business Equipment | 156 | 9.70 | 41.08 | |
| Telephone and Television Transmission | 19 | 1.18 | 42.26 | |
| Whole sales, Retail, and Some Services | 340 | 21.13 | 63.39 | |
| Healthcare, Medical Equipment, and Drugs | 44 | 2.73 | 66.13 | |
| Other | 545 | 33.87 | 100.00 | |
| Total | 1609 | 100.00 | ||
| Panel A: Summary Statistics | |||||||||||||
| N | Mean | SD | Min | Median | Max | ||||||||
| DACC | 1609 | −0.006 | 0.064 | −0.314 | −0.002 | 0.321 | |||||||
| EIS | 1609 | 0.265 | 0.313 | 0.000 | 0.120 | 0.986 | |||||||
| ROA | 1609 | 0.062 | 0.095 | −0.248 | 0.055 | 0.448 | |||||||
| SIZE | 1609 | 21.161 | 1.560 | 16.435 | 21.061 | 25.512 | |||||||
| LEV | 1609 | 0.204 | 0.154 | 0.000 | 0.200 | 0.770 | |||||||
| MTB | 1609 | 1.825 | 1.895 | 0.235 | 1.217 | 12.875 | |||||||
| AIN | 1609 | 0.139 | 0.615 | −2.727 | 0.061 | 4.391 | |||||||
| LIQ | 1609 | 1.633 | 1.187 | 0.242 | 1.333 | 8.112 | |||||||
| AGE | 1609 | 3.233 | 0.977 | 0.000 | 3.180 | 4.930 | |||||||
| BODSIZE | 1609 | 8.804 | 2.084 | 3.000 | 9.000 | 17.000 | |||||||
| BODIND | 1609 | 0.615 | 0.130 | 0.071 | 0.625 | 0.923 | |||||||
| BIG4 | 1609 | 0.642 | 0.480 | 0.000 | 1.000 | 1.000 | |||||||
| CAP_INTENS | 1609 | 1.366 | 2.386 | 0.057 | 0.866 | 26.120 | |||||||
| Panel B: Variance Inflation Factors | |||||||||||||
| Variable | VIF | 1/VIF | |||||||||||
| SIZE | 2.20 | 0.454 | |||||||||||
| MTB | 1.70 | 0.587 | |||||||||||
| ROA | 1.68 | 0.596 | |||||||||||
| BODSIZE | 1.60 | 0.626 | |||||||||||
| CAP_INTENS | 1.32 | 0.758 | |||||||||||
| LEV | 1.26 | 0.793 | |||||||||||
| LIQ | 1.21 | 0.827 | |||||||||||
| EIS | 1.19 | 0.837 | |||||||||||
| BODIND | 1.16 | 0.865 | |||||||||||
| AGE | 1.12 | 0.889 | |||||||||||
| AIN | 1.05 | 0.949 | |||||||||||
| BIG4 | 1.03 | 0.975 | |||||||||||
| MEAN VIF | 1.38 | ||||||||||||
| Panel C: Correlation Matrix | |||||||||||||
| Variables | (1) | (2) | (3) | (4) | (5) | (6) | (7) | (8) | (9) | (10) | (11) | (12) | (13) |
| DACC | 1.000 | ||||||||||||
| EIS | 0.096 *** | 1.000 | |||||||||||
| ROA | −0.035 | −0.007 | 1.000 | ||||||||||
| SIZE | 0.008 | 0.334 *** | −0.094 *** | 1.000 | |||||||||
| LEV | −0.080 *** | −0.015 | −0.252 *** | 0.145 *** | 1.000 | ||||||||
| MTB | −0.302 *** | −0.085 *** | 0.574 *** | −0.241 *** | −0.065 *** | 1.000 | |||||||
| AIN | 0.050 ** | −0.063 ** | 0.042 * | −0.190 *** | −0.059 ** | 0.030 | 1.000 | ||||||
| LIQ | 0.030 | −0.064 ** | 0.216 *** | −0.236 *** | −0.313 *** | 0.105 *** | 0.004 | 1.000 | |||||
| AGE | 0.165 *** | 0.190 *** | −0.035 | 0.143 *** | −0.171 *** | −0.103 *** | 0.014 | 0.009 | 1.000 | ||||
| BODSIZE | 0.011 | 0.218 *** | −0.107 *** | 0.534 *** | 0.180 *** | −0.092 *** | −0.161 *** | −0.071 *** | −0.044 * | 1.000 | |||
| BODIND | −0.002 | 0.255 *** | −0.033 | 0.298 *** | 0.077 *** | −0.112 *** | −0.074 *** | −0.061 ** | 0.100 *** | 0.221 *** | 1.000 | ||
| BIG4 | −0.042 * | −0.010 | 0.087 *** | −0.011 | −0.019 | 0.120 *** | 0.032 | −0.029 | 0.048 * | −0.052 ** | 0.013 | 1.000 | |
| CAP_INTENS | 0.190 *** | −0.081 *** | −0.121 *** | −0.322 *** | 0.106 *** | −0.109 *** | −0.018 | 0.096 *** | −0.143 *** | 0.045 * | 0.011 | −0.024 | 1.000 |
| Variables | DACC | ||
|---|---|---|---|
| (1) | (2) | (3) | |
| EIS | 0.195 *** (3.856) | 0.152 *** (3.012) | 0.107 *** (3.379) |
| ROA | 0.141 *** (7.161) | 0.115 ** (2.385) | |
| SIZE | −0.001 (−0.945) | 0.000 (0.152) | |
| LEV | −0.018 * (−1.712) | −0.016 * (−1.891) | |
| MTB | −0.013 *** (−13.327) | −0.013 *** (−5.152) | |
| AIN | 0.005 ** (2.163) | 0.006 ** (2.680) | |
| LIQ | −0.001 (−0.562) | −0.000 (−0.296) | |
| AGE | 0.010 *** (6.273) | 0.009 *** (3.967) | |
| BODSIZE | 0.001 (0.871) | 0.000 (0.516) | |
| BODIND | −0.032 *** (−2.680) | −0.033 * (−1.999) | |
| BIG4 | −0.002 (−0.710) | −0.002 (−0.887) | |
| CAP_INTENS | 0.005 *** (7.556) | 0.006 *** (4.115) | |
| Constant | −0.011 *** (−5.290) | 0.013 (0.478) | −0.018 (−0.544) |
| Year Fixed Effect | NO | NO | YES |
| Industry Fixed Effect | NO | NO | YES |
| Observations | 1609 | 1609 | 1609 |
| Adjusted R-squared | 0.009 | 0.181 | 0.211 |
| Dependent Variable: | DACC | |||
|---|---|---|---|---|
| Financial Constraint: | High Sales | Low Sales | High WW Score | Low WW Score |
| (1) | (2) | (3) | (4) | |
| EIS | −0.027 (−0.498) | 0.282 *** (5.125) | 0.128 * (1.842) | 0.095 (1.616) |
| Controls | YES | YES | YES | YES |
| Constant | 0.003 (0.059) | 0.076 (1.534) | 0.013 (0.227) | −0.018 (−0.289) |
| Year Fixed Effect | YES | YES | YES | YES |
| Industry Fixed Effect | YES | YES | YES | YES |
| Observations | 805 | 804 | 805 | 804 |
| Adjusted R-squared | 0.185 | 0.245 | 0.170 | 0.302 |
| Permutation tests for coef. diff | p-value < 0.000 | p-value = 0.380 | ||
| Dependent Variable | DACC | |
|---|---|---|
| Financial Opacity: | High Transparency | Low Transparency |
| (1) | (2) | |
| EIS | −0.054 (−1.206) | 0.146 *** (3.640) |
| Controls | YES | YES |
| Constant | −0.035 (−0.660) | −0.016 (−0.339) |
| Year Fixed Effect | YES | YES |
| Industry Fixed Effect | YES | YES |
| Observations | 492 | 1117 |
| Adjusted R-squared | 0.212 | 0.222 |
| Permutation tests for coef. diff | p-value = 0.04 | |
| Dependent Variable | DACC | |
|---|---|---|
| ESG Performance: | High ESG Performance | Low ESG Performance |
| (1) | (2) | |
| EIS | −0.029 (−0.590) | 0.328 *** (4.650) |
| Controls | YES | YES |
| Constant | −0.003 (−0.050) | −0.029 (−0.320) |
| Year Fixed Effect | YES | YES |
| Industry Fixed Effect | YES | YES |
| Observations | 805 | 804 |
| Adjusted R-squared | 0.243 | 0.228 |
| Permutation tests for coef. diff | p-value = 0.000 | |
| Dependent Variable | DACC | |||
|---|---|---|---|---|
| JONES | DECHOW | KASZNIK | KHOTARI | |
| EIS | 0.098 ** (2.584) | 0.098 ** (2.563) | 0.081 * (2.109) | 0.107 *** (3.379) |
| ROA | 0.398 *** (7.547) | 0.403 *** (7.780) | 0.462 *** (8.925) | 0.115 ** (2.385) |
| SIZE | −0.001 (−0.296) | −0.000 (−0.127) | −0.000 (−0.102) | 0.000 (0.152) |
| LEV | 0.005 (0.488) | 0.004 (0.339) | 0.012 (1.213) | −0.016 * (−1.891) |
| MTB | −0.014 *** (−5.330) | −0.014 *** (−5.276) | −0.014 *** (−5.559) | −0.013 *** (−5.152) |
| AIN | 0.006 ** (2.722) | 0.006 ** (2.704) | 0.006 *** (3.932) | 0.006 ** (2.680) |
| LIQ | −0.000 (−0.035) | −0.000 (−0.069) | −0.001 (−0.578) | −0.000 (−0.296) |
| AGE | 0.010 *** (4.500) | 0.010 *** (4.314) | 0.010 *** (4.479) | 0.009 *** (3.967) |
| BODSIZE | 0.001 (0.841) | 0.001 (0.751) | 0.001 (1.233) | 0.000 (0.516) |
| BODIND | −0.030 (−1.473) | −0.031 (−1.560) | −0.028 (−1.775) | −0.033 * (−1.999) |
| BIG4 | −0.003 (−0.856) | −0.003 (−0.851) | −0.003 (−0.658) | −0.002 (−0.887) |
| CAP_INTENS | 0.006 *** (4.401) | 0.006 *** (4.131) | 0.006 *** (4.425) | 0.006 *** (4.115) |
| Constant | −0.035 (−0.788) | −0.039 (−0.898) | −0.048 (−1.298) | −0.018 (−0.544) |
| Year Fixed Effect | YES | YES | YES | YES |
| Industry Fixed Effect | YES | YES | YES | YES |
| Observations | 1609 | 1609 | 1609 | 1609 |
| Adjusted R-squared | 0.292 | 0.298 | 0.385 | 0.211 |
| Entropy Balance and Propensity Score Matching | ||||
|---|---|---|---|---|
| Panel A: Univariate comparison of means between treatment and control groups before and after balancing—Entropy Balance | ||||
| High Intensity | Low Intensity | High Intensity | Low Intensity | |
| (Treated Group) | (Control Group) | (Treated Group) | (Control Group) | |
| Variable | Before Balancing | After Balancing | ||
| ROA | 0.059 | 0.065 | 0.059 | 0.059 |
| SIZE | 21.650 | 20.670 | 21.650 | 21.650 |
| LEV | 0.201 | 0.208 | 0.201 | 0.201 |
| MTB | 1.642 | 2.007 | 1.642 | 1.642 |
| AIN | 0.098 | 0.179 | 0.098 | 0.098 |
| LIQ | 1.625 | 1.641 | 1.625 | 1.625 |
| AGE | 3.439 | 3.028 | 3.439 | 3.439 |
| BODSIZE | 9.186 | 8.423 | 9.186 | 9.186 |
| BODIND | 0.643 | 0.588 | 0.643 | 0.643 |
| BIG4 | 0.630 | 0.654 | 0.630 | 0.630 |
| CAP_INTENS | 1.100 | 1.632 | 1.100 | 1.100 |
| Panel B: Univariate comparison of means between treatment and control groups—PSM | ||||
| High Intensity | Low Intensity | Difference of Mean | ||
| Variable | (Treated) | (Control) | Diff | t-value |
| ROA | 0.064 | 0.063 | −0.001 | −0.202 |
| SIZE | 21.198 | 21.229 | 0.031 | 0.292 |
| LEV | 0.193 | 0.195 | 0.002 | 0.159 |
| MTB | 1.864 | 1.752 | −0.112 | −0.865 |
| AIN | 0.148 | 0.152 | 0.004 | 0.077 |
| LIQ | 1.742 | 1.666 | −0.076 | −0.819 |
| AGE | 3.314 | 3.329 | 0.015 | 0.222 |
| BODSIZE | 8.722 | 8.832 | 0.110 | 0.736 |
| BODIND | 0.617 | 0.609 | −0.008 | −0.837 |
| BIG4 | 0.677 | 0.649 | −0.028 | −0.795 |
| CAP_INTENS | 1.294 | 1.170 | −0.124 | −0.889 |
| Panel C: Regression Estimate after Entropy Balancing and PSM | ||||
| Dependent variable | DACC | |||
| Entropy Balancing | PSM | |||
| (1) | (2) | |||
| EIS | 0.121 ** (2.881) | 0.101 ** (2.374) | ||
| ROA | 0.115 ** (2.394) | 0.168 * (2.228) | ||
| SIZE | −0.000 (−0.142) | 0.003 (1.290) | ||
| LEV | −0.015 (−1.819) | −0.026 (−1.267) | ||
| MTB | −0.013 *** (−5.151) | −0.012 *** (−3.684) | ||
| AIN | 0.006 ** (2.708) | 0.010 ** (2.703) | ||
| LIQ | −0.001 (−0.343) | −0.003 (−0.961) | ||
| AGE | 0.009 *** (3.959) | 0.011 *** (5.212) | ||
| BODSIZE | 0.000 (0.408) | −0.000 (−0.298) | ||
| BODIND | −0.035 ** (−2.541) | −0.017 (−0.988) | ||
| BIG4 | −0.002 (−0.795) | −0.000 (−0.065) | ||
| CAP_INTENS | 0.006 *** (4.225) | 0.009 *** (12.803) | ||
| Constant | −0.008 (−0.218) | −0.094 (−1.778) | ||
| Year Fixed Effect | YES | YES | ||
| Industry Fixed Effect | YES | YES | ||
| Observations | 1609 | 706 | ||
| Adjusted R-squared | 0.211 | 0.220 | ||
| Panel D: Heckman Test | ||||
| First Stage | Second Stage | |||
| Variables | (1) | (2) | ||
| IND_AVG | 0.316 *** (3.390) | |||
| EIS | 0.104 *** (3.419) | |||
| Controls | Yes | Yes | ||
| Constant | −9.339 *** (−4.636) | 0.033 (0.320) | ||
| Year Fixed Effect | YES | YES | ||
| Industry Fixed Effect | YES | YES | ||
| Observations | 1609 | 1609 | ||
| Adjusted R-squared | 0.194 | 0.211 | ||
Disclaimer/Publisher’s Note: The statements, opinions and data contained in all publications are solely those of the individual author(s) and contributor(s) and not of MDPI and/or the editor(s). MDPI and/or the editor(s) disclaim responsibility for any injury to people or property resulting from any ideas, methods, instructions or products referred to in the content. |
© 2025 by the authors. Licensee MDPI, Basel, Switzerland. This article is an open access article distributed under the terms and conditions of the Creative Commons Attribution (CC BY) license (https://creativecommons.org/licenses/by/4.0/).
Share and Cite
Sastroredjo, P.E.; Ausloos, M.; Khrennikova, P. Eco-Innovation and Earnings Management: Unveiling the Moderating Effects of Financial Constraints and Opacity in FTSE All-Share Firms. Sustainability 2025, 17, 4860. https://doi.org/10.3390/su17114860
Sastroredjo PE, Ausloos M, Khrennikova P. Eco-Innovation and Earnings Management: Unveiling the Moderating Effects of Financial Constraints and Opacity in FTSE All-Share Firms. Sustainability. 2025; 17(11):4860. https://doi.org/10.3390/su17114860
Chicago/Turabian StyleSastroredjo, Probowo Erawan, Marcel Ausloos, and Polina Khrennikova. 2025. "Eco-Innovation and Earnings Management: Unveiling the Moderating Effects of Financial Constraints and Opacity in FTSE All-Share Firms" Sustainability 17, no. 11: 4860. https://doi.org/10.3390/su17114860
APA StyleSastroredjo, P. E., Ausloos, M., & Khrennikova, P. (2025). Eco-Innovation and Earnings Management: Unveiling the Moderating Effects of Financial Constraints and Opacity in FTSE All-Share Firms. Sustainability, 17(11), 4860. https://doi.org/10.3390/su17114860