Article

Do Different Settings Matter in the Economically Sustainable Tourism Approach? A Comparative Study of Serbia, Kazakhstan, and Hungary

by
Marko D. Petrović
1,2,*,
Tamara Gajić
1,
Shakhislam Laiskhanov
3,*,
Milan M. Radovanović
1,
Željko Anđelković
4,
Emin Atasoy
5 and
Dariga M. Khamitova
6
1
Geographical Institute “Jovan Cvijić” SASA, 11000 Belgrade, Serbia
2
Department of Regional Economics and Geography, Faculty of Economics, Peoples’ Friendship University of Russia (RUDN University), 117198 Moscow, Russia
3
Department of Science and Innovation, International Educational Corporation, Almaty 050043, Kazakhstan
4
Department of Geography and Tourism, Faculty of Science and Mathematics, University of Niš, 18000 Niš, Serbia
5
Department of Social Sciences, Faculty of Education, Uludag University, 16059 Bursa, Turkey
6
Department of Art and Art Management, Kazakh National Academy of Choreography, Astana 010000, Kazakhstan
*
Authors to whom correspondence should be addressed.
Sustainability 2025, 17(11), 4985; https://doi.org/10.3390/su17114985
Submission received: 16 April 2025 / Revised: 16 May 2025 / Accepted: 26 May 2025 / Published: 29 May 2025

Abstract

:
This study explores residents’ perceptions of tourism development with a particular emphasis on the economic dimension of sustainability, focusing on how economic benefits, costs, and related factors shape local support in Serbia, Kazakhstan, and Hungary. By analyzing perceived advantages and disadvantages, the study aims to assess the extent of local support for tourism and the moderating effects of travel frequency and contact with tourists. In parallel, tourist arrival forecasts for 2025–2030 provide context on the anticipated dynamics of tourism growth, with Hungary showing the highest projected increase. Using advanced statistical techniques, including Multi-Group Analysis (MGA), structural equation modeling (SEM), and machine learning methods, key factors driving tourism support were identified. Positive perceptions of economic benefits and cultural identification significantly enhance support for tourism, while perceived costs act as inhibitors. The application of Random Forest and XGBoost (version 1.7.x) models improved predictive accuracy, while K-means clustering and principal component analysis (PCA) clarified relationships among constructs. The findings provide actionable insights for developing sustainable tourism strategies that prioritize economic outcomes and community engagement, particularly in culturally and economically diverse settings.

1. Introduction

In recent decades, sustainable tourism has emerged as a global development priority, driven by the recognition of tourism’s potential to generate economic value while preserving social and cultural integrity. The United Nations World Tourism Organization (UNWTO) emphasizes tourism as a strategic pillar for achieving sustainable development goals, particularly in developing and transitioning economies that aim to balance economic growth with inclusiveness and resilience [1]. Amid increasing global mobility and heightened awareness of community rights, tourism development is undergoing significant shifts, particularly in culturally diverse and economically transitional regions [2].
Tourism development has become a significant instrument of commercial growth and social integration in many countries, often highlighted as a driver of local progress through infrastructure improvement, job creation, and revenue generation [3]. However, the sustainability of this sector is influenced by several factors, including the perception of benefits and costs, local support, cultural identification, reciprocal benefits, and their mutual interaction [4]. Although previous studies have emphasized economic benefits as a key prerequisite for tourism support [5], they have rarely incorporated cultural and social elements into a single, unified analytical framework. The focus on isolated individual factors often overlooks their potential synergistic effects, which can result in an incomplete understanding of the complex relationships between tourists and local communities.
Furthermore, the role of moderating variables, such as travel frequency and contact with tourists, has received insufficient empirical attention, despite indications that these interactions can significantly affect perceptions and attitudes [6]. Comparative studies that examine tourism perceptions across distinct geographic and cultural settings, particularly among countries with different economic levels and cultural characteristics, remain scarce and fragmented [7].
Despite growing interest in sustainable tourism, few studies have employed an integrated approach to assess resident perceptions from the standpoint of economic sustainability. This creates a gap in understanding how multiple factors interact to shape local support, especially in regions facing structural transitions. Addressing this gap is crucial today, as many destinations must balance economic modernization with cultural preservation and social cohesion.
To respond to these gaps, this research proposes an integrative model that captures economic, cultural, and social dimensions while applying advanced forecasting and evaluation techniques. Focusing on Serbia, Kazakhstan, and Hungary allows for the comparison of three culturally and economically distinct contexts. Serbia and Kazakhstan, as transitional economies, encounter persistent challenges in aligning tourism development with global standards and in overcoming structural limitations [8]. In contrast, Hungary, as a member of the European Union, has advanced tourism infrastructure and actively promotes innovation in rural and cultural tourism [9].
This research aims to uncover the key elements that contribute to long-term sustainable tourism development by analyzing perceived benefits and costs, local support, cultural identification, and reciprocal benefits, along with the moderating roles of travel frequency and tourist interaction. Although sustainability in tourism is often framed in environmental terms, this study emphasizes the economic dimension, specifically how local communities interpret and support tourism based on perceived material gains and losses [4,5,6].
By integrating these constructs into a single evaluative model, the study offers both theoretical advancement and practical guidance. Through comparative analysis, the research also seeks to identify universal patterns and country-specific differences in residents’ tourism perceptions, which can inform adaptable strategies. The findings are expected to have broader international relevance, especially for destinations facing pressures of globalization, identity negotiation, and the need for inclusive economic growth.

2. Foundation of Theory and Hypotheses Development

This study adopts an economic lens on sustainability, explicitly emphasizing how tourism-related benefits and costs, primarily employment, infrastructure development, and income generation, shape residents’ support. This focus on economic sustainability is consistent with prior research that examines community members’ perceptions of tourism growth through the evaluation of economic advantages and financial burdens [10].

2.1. Perceptions of Tourism Benefits and Costs as Determinants of Support

Perceptions toward tourism’s benefits and costs are deeply interrelated and form the basis for residents’ support or opposition to tourism development [11]. Numerous studies confirm that positive perceptions, especially those relating to economic benefits, tend to dominate attitudinal formation. For example, Muresan et al. [12] demonstrate that residents in mountainous areas view tourism as a tool for cultural preservation and socioeconomic advancement, particularly through job creation. However, their analysis underrepresents potential resident–tourist conflicts, a limitation often shared by other studies. Boley, Strzelecka, and Woosnam [13] reinforce the centrality of economic benefits and advocate for their standardized measurement to ensure analytical consistency. Yet, they omit the influence of cultural and social factors, which are equally relevant in shaping perceptions. Similarly, Joo, Cho, and Woosnam [14] focus on tourists’ views and the positive economic outcomes of tourism, without adequately accounting for complex cultural and environmental dimensions, which may lead to oversimplified conclusions.
While Kodaş et al. [15] and Kanwal et al. [16] also emphasize the role of infrastructure in forming positive attitudes, their studies lack attention to social and cultural resources. Such a narrow focus may be suitable for highly developed tourist destinations but is less applicable in rural or underdeveloped areas. This literature demonstrates a consistent bias toward positive perceptions, with limited analysis of negative aspects of tourism. Although Woosnam et al. [17] provide an innovative application of Social Exchange Theory (SET), they primarily examine tourism’s benefits while neglecting potential disamenities, such as pollution, overcrowding, or income disparity. Gursoy et al.’s [18] meta-analysis also aggregates predominantly positive findings and offers little insight into potential cultural or social costs. In contrast, a growing body of literature highlights the need for more balanced assessments that include negative perceptions. Khandeparkar et al. [19], for instance, explore perceptions of price fairness, demonstrating that high prices can diminish local support for tourism, although they do not fully explore other social or environmental burdens. Wei et al. [20] consider how the nature of tourist attractions influences price perceptions but fail to assess the long-term impacts of perceived costs on resident attitudes. Çelik and Rasoolimanesh [21] explicitly point out that negative perceptions, especially during early stages of tourism development, can critically undermine local support. Lan et al. [22] underscore the value of collaboration between residents and tourists yet omit the conflict potential embedded in unbalanced tourism practices. Recent research has further complicated this picture. Carballo-Cruz and Silva [23] examine how local socioeconomic contexts shape benefit perceptions but tend to overlook negative implications, leading to possible analytical bias. Rodríguez Bolívar et al. [24] explore how technological innovations affect perceived benefits, yet within a narrowly defined technological scope. Zhou et al. [25] enrich the discussion by analyzing how ecocentrism and collectivism influence tourists’ willingness to pay for national park services, but their failure to integrate perceived costs into the analysis represents a methodological limitation. Taken together, these studies reveal a dominant focus on the positive economic outcomes of tourism, often at the expense of understanding its full societal impact. A comprehensive approach that considers both benefit and cost perceptions is thus essential for accurately assessing resident support for tourism development.
H1. 
Positive perceptions of tourism benefits foster enhanced support.
H2. 
Negative perceptions of associated costs erode that support.

2.2. The Role of Local Support in Fostering Community Engagement in Tourism

Beyond economic and cultural benefits, local support represents a foundational pillar in shaping community perceptions of tourism development. However, the academic literature approaches this construct from multiple perspectives, ranging from institutional and emotional to digital forms, often failing to offer a comprehensive, integrative interpretation. A group of studies explores institutional and physical dimensions of local support. Liu, Tan, and Mai [26] demonstrate that effective local support structures can improve residents’ well-being and strengthen tourism support, even under adverse conditions. However, their focus is limited to tourism employees, neglecting how such support mechanisms extend to the broader community. Ramkissoon [27] further develops a conceptual model linking local support to enhanced quality of life in tourist destinations, but the framework lacks empirical grounding, limiting its practical application. Magno and Dossena [28] investigate the influence of large-scale events like the 2015 World Expo in Milan, showing that international exposure can instill civic pride and satisfaction, a form of local support, but their findings highlight that such effects are often short-lived and conditional upon long-term economic gains. Another group of scholars emphasizes digital and informational support. Majeed et al. [29] use structural equation modeling to show how online information, such as that found on travel platforms, affects tourists’ behaviors and indirectly strengthens local support. However, this approach overlooks the relational and social dimensions of support. Similarly, Rafi et al. [30] study digital platforms like Couchsurfing as enablers of social connectivity and support, but do not explore how such support manifests in broader tourism communities or in resident–tourist dynamics. Several authors focus on emotional and relational aspects of local support. Zhuang and Wang [31] emphasize that local support enhances communication and mutual understanding between tourists and residents, thereby increasing acceptance of tourism development. Munanura et al. [32] explore emotional solidarity as a driver of resident support, though their focus on emotional connection underrepresents other vital components like economic security or environmental concern. Du and Cheng [33], examining family-based tourism, show how intergenerational travel fosters social bonding and perceived support, particularly in destinations targeting senior-friendly tourism.
Despite these diverse contributions, most studies adopt fragmented approaches, analyzing local support through singular lenses, be they digital, emotional, or institutional, without addressing its multidimensional nature. As a result, there remains a gap in fully understanding how different forms of local support work together to influence tourism development across communities. Based on the reviewed literature, it can be posited that local support, whether institutional, emotional, or digital, plays a critical role in shaping residents’ engagement with tourism. Therefore, the following hypothesis is proposed:
H3. 
Local support impacts community care for tourism initiatives.

2.3. The Influence of Reciprocal Benefits on Resident Support for Tourism

The concept of reciprocal benefits, the perception that tourism provides tangible advantages in return for hosting visitors, has become increasingly prominent in research grounded in Social Exchange Theory (SET). Numerous studies emphasize that local residents are more likely to support tourism when they perceive a fair exchange in which economic and social gains outweigh potential burdens. Several authors underline the role of positive economic outcomes in fostering support. Dutt, Harvey, and Shaw [34] apply SET in the context of Dubai and demonstrate that increased revenue, job creation, and improved infrastructure are critical elements shaping favorable community attitudes. However, they also caution that these benefits must be balanced against challenges such as infrastructure pressure and cultural erosion, underscoring the need for a more stable exchange. Similarly, Solarin, Ulucak, and Erdogan [35] argue that diversifying tourism markets and activities leads to increased economic benefits and greater resilience, especially for destinations overly dependent on a single form of tourism. In the case of Small Island Developing States (SIDSs), Roudi, Arasli, and Akadiri [36] show that tourism significantly contributes to GDP and employment, but their analysis is narrowly confined to economic metrics, neglecting social and ecological trade-offs.
Other scholars offer critical perspectives on the limitations of an economy-focused view. Alamineh et al. [37], for instance, analyze tourism in Ethiopia’s Amhara region and warn of the degradation of cultural values due to rapid tourism development. Although they acknowledge economic contributions, they conclude that insufficient management of local traditions can undermine sustainability. Jehan et al. [38] provide a broader socio-ecological framework in their analysis of tourism in Pakistan, highlighting that job creation and infrastructure gains are often overshadowed by ignored ecological and cultural impacts, a pattern that risks undermining long-term community support. A more nuanced view emerges from authors exploring the balance between economic gain and social well-being. Paja et al. [39] discuss how lower tourism intensity may improve quality of life but potentially reduce economic returns from mass tourism. This trade-off illustrates the importance of equity and long-term thinking in evaluating reciprocal benefits. Reivan-Ortiz et al. [40] further complicate this relationship by incorporating geopolitical risks, currency fluctuations, and policy dynamics in BRICS countries, showing that economic benefits from tourism are not guaranteed and must be managed adaptively. Sengoz et al. [41] shift focus to the role of intermediaries, such as tour guides, in promoting sustainable practices and enhancing reciprocal value. Their findings support the idea that enhancing tourist experiences and increasing local awareness can strengthen perceptions of tourism as mutually beneficial. Finally, Back, Tasci, and Woosnam [42] reinforce the centrality of economic gains in shaping attitudes, yet caution that perceived injustice or uneven benefit distribution can generate resistance among residents.
Collectively, these findings underscore that while reciprocal benefits are powerful drivers of community support, they must be balanced, inclusive, and perceived as fair. Failing to address social, ecological, or cultural dimensions can lead to perceptions of inequality or exploitation, thereby undermining the very support that benefits are intended to foster. Accordingly, the following hypothesis is proposed:
H4. 
Reciprocal benefits positively influence support for tourism.

2.4. Cultural Identification and Its Impact on Support for Tourism

Cultural identification plays a vital role in shaping residents’ perceptions of tourism, especially in destinations where cultural heritage is a central component of the tourism offer. When local communities perceive tourism as a vehicle for preserving and promoting their cultural identity, they are more likely to support its development. However, striking a balance between cultural preservation and tourism commodification remains a persistent challenge. Sinha et al. [43] emphasize that sustainable tourism practices can support the preservation of historical and cultural sites, particularly in areas struggling with resource conservation. Their research highlights that involving local communities in heritage-related decisions reinforces cultural identity. However, they also point out the absence of concrete strategies for balancing cultural integrity with economic gains. Similarly, Katyukha et al. [44] examine how contemporary strategies seek to harness cultural heritage as a growth engine for tourism. Yet, they caution that the commercialization of culture can threaten authenticity, especially in highly market-driven environments. The tension between authenticity and commodification is also explored by Oorgaz-Agüere et al. [45] and Qiu et al. [46], who argue that maintaining cultural authenticity is essential for strengthening local identity and long-term tourism support. Nonetheless, many of these studies tend to overlook the integration of social and economic dimensions, which limits the broader applicability of their findings [47,48,49,50]. Further contributions, such as that by Mteti et al. [51], investigate how local awareness of cultural heritage influences attitudes toward tourism. Their study in Tanzania’s Katavi region demonstrates that residents with a strong sense of cultural awareness are more likely to express supportive attitudes toward tourism development. Similarly, Butler, Szili, and Huang [52] highlight that tourism can foster positive identity processes when residents perceive it as aligned with the preservation of traditional values. However, they also warn that economic priorities often overshadow cultural considerations, resulting in superficial cultural offerings and the erosion of authenticity. The significance of intangible heritage, including festivals, language, and rituals, is examined by Wasela [53], who argues that these elements can enhance the attractiveness of tourism products, provided they are integrated respectfully. Yet, commercialization may undermine the very authenticity that attracts tourists in the first place. This point is echoed in Qiu et al.’s [54] comprehensive literature review, which notes that while economic valorization of culture is frequently studied, aspects related to identity and authenticity are often sidelined. The authors call for future research to address the social and cultural dimensions of cultural heritage in tourism. Finally, Worku Tadesse [55] emphasizes that cultural resources can effectively drive tourism and protect local identities, but the absence of robust institutional frameworks often impedes successful implementation and long-term preservation.
Taken together, these findings underscore the importance of cultural identification as a psychological and emotional driver of support for tourism, particularly when cultural authenticity is respected and preserved.
H5. 
Cultural identification positively influences tourism initiatives.

2.5. Theoretical Role of Moderating Variables

In the context of sustainable tourism development, travel frequency and contact with tourists have emerged as significant moderating variables influencing residents’ attitudes and behavioral intentions. Drawing on Social Exchange Theory (SET), these factors can alter how individuals evaluate the perceived balance between tourism’s benefits and costs. The extent and nature of personal experiences with tourism, whether through frequent travel or regular interaction with tourists, shape cognitive and emotional responses that ultimately affect support for tourism initiatives. According to the reviewed literature, frequent travelers often possess a more nuanced understanding of tourism’s economic and social implications, potentially leading to greater tolerance of its costs and stronger recognition of its benefits [56,57,58]. These individuals may relate to the tourist experience more directly and thus exhibit increased empathy toward visitors and tourism-related development. Conversely, limited travel experience may result in skepticism or reduced support, particularly if residents perceive imbalanced exchanges or unmet expectations. Similarly, direct contact with tourists, whether through professional, social, or incidental interactions, can play a decisive role in shaping perceptions of tourism’s impact. Repeated and positive interactions are associated with increased social acceptance, enhanced mutual understanding, and improved attitudes toward tourism [59,60]. However, negative encounters or cultural misunderstandings may lead to heightened perceptions of disruption or exploitation, thus weakening support. These patterns align with hierarchical and interactional models that emphasize how exposure and experience modulate attitudinal outcomes [61,62,63]. In light of these considerations and theoretical gaps identified in previous research, we propose that both travel frequency and contact with tourists moderate the relationships between key predictors, such as perceptions of benefits and costs, local support, reciprocal benefits, and cultural identification, and residents’ overall support for tourism development.
H6(a–e). 
Travel frequency positively moderates the relationship between benefits perception, costs perception, local support, reciprocal benefits, cultural identification, and support for tourism development.
H7(a–e). 
Contact with tourists positively moderates the relationship between benefits perception, costs perception, local support, reciprocal benefits, cultural identification, and tourism initiatives.

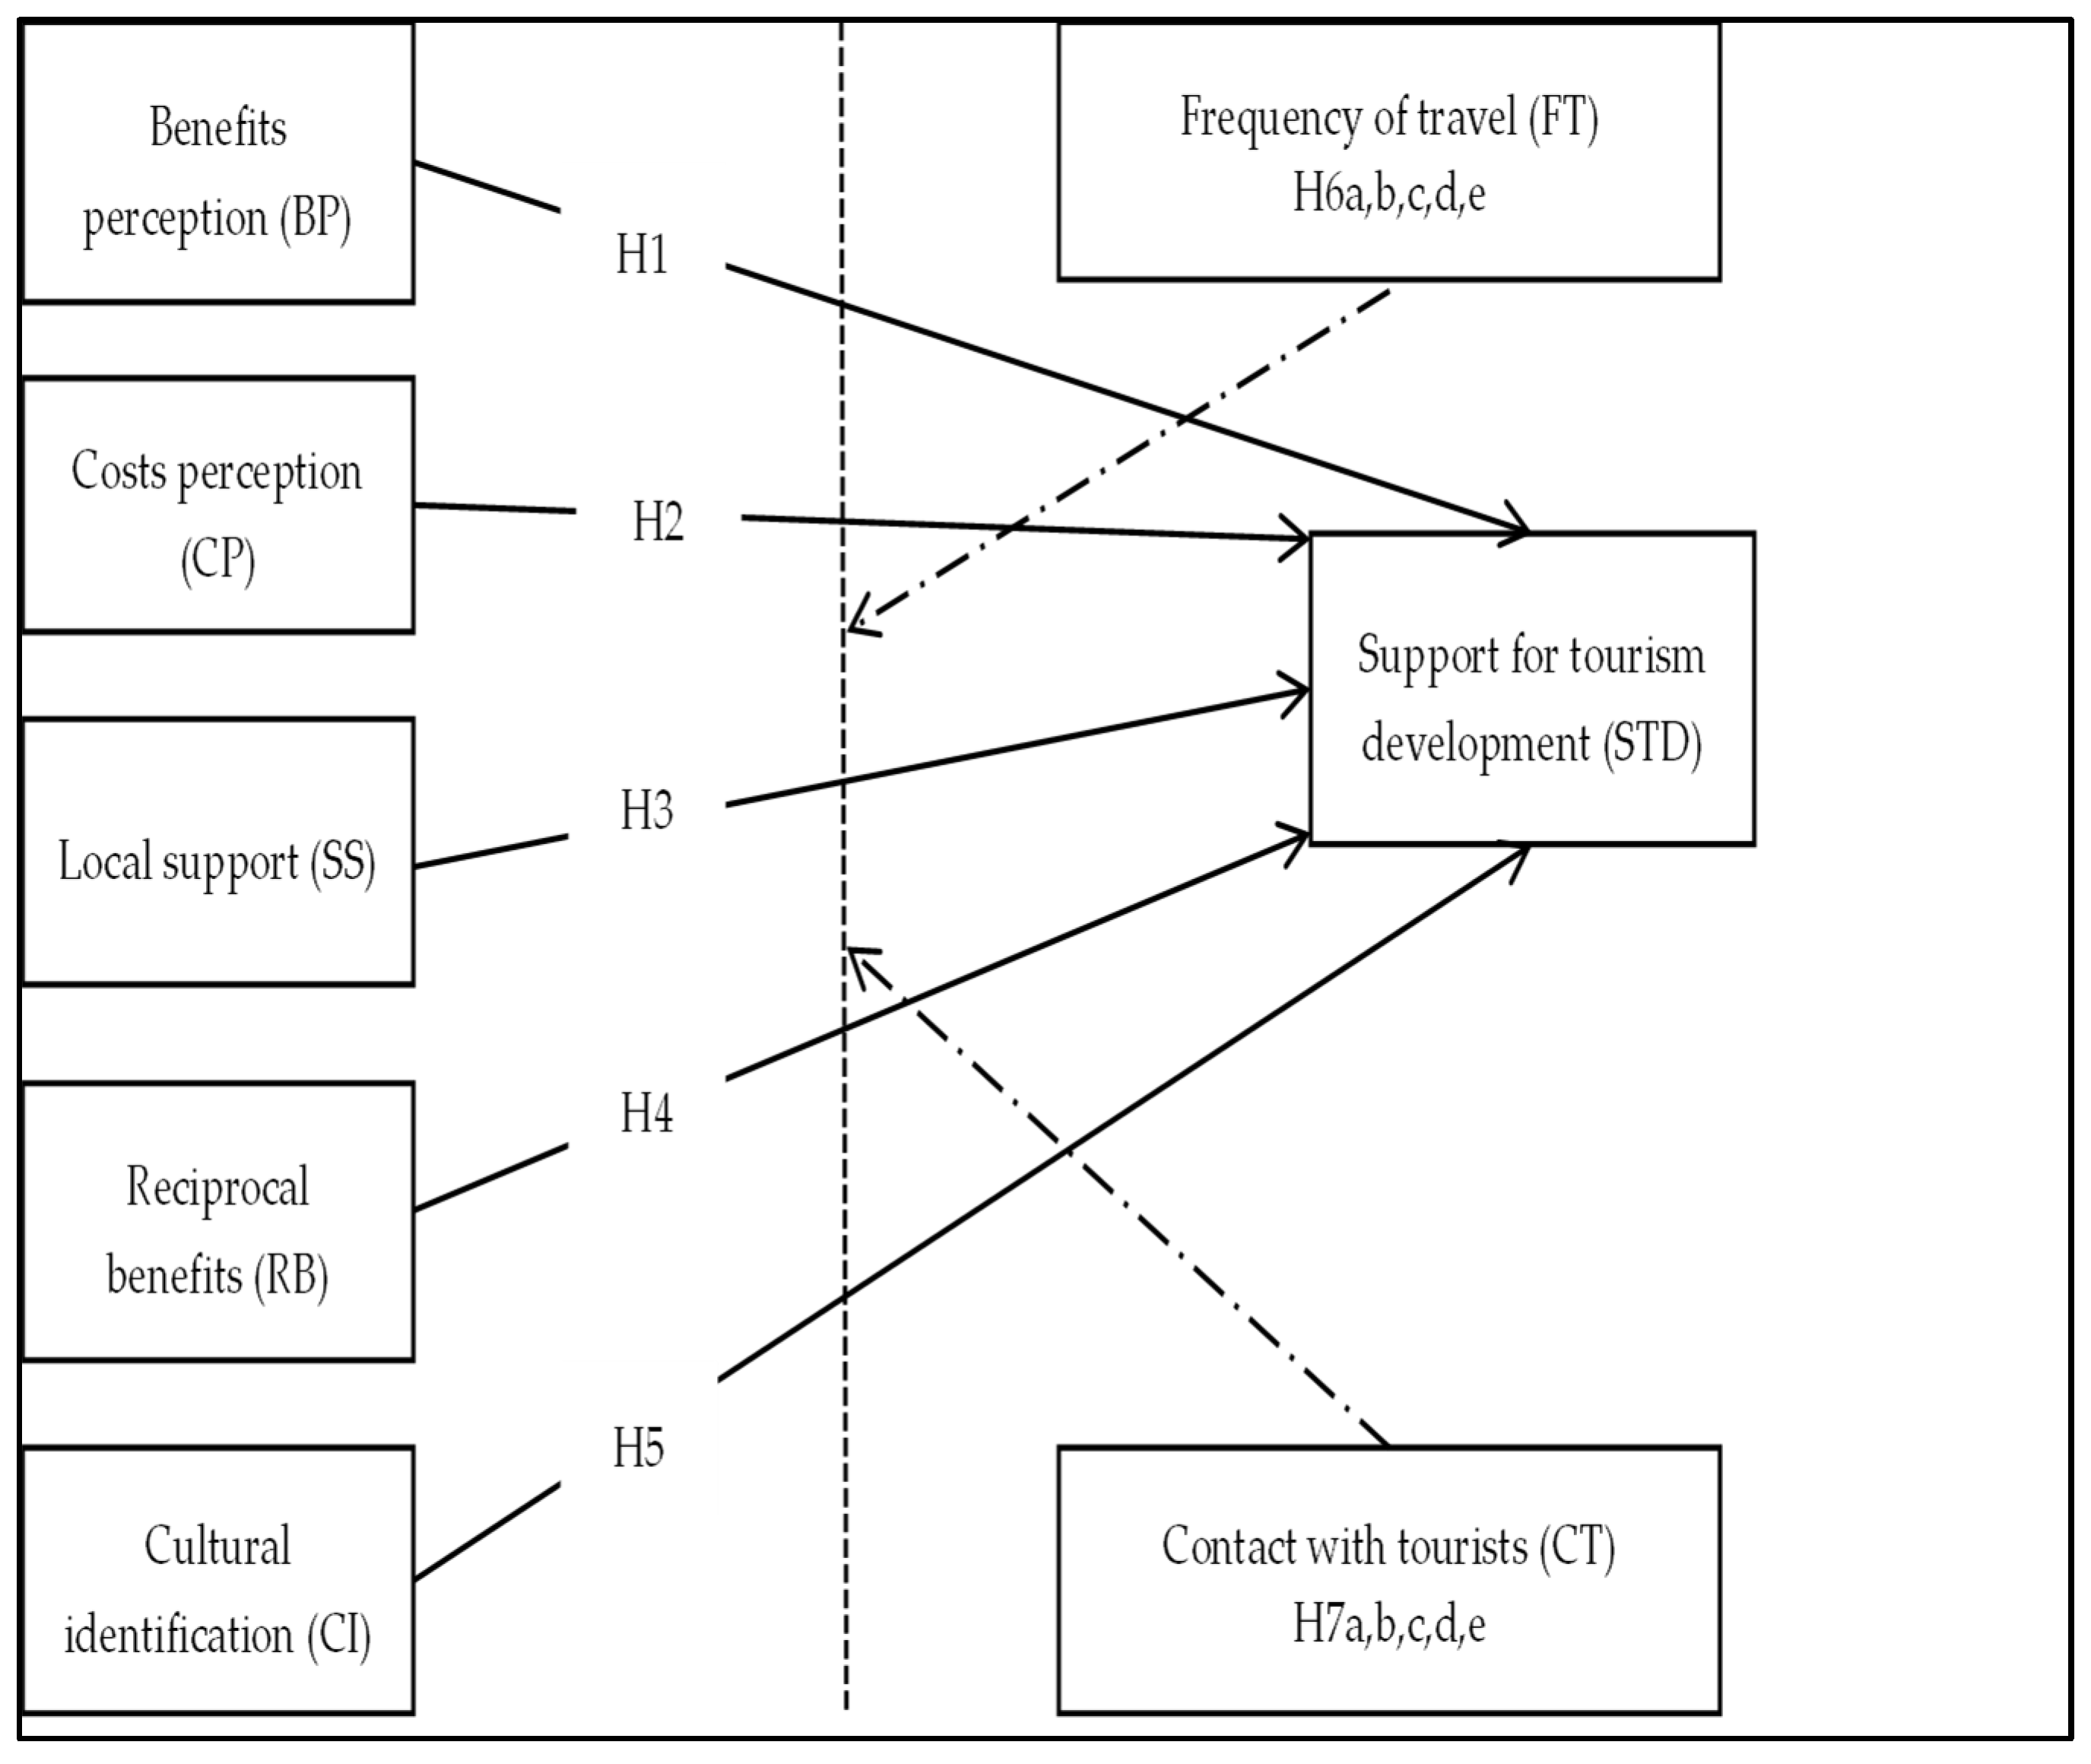
2.6. Development of Theoretical Model

Homans [64] and Blau [65] defined the SET and emphasized that social interactions operate on the principle of exchanging benefits and costs. According to this theory, individuals and communities decide whether to support or oppose tourism development based on their assessment of perceived benefits and costs [64]. If benefits are perceived as greater than costs, support for tourism increases, whereas negative impacts reduce support. Ap [66] was among the first researchers to apply SET to tourism, analyzing the locals’ attitudes in two tourist destinations in Australia, and demonstrated that positive perceptions are primarily related to financial interest and economic benefits, such as increased incomes, job creation, and improved infrastructure. In contrast, negative attitudes are the result of perceived social and environmental costs. Through subsequent research, SET has found wide application in analyzing various aspects of tourism. For example, Allaberganov and Catterall [67] used it to examine community responses to cultural tourism in Uzbekistan, demonstrating that support for tourism increases when communities feel that benefits, such as cultural identity preservation and economic gains, outweigh costs. Similarly, Han et al. [68] applied this theory in researching sustainable tourism in natural destinations, showing that positive perceptions of ecological benefits are a significant factor for community support. Kumar et al. [56] investigated the SET in the context of rural tourism progress. They found that economic benefits and social support are key factors influencing support for tourism development, but negative perceptions of costs often overshadow positive effects. Solakis et al. [57] investigated the role of artificial intelligence in value co-creation in tourism through the application of SET. Their research shows that technology can enhance perceptions of benefits through the promotion and preservation of cultural heritage but also emphasizes that perceived benefits can be undermined by the commodification of cultural resources. This approach is particularly relevant to the present analysis, which includes aspects of cultural identification. Additionally, Meira and Hancer [69] applied SET to analyze the link between hospitality employees and organizations, and Hassan et al. [70] used SET to analyze ecotourism in Saudi Arabia, emphasizing the role of economic benefits in renewing investment strategies. On the other hand, Brandmiller et al. [71] focused on destinations in the stagnation phase of the tourism life cycle, indicating that negative perceptions of costs can significantly reduce support for tourism. However, researchers often neglect the interactions between different aspects of benefits and costs, which may result in one-sided conclusions.
While previous authors have successfully used SET to analyze residents’ opinions about tourism, the majority of this research has primarily emphasized economic benefits [56,64,65,66,67,68]. Such an approach overlooks the importance of cultural identification, local support, and negative perceptions of costs, which are key factors for understanding locals’ perceptions. Together with this, contemporary research has shown that contact with tourists and travel frequency can significantly influence perceptions of benefits and costs, further complicating the analysis of community attitudes [57,69].
This research is justified because it offers a comprehensive approach that considers various dimensions of benefits and costs, as well as moderating factors such as travel frequency and contact with tourists. This holistic perspective sheds more light on a more profound comprehension of the relationship between economic, cultural, social, and environmental aspects, which previous studies have not adequately addressed [69]. By integrating these elements into a unified model, this research contributes to the advancement of SET in the context of tourism and lays the groundwork for developing sustainable tourism strategies. The conceptual model is focused exclusively on economic sustainability, assessing local support in relation to perceived economic costs and benefits (Figure 1).

3. Materials and Methods

The selection of Serbia, Kazakhstan, and Hungary for analyzing the arrival of tourism and the development of tourism is based on several key criteria. These countries represent diverse geographical, cultural, and economic contexts, enabling a detailed comparative analysis. Serbia, as a Western Balkan country on its path toward European Union membership, is characterized by specific transitional processes and efforts to enhance its tourism offer through cultural and rural tourism. Hungary, as an EU member state with a well-developed tourism infrastructure, presents important perspectives on the progress of tourism in Central Europe, with a special emphasis on selective types of tourism based on spas, MICE, and cultural offerings. Kazakhstan, as a Central Asian country with unique natural resources and cultural heritage, serves as an example of a destination undergoing intensive tourism development, particularly in the segments of nature-based, adventure, and cultural tourism. Additionally, Kazakhstan is actively working to strengthen its international recognition and increase tourism traffic, making it relevant for analysis. These countries also offer the opportunity to compare tourism policies and strategies between European Union member states and non-member countries. The analysis can highlight similarities and differences in tourism policies, destination promotion, tourism investments, and rural development, as well as the various challenges they face. The selection of these countries allows for a comparison between different economic systems, with Serbia and Hungary representing European countries with developed or transitional economies, while Kazakhstan represents a growing economy in Central Asia. Such an analysis can help identify specific factors influencing tourism development across different economic contexts.

3.1. Procedure and Participants

The study focuses on three selected countries encompassing a total of 1387 respondents. Data collection was carried out from December 2024 to March 2025 using Computer-Assisted Personal Interviewing (CAPI) [72]. This technique enabled standardized data collection through structured questionnaires administered by interviewers in direct contact with respondents. The application of the CAPI method allowed for immediate clarification of questions and additional explanations in cases of ambiguities, thereby improving the accuracy and reliability of the responses. The study was conducted with professional support from academic experts and students from hospitality and tourism programs, who participated in the data collection process as trained interviewers. This collaboration with students also enabled more efficient questionnaire distribution across different geographic regions, providing a broader insight into respondents’ perceptions across all three investigated contexts. The questionnaire included questions tailored to assess respondents’ subjective perceptions of the impact of tourism on various constructs, from financial, community, and heritage aspects. The research relies on respondents’ perceptions rather than objective measurement or proof of the actual impact of tourism. The collected data reflect the opinions, attitudes, and experiences of the local population, meaning that the results represent their subjective assessments rather than empirically verified effects. This research offers valuable insights into respondents’ perceptions of the positive and negative aspects of tourism, but does not provide a direct measurement of actual effects or their quantitative consequences.
In Serbia, the study included 472 respondents from various cities and rural areas known for tourism activities. The highest percentage of respondents was from Belgrade (44.9%), followed by Novi Sad (26.8%) and Niš (17.2%), while the remaining responses were collected from smaller towns and rural areas in western and southern Serbia (11.1%). This distribution was designed to capture the perceptions of both urban and rural populations, ensuring a comprehensive understanding of the national context. In Kazakhstan, a total of 465 respondents were surveyed, primarily from urban centers such as Almaty (43.2%), Astana (29.5%), and Shymkent (14.9%), while the remaining participants (12.4%) came from smaller cities and rural communities. Given Kazakhstan’s geographical vastness and economic diversity, special attention was paid to including both urban and rural regions where tourism has the potential to significantly enhance local progress. Along with this, the study also involved 450 respondents in Hungary, mainly from Budapest (50.5%), Debrecen (24.1%), and Szeged (16.9%), with the remainder (8.5%) coming from various rural locations. The developed tourism infrastructure and recognition of urban tourism in Hungary required greater attention to urban areas, although rural areas were also included to capture the perspectives of communities benefiting from ecotourism and cultural tourism. The sampling process in each country followed a purposive and stratified strategy. In Serbia, regions were selected to represent a mix of urban and rural tourism-active areas. Respondents were approached in public places such as parks, city centers, and near cultural sites. In Kazakhstan, major urban areas and surrounding regions were selected based on tourism activity and accessibility. In Hungary, data collection focused primarily on cities with high tourism flows, supplemented by rural areas with recognized ecotourism or cultural tourism relevance. The aim was to ensure demographic diversity and contextual relevance in each national sample.
To ensure the representativeness of the sample, a power analysis was conducted using G*Power 3.1.9.7 software [73]. An a priori analysis was performed to establish the needed sample size using a linear multiple regression model with fixed effects (R2 deviation from zero) to assess predictors. The analysis parameters included a medium effect size (f2 = 0.15), significance level (α = 0.05), and desired statistical power (1 − β = 0.95) [73], with seven predictors included.
Based on the G*Power analysis outcomes, the recommended minimum sample size to achieve the desired statistical power is 185 respondents per country, or a total of 555 for all three countries. Considering that the study involved a total of 1387 respondents (significantly more than the required minimum), it can be concluded that the sample meets the criteria for representativeness. Most respondents are female, with higher education being the dominant category across all three countries. While most respondents are employed, unemployed individuals and students make up significant percentages in Serbia and Kazakhstan, while Hungary shows a smaller share of unemployed participants. Differences in income levels are also present, with Hungary having the highest percentage of respondents with high incomes, while Serbia records the most low-income respondents. Urbanization is most pronounced in Hungary, while Serbia has the highest proportion of respondents from rural areas. Travel frequency varies, with Hungary having the highest percentage of respondents who travel more than five times a year. Contact with tourists is also significantly higher in Hungary than in Serbia and Kazakhstan (Table 1), which may indicate greater tourist traffic or more developed tourism activities in that country.
Special attention was given to ethical principles and data integrity during the research process to ensure respondents’ trust. Respondents were informed about the anonymity of their responses, emphasizing that their data would not be linked to their identity. Verbal informed consent was obtained from the participants. The questionnaires were designed in such a way that no personal data were collected, ensuring complete privacy for the participants. To reduce the influence of socially desirable responses, respondents were encouraged to freely express their opinions without fear of negative consequences. It was emphasized that all responses are valuable for understanding their opinions on the relationships of their community to tourism. The study applies the highest ethical standards, respecting relevant legal regulations and privacy protection guidelines.

3.2. Methodological Instrument

The survey utilized in this research draws on SET, as proposed by Homans [64] and Blau [65], which aims to evaluate the perceived advantages and disadvantages of tourism, along with the degree of support from the community. Applied constructs included benefits perception, costs perception, local support, reciprocal benefits, cultural identification, and support for tourism. The questions were developed through a literature review and adaptation of existing scales. The constructs and questions are based on the theoretical framework (Table 2). Standardization of the instrument across the three countries was achieved by applying a unified structure and consistent terminology, adjusted for cultural relevance. Constructs were operationalized identically in all contexts, ensuring comparability. The Likert scale format and item phrasing were harmonized, while cultural idioms and examples were adapted to maintain clarity for each national context.
To ensure cross-cultural validity and consistency, the original questionnaire was translated and back-translated for each language (Serbian, Kazakh/Russian, and Hungarian) using the committee approach. Native speakers and domain experts reviewed each version to guarantee semantic equivalence. Cultural nuances were also considered during the adaptation, particularly for items related to local support and cultural identification. Reliability tests showed high internal consistency across all countries (Cronbach’s α > 0.85), supporting the instrument’s robustness in diverse cultural settings.
A pilot study was primarily initiated, aiming to test the research instrument and assess its validity parameters. Respondents were from various sociodemographic groups to evaluate the adequacy of the questionnaire in relation to variations in age, education, and employment. There were 50 involved participants, 20 of whom were from Serbia, 15 from Kazakhstan, and 15 from Hungary. All participants were over 18 years old, and the sample covered diverse demographic groups, including employed individuals, unemployed individuals, and students. Following the pilot study, consultations with tourism, economics, sociology, and cultural studies experts were essential for further refining the questionnaire. Experts provided feedback on question formulation, relevance of thematic areas, and alignment with theoretical frameworks. Based on their recommendations, the questionnaire was modified to enhance the precision and clarity of the items. This process ensured greater validity and relevance of the data to be collected during the main study. A five-point Likert scale (1—strongly disagree, 5—strongly agree) was used to assess respondents’ perceptions regarding various constructs.

3.3. Data Processing and Analysis

The collected quantitative data were used to predict tourism growth in Serbia, Kazakhstan, and Hungary for the period up to 2030. The application of the Linear Regression Model (LRM) enabled the identification of linear trends in time series for each of the analyzed countries [86]. Data were analyzed using SPSS software version 26.0 for descriptive statistics and regression analyses. The validity of the model was confirmed by high coefficients of determination (R2) for Serbia (0.93), Kazakhstan (0.91), and Hungary (0.94), as well as low RMSE values for all countries (Serbia: 0.05, Kazakhstan: 0.06, Hungary: 0.04). The p-values for all model parameters were statistically significant (p < 0.05), further confirming the model’s adequacy [87]. The optimality of the model was additionally confirmed through AIC and BIC criterion estimates, while the Shapiro–Wilk, Breusch–Pagan, and Durbin–Watson tests indicated the absence of autocorrelation and heteroscedasticity, confirming the validity and reliability of the applied models [88]. The analysis of the normality of the data distribution was conducted using several statistical measures, including skewness, kurtosis, and the Kolmogorov–Smirnov test [89]. The results for all three countries indicate acceptable normality of distribution, allowing further application of predictive and factor analyses. Skewness values for Serbia ranged from −0.323 to 0.487, for Kazakhstan from −0.289 to 0.503, and for Hungary from −0.376 to 0.465, which is within the recommended range between −1 and 1. Similarly, kurtosis values were also within acceptable limits, with Serbia ranging from −0.710 to 0.891, Kazakhstan from −0.654 to 0.913, and Hungary from −0.712 to 0.878. These values indicate that the data do not have pronounced positive or negative skewness, nor extreme points indicating significant deviation from normal distribution. The Kolmogorov–Smirnov test further confirmed these findings, with p-values for all constructs above 0.05, indicating an acceptable distribution for all analyzed samples [90].
In the process of model analysis, both EFA and CFA have been employed to ensure the reliability of the proposed model for all three analyzed countries: Serbia, Kazakhstan, and Hungary. EFA was conducted using smaller portions of the sample from each country (30% of the total sample) to identify key factors and assess the model structure, while CFA was conducted on the remaining portion of the sample (70%) for each country (Table 3). CFA aims to confirm the validity of the identified constructs and evaluate internal consistency, convergent validity, and discriminant validity [91]. Within the EFA, sample validity was assessed by applying Bartlett’s test of sphericity and the KMO test. The KMO test values for all three countries were above the recommended threshold of 0.85, indicating high sample adequacy for factor analysis. The specific values were 0.923 for Serbia, 0.918 for Kazakhstan, and 0.927 for Hungary. Bartlett’s test of sphericity was statistically significant for all three countries (p < 0.001), demonstrating that the variables were adequately correlated for conducting factor analysis [92].
The fit indices evaluated within the CFA included SRMR, RMSEA, TLI, and CFI analyses [93]. All the gained values are in accordance with the recommended thresholds, indicating an excellent model fit for each individual country. To ensure construct reliability, AVE and CR values were projected for each construct [92]. Additionally, to eliminate the probability of CMB, procedural and statistical controls were applied [94]. To assess convergent validity, the FLC and HTMT were used [95]. The FLC showed satisfactory values for all constructs in Serbia (AVE ≥ 0.743, CR ≥ 0.912), Kazakhstan (AVE ≥ 0.741, CR ≥ 0.910), and Hungary (AVE ≥ 0.748, CR ≥ 0.916). The HTMT ratio for all constructs was below the recommended threshold of 0.85 in all three countries (SRB: HTMT ≤ 0.821, KAZ: HTMT ≤ 0.832, HUN: HTMT ≤ 0.844), confirming adequate discriminant validity.
The estimated models were also tested for multicollinearity using the VIF test [96], ensuring values below the recommended threshold of 5, indicating no multicollinearity within the constructs (SRB: VIF ≤ 3.012, KAZ: VIF ≤ 3.008, HUN: VIF ≤ 3.014). Fit indices demonstrated satisfactory values for all three countries, including RMSEA, CFI, SRMR, and NFI [97]. The values for Serbia included RMSEA (0.046), CFI (0.961), SRMR (0.034), and NFI (0.932). For Kazakhstan, the obtained values were RMSEA (0.048), CFI (0.957), SRMR (0.036), and NFI (0.930). The values for Hungary were RMSEA (0.045), CFI (0.964), SRMR (0.033), and NFI (0.936). All these values are within acceptable limits, indicating a good model fit for each analyzed country. The coefficients of determination (R2) demonstrated adequate explanatory power of the dependent variable in all models. The values for Serbia (R2 = 0.672), Kazakhstan (R2 = 0.650), and Hungary (R2 = 0.676) indicate a satisfactory level of model explanation [98]. Additionally, the Random Forest algorithm was employed, and regression was used due to its ability to reduce variance and increase prediction accuracy [99]. This algorithm consists of multiple independent decision trees (n = 100), which together make the final decision through majority voting, thus achieving greater resilience against model overfitting. The data were previously normalized using the StandardScaler method, which allowed for scaling all variables to a standardized scale [100,101]. The model evaluation was performed using the Scikit-Learn library in Python 3.11 (sklearn), which provides a straightforward implementation and validation of various machine learning algorithms. For visualization of performance, the Matplotlib 3.7.x library was used, while the results of ROC analysis were created using the roc_curve and auc functions from the sklearn.metrics module. The significance of different construct factors in prediction was determined based on the Feature Importance functionality within the Random Forest model, allowing for the identification of the most influential variables in the prediction process. The model was further validated using a confusion matrix to determine prediction accuracy for all classes. For a more detailed analysis and prediction of factors influencing support for tourism development, modern machine learning algorithms were applied, including PCA, XGBoost, and K-means clustering. These algorithms enable the identification of key variables and the grouping of similar responses, and allow for a more detailed understanding of the interdependencies between constructs [102].

4. Results

4.1. Trend Analysis and Tourism Growth Prediction

The research employed quantitative data, which were gathered from official statistical bases for the three investigated countries. Data for Serbia were collected from the website of the Statistical Office of the Republic of Serbia, which provides detailed information on tourist arrivals and overnight stays in the country for the period from 2015 to 2023. Data for Hungary were sourced from the publications of the Hungarian Central Statistical Office (KSH), which publishes annual tourism reports, including tourist arrivals and overnight stays across different regions of the country. Data for Kazakhstan were collected from multiple sources, including the Agency for Statistics of the Republic of Kazakhstan and reports available through international databases such as UN Tourism and the World Bank. To ensure consistency and comparability of data across countries, only official statistical data published in relevant annual reports and international databases were used. The collected data include the total number of tourist arrivals for each country, expressed in millions, for the period from 2015 to 2023 (Table 4).
In this study, future tourism growth for the period from 2025 to 2030 was predicted using the linear regression model (LRM). Data were analyzed through regression analysis to assess various validity parameters, model fit, and the fulfillment of conditions for adequate prediction. The findings demonstrated a high predictive power of the model across all three countries, as reflected in high coefficients of determination. The model for Hungary shows the highest degree of variance explanation, while the models for Serbia and Kazakhstan are slightly lower but still satisfactory. Both criteria values (BIC and AIC) showed Hungary’s case as the best balance between accuracy and simplicity, while slightly higher values for Serbia and Kazakhstan indicate a somewhat less optimal model. Low RMSE values in all three countries confirm the model’s accuracy, with the smallest deviations in predictions observed for Hungary. The fulfillment of conditions for applying regression analysis was confirmed through several tests. Linearity of data was confirmed by positive coefficients in all models, with trends shown to be linear for the period from 2015 to 2023. Normality of residuals was confirmed using the Shapiro–Wilk test, with p-values of 0.98 for Serbia, 0.97 for Kazakhstan, and 0.99 for Hungary, indicating a normal distribution of residuals. Homoscedasticity was confirmed through variance analysis (Breusch–Pagan test), with p-values of 0.87 for Serbia, 0.85 for Kazakhstan, and 0.91 for Hungary, indicating the absence of heteroscedasticity (Table 5).
The data on tourist arrivals in Serbia, Kazakhstan, and Hungary indicate a steady increase from 2015 to 2019, succeeded by a significant decline in 2020 (impacted by the COVID-19 pandemic). After this period, a gradual recovery is observed, with an increasing number of arrivals in all three countries. Projections for the period from 2025 to 2030 indicate steady growth across all three countries, with Hungary expected to record the highest number of arrivals due to its well-developed tourism infrastructure and popularity among international tourists. Serbia and Kazakhstan are also experiencing a positive trend, but with a somewhat slower pace compared to Hungary (Table 6).
Figure 2 presents the projected number of tourists for Serbia, Kazakhstan, and Hungary during the period from 2015 to 2030. Hungary shows continuous growth, particularly after recovering from the decline caused by the 2020 pandemic. Kazakhstan demonstrates stable growth with minor fluctuations, while Serbia records the lowest number of tourists throughout the entire period, with slow but consistent growth.
What-if analysis provides deeper insights into potential scenarios of growth or decline in tourist arrivals for Serbia, Kazakhstan, and Hungary during the period from 2025 to 2030. The evaluation allows for assessing how changes in tourist numbers affect overall growth, with scenarios involving a 10% increase and decrease in arrivals being examined. The results indicate that a positive scenario, involving a 10% increase in arrivals, would lead to significant growth in all countries. The expected growth for Serbia is 12.4%; for Kazakhstan, it is 11.7%, while Hungary shows the highest growth of 13.3%. This difference can be partly explained by Hungary’s larger current tourist base and better infrastructure, allowing for more efficient adaptation to increased tourism traffic. Conversely, a negative scenario with a 10% decrease in arrivals shows that Serbia would experience a decline of 9.8%, Kazakhstan 10.5%, while Hungary would record a decline of 8.9%. These results suggest that Serbia and Kazakhstan could be relatively more sensitive to potential negative changes in tourism traffic compared to Hungary. Hungary demonstrates slightly greater resilience, likely due to its larger number of visitors and more diversified tourism offerings, which can compensate for declines in certain market segments (Table 7).

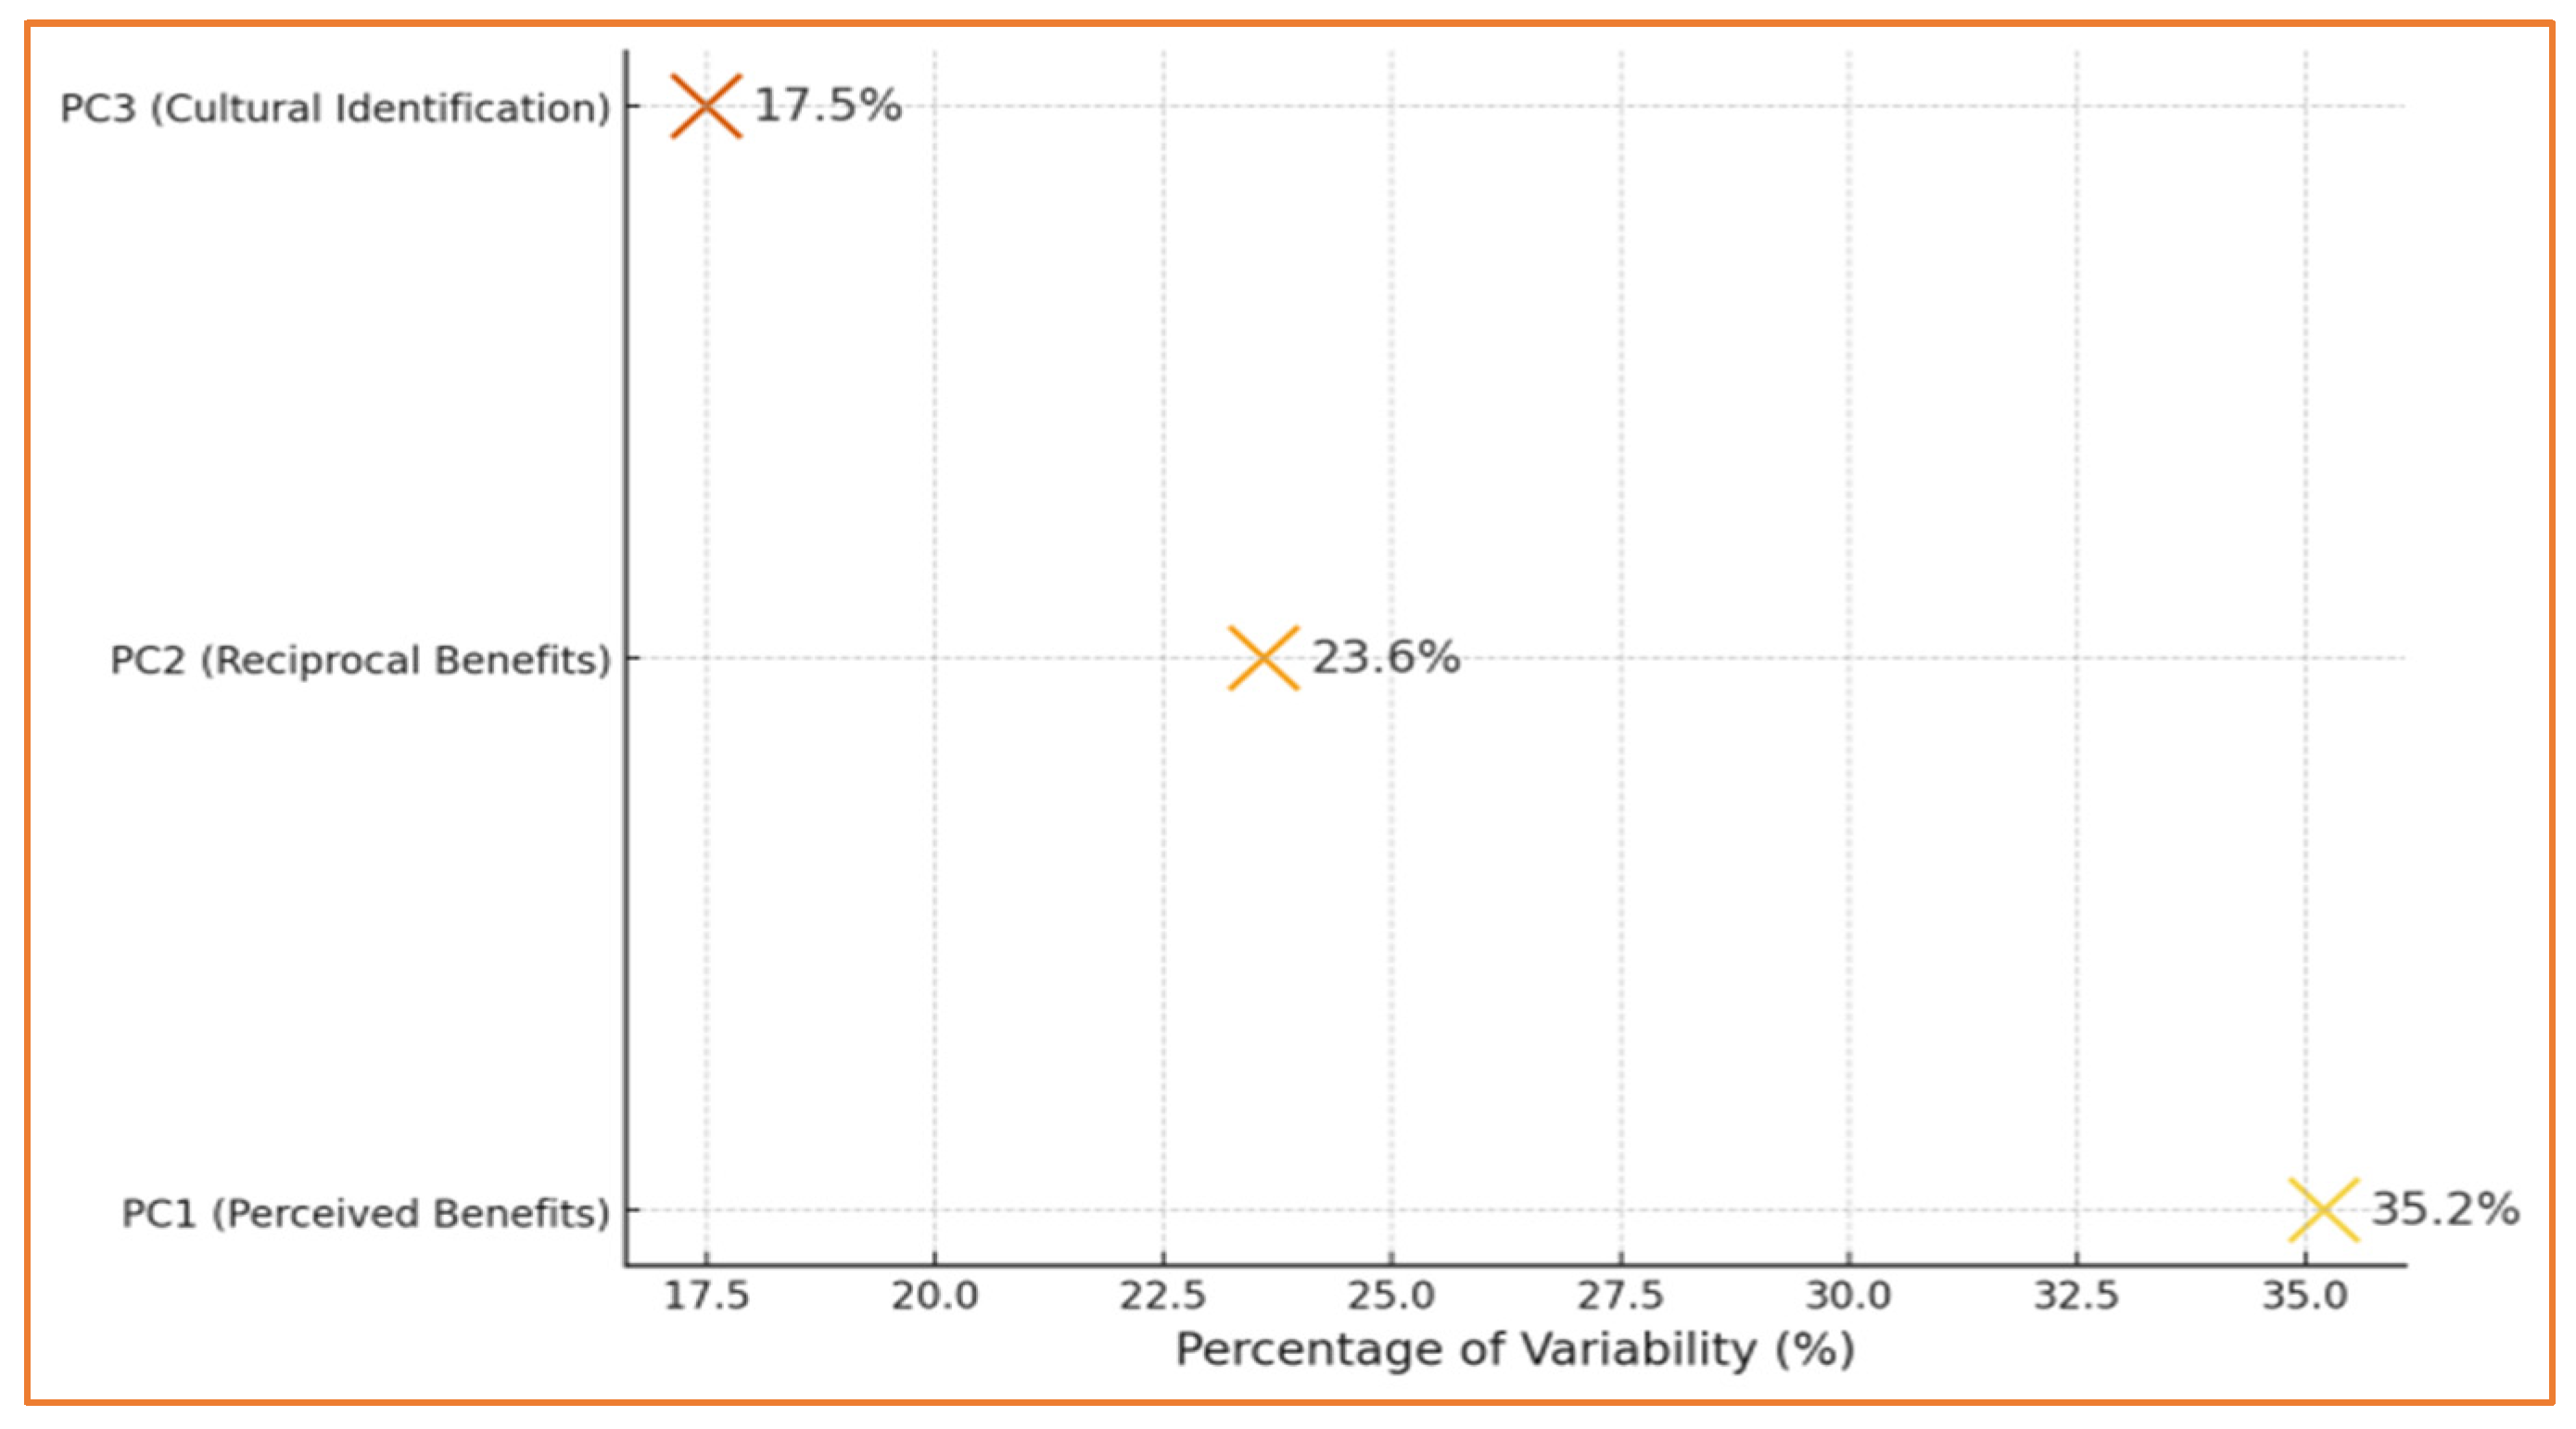
4.2. Descriptive and Factor Analysis

The results show that respondents from Hungary generally have the most positive perception of tourism benefits, with the highest average ratings regarding commercial development, social promotion, and infrastructure improvement. The measurement instrument’s reliability for all constructs is high across all countries (α > 0.80), confirming the internal consistency of the scales used. Constructs related to cultural identification also record high average values, with Hungary demonstrating the most positive attitudes, which can be attributed to its more developed tourism infrastructure and more successful promotion of cultural heritage. Serbia shows slightly lower average values in the observation of tourism’s advantages, while the perception of costs is relatively higher compared to other countries. These results indicate the presence of certain concerns regarding the undesirable effects of Serbia’s tourism growth, including price increases and privacy disruption (Table 8).
The results of construct validity assessment for Serbia, Kazakhstan, and Hungary indicate high internal consistency and adequacy of measurement instruments, observed in all constructs (α exceeds 0.85 in all countries, indicating a high level of reliability). Factors with the highest share in explained variance (eigenvalues) for Serbia, Kazakhstan, and Hungary suggest that the dominant constructs differ in their share of explained variance. The highest share of explained variance was recorded for the BP (benefits perception) constructs across all countries, highlighting the importance of these constructs in the local population’s perception of tourism. Cumulative explained variance values for Serbia, Kazakhstan, and Hungary also demonstrate consistency in the models, with high overall values exceeding 90% (Table 9).

4.3. Correlation Analysis

The highest levels of correlations were recorded between the constructs benefits perception (BP) and support for tourism development (STD) across all countries, indicating that a greater perception of benefits positively contributes to higher local community support for tourism development. Additionally, reciprocal benefits (RB) show a strong positive association with both STD and BP, emphasizing the relevance of supporting tourism from economic and cultural perspectives. A similar pattern is observed across all three countries, suggesting consistency in respondents’ perceptions and attitudes regardless of geographical and cultural context. Although the correlations between costs perception (CP) and other constructs are somewhat lower compared to other constructs, they remain significant, implying that residents evaluate the negative aspects of tourism in relation to potential benefits. The constructs cultural identification (CI) and local support (LS) demonstrate moderate positive correlations with all other constructs, indicating their role in shaping perceptions and attitudes toward tourism. The overall pattern of positive and significant correlations suggests that the analyzed constructs are interrelated and relevant for assessing tourism support across all countries (Table 10).

4.4. SEM and MGA Analysis Findings

The SEM findings demonstrated a high predictive power of the model across all three countries, with R2 values indicating that the model explains between 70.4% and 72.9% of the variance in tourism support in Serbia, Kazakhstan, and Hungary. The Q2 values confirm the adequacy of the model through positive values exceeding the threshold of 0.5 in all cases, suggesting good predictive relevance. The effects of the model are reflected through direct, indirect, and total effects. Direct effects show the greatest impact on tourism support, while indirect effects are somewhat lower but remain significant. Combined effects reveal a consistent pattern across all countries, with total effects being the highest in Hungary, which may indicate a greater willingness of the local population to support tourism in that country (Table 11).
BP showed a relevant impact on STD in Serbia (β = 0.371, t = 8.453, p < 0.001), Kazakhstan (β = 0.367, t = 8.342, p < 0.001), and Hungary (β = 0.372, t = 8.478, p < 0.001), confirming Hypothesis H1. The negative effect of perceived costs (CP) on STD is also significant in all analyzed countries, with a slightly stronger negative impact in Kazakhstan (β = −0.215, t = −3.521, p = 0.010) compared to Serbia (β = −0.203, t = −3.249, p = 0.012) and Hungary (β = −0.208, t = −3.410, p = 0.011), confirming Hypothesis H2. Local support (LS) positively affects STD across all three countries, with a slightly stronger impact in Hungary (β = 0.347, t = 6.856, p < 0.001) compared to Serbia (β = 0.338, t = 6.721, p < 0.001) and Kazakhstan (β = 0.341, t = 6.725, p < 0.001), confirming Hypothesis H3. Reciprocal benefits (RB) positively influence STD in all countries, with the most pronounced effect observed in Hungary (β = 0.284, t = 5.318, p = 0.005), supporting Hypothesis H4. Cultural identification (CI) shows a statistically significant positive impact on STD across all three countries, with the highest effect in Hungary (β = 0.305, t = 5.812, p = 0.002), confirming Hypothesis H5. Moderation effects are also found to be significant. Frequency of travel (Mod-FT) positively moderates the relationship between BP and STD in all three countries, while contact with tourists (Mod-CT) demonstrates a somewhat weaker but still significant moderation effect. The same applies to constructs CP, LS, RB, and CI. These findings confirm Hypotheses H6, H7, and H8 related to the moderation effects in the analyzed relationships (Table 12).
The comparative MGA analysis reveals significant distinctions in the three observed countries. Serbia and Hungary exhibit relatively similar patterns in constructs related to perceived benefits (BP) and reciprocal benefits (RB), while Kazakhstan shows slightly lower values in these categories. In the construct of cultural identification (CI), Hungary demonstrates a more pronounced positive effect compared to Serbia and Kazakhstan, which could result from stronger integration of local culture into tourism offerings or more developed cultural tourism promotion strategies. A similar trend is observed in reciprocal benefits (RB), where Hungary shows the highest positive impact on tourism support (STD), while differences between Serbia and Kazakhstan are less pronounced. Overall, the results suggest that Hungary is the most positively oriented toward tourism impacts, likely due to a more developed tourism sector and better-integrated mechanisms for promoting local culture. Serbia shows a positive impact on tourism support, but to a lesser extent than Hungary, while Kazakhstan records slightly weaker results in most constructive categories. The application of moderating variables such as frequency of travel (Mod-FT) and contact with tourists (Mod-CT) further highlights the differences between countries. These effects are particularly pronounced in Hungary, indicating that contact with tourists and travel frequency have a greater influence on tourism support there compared to Serbia and Kazakhstan. In contrast, Kazakhstan demonstrated the least pronounced moderation effects, suggesting the need to strengthen connections between residents and tourists through promotional activities or better integration of local culture into tourism offerings. These findings suggest that strategies for tourism enhancement should be tailored to the specificities of each country. Serbia and Kazakhstan could benefit from further improving promotional activities and better integrating local culture into tourism products, while Hungary could further enhance positive effects through greater diversification of tourism offerings (Table 13).

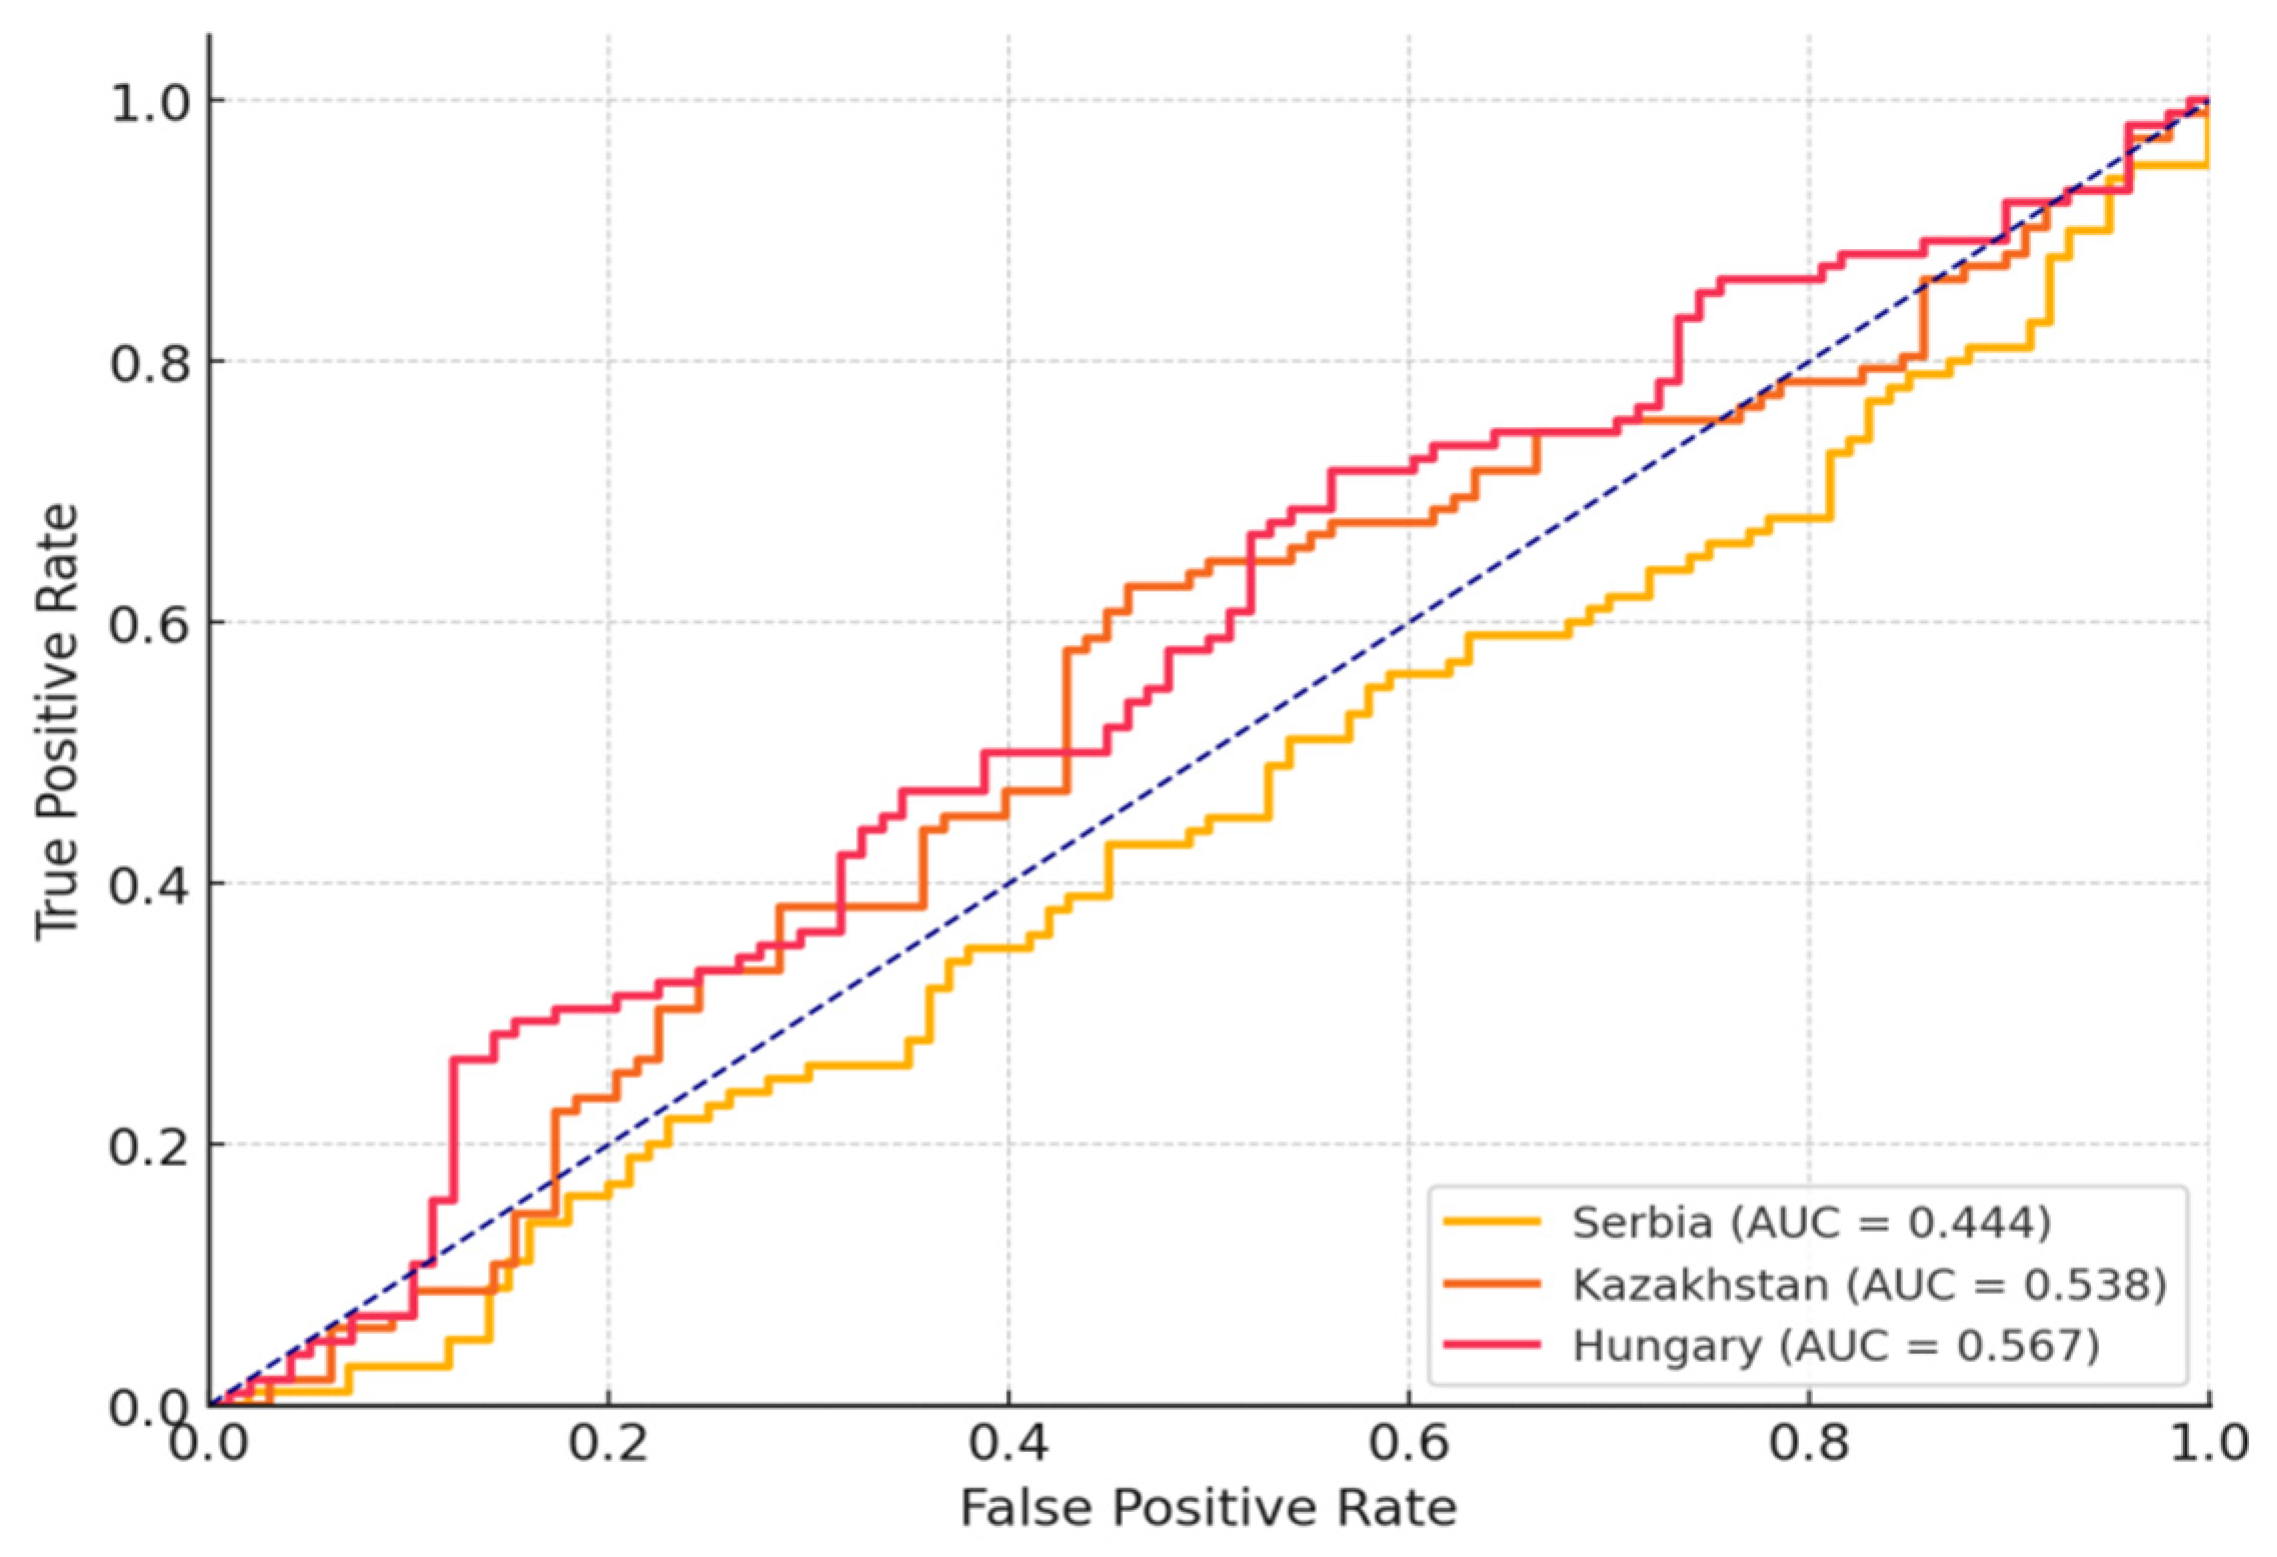
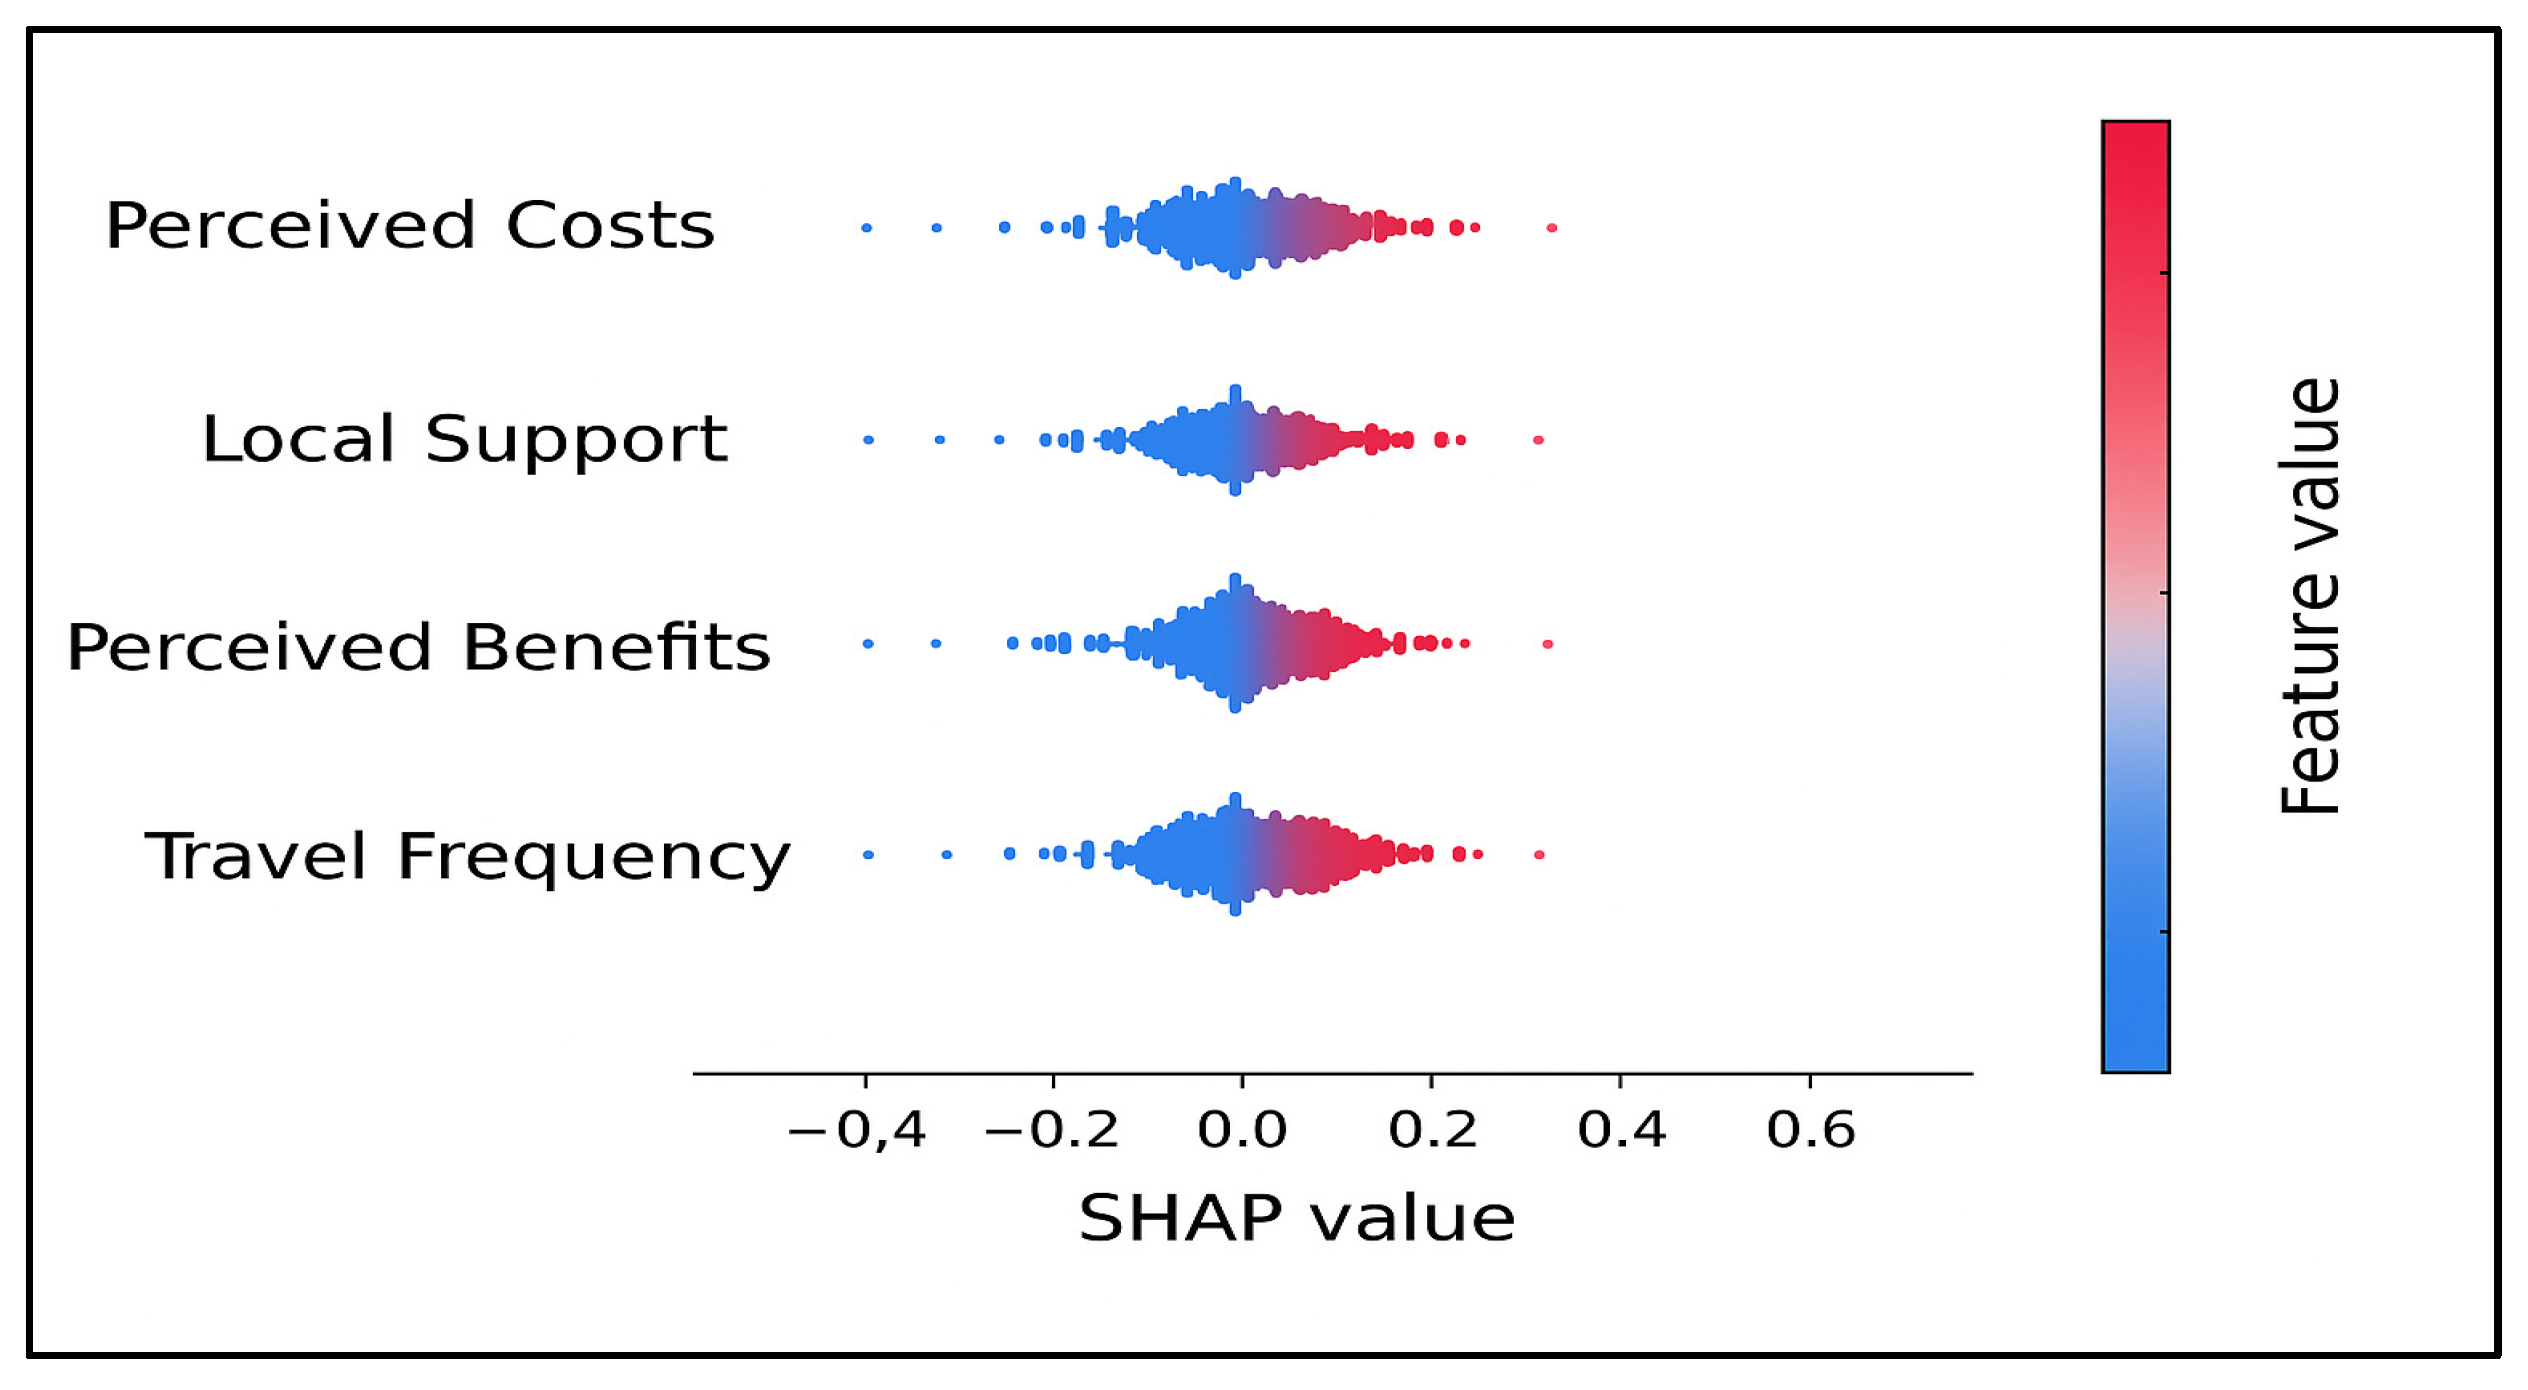
4.5. Prediction Model and Variable Importance Analysis

This model has proven particularly suitable for prediction and analysis when dealing with heterogeneous samples, such as respondents from different countries with varying perceptions and attitudes toward tourism. The Random Forest models for Serbia, Kazakhstan, and Hungary demonstrate a high level of predictive accuracy, with slight differences between countries (Table 14).
The variable importance analysis shows that different constructs contributed differently to predicting support for tourism in each country. In Serbia and Kazakhstan, cultural identification shows the highest importance (0.225 for Serbia, 0.223 for Kazakhstan), suggesting that the local population places the greatest emphasis on preserving and promoting cultural values through tourism. In Hungary, benefits perception has the highest importance (0.223), indicating a stronger economic focus in the approach to tourism. Other constructs, such as costs, social support, and reciprocal benefits, show moderate significance in prediction for all three countries, with values that are consistent and relatively balanced (Table 15).
The confusion matrix demonstrates the accuracy of the prediction model in identifying positive and negative attitudes toward tourism. The model accurately identified 782 cases of positive tourism perception (True Positive) and 764 cases of negative perception (True Negative). However, there were also prediction errors, with 118 positive cases categorized as negative (False Negative) and 124 negative cases categorized as positive (False Positive) (Table 16).
The ROC curve illustrates the performance of the prediction model for Serbia, Kazakhstan, and Hungary based on AUC (area under the curve) values (Figure 3). Hungary shows the highest AUC value (0.567). Kazakhstan records a medium AUC value (0.538), while Serbia shows the lowest AUC value (0.444), indicating a lower precision of the model in predicting attitudes.
The model demonstrates differences in variable importance between countries, with cultural identification (CI) and benefits perception (BP) identified as the most important predictors across all countries, albeit with variations in their importance share. Further research can enhance predictive models and enable more precise assessment of tourism perceptions based on respondents’ subjective attitudes. Additional implementation of XGBoost, K-means clustering, PCA, and SHAP analysis was conducted to improve prediction accuracy and better interpret the results. The aim of these additional analyses is to provide deeper insights into the interdependencies among key constructs and determine the significance of individual factors for tourism support through advanced machine learning methods and data segmentation.
The results in Figure 4 indicate that perceived benefits, reciprocal benefits, and cultural identification contribute most to tourism support, while social support has a somewhat lower but still positive impact. The negative SHAP value for perceived costs suggests that costs reduce tourism support, but their influence is relatively weaker compared to positive factors.
On the other hand, Figure 5 shows that perceived benefits (PC1) contributes the most to the overall data variability at 35.2%. Reciprocal benefits (PC2), accounting for 23.6%, also significantly contributes to explaining variability, although to a lesser extent than PC1. Cultural identification (PC3), with 17.5%, has the smallest impact, indicating a relatively minor importance of cultural aspects within this model. This distribution of variability suggests that economic and reciprocal benefits are the primary factors shaping respondents’ perceptions, while cultural identification plays a secondary role. The orange color intensity of the symbols in Figure 5 reflects the percentage of explained variability. Lighter shades represent components with a higher contribution, while darker shades indicate a lower proportion of explained variance.
K-means clustering results indicate the presence of three clearly defined clusters of respondents with different perceptions of tourism. The largest cluster consists of respondents with balanced attitudes toward benefits and costs, while a slightly smaller group of respondents expressed highly positive perceptions of benefits. The smallest cluster is characterized by negative perceptions due to high perceived costs (Table 17).

5. Discussion

The research outcomes demonstrated the importance of benefits perception, cultural identification, and reciprocal benefits as key factors positively influencing sustainable tourism encouragement in Serbia, Kazakhstan, and Hungary. Findings clearly reflect the influence of the economic dimension of sustainability, particularly how perceived financial gains and losses affect residents’ attitudes. This is consistent with Social Exchange Theory, according to which positive perceptions of benefits and reciprocal benefits can be interpreted as a basis for forming positive attitudes toward tourism [64,65,103,104,105]. Ap [66] previously established that positive perceptions of economic benefits often outweigh negative impacts, which is further confirmed by this study, which identified benefits as the most relevant factor for sustaining tourism. The findings related to the positive role of cultural identification in forming support for tourism are also consistent with previous research. Allaberganov and Catterall [67] emphasized the importance of cultural identity in tourism development, particularly in destinations striving to preserve authenticity and cultural values. Cross-country differences observed in this study provide additional insights into how contextual factors shape residents’ attitudes toward tourism. In Hungary, respondents showed the highest levels of perceived economic benefits and overall tourism support, likely due to the country’s well-developed tourism infrastructure, EU integration, and long-standing institutional support for sustainable tourism initiatives. In contrast, respondents in Serbia and Kazakhstan demonstrated lower scores in cultural identification and reciprocal benefits, which may reflect gaps in strategic communication, community inclusion, and underdeveloped cultural tourism offers. Serbia’s post-transition status and limited funding for tourism development might contribute to a more cautious perception of tourism’s long-term benefits. Kazakhstan’s emerging tourism sector, still in development, may lack sufficient visibility and perceived local impact, influencing resident support. These differences underscore the importance of national policy frameworks, investment in infrastructure, and culturally embedded tourism narratives in shaping support across different contexts. Our findings suggest that cultural identification emerged as one of the most important predictors of tourism support, especially in the context of cultural attractions and heritage that these countries are attempting to promote and preserve. The observed negative relationship between cost perception and tourism support is consistent with previous research, indicating that social and environmental costs often pose obstacles to the acceptance of tourism activities. Han et al. [68] demonstrated that negative perceptions due to environmental degradation and conflicts over resource use can diminish local support for tourism, which is further confirmed by this study. Kumar et al. [56] also noted that negative effects of tourism can overshadow positive impacts, particularly in rural areas where economic benefits are less pronounced. Results across different analytical approaches consistently identified perceived benefits and cultural identification as dominant predictors of tourism support. SEM path coefficients indicated statistically significant effects for these variables, while Random Forest and XGBoost ranked them highest in predictive importance. SHAP analysis confirmed these findings by visualizing their strong positive contribution to model output across individual observations. Additional insights were derived from the K-means clustering and principal component analysis (PCA), which contributed to a deeper understanding of the relationships among constructs and the grouping of respondent profiles. K-means analysis identified clusters characterized by high levels of benefits perception, cultural identification, and local support, suggesting that these groups are more likely to support tourism development. These clusters were particularly evident in Hungary, where tourism infrastructure and promotional strategies are more established. PCA further supported these findings by extracting components that strongly loaded on perceived benefits and cultural identification, indicating their central role in shaping attitudes toward tourism. These findings align with the research questions, particularly the goal of identifying dominant predictors of tourism support and understanding how perceptions differ across contexts. The integration of K-means and PCA enhanced the multidimensional interpretation of results, providing clearer segmentation of respondent profiles and validation of the core model dimensions.
However, this study further established that negative cost perceptions can be mitigated by a high level of cultural identification and reciprocal benefits, suggesting that the positive effects of cultural exchange can alleviate negative perceptions of tourism. Additionally, the application of algorithms such as Random Forest and XGBoost enabled a deeper analysis of interdependencies between variables and confirmed that positive perceptions of benefits and cultural identification are the most significant predictors of tourism support. Using SHAP analysis allowed for a precise assessment of the importance of individual features in predicting tourism support, further strengthening the validity of the developed model. This method enabled a detailed explanation of the influence of specific constructs on tourism support, ensuring the transparency and interpretability of the results. Comparison with studies that did not employ these advanced methods, such as Ap’s research [66] and Kumar et al.’s study [56], demonstrates that combining traditional methods such as SEM and MGA with modern machine learning techniques provides deeper insights and more accurate results.
The moderating effects of travel frequency and contact with tourists further confirmed the complexity of interdependencies between different aspects of tourism support. The findings indicate that contact with tourists and travel frequency positively influence perceptions of benefits and reciprocal benefits, which can be explained by Social Exchange Theory. Shen et al. [61] highlighted the relevance of interaction in creating opinions about tourism growth, which is also reflected in the findings of this study. Increased frequency of contact with tourists often results in higher levels of positive attitudes, which aligns with Pennington-Gray’s [60] findings on the importance of social interaction in tourism destinations.

6. Conclusions

This study confirmed that the perception of economic benefits, cultural identification, and reciprocal advantages play a pivotal role in encouraging sustainable tourism development, particularly in contexts with diverse cultural and socioeconomic backgrounds. The research has empirically validated all seven proposed hypotheses, highlighting that perceived benefits (H1), perceived costs (H2), local support (H3), reciprocal benefits (H4), and cultural identification (H5) directly influence tourism support. Moreover, the moderating effects of travel frequency and contact with tourists (H6, H7) were confirmed as amplifiers of these relationships. These findings contribute to the refinement of Social Exchange Theory by demonstrating its applicability in emerging and transitional tourism markets. By bridging gaps in the existing literature, the study offers a foundation for future empirical models and supports policy development aimed at inclusive, economically sustainable tourism. In addition to its academic contribution, the research provides guidance for destination managers and policymakers to shape tourism strategies that reflect not only economic aspirations, but also cultural sensitivities and community engagement. Future research may expand this model across other geographic areas, especially within the Global South, to verify its broader relevance and applicability.

6.1. Conceptual and Practical Implications

This study offers a substantial contribution to the theoretical understanding and practical advancement of sustainable tourism by integrating economic, cultural, and social dimensions into a coherent analytical framework. The research extends Social Exchange Theory by emphasizing the significance of cultural identification and local support alongside economic benefits, particularly in contexts where cultural heritage and collective identity play essential roles in shaping residents’ attitudes toward tourism development. Unlike previous models that have predominantly focused on material gains, this study demonstrates that cultural belonging and perceived reciprocity significantly influence support for tourism, thereby positioning culture not as a complementary, but as a central factor in sustainability discourse. The developed model enhances the interpretive capacity of existing theories by demonstrating how tourism impacts are evaluated not only through economic metrics, but also through their alignment with local values and lived experiences. The empirical findings confirm that communities with a strong sense of cultural identity and perceived inclusion in tourism processes are more likely to support its development, even in the presence of moderate costs or risks. This dynamic suggests that the legitimacy of tourism initiatives is not derived solely from their profitability, but from the perception of fairness, representation, and cultural respect they generate among residents.
In practical terms, the study provides a solid foundation for the formulation of sustainable tourism policies that reflect local priorities while remaining responsive to broader developmental goals. In transitional societies such as Serbia and Kazakhstan, where tourism development is still maturing, the findings offer guidance for designing context-sensitive strategies that align economic advancement with the preservation of cultural identity and social cohesion. Fostering authentic local experiences, improving participatory governance in tourism planning, and strengthening the visibility of cultural assets are essential pathways toward inclusive growth and long-term resilience, especially in rural and economically vulnerable communities. In more developed contexts such as Hungary, where the institutional infrastructure for tourism is more established, the study suggests that further competitiveness may be achieved by reinforcing cultural authenticity and integrating digital innovations that support cultural interpretation and promotion.
By framing tourism support through a multidimensional lens, this research advances policy relevance beyond the immediate study area. The proposed model is adaptable to a variety of destinations, particularly in regions undergoing structural transformation and facing the pressures of globalization. It also holds potential for broader regional cooperation, offering an approach through which countries with shared post-socialist trajectories can formulate joint strategies for sustainable tourism development grounded in cultural continuity and socioeconomic equity.
Furthermore, the study aligns with the global sustainability agenda by reinforcing the role of tourism in achieving objectives such as heritage preservation, poverty reduction, inclusive economic growth, and community empowerment. The analytical structure developed here offers a flexible and transferable model that enables policymakers, practitioners, and scholars to better understand and manage the complex interactions between tourism and local communities. In doing so, the study supports the creation of tourism systems that are not only economically efficient, but also culturally sensitive and socially just, contributing meaningfully to the long-term sustainability of destinations at the local, national, and global level.

6.2. Study’s Limitations and Future Recommendations

The quantitative approach applied in this study, based on self-reported perceptions collected through structured survey questionnaires, presents several methodological limitations that should be acknowledged when interpreting the results. As with most perception-based surveys, the data are subject to social desirability bias and may reflect respondents’ momentary attitudes shaped by prevailing socioeconomic or political conditions. This subjectivity is particularly relevant when dealing with complex and abstract constructs such as cultural identification and the perceived costs and benefits of tourism. Additionally, the cross-sectional design of the research captures a snapshot in time, thereby limiting the ability to observe the evolution of attitudes or support dynamics over extended periods. To overcome this limitation, future research should consider longitudinal designs that would enable tracking shifts in residents’ perceptions over time and provide insight into the processes underlying the development of tourism support.
Although the comparative design involving Serbia, Kazakhstan, and Hungary enriched the analysis by allowing for cultural and economic contrasts, the generalizability of the findings to broader geographical or cultural contexts remains constrained. Differing national tourism policies, institutional capacities, and levels of cultural capital may significantly shape how tourism is perceived across other societies. Expanding the study to include countries with varying degrees of economic development, or to regions with distinct sociopolitical histories, could contribute to identifying both universal patterns and context-specific variations in tourism support. Particular attention should be given to transitional economies undergoing modernization pressures, as well as to advanced economies where cultural and rural tourism are being reshaped through digital innovation and creative strategies.
In terms of research design, the reliance on hypothetical or generalized scenarios within the survey instrument may have introduced inconsistencies between respondents’ stated preferences and actual behaviors. Future studies could benefit from integrating real-life case studies or applying qualitative methods that allow for a more nuanced exploration of resident–tourism relationships. Techniques such as in-depth interviews, focus groups, and ethnographic fieldwork would enable a deeper understanding of local motivations, community values, and interpretive meanings attached to tourism development. Combining quantitative and qualitative approaches is essential for capturing the full complexity of economic, cultural, and social interdependencies influencing residents’ support for tourism.
Further research should also seek to diversify the range of stakeholders included in the analysis. Involving tourists, investors, and public officials could offer broader insight into how tourism strategies are perceived and co-created across different levels of the system. Special emphasis should be placed on exploring the role of online platforms, digital storytelling, and technological innovations in promoting cultural identity and enhancing resident participation. Such directions could provide valuable inputs for designing adaptable and context-sensitive sustainable tourism strategies.
The integrated model, developed and tested across the Serbian, Kazakh, and Hungarian contexts, offers a robust foundation for future research. By balancing economic, cultural, and social components within a unified framework, it opens new possibilities for theory development and policy formulation. Comparative applications of this model in other regions could help identify structural regularities and divergences, offering evidence-based recommendations for inclusive, responsible, and sustainable tourism development in diverse settings. Additionally, future studies may explore how global economic and societal transformations, such as shifting labor patterns, environmental pressures, or geopolitical changes, reshape local perspectives on tourism and influence the level of community support.

Author Contributions

Conceptualization, T.G. and M.D.P.; methodology, T.G., M.D.P. and S.L.; software, T.G.; validation, M.D.P., T.G. and M.M.R.; formal analysis, T.G. and S.L.; investigation, M.D.P., E.A. and D.M.K.; resources, T.G. and S.L.; data curation, Ž.A. and E.A.; writing—original draft preparation, T.G. and S.L.; writing—review and editing, M.D.P., M.M.R. and D.M.K.; visualization, Ž.A.; supervision, M.D.P., M.M.R. and E.A. All authors have read and agreed to the published version of the manuscript.

Funding

The research was supported by the Ministry of Science, Technological Development and Innovation of the Republic of Serbia (Contract no. 451-03-136/2025-03/200172), and by RUDN University (Grant no. 060509-0-000).

Institutional Review Board Statement

The research was conducted entirely in accordance with the principles of the Declaration of Helsinki (1975, revised in 2013). According to the Declaration of Helsinki, research involving human subjects requires particular caution when there is a risk of harm, sensitive data processing, or invasive procedures. Our study did not involve any form of experiment, medical intervention, physical or psychological risk, or the collection of personal or sensitive data. The research solely involved anonymous, voluntary questionnaire responses related to perceptions of sustainable tourism. Participants were fully informed about the study’s objectives prior to participation, participation was entirely voluntary, and anonymity was guaranteed throughout the process. According to national legislation in the analyzed countries, ethical committee approval is required only for biomedical or health-related research that involves interventions, biological sampling, or sensitive personal health data. Since our study involved noninvasive social research without collecting personal identifiers or sensitive information, there was no legal requirement to obtain ethics committee approval or request signed informed consent forms. Furthermore, the Materials and Methods Section of the manuscript clearly explains that the survey was anonymous and voluntary and that all ethical principles were upheld, ensuring no risk to the participants. Based on the above points, obtaining ethics approval and submitting a written informed consent form was not necessary and not required by the applicable international and national ethical and legal standards for this type of research.

Informed Consent Statement

Verbal informed consent was obtained from the participants.

Data Availability Statement

The data presented in this study are available on request from the corresponding author.

Conflicts of Interest

Author Shakhislam Laiskhanov is employed by International Educational Corporation. The remaining authors declare that the research was conducted in the absence of any commercial or financial relationships that could be construed as a potential conflict of interest.

References

  1. Gallegati, S.; Masiá, P.; Fanelli, E.; Danovaro, R. The Impact of Natural Capital Loss on Blue-Tourism Economy: The Red Sea Case Study. Mar. Policy 2025, 172, 106507. [Google Scholar] [CrossRef]
  2. Sudarmanto, E.; Raharjo, B.B.; Kristiyanto, A.; Sulaiman, S.; Setyawati, H.; Priyono, B.; Jariono, G. A Systematic Review for the Development of Sustainable Tourism Destinations Based on Sports Tourism. Retos Nuevas Tend. En Educ. Física Deporte Y Recreación 2025, 62, 646–654. [Google Scholar] [CrossRef]
  3. Chernyshev, K.A.; Alov, I.N.; Li, Y.; Gajić, T. How Real Is Migration’s Contribution to the Population Change in Major Urban Agglomerations? J. Geogr. Inst. Jovan Cvijić SASA 2023, 73, 371–378. [Google Scholar] [CrossRef]
  4. Rossini, L.; Falese, L.; Andrade, A.; Federici, D. Exploring the Socio-Economic Impact of Small and Medium-Sized Sports Events on Participants, Tourism and Local Communities: A Systematic Review of the Literature. J. Sport Tour. 2024, 28, 197–220. [Google Scholar] [CrossRef]
  5. Ijatuyi, E.J.; Yessoufou, K.; Patrick, H.O. Sustainable Tourism and Green Space: Exploring How Green Spaces and Natural Attractions Contribute to Local Tourism Economies and Revenue Generation in Gauteng Province. Discov. Sustain. 2025, 6, 236. [Google Scholar] [CrossRef]
  6. Demirović, D.; Petrović, M.D.; Neto Monteiro, L.C.; Stjepanović, S. An Examination of Competitiveness of Rural Destinations from the Supply Side Perspective. J. Geogr. Inst. Jovan Cvijić SASA 2016, 66, 387–400. [Google Scholar] [CrossRef]
  7. Dziekański, P.; Popławski, Ł.; Popławska, J. Interaction Between Pro-Environmental Spending and Environmental Conditions and Development. J. Geogr. Inst. Jovan Cvijić SASA 2024, 74, 329–345. [Google Scholar] [CrossRef]
  8. Abbas, J.; Mamirkulova, G.; Al-Sulaiti, I.; Al-Sulaiti, K.I.; Dar, I.B. Mega-Infrastructure Development, Tourism Sustainability and Quality of Life Assessment at World Heritage Sites: Catering to COVID-19 Challenges. Kybernetes 2025, 54, 1993–2018. [Google Scholar] [CrossRef]
  9. Happ, E.; Nemes, N. The Role of Territorial Identity in the Sustainability of Tourism in Hungary. Geo J. Tour. Geosites 2025, 58, 225–232. [Google Scholar] [CrossRef]
  10. Silva, M.G.E.; Remoaldo, P.; Peluso, M.L. Human Values and Tourism Perception: A New Approach in Residents’ Perceptions. Curr. Issues Tour. 2025, 28, 353–358. [Google Scholar] [CrossRef]
  11. Pinto, H.; Barboza, M.; Nogueira, C. Perceptions and Behaviors Concerning Tourism Degrowth and Sustainable Tourism: Latent Dimensions and Types of Tourists. Sustainability 2025, 17, 387. [Google Scholar] [CrossRef]
  12. Muresan, I.C.; Harun, R.; Arion, F.H.; Fatah, A.O.; Dumitras, D.E. Exploring Residents’ Perceptions of the Socio-Cultural Benefits of Tourism Development in the Mountain Area. Societies 2021, 11, 83. [Google Scholar] [CrossRef]
  13. Boley, B.B.; Strzelecka, M.; Woosnam, K.M. Resident Perceptions of the Economic Benefits of Tourism: Toward a Common Measure. J. Hosp. Tour. Res. 2018, 42, 1295–1314. [Google Scholar] [CrossRef]
  14. Joo, D.; Cho, H.; Woosnam, K.M. Exploring Tourists’ Perceptions of Tourism Impacts. Tour. Manag. Perspect. 2019, 31, 231–235. [Google Scholar] [CrossRef]
  15. Kodaş, D.; Arıca, R.; Kafa, N.; Duman, F. Relationships Between Perceptions of Residents Toward Tourism Development, Benefits Derived from Tourism and Support to Tourism. J. Tour. 2022, 8, 255–280. [Google Scholar] [CrossRef]
  16. Kanwal, S.; Rasheed, M.I.; Pitafi, A.H.; Pitafi, A.; Ren, M. Road and Transport Infrastructure Development and Community Support for Tourism: The Role of Perceived Benefits, and Community Satisfaction. Tour. Manag. 2020, 77, 104014. [Google Scholar] [CrossRef]
  17. Woosnam, K.M.; Draper, J.; Jiang, J.K.; Aleshinloye, K.D.; Erul, E. Applying Self-Perception Theory to Explain Residents’ Attitudes About Tourism Development Through Travel Histories. Tour. Manag. 2018, 64, 357–368. [Google Scholar] [CrossRef]
  18. Gursoy, D.; Ouyang, Z.; Nunkoo, R.; Wei, W. Residents’ Impact Perceptions of and Attitudes Towards Tourism Development: A Meta-Analysis. J. Hosp. Mark. Manag. 2019, 28, 306–333. [Google Scholar] [CrossRef]
  19. Khandeparkar, K.; Maheshwari, B.; Motiani, M. Why Should I Pay More? Testing the Impact of Contextual Cues on Perception of Price Unfairness for the Price-Disadvantaged Segment in Dual Pricing. Tour. Manag. 2020, 78, 104075. [Google Scholar] [CrossRef]
  20. Wei, Q.; Lv, D.; Fu, S.; Zhu, D.; Zheng, M.; Chen, S.; Zhen, S. The Influence of Tourist Attraction Type on Product Price Perception and Neural Mechanism in Tourism Consumption: An ERP Study. Psychol. Res. Behav. Manag. 2023, 16, 3787–3803. [Google Scholar] [CrossRef]
  21. Çelik, S.; Rasoolimanesh, S.M. Residents’ Attitudes Towards Tourism, Cost–Benefit Attitudes, and Support for Tourism: A Pre-Development Perspective. Tour. Plan. Dev. 2023, 20, 522–540. [Google Scholar] [CrossRef]
  22. Lan, T.; Zheng, Z.; Tian, D.; Zhang, R.; Law, R.; Zhang, M. Resident-Tourist Value Co-Creation in the Intangible Cultural Heritage Tourism Context: The Role of Residents’ Perception of Tourism Development and Emotional Solidarity. Sustainability 2021, 13, 1369. [Google Scholar] [CrossRef]
  23. Carballo-Cruz, F.; Silva, L.F. What Drives Residents’ Support for Tourism Development of the Camino de Santiago? The Role of Perceived Impacts, Local Socioeconomic Context, and Overall Attitudes. Curr. Issues Tour. 2025, 1–21. [Google Scholar] [CrossRef]
  24. Rodríguez Bolívar, M.P.; Sepe, F.; Nanu, L.; Roberto, F. Perceptions and Challenges of Blockchain Adoption in Tourism Industry: A Study on Trust, Privacy and Security. J. Hosp. Tour. Technol. 2025, 16, 429–449. [Google Scholar] [CrossRef]
  25. Zhou, B.; Wang, Y.; Huang, S.; Qiao, G. Perceived Benefits and Tourist Willingness to Pay More in National Forest Parks: The Moderating Roles of Ecocentrism, Collectivism, and Power Distance. J. Vacat. Mark. 2025, 0, 13567667251314202. [Google Scholar] [CrossRef]
  26. Liu, H.; Tan, Q.; Mai, H. Stress-Buffering Effects of Social Support on Tourism Employees During the COVID-19 Pandemic: A Moderated Mediation Model. Int. J. Environ. Res. Public Health 2023, 20, 2342. [Google Scholar] [CrossRef]
  27. Ramkissoon, H. Perceived Social Impacts of Tourism and Quality-of-Life: A New Conceptual Model. J. Sustain. Tour. 2020, 31, 442–459. [Google Scholar] [CrossRef]
  28. Magno, F.; Dossena, G. Pride of Being Part of a Host Community? Medium-Term Effects of Mega-Events on Citizen Quality of Life: The Case of the World Expo 2015 in Milan. J. Destin. Mark. Manag. 2020, 15, 100410. [Google Scholar] [CrossRef]
  29. Majeed, S.; Zhou, Z.; Lu, C.; Ramkissoon, H. Online Tourism Information and Tourist Behavior: A Structural Equation Modeling Analysis Based on a Self-Administered Survey. Front. Psychol. 2020, 11, 599. [Google Scholar] [CrossRef]
  30. Rafi, A.; Rehman, M.A.; Sharif, S.; Lodhi, R.N. The Role of Social Media Marketing and Social Support in Developing Value Co-Creation Intentions: A Couchsurfing Community Perspective. Glob. Knowl. Mem. Commun. 2025, 74, 1275–1294. [Google Scholar] [CrossRef]
  31. Zhuang, X.; Wang, Y. Social Support and Travel: Enhancing Relationships, Communication, and Understanding for Travel Companions. Int. J. Tour. Res. 2024, 26, e2712. [Google Scholar] [CrossRef]
  32. Munanura, I.E.; Needham, M.D.; Lindberg, K.; Kooistra, C.; Ghahramani, L. Support for Tourism: The Roles of Attitudes, Subjective Wellbeing, and Emotional Solidarity. J. Sustain. Tour. 2021, 31, 581–596. [Google Scholar] [CrossRef]
  33. Du, F.; Cheng, N. Taking Aging Parents on Travel: A Social Support Perspective. Curr. Issues Tour. 2025, 1–14. [Google Scholar] [CrossRef]
  34. Dutt, C.S.; Harvey, W.S.; Shaw, G. Exploring the Relevance of Social Exchange Theory in the Middle East: A Case Study of Tourism in Dubai, UAE. Int. J. Tour. Res. 2023, 25, 198–220. [Google Scholar] [CrossRef]
  35. Solarin, S.A.; Ulucak, R.; Erdogan, S. Assessing the Economic Impacts of Tourism Markets and Activities Diversification: Evidence from a New Dynamic Regression Approach. J. Travel Res. 2024, 63, 2078–2093. [Google Scholar] [CrossRef]
  36. Roudi, S.; Arasli, H.; Akadiri, S.S. New Insights into an Old Issue—Examining the Influence of Tourism on Economic Growth: Evidence from Selected Small Island Developing States. Curr. Issues Tour. 2019, 22, 1280–1300. [Google Scholar] [CrossRef]
  37. Alamineh, G.A.; Hussein, J.W.; Mulu, Y.E.; Taddesse, B. The Negative Cultural Impact of Tourism and Its Implication on Sustainable Development in Amhara Regional State. Cogent Arts Humanit. 2023, 10, 2224597. [Google Scholar] [CrossRef]
  38. Jehan, Y.; Batool, M.; Hayat, N.; Hussain, D. Socio-Economic and Environmental Impacts of Tourism on Local Community in Gilgit Baltistan, Pakistan: A Local Community Perspective. J. Knowl. Econ. 2023, 14, 180–199. [Google Scholar] [CrossRef]
  39. Pai, C.K.; Chen, H.; Lee, T.J.; Hyun, S.S.; Liu, Y.; Zheng, Y. The Impacts of Under-Tourism and Place Attachment on Residents’ Life Satisfaction. J. Vacat. Mark. 2023, 30, 694–712. [Google Scholar] [CrossRef]
  40. Reivan-Ortiz, G.G.; Cong, P.T.; Wong, W.K.; Ali, A.; Thu, H.T.T.; Akhter, S. Role of Geopolitical Risk, Currency Fluctuation, and Economic Policy on Tourist Arrivals: Temporal Analysis of BRICS Economies. Environ. Sci. Pollut. Res. 2023, 30, 78339–78352. [Google Scholar] [CrossRef]
  41. Sengoz, A.; Dogru, T.; Mody, M.; Isik, C. Guiding the Path to Sustainable Tourism Development: Investigating the Role of Tour Guides within a Social Exchange Theory Paradigm. Tour. Manag. 2025, 110, 105162. [Google Scholar] [CrossRef]
  42. Back, R.M.; Tasci, A.D.A.; Woosnam, K.M. Factors Explaining Resident Stakeholders’ Perception and Support for Wineries and Wine Tourism in Florida. J. Hosp. Tour. Res. 2023, 49, 563–580, (Original work published 2025). [Google Scholar] [CrossRef]
  43. Sinha, N.; Dhingra, S.; Sehrawat, R.; Jain, V.; Himanshu, H. Customers’ Intention to Use Virtual Reality in Tourism: A Comprehensive Analysis of Influencing Factors. Tour. Rev. 2025, 80, 742–766. [Google Scholar] [CrossRef]
  44. Katyukha, D.; Yurovchyk, V.; Horiunova, K.; Melnychenko, S.; Myronov, Y. Leveraging Cultural Heritage for Sustainable Tourism Growth: Contemporary Strategies for Conservation and Promotion. OIDA Int. J. Sustain. Dev. 2025, 18, 53–66. [Google Scholar]
  45. Oorgaz-Agüera, F.; Puig-Cabrera, M.; Moral-Cuadra, S.; Domínguez-Valerio, C.M. Authenticity of Architecture, Place Attachment, Identity and Support for Sustainable Tourism in World Heritage Cities. Tour. Hosp. Manag. 2025, 31, 81–92. [Google Scholar] [CrossRef]
  46. Qiu, R.T.; Park, J.; Li, S.; Song, H. Social Costs of Tourism During the COVID-19 Pandemic. Ann. Tour. Res. 2020, 84, 102994. [Google Scholar] [CrossRef]
  47. Aziz, N.A.; Long, F. To Travel, or Not to Travel? The Impacts of Travel Constraints and Perceived Travel Risk on Travel Intention Among Malaysian Tourists Amid the COVID-19. J. Consum. Behav. 2022, 21, 352–362. [Google Scholar] [CrossRef]
  48. Dechezleprêtre, A.; Fabre, A.; Kruse, T.; Planterose, B.; Sanchez Chico, A.; Stantcheva, S. Fighting Climate Change: International Attitudes toward Climate Policies. Am. Econ. Rev. 2025, 115, 1258–1300. [Google Scholar] [CrossRef]
  49. Frantál, B.; Chodkowska-Miszczuk, J.M.; Alexandrescu, F.; Stölzel, F.; Klusáček, P.; Konečný, O.; Zieliński, D. With Coal Forever? Conflicted Attitudes of Residents in Coal Mining Areas in the Czech Republic, Germany and Poland to Coal Phase-Out. Resour. Policy 2025, 101, 105476. [Google Scholar] [CrossRef]
  50. Kordej-De Villa, Ž.; Šulc, I. Cultural Heritage, Tourism and the UN Sustainable Development Goals: The Case of Croatia. In Rethinking Sustainability Towards a Regenerative Economy; Andreucci, M.B., Marvuglia, A., Baltov, M., Hansen, P., Eds.; Springer: Cham, Switzerland, 2021; Volume 15. [Google Scholar] [CrossRef]
  51. Mteti, S.H.; Mpambije, C.J.; Manyerere, D.J. Unlocking Cultural Tourism: Local Community Awareness and Perceptions of Cultural Heritage Resources in Katavi Region in Southern Circuit of Tanzania. Soc. Sci. Humanit. Open 2025, 11, 101295. [Google Scholar] [CrossRef]
  52. Butler, G.; Szili, G.; Huang, H. Cultural Heritage Tourism Development in Panyu District, Guangzhou: Community Perspectives on Pride and Preservation, and Concerns for the Future. J. Herit. Tour. 2022, 17, 56–73. [Google Scholar] [CrossRef]
  53. Wasela, K. The Role of Intangible Cultural Heritage in the Development of Cultural Tourism. Int. J. Eco-Cult. Tour. Hosp. Plan. Dev. 2023, 6, 15–28. [Google Scholar] [CrossRef]
  54. Qiu, Q.; Zuo, Y.; Zhang, M. Intangible Cultural Heritage in Tourism: Research Review and Investigation of Future Agenda. Land 2022, 11, 139. [Google Scholar] [CrossRef]
  55. Worku Tadesse, G. Heritage Resources as a Driver of Cultural Tourism Development in Ethiopia: A Review. Cogent Arts Humanit. 2022, 10, 2158623. [Google Scholar] [CrossRef]
  56. Kumar, S.; Valeri, M.; Shekhar, A. Understanding the Relationship Among Factors Influencing Rural Tourism: A Hierarchical Approach. J. Organ. Change Manag. 2022, 35, 385–407. [Google Scholar] [CrossRef]
  57. Solakis, K.; Katsoni, V.; Mahmoud, A.B.; Grigoriou, N. Factors Affecting Value Co-Creation Through Artificial Intelligence in Tourism: A General Literature Review. J. Tour. Futur. 2024, 10, 116–130. [Google Scholar] [CrossRef]
  58. Munanura, I.E.; Kline, J.D. Residents’ Support for Tourism: The Role of Tourism Impact Attitudes, Forest Value Orientations, and Quality of Life in Oregon, United States. Tour. Plan. Dev. 2023, 20, 566–582. [Google Scholar] [CrossRef]
  59. Samad, S.; Alharthi, A. Untangling Factors Influencing Women Entrepreneurs’ Involvement in Tourism and Its Impact on Sustainable Tourism Development. Adm. Sci. 2022, 12, 52. [Google Scholar] [CrossRef]
  60. Pennington-Gray, L. Resident Attitudes Towards Tourism in a Destination in the Stagnation Stage of the Tourism Life Cycle. WIT Trans. Ecol. Environ. 2025, 84, 8. [Google Scholar] [CrossRef]
  61. Shen, S.; Xu, K.; Sotiriadis, M.; Wang, Y. Exploring the Factors Influencing the Adoption and Usage of Augmented Reality and Virtual Reality Applications in Tourism Education within the Context of COVID-19 Pandemic. J. Hosp. Leisure Sport Tour. Educ. 2022, 30, 100373. [Google Scholar] [CrossRef]
  62. Khajehshahkoohi, M.; Davoodi, S.R.; Shaaban, K. Factors Affecting the Behavioral Intention of Tourists on the Use of Bike Sharing in Tourism Areas. Res. Transp. Bus. Manag. 2022, 43, 100742. [Google Scholar] [CrossRef]
  63. Mutmainah, I.; Yulia, I.A.; Setiawan, F.A.; Setiawan, A.S.; Nurhayati, I.; Rainanto, B.H.; Endri, E. Analysis of Factors Influencing Digital Transformation of Tourism Villages: Evidence from Bogor, Indonesia. Tour. Hosp. 2025, 6, 57. [Google Scholar] [CrossRef]
  64. Homans, G.C. Social Behavior: Its Elementary Forms; Harcourt Brace Jovanovich: New York, NY, USA, 1961; Available online: https://openlibrary.org/books/OL5418810M/Social_behavior_its_elementary_forms (accessed on 1 April 2025).
  65. Blau, P.M. Justice in Social Exchange. Sociol. Inq. 1964, 34, 193–206. [Google Scholar] [CrossRef]
  66. Ap, J. Residents’ Perceptions on Tourism Impacts. Ann. Tour. Res. 1992, 19, 665–690. [Google Scholar] [CrossRef]
  67. Allaberganov, A.; Catterall, P. Using Social Exchange Theory to Examine Residents’ Responses to Heritage Tourism: Case Studies of Samarqand and Bukhara in Uzbekistan. J. Herit. Tour. 2023, 18, 846–863. [Google Scholar] [CrossRef]
  68. Han, S.; Ramkissoon, H.; You, E.; Kim, M.J. Support of Residents for Sustainable Tourism Development in Nature-Based Destinations: Applying Theories of Social Exchange and Bottom-Up Spillover. J. Outdoor Recreat. Tour. 2023, 43, 100643. [Google Scholar] [CrossRef]
  69. Meira, J.V.d.S.; Hancer, M. Using the Social Exchange Theory to Explore the Employee-Organization Relationship in the Hospitality Industry. Int. J. Contemp. Hosp. Manag. 2021, 33, 670–692. [Google Scholar] [CrossRef]
  70. Hassan, T.H.; Salem, A.E.; Abdelmoaty, M.A.; Saleh, M.I. Renewing the Ecotourism Investments’ Strategies in the Kingdom of Saudi Arabia: Social Exchange Theory Prospects. Geo J. Tour. Geosites 2022, 45, 1661–1673. [Google Scholar] [CrossRef]
  71. Brandmiller, C.; Schnitzler, K.; Dumont, H. Teacher Perceptions of Student Motivation and Engagement: Longitudinal Associations with Student Outcomes. Eur. J. Psychol. Educ. 2024, 39, 1397–1420. [Google Scholar] [CrossRef]
  72. Xu, W.; Sun, H.; Zhu, B.; Yu, X.; Niu, Y.; Kou, C.; Li, W. The Prevalence of Depressive Symptoms and Its Determinants Among Adults in Mainland China: Results from a National Household Survey. J. Affect. Disord. 2021, 281, 220–227. [Google Scholar] [CrossRef]
  73. Kang, S.K.; Lee, J. Support of Marijuana Tourism in Colorado: A Residents’ Perspective Using Social Exchange Theory. J. Destin. Mark. Manag. 2018, 9, 310–319. [Google Scholar] [CrossRef]
  74. Nunkoo, R.; Ramkissoon, H. Developing a Community Support Model for Tourism. Ann. Tour. Res. 2011, 38, 964–988. [Google Scholar] [CrossRef]
  75. Wang, Y.; Xiang, D.; Yang, Z.; Ma, S.S. Unraveling Customer Sustainable Consumption Behaviors in Sharing Economy: A Socio-Economic Approach Based on Social Exchange Theory. J. Clean. Prod. 2019, 208, 869–879. [Google Scholar] [CrossRef]
  76. Chang, K.C. The Affecting Tourism Development Attitudes Based on the Social Exchange Theory and the Social Network Theory. Asia Pac. J. Tour. Res. 2021, 26, 167–182. [Google Scholar] [CrossRef]
  77. Harrill, R. Residents’ Attitudes Toward Tourism Development: A Literature Review with Implications for Tourism Planning. J. Plan. Lit. 2004, 18, 251–266. [Google Scholar] [CrossRef]
  78. Diedrich, A.; García-Buades, E. Local Perceptions of Tourism as Indicators of Destination Decline. Tour. Manag. 2009, 30, 512–521. [Google Scholar] [CrossRef]
  79. Rasoolimanesh, S.M.; Ringle, C.M.; Jaafar, M.; Ramayah, T. Urban vs. Rural Destinations: Residents’ Perceptions, Community Participation and Support for Tourism Development. Tour. Manag. 2017, 60, 147–158. [Google Scholar] [CrossRef]
  80. Kim, H.; So, K.K.F.; Wirtz, J. Service Robots: Applying Social Exchange Theory to Better Understand Human–Robot Interactions. Tour. Manag. 2022, 92, 104537. [Google Scholar] [CrossRef]
  81. Wang, Y.; Pfister, R.E. Residents’ Attitudes Toward Tourism and Perceived Personal Benefits in a Rural Community. J. Travel Res. 2008, 47, 84–93. [Google Scholar] [CrossRef]
  82. Stylidis, D.; Biran, A.; Sit, J.; Szivas, E.M. Residents’ Support for Tourism Development: The Role of Residents’ Place Image and Perceived Tourism Impacts. Tour. Manag. 2014, 45, 260–274. [Google Scholar] [CrossRef]
  83. Rizal, H.; Amin, H.; Suddin, L.; Sondoh, S.L.; Chen, J.K. Relationship Quality and E-Loyalty Towards Online Travel Agency (OTA): Social Exchange Theory Perspective. J. Pengurusan 2020, 58, 39–51. [Google Scholar] [CrossRef]
  84. Ahmad, R.; Nawaz, M.R.; Ishaq, M.I.; Khan, M.M.; Ashraf, H.A. Social Exchange Theory: Systematic Review and Future Directions. Front. Psychol. 2023, 13, 1015921. [Google Scholar] [CrossRef] [PubMed]
  85. Fan, X.; Li, J.; Mao, Z.E.; Lu, Z. Can Ethical Leadership Inspire Employee Loyalty in Hotels in China?—From the Perspective of the Social Exchange Theory. J. Hosp. Tour. Manag. 2021, 49, 538–547. [Google Scholar] [CrossRef]
  86. Maulud, D.; Abdulazeez, A.M. A Review on Linear Regression Comprehensive in Machine Learning. J. Appl. Sci. Technol. Trends 2020, 1, 140–147. [Google Scholar] [CrossRef]
  87. Zhang, D.; Khalili, A.; Asgharian, M. Post-Model-Selection Inference in Linear Regression Models: An Integrated Review. Stat. Surv. 2022, 16, 86–136. [Google Scholar] [CrossRef]
  88. Rath, S.; Tripathy, A.; Tripathy, A.R. Prediction of New Active Cases of Coronavirus Disease (COVID-19) Pandemic Using Multiple Linear Regression Model. Diabetes Metab. Syndr. Clin. Res. Rev. 2020, 14, 1467–1474. [Google Scholar] [CrossRef] [PubMed]
  89. Maydeu-Olivares, A.; Shi, D.; Fairchild, A.J. Estimating Causal Effects in Linear Regression Models with Observational Data: The Instrumental Variables Regression Model. Psychol. Methods 2020, 25, 243. [Google Scholar] [CrossRef]
  90. Wang, Z.; Wang, W. Concept Drift Detection Based on Kolmogorov–Smirnov Test. In Artificial Intelligence in China; Liang, Q., Wang, W., Mu, J., Liu, X., Na, Z., Chen, B., Eds.; Springer: Singapore, 2020; Volume 572, pp. 457–468. [Google Scholar] [CrossRef]
  91. Kyriazos, T.; Poga-Kyriazou, M. Applied Psychometrics: Estimator Considerations in Commonly Encountered Conditions in CFA, SEM, and EFA Practice. Psychology 2023, 14, 799–828. [Google Scholar] [CrossRef]
  92. Baharum, H.; Ismail, A.; Awang, Z.; McKenna, L.; Ibrahim, R.; Mohamed, Z.; Hassan, N.H. The Study Adapted Instruments Based on Confirmatory Factor Analysis (CFA) to Validate Measurement Models of Latent Constructs. Int. J. Environ. Res. Public Health 2023, 20, 2860. [Google Scholar] [CrossRef]
  93. Husain, H.; Aziz, H. Exploratory Factor Analysis (EFA) and Confirmatory Factor Analysis (CFA) to Measure the Validity and Reliability Constructs of Historical Thinking Skills, Tpack, and Application of Historical Thinking Skills. Int. J. Educ. Psychol. Couns. 2022, 7, 608–623. [Google Scholar] [CrossRef]
  94. Podsakoff, P.M.; Podsakoff, N.P.; Williams, L.J.; Huang, C.; Yang, J. Common Method Bias: It’s Bad, It’s Complex, It’s Widespread, and It’s Not Easy to Fix. Annu. Rev. Organ. Psychol. Organ. Behav. 2024, 11, 17–61. [Google Scholar] [CrossRef]
  95. Long, S.; Al Mamun, A.; Yang, Q.; Gao, J.; Hussain, W.M.H.W.; Shami, S.S.A.A. Modelling the Mass Adoption of Mobile Payment for E-Hailing Services Using SEM-MGA. PLoS ONE 2023, 18, e0287300. [Google Scholar] [CrossRef]
  96. Ibrahim, N.; Farinordin, F.A.; Mohamad, N.I.; Lee, U.H.M.S.; Ismail, A. Psychological Empowerment Link Using Employee Performance and Organizational Commitment on the Generation Gap: PLS-MGA Analysis. Gadjah Mada Int. J. Bus. 2024, 26, 23–53. [Google Scholar] [CrossRef]
  97. Ngah, A.H.; Kamalrulzaman, N.I.; Mohamad, M.; Grippa, T.; Niang Gadiaga, A.; Linard, C.; Lennert, M.; Vanhuysse, S.; Kalogirou, S. Do Science and Social Science Differ? Multi-Group Analysis (MGA) of the Willingness to Continue Online Learning. Qual. Quant. 2023, 57, 2957–2980. [Google Scholar] [CrossRef]
  98. Saleki, R.; Quoquab, F.; Mohammad, J. To Buy or Not to Buy Organic Food: Evaluating the Moderating Effect of Gender Using PLS-MGA. Int. J. Bus. Gov. Ethics 2021, 15, 106–127. [Google Scholar] [CrossRef]
  99. Salman, H.A.; Kalakech, A.; Steiti, A. Random Forest Algorithm Overview. Babylon. J. Mach. Learn. 2024, 2024, 69–79. [Google Scholar] [CrossRef] [PubMed]
  100. Sun, Z.; Wang, G.; Li, P.; Wang, H.; Zhang, M.; Liang, X. An Improved Random Forest Based on the Classification Accuracy and Correlation Measurement of Decision Trees. Expert Syst. Appl. 2024, 237, 121549. [Google Scholar] [CrossRef]
  101. Georganos, S.; Grippa, T.; Niang Gadiaga, A.; Linard, C.; Lennert, M.; Vanhuysse, S.; Kalogirou, S. Geographical Random Forests: A Spatial Extension of the Random Forest Algorithm to Address Spatial Heterogeneity in Remote Sensing and Population Modelling. Geocarto Int. 2019, 36, 121–136. [Google Scholar] [CrossRef]
  102. Ben Jabeur, S.; Stef, N.; Carmona, P. Bankruptcy Prediction Using the XGBoost Algorithm and Variable Importance Feature Engineering. Comput. Econ. 2023, 61, 715–741. [Google Scholar] [CrossRef]
  103. Elgammal, I. What if the local community is already well-off enough? Stakeholders’ conflicts over sustainable tourism development in remote communities. J. Place Manag. Dev. 2022, 15, 493–510. [Google Scholar] [CrossRef]
  104. Shoukat, M.H.; Sinha, R.; Elgammal, I.; Selem, K.M. Antecedents of nostalgia-related cultural tourism behavior: Evidence from visitors to pharaonic treasures city. J. Hosp. Tour. Insights 2024, 7, 2486–2503. [Google Scholar] [CrossRef]
  105. Khan, M.A.; Selem, K.M.; Elgammal, I.; Abdelhakim, A.S. AR-Enabled Safety Precautions and Employee Volunteerism in Fast-Food Restaurants: The Pivotal Role of Adoption Intention. Curr. Issues Tour. 2024, 1–21. [Google Scholar] [CrossRef]
Figure 1. Proposed research model.
Sustainability 17 04985 g001
Figure 2. Predicted growth of tourist arrivals in three selected countries until 2030.
Sustainability 17 04985 g002
Figure 3. ROC curve analysis for predicting perceived support for tourism development.
Sustainability 17 04985 g003
Figure 4. SHAP value distribution.
Sustainability 17 04985 g004
Figure 5. Principal component analysis.
Sustainability 17 04985 g005
Table 1. Respondents’ characteristics.
Serbia (N = 472)Kazakhstan (N = 465)Hungary (N = 450)Total (N = 1387)
Gender
Male217 (46.0%)212 (45.6%)204 (45.3%)633 (45.6%)
Female255 (54.0%)253 (54.4%)246 (54.7%)754 (54.4%)
Age
18–29178 (37.7%)166 (35.7%)162 (36.0%)506 (36.5%)
30–44148 (31.4%)145 (31.2%)136 (30.2%)429 (30.9%)
45–59108 (22.9%)112 (24.1%)108 (24.0%)328 (23.6%)
60+38 (8.0%)42 (9.0%)44 (9.8%)124 (8.9%)
Education
Primary education10 (2.1%)12 (2.6%)10 (2.2%)32 (2.3%)
Secondary education169 (35.8%)128 (27.5%)119 (26.4%)416 (30.0%)
Higher education293 (62.1%)325 (69.9%)321 (71.3%)939 (67.7%)
Employment
Employed278 (58.9%)295 (63.4%)287 (63.8%)860 (62.0%)
Unemployed108 (22.9%)105 (22.6%)91 (20.2%)304 (21.9%)
Student86 (18.2%)65 (14.0%)72 (16.0%)223 (16.1%)
Income
High24.5%30.4%40.5%31.8%
Medium50.2%50.2%46.3%48.9%
Low25.3%19.4%13.2%19.3%
Resident
Urban65.3%70.5%78.9%71.5%
Rural34.7%29.5%21.1%28.5%
Frequency of travel
More than 5 trips per year25.4%28.7%36.5%30.2%
1 to 5 trips per year47.8%48.5%44.2%46.8%
Fewer than 1 trip per year26.8%22.8%19.3%23.0%
Contact with tourists
Yes40.2%52.1%59.3%50.5%
No59.8%47.9%40.7%49.5%
Table 2. Summary of constructs and variables derived from the theoretical framework.
ConstructTheoretical Statements According to Social Exchange Theory Adapted Statements for the Research Relevant Authors
Benefits Perception
(BP)
People will support tourism if they perceive positive economic, social, or cultural benefits.1. Tourism in my area contributes to economic development, which is a core element of economic sustainability.
2. Tourism improves the quality of local infrastructure.
3. Tourism enhances cultural promotion and preservation.
Homans [64]; Blau [65]; Gursoy & Rutherford [18]; Nunkoo & Ramkissoon [74]; Wang & Pfister [75]; Chang et al. [76]
Costs
Perception
(CP)
If perceived costs (pollution, overcrowding, economic inequality) outweigh the benefits, opposition to tourism arises.1. Tourism causes an increase in real estate prices and services.
2. Tourism negatively impacts the natural environment.
3. Tourism disrupts the peace and privacy of residents.
Blau [65]; Ap [66]; Harrill [77]; Diedrich & García-Buades [78]; Rasoolimanesh et al. [79]; Kim et al. [80]
Local
Support
(SS)
Positive relationships between the community and tourists strengthen support for tourism.1. Local authorities adequately manage tourism development.
2. Communication between local residents and tourists is positive.
3. There is solidarity and cooperation within the community due to tourism.
Homans [64]; Nunkoo & Ramkissoon [74]; Gursoy et al. [18]; Wang & Pfister [81]; Stylidis et al. [82]; Rizal et al. [83]
Reciprocal Benefits
(RB)
If the community is given the opportunity to benefit from tourism, it is more likely to support its development.1. Tourism provides opportunities for employment and additional income.
2. There are economic benefits for local residents from tourism.
3. There is an opportunity to include local products in the tourism offer.
Homans [64]; Gursoy & Rutherford [18]; Stylidis et al. [82]; Rasoolimanesh et al. [79]; Ahmad et al. [84]
Cultural Identification
(CI)
If local culture is affirmed through tourism, support for its development increases.1. Tourism helps preserve cultural heritage.
2. Tourists show interest in local customs and traditions.
3. Local culture is positively promoted through tourism.
Blau [65]; Ap [66]; Gursoy et al. [18]; Stylidis et al. [82]; Rasoolimanesh et al. [79]; Wang et al. [81]; Fan et al. [85]
Support for Tourism Development (STD)Positive perceived benefits compared to costs lead to support for tourism development.1. I support the further development of tourism as a function of perceived economic impacts.
2. I am willing to promote the tourism offer of my community.
3.Tourism in my area is sustainable and contributes to overall well-being.
Homans [64]; Blau [65]; Gursoy & Rutherford [18]; Nunkoo & Ramkissoon [74]; Rasoolimanesh et al. [79]
Table 3. Sample distribution for EFA and CFA by country.
CountryTotal Number of
Respondents
EFA
(30% of Total Sample)
CFA
(70% of Total Sample)
SRB527158369
KAZ569171398
HUN614184430
Note: SRB—Serbia, KAZ—Kazakhstan, HUN—Hungary.
Table 4. Tourist arrivals for the period 2015–2023 (in millions).
YearSerbia (mil.)Kazakhstan (mil.)Hungary (mil.)
20151.2816.43048.345
20161.2816.50952.890
20171.4977.70154.962
20181.7108.78957.667
20191.8478.51561.397
20200.4982.03531.641
20210.8193.10036.688
20221.4094.50046.343
20231.5194.90049.403
Table 5. Validation parameters.
ParametersSerbiaKazakhstanHungary
R20.930.910.94
AIC320.4335.1298.7
BIC326.2341.0304.5
RMSE0.050.060.04
p-values<0.05<0.05<0.05
Durbin–Watson1.982.011.95
Table 6. Anticipated tourist arrivals (mil.).
YearSerbiaKazakhstanHungary
20151.2814.448.345
20161.2814.652.89
20171.4974.854.962
20181.714.957.667
20191.8475.261.397
20200.4983.131.641
20210.8193.836.688
20221.4094.546.343
20231.5194.949.403
20241.55550
20251.65.152
20261.655.254
20271.75.356
20281.755.458
20291.85.560
20301.855.662
Table 7. Results of what-if analysis.
YearSerbia ForecastSerbia Increase 10%Serbia Decrease 10%Kazakhstan ForecastKazakhstan Increase 10%Kazakhstan Decrease 10%Hungary ForecastHungary Increase 10%Hungary Decrease 10%
202516001760144050005500450050,00055,00045,000
202617001870153052005720468052,00057,20046,800
202718001980162054005940486054,00059,40048,600
202819002090171056006160504056,00061,60050,400
202920002200180058006380522058,00063,80052,200
203021002310189060006600540060,00066,00054,000
Table 8. Values of descriptive and factor analysis.
ConstructItemSRB (m)SRB (sd)SRB (α)SRB (λ)KAZ (m)KAZ (sd)KAZ (α)KAZ (λ)HUN (m)HUN (sd)HUN (α)HUN (λ)
BPTourism in my area contributes to economic development.4.3120.6270.8290.7414.1980.7210.8720.7194.4070.6020.8830.751
Tourism improves the quality of local infrastructure.4.1580.7210.8060.8024.0110.7890.8120.7344.4780.6840.8440.765
Tourism enhances cultural promotion and preservation.4.4760.6020.8530.7524.2150.7330.8630.7874.5360.6710.8130.769
CPTourism causes an increase in real estate prices and services.3.2690.8930.8500.7083.1980.9120.8040.7023.3890.8560.8270.731
Tourism negatively impacts the natural environment.3.4290.7560.8690.6843.3120.7810.8340.6893.4760.7920.8930.711
Tourism disrupts the peace and privacy of local residents.3.5010.8040.8060.7933.4080.8410.8000.7613.5230.8220.8660.755
LSLocal authorities adequately manage tourism development.3.9720.8450.8370.7683.8820.8920.8560.7554.0140.8310.8840.772
Communication between local residents and tourists is positive.4.0010.6740.8340.7984.0070.6670.8210.7944.0580.6890.8380.812
There is solidarity and cooperation within the community due to tourism.4.0880.7370.8140.7524.1160.7040.8770.7774.1710.7230.8290.789
RBTourism provides opportunities for employment and additional income.4.2370.5320.8790.7814.1230.5980.8670.7684.2670.5120.8810.784
There are economic benefits for local residents from tourism.4.1120.6780.8090.7314.1090.6540.8670.7514.2140.6450.8190.772
There is an opportunity to include local products in the tourism offer.4.1450.7390.8550.7924.1890.7240.8670.7854.2990.7010.8580.811
CITourism helps preserve cultural heritage.4.2650.6920.8620.7834.1420.7150.8700.7724.3810.6740.8780.795
Tourists show interest in local customs and traditions.4.2030.7240.8410.7694.0980.7520.8540.7514.2950.7120.8610.784
Local culture is positively promoted through tourism.4.3120.6760.8510.7884.2210.7020.8634.3120.6760.8510.7884.221
STDI support the further development of tourism in my area.4.2760.6090.9150.8244.2410.6320.9230.8174.3150.6110.9180.828
I am willing to promote the tourism offer of my community.4.2310.6210.9040.8374.2940.6170.9060.8394.3980.6030.9030.841
Tourism in my area is sustainable and contributes to overall well-being.4.3180.6420.9000.8014.3070.6590.9080.7924.3890.6320.9440.813
Table 9. Assessment of construct validity.
ConstructmsdαEigenvalues% VarianceCumulative %CRAVE
Serbia
BP4.2820.6500.8893.42834.28%34.28%0.9120.783
CP3.3990.8220.8562.94529.45%63.73%0.8790.701
LS4.0200.7860.8722.17721.77%85.50%0.8910.732
RB4.1870.6240.8791.90219.02%94.52%0.8740.711
CI4.1340.7030.8841.51015.10%96.12%0.8860.720
STD4.3040.6210.9151.30513.05%98.23%0.9180.750
Kazakhstan
BP4.1900.6210.8783.60136.01%36.01%0.9100.741
CP3.4500.7890.8602.80128.01%64.02%0.8820.795
LS4.0300.7900.8742.34023.40%87.42%0.8930.734
RB4.2100.6120.8821.93519.35%96.77%0.8770.713
CI4.1500.7020.8801.71017.10%98.87%0.8880.742
STD4.3150.6150.9191.40014.00%99.91%0.9210.781
Hungary
BP4.3120.6090.8903.75037.50%37.50%0.9160.748
CP3.4620.8100.8652.95429.54%67.04%0.8840.706
LS4.0400.7720.8802.40024.00%91.04%0.8950.755
RB4.2220.6010.8861.95019.50%98.54%0.8890.764
CI4.2100.7100.8921.54015.40%98.84%0.8940.723
STD4.3280.6050.9211.31513.15%100.00%0.9230.773
Table 10. Correlation analysis values.
ConstructsBPCPLSRBSTDCI
Serbia
BP1.0000.4670.4920.5280.5530.507
CP0.4671.0000.4250.4130.3980.374
LS0.4920.4251.0000.4620.4440.472
RB0.5280.4130.4621.0000.5350.494
STD0.5530.3980.4440.5351.0000.519
CI0.5070.3740.4720.4940.5191.000
Kazakhstan
BPCPLSRBSTDCI
BP1.0000.4550.4820.5200.5480.504
CP0.4551.0000.4160.4090.3950.371
LS0.4820.4161.0000.4670.4550.478
RB0.5200.4090.4671.0000.5310.499
STD0.5480.3950.4550.5311.0000.512
CI0.5040.3710.4780.4990.5121.000
Hungary
BPCPLSRBSTDCI
BP1.0000.4590.4970.5370.5620.522
CP0.4591.0000.4230.4160.4030.377
LS0.4970.4231.0000.4750.4630.480
RB0.5370.4160.4751.0000.5480.515
STD0.5620.4030.4630.5481.0000.528
CI0.5220.3770.4800.5150.5281.000
Table 11. Predictive power and effects on support for tourism development.
CountryConstruct R2Q2f2Direct EffectIndirect EffectTotal Effect
SerbiaSTD0.7180.5210.4670.5320.1240.656
KazakhstanSTD0.7040.5130.4420.5210.1180.639
HungarySTD0.7290.5290.4720.5450.1270.672
Table 12. Hypothesis testing and path analysis.
ConstructSerbiaKazakhstanHungary
βmsdtpβmsdtpβmsdtp
BP → STD0.3714.2820.6508.4530.0000.3674.2820.6218.3420.0000.3724.3120.6508.4780.000
CP → STD−0.2033.3990.822−3.2490.012−0.2153.3990.789−3.5210.010−0.2083.4620.822−3.4100.011
LS → STD0.3384.0200.7866.7210.0000.3414.0200.7906.7250.0000.3474.0400.7866.8560.000
RB → STD0.2824.1870.6245.1040.0050.2764.1870.6125.2110.0040.2844.2220.6245.3180.005
CI → STD0.2974.1050.6995.5670.0020.2994.1050.6745.7610.0020.3054.3000.6995.8120.002
BP × Mod-FT → STD0.1734.1500.6544.0220.0040.1484.1500.6353.2890.0090.1624.3100.6543.8700.007
BP × Mod-CT → STD0.2144.2200.6724.2610.0050.1914.2200.6713.7100.0120.2044.3200.6724.1340.006
CP × Mod-FT → STD−0.1273.1990.801−2.1490.032−0.1353.1990.799−2.3850.026−0.1223.4000.801−2.3520.041
CP × Mod-CT → STD−0.1013.4020.812−2.0210.047−0.1143.4020.811−2.0730.038−0.1093.4100.812−2.0910.050
LS × Mod-FT → STD0.1874.0600.7724.3210.0030.1784.0600.7803.9530.0080.1964.0300.7724.5720.004
LS × Mod-CT → STD0.2014.1150.7844.5650.0040.1944.1150.7704.1200.0070.2094.0500.7844.8000.005
RB × Mod-FT → STD0.1764.2000.6214.2210.0060.1584.2000.6193.9860.0090.1814.2300.6214.3240.005
RB × Mod-CT → STD0.1934.2500.6324.5210.0050.1834.2500.6254.2220.0070.1904.2700.6324.5110.006
CI × Mod-FT → STD0.1684.1800.6754.1120.0080.1754.1800.6624.0070.0060.1794.2900.6754.1240.008
CI × Mod-CT → STD0.2024.2100.6814.6340.0040.1984.2100.6714.5120.0050.1944.3100.6814.4880.004
Table 13. MGA analysis.
ConstructΔβ (SRB-KAZ)Δt (SRB-KAZ)Δp (SRB-KAZ)Significance (SRB-KAZ)Δβ (SRB-HUN)Δt (SRB-HUN)Δp (SRB-HUN)Significance (SRB-HUN)Q2 (SRB)Q2 (KAZ)Q2 (HUN)f2 (SRB)f2 (KAZ)f2 (HUN)
BP → STD0.0042.7890.006Significant0.0072.9010.005Significant0.2820.2760.2980.3150.3090.328
CP → STD0.0122.8530.005Significant0.0153.0120.004Significant0.1980.1910.2040.1920.1860.194
LS → STD0.0082.7620.007Significant0.0092.8010.006Significant0.3100.3050.3180.3340.3280.339
RB → STD0.0172.9450.004Significant0.0162.9100.005Significant0.2410.2380.2490.2220.2180.227
CI → STD0.0192.9710.004Significant0.0152.9230.004Significant0.2890.2830.2950.3080.3020.313
BP × Mod-FT → STD0.0213.0120.003Significant0.0182.9810.003Significant0.2620.2570.2690.2910.2840.296
BP × Mod-CT → STD0.0162.9020.004Significant0.0142.8750.005Significant0.2750.2700.2820.2940.2870.298
CP × Mod-FT → STD0.0203.0050.003Significant0.0192.9920.003Significant0.2160.2100.2230.2380.2320.244
CP × Mod-CT → STD0.0182.9740.004Significant0.0172.9510.004Significant0.2030.1980.2090.2190.2140.223
LS × Mod-FT → STD0.0223.1030.002Significant0.0203.0670.002Significant0.3070.3020.3140.3360.3300.341
LS × Mod-CT → STD0.0152.8650.005Significant0.0142.8320.005Significant0.2980.2920.3030.3180.3120.325
RB × Mod-FT → STD0.0193.0220.003Significant0.0183.0090.003Significant0.2480.2420.2580.2320.2270.240
RB × Mod-CT → STD0.0203.0450.002Significant0.0213.0780.002Significant0.2560.2500.2650.2350.2300.240
CI × Mod-FT → STD0.0182.9840.004Significant0.0172.9520.004Significant0.2950.2900.3050.3100.3050.320
CI × Mod-CT → STD0.0193.0120.003Significant0.0203.0890.002Significant0.3080.3020.3180.3280.3220.340
Table 14. Random Forest metrics.
MetricSerbiaKazakhstanHungary
Accuracy0.8750.8680.872
Precision0.8430.8390.846
Recall0.8560.8500.860
F1-score0.8490.8440.853
AUC-ROC0.8920.8880.895
Table 15. Variable importance analysis.
VariablesSerbia (Importance)Kazakhstan (Importance)Hungary (Importance)
Benefits Perception (BP)0.2180.2070.223
Costs Perception (CP)0.1640.1570.166
Local Support (LS)0.2040.1980.209
Reciprocal Benefits (RB)0.1890.1860.191
Cultural Identification (CI)0.2250.2230.211
Table 16. Confusion matrix.
Actual/PredictedPositive (STD)Negative (STD)
Positive (STD)782118
Negative (STD)124764
Table 17. K-means clustering.
ClusterSampleDominant Characteristics
1480Highly positive perceptions of benefits
2525Balanced perceptions of benefits and costs
3382Negative perceptions due to high costs
Disclaimer/Publisher’s Note: The statements, opinions and data contained in all publications are solely those of the individual author(s) and contributor(s) and not of MDPI and/or the editor(s). MDPI and/or the editor(s) disclaim responsibility for any injury to people or property resulting from any ideas, methods, instructions or products referred to in the content.

