1. Introduction
Governments and energy policy makers must make choices to encourage and deploy different sources of energy and appropriate sustainable technologies. In the modern era, there is a tremendous amount of information describing the cost effectiveness, life cycle, and impacts of different schemes. The complexity of decisions grows as the primary objective of security of supply (sufficient power at the time it is needed) has to be assessed for its sustainability by examining economics (minimizing cost while still supporting a range of sectors), environmental protection (currently dominated by climate change, but still covering toxicity and conservation), and societal interests (affordability, jobs, and public perception). Most decisions need to be transparent, well-argued, and backed by rigorous analyses. Our analyses aim to compare disparate schemes by creating rankings that ease decision making, justify selections, and infer a level playing field.
Levelised Cost of Energy (LCOE) is one of the commonly used metrics that estimates the whole life costs of electricity for a technology and energy source. The calculation expresses a scheme’s total discounted costs divided by the total discounted electricity generated over its lifecycle. However, as with all comprehensive metrics, the problems and issues arise from specific components; as they say in Britain, ‘the devil is in the detail’.
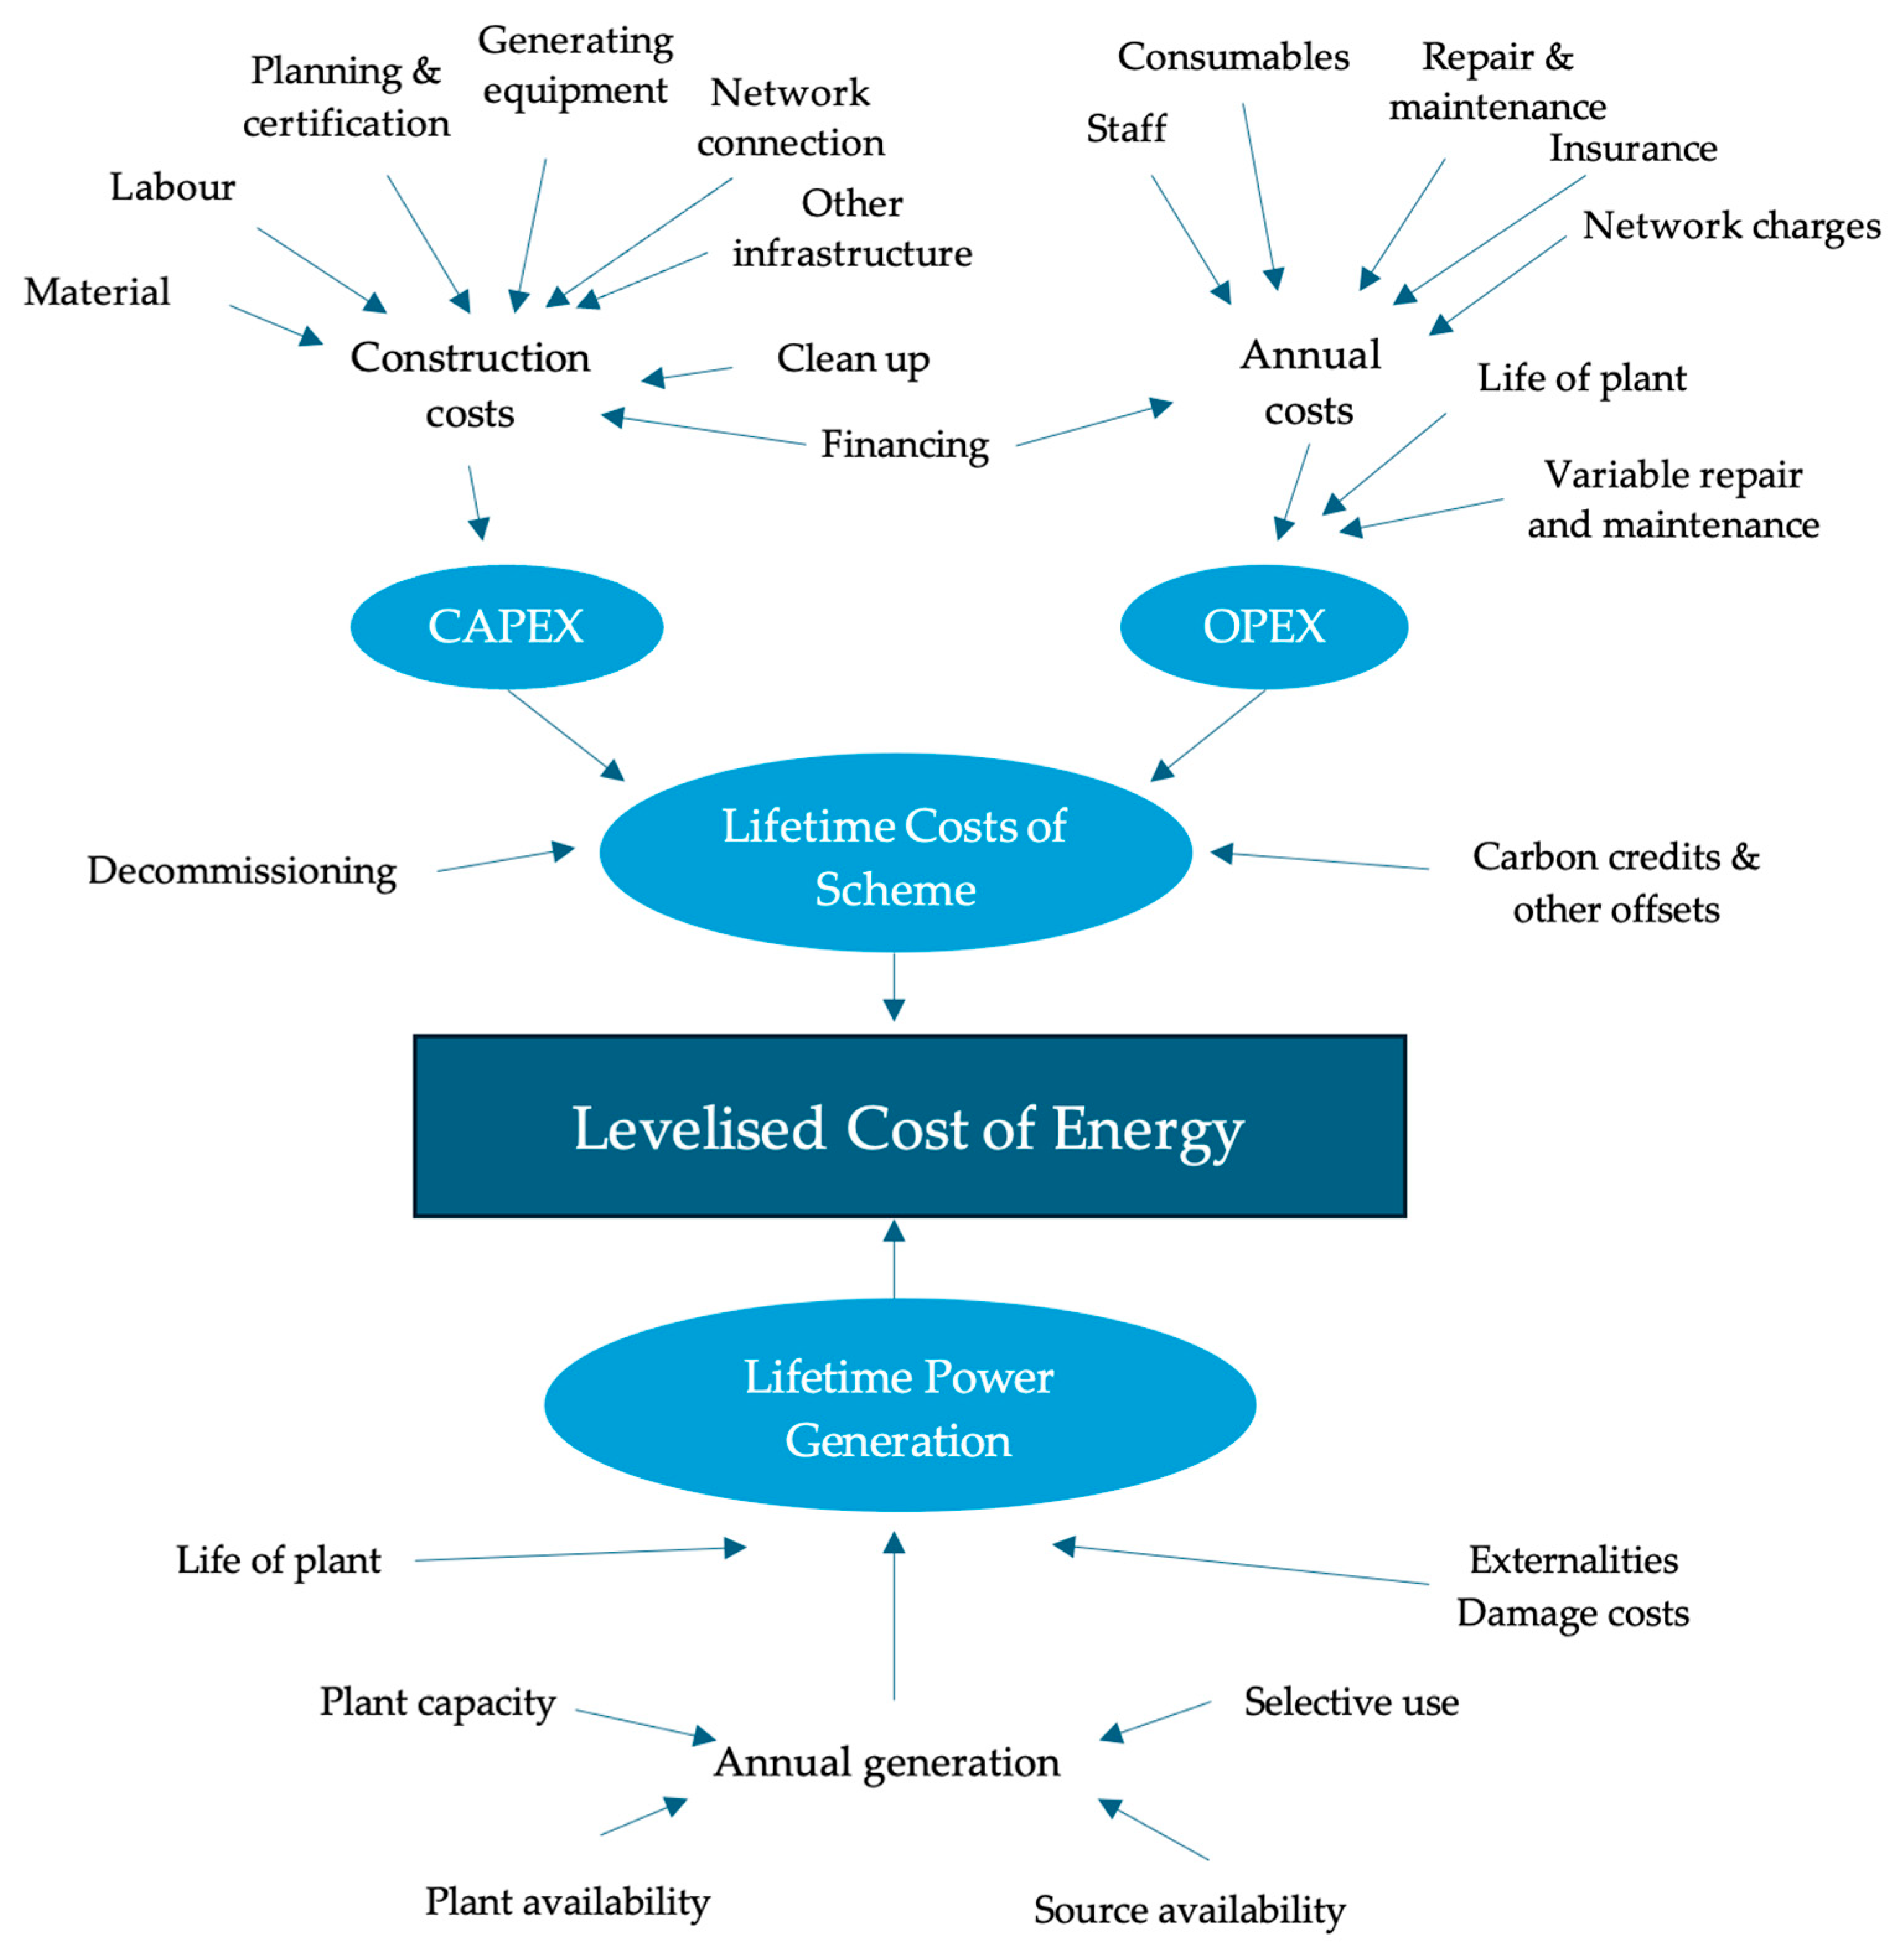
Figure 1 shows that both costs and energy production are complex systems where each of the components have sub-components. Those sub-components are complex and independently dynamic, making their valuation challenging. The costs are divided into the capital needed for commissioning (CAPEX) and the annual operating costs (OPEX), so factors arising from temporal properties (inflation, interest, deterioration, etc.) influence their integration.
The approach was originally intended to compare schemes of similar technology and lifetimes. It developed from studies of the externalities of energy in the 1990s (e.g., ExternE [
1]) and started to become popular in the early 2000s. During the early years, academics discussed the intricacies and capabilities of the approach [
2,
3], but it was used in earnest by administrators, such as the California Energy Commission [
4].
Increasingly, LCOE is being used to compare all technologies despite their different characteristics, scales, and lifetimes. The goal remains to identify the most cost-effective style of scheme and energy source. There are well known risks to this approach, as manipulating assumptions can affect the outcomes and lead to questions of bias.
The usefulness of the LCOE has been questioned by several authors over recent years. In 2017, Beiter [
5] quoted the warning from the US Energy Information Administration that “LCOE is not a useful tool to compare the cost of different generation options, unless the options being compared have substantially similar operational profiles and system values”.
In 2019, Aldersey-Williams et al. [
6] found that most estimates of LCOE used existing public domain data and that this was “… potentially inaccurate, inconsistent, and possibly susceptible to massaging in support of a political or commercial agenda”. They proposed better estimates of LCOE could be obtained from published company accounts and gave examples for UK offshore wind farms and a combined cycle gas turbine (CCGT), where despite the expected LCOE of the CCGT being lower, it had a substantially higher risk due to fuel costs.
In 2021, Aldersey-Williams et al. [
7] stated “… using the LCOE as a proxy for the electricity price required by the project to generate a return is not reliable”. In 2022, Loth et al. [
8], stated, “LCOE does not consider differences for when electricity is generated, nor the dispatchability of that generation”.
In 2023, Guo et al. [
9] published a critical review of LCOE in which they examined scenarios of the undiscounted, half-discounted, and discounted cost models. In the half-discounted model, the costs are discounted but not the annual energy production (AEP). They introduced a techno-economic appraisal model in which the discounted annual costs were calculated as revenue from electricity sales minus the CAPEX and OPEX costs. Their conclusion was that “...non-technological costs should be incorporated into the LCOE; for instance, inflation and price fluctuations are not included in the general analysis”. However, their analysis was solely based on wave energy converters so did not consider technologies with dissimilar lifespans.
Currently, there is no internationally agreed approach for LCOE [
10], although a number of reputable organisations publish their versions (e.g., Ocean Energy Systems [
11] and Lazards [
12]). The approach uses the Net Present Value (NPV) of the CAPEX and total OPEX across the lifetime of the project divided by the total predicted electricity generated across its lifetime. Whilst the LCOE model avoids speculation about future electricity prices, it does make an allowance for time by using a discount rate. It serves as an expectation as to whether the project is economically viable and allows high level strategic decisions over energy sources to be made. There is a complex set of cost areas to be included in the analysis shown in
Figure 1. The figure attempts to cover all components, but the costs may be crudely estimated. For renewables, such as wind and solar, intermittency adds temporal uncertainty to the energy available for conversion but removes fuel cost uncertainty. Thus, LCOE calculations can only be regarded as an approximate guide to the cost/benefit of different technologies. Levelised costs are highly sensitive to the underlying data and assumptions used, including those around capital costs, fuel prices, carbon costs, operating costs, load factors, and discount rates. The UK government Department for Business Energy & Industrial Strategy (BEIS) report [
13] publishes point estimates of LCOE, but refer to Mott McDonald report [
14] as more appropriately considering a range of cost estimates.
The internal rate of return (IRR) [
15,
16] is another metric employed to determine the value of a project by balancing costs and revenues. By estimating rates rather than financial values, it provides investors with the ability to ensure that their capital investments are sufficiently profitable relative to their cost of capital.
Here, we propose a new metric, the sustained cost of energy (SCOE) that avoids discounting and comparing all technologies over equivalent operational timespans. In the examples presented, the cost of generating power over a fixed period of continuous generation that matches the lifespan of the longest technology is estimated. Thus, one tidal range scheme (120 years) is compared with two consecutive nuclear schemes (2 × 60 years) or four consecutive CCGT power stations (4 × 30 years). The approach allows schemes of different operating lives to be more equitably compared based on SCOE and IRR. Operational lifespans are taken from DESNZ report 2023 [
17], except for tidal range, which is taken from [
18].
The goal of our paper is to examine the three forms of analysis and investigate the robustness of outcomes. We will show how consistent the ratings of divergent technologies are using recent national data describing the United Kingdom (UK). Although many people think of Bruntland [
19], in his definitive report for the United Nations (UN), as the creator of the three pillars of sustainability, it was his definition of sustainability that underpins the UN Sustainable Development Goals (SDG) [
20]. We believe that SCOE improves the assessment of his definition “meeting the needs of the present without compromising the ability of future generations to meet their own needs”. SCOE employs an economic approach that incorporates environmental and social pillars. The relationship between renewable energy and SDGs is well recognised [
21], but the gaps in our knowledge prevent greater insights into the different dimensions of sustainability.
UK Sources of Electricity Generation
Before making a comparison, it is valuable to consider the existing UK energy system, the source of data for our case study. While our analysis is specific to the UK, we believe it is transferable to other developed nations with a diverse portfolio of energy sources, including the USA and EU states. The installed generation capacity for the UK by fuel is published every year in the Digest of UK Energy Statistics (DUKES) [
22];
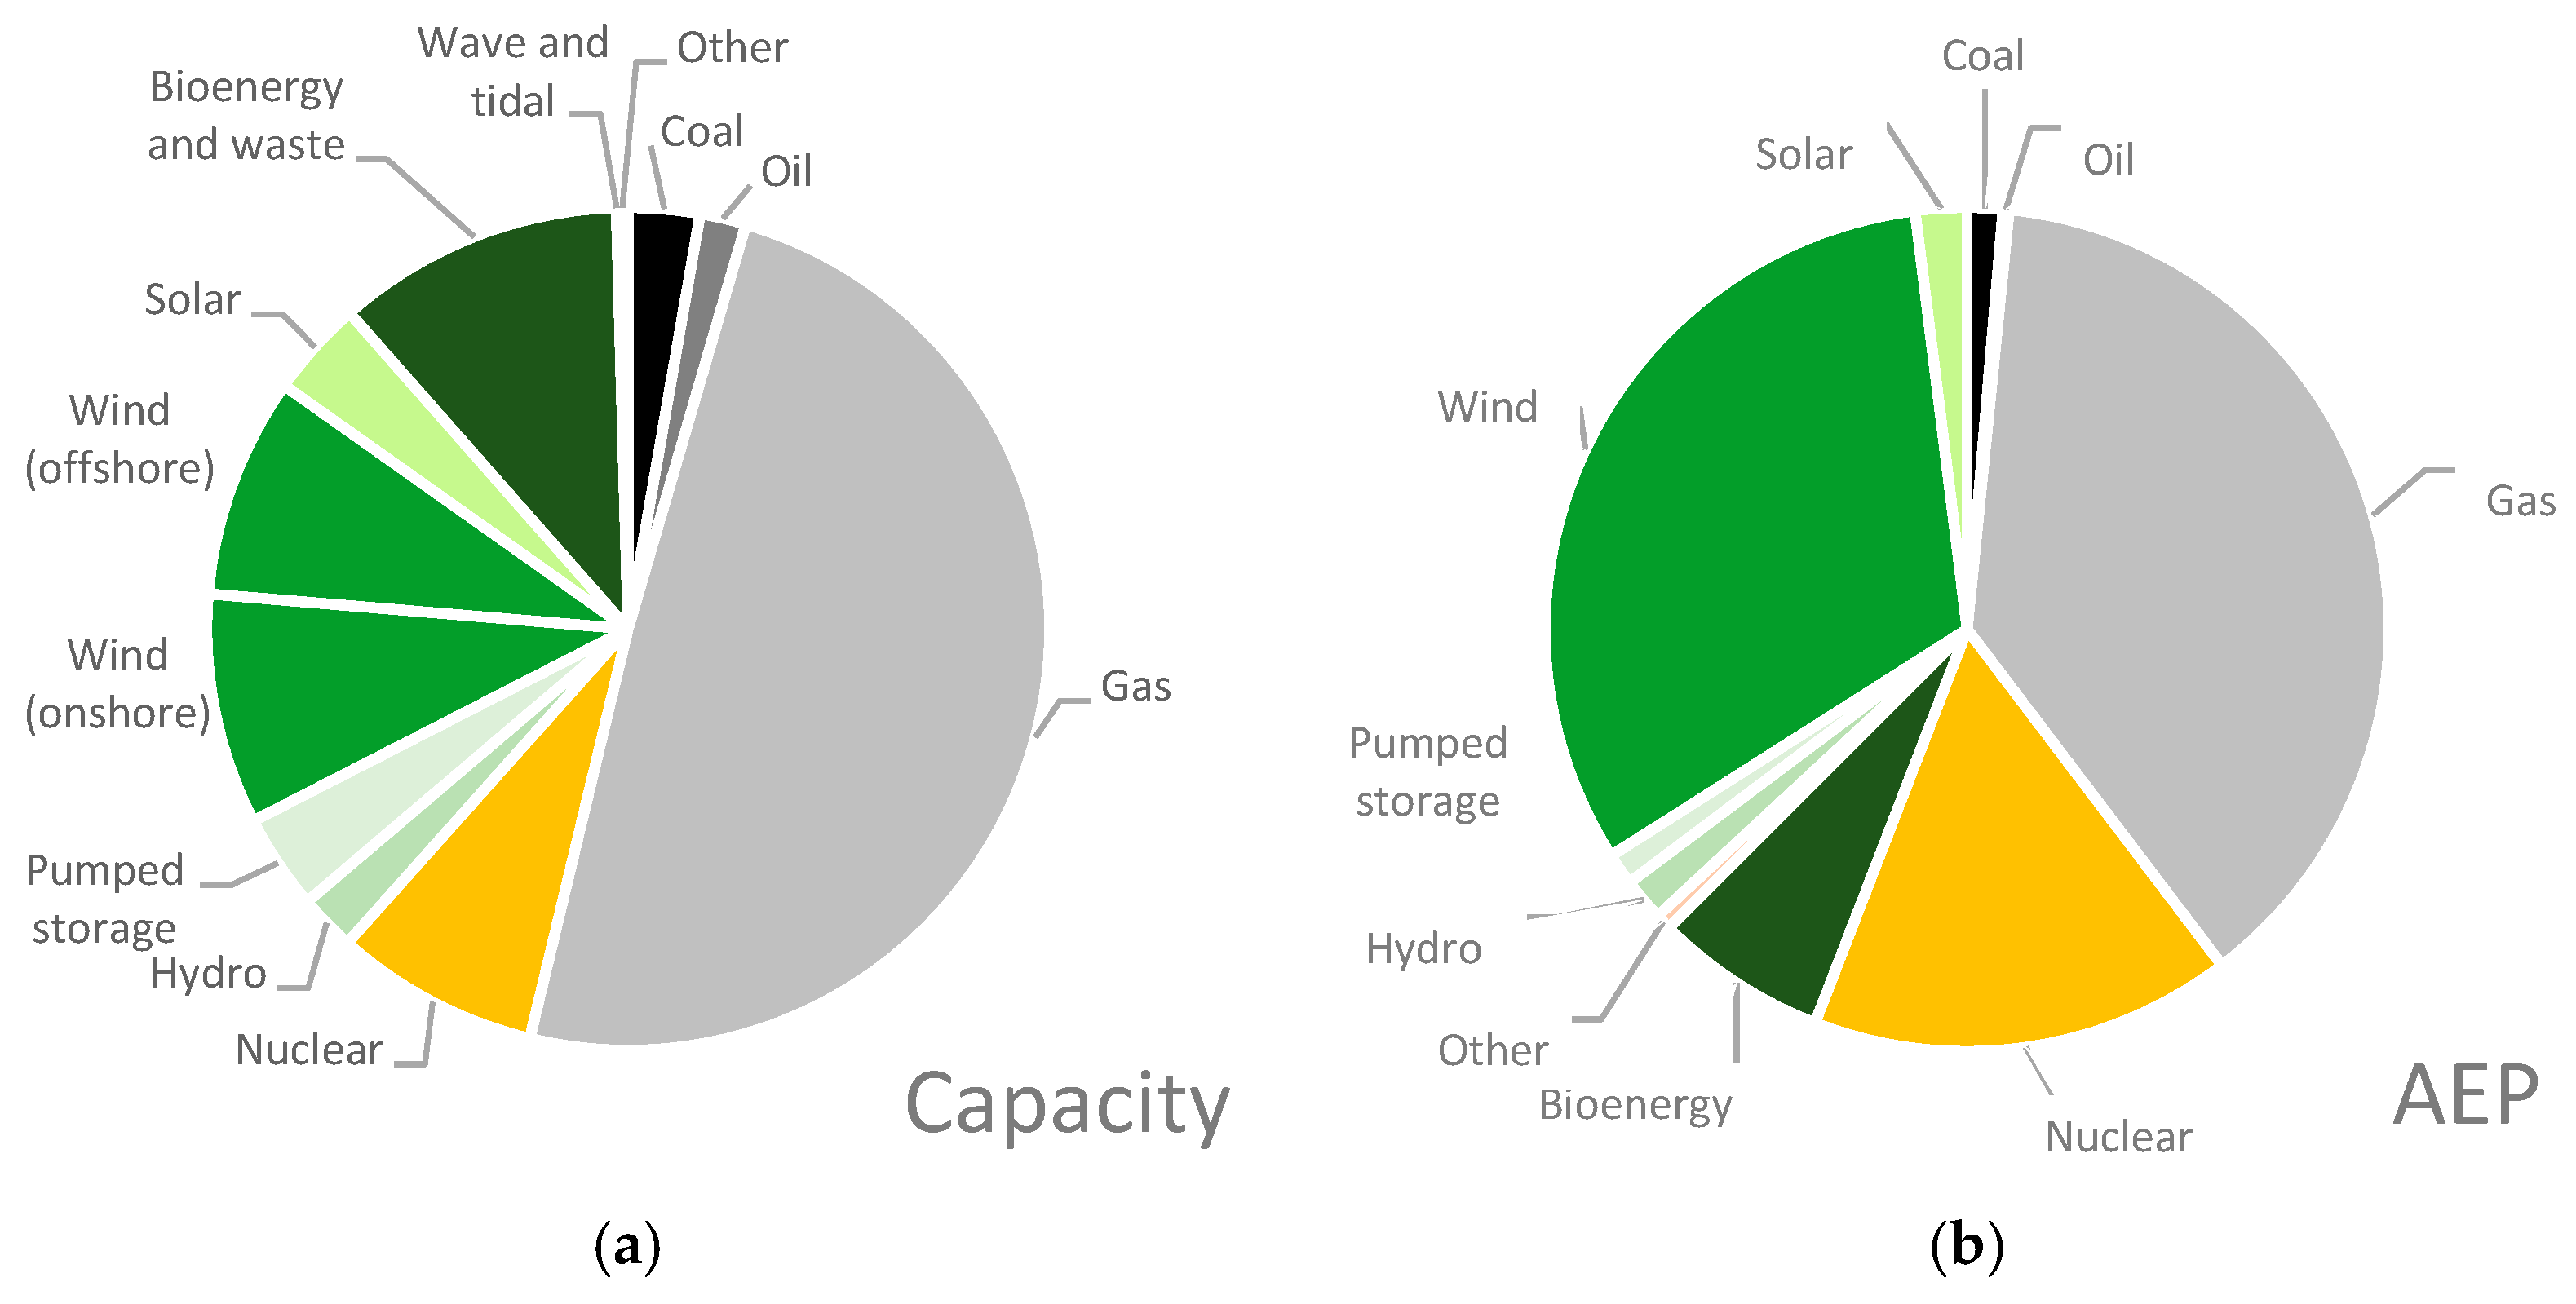
Figure 2 shows the composition of Britain’s electricity system for 2023 in terms of installed capacity and annual electricity production (AEP). The UK system is not independent but has links through seven international high-voltage direct-current cable interconnectors, which import and export electricity to nearby regions, namely Ireland, France, and Norway.
The capacity in 2023 was 75 GW, and the AEP was 273 TWh [
22]. However, the importance is not in the values per se but the relationship between the proportion of the different components. Gas has a higher proportion of the capacity than its AEP, while nuclear and wind are the opposite, generating a greater proportion than their capacity.
It is important to recognise the characteristics and roles different technologies play in UK’s unified national electricity structure, as it helps define their value. The composition of the generating network changes in response to different drivers, but with the primary goal of meeting the dynamic demand for electricity from all groups in the UK. The effort is primarily targeted at dynamic generation that attempts to match demand; if an excess is generated, it must immediately be exported and converted into another form of energy for storage, or it is lost. There are several methods of storage, such as:
Pumping water from a lower reservoir to an upper one when an excess of power is available, to be released to drive turbines when power is needed (pumped storage);
Battery storage for short bursts of electricity while other forms of generation are being started.
The contrast between the installed capacity and AEP in
Figure 2 is important in reflecting not only the load factors in
Table 1, but also the different components of the overall cost. The capacity gives an indication of where the capital has been invested, although its current value is dependent on the years remaining in the facilities’ life. The AEP is a surrogate for the operational energy production for the year. The load factor is the proportion of a system’s maximum power generation that is delivered over a fixed period (Equation (1)). The load factor can indicate the efficiency of the system by comparing the maximum actual use or efficiency at energy conversion with its capacity:
The actual amount of power generated by a technology is determined by a number of factors, but predominantly its availability (solar cannot generate at night, wind in still air, etc.), its efficiency in handling sub-optimal source conditions (low flow for hydro schemes, variation in tidal stream, etc.), and choice of operation of the system (e.g., pumped hydro for peaking).
The load factor alone does not define the role of the different technologies. Availability to deliver on demand across the day is also fundamental, as well as minimizing system maintenance to take power plants temporarily offline. Traditionally, plants using traditional fuels are classified as either base load or ‘peaking’, with the latter reflecting the ability to ramp generation up and down and respond to short-term peaks in demand. Nuclear are base-load plants whilst open cycle gas turbines (OCGT) are typical ‘peaking’ plants.
Changes in installed capacity tend to be gradual and stepped as the facilities are large, relatively long lived, and take time and money to install.
Figure 3 shows how the system generation has evolved over the last quarter of a century in the UK with the decline of coal and oil, expansion of gas, and the emergence of sustainable renewable technologies.
The period shown in
Figure 3 represents the expansion of the use of LCOE in decision making, and its appearance is, in part, determined by decisions informed by such statistics. The data used in the analyses are published for transparency and the objectives form government policy published through white papers and passed into statute. The government does not own the energy system, so does not direct its operation, instead it use economic carrots (subsidies) and sticks (taxes).
The system, data, and forms of analysis are the basis of the investigations presented here. Our objectives are to examine the effectiveness of the analyses in making sustainable decisions. We are not intending to generate a comprehensive review of all power sources, not even for the UK, but to demonstrate how time, an important component of sustainability, is overlooked currently.
The drivers of change can be interpreted from the UK government’s policies, updated periodically. The current dominant drivers are security of supply, environmental protection (reduction of greenhouse emissions), support and development of the economy, and safeguarding society. The most recent white paper [
23] embodies current policy and promotes generation through wind, nuclear, bioenergy, and the application of carbon capture use and storage (CCUS).
The Materials and Methods section is subdivided into three components. First, the data structure is described, giving an overview of the form of the data and the technologies selected. Second, the costs are presented for each technology. Further details are provided on the sources of data not published by DESNZ [
24]. Finally, the Methods section covers the forms of analysis used, including a description of the novel approach. Results are presented in the form of a comparison of rankings of technologies followed by a discussion and conclusions.
2. Materials—Data Structure
Financial analysis requires annual costs for each technology over the lifetime of the projects. The sum of development and construction costs is called capital expenditure (CAPEX) and is spread over each year of the development and construction period, although usually not equally. To enable comparisons, the CAPEX cost is divided by the installed capacity of the plant to give a cost per Megawatt (GBP/MW).
Once construction is complete, the main costs are classed as operational (OPEX). These are sub-divided into fixed and variable operational and maintenance (OM) costs. Fixed costs are from staff, insurance, connection charges etc. For comparison, these costs are also divided by the installed capacity to give GBP/MW. The variable OM costs relate to generating hours such as mechanical and electrical maintenance. For comparison these costs are divided by the annual electricity production (AEP) to give GBP/MWh.
Fuel is an operating cost but is considered separately, as most renewable energy has zero fuel costs. The UK Department of Energy Security and Net Zero (DESNZ) figures also include an estimated carbon cost assumed to apply to fossil fuels by 2030 [
24]. Both these are divided by AEP to give GBP/MWh. Finally, decommissioning and demolition costs are given as cost per installed capacity. These are most significant for nuclear power as discussed later. Annual costs were entered into a spreadsheet where each column represents a year of project life and each row a different technology. They were then discounted to give an estimated LCOE. The spreadsheet is available upon request.
The UK government’s DESNZ 2023 report contains the most recently published figures [
24] and provides data describing 41 generation technologies. We selected seven of their technologies for our analysis to represent a mixture of existing and emerging technologies. They include the commonly used combined cycle gas turbines (CCGT) as well as an assortment of renewable technologies, and are shown below:
Three other technologies that are absent from the UK 2023 report were also included, namely nuclear fission, tidal barrage, and coastal lagoon. Their inclusion creates a more comprehensive analysis of existing and emerging clean energy production technologies and extends the range of technology lifespans.
The technologies were selected to represent a range of characteristics that are common in the UK energy system as shown in
Figure 3. Gas is at present dominant, but for comparison a different fuel using the same combustion system was included. Despite not being in the latest government statistics, nuclear was included, as it is still under consideration for future power and has a long lifespan. Wind is the renewable source that provides the greatest annual power; only offshore forms were included, as that is where current expansion is being considered. Solar represents relatively short-term renewables, and four different marine options were included, as UK is well situated for their exploitation.
It would have been good to include more technologies if the aim was to investigate their differences. Hydro is interesting, but at present there seems little chance of any new large-scale system; governments do not commonly include small run-of-the-river schemes in their planning. Where there does seem to be an opportunity for hydro is in pumped storage; however, it is predominantly a storage system using electricity as its source.
Nuclear power (fission) was last included in the BEIS 2016 report [
13], but has since been omitted on the grounds that costs are commercially confidential. We used historical data from that report updated with published figures describing increased capital costs and construction duration [
13]. The update removes the cost optimism from earlier cost estimates of nuclear to provide a more unbiased cost estimate. Tidal range technologies have been included it in our study as examples of long-life systems. Cost estimates use published data that have been used to compare the two different tidal range technologies: estuarine barrage and coastal lagoon [
18].
4. Methods
All the analyses were carried out using Microsoft Excel spreadsheets with its built-in IRR formula. All spreadsheets are included in the
supplementary data or can be obtained from the corresponding author. Each column in the spreadsheets represents one year of costs, and for the IRR analysis, revenue is included. Costs are handled in the same way as revenue and are indexed to assumed inflation rates. The data are those that are used by the UK government and are not qualified by error terms; we are attempting to mimic government analyses.
4.1. Levelised Cost of Energy
LCOE was estimated for two tidal range case studies by Vandercruyssen et al. [
18]. To make these studies compatible with other forms of generation, the LCOE was structured over three periods of 40 years. The costs for the second and third periods were approximately half (57%) of those for the first 40 years. Costs for the later periods included replacement or refurbishment of the turbines and electrical equipment, but the barrage structure was estimated to require only 10% of its construction cost for repairs or extension in subsequent 40-year periods.
In contradiction to the US Energy Information Administration, the UK DECC [
14] describes LCOE as “a straightforward way of consistently comparing the costs of different generating technologies with different characteristics”. It provides data, additional estimates, and key assumptions that allow LCOE to be calculated along with worked examples. Further information on how levelised costs are calculated, the component categories, and the Department’s Levelised Cost Model are available from the Mott McDonald report [
14]. The DESNZ equation for LCOE is given in Equation (4).
Ocean Energy Systems (OES) investigated various LCOE models and adopted the same method as UK DESNZ for ocean systems [
11]. They gave examples of tidal stream, wave energy, and ocean thermal energy conversion (OTEC). They included a discount rate (r) to balance out the effect of schemes with different lifespans over the lifetime of the project (N-years). OES assumed a discount rate of 10% as contingency for emerging technologies and 5% for proven technology. Note that inflation is considered part of the discount rate.
In Equation (4) for LCOE, terms are defined as follows:
CAPEX = capital expenditure;
OPEX = annual operating expenditure;
AEP = annual electricity produced;
N = number of operating years;
r = discount rate.
The positive discount rate assumes that the same money spent in the future is not as valuable as the initial expenditure. It also reflects project risk, as suggested by Titman and Martin (2010) [
35]. In the case of UK national infrastructure projects, some or all the capital outlay may come from taxpayers, customers, or private investors. So, the discount rate represents risk-adjusted cost of capital that may include a mix of public and private funds in the form of equity and debt financing. We note that applying the discount rate to AEP seems dubious as this is not a monetary value, but the value of the amount of electricity generated, which is unlikely to decline. Nevertheless, the following LCOE calculations are based on Equation (4) but with various discount rates, including zero. Please see the
supplementary material for examples of the LCOE spreadsheet calculations, which are based on the DESNZ 2023 report. The results for the various technologies and discount rates are shown in
Table 3.
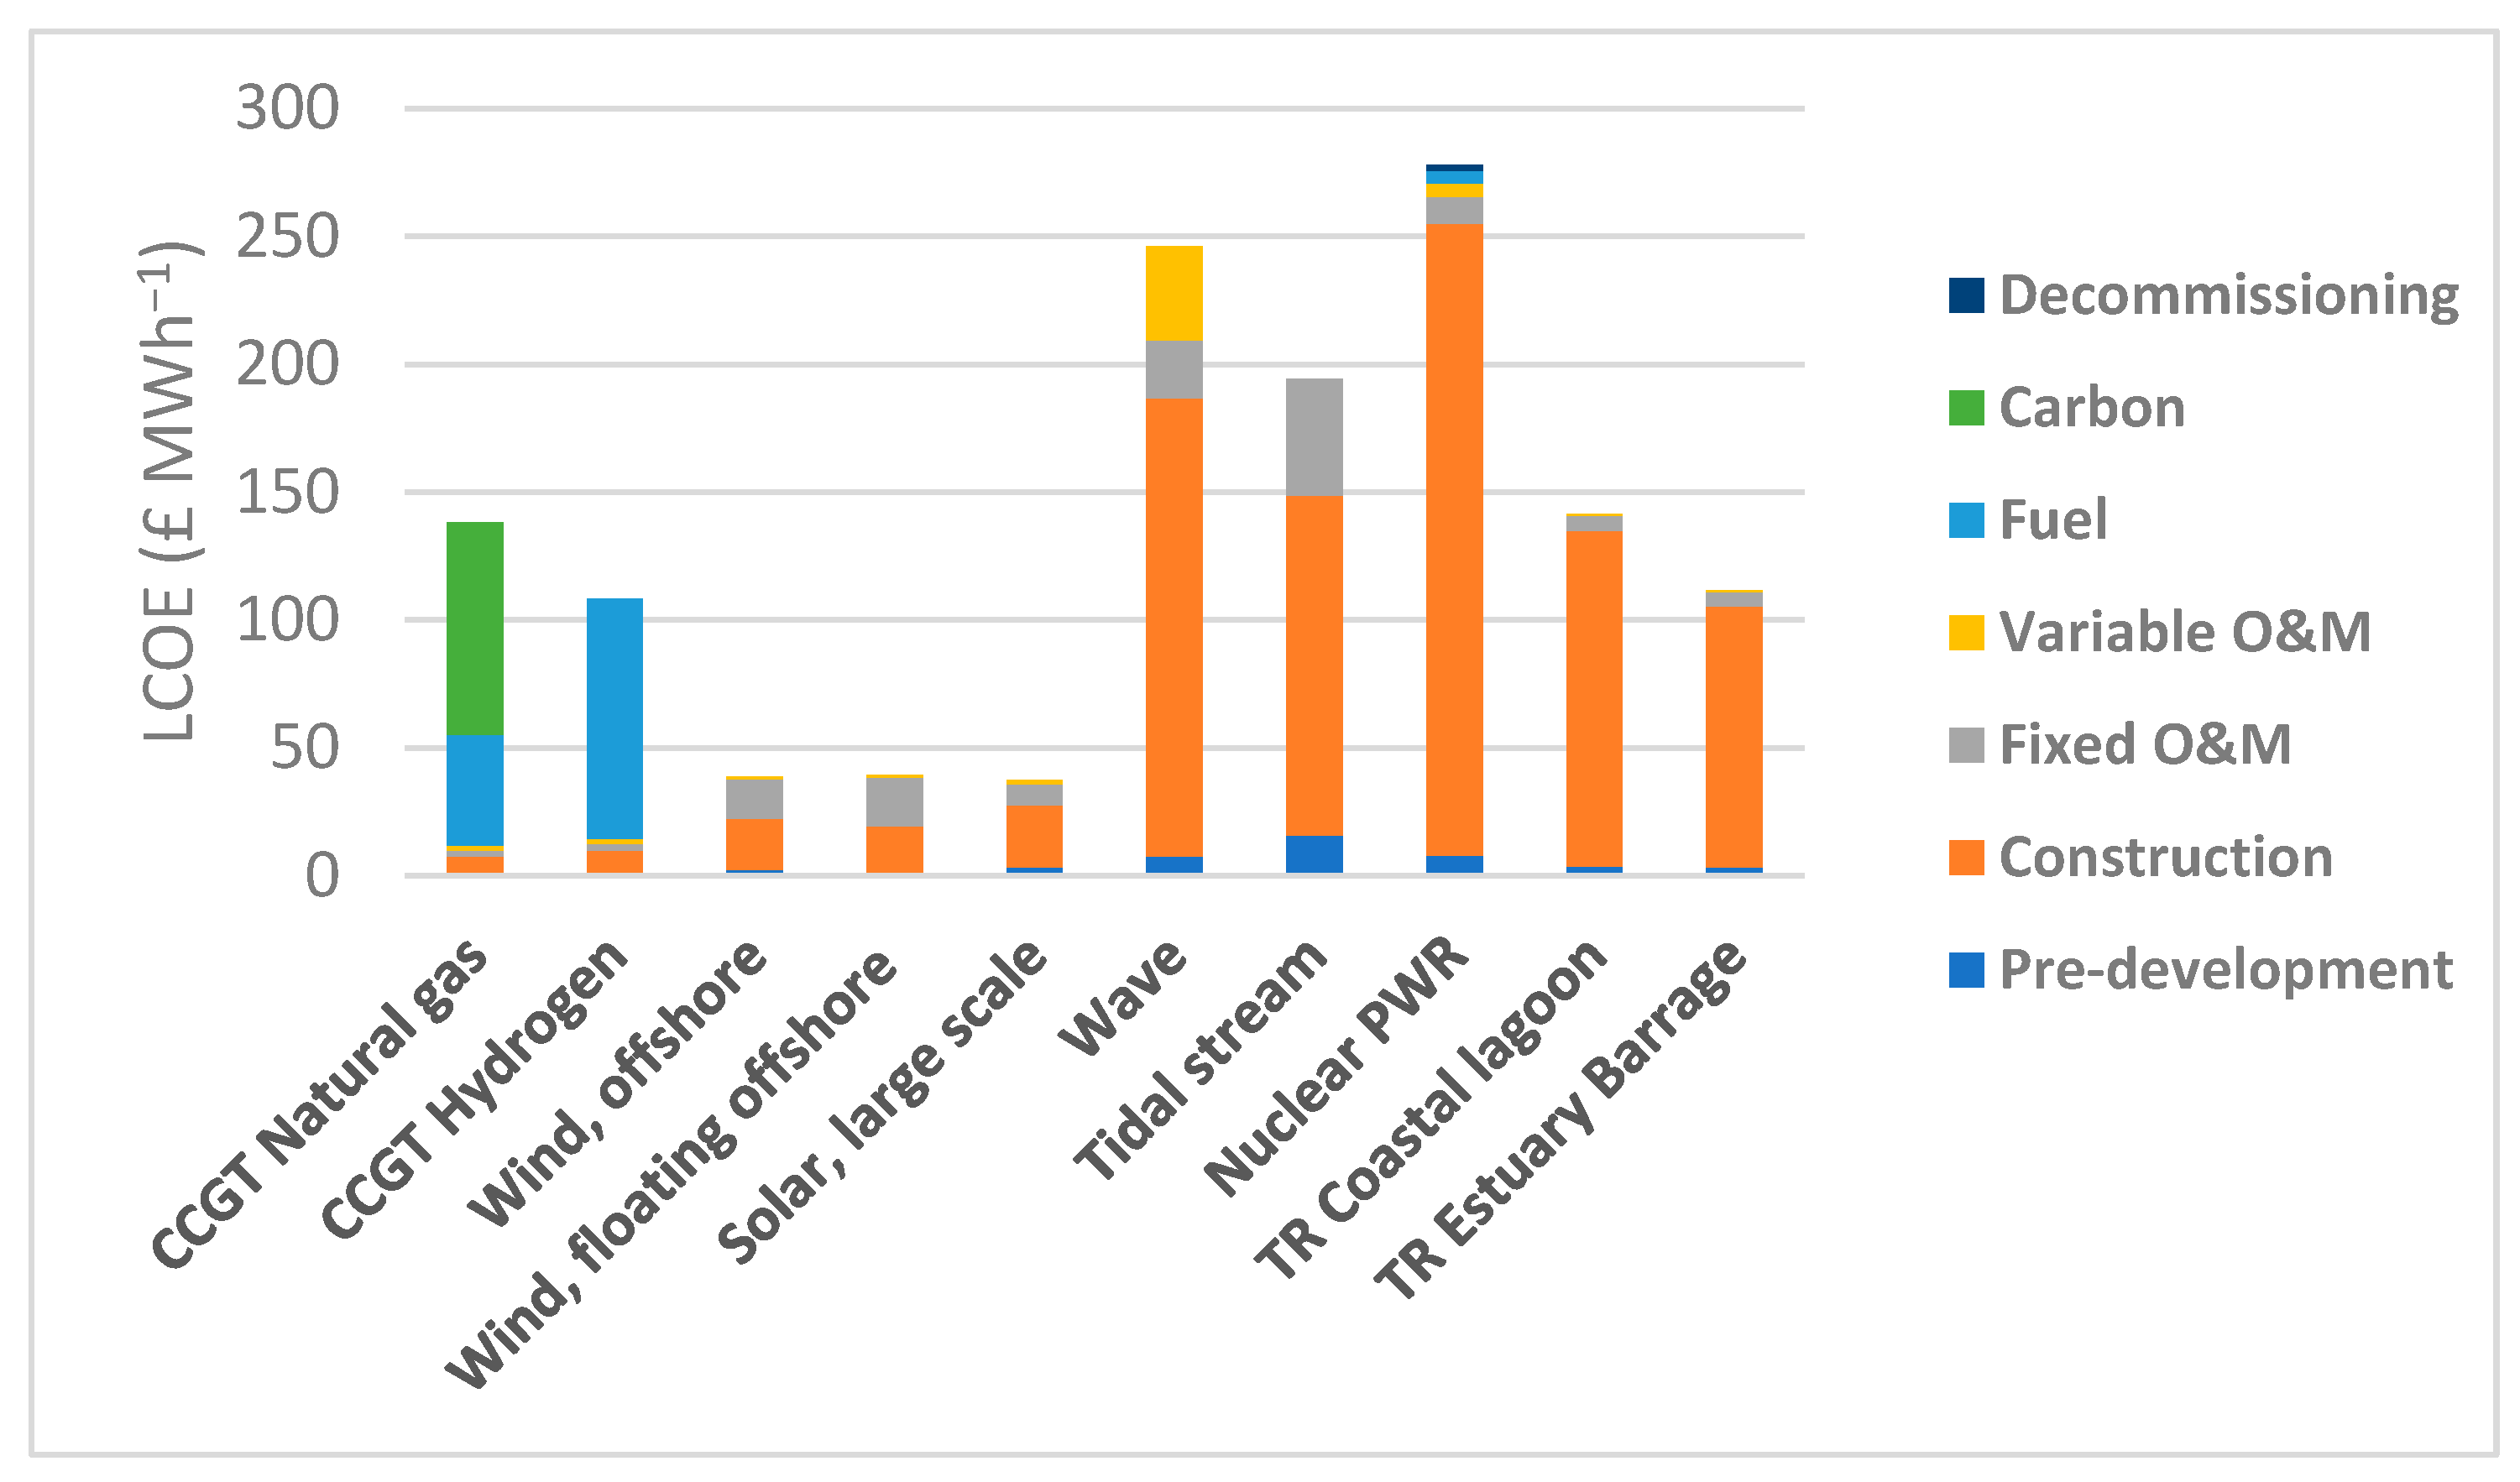
The LCOEs derived from the data in
Table 3 are presented in
Figure 5, broken down into specific components. Wind (offshore fixed and offshore floating) and large-scale solar have the lowest LCOE, whilst nuclear, wave, and tidal stream are the highest. Carbon costs make gas more expensive than hydrogen to power CCGTs, despite hydrogen as a fuel costing double that of gas.
The LCOE values produced by DESNZ are based on the specific discount rate at which each technology is commercially viable, which is known as the hurdle rate. Thus, it is difficult to make comparisons where projects receive public funds, as they confound the discount rate.
Figure 6 shows LCOEs for each technology at specific discount rates. The LCOE reduces with lower discounting because the AEP is considered constant for the lifetime of the plant, whilst the CAPEX impacts the first few years. The sensitivity of the analyses is demonstrated by changes in the ranking of schemes with different discount rates. With no discounting, large scale solar is cheapest, closely followed by offshore wind. The most expensive technology for higher discount rates is nuclear, although it is competitive without discounting.
Issues and Limitations of LCOE
LCOE is often considered to be subjective due to the complexity and dynamic nature of the data. The assumptions of each analysis are fundamental to comparison of any two sets of output and largely focus on the values selected for each variable; for the analyses carried out here, the DESNZ assumptions are used [
17].
Hurdle rates define the minimum rate of return required for each technology to be economically viable, based on perceived risk. For technologies discussed here, these rates range from 6.3% for offshore wind to 9.4% for nuclear.
The LCOE is sensitive to the discount rate and is used to balance the operational lives of different technologies. However, its application can be both subjective and inappropriate for some phases of development, making its application of limited value. More especially, discounting non-financial metrics such as the annual electricity generation is inconsistent with generation not degrading over time.
In UK government assessments, discounting starts from the beginning of the pre-development phase, favouring projects with long pre-development periods with deferred costs. For example, the nuclear, tidal stream, and offshore winds have the longest development periods, of 5 years. With a discount rate of 7.5% per year, the costs at start of construction are only 70% of their value on day 1. As the pre-development cost represents such a small part of the whole scheme, would it not be better to discount from the start of construction?
Of the seven technologies we considered from DESNZ 2023, offshore wind, floating offshore wind, and solar have the lowest LCOE. However, these assume average load factors of 65% and 69% for offshore and floating offshore wind, which seems very optimistic, as winds speeds can be variable over relatively short periods.
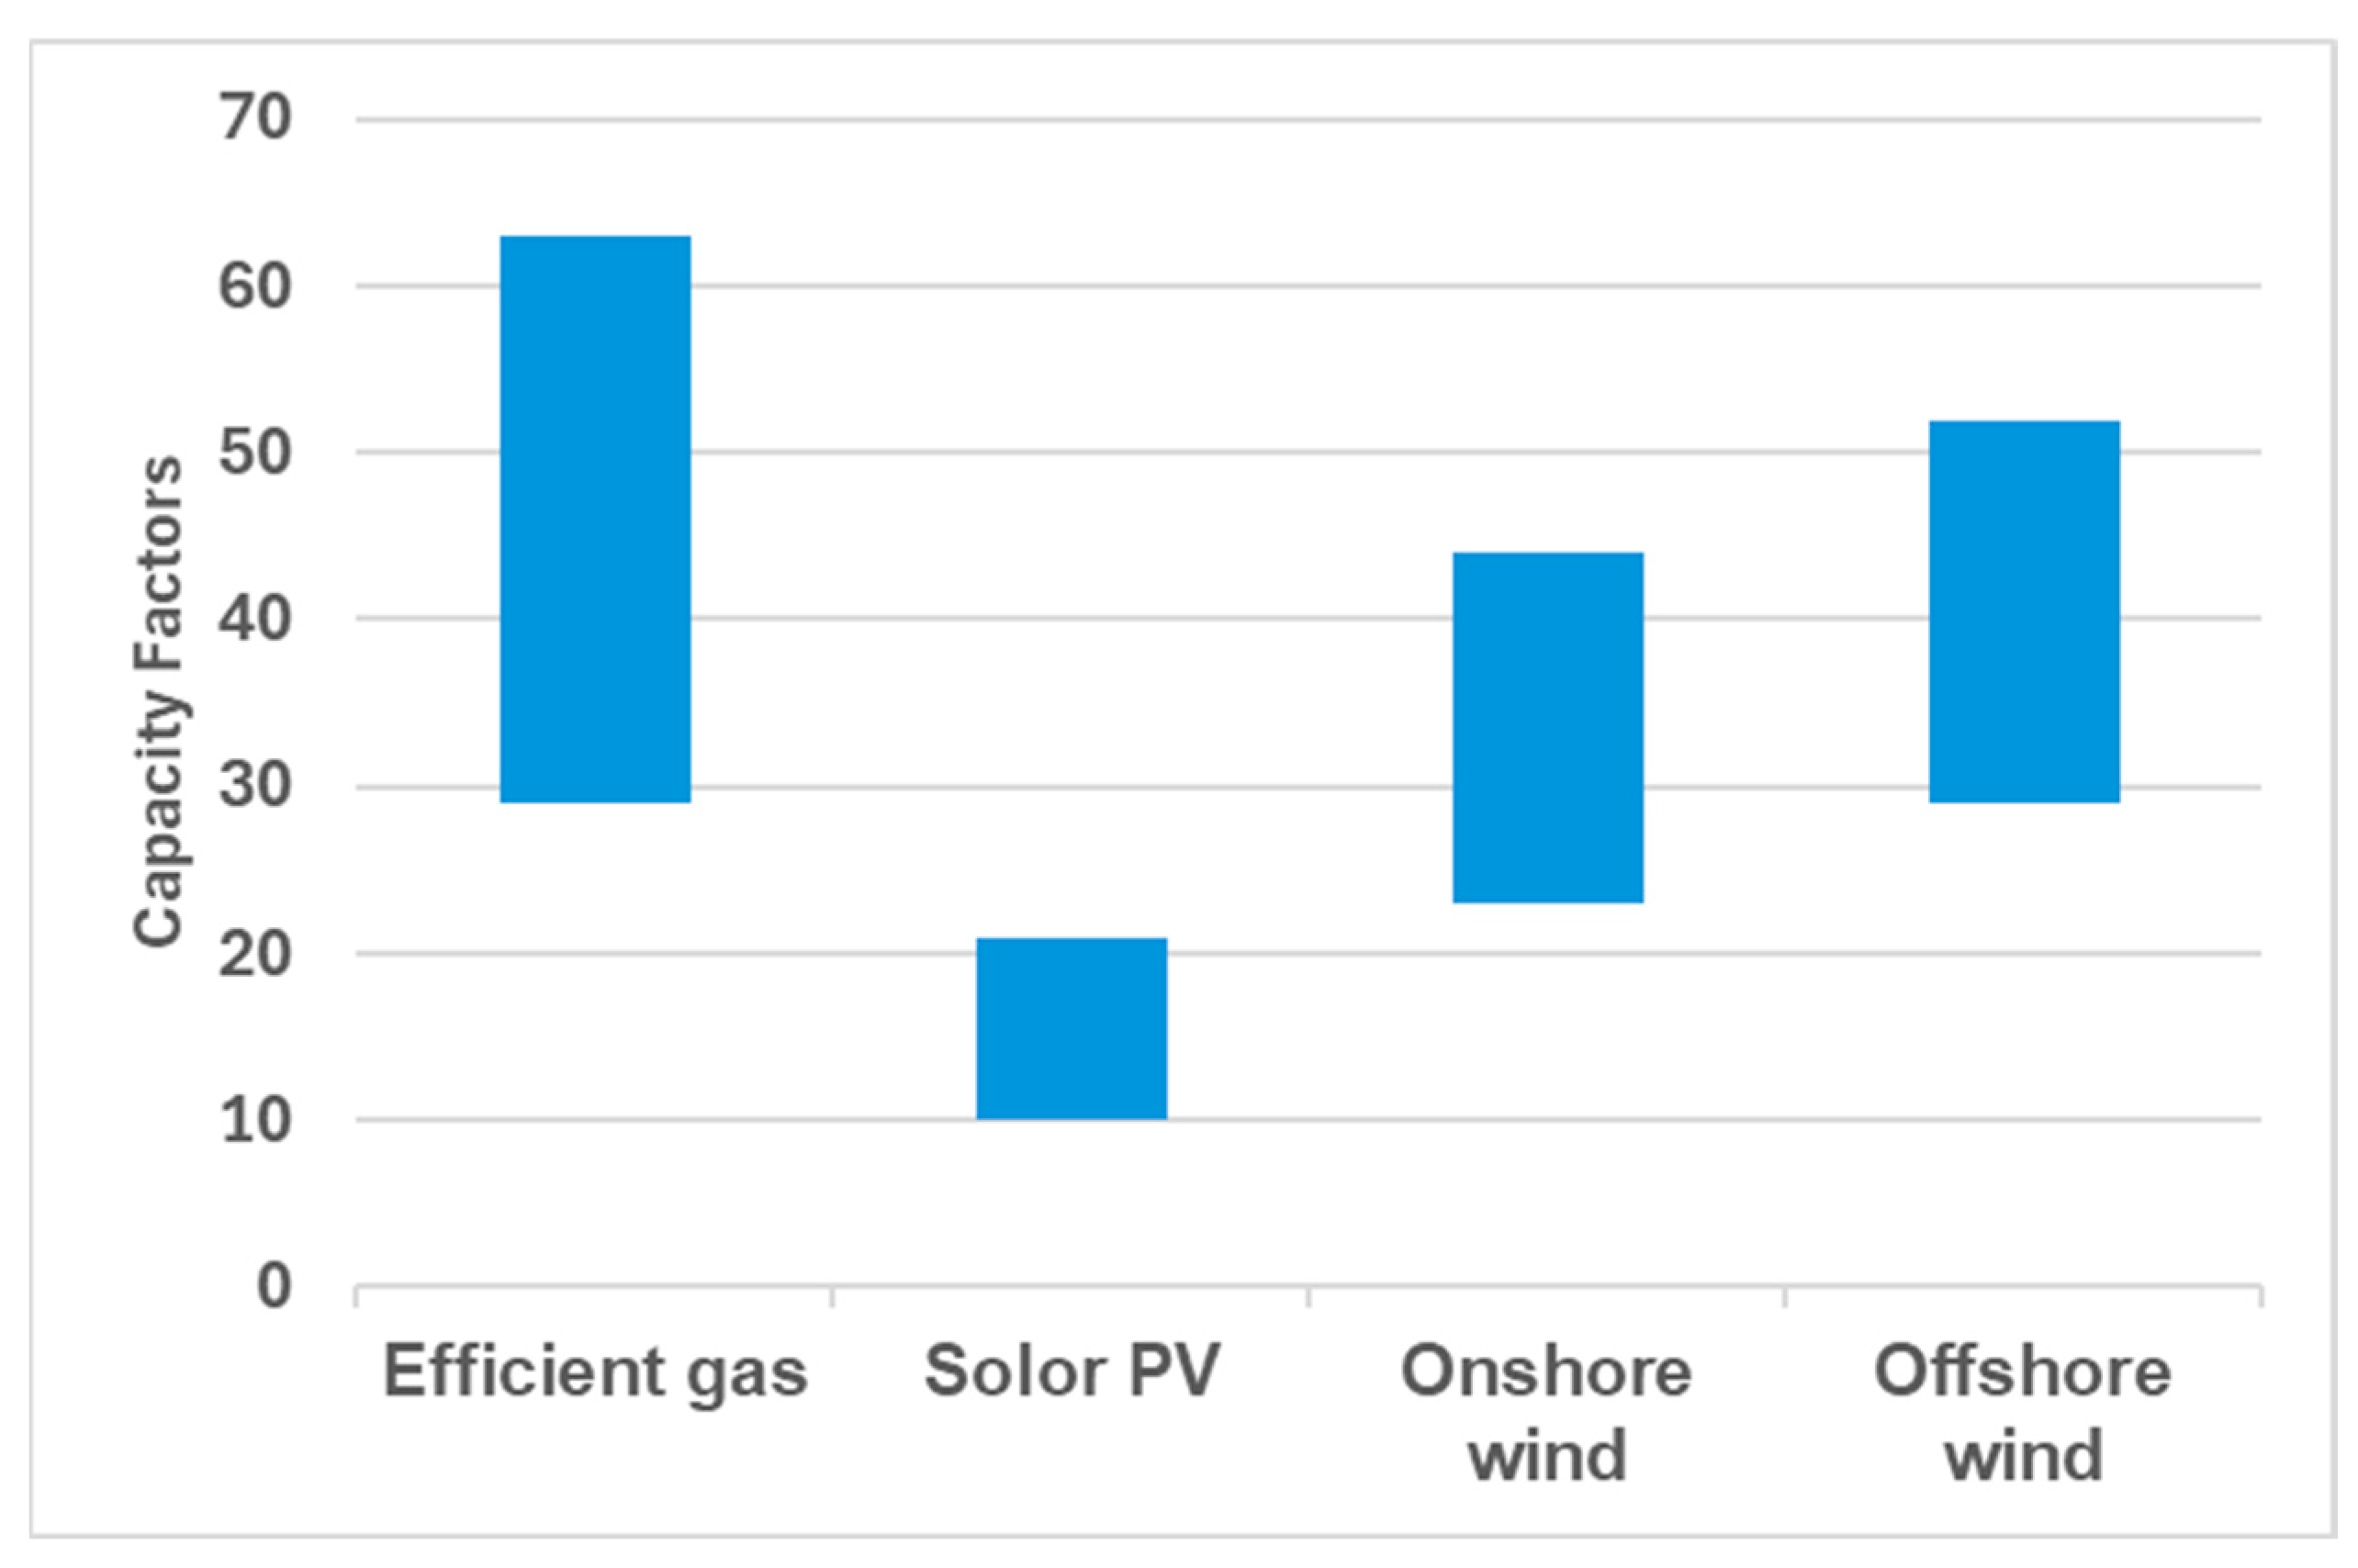
The capacity/load factors for each technology are a very important part of the cost calculations. For renewable technologies, it is almost entirely based on the availability of energy sources and efficiency of energy conversion, e.g., wind, solar, wave, or tides. For gas plants, it is mostly based on the plant availability allowing for outages and repairs.
Figure 7 shows predicted capacity factors by technology (IEA) [
36]. Note that for gas and new offshore wind, the capacity/load factors are significantly lower than the 93% and 65%, respectively, assumed in the DESNZ 2023 calculations.
The UK-published reports commonly include analyses of the sensitivity of costs to different components and show the range of values that can arise. Whilst it does not alter the ranking of the various technologies, it offers information that can assist in identifying the importance of the relationships between schemes. The following analysis is concerned with the comparing the LCOE with other forms of cost accounting, so only the average price assumptions are used.
4.2. Sustained Cost of Electricity
To compare the costs of generation from the different forms of generation through a different metric, we propose to express the cost of electricity (SCOE) over an extended fixed period (i.e., sustained), including multiple CAPEX costs to cover replacement systems. The length of analysis is set at the minimum life of the longest-lived technology. For technologies considered here, tidal range schemes have the longest operational lifespan of 120 years, which is also a lowest common factor for 60-, 40-, 30-, and 20-year technologies. The operational life of CCGTs is assumed to be 30 years, although most of the units built since privatisation in 1990 are still operational in 2025. Thus, two nuclear stations (2 × 60) will be needed consecutively, four offshore wind farms and CCGT s (4 × 30), five tidal stream stations (5 × 25), and six wave farms (6 × 20), to cover the same period.
The form of the equation is similar to that for LCOE (Equation (4)) and the assumptions and costs use the same base [
17]. The annual base costs are taken as the LCOE previously calculated without depreciation. However, the pre-development phase is ignored for inflation, and indexing will begin from 2023, assuming the appropriate number of years for construction. The difficulty of including predevelopment is that it varies in the DESNZ assumptions from 1 to 12 years (
Table 1). As the bulk of the costs come after that period, it sets the larger schemes at a disadvantage.
In Equation (5) for SCOE, the terms are defined as follows:
CAPEX = capital expenditure;
OPEX = annual operating expenditure;
AEP = annual electricity produced;
N = 120 years of operation;
TL = number of technology lifespans in 120 years.
Inflation
The Bank of England is currently tasked with controlling UK inflation and keeping it below 2% per annum. In 2023, inflation spiked at 10% due to the post COVID-19 recovery and the war in Ukraine. UK inflation returned to 2% by August 2024 but has since risen slightly. For our analysis, the internal rate of return (IRR) at 2023 prices was calculated in worked examples using inflation rates of 0%, 2%, and 4%.
Note that
Table 4 has a significantly different ranking to that generated by the LCOE model in
Table 3. The longer-lived schemes have relatively lower costs in SCOE.
4.3. Internal Rate of Return (IRR)
To calculate the IRR, the SCOE costs are compared with the expected revenue over 125-year construction and operation phases of the projects.
Revenue
Historic half hourly wholesale electricity prices in Britain are published by Elexon [
37]. The half-hourly sell prices from recent years are summarised in
Table 5 as the average for each half hour slot throughout the year. The maximum and minimum price for any slot in the year is also given.
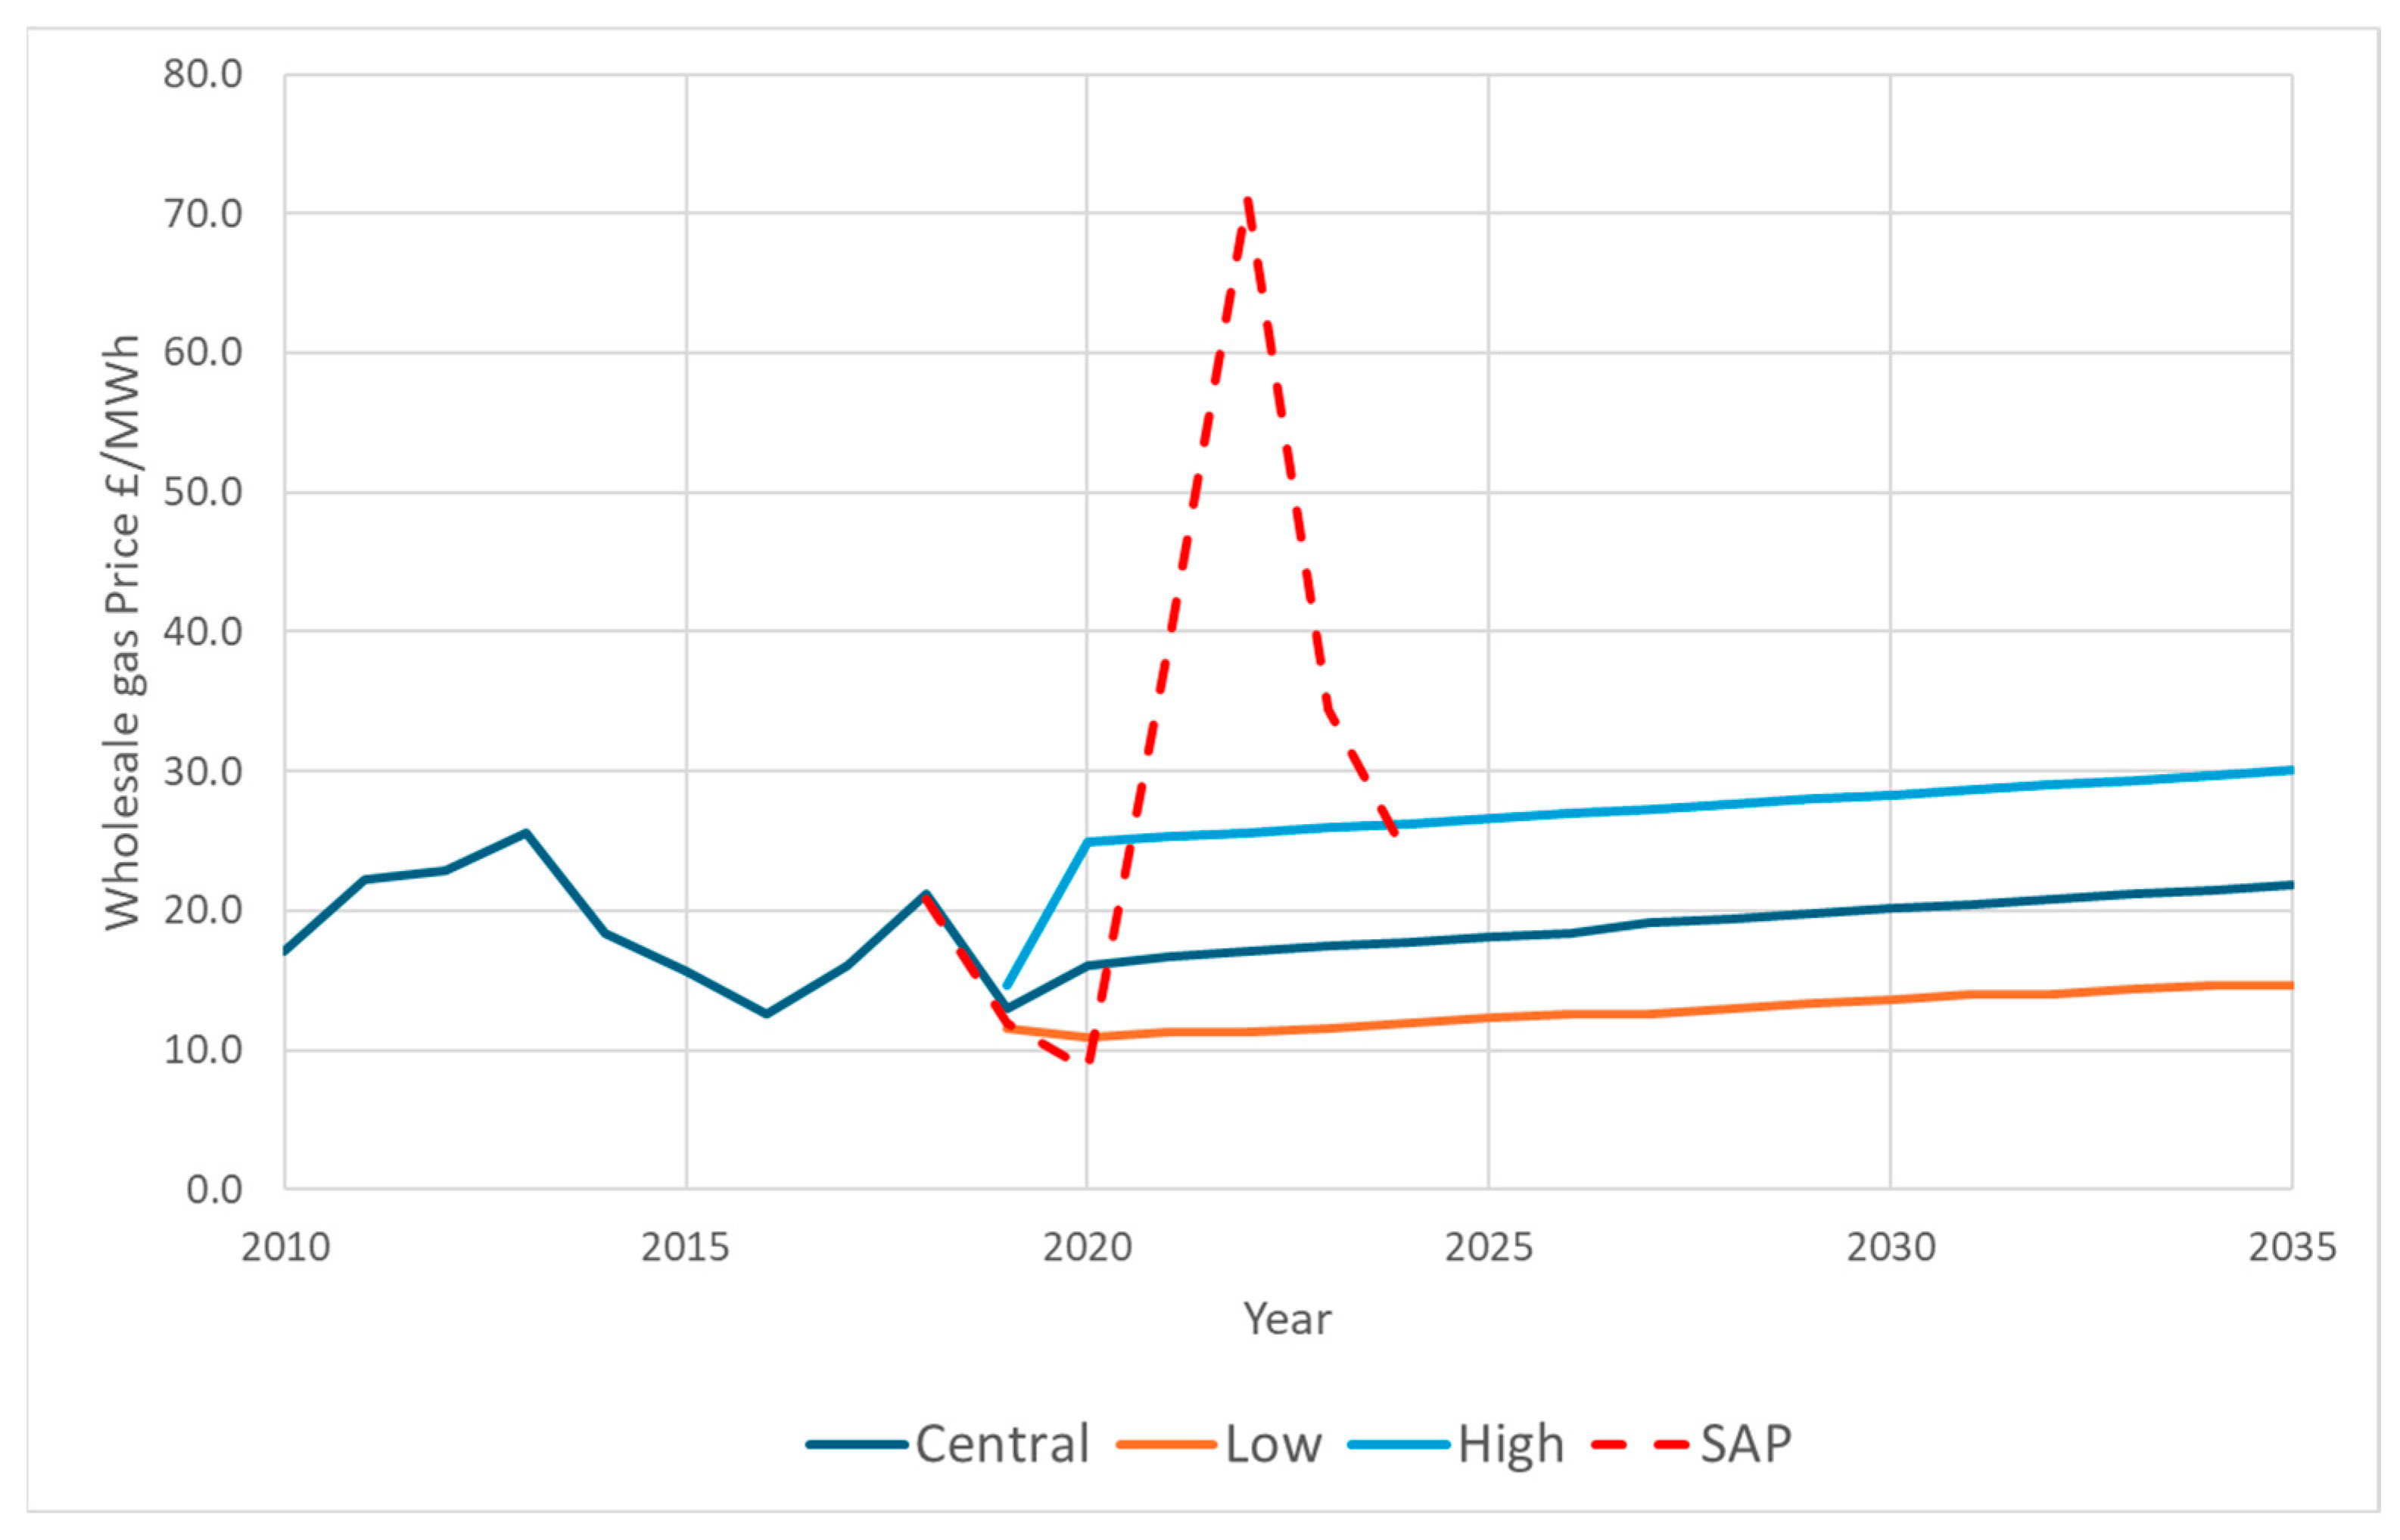
Whilst the wholesale price of British electricity reflects the cost of fuel (mainly gas), it is also determined by demand, with an initial reduction due to COVID-19 (2019–2020) followed by a boom (2021) that has been exacerbated by the restrictions on the use of Russian gas (2022). Prices are unlikely to fall to pre-2020 levels due to the closure of coal and nuclear Advanced Gas-Cooled Reactors (AGRs) and the proposed conversion of CCGTs fuel from natural gas to hydrogen or biofuels. Replacing fossil fuels and increasing demand for electricity from data centres, electric vehicles, and population growth are likely to increase future electricity prices, at least until the net-zero goals have been met.
The analysis to estimate the IRR over 120 years is straightforward. Revenue is based on the average wholesale price for 2024, shown in
Table 5. Expenditure is based on the total costs from the SCOE analysis. Both revenue and expenditure are inflated by 0%, 2%, and 4% per annum; the resulting IRR is presented in
Table 6.
5. Comparison of Results
The three methods of analysis produce different rankings, but all have the same goal—to help governments select the most appropriate power scheme that will meet demand. These metrics also dovetail with other commitments to safeguard the environment, can be seen as socially just, and support a successful economy. Although the rankings differ, there is a group that heads the list (offshore wind, large scale solar, and tidal range) and others that are less favourable (tidal stream, gas, and wave).
Each of the metrics highlights different characteristics. The IRR appears to be the most stable, whilst LCOE is sensitive to discount rates, with the rankings shifting as discount rates change. Our proposed metric of SCOE is sensitive to the assumed rate of inflation.
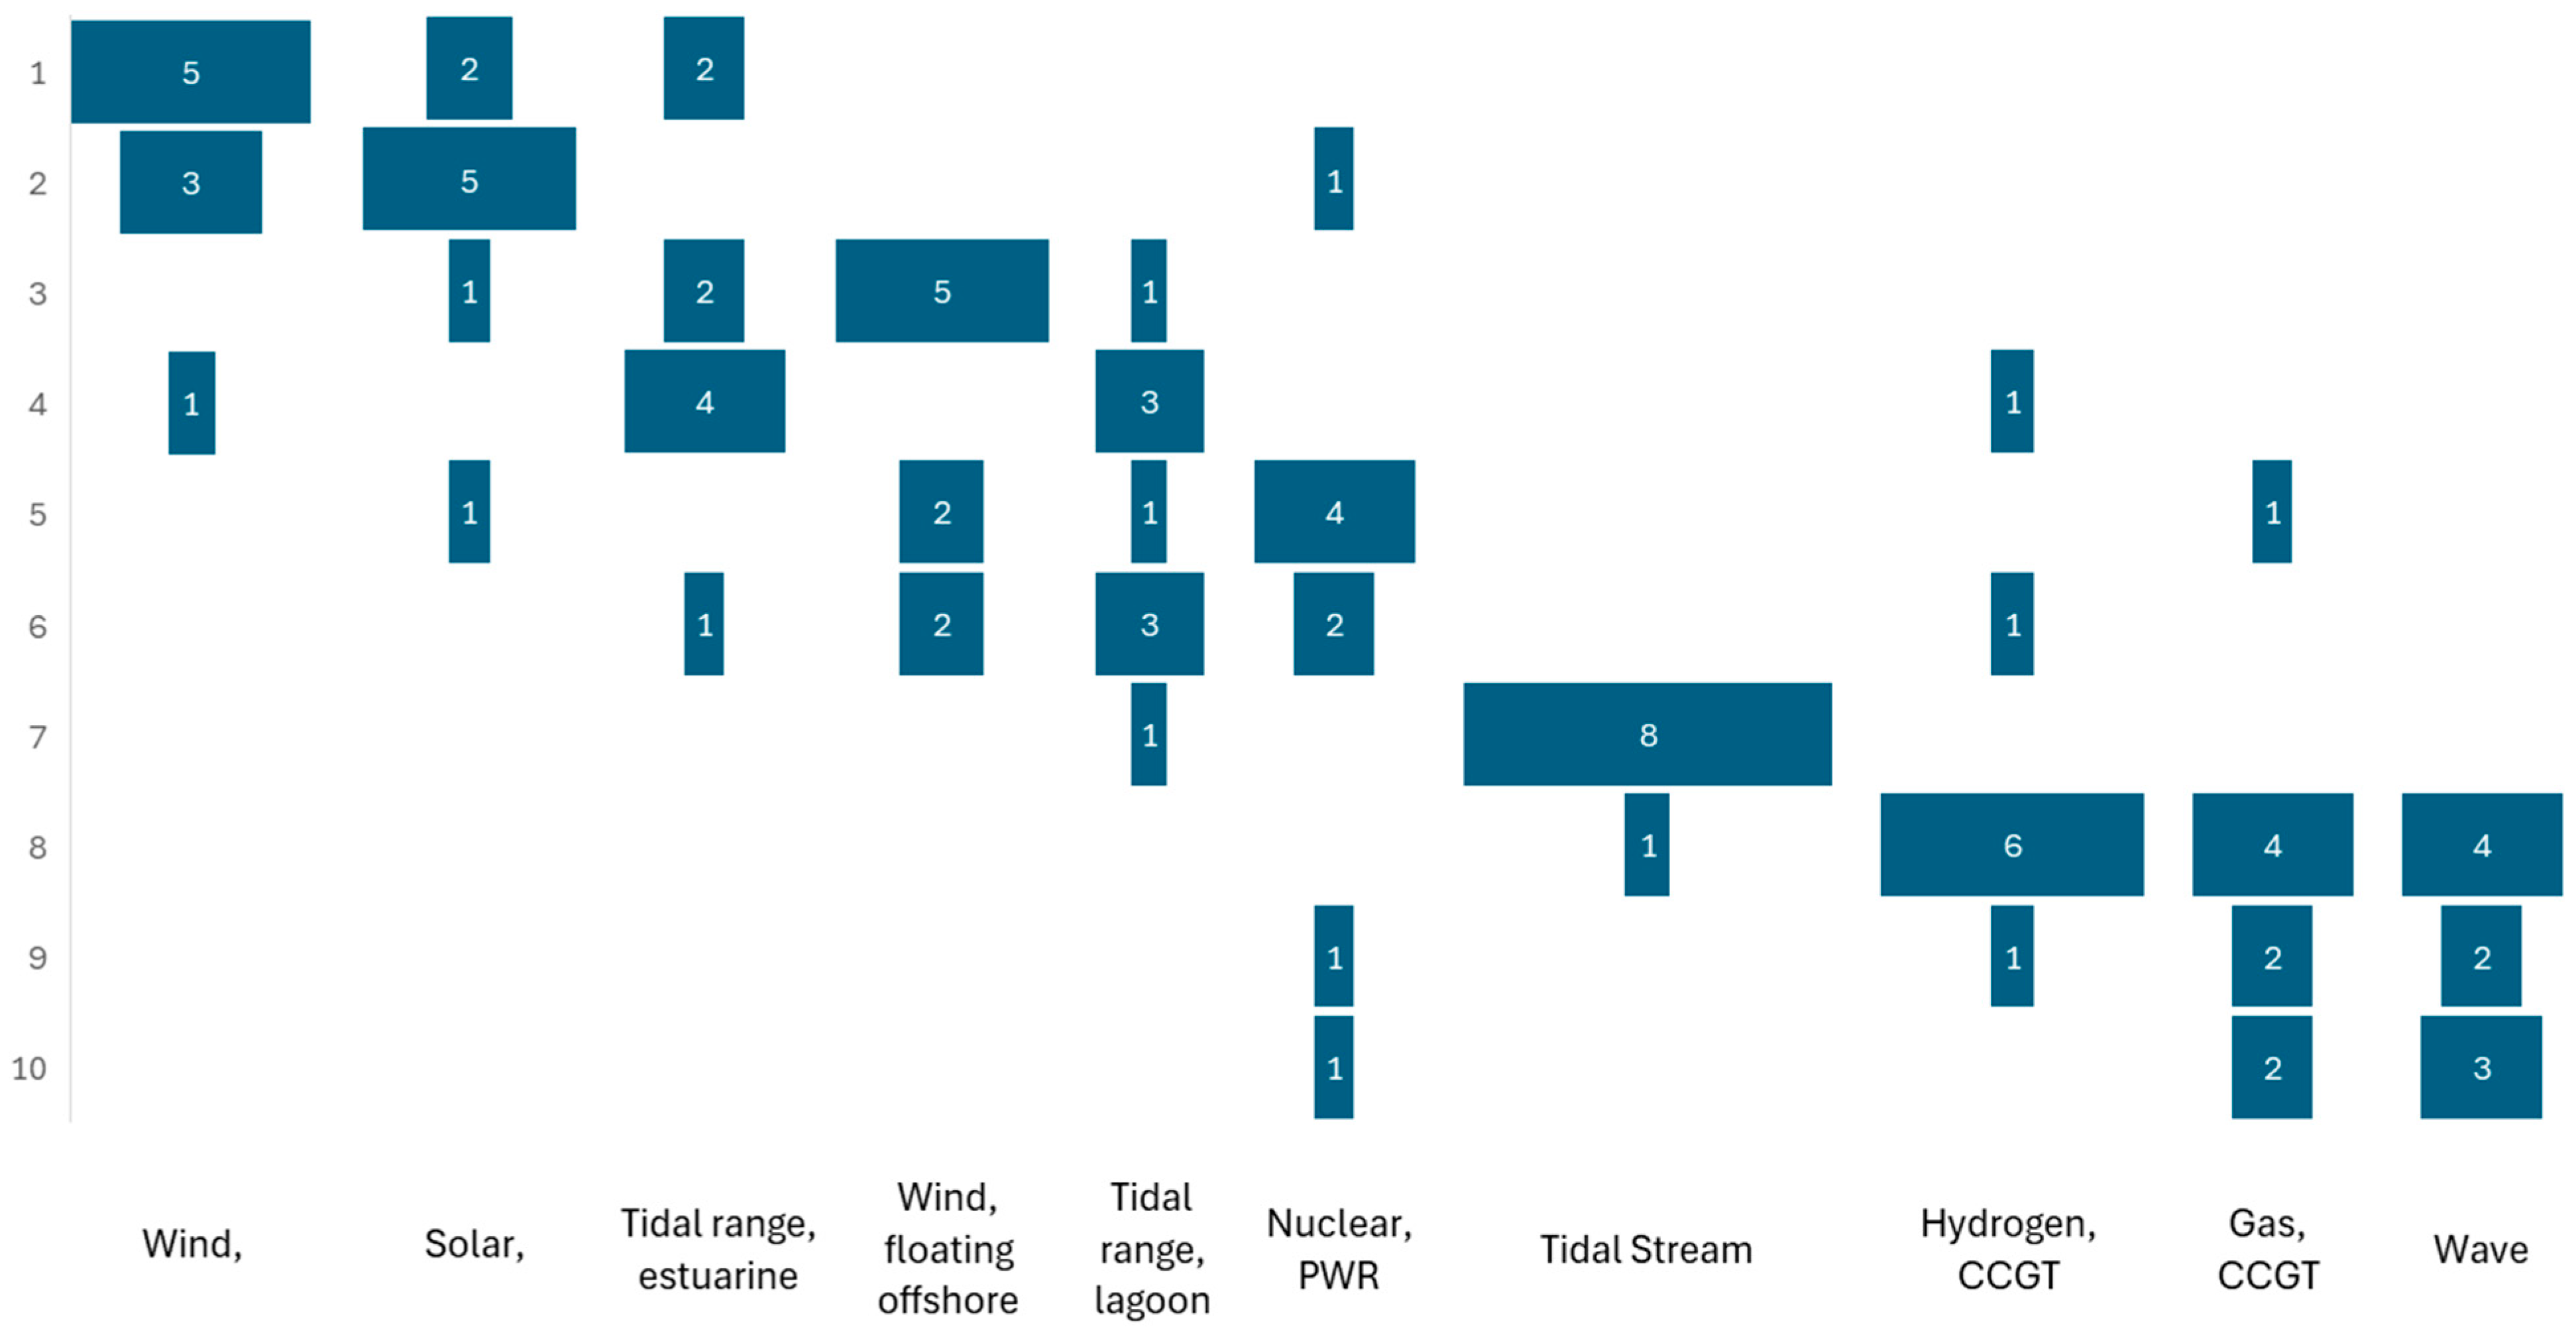
A summary of our ranking results is shown in
Figure 8. The Figure shows the outputs from the perspective of an adviser who is looking for the best or worst systems. The size of block represents the number of times a scheme was ranked at that position. There are a total of nine rankings for each scheme (three forms of analysis × three discount/inflation rates). Most schemes are consistently ranked within three or four ranking positions; tidal stream was ranked seventh eight times and eighthth once. It does not seem surprising that offshore wind and large-scale solar head the list, as these match the current policy as seen in recent energy white papers [
19]. It is less clear why tidal-stream and wave appear to be unpopular, which may be attributed to their relative size, their operational life expectancy, and their relative novelty making them FOAK. Nuclear sits in the middle, but shows the greatest variation in its ranking, from second to tenth, with the highest standard deviation of 2.4 being eight times the lowest (tidal stream at 0.3) and half as large again as its nearest technology (estuarine barrage at 1.6).
The values of the different approaches (LCOE, IRR, and SCOE) cannot be compared directly, as the metrics are not all expressed in the same units. Each estimate contains specific assumptions and cost estimates that invalidate inter-metric comparisons. Intra-metric comparisons can be made, but even then, care must be taken. The UK DESNZ [
24] publishes LCOE estimates for a range of technologies, but each technology has a bespoke calculation (e.g., technology-specific hurdle rate, discount rate, and load factor) that aims to make comparisons fairer despite extremely heterogeneous characteristics. Unfortunately, their statistics can be criticised for bias despite openly detailing all the assumptions. It must be noted that LCOEs are not used to set the strike price for technologies in schemes such as Contracts for Difference [
24].
LCOE and SCOE use the same units (GBP/MWh) and if compared with no discount rate or inflation, generate similar values (
Figure 6 and
Table 4). LCOE appears to be less sensitive to discount rate than SCOE is to inflation, with the result that SCOE appears to differentiate technologies more as the rate increases. However, SCOE has a group of 5 technologies that appear consistently better (tidal range estuary, nuclear, tidal range coastal lagoon, offshore wind, and large scale solar). There are interactions (rankings shift as the rates change) with nuclear getting worse in LCOE and better in SCOE.
6. Discussion
Currently, most renewable energy needs government subsidies to support early development or guarantee initial profitability. There are several features that need to be borne in mind when interpreting the results presented here.
The analyses are based on a restricted set of data describing a selection of technologies in the UK in 2024, so the output should only be interpreted for other locations after revisiting the model’s assumptions. Our aim was to demonstrate the strengths and weaknesses of the forms of analysis. All three metrics calculated attempt to spread the net present value (NPV) across timeframes and magnitudes that vary between technologies. It is not surprising that there is no ‘perfect’ metric, as each reflects specific perspectives.
The metrics generated here represent specifications that characterize the existing state of schemes, but they may not be typical of the technology as it evolves. Schemes can be operated in different modes that can affect both their costs and benefits and may have additional features that are not captured by the analysis.
Policy makers should therefore be cautioned against the selection of a single metric in isolation; it can be used to promote specific technologies. A basket of measures offers a better picture, and exploring the differences between outputs should lead to a stronger understanding of the system.
The value of generated power is assumed to be constant per MW in calculations, but as
Table 5 shows, there is tremendous variation in how much is paid, with the maximum being over 60 times the mean for the year (2020) and the minimum being negative in every year. The variation is not regular (e.g., daily or seasonal); although trends may be seen, there is no reliable consistency. It is easy to assume that demand will be higher in winter and there will be a lull overnight with peaks at specific times of the day. As climate change has driven summer temperatures up, so power demand has increased to drive air conditioning; the overnight lull is countermanded by devices (such as washing machines) being used when electricity is cheap and now being in competition with car batteries as they are charged while the owner sleeps.
The generating system also has its own momentum, so even if renewable generation meets the full UK demand for power, a nuclear plant cannot be turned off without penalties to the life of the boilers and turbines. Nuclear has issues with legacy (waste and contaminated infrastructure) and is viewed by the public as the riskiest form of generation. The decision to use nuclear power is therefore not simply financial cost, but also political.
Until an effective and large-scale energy storage scheme is discovered and developed, electricity is still ‘use it or lose it’. Oversupply can be exported to adjacent countries should they have shortfalls, but if there is no demand, power is lost. The system has to be balanced; when demand exceeds renewable generation, CCGTs, or more probably OCGTs, running on hydrogen or biofuels could act as peaking plants.
Intermittency and security of supply are also characteristics that influence decisions [
38]. Most renewable technologies have periods when no power can be generated, but intermittency has multiple forms ranging from short-term random dynamic (e.g., wind), through daily cycles (e.g., solar) to seasonal (e.g., agroforestry bioenergy production). Some forms (e.g., hydro) can appear to be more immune, depending on scale and location, but as with the security of supply of non-renewable fuels, the environment (natural and/or economic) can change, creating shortages.
Once the dynamics and magnitude of demand, along with the risks, are recognised, a robust and responsive combined system is required [
39]. It is necessary to efficiently design a combined system with an associated pricing structure that is dispatchable, supports baseload and peaking needs, and manages intermittency. Gas turbines running on biofuels or hydrogen, or plants fitted with carbon capture and sequestration (CCS), would provide a low carbon dispatchable source of electricity; Sepulveda [
40] suggests this approach along with nuclear as low-carbon resources. They showed that in a fully net zero market, having firm low-carbon plants in the mix brings down the overall cost of electricity.
Using the UK government’s figures for the cost of hydrogen and carbon tax, only offshore wind, solar, nuclear, and tidal range are viable at current electricity prices. Of these, offshore wind and solar are the most cost effective, but none of them are capable of responsive generation as peaking plants.
The UK government plans to quadruple its generating capacity from offshore wind, anticipating an average load factor of 65% [
17]. The factor is far higher than currently achievable, as the existing level is around 25% [
39] and only predicted to rise to between 30% and 50% [
36]. Solar no longer requires subsidies and must be regarded as a success, even at the low load factors available in the UK climate. Offshore wind is still subsidized, but the best sites have already been used and new plants need to be further offshore, adding to their costs. We expect other forms of renewable energy and nuclear power will continue to require subsidies in the near-to-medium future. Currently, the subsidies are recovered by an increase in the daily standing charge to electricity consumers.
The UK is fortunate that it can meet its current electricity demand from renewable sources, guaranteeing security of supply and reducing impacts of global fuel prices [
41]. However, in the short term, if the UK’s net zero targets are to be achieved, the cost of electricity is likely to increase significantly [
42]. If the UK acts alone, there will be a benefit to the British environment but a smaller impact on a global scale; Britain could serve as a role model to other nations.
Other functions, such as the use of tidal range schemes to provide flood protection from sea level rise, have been difficult to quantify. The benefits to the community, ratepayers, and local municipalities can be included in the LCOE by subtracting the estimated annual damage prevented (EAD) per MW of installed capacity from the annual fixed operating expenses, shown in
Table 2. As the benefits are likely to exceed the operating cost, the devices can be primarily for flood defence, which may confuse the creation of energy policy.
As most governments do not own or directly control their power generating systems, they have to use strategies of encouragement and dissuasion to drive the sector towards their goals. Encouragement through subsidies is common; in 2024, the International Energy Agency (IEA) identified 70 states that used over 2500 policies to encourage the use of green energy [
43]; there was an even larger database showing the support for fossil fuels [
44]. The UK lies 11th in the magnitude of its green energy subsidies with at least eleven different policies.
The World Bank publishes a dashboard of the state and trends of world carbon pricing, covering both carbon compliance (tax) mechanisms and carbon credits to offset tax [
45]. The UK was an early advocate through the EU Energy Trading Scheme and has had both compliance and credit schemes.
There are multiple avenues of research of different styles to examine the strategies for governments to steer energy policy (e.g., [
46]). However, most advisers see these outputs as of academic interest and do not formally make use of them.
7. Conclusions
There is serious criticism of the use of LCOE for policy development on a number of grounds. There is a reasonable argument that the technique can be manipulated by the analyst to produce a desired conclusion. Our research has shown that there is some consistency in analyses based on the Net Product Value when assumptions and underlying data are comparable.
Policy and development of an acceptable energy mix are not informed solely by LCOE, but it is still a high-profile method used to validate and support decisions. It is, and always will be, impossible to measure the “true” cost of energy, but the use of a suite of analyses can provide a useful insight. The proposed SCOE system provides an alternative for comparison and public policy-making. We hope that future policy decisions include several metrics in decision-making as part of a critical review of long-term energy planning.
Our analyses have shown that currently a weakness in the comparison the cost of energy for different technologies and lifespans is the consideration of time and lifespan; these are essential in the development of a sustainable system. The assumptions, data, and form of equation change the ranking of technologies, particularly for emerging technologies where the costs are only estimated, more specifically indicated as follows:
To add authority to the analysis, there needs to be an internationally agreed standard not only for the form and application of the equations, but also the selection of parameters; the parameter selection must be transparent.
A method of describing and validating data sources also needs to be established to prevent comparison of incompatible data.
There should be a recognised suite of tools for making assessments that should include LCOE, SCOE, and IRR as the differences between outputs can be much more informative than any individual result.
In addition, the social and environmental benefits, such as flood protection or improved road links, should be included in the assessments. Job creation may be common to all CAPEX schemes as a proportion of cost, so while it may be ignored in some assessments, locally it can be a deciding factor.


