Article

Differential Game Model of Fresh Supply Chain, Considering Preservation Efforts and Member Behavior Under Government Subsidies

1
Teaching Department of Basic Subjects, Jiangxi University of Science and Technology, Nanchang 330013, China
2
Business School, Jiangxi University of Science and Technology, Nanchang 330013, China
*
Author to whom correspondence should be addressed.
Sustainability 2025, 17(11), 4820; https://doi.org/10.3390/su17114820
Submission received: 27 March 2025 / Revised: 15 May 2025 / Accepted: 22 May 2025 / Published: 23 May 2025
(This article belongs to the Special Issue Sustainability Management Strategies and Practices—2nd Edition)

Abstract

:
With the improvement of living standards, consumer demand for fresh produce has witnessed a remarkable upsurge. Fresh products present significant preservation challenges, as their freshness directly correlates with sales performance and ultimately impacts the sustainable development of the fresh supply chain. Enhancing freshness preservation standards, boosting market demand, strengthening brand reputation, and promoting the development of a fresh supply chain are urgent problems that need to be solved. This paper delves into the dynamic optimal decision-making processes within a fresh food supply chain, which is composed of a supplier and a retailer, under different government subsidy scenarios: centralized decision-making, decentralized decision-making under supplier myopia, and decentralized decision-making under supplier’s foresight. Herein, a differential game model is constructed, and through the utilization of dynamic optimization and backward induction techniques, feedback strategies for various decision-making paradigms are derived. A comparative evaluation of decision-making models is conducted, grounded in theoretical frameworks and substantiated through numerical simulations, to assess critical parameter impacts. The results indicate the following: (1) the effect coefficients of consumer preference and preservation efforts show significant positive correlations with suppliers’ preservation strategies and retailers’ promotional tactics, respectively; (2) supply chain profitability reaches its Pareto-optimal state under centralized decision-making structures, while myopic supplier behavior leads to systematically lower profits than foresighted supplier strategies; (3) retailers demonstrate stronger collaboration preferences toward foresighted suppliers, as such partnerships ensure enhanced quality consistency and supply continuity; and (4) government agencies should implement dynamically adjusted subsidy schemes during preservation initiatives to facilitate sustainable operational frameworks in fresh produce supply chains.

1. Introduction

Fresh products usually refer to primary agricultural products that are not deeply processed, perishable, and need cold-chain or fresh-keeping technology to maintain quality [1,2,3]. They have the following core characteristics: perishability, supply chain sensitivity, and high consumption frequency. China maintains global leadership in both fresh agricultural commodity production and domestic consumption. Zhiyan Consulting’s market analysis reveals the Chinese fresh produce sector was valued at 9437.14 billion yuan in 2023, demonstrating 2.84% year-on-year growth. Consumption upgrading coupled with supply chain optimization has fueled steady market growth. Rising living standards and expanding health-conscious demand drive consumers to prioritize product freshness and brand credibility in purchasing decisions [4]. Product freshness exerts a decisive influence on consumer purchasing decisions in fresh produce markets. The inherent perishability of these goods causes substantial economic losses across supply chain operations, emerging as a critical operational challenge demanding prioritized resolution [5]. Industry analyses substantiate that quality deterioration challenges in fresh goods preservation generate substantial economic losses throughout multi-stage logistics [6]. The statistical analysis reveals significant variations in loss rates across product categories, with fruits and vegetables exhibiting the highest rate, at 12.5%, followed by aquatic products (9.3%), meat (7.8%), and dairy products, which show the most favorable performance, at 5.1% [7]. Substantial product losses in the fresh food supply chain significantly impair the profitability of suppliers and retailers, while simultaneously hindering market expansion for fresh goods. Product loss mitigation necessitates strengthening preservation capabilities across supply chain entities to ensure freshness integrity. Current operational constraints stem from cold-chain logistics costs inherent to the system, compounded by infrastructural deficiencies in storage and preservation technologies [8,9]. Mounting cold-chain infrastructure investments prove prohibitively costly to offset, while fresh food suppliers lack adequate incentives to ensure product preservation.
Consequently, during the initial phase, characterized by insufficient storage capacity and preservation infrastructure, coupled with the imperative requirement for developmental support within the fresh food supply chain ecosystem, governmental authorities have implemented a comprehensive suite of fiscal measures. These policy instruments encompass tax relief mechanisms and direct financial subsidies [10,11], which are strategically designed to provide essential capital infusion for supply chain participants to enhance their preservation technology investments. For example, in 2020, in order to reduce the postpartum loss of agricultural products, the Guangdong provincial government launched the Subsidy Plan for the construction of cold-chain logistics of agricultural products, and gave a 30% purchase subsidy to fresh enterprises’ investment in cold-chain warehousing, transportation equipment, and technology. Xiankangda Technology Co. used subsidies to construct two automated cold storage facilities equipped with Internet of Things temperature-control systems to enhance real-time freshness management for fresh food. However, due to the large amount of energy and financial resources required for fresh-keeping research and development, some suppliers will choose not to invest in fresh-keeping research and development. This behavior, which only pursues the maximization of current interests, and does not consider future development, is called myopia behavior.
It can be seen from the above that the decision-making of suppliers for fresh-keeping technology investment in the fresh supply chain is full of myopia and foresight choices and collisions. Some suppliers believe that a good strategic decision should be forward-looking and foresighted, taking into account the impact of the current decision on future long-term profits, while others believe that a good strategic decision only needs to maximize current interests. Therefore, which decision is more favorable: myopia or foresight? Through this analytical lens, the research tracks dynamic trajectories of product freshness, consumer preference formation, and brand goodwill accumulation. These findings ultimately provide actionable insights for achieving supply chain sustainability and fostering industry-wide operational excellence in fresh food systems.
The innovation points of this paper are as follows:
  • This paper develops a two-echelon differential game model, encompassing the supplier and retailer, to analyze preservation efforts and participant conduct. Among them, the supplier can choose myopia or foresight behavior.
  • This research analyzes how the supplier and retailer achieve optimal coordination through strategic decision-making in continuous-time systems, enabling rigorous analysis of time-dependent operational variables, and thus authentically replicating the inherent continuity and adaptive strategic interplay observed in actual market ecosystems.
  • This paper models consumer preferences as state variables and analyzes their evolution in continuous time. This achieves dynamic consistency of the strategy, making it more realistic.
  • Rather than simply considering preservation efforts, this paper will incorporate promotional efforts for research.
The subsequent sections of this paper are structured as follows: Section 2 conducts a literature review focused on two critical dimensions: determinants influencing fresh produce supply chains and methodologies applied in this research field. Section 3 develops and solves a differential game model for the fresh supply chain, constructing a two-echelon framework comprising a supplier–retailer dyad. Decision variables include preservation efforts and promotional investments, while state variables encompass product freshness, consumer preference dynamics, and goodwill. The analysis examines three operational scenarios: centralized decision-making, decentralized decision-making with a myopic supplier, and decentralized decision-making with a foresighted supplier, with comparative evaluations of decision-making patterns and profit distributions among channel members. Section 4 performs numerical simulations through parameter assignments. Section 5 synthesizes research findings and acknowledges inherent limitations.

2. Literature Review

The content of this literature review is mainly divided into three parts: the research status of myopia and foresight behavior, the factors affecting the development of fresh supply chains, and research models of fresh supply chains.

2.1. Research Status of Myopic and Foresighted Behavior

In the field of myopic and foresighted behavior research, behavior whereby enterprises ignore the impact of current important decisions on the reduction of future goodwill and profits is referred to by scholars as myopia behavior, while behavior that takes into account the long-term impact of current decisions on the accumulation of future goodwill and the growth of profits is regarded as foresighted behavior [12,13,14].
The existing literature combines myopic and foresighted behavior with specific fields. For example, Liu et al. [15] built a differential game model including suppliers and manufacturers. Supply chain members can choose two behaviors: myopia and foresight. The results show that foresight is their dominant strategy, but myopia will benefit both sides. Huang et al. [16] discussed the balanced control strategies of private-brand introduction and strategic behavior under different scenarios. Among them, retailers may be myopic and foresighted, and consider introducing private brands. The results show that, compared with foresighted retailers, myopic retailers prefer to introduce private brands. Wen et al. [17] constructed four dynamic differential game models for the myopia and foresighted behavior of members of the competitive pharmaceutical supply chain, and studied the effects of different behavior choices, changes in competition intensity, and the medical insurance reimbursement ratio on pharmaceutical manufacturers’ research and development innovation, medical institutions’ cost-sharing strategies, and supply chain performance. In addition, some scholars have combined myopic and foresighted behavior with different economic effects and theories to carry out a series of studies. Wu et al. [18] utilized data from Chinese A-share listed companies from 2012 to 2021 to build a fixed-effect model. The results show that management myopia has a negative moderating effect on the positive relationship between supply chain concentration and carbon performance, while public emergencies have a positive moderating effect on this relationship. Arash et al. [19] analyzed the information of 215 companies from 2014 to 2021, and found that management myopia had a negative effect on the efficiency of supply chain management. There is no research on the fresh supply chain in the above-mentioned literature. Moreover, according to the above-mentioned differences between myopic and foresighted behavior in fresh-keeping technology investment in the fresh-keeping industry, this study will study the strategy of fresh-keeping technology investment combined with the behavior selection of fresh-keeping supply chain members.

2.2. Key Determinants in the Fresh Supply Chain

The existing literature on fresh produce supply chains has predominantly focused on coordination mechanisms, pricing strategies [20,21,22], and optimization methodologies [23,24,25] across fresh supply chain operations. In studies of supply chain coordination, scholars have examined the role of blockchain technology [26,27,28], inventory management systems, and logistical operations [29,30,31] in enhancing coordination efficiency. Concurrently, researchers have analyzed promotional strategies [32,33,34] through the lens of market dynamics, demonstrating their potential to drive sales growth and expand fresh supply chain networks. The extant research underscores the multifaceted nature of fresh supply chain studies, with key determinants shaping its evolution. Aligned with this paper’s objectives, this analysis focuses on three critical factors: government subsidies, preservation efforts, and consumer demand.

2.2.1. Government Subsidies

Government subsidies constitute a pivotal mechanism for advancing fresh supply chain development, critically shaping operational effectiveness [35]. This study systematically examines subsidy typologies and their operational impacts. Regarding subsidy forms, Wu and Zhu [36] categorized four governmental approaches based on e-commerce agricultural support: no subsidy, farmer-focused price subsidies, e-commerce platform price subsidies, and regional subsidies. Xu et al. [37] established a manufacturer-led Stackelberg model within dual-channel supply chains, comparing the impacts of manufacturer-oriented versus retailer-oriented subsidy mechanisms. Shi et al. [38] evaluated two agricultural subsidy policies: green technology operational subsidies and green technology investment subsidies. Concerning subsidy efficacy, Guo et al. [39] constructed a tripartite evolutionary game model involving governments, manufacturers, and consumers, demonstrating that consumer-targeted subsidies more effectively incentivize manufacturer green investments than direct manufacturer subsidies. Zhang et al. [40] applied game-theoretic analysis to three subsidy schemes, revealing that hybrid programs optimize pollution reduction, enhance output, maximize profits, and expand consumer surplus. Song et al. [41] utilized a Stackelberg framework to compare four closed-loop subsidy strategies, finding that third-party recycler subsidies are superior under high remanufacturing costs, whereas manufacturer subsidies excel in low-cost scenarios.
Collectively, these studies establish subject-focused subsidies as the dominant mechanism, with substantial operational influence.

2.2.2. Preservation Initiatives

Freshness preservation constitutes a critical determinant in fresh supply chain operations. Zhang et al. [42] established an innovative supply chain framework involving suppliers and e-retailers, revealing that implementing preservation initiatives by e-retailers elevates profitability for both parties. Liu et al. [43] analyzed information-sharing dynamics in e-commerce fresh goods supply chains, identifying how equilibrium decisions—dependent on information transparency—are modulated by freshness elasticity coefficients. Feng et al. [44] constructed a two-echelon decision model with risk-neutral suppliers and risk-averse retailers, demonstrating that supplier-led freshness efforts amplify consumer demand for agricultural products. For suppliers, investing in preservation technologies and optimizing post-harvest handling protocols are strategic imperatives for advancing fresh supply chain systems.

2.2.3. Consumer Demand

Consumer demand drives production scaling, with perishable goods preferences critically shaping fresh supply chain evolution. Chen et al. [45] formulated a dual-channel optimization model integrating online–offline platforms while incorporating consumer freshness preferences, demonstrating that increased freshness demand motivates retailers to adopt advanced preservation technologies, enhancing profitability. Yang et al. [46] analyzed preservation strategies in supplier-led secondary agricultural supply chains under carbon quota-trading policies, revealing that, regardless of policy adoption, heightened freshness preferences and lower price sensitivity coefficients drive suppliers to intensify preservation efforts. Within fresh produce markets, purchasing decisions hinge on multifaceted factors, where perceived freshness dominates. To optimize operational strategies, suppliers and retailers must align production–distribution plans with consumer preference analytics.
In conclusion, government subsidies may promote the progress of the fresh supply chain, the fresh-keeping level affects the freshness of products, and consumer preferences affect the sales of fresh products, which are important factors affecting the development of the fresh supply chain.

2.3. Research Models of Fresh Supply Chains

The fresh produce market continues to expand, driving methodological innovations in supply chain research. Liao et al. [47] developed a resilience framework for fresh agricultural supply chain enterprises, constructed an extended model to address resilience incompatibility, and conducted correlation analyses of key resilience determinants. Yang et al. [48] applied grounded theory to identify 36 vulnerability factors across seven categories from stakeholder data, then mapped inter-factor relationships using complex network theory to pinpoint critical vulnerabilities and impact pathways. Zhang et al. [49] proposed a hybrid taboo gray wolf optimizer to optimize cold-chain logistics, enhancing distribution efficiency, reducing costs, and improving product quality for operational decision-making. Wang et al. [50] built dual-channel optimization models incorporating logistics service levels and performed dynamic analyses of agricultural supply chains. Ran et al. [51] established three Stackelberg decision models (supplier-led, retailer-led, centralized) to analyze preservation and coordination strategies. Zhao et al. [52] created a tripartite evolutionary game model involving data platforms, providers, and consumers, employing dynamic system theory to examine stability strategies and decision-influencing factors. These studies collectively advance fresh supply chain research through diverse methodological applications in resilience analysis, logistical optimization, and strategic decision modeling, providing theoretical foundations for sectoral development.
However, Liao et al. [46] and Yang et al. [47] utilized empirical datasets for analysis—a methodology which is inherently limited in capturing real-time dynamic game behaviors under disruptive events, and fails to derive optimal intertemporal decision pathways. Zhang et al. [48] algorithmically enhanced logistics efficiency, yet overlooked strategic interdependencies among decision-makers. Ran et al. [50] and Zhao et al. [51] constrained their analysis to discrete operational phases through Stackelberg and evolutionary game frameworks, but both methodologies lacked real-time adaptability to dynamically evolving conditions. Existing models inadequately model strategic coordination and joint optimization between suppliers and retailers in fresh supply chains, whereas differential game theory provides a robust framework to address these limitations.
A differential game is defined as a continuous game played by multiple actors within a continuous-time system. The objective is to optimize their individual, often competing, goals. This process seeks to determine the time-dependent strategies of each actor, culminating in an equilibrium outcome [53]. ISAACS’ [54] seminal work, Differential Games, is widely recognized as the genesis of differential game theory. This study examines strategic interactions between suppliers and retailers in fresh supply chains through differential game modeling, advancing traditional game theory by integrating continuous-time dynamics to capture real-time freshness variations from supplier preservation initiatives, brand reputation fluctuations, and their subsequent impacts on operational strategies. Mu et al. [55] developed a differential game model of a supply chain, characterized by manufacturer leadership and retailer followership, to investigate the effects of consumer regret and product returns on supply chain decision-making following the introduction of innovative products. Shi et al. [56] formulated a differential game model for a fresh e-commerce supply chain, incorporating preservation efforts, retailer promotion, and brand reputation to analyze the collaboration between fresh e-commerce platforms and suppliers. Zhang et al. [57] investigated a differential game model within a dual-channel supply chain, focusing on the interactions between fresh electronic retailers and chain supermarket suppliers. Their analysis explored the implications of shared preservation technology on the dynamics of this dual-channel fresh supply chain. Liu et al. [58] developed a differential game framework to analyze how the interaction between fresh food suppliers and retailers influences investment in precooling and carbon reduction technology R&D (research and development), quantifying their collective profitability implications.
In conclusion, the current research on the fresh food supply chain exhibits certain shortcomings, as shown in Table 1.
Firstly, existing research has predominantly concentrated on the static implications of influencing variables, thereby precluding the capacity to undertake a dynamic impact assessment across an extended temporal spectrum. Second, consumer decision-making is shaped by multifaceted determinants extending beyond unidimensional parameter shifts. Third, differential game applications in fresh food supply chains remain an underexplored research domain. For example, although scholars such as Shi et al. [56], Zhang et al. [57], and Liu et al. [58] systematically analyzed the impact of preservation efforts on the supply chain, they failed to consider the decision-making behavior characteristics of supply chain members (such as myopic or foresighted behavior). Secondly, although Mu et al. [55] included behavioral characteristics in their analysis framework, they did not focus on the specific context of the fresh food supply chain. Finally, although Ran et al. [51] explored preservation decisions in the fresh food supply chain, they were still limited to static analysis, and failed to reveal their dynamic evolution patterns. This research status indicates that there is a lack of comprehensive research that integrates decision-making behavior, industry characteristics, and dynamic analysis simultaneously. Therefore, this paper uses differential game theory to build a two-level supply chain between the supplier and the retailer, and considers the impact of preservation efforts and member behavior on the dynamic decision-making of the supply chain when the government subsidizes the preservation efforts of the supplier. This not only considers the factors that affect the development of fresh supply chain, but also uses differential game theory to analyze the strategy changes under continuous time, which provides ideas for the research of fresh supply chains.

3. Differential Game-Theoretic Model of Fresh Supply Chain

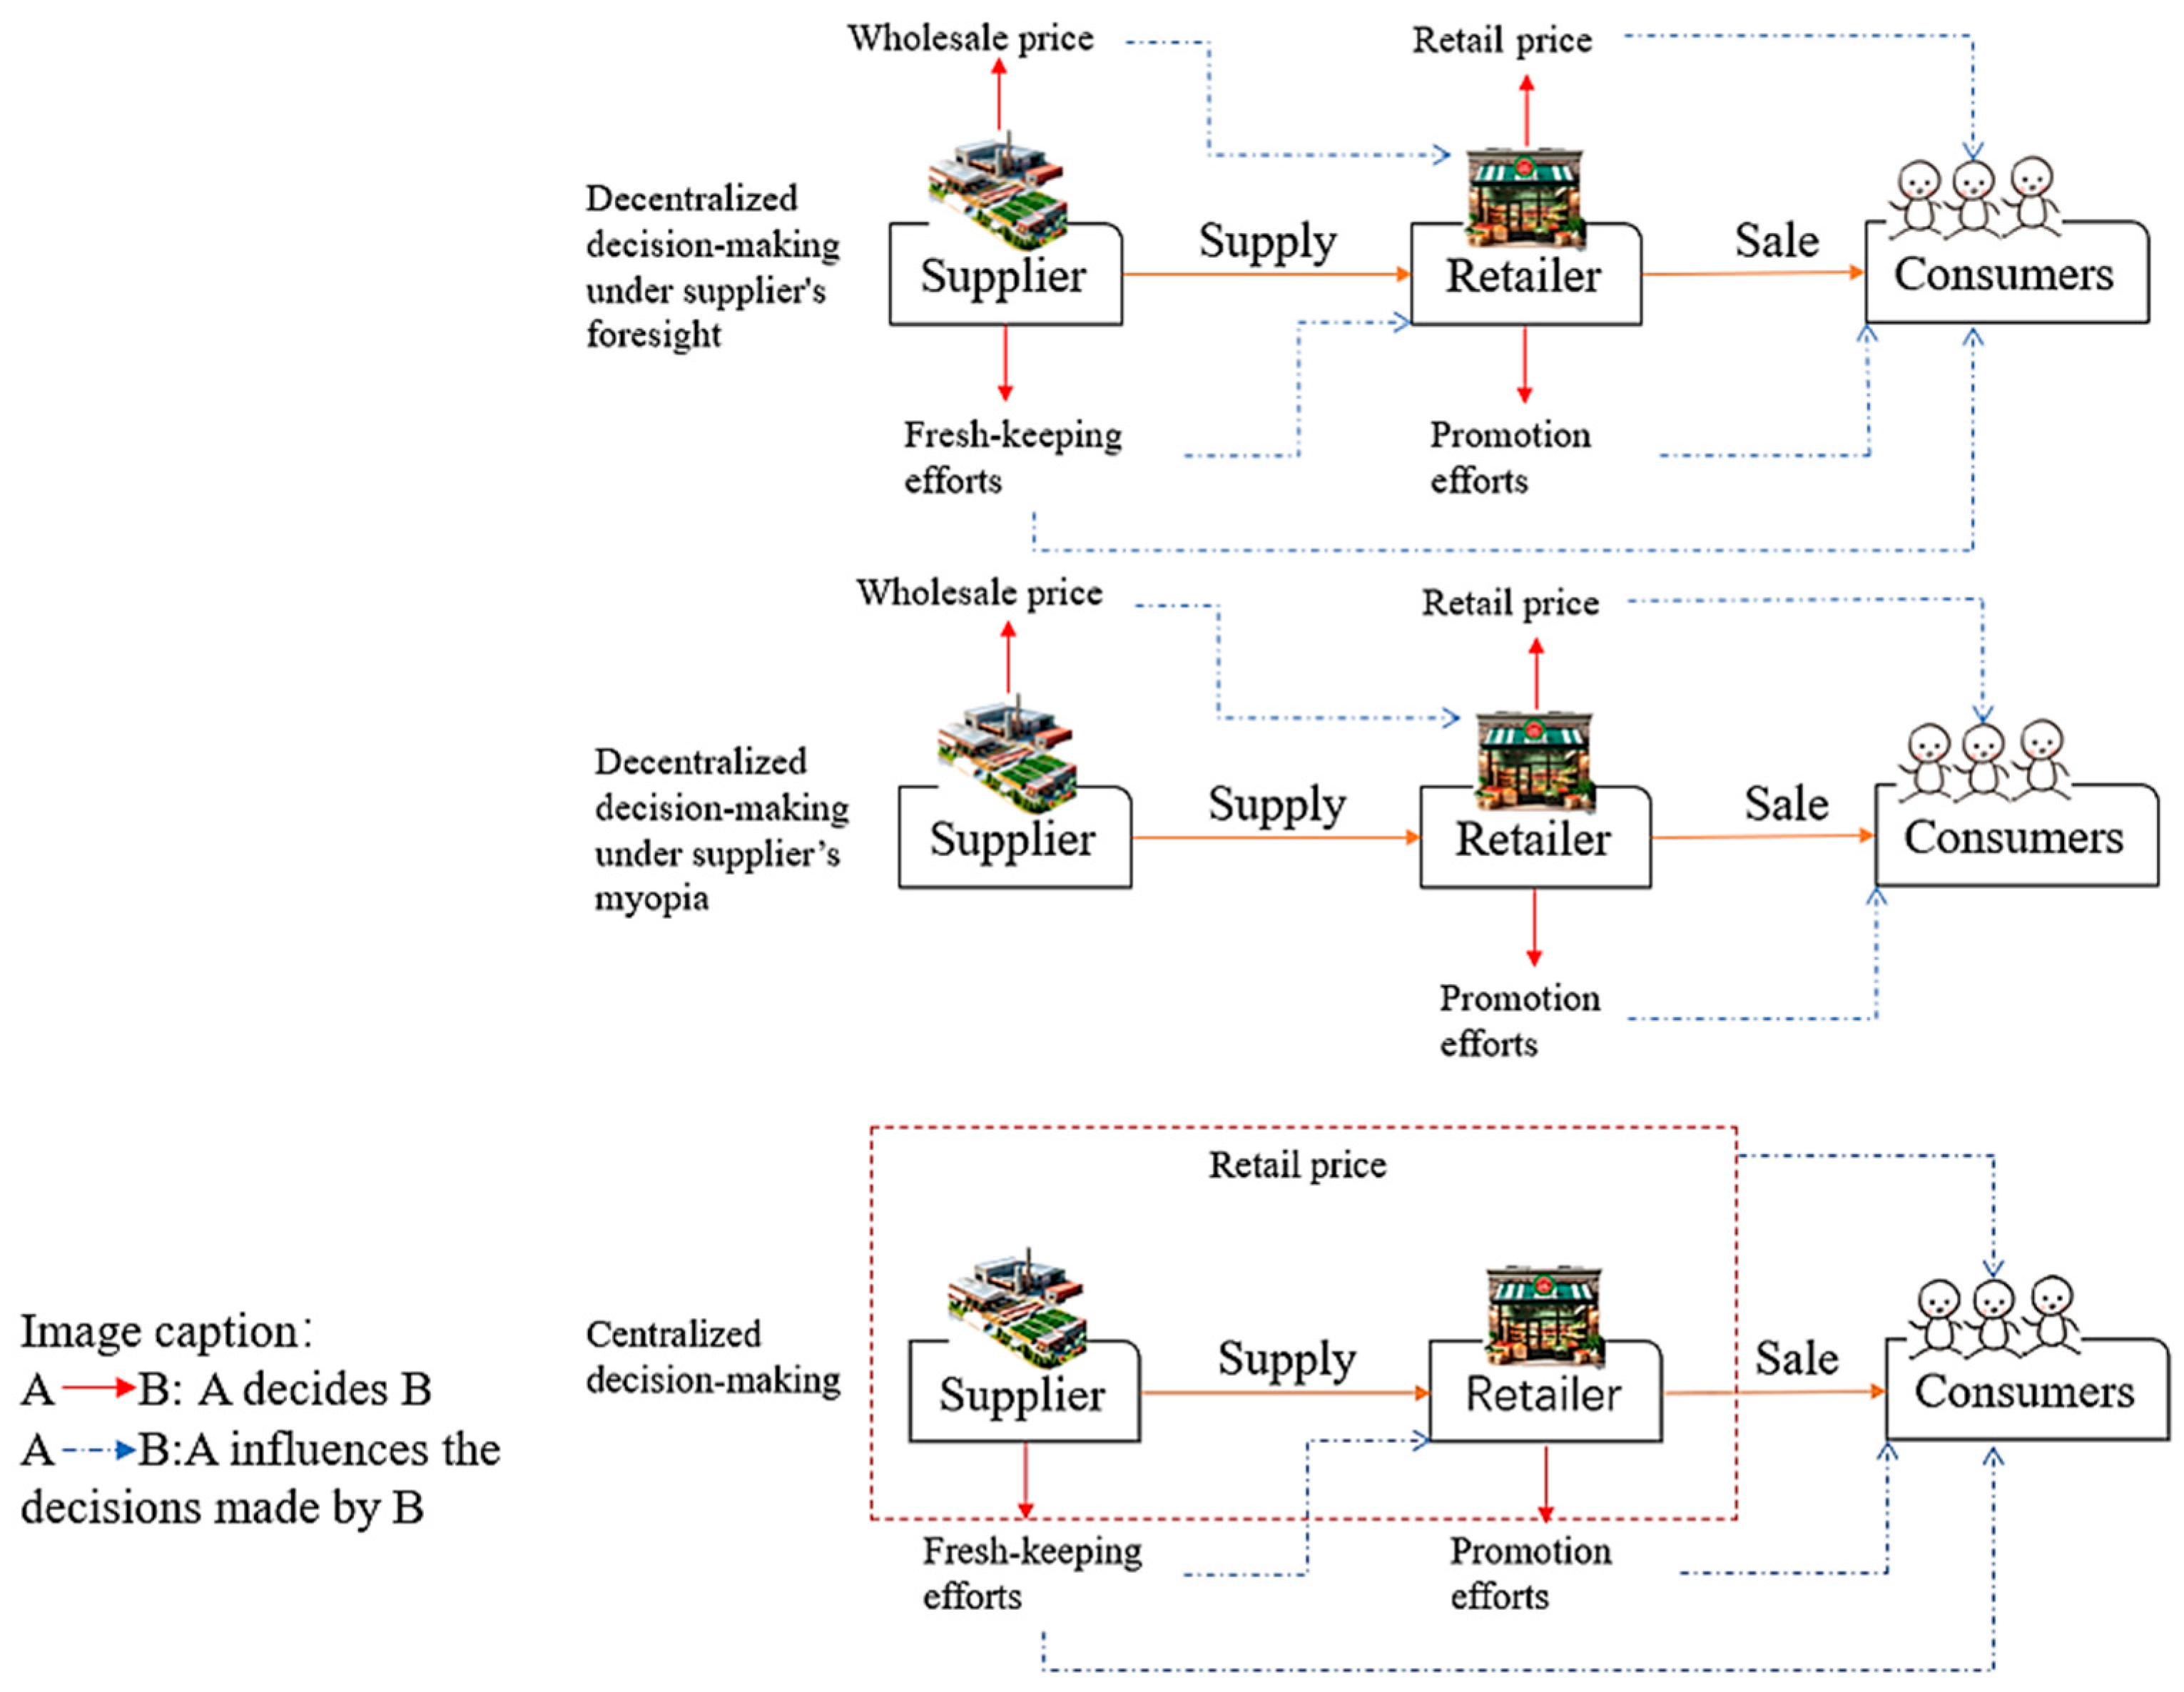
3.1. Problem Description

To promote the sustainable development of the fresh industry, the government is implementing targeted subsidy programs for suppliers engaged in the research and development of advanced preservation technologies. To ensure the quality retention of fresh goods, the suppliers assess the adoption of advanced preservation methodologies and strategically allocate resources toward innovative preservation technologies. To optimize sales performance, the retailers strategically allocate resources toward promotional campaigns to enhance market penetration and brand visibility. This study analyzes a fresh produce supply chain consisting of a supplier–retailer dyad, where the supplier delivers perishables to the retailer, while strategically determining wholesale pricing and product preservation levels. The retailer establishes predicated retail prices and allocates resources to promotional activities. If the supplier exhibits a myopic perspective, it may fail to recognize the long-term advantages that preservation initiatives offer to the enterprise itself, thereby opting against investments in product preservation. Conversely, a foresighted approach among suppliers yields the opposite outcome.
Consequently, this paper employs differential game theory to develop game-theoretic models for the supplier and retailer. The supplier and retailer can choose between centralized decision-making, decentralized decision-making under the myopia of the supplier, and decentralized decision-making under the foresight of the supplier. Through comparative equilibrium analysis, optimal strategies for each stakeholder are derived, generating operational guidelines to enhance supply chain efficiency. This methodology is designed to enhance the efficiency of the fresh supply chain. Figure 1 schematically illustrates the supply chain process across three decision-making models, effectively illustrating the logical interdependencies among supply chain entities.
Within centralized decision-making, the supplier and retailer engage in collaborative efforts to determine product pricing, preservation, and promotional strategies. In decentralized decision-making, the supplier’s foresighted behavior will cause them to first determine wholesale prices and preservation efforts, while the supplier will not consider preservation cost investment in their myopic behavior.

3.2. Model Assumptions

The preceding section established the study’s foundational research question; this phase requires developing model assumptions and eliminating confounding variables. Before formalizing these assumptions, this section formally establishes essential parameter notations. Table 2 presents a systematic presentation of model symbols with corresponding operational definitions.
Leveraging the parameters outlined in Table 2, to enhance the analysis of supplier and retailer decision-making within the fresh supply chain, this analysis is based on the following assumptions:
Assumption 1.
The fresh supply chain operates as a dyadic system between a supplier and a retailer, with both seeking to maximize their infinite-horizon discounted profits [59,60].
Assumption 2.
The fresh supplier’s preservation initiatives will inevitably lead to increased costs, whereas the retailer will leverage promotional activities and advertising to enhance their market competitiveness. This analysis leverages the research of Dong et al. [61] to model the relationship between supplier preservation efforts and associated costs, and the relationship between retailer promotion efforts and their respective costs, using a quadratic function.
C m ( t ) = m 2 ω m 2 ( t ) ,
C r ( t ) = r 2 ω r 2 ( t ) .
Assumption 3.
The differential evolution equation for freshness of fresh products [62] is defined as follows:
G ( t ) t = u ω m v G ( t ) G ( 0 ) = G 0 ,
Assumption 4.
Referring to Luo et al. [63], the dynamic process of consumer preferences is represented as follows:
N ( t ) t = β G ( t ) + λ ω r η N ( t ) N ( 0 ) = N 0 ,
Assumption 5.
The goodwill value is contingent upon retailer promotional activities, product freshness, consumer preference, and the goodwill decay rate. Based on the Nerlove-Arrow [64] model specification, the differential equation governing goodwill dynamics is as follows:
M ( t ) t = b G ( t ) + f ω r + χ N ( t ) q M ( t ) M ( 0 ) = M 0 ,
Assumption 6.
Market demand will be jointly influenced by the market’s potential, retail pricing strategies, and goodwill [65], which can be specifically expressed as follows:
Q ( t ) = [ s H p ( t ) ] a M ( t ) ,
Assumption 7.
To facilitate the efficient supply of fresh goods, the government offers subsidies to supplier for their preservation activities [11]. Referring to the model of Su et al. [66], the subsidy amount is calculated as the product of the supplier’s preservation costs and the subsidy rate, denoted as α C m ( t ) .
Assumption 8.
Social welfare encompasses the aggregation of supply chain profitability, consumer surplus, and government expenditure. Specifically, consumer surplus represents the disparity between the maximum price that consumers are prepared to pay for a good or service and the prevailing market price. Based on the research conducted by Panda et al. [67], consumer surplus is represented as follows:
C S = p min p max ( s H p ) a M d p = a s M Q a H M s H ( s H p ) a M d p = Q 2 2 a H M ,
Given the above assumptions, the objective functions of the supplier and retailer are as follows:
J m = max ω m , w 0 e θ t [ ( w c ) Q ( 1 α ) m 2 ω m 2 ] d t ,
J r = m a x p , ω r 0 e θ t [ ( p w ) Q r 2 ω r 2 ] d t .

3.3. Analysis of Differential Game Models

To investigate the impact of preservation efforts and member behavior on supply chain operations under government subsidies, this study utilizes a differential game model, incorporating both the supplier and retailer. This analysis will assess the impact of various supply chain configurations—specifically, decentralized decision-making with supplier foresight, decentralized decision-making with supplier myopia, and centralized decision-making—on goodwill, preservation efforts, publicity efforts, consumer preferences, governmental financial support, retail pricing, and overall firm performance.

3.3.1. Distributed Decision-Making Model Under Supplier’s Foresight

Within this decision-making paradigm, both the supplier and the retailer are driven by the objective of profit maximization. Initially, the supplier determines wholesale prices and inventory management strategies. Afterward, the retailer implements promotional efforts and establishes retail prices, contingent upon the suppliers’ strategic decisions.
Proposition 1.
The upper-right label t represents decentralized decision-making in the case of the supplier’s foresight (Appendix A). Within this decision-making paradigm, the optimal outcomes for all stakeholders within the supply chain are as follows:
(i) 
The optimal wholesale price for the supplier is as follows:
w t = s + H c 2 H .
(ii) 
The optimal retail price for the retailer is as follows:
p t = 3 s + H c 4 H .
(iii) 
The supplier’s best preservation effort is as follows:
ω m t = u ( 1 α ) m m 2 t .
(iv) 
The retailer’s best publicity effort is as follows:
ω r t = f r 1 t + λ r 3 t r .
(v) 
The optimal consumer surplus is as follows:
C S t = ( s H c ) 2 32 H a M t .
(vi) 
The optimal profits of the supplier and retailer at point  t  are as follows:
V m t = m 1 t M + m 2 t G + m 3 t N + m 4 t ,
V r t = r 1 t M + r 2 t G + r 3 t N + r 4 t ,
where  m 1 t = a ( s H c ) 2 8 ( θ + q ) H ,  m 2 t = [ a b ( θ + η ) + a β χ ] ( s H c ) 2 8 ( θ + q ) ( θ + η ) ( θ + v ) H ,
m 3 t = a χ ( s H c ) 2 8 ( θ + q ) ( θ + η ) H ,  r 1 t = a ( s H c ) 2 16 H ( θ + q ) ,
r 2 t = [ a b ( θ + η ) + a β χ ] ( s H c ) 2 16 H ( θ + q ) ( θ + η ) ( θ + v ) ,  r 3 t = a χ ( s H c ) 2 16 H ( θ + q ) ( θ + η ) ,
m 4 t = u 2 2 θ ( 1 α ) m ( m 2 t ) 2 + f 2 θ r m 1 t r 1 t + λ f θ r m 1 t r 3 t + λ f θ r m 3 t r 1 t + λ 2 θ r m 3 t r 3 t ,
r 4 t = f 2 2 θ r ( r 1 t ) 2 + λ f θ r r 1 t r 3 t + λ 2 2 θ r ( r 3 t ) 2 + u 2 θ ( 1 α ) m r 2 t m 2 t .
(vii) 
Under the equilibrium strategy, the state variables encompassing product freshness, consumer preferences, and brand equity are articulated as follows:
G t = u 2 [ a b ( θ + η ) + a β χ ] ( s H c ) 2 8 v m ( 1 α ) ( θ + q ) ( θ + η ) ( θ + v ) H + ( G 0 u 2 [ a b ( θ + η ) + a β χ ] ( s H c ) 2 8 v m ( 1 α ) ( θ + q ) ( θ + η ) ( θ + v ) H ) e v t ,
N t = 1 η ( β G t + λ f r 1 t + λ 2 r 3 t r ) + [ N 0 1 η ( β G t + λ f r 1 t + λ 2 r 3 t r ) ] e η t ,
M t = 1 q ( b G t + χ N t + f 2 r 1 t + λ f r 3 t r ) + [ M 0 1 q ( b G t + χ N t + f 2 r 1 t + λ f r 3 t r ) ] e q t .
Remark 1.
From Equation (17), under the decentralized decision-making of the supplier’s foresight, product freshness in a steady state exhibits a positive correlation with preservation effort impact, government subsidy rates, and potential market size. Conversely, it demonstrates an inverse relationship with the rate of freshness degradation, the preservation cost conversion coefficient, and the cost and price elasticity coefficients. From Equation (18), it can be seen that consumer preferences and product freshness exhibit a positive correlation, as do the coefficients of promotion and advertising. Conversely, consumer preferences are negatively correlated with the rate of decline in consumer preferences and the conversion rate of promotional expenditures. As can be seen from Equations (10) and (11), the optimal wholesale and retail prices exhibit a positive correlation with market potential and cost factors, while demonstrating a negative correlation with the price elasticity coefficient. However, it can be seen from Equation (19) that the influencing factors of goodwill are more extensive. It exhibits a positive correlation with the degree of brand preservation initiatives, consumer preference index, and product promotion intensity, while demonstrating an inverse relationship with goodwill erosion factors, the conversion rate of promotional expenditures, and the price elasticity coefficient.
The easier it is to convert the cost of preservation efforts, the lower the cost of preservation efforts, the higher the government subsidy rate, and the more significant the efforts of suppliers will be. This will incentivize suppliers to enhance product freshness, leading to increased revenue derived from these preservation efforts. As a result, the supplier will intensify preservation efforts, bringing about a corresponding enhancement in preservation levels.
Enhanced product freshness, coupled with a reduced promotional cost conversion coefficient, will elevate consumer purchasing preferences, thereby resulting in increased profitability for both the supplier and retailer. Initially, consumer preference is below the projected steady-state level, suggesting inadequate product awareness and promotion. Enhanced supplier investment in preservation efforts, coupled with amplified retailer promotional activities, will likely intensify consumer demand, thereby augmenting corporate profitability.
As preservation efforts intensify, product promotion expands, and consumer trust grows, the retailers’ initiatives will significantly boost the company’s brand goodwill. An improved corporate reputation fosters greater consumer trust, which, in turn, drives profitability and facilitates organizational growth. Consequently, companies will endeavor to enhance product promotion, intensify their marketing initiatives, and maintain and augment their brand goodwill.

3.3.2. Decentralized Decision-Making in the Face of Supplier Myopia

In this decision-making paradigm, the supplier, prioritizing their own self-interests, disregards the influence of preservation technology on the enterprise’s overall profitability, thereby demonstrating a short-sighted approach. Due to a lack of foresight, there will be no immediate gains, which will disincentivize the supplier from investing in conservation initiatives, ω m 0 . Subsequently, this segment will determine the optimal strategy for decentralized decision-making, considering the myopia behavior of the supplier. The differential game models for the supplier and retailer are as follows:
J m = max w 0 e θ t ( w c ) Q d t ,
J r = max p , ω r 0 e θ t [ ( p w ) Q r 2 ω r 2 ] d t .
Proposition 2.
The computational methodology employed in this segment mirrors that of Section 3.3.1. The right superscript ‘ o ’ denotes decentralized decision-making under the supplier’s short-sightedness (Appendix B). Under this model, the supply chain’s optimal outcomes are as follows:
(i) 
The optimal wholesale price for the supplier is as follows:
w o = s + H c 2 H .
(ii) 
The optimal retail price for the retailer is as follows:
p o = 3 s + H c 4 H .
(iii) 
The retailer’s best publicity effort is as follows:
ω r o = f r 1 o + λ r 3 o r .
(iv) 
The optimal consumer surplus is as follows:
C S o = ( s H c ) 2 32 H a M o .
(v) 
The optimal profits of the supplier and retailer at point t are as follows:
V m o = m 1 o M + m 2 o G + m 3 o N + m 4 o ,
V r o = r 1 o M + r 2 o G + r 3 o N + r 4 o ,
where m 1 o = a ( s H c ) 2 8 ( θ + q ) H , m 2 o = [ a b ( θ + η ) + a β χ ] ( s H c ) 2 8 ( θ + q ) ( θ + η ) ( θ + v ) H , m 3 o = a χ ( s H c ) 2 8 ( θ + q ) ( θ + η ) H ,
r 1 o = a ( s H c ) 2 16 H ( θ + q ) ,  r 2 o = [ a b ( θ + η ) + a β χ ] ( s H c ) 2 16 H ( θ + q ) ( θ + η ) ( θ + v ) ,  r 3 o = a χ ( s H c ) 2 16 H ( θ + q ) ( θ + η ) ,
m 4 o = f 2 θ r m 1 o r 1 o + λ f θ r m 1 o r 3 o + λ f θ r m 3 o r 1 o + λ 2 θ r m 3 o r 3 o ,  r 4 o = f 2 2 θ r ( r 1 o ) 2 + λ f θ r r 1 o r 3 o + λ 2 2 θ r ( r 3 o ) 2 .
(vi) 
Under this strategy, the changes in product freshness, brand goodwill, and consumer preference are detailed below:
G o = G 0 e v t ,
N o = 1 η ( β G o + λ f r 1 o + λ 2 r 3 o r ) + [ N 0 1 η ( β G o + λ f r 1 o + λ 2 r 3 o r ) ] e η t ,
M o = 1 q ( b G o + χ N o + f 2 r 1 o + λ f r 3 o r ) + [ M 0 1 q ( b G o + χ N o + f 2 r 1 o + λ f r 3 o r ) ] e q t .
The freshness of the supplier’s products is entirely dependent on their initial freshness, and is subject to degradation over time. Consumer preferences and goodwill are influenced by the same factors as decentralized decision-making under the foresight of the supplier. The main difference lies in the sensitivity of each parameter. A detailed comparative analysis can be found in the simulation results.

3.3.3. Centralized Decision-Making

Under a centralized decision-making model, collaborative efforts between the supplier and the retailer are utilized to determine product pricing and preservation strategies. The objective of supply chain decision-making is to optimize the long-term value for all the stakeholders involved. The optimal result in this instance is indicated by the label c in the upper-right corner. The differential game model for this decision is as follows:
J = max p c , ω m c , ω r c 0 e θ t [ ( p c ) ( s H p ) a M ( 1 α ) m 2 ω m 2 r 2 ω r 2 ] d t .
Proposition 3.
The feedback equilibrium strategies within a centralized decision-making framework are as follows (Appendix C):
(i) 
The optimal retail price is as follows:
p c = s + H c 2 H .
(ii) 
The supplier’s best preservation effort is as follows:
ω m c = u ( 1 α ) m g 2 c .
(iii) 
The retailer’s best publicity effort is as follows:
ω r c = f r g 1 c + λ r g 3 c .
(iv) 
The optimal consumer surplus is as follows:
C S c = ( s H c ) 2 8 H a M c .
(v) 
The optimal profit of the supply at point t is as follows:
V c = g 1 c M + g 2 c G + g 3 c N + g 4 c ,
where  g 1 c = a ( s H c ) 2 4 ( θ + q ) H ,  g 2 c = ( a b ( θ + η ) + a β χ ) ( s H c ) 2 4 ( θ + q ) ( θ + v ) ( θ + η ) H ,
g 3 c = a χ ( s H c ) 2 4 ( θ + q ) ( θ + η ) H ,  g 4 c = u 2 2 ( 1 α ) θ m ( g 2 c ) 2 + f 2 2 θ r ( g 1 c ) 2 + λ f θ r g 1 c g 3 c + λ 2 2 θ r ( g 3 c ) 2 .
(vi) 
In the context of an equilibrium strategy, the state changes of product perishability, consumer preferences, and brand goodwill are as follows:
G c = u 2 ( a b ( θ + η ) + a β χ ) ( s H c ) 2 4 v m ( 1 α ) ( θ + q ) ( θ + v ) ( θ + η ) H + ( G 0 u 2 ( a b ( θ + η ) + a β χ ) ( s H c ) 2 4 v m ( 1 α ) ( θ + q ) ( θ + v ) ( θ + η ) H ) e v t ,
N c = 1 η ( β G c + λ f g 1 c + λ 2 g 3 c r ) + [ N 0 1 η ( β G c + λ f g 1 c + λ 2 g 3 c r ) ] e η t ,
M c = 1 q ( b G c + χ N c + f 2 g 1 c + λ f g 3 c r ) + [ M 0 1 q ( b G c + χ N c + f 2 g 1 c + λ f g 3 c r ) ] e q t .
Remark 2.
From Equation (37), within a centralized decision-making framework, the freshness of the supplier’s products exhibits a positive correlation with preservation efforts, prospective market scale, and governmental incentives. Conversely, it demonstrates an inverse relationship with the cost conversion factor of preservation efforts, the rate of freshness degradation, and the price elasticity coefficient. From Equation (32), the optimal retail price exhibits a positive correlation with market potential and product cost, while demonstrating an inverse relationship with price elasticity. As illustrated in Equation (38), consumer demand intensifies with enhancements in product freshness, promotional activities, and prospective market scale, while it diminishes with escalations in the conversion coefficient of promotional expenditures, reputational erosion, and price elasticity. As illustrated in Equation (39), goodwill is positively correlated with enhanced product freshness, advertising efforts, consumer preferences, and prospective market scale, yet inversely correlated with the advertising and promotion cost conversion rate, preservation efforts cost conversion rate, rate of product degradation, and shifts in consumer preferences.

3.4. Comparison of the Results of Three Decision-Making Models

Subsequent to the functional analysis of the aforementioned decision-making behaviors, this section will concentrate on the comparative analysis of fluctuations in wholesale and retail prices, preservation efforts, promotional initiatives, consumer surpluses, and supply chain profitability under different decision-making scenarios.
Remark 3.
The comparative analyses of wholesale pricing versus optimal retail pricing across varying decision-making paradigms are presented below:
w t = w o ,
p t = p o > p c .
Collective decision-making denotes the consolidated decision-making process among all stakeholders, coupled with the internal allocation of resultant benefits, thereby precluding the establishment of a wholesale price. The identical wholesale prices obtained from the remaining two decision-making models suggest that the supplier’s pricing strategy is independent of the partner in cooperation, instead being solely determined by prospective market demand and product manufacturing costs. The retailer’s pricing strategies are, however, influenced by diverse decision-making processes. The varying positions for the retailer within these decision-making frameworks impact product pricing, thereby affecting the determination of optimal price points. Within a decentralized decision-making framework, the supplier, acting as the supply chain leader, establishes wholesale product prices. The retailer, functioning as a follower, subsequently determines retail prices based on the wholesale prices set by the supplier, often adjusting retail prices to maximize their profit margins. Within a centralized decision-making framework, the pricing of products is collaboratively established by the supplier and retailer. Given the supplier’s relatively stable production costs and their position as the supply chain leader, they wield significant influence, resulting in comparatively low retail prices.
Remark 4.
The comparative analyses of conservation initiatives and product marketing strategies across various decision-making scenarios are presented below:
ω m c > ω m t ,
ω r c > ω r t = ω r o .
Due to the supplier’s myopic decentralized decision-making, it fails to anticipate the implications of preservation efforts and, consequently, does not invest in the requisite technology, resulting in a lack of preservation efforts. Consequently, the government does not offer subsidies under these circumstances. From the comparative analysis, it is evident that centralized decision-making can achieve Pareto efficiency and fully incentivize suppliers to maintain product preservation. Decentralized decision-making, compared with centralized models, may diminish a firm’s preservation strategies, particularly when supplier foresight is a factor. This result is attributed to the retailer’s pricing strategy, which, in this case, results in prices exceeding the supplier’s wholesale costs. Consequently, the sales volume will likely decline, thereby adversely affecting the supplier’s profitability and potentially diminishing their incentive for preservation efforts. Regarding retail advertising expenditures, centralized decision-making continues to represent the most significant investment allocation.
Remark 5.
The game between a fresh food supplier and retailer is to ensure the maximization of their own interests, and consumer surplus and supply chain profits are important components of social welfare. The comparative analyses of supply chain profitability and consumer surplus across various decision-making methodologies are presented below:
V c > V t > V o ,
C S c > C S t > C S o .
Centralized decision-making generates the optimal profit across the entire value chain. When the supplier and retailer work closely together and develop in synergy, the profit formula of the entire supply chain is greater than the optimal profit under the other two decision-making models. The optimal strategy, in terms of maximizing respective benefits, will be adopted by both the supplier and the retailer only when the advantages of centralized decision-making surpass those of decentralized decision-making for each party. Similarly, consumer surplus is maximized, and centralized decision-making is also optimal.

4. Numerical Simulation Analysis

This section employs numerical simulations to validate the findings of the preceding study, examining the variations in retail prices, wholesale prices, preservation efforts, and other pertinent factors within the supply chain’s key entities under diverse decision-making scenarios, along with their consequential effects on supply chain profitability. The model presented in this paper comprises 17 symbols, as detailed in Table 3.
Drawing upon the parameter specifications established by Guo et al. [68] and Yao et al. [65], and the principles of mathematical feasibility and economic interpretability, this study adopts the following parameter values: s = 4 , a = 2 , H = 0.3 , c = 0.1 , m = 0.3 , r = 0.2 , b = 0.4 , f = 0.3 , q = 0.25 , χ = 0.25 , u = 0.4 , v = 0.3 , β = 0.3 , λ = 0.3 , η = 0.25 , θ = 0.25 . The value unit of the parameter is 100; the potential market scale ( s ) has no unit, and is set within the economically feasible range. Except for s and c , the values of other parameters are between 0 and 1.
As previously indicated, retail pricing is solely contingent upon the potential scale, product costs, and price elasticity of demand. Figure 2 illustrates the correlation between retail prices and price elasticity coefficients across three distinct decision-making paradigms.
Figure 2 reveals that the decentralized decision-making framework, whether predicated on the supplier’s long-term perspective or its myopic view, culminates in an identical retail price. Consequently, the corresponding curves in the graph display complete superposition. The retail prices, in descending order, are p c , p o , and p t , respectively. As the price elasticity coefficient escalates, the retail price trajectories across the three decision-making paradigms exhibit a precipitous decline, converging asymptotically, thereby signifying an inverse relationship between the price elasticity coefficient and retail prices. This simulation also validates Remark 3.

4.1. Trajectory Analyses of Temporal Evolution

4.1.1. Analysis of Product Freshness Trajectory

The fresh-making ability of fresh produce significantly influences the sustained market performance of these goods. To maintain product freshness, the supplier must implement stringent freshness protocols throughout production and distribution. Furthermore, preservation techniques are essential to mitigate spoilage and safeguard profitability. With all other variables held constant, the initial freshness value of the product is set to G 0 = 100 to analyze the trajectory of product freshness degradation. At this point, the time evolution trajectory of product freshness can be obtained for the three decision models (Figure 3).
Based on Figure 3, the three decision-making paradigms demonstrate distinct evolutionary trajectories, ultimately converging towards a state of equilibrium. Product freshness represents an irreversible state. Across all three decision-making scenarios, product freshness exhibits a decaying trend over time, ultimately converging to a state of equilibrium. With centralized decision-making, the freshness maintenance of products is the highest. Conversely, decentralized decision-making, particularly when the supplier exhibits short-term perspectives, leads to the lowest levels of product freshness compared to decentralized strategies predicated on forward-looking supplier behavior.

4.1.2. Analysis of Consumer Preference Trajectory

Consumers exhibit a heightened sensitivity to the perishability and promotional activities associated with fresh produce when making their purchasing decisions. Enhanced product promotion and freshness levels demonstrate a positive correlation with heightened trust of consumers. To analyze the evolutionary trajectory of consumer preferences while holding other model parameters constant, the initial values for consumer preferences are designated as ‘ N 0 = 0 ’ and ‘ N 0 = 300 ’, respectively. Figure 4 and Figure 5 illustrate the trajectory of consumer preference evolution across the three decision-making models.
Figure 4 and Figure 5 reveal that the evolution of consumer preferences among the three decision-making models is contingent upon the initial consumer preference values. In instances of low initial consumer preference, a sustained trajectory of preference escalation is anticipated over time. However, when the initial consumer preference registers at a high level, a subsequent decline in consumer preference is anticipated. Regardless of the initial consumer preference parameter, the steady-state values of various decision outcomes have no impact. In a centralized decision-making framework, the equilibrium value of consumer preference is maximized, followed by decentralized decision-making with supplier foresight, and lastly, decentralized decision-making with supplier myopia.

4.1.3. Analysis of Goodwill Trajectory

A company’s intangible assets—specifically, its goodwill—substantially influence its growth trajectory, and are correlated with its long-term financial performance. The goodwill of a company is contingent upon several determinants, encompassing product freshness, the level of advertising, and consumer preferences. By maintaining the invariance of the model’s other parameters, the evolution trajectory of goodwill is examined under three distinct decision-making paradigms. The initial goodwill values are established as ‘ M 0 = 10 ’ and ‘ M 0 = 600 ’, respectively, and the resulting outcomes are illustrated in Figure 6 and Figure 7.
Figure 6 and Figure 7 reveal that the initial goodwill value significantly influences the trajectory of goodwill fluctuations. A high initial value correlates with a declining trend across all three decision models, whereas a low initial value is associated with an upward trend in goodwill changes across all three decision models. Regardless of the initial goodwill valuation, its impact diminishes over time, leading to a stable state. Therefore, the steady-state value of goodwill is independent of the initial valuation, and is solely determined by the decision-making models. The steady-state value of goodwill is maximized under centralized decision-making. This is followed by decentralized decision-making with supplier foresight, and is minimized under decentralized decision-making with supplier myopia.

4.1.4. Brief Summary

According to the analyses of the time evolution trajectory above, the following conclusions can be made:
(1) Under supplier myopia, the supplier inadequately accounts for the preservation impact of mitigation strategies on fresh goods, leading to substantially elevated losses of fresh products relative to the other two decision-making models. Across both the centralized and decentralized decision-making models, active investment in preservation initiatives and the pursuit of enhanced preservation metrics enable products to unleash higher value.
(2) Within a framework of centralized decision-making, the supplier and retailer engage in collaborative decision-making, characterized by aligned incentives. To optimize collective welfare, both parties may forgo certain individual gains, thereby fostering a mutually beneficial outcome. The forward-looking, decentralized decision-making of the supplier, who invests in preservation efforts, will invariably elevate the wholesale cost of their goods. The retailer, aiming to maximize profitability, will subsequently mark up the wholesale price when establishing retail prices. This scenario will result in escalated product prices, which will ultimately influence consumer purchasing behavior. In scenarios involving a short-term supplier, product prices may not increase significantly, yet the assurance of fresh product quality becomes challenging. Consequently, a decline in consumer confidence ensues, culminating in the lowest possible steady-state value. However, when consumer preference exhibits a high degree of valuation and the consumer possesses a robust level of product familiarity, a decline in consumer preference valuation is observed, irrespective of the prevailing decision-making model.
(3) With centralized decision-making, the supplier proactively invests in preservation initiatives, the retailer actively merchandises products, the quality of fresh produce is assured, product pricing is competitive, product visibility is enhanced, and the brand reputation organically improves. In contrast to decentralized decision-making under the supplier’s foresight, the supplier’s lack of vision neglects the influence of preservation strategies on product freshness, consequently diminishing product quality. In this scenario, aggressive promotional activities by the retailer could exacerbate the negative impact on goodwill, precipitating an accelerated decline in goodwill and a subsequent reduction in its value.

4.2. Examination of Determinants Influencing Member Strategies

4.2.1. The Impact of u and α on Preservation Efforts

In the context of the supply chain, when the supplier engages in the wholesale distribution of perishable goods to the retailer, it typically allocates resources to preservation strategies. This investment is undertaken to maintain product integrity and, consequently, drive revenue enhancement. To stimulate the growth of the fresh produce market, the government will offer financial subsidies to vendors who implement measures to enhance product preservation. This segment presents an analysis of how the preservation coefficient ( u ) and the government subsidy rate ( α ) influence suppliers’ preservation endeavors. Holding all other model parameters constant, this part adjusts the preservation coefficient ( u ) and government subsidy rate ( α ), resulting in Figure 8 and Figure 9.
Figure 8 demonstrates a linear correlation between u and the supplier’s preservation efforts. With a rise in the factor u , suppliers demonstrate a heightened propensity to allocate resources towards preservation efforts. Furthermore, suppliers’ preservation efforts under centralized decision-making consistently surpass those under decentralized decision-making, and the disparity between preservation efforts under the two decision-making paradigms widens. This suggests that the factor u significantly influences suppliers’ preservation endeavors.
Based on Figure 9, a gradual increase in the influence coefficients, denoted as u and α , correlates with a heightened propensity among suppliers to engage in preservation efforts, subsequently leading to an elevated level of such efforts. Furthermore, the supplier’s preservation efforts exhibit a relatively slow increase when these two coefficients operate independently. The synergistic effect of the two coefficients will amplify suppliers’ incentives to implement preservation efforts. The figure further illustrates that the degree of preservation efforts under centralized decision-making consistently surpasses that under decentralized decision-making. Both decision-making approaches exhibit a positive correlation with the influence coefficient, thereby corroborating the preceding textual conclusions.

4.2.2. Analysis of the Impact of Factors f and λ on Retailers’ Promotional Efforts

An increase in sales volume will lead to an increase in revenue, thereby promoting the development of the enterprise. Retailers can leverage advertising to broaden product reach, stimulate consumer demand, and consequently bolster brand equity, thereby fostering business growth. This section manipulates factors f and λ , and observes the change trajectories that result, in order to investigate the effects of these variables on retailers’ promotional activities, while maintaining the same values for other model parameters. The detailed change trajectory is shown in Figure 10.
According to Figure 10, a gradual increase in the two parameters leads to a corresponding rise in retailers’ propensity for promotional activities, accompanied by an increase in the amount of funds invested in promotion. This suggests that the two parameters significantly influence retailers’ selection willingness. The figure further illustrates that, within a centralized decision-making framework, the two parameters exhibit the most substantial influence, whereas the impact of decentralized decision-making is less pronounced under both supplier foresight and supplier myopia scenarios. As the two parameters continue to escalate, the disparity concurrently expands.

4.2.3. Analysis of the Impact of Factors u and α on Supply Chain Profits

The aggregate profit within the supply chain is derived from the summation of profits generated by both suppliers and retailers. To effectively analyze the impact of conservation initiatives and governmental subsidy rates on supply chain profitability, while maintaining other model parameters constant, parameters u and α were adjusted to determine the relationship between supply chain profits and changes in these two parameters. The specific trajectory is shown in Figure 11.
As shown in Figure 11, the supply chain’s profitability exhibits a sustained upward trajectory, with an accelerating growth rate, attributable to conservation initiatives and the progressive augmentation of governmental subsidy rates. Among them, the profit value of the supply chain under centralized decision-making is strictly superior to that under the other two decision models. In contrast to scenarios with supplier foresight, the supply chain profit under decentralized decision-making consistently reaches its nadir when suppliers exhibit short-term behavior.

4.2.4. Analysis of the Impact of Factors u and α on Social Welfare

To foster the growth of the perishable goods market and mitigate challenges in the storage and distribution of fresh products, the government offers financial incentives to suppliers who actively contribute to the preservation and advancement of the fresh food sector. Indeed, the primary objective of the government is to optimize societal well-being. The social welfare function, denoted by L , comprises supply chain profits, consumer surplus, and government subsidies. Holding other variables constant, variations in either u or α result in alterations to social welfare concerning the two parameters, as depicted in Figure 12 and Figure 13. Building upon this framework, we further incorporate temporal dynamics into our analysis, examining how variations in government subsidy rate and its evolution over time affect overall social welfare. This relationship is illustrated in Figure 14.
In Figure 12, the social welfare curves among the three decision-making models are correspondingly altered by the intensifying effects of conservation initiatives. Specifically, under centralized decision-making, social welfare continues to experience an upward trajectory and maintains a dominant position due to the impact of preservation initiatives. In contrast to the supplier’s far-sighted perspective, the social welfare derived from decentralized decision-making, influenced by the supplier’s short-sighted focus, remains unaffected by conservation initiatives, maintaining the lowest level of social welfare among the three decision models. As shown in Figure 13, effective government subsidies can foster the robust development of enterprises, thereby furnishing the fresh produce sector with substantial support. But, the government needs to undertake rigorous market evaluations and precisely ascertain market dynamics to forestall the potential for over-subsidization. As shown in Figure 14, when the government subsidy rate is 0, social welfare continues to gradually increase over time. But, when the government’s subsidy rate gradually increases, the growth rate of social welfare is much faster than the stage with a subsidy rate of 0. However, when the government’s subsidy rate reaches a certain level and evolves over time, the fresh supply chain gradually enters a mature stage, at which point government subsidies will have a counterproductive effect.
Drawing upon the model’s conclusions and simulation outcomes, this paper recommends the following policy interventions to foster the robust and structured advancement of the fresh food supply chain.
As a fresh food supplier, it establishes the baseline for product quality. Ensuring the integrity of fresh products throughout the production and distribution chain necessitates the implementation of advanced preservation technologies. Given assured product quality, retailers will prioritize wholesale procurement, contingent upon a guaranteed wholesale volume. The advancement of preservation technology may initially elevate expenditure commitments; however, it is advantageous for the long-term viability of organizations. Enterprises can make sustained investments to ensure the enduring and robust development of the company.
Retailers allocate capital to advertising and promotional activities, aiming to maintain consistent product sales. The objectives include elevating brand recognition, stimulating consumer demand, and ultimately fortifying the brand’s equity and reputation. These efforts collectively contribute to the sustainable and structured growth of the brand.
In the allocation of supplier subsidies, the government should establish specific subsidy rates to comprehensively safeguard social welfare. However, the advancement of the fresh food industry necessitates not only the efforts of individual enterprises or governmental backing, but also the active collaboration of all stakeholders within the supply chain, with each entity fulfilling its designated roles to facilitate collective progress. Stakeholders within the fresh produce supply chain are incentivized to enhance product quality. Suppliers seek to optimize freshness, retailers actively market their goods, and the government offers supportive measures. These efforts aim to mitigate losses, ensure product integrity, and expedite distribution, thereby fostering the sustainable advancement of the fresh supply chain.

5. Conclusions

5.1. Main Conclusions

Under the policy of government subsidies, this study constructs a dynamic supply chain system that includes the fresh food supplier and retailer, taking preservation efforts and member behavior choices as entry points. By solving and analyzing the equilibrium strategy and using numerical simulation to analyze the impact of various influence coefficients on enterprise decision-making and revenue, the long-term effects of supplier efforts in preservation were further analyzed. The main conclusions drawn are as follows:
Initially, wholesale prices remain invariant across different decision-making frameworks, contingent solely upon potential market size, product costs, and price elasticity coefficients. In contrast to centralized decision-making, decentralized decision-making tends to result in relatively high retail prices. Furthermore, product retail prices exhibit a gradual decline as the price elasticity coefficient increases.
Secondly, the government subsidy level should be controlled at around 0.6, and targeted subsidy rates need to be formulated. Furthermore, as time passes, when the fresh supply chain gradually enters a mature stage, continued government subsidies will have a counterproductive effect.
Thirdly, when suppliers exhibit far-sighted behavior, companies will gain long-term benefits.
Finally, centralized decision-making enables the rational distribution of profits among various stakeholders, and each stakeholder can find a balanced strategic choice from the game. In the long-term development process, retailers are more willing to cooperate with foresighted suppliers.

5.2. Research Shortcomings and Prospects

Overall, this study still has shortcomings in model construction and numerical simulation.
Firstly, this study studies the secondary supply chain of the individual supplier and retailer, but the real fresh food supply chain relationship is complex. Further research on multi-agent supply chain decision-making should be considered.
Secondly, this study considers the impact of the preservation efforts of the supplier and the promotion efforts of the retailer on the development of the fresh supply chain. In the future, a hybrid coordination mechanism [69] should be considered to design a ‘preservation-advertising’ joint contract.
Thirdly, the numerical simulation values in the article are mainly set based on references from the literature, mathematical feasibility, and economic interpretability, and cannot comprehensively analyze the effects of various influencing factors. We will consider combining empirical evidence with models to measure relevant factors in the future [70], which can better solve problems in the fresh food supply chain from a practical perspective.
Finally, this study considers the impact of supplier myopia on decision-making. However, in the decision-making process of the supply chain, other entities may also exhibit myopic behavior, and further research can be conducted on other entities [71].

Author Contributions

Conceptualization, Y.X. and H.R.; methodology, Y.X. and X.H.; software, Y.X.; writing—original draft preparation, Y.X., L.H. and H.R.; writing—review and editing, L.H., Y.X., H.R. and X.H.; funding acquisition, H.R. and X.H. All authors have read and agreed to the published version of the manuscript.

Funding

This research was funded by the Jiangxi Humanities and Social Science Research Project, grant number GL24108.

Institutional Review Board Statement

Not applicable.

Informed Consent Statement

Not applicable.

Data Availability Statement

No new data were created or analyzed in this study. Data sharing is not applicable to this article.

Conflicts of Interest

The authors declare no conflicts of interest.

Appendix A

Proof of Proposition 1.
This paper utilizes the Hamilton–Jacobi–Bellman (HJB) equation to address differential game scenarios. According to the principle of reverse solving, the expressions for the optimal decision of the supply chain are first calculated, and their HJB equations are shown below.
The HJB equation of the supplier is as follows:
θ V m t = ( w c ) ( s H p ) a M ( 1 α ) m 2 ω m 2 + V m t M [ b G + χ N + f ω r q M ] + V m t G ( u ω m v G ) + V m t N ( β G + λ ω r η N ) .
The HJB equation of the retailer is as follows:
θ V r t = ( p w ) ( s H p ) a M r 2 ω r 2 + V r t M [ b G + χ N + f ω r q M ] + V r t G ( u ω m v G ) + V r t N ( β G + λ ω r η N ) .
Based on the first-order condition, this section will differentiate Equations (A1) and (A2) with respect to w , p , ω m , and ω r . The optimal wholesale price and retail price are derived from the solution of the equations, as detailed in Equations (10) and (11). The subsequent findings are presented below.
ω m t = u ( 1 α ) m V m t G ,
ω r t = 1 r ( f V r t M + λ V r t N ) .
Then, by substituting w t , p t , ω m t and ω r t into Equations (A1) and (A2), we can obtain the following:
θ V m t = ( s H c ) 2 8 H a M + u 2 2 ( 1 α ) m ( V m t G ) 2 + f 2 r V m t M V r t M + λ f r V m t M V r t N + λ f r V r t M V m t N + λ 2 r V m t N V r t N + V m t M [ b G + χ N q M ] v G V m t G + V m t N ( β G η N ) ,
θ V r t = ( s H c ) 2 16 a M + f 2 2 r ( V r t M ) 2 + λ f r V r t M V r t N + λ 2 2 r ( V r t N ) 2 + u 2 ( 1 α ) m V r t G V m t G + V r t M [ b G + χ N q M ] v G V r t G + V r t N ( β G η N ) .
Upon examination of Equations (A5) and (A6), a linear relationship is observed between the function and preservation efforts ( G ), brand goodwill ( M ), and consumer preferences ( N ). Subsequently, given that the supplier value function’s structural form is denoted as ‘ V m t = m 1 t M + m 2 t G + m 3 t N + m 4 t ’, and the retailer value function’s structural form is denoted as ‘ V r t = r 1 t M + r 2 t G + r 3 t N + r 4 t ’, consequently, the ultimate optimal preservation effort and optimal promotional effort are derived, which are detailed in Equations (12) and (13). In the end, by incorporating the assumed equations into Equations (A5) and (A6), respectively, and subsequently consolidating and rearranging them, the following equations are yielded:
θ ( m 1 t M + m 2 t G + m 3 t N + m 4 t ) = ( s H c ) 2 8 H a M + u 2 2 ( 1 α ) m ( m 2 t ) 2 + f 2 r m 1 t r 1 t + λ f r m 1 t r 3 t + λ f r m 3 t r 1 t + λ 2 r m 3 t r 3 t + m 1 t [ b G + χ N q M ] v G m 2 t + m 3 t ( β G η N ) ,
θ ( r 1 t M + r 2 t G + r 3 t N + r 4 t ) = ( s H c ) 2 16 a M + f 2 2 r ( r 1 t ) 2 + λ f r r 1 t r 3 t + λ 2 2 r ( r 3 t ) 2 + u 2 ( 1 α ) m r 2 t m 2 t + r 1 t [ b G + χ N q M ] v G r 2 t + r 3 t ( β G η N ) .
Summarizing and organizing Equations (A7) and (A8) yields the subsequent equations: ( θ + q ) m 1 t = ( s H c ) 2 8 H a , ( θ + η ) m 3 t = m 1 t χ , ( θ + v ) m 2 t = b m 1 t + β m 3 t , ( θ + q ) r 1 t = ( s H c ) 2 16 a , ( θ + η ) r 3 t = r 1 t χ , ( θ + v ) r 2 t = b r 1 t + β r 3 t , θ r 4 t = f 2 2 r ( r 1 t ) 2 + λ f r r 1 t r 3 t + λ 2 2 r ( r 3 t ) 2 + u 2 ( 1 α ) m r 2 t m 2 t , θ m 4 t = u 2 2 ( 1 α ) m ( m 2 t ) 2 + f 2 r m 1 t r 1 t + λ f r m 1 t r 3 t + λ f r m 3 t r 1 t + λ 2 r m 3 t r 3 t .
To assess the product freshness of the supplier over time, we substitute Equation (12) into Equation (3), resulting in differential Equation (A9).
G t + v G = u 2 ( 1 α ) m m 2 t .
Based on the initial condition G ( 0 ) = G 0 , the application of the first-order linear non-homogeneous equation’s solution formula yields the product’s freshness trajectory over time, as defined by Equation (17). Here, u 2 m 2 t v ( 1 α ) m represents the product’s sustained freshness metric. Similarly, changes in the status of goodwill and consumer sentiment can be quantified. □

Appendix B

Proof of Proposition 2.
According to the principle of reverse solving, the expressions for the optimal decision of the supply chain are first calculated, and their HJB equations are shown below.
The HJB equation of the supplier is as follows:
θ V m o = ( w c ) ( s H p ) a M + V m t M [ b G + χ N + f ω r q M ] V m t G v G + V m t N ( β G + λ ω r η N ) .
The HJB equation of the retailer is as follows:
θ V r o = ( p w ) ( s H p ) a M r 2 ω r 2 + V r o M [ b G + χ N + f ω r q M ] V r o G v G + V r o N ( β G + λ ω r η N ) .
Based on the first-order condition, this section will differentiate Equations (A10) and (A11) with respect to w , p , and ω r . The optimal wholesale price and retail price are detailed in Equations (22) and (23), and the best publicity effort is as follows:
ω r o = 1 r ( f V r o M + λ V r o N ) .
Then, by substituting Equations (22), (23) and (A12) into Equations (A10) and (A11), we can obtain the following:
θ V m o = ( s H c ) 2 8 H a M + f 2 r V m o M V r o M + λ f r V m o M V r o N + λ f r V r o M V m o N + λ 2 r V m o N V r o N + V m o M [ b G + χ N q M ] v G V m o G + V m o N ( β G η N ) ,
θ V r o = ( s H c ) 2 16 a M + f 2 2 r ( V r o M ) 2 + λ f r V r o M V r o N + λ 2 2 r ( V r o N ) 2 + V r o M [ b G + χ N q M ] v G V r o G + V r o N ( β G η N ) .
Upon examination of Equations (A13) and (A14), a linear relationship is observed between the function and preservation efforts ( G ), brand goodwill ( M ), and consumer preferences ( N ). Subsequently, we express the structural form of the supplier value function as ‘ V m o = m 1 o M + m 2 o G + m 3 o N + m 4 o ’, and the retailer value function’s structural form is denoted as ‘ V r o = r 1 o M + r 2 o G + r 3 o N + r 4 o ’. Then, we can obtain the following: V m o M = m 1 o , V m o G = m 2 o , V m o N = m 3 o , V r o M = r 1 o , V r o G = r 2 o , V r o N = r 3 o . Consequently, the optimal promotional effort is derived, which is detailed in Equation (24). In the end, by incorporating the assumed equations into Equations (A13) and (A14), respectively, and subsequently consolidating and rearranging them, the following equations are yielded:
θ ( m 1 o M + m 2 o G + m 3 o N + m 4 o ) = ( s H c ) 2 8 H a M + f 2 r m 1 o r 1 o + λ f r m 1 o r 3 o + λ f r m 3 o r 1 o + λ 2 r m 3 o r 3 o + m 1 o [ b G + χ N q M ] v G m 2 o + m 3 o ( β G η N ) ,
θ ( r 1 o M + r 2 o G + r 3 o N + r 4 o ) = ( s H c ) 2 16 a M + f 2 2 r ( r 1 o ) 2 + λ f r r 1 o r 3 o + λ 2 2 r ( r 3 o ) 2 + r 1 o [ b G + χ N q M ] v G r 2 o + r 3 o ( β G η N ) .
Summarizing and organizing Equations (A15) and (A16) yields the following equations:
( θ + q ) m 1 o = ( s H c ) 2 8 H a , ( θ + η ) m 3 o = m 1 o χ , ( θ + v ) m 2 o = b m 1 o + β m 3 o , ( θ + q ) r 1 o = ( s H c ) 2 16 a , ( θ + η ) r 3 o = r 1 o χ , ( θ + v ) r 2 o = b r 1 o + β r 3 o , θ m 4 o = f 2 r m 1 o r 1 o + λ f r m 1 o r 3 o + λ f r m 3 o r 1 o + λ 2 r m 3 o r 3 o , θ r 4 o = f 2 2 r ( r 1 o ) 2 + λ f r r 1 o r 3 o + λ 2 2 r ( r 3 o ) 2 .
Since the supplier has not invested in preservation efforts, ω m r = 0 . We substitute ω m r = 0 into Equation (3) to obtain the differential Equation (A17).
G t + v G = 0 .
Based on the initial condition G ( 0 ) = G 0 , the application of the first-order linear non-homogeneous equation’s solution formula yields the product’s freshness trajectory over time, as defined by Equation (28). Similarly, changes in the status of goodwill and consumer sentiment can be quantified. □

Appendix C

Proof of Proposition 3.
Employing the principle of backward induction, the expression for the optimal decision of the supply chain is calculated, and its HJB equation is shown below.
The HJB equation of the supply is as follows:
θ V c = ( p c ) ( s H p ) a M ( 1 α ) m 2 ω m 2 r 2 ω r 2 + V c M [ b G + χ N + f ω r q M ] + V c G ( u ω m v G ) + V c N ( β G + λ ω r η N ) .
Based on the first-order condition, differentiating the equation with respect to ω m , ω r , and p , and subsequently rearranging the derived equations, allows for the determination of the optimal price ( p c ), optimal promotional effort ( ω r c ), and optimal preservation investment ( ω m c ). The results are as follows:
p c = s + H c 2 H ,
ω m = u ( 1 α ) m V c G ,
ω r = f r V c M + λ r V c N .
Then, by substituting p c , ω m , and ω r into Equation (A18), we can obtain the following:
θ V c = ( s H c ) 2 4 H a M + u 2 2 ( 1 α ) m ( V c G ) 2 + f 2 2 r ( V c M ) 2 + λ f r V c M V c N + λ 2 2 r ( V c N ) 2 + V c M ( b G + χ N q M ) v G V c G + V c N ( β G η N ) .
By observing Equation (A22), a linear relationship is revealed between the function and preservation efforts ( G ), brand goodwill ( M ), and consumer preferences ( N ). Consequently, assuming the value function’s structural form is V c = g 1 c M + g 2 c G + g 3 c N + g 4 c , then V c M = g 1 c , V c G = g 2 c , V c N = g 3 c , and these can be substituted into Equation (A22) for inductive reasoning and organizational purposes, specifically, as follows:
θ ( g 1 c M + g 2 c G + g 3 c N + g 4 c ) = ( s H c ) 2 4 H a M + u 2 2 ( 1 α ) m ( g 2 c ) 2 + f 2 2 r ( g 1 c ) 2 + λ f r g 1 c g 3 c + λ 2 2 r ( g 3 c ) 2 + g 1 c ( b G + χ N q M ) v G g 2 c + g 3 c ( β G η N ) .
By merging similar terms, Equation (A23) is obtained as follows: ( θ + q ) g 1 c = ( s H c ) 2 4 H a , ( θ + v ) g 2 c = b g 1 c + β g 3 c , ( θ + η ) g 3 c = χ g 1 c , θ g 4 c = u 2 ( g 2 c ) 2 2 ( 1 α ) m + f 2 2 r ( g 1 c ) 2 + λ f r g 1 c g 3 c + λ 2 2 r ( g 3 c ) 2 . Based on the analysis, g 1 c , g 2 c , g 3 c , and g 4 c can be determined.
To understand the freshness level of the supplier’s products at different times, substituting Equation (33) into Equation (3) yields the following:
G t = u 2 ( 1 α ) m g 2 c v G .
Given the initial condition G ( 0 ) = G 0 , the trajectory of product freshness over time can be determined by solving the first-order linear non-homogeneous equation under a centralized decision-making framework. In this context, u 2 g 2 c v ( 1 α ) m signifies the product’s stable freshness value. Utilizing an analogous approach, we can ascertain the shifts in goodwill and consumer preferences within a centralized decision-making framework. □

References

  1. Liu, J.; Chen, Z.P.; Consigli, G. Interval-based stochastic dominance: Theoretical framework and application to portfolio choices. Ann. Oper. Res. 2021, 307, 329–361. [Google Scholar] [CrossRef] [PubMed]
  2. Hyun, J.E.; Lee, S.Y. Blue light-emitting diodes as eco-friendly non-thermal technology in food preservation. Trends Food Sci. Technol. 2020, 105, 284–295. [Google Scholar] [CrossRef]
  3. Boxma, O.; Perry, D.; Stadje, W. Perishable inventories with random input: A unifying survey with extensions. Ann. Oper. Res. 2024, 332, 1069–1105. [Google Scholar] [CrossRef]
  4. Fang, X.; Yuan, F.J.; Cai, J.R. An optimized coordination model of freshness-keeping efforts and shelf service for fresh produce supply chain. Chin. J. Manag. Sci. 2023, 31, 142–152. [Google Scholar]
  5. Wu, Y.T.; Zhu, A.M. Research on the fresh-keeping cooperation strategy of fresh supply chain members under government subsidies. Syst. Eng. 2024, 1–12. [Google Scholar]
  6. Wu, S.; Li, B.; Li, Y.R. Advance selling decisions of retailer in dual channel of the fresh product supply chain. J. Syst. Eng. 2023, 38, 372–394. [Google Scholar]
  7. CCLC, National Agricultural Products Modern Logistics Engineering Technology Research Center. Wanwei Cold Chain; 2024 China Cold Chain Logistics Development Report; China Fortune Press: Beijing, China, 2024. [Google Scholar]
  8. Zhao, Z.; Cheng, Y. Coordination of fresh product supply chain with option contract considering freshness-keeping effort. Chin. J. Manag. Sci. 2024, 32, 258–269. [Google Scholar]
  9. Xiao, M.; Zhang, S.Y. Research on fresh supply chain preservation effort and advertising cost sharing considering risk attitude. J. Hefei Univ. Technol. 2023, 46, 1564–1572. [Google Scholar]
  10. Dan, B.; Lei, T.; Zhang, X.M.; Liu, M.L.; Ma, S.X. Modeling of the subsidy policy in fresh produce wholesale markets under yield uncertainty. Econ. Model. 2023, 126, 106413. [Google Scholar] [CrossRef]
  11. Zhu, J.H.; Zhang, X.M.; Dan, B. Combined policy of fiscal subsidies and tax reduction in fresh produce supply chain. Syst. Eng. Theory Pract. 2024, 44, 2557–2575. [Google Scholar]
  12. Benchekroun, H.; Martin-Herran, G.; Taboubi, S. Could myopic pricing be a strategic choice in marketing channels? A game theoretic analysis. J. Econ. Dyn. Control 2009, 33, 1682–1698. [Google Scholar] [CrossRef]
  13. Yu, M.Y.; Lu, K.F.; Ruan, Y.P. Supply chain network location and enterprise competitive position. Syst. Eng. Theory Pract. 2022, 42, 1796–1810. [Google Scholar]
  14. He, Y.; Hao, X.L. Empowerment or disempowerment: Supply chain digitization and corporate ESG performance. Resour. Ecol. Manag. 2025, 46, 96–118. [Google Scholar]
  15. Liu, Y.; Zhang, J.X.; Zhang, S.C.; Liu, G.W. Prisoner’s dilemma on behavioral choices in the presence of sticky prices: Farsightedness vs myopia. Int. J. Prod. Econ. 2017, 191, 128–142. [Google Scholar] [CrossRef]
  16. Huang, Z.; Bai, P. Dynamic cooperative promotion in the presence of private brand introduction and retailer myopic behavior. Dyn. Games Appl. 2024, 14, 1131–1159. [Google Scholar] [CrossRef]
  17. Wen, Y.; Yu, X.Y.; Hu, J.S. R&D innovation strategy and behavior choice of competition drug supply chain. J. Shandong Univ. 2023, 58, 18–31. [Google Scholar]
  18. Wu, S.C.; Wang, H.; Guo, Y.; Fan, Y.J. Supply chain concentration, financing constraints, and carbon performance. Sustainability 2024, 16, 1354. [Google Scholar] [CrossRef]
  19. Arash, A.; Imad Taher, L.; Bita, M. The impact of managerial psychological characteristics on the supply chain management efficiency. TQM J. 2025, 37, 150–170. [Google Scholar]
  20. He, Y.; Chen, L.D.; Xu, Q.Y. Optimal pricing decisions for a global fresh product supply chain in the blockchain technology era. Int. J. Logist. Res. Appl. 2021, 27, 649–666. [Google Scholar] [CrossRef]
  21. Di, W.; Tian, X.Y.; Guo, M.C. Pricing decision and channel selection of fresh agricultural products dual-channel supply chain based on blockchain. PLoS ONE 2024, 19, e0297484. [Google Scholar]
  22. Jiang, Y.C.; Cao, J.X.; Zhu, H.J. Research on inventory control and pricing decisions in the supply chain of fresh agricultural products under the advertisement delay effect. IEEE Access 2024, 12, 197468–197487. [Google Scholar]
  23. Guan, Z.M.; Mou, Y.X.; Sun, M.H. Hybrid robust and stochastic optimization for a capital-constrained fresh product supply chain integrating risk-aversion behavior and financial strategies. Comput. Ind. Eng. 2022, 169, 108224. [Google Scholar] [CrossRef]
  24. Lu, Z.G.; Yu, J.X. An OGSM-based multi-objective optimization model for partner selection in fresh produce supply chain considering carbon emissions. Comput. Ind. Eng. 2024, 194, 110402. [Google Scholar] [CrossRef]
  25. Zhang, D.F.; Shen, Z.F.; Li, Y.L. Requirement analysis and service optimization of multiple category fresh products in online retailing using importance-Kano analysis. J. Retail. Consum. Serv. 2023, 72, 103253. [Google Scholar] [CrossRef]
  26. Feng, Z.; Jin, P.; Li, G. Investment decision of blockchain technology in fresh food supply chains considering misreporting behavior. Sustainability 2023, 15, 7421. [Google Scholar] [CrossRef]
  27. Liu, Y.H.; Ma, D.Q.; Hu, J.S.; Zhang, Z.Y. Sales mode selection of fresh food supply chain based on blockchain technology under different channel competition. Comput. Ind. Eng. 2021, 162, 107730. [Google Scholar] [CrossRef]
  28. Yuan, H.P.; Zhang, L.; Cao, B.B.; Chen, W.W. Optimizing traceability scheme in a fresh product supply chain considering product competition in blockchain era. Expert Syst. Appl. 2024, 258, 125127. [Google Scholar] [CrossRef]
  29. Yan, B.; Liu, Y.P.; Fan, J. Two-echelon fresh product supply chain with different transportation modes. Ann. Oper. Res. 2022, 1–24. [Google Scholar] [CrossRef]
  30. Zeng, M.; Wu, Y.X.; Xing, X.L.; Tang, W.J.; Xu, H.Y. Coordinating principal-agent and incentive strategy of cold chain logistics service in fresh food supply chain. PLoS ONE 2024, 19, e0306976. [Google Scholar] [CrossRef]
  31. Siraj, Z.R. Optimizing supply chain management of fresh e-commerce agri-consumer products using energy-efficient vehicle routing. IEEE Trans. Consum. Electr. 2024, 70, 1685–1693. [Google Scholar]
  32. Wang, Y.Y.; Wu, Q.C.; Cheng, T.C.E.; Sun, Y.L. Supply chain modelling considering blockchain improvement and publicity with fairness concern. J. Intell. Manuf. 2025, 36, 681–702. [Google Scholar] [CrossRef]
  33. Wang, G.; Shen, J.F. Decision-making of fresh supply chain based on cost-sharing contract. J. Cent. China Norm. Univ. 2019, 53, 977–986. [Google Scholar]
  34. Wang, W.B.; Zhu, A.M.; Yu, L.J.; Wer, H.J. Research on cooperative advertising strategies for dual channel supply chain of fresh agricultural products considering carbon reduction efficiency under retailer leadership. PLoS ONE 2024, 19, e0303525. [Google Scholar]
  35. Guo, F.; Zhang, T.; Huang, X.; Zhong, Y. Government subsidy strategies considering greenness on agricultural product e-commerce supply chain. Mathematics 2023, 11, 1662. [Google Scholar] [CrossRef]
  36. Wu, Z.X.; Zhu, J.L. Optimal strategies for contract farming supply chain with government subsidies under e-commerce assistance to farmers. PLoS ONE 2024, 19, e0311490. [Google Scholar] [CrossRef]
  37. Xu, Y.; Tian, Y.; Pang, C.; Tang, H. Manufacturer vs. Retailer: A comparative analysis of different government subsidy strategies in a dual-channel supply chain considering green quality and channel preferences. Mathematics 2024, 12, 1433. [Google Scholar] [CrossRef]
  38. Shi, L.G.; Pang, T.; Peng, H.J.; Feng, X. Green technology outsourcing for agricultural supply chains with government subsidies. J. Clean. Prod. 2024, 436, 140674. [Google Scholar] [CrossRef]
  39. Guo, L.B.; Zhang, Q.Q.; Wu, J.; Gonzalez, E.D.R.S. An evolutionary game model of manufacturers and consumers’ behavior strategies for green technology and government subsidy in supply chain platform. Comput. Ind. Eng. 2024, 189, 109918. [Google Scholar] [CrossRef]
  40. Zhang, R.R.; Ma, W.M.; Liu, J.J. Impact of government subsidy on agricultural production and pollution: A game-theoretic approach. J. Clean. Prod. 2021, 285, 124806. [Google Scholar] [CrossRef]
  41. Song, H.X.; Li, Q.X. Decision-making in closed-loop supply chains: Effects of government subsidies and risk aversion. Int. Rev. Financ. Anal. 2024, 96, 103566. [Google Scholar] [CrossRef]
  42. Zhang, R.; Huang, Z.J.; Liu, B.; Wang, J.L. Freshness-keeping efforts and value-added service choice in fresh food supply chain. Comput. Ind. Eng. 2024, 190, 110063. [Google Scholar] [CrossRef]
  43. Liu, M.L.; Dan, B.; Zhang, S.G.; Ma, S.X. Information sharing in an E-tailing supply chain for fresh produce with freshness-keeping effort and value-added service. Eur. J. Oper. Res. 2021, 290, 572–584. [Google Scholar] [CrossRef]
  44. Feng, Y.G.; Hu, Y.; He, L. Research on coordination of fresh agricultural product supply chain considering fresh-keeping effort level under retailer risk avoidance. Discrete Dyn. Nat. Soc. 2021, 2021, 1–15. [Google Scholar] [CrossRef]
  45. Chen, X.; Li, J.; Wang, Z. Equilibrium decisions for fresh product supply chain considering consumers’ freshness preference. Netw. Spat. Econ. 2023, 23, 771–797. [Google Scholar] [CrossRef]
  46. Yang, Y.; Yao, G.X. Fresh-keeping decision and coordination of fresh agricultural product supply chain considering carbon cap-and-trade under different dominance. J. Syst. Sci. Syst. Eng. 2024, 33, 30–51. [Google Scholar] [CrossRef]
  47. Liao, Z.Z.Y.; Li, C.L.; Lu, L.; Luo, X.C. The improvement strategy of fresh produce supply chain resilience based on extenics. PLoS ONE 2024, 19, e0309008. [Google Scholar] [CrossRef]
  48. Yang, M.Y.; Qu, S.J.; Ji, Y.; Abdoulrahaman, D.B. Vulnerability of fresh agricultural products supply chain: Assessment, interrelationship analysis and control strategies. Socio-Econ. Plan. Sci. 2024, 94, 101928. [Google Scholar] [CrossRef]
  49. Zhang, H.; Yan, J.N.; Wang, L.L. Hybrid tabu-grey wolf optimizer algorithm for enhancing fresh cold-chain logistics distribution. PLoS ONE 2024, 19, e0306166. [Google Scholar] [CrossRef]
  50. Wang, Y.; Gao, B. Dual-channel supply chain of agricultural products under centralised and decentralised decision-making. Appl. Sci. 2024, 14, 8039. [Google Scholar] [CrossRef]
  51. Ran, W.; Chen, Y. Fresh produce supply chain coordination based on freshness preservation strategy. Sustainability 2023, 15, 8184. [Google Scholar] [CrossRef]
  52. Zhao, H.Y.; Yang, J. Evolutionary game analysis of stakeholders’ decision-making behavior in agricultural data supply chain. Front. Phys. 2024, 11, 1–17. [Google Scholar] [CrossRef]
  53. Cheng, Y.K.; Wang, X.X.; Tian, X.M.; Chen, J.M. Study of the Cooperation between E-commerce Platform and Merchants Based on Differential Game. Oper. Res. Manag. Sci. 2023, 32, 56–63. [Google Scholar]
  54. Isaacs, R. Differential Games; John Wiley Sons: New York, NY, USA, 1965. [Google Scholar]
  55. Mu, X.P.; Liu, J.J.; Pu, Y.T. Differential games in the supply chain of innovative products with consumer purchase regret induced returns. PLoS ONE 2024, 19, e0302154. [Google Scholar] [CrossRef]
  56. Shi, T.; Xiao, X.; Liu, G.F. Dynamic coordination strategy of fresh supply chain based on compound contract mechanism. J. Chongqing Univ. Technol. 2020, 34, 228–237. [Google Scholar]
  57. Zhang, K.J.; Ma, M.Q. Differential game model of a fresh dual-channel supply chain under different return modes. IEEE Access 2021, 9, 8888–8901. [Google Scholar] [CrossRef]
  58. Liu, Z.; Huang, Y.Q.; Shang, W.L.; Zhao, Y.J.; Yang, Z.L.; Zhao, Z. Precooling energy and carbon emission reduction technology investment model in a fresh food cold chain based on a differential game. Appl. Energy 2022, 326, 119945. [Google Scholar] [CrossRef]
  59. De Zeeuw, A. A crash course in differential games and applications. Environ. Resour. Econ. 2024, 87, 1521–1544. [Google Scholar] [CrossRef]
  60. Li, X.R.; Ou Yang, A.W. A study on pricing and coordination of online fresh produce supply chain considering time and temperature. Ind. Eng. Manag. 2024, 29, 32–39. [Google Scholar]
  61. Dong, Z.N.; Zhou, X.J.; Lin, Q. Coordination of fresh products supply chain with freshness-keeping effort. J. Syst. Eng. 2022, 37, 362–374. [Google Scholar]
  62. Wang, W.L.; He, Z.Y.; Zhang, S.X. Joint decision of freshness-keeping effort and promotion effort in a dual-channel fresh produce supply chain from a dynamic perspective. Chin. J. Manag. Sci. 2023, 1–16. [Google Scholar]
  63. Luo, M.; Zhou, G.H. Research on temperature control input of three-level supply chain of fresh agricultural products based on differential game. Oper. Res. Manag. Sci. 2024, 33, 64–68. [Google Scholar]
  64. Nerlove, M.; Arrow, K.J. Optimal advertising policy under dynamic conditions. Economica 1962, 114, 129–142. [Google Scholar] [CrossRef]
  65. Yao, F.J.; Xiao, H.; Gao, Y.; Gao, H.W. A Differential Game Study of Supply Chain Considering Consumers’ Green preference and Member’s Behavior under Cap-and-trade Policy. Chin. J. Manag. Sci. 2024, 32, 231–241. [Google Scholar]
  66. Su, B.W.; Zheng, Q. Supply Chain Coordination of Fresh Products with Government Subsidy in the Live-streaming E-commerce. Oper. Res. Manag. 2024, 33, 71–77. [Google Scholar]
  67. Panda, S.; Mohan Modak, N.; Cárdenas-Barrón, L.E. Coordinating a socially responsible closed-loop supply chain with product recycling. Int. J. Prod. Econ. 2017, 188, 11–21. [Google Scholar] [CrossRef]
  68. Guo, W.Q.; Liang, Y.Z.; Ming, L. Dynamic strategy for low-carbon supply chain considering retailers competition and technological innovation. Heliyon 2023, 10, e27474. [Google Scholar] [CrossRef]
  69. Li, Z.P.; Wang, J.J. High-Quality Service Capacity Reallocation Decision and Profit-Sharing Coordination Scheme Design in the Hierarchical Healthcare Systems. Chin. J. Manag. Sci. 2023, 31, 205–217. [Google Scholar]
  70. Huang, X.Q.; Ye, Q.L.; Fu, H.J. Identification and Measurement of Key Factors of Energy Security Based on Dual Perspectives; Central South University Press: Changsha, China, 2024; Volume 10, pp. 106–138. [Google Scholar]
  71. Wang, H.; Bai, C.G.; Zhang, C. The optimal inventory policy of perishable retailers considering regret behavior of strategic consumers. J. Ind. Eng. Eng. Manag. 2024, 38, 251–270. [Google Scholar]
Figure 1. Supply chain flowchart of three decision-making models.
Sustainability 17 04820 g001
Figure 2. Comparison of p under three decision-making models.
Sustainability 17 04820 g002
Figure 3. Time trajectory of product freshness under three decision-making models.
Sustainability 17 04820 g003
Figure 4. Time trajectory of consumer preferences under N 0 = 0 .
Sustainability 17 04820 g004
Figure 5. Time trajectory of consumer preferences under N 0 = 300 .
Sustainability 17 04820 g005
Figure 6. Time trajectory of goodwill under M 0 = 10 .
Sustainability 17 04820 g006
Figure 7. Time trajectory of goodwill under M 0 = 600 .
Sustainability 17 04820 g007
Figure 8. The influence of u on supplier preservation initiatives.
Sustainability 17 04820 g008
Figure 9. The impart of u and α on the supplier’s preservation efforts.
Sustainability 17 04820 g009
Figure 10. The impact of f and λ on retailers’ promotional efforts.
Sustainability 17 04820 g010
Figure 11. The impact of u and α on supply chain profits.
Sustainability 17 04820 g011
Figure 12. The impact of u on social welfare.
Sustainability 17 04820 g012
Figure 13. The impact of α on social welfare.
Sustainability 17 04820 g013
Figure 14. The impact of α and time on social welfare.
Sustainability 17 04820 g014
Table 1. Comparisons between the relevant literature and this paper.
ReferencesFocusDynamic GameDecision-Maker InteractionPromotion EffortsMyopia and Foresighted BehaviorEfforts to Preserve Freshness
Zhang et al. [49]Hybrid taboo gray wolf optimizer algorithmNoNoNoNoYes
Ran et al. [51]StackelbergNoYesNoNoYes
Zhao et al. [52]Evolutionary gameNoYesNoNoNo
Mu et al. [55]Differential gameYesYesNoYesNo
Shi et al. [56]Differential gameYesYesYesNoYes
Zhang et al. [57]Differential gameYesYesNoNoYes
Liu et al. [58]Differential gameYesYesNoNoYes
This paperDifferential gameYesYesYesYesYes
Table 2. Notation of parameters and variables.
NotationsDescriptions
Parameters
s Addressable   market ,   0 < s < 10
H Price   elasticity   coefficient ,   0 < H < 1
a Impact   coefficient   of   goodwill   on   demand ,   0 < a < 1
b Impact   coefficient   of   preservation   efforts   on   goodwill ,   0 < b < 1
f Impact   coefficient   of   product   promotion   level   on   goodwill ,   0 < f < 1
λ Impact coefficient of promotional efforts on consumer preference
ω r Retailer’s efforts to promote their products
ω m Supplier’s level of preservation efforts
u Impact coefficient of preservation efforts on product freshness
β Impact   of   product   freshness   on   consumer   preference ,   0 < β < 1
q Goodwill   attenuation   factor ,   0 < q < 1
η Consumer   preference   decline   factors ,   0 < η < 1
χ Impact   coefficient   of   consumer   preference   on   goodwill ,   0 < χ < 1
v Freshness reduction rate
m Direct conversion coefficient between preservation efforts and costs
r Conversion coefficient between promotion and advertising costs
α Government   subsidy   rate ,   0 < α < 1
θ Discount   rate ,   0 < θ < 1
c Supplier unit production cost
Variables
C m ( t ) Cost of supplier’s preservation efforts at point t
Q ( t ) Retailer’s product demand at point t
M ( t ) Goodwill of product at point t ,   M ( 0 ) = M 0
G ( t ) Freshness of product at point t ,   G ( 0 ) = G 0
C r ( t ) Promotional cost of retailer at point t
N ( t ) Consumer preference at point t ,   N ( 0 ) = N 0
p ( t ) Retail price established at point t
w ( t ) Wholesale price established at point t
Decision variables
J Overall profit of fresh supply chain under centralized decision-making
J m , J r Profit of fresh food supplier (retailer) under decentralized decision-making
Table 3. Symbols and their types.
TypeSymbols
Demand parameters s , a , H
Cost parameters c ,   m ,   r , α
Parameters of goodwill dynamic equation b , f , q , χ
Dynamic equation parameters of product freshness u , v
Parameters of dynamic equation of consumer preference β , λ , η
Discount rate θ
Disclaimer/Publisher’s Note: The statements, opinions and data contained in all publications are solely those of the individual author(s) and contributor(s) and not of MDPI and/or the editor(s). MDPI and/or the editor(s) disclaim responsibility for any injury to people or property resulting from any ideas, methods, instructions or products referred to in the content.

