

Carbon Footprint Variability in Engineered Wood Products for Timber Buildings: A Systematic Review of Carbon Accounting Methodologies


Abstract
1. Introduction
1.1. Background

| Classification | Subtype | Picture | Source |
|---|---|---|---|
| Fibre-based | Wood cement fibreboard (WCF) |  | [15] |
| Wood plastic composite (WPC) |  | [16] | |
| Lumber-based | Glue laminated timber (Glulam) |  | [15] |
| Nail laminated timber (NLT) |  | [15] | |
| Dowel laminated timber (DLT) |  | [15] | |
| Cross laminated timber (CLT) |  | [15] | |
| Strand-based | Oriented strand board (OSB) |  | [15] |
| Laminated strand lumber (LSL) |  | [15] | |
| Oriented strand lumber (OSL) |  | [15] | |
| Veneer-based | Plywood |  | [15] |
| Laminated veneer lumber (LVL) |  | [16] | |
| Parallel strand lumber (PSL) |  | [15] |
1.2. Challenges and Research Gaps in Carbon Accounting of EWPs
1.3. Research Objectives
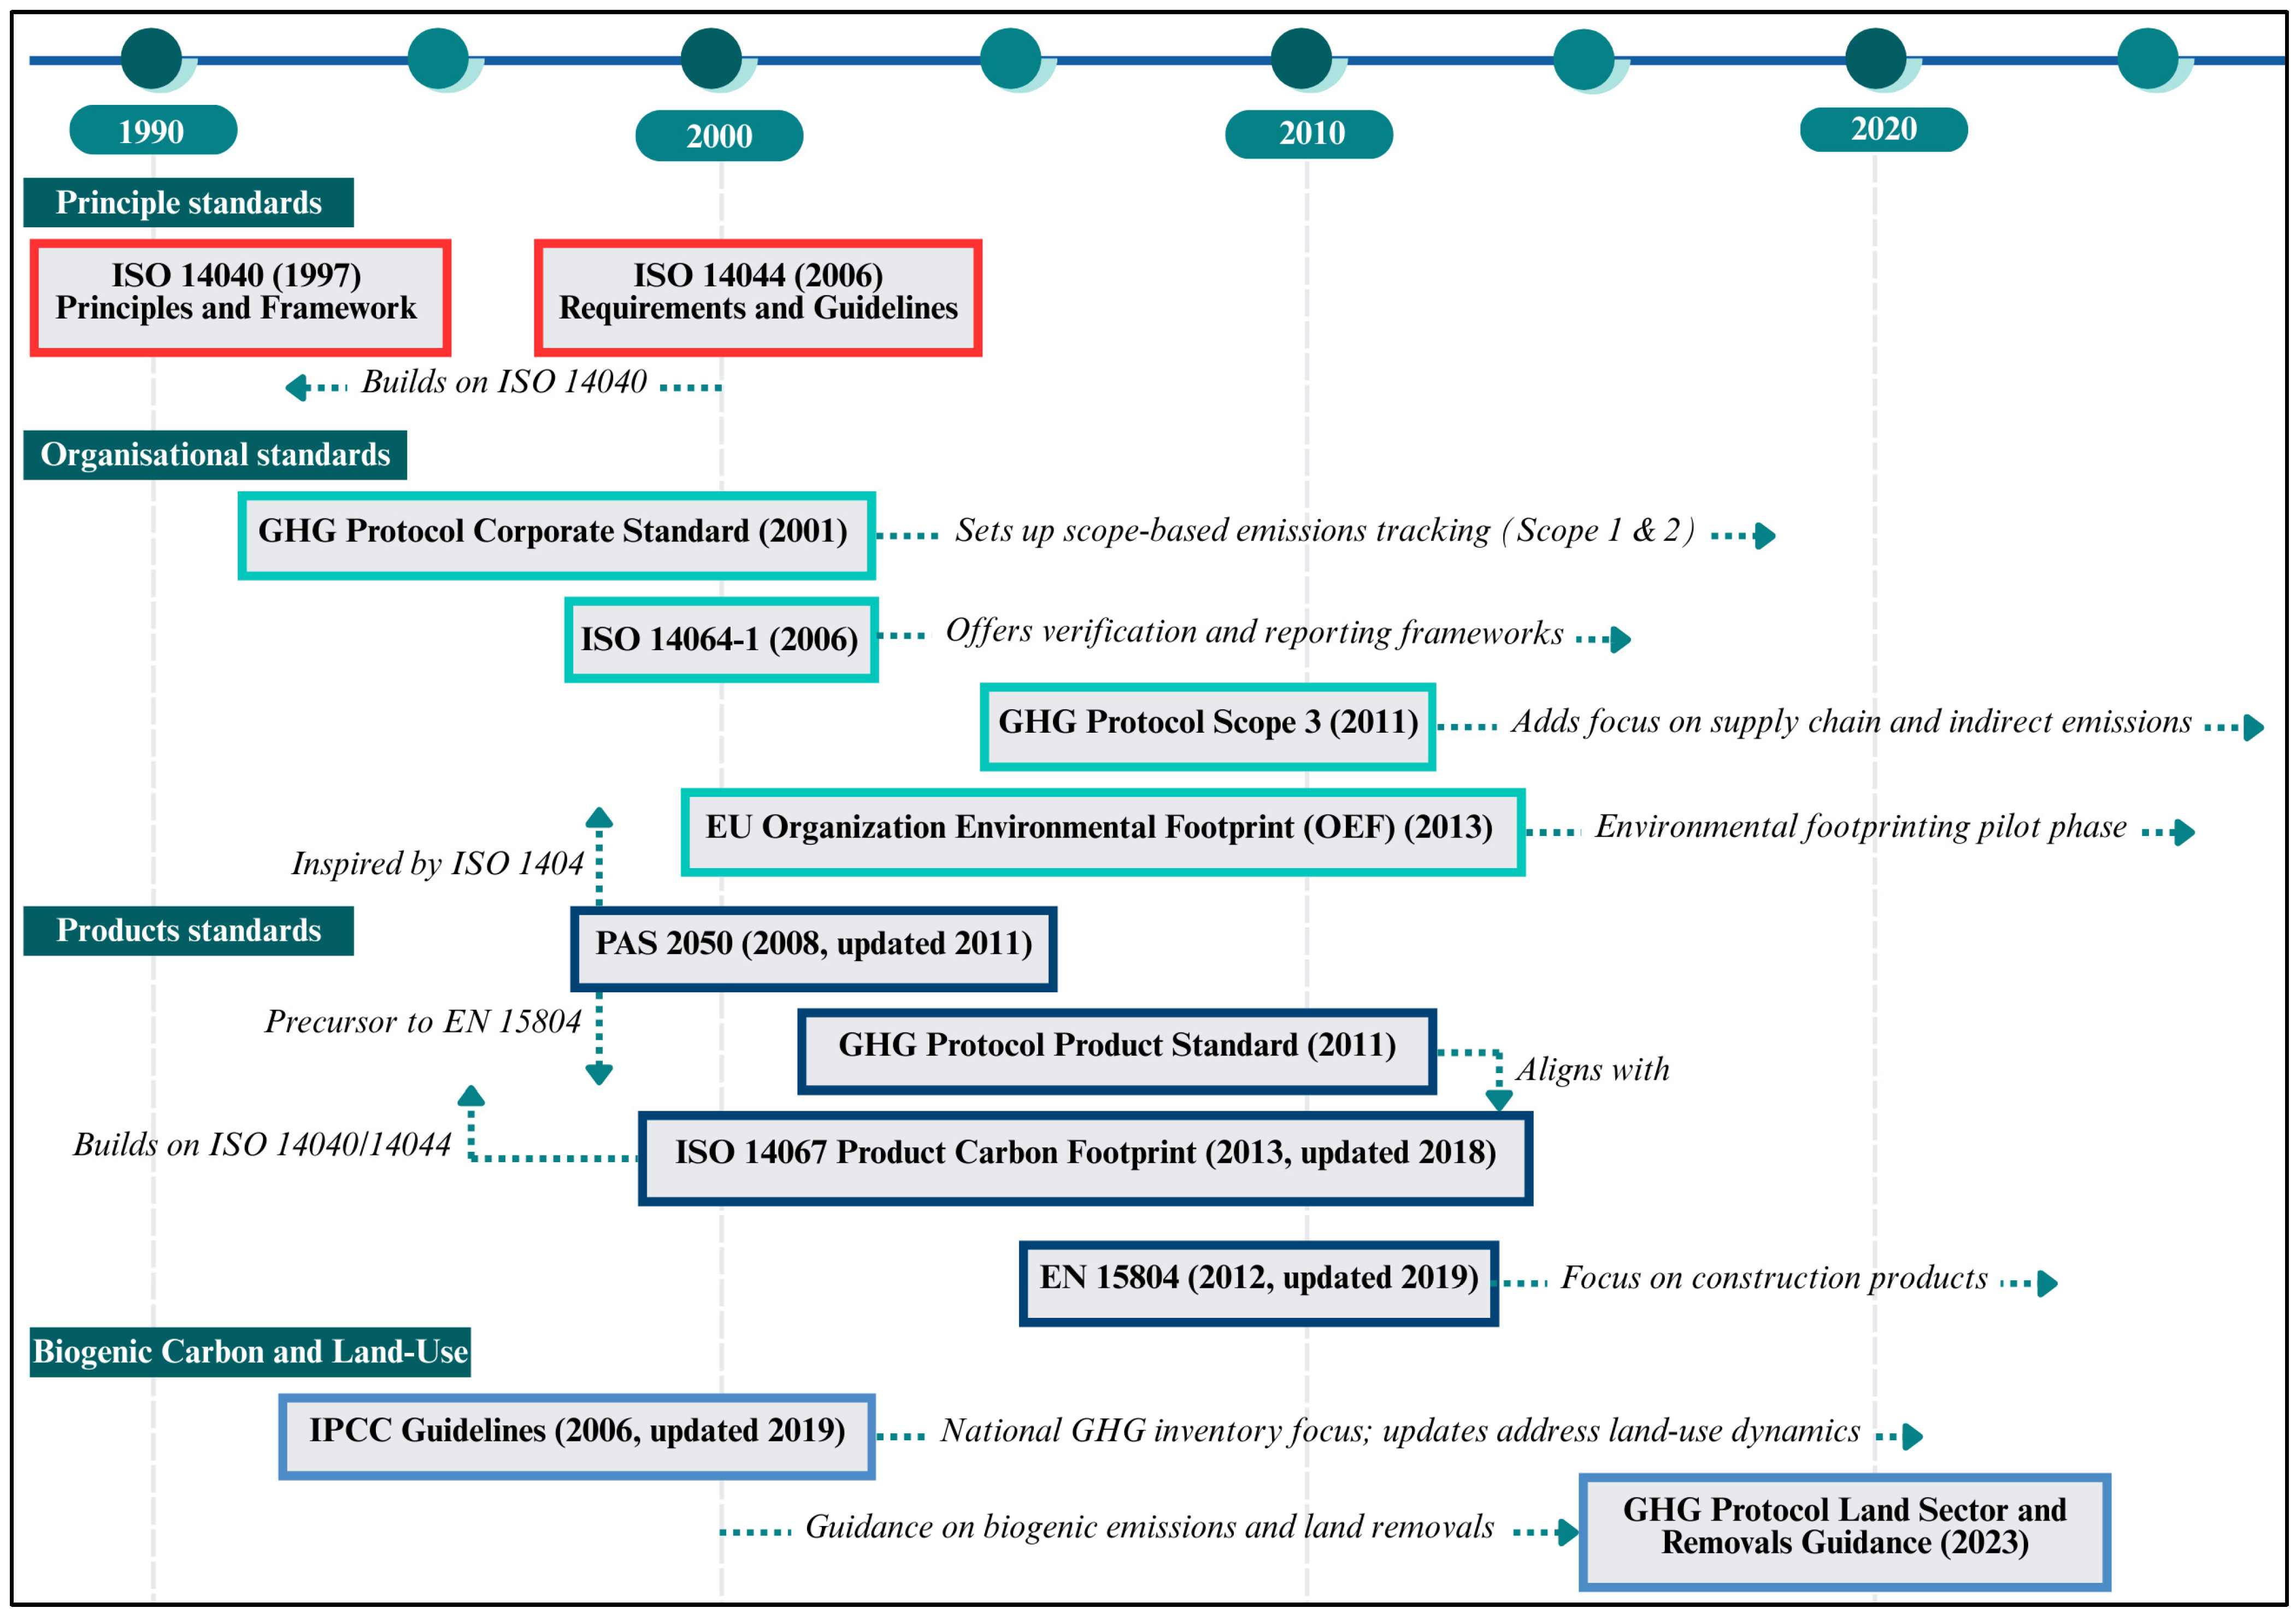
2. Key Standards, Methods, and Applications of Carbon Accounting
2.1. Carbon Accounting Standards and Guidelines
2.2. Carbon Accounting Methods
2.2.1. IPCC Guidelines for Timber Buildings and Products
2.2.2. LCA Methods for Timber Buildings and Products
2.2.3. MFA Methods for Timber Buildings and Products
2.2.4. Comparison of Carbon Accounting Methods
- IPCC methods:where
- LCA method (process-based):where
- MFA method (static MFA):where
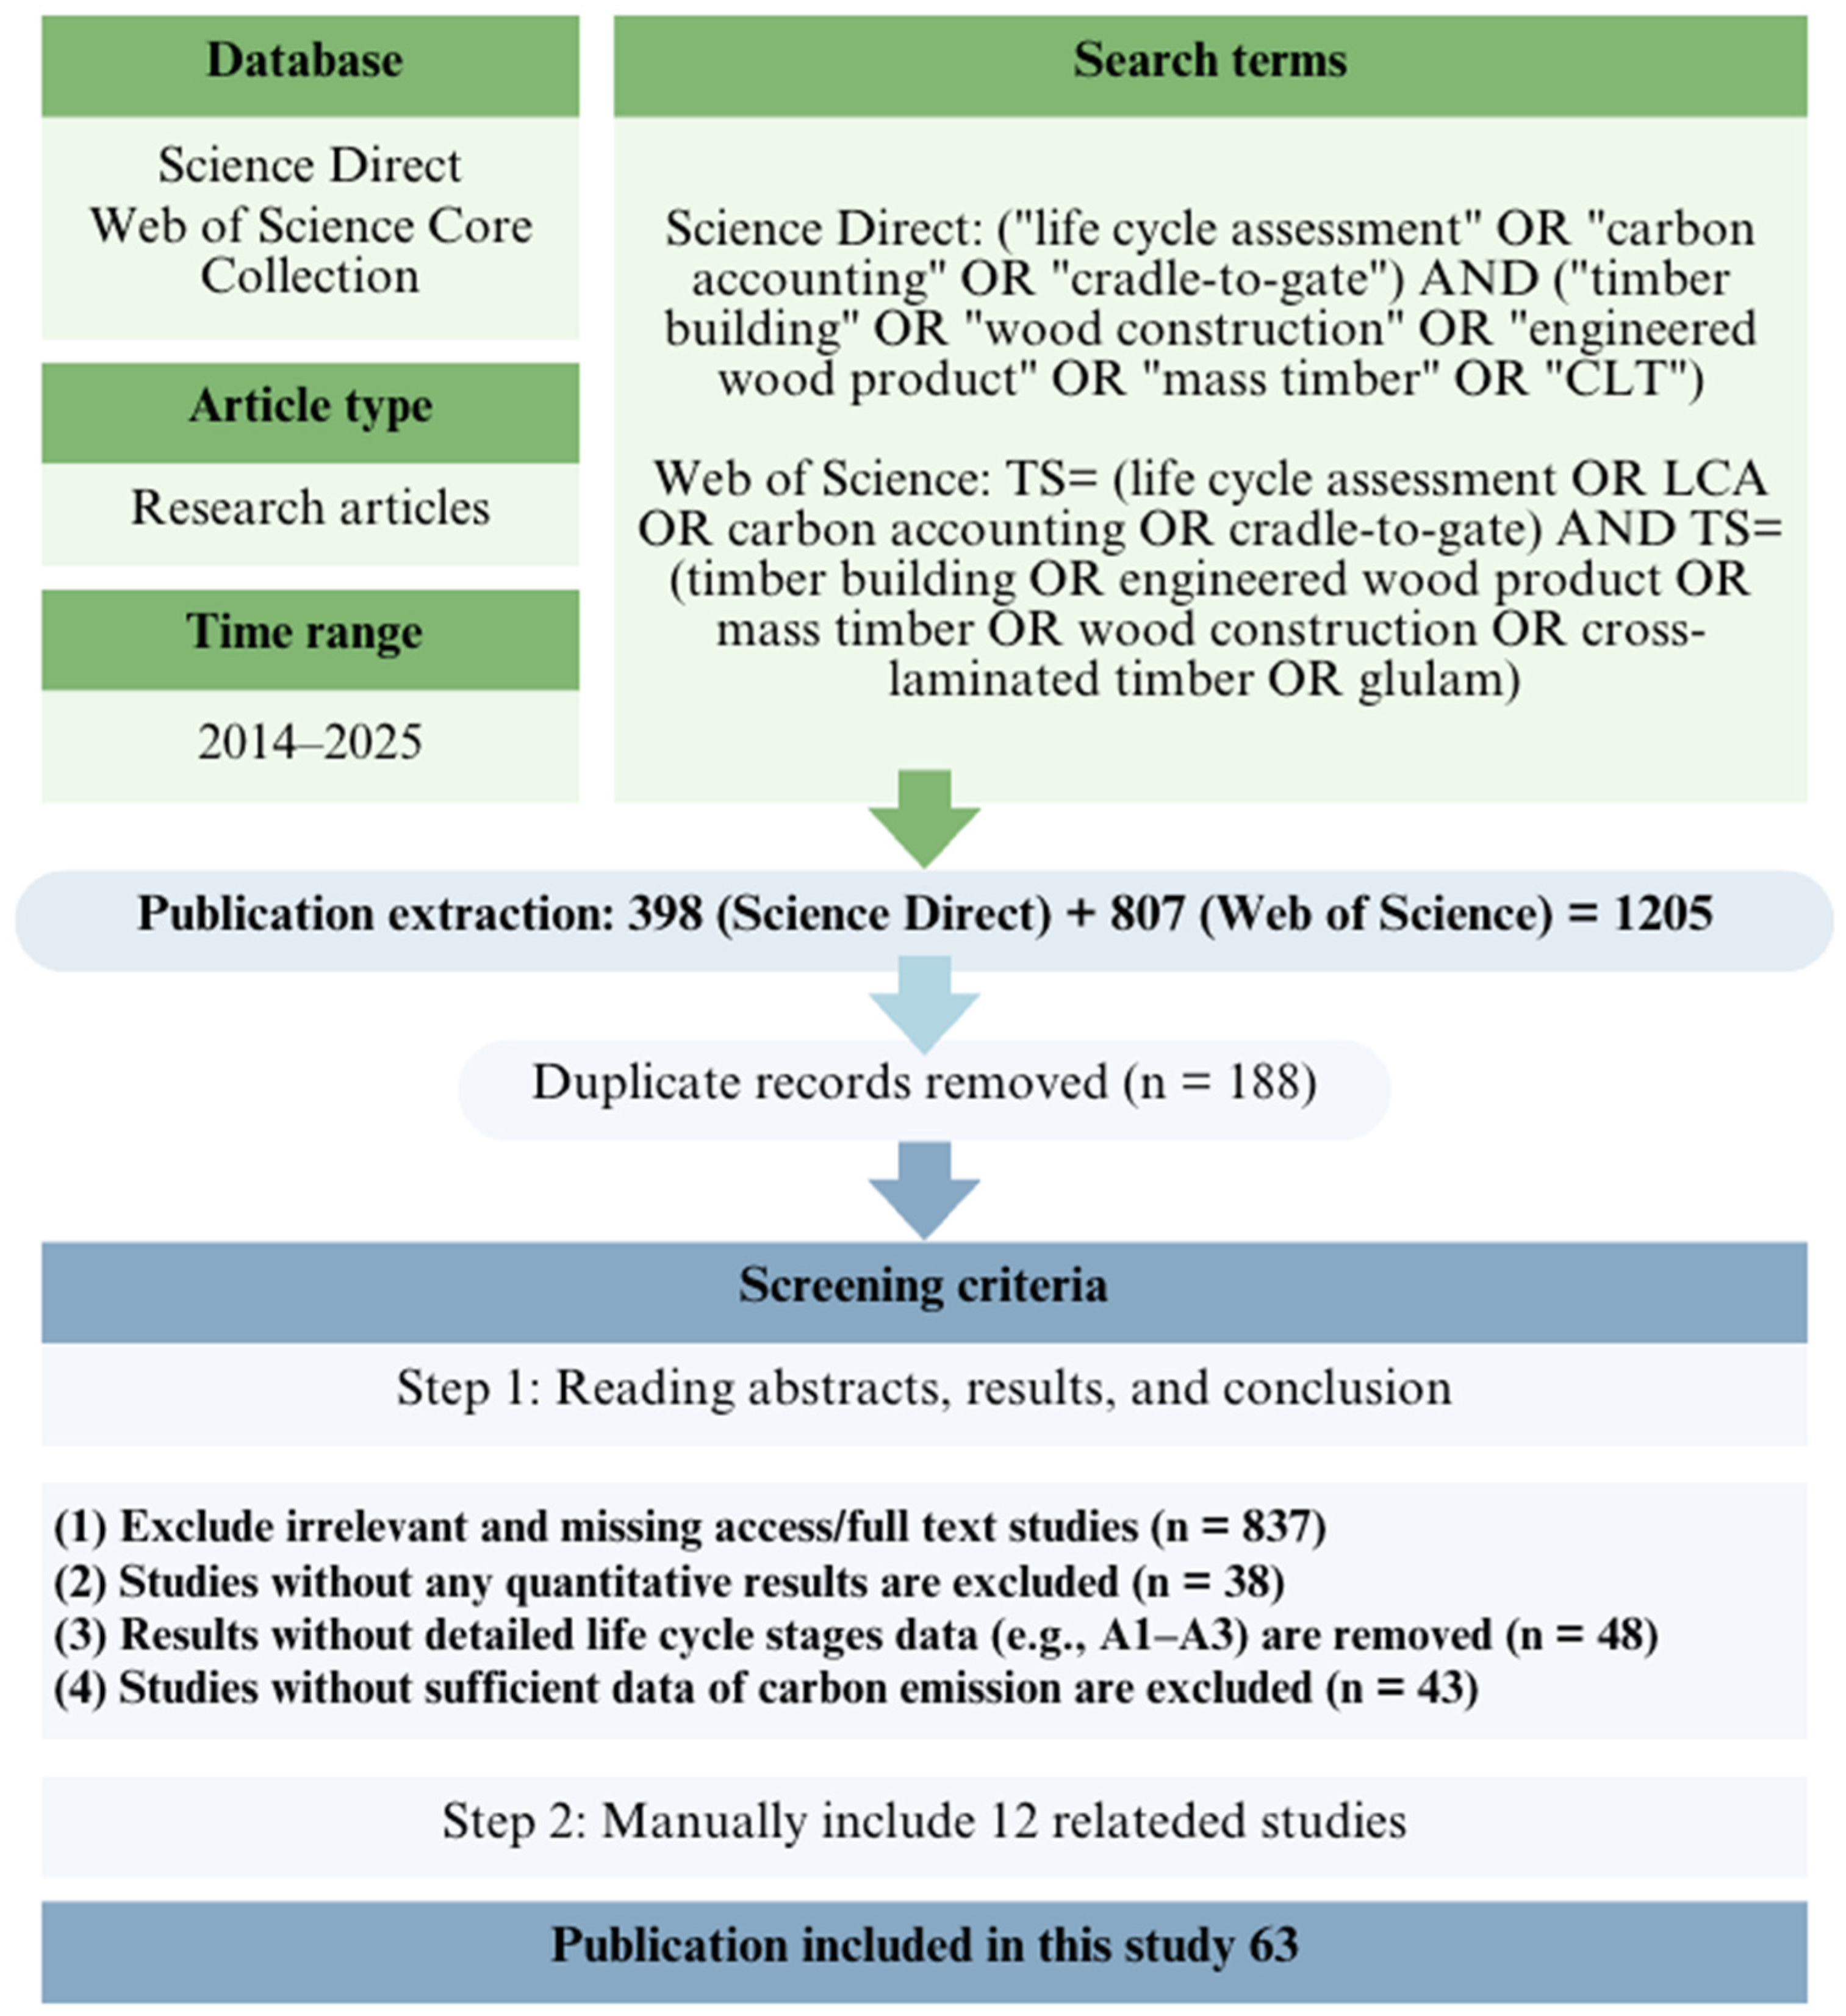
3. Methodology
4. Results
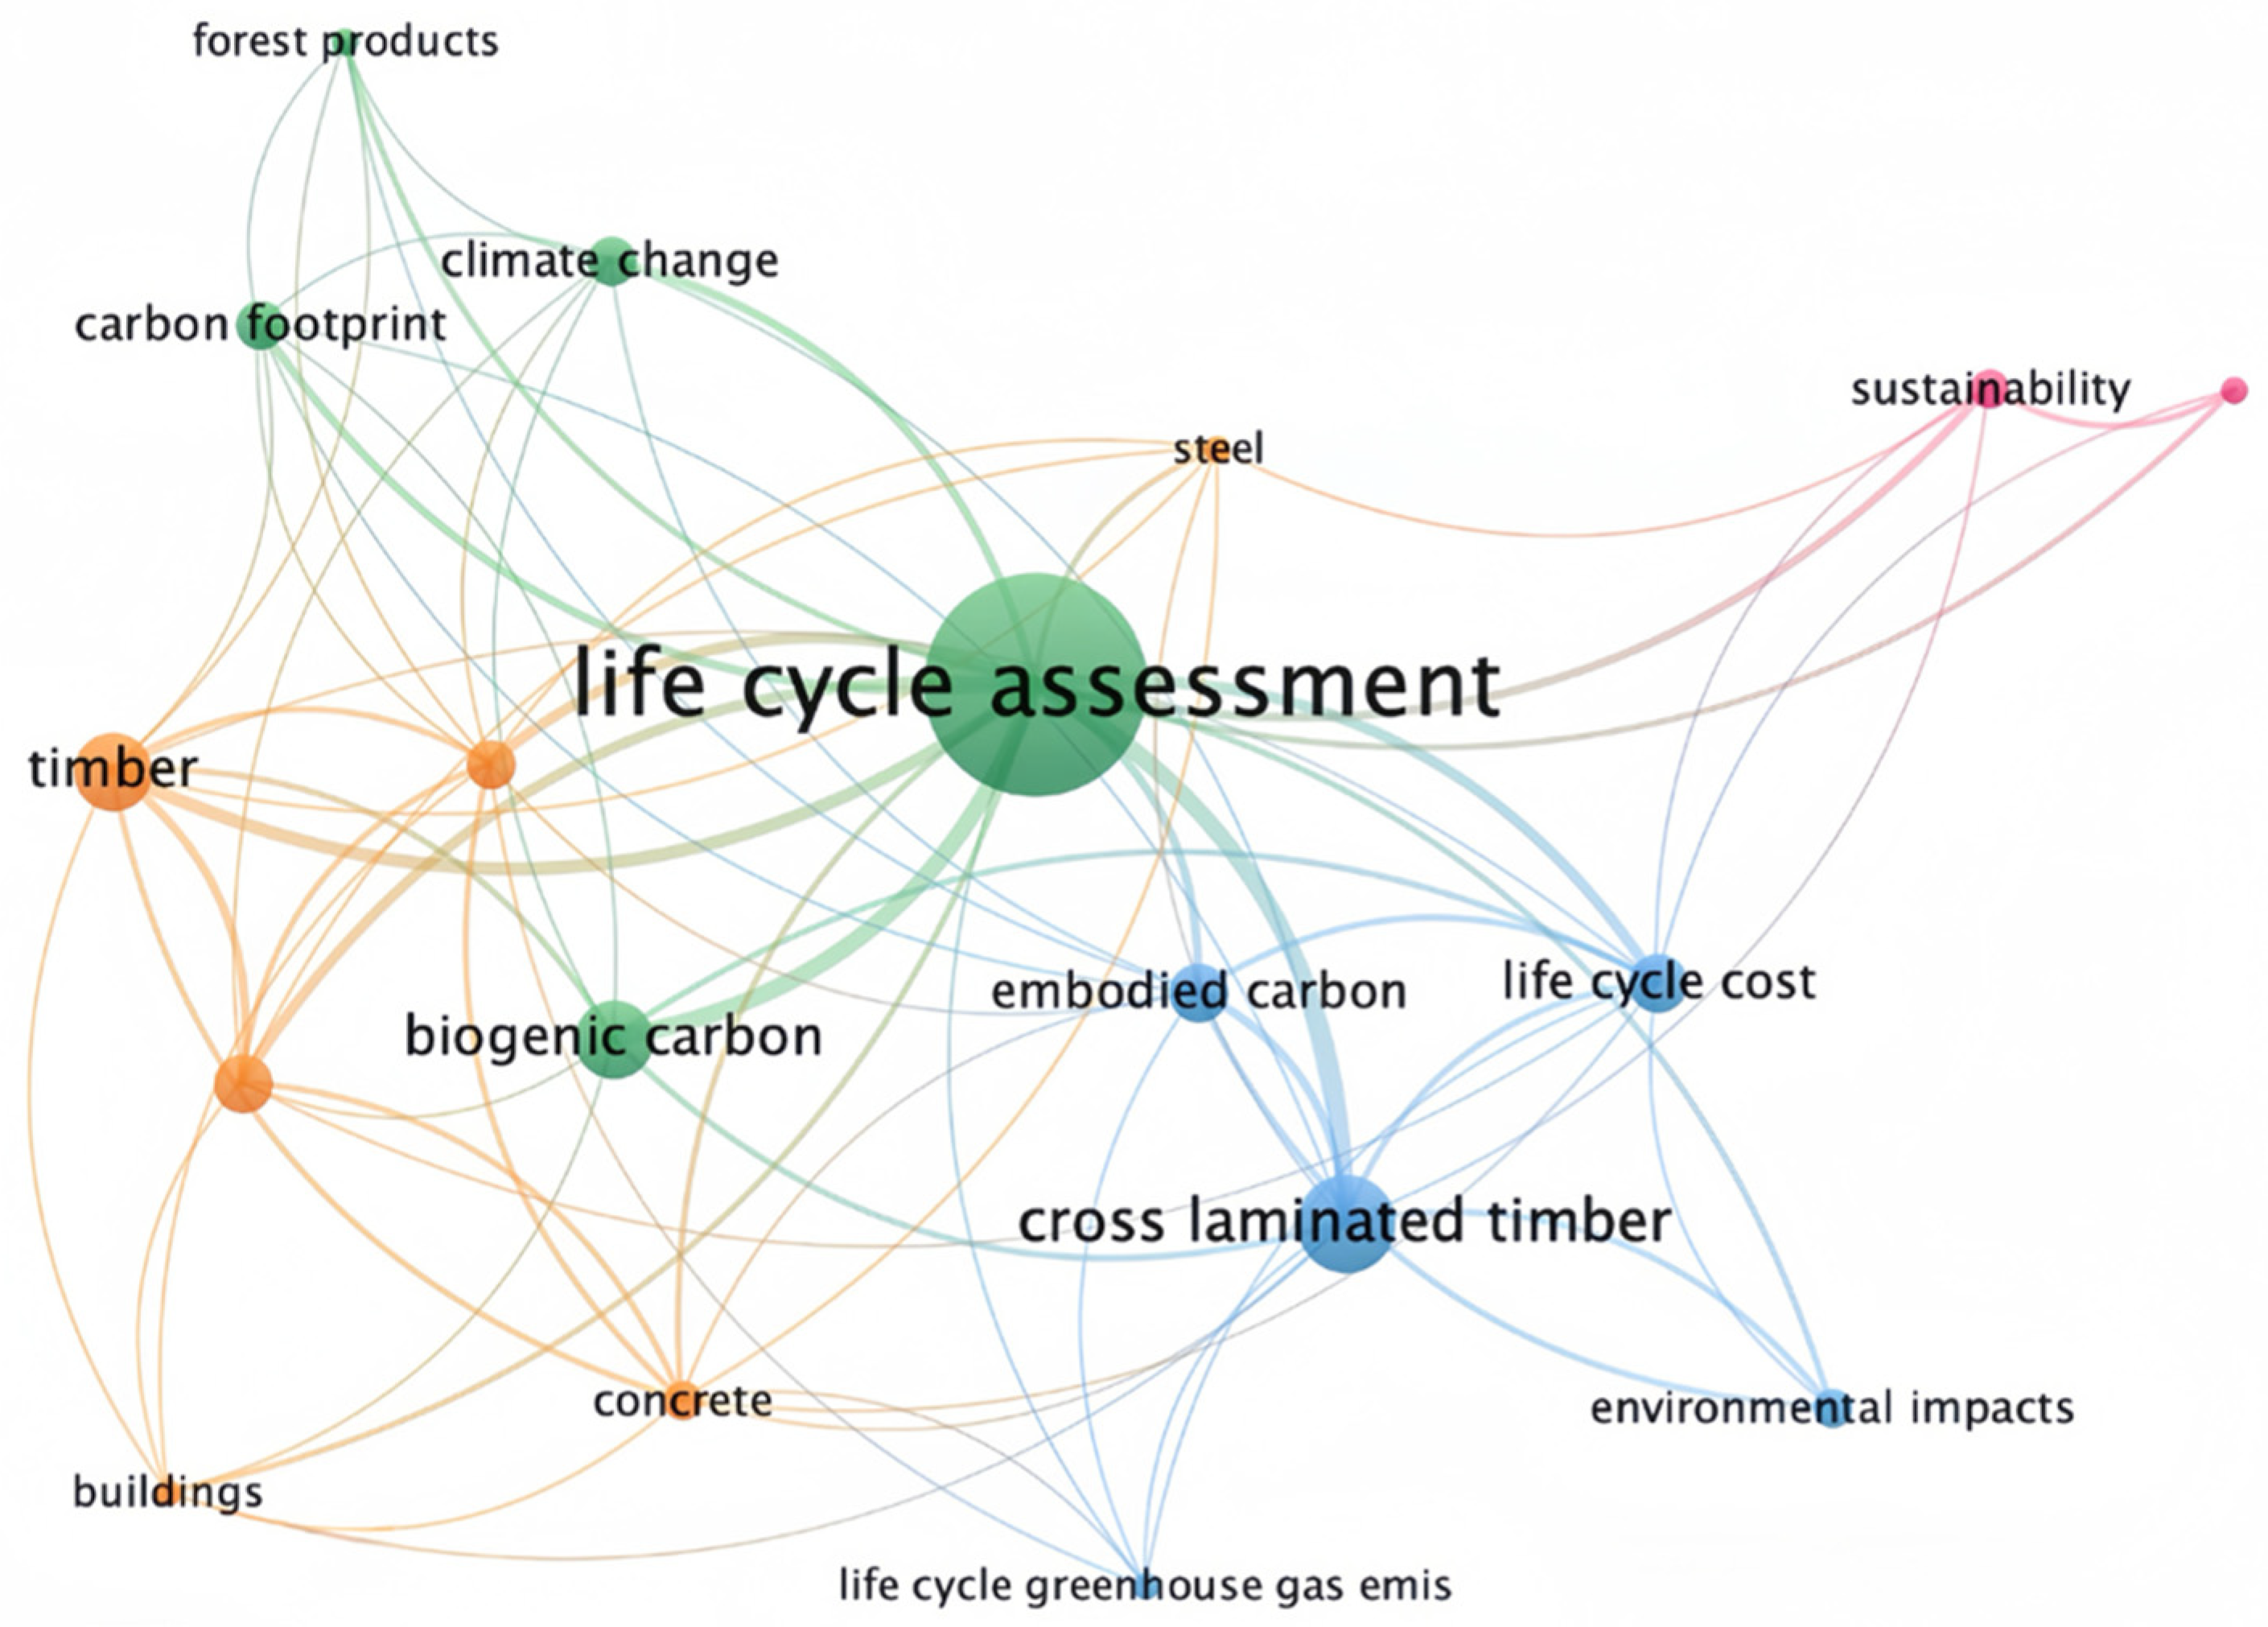
4.1. Bibliometric Analysis
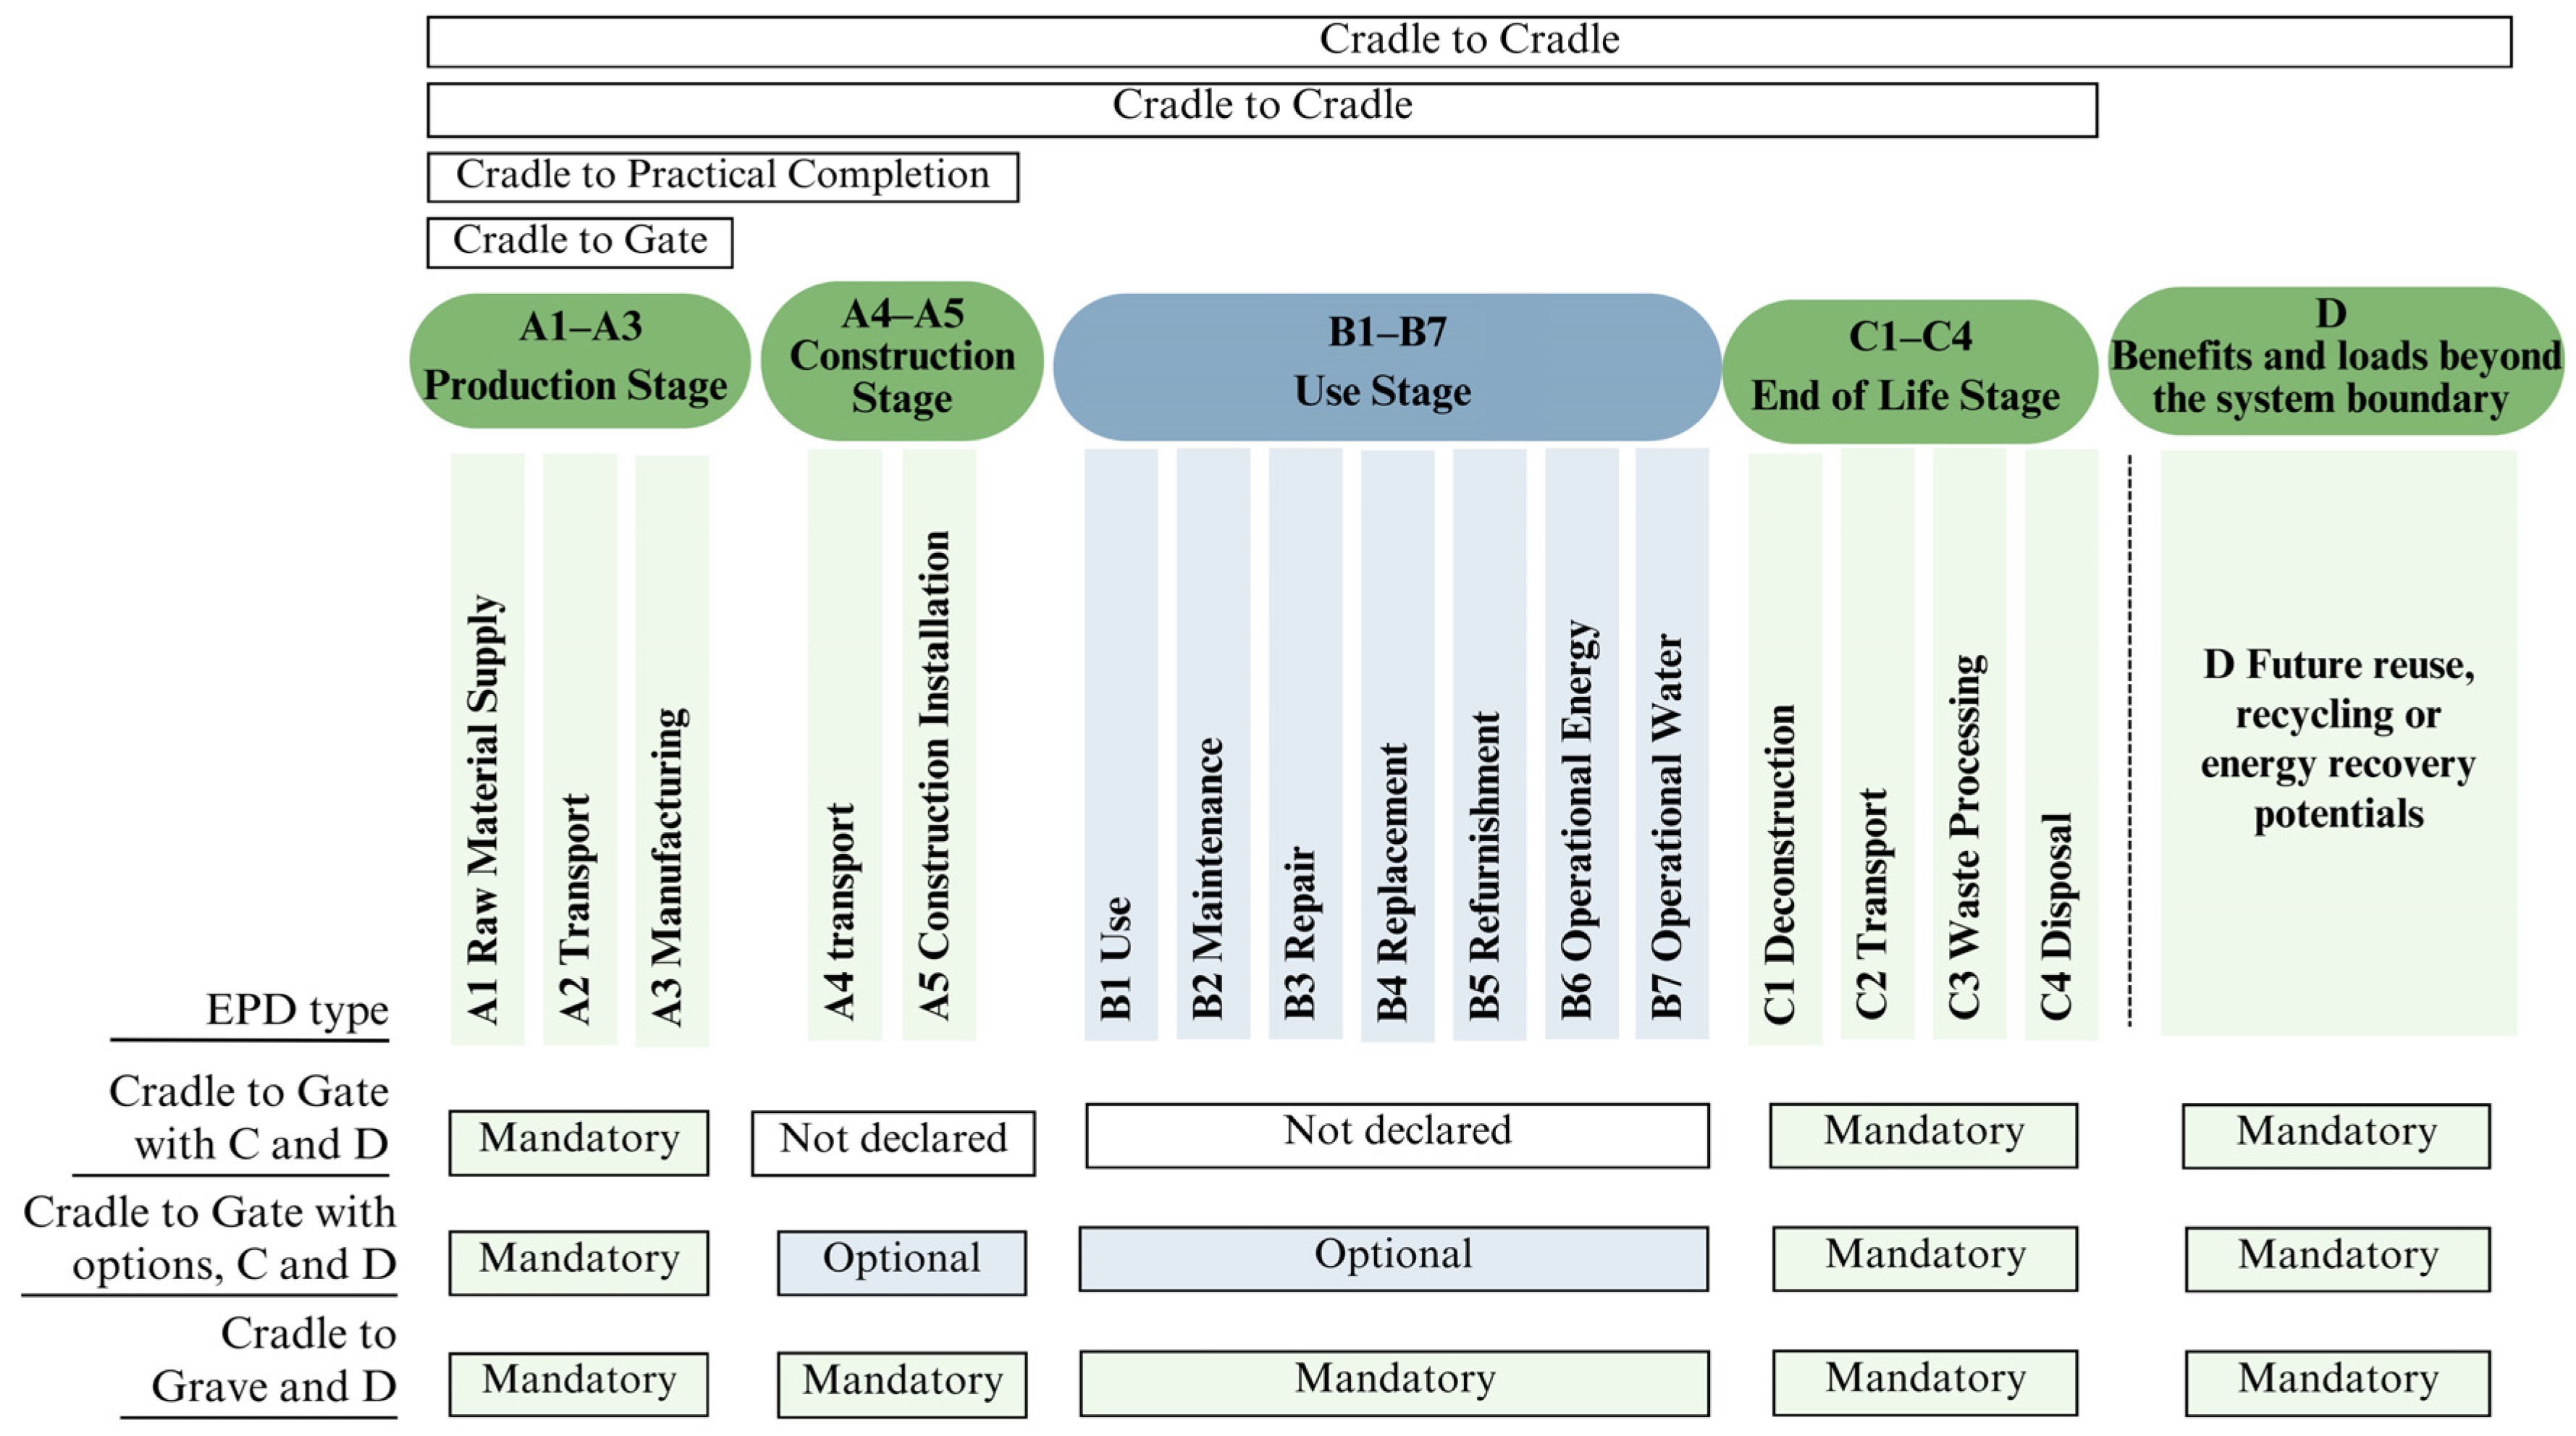
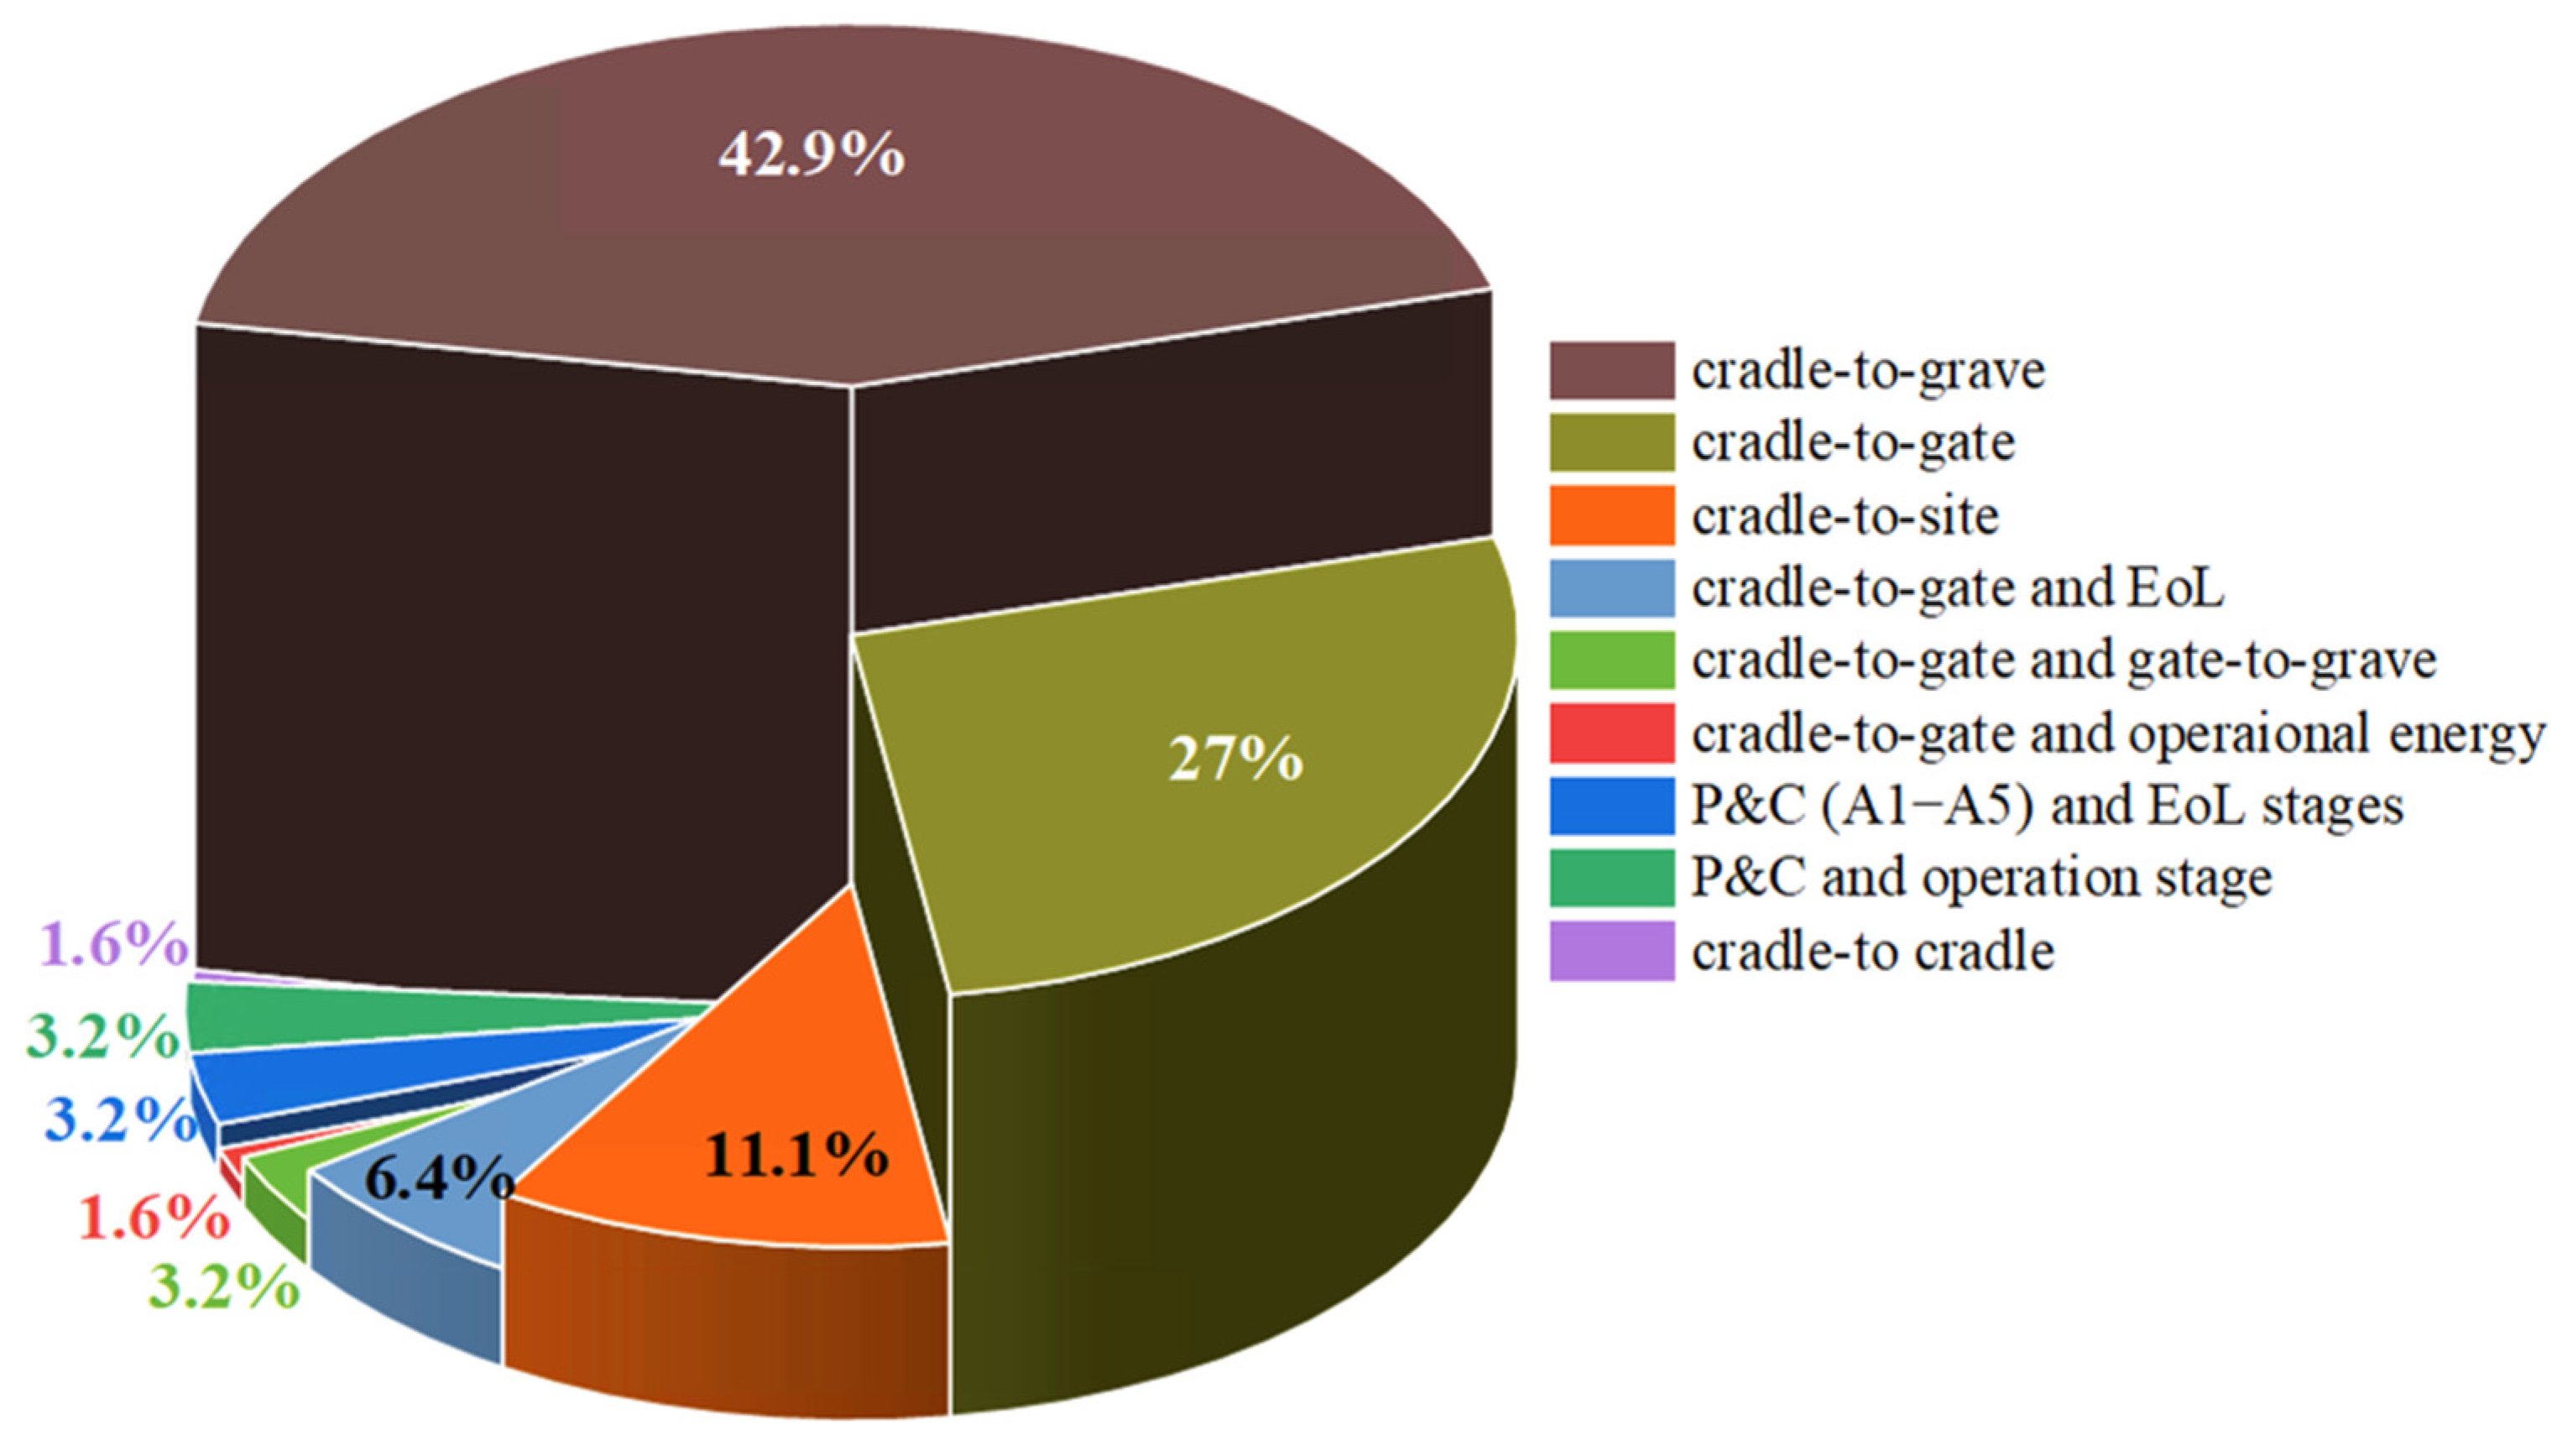
4.2. System Boundary and Functional Unit
4.3. Life Cycle Inventory (LCI) Database
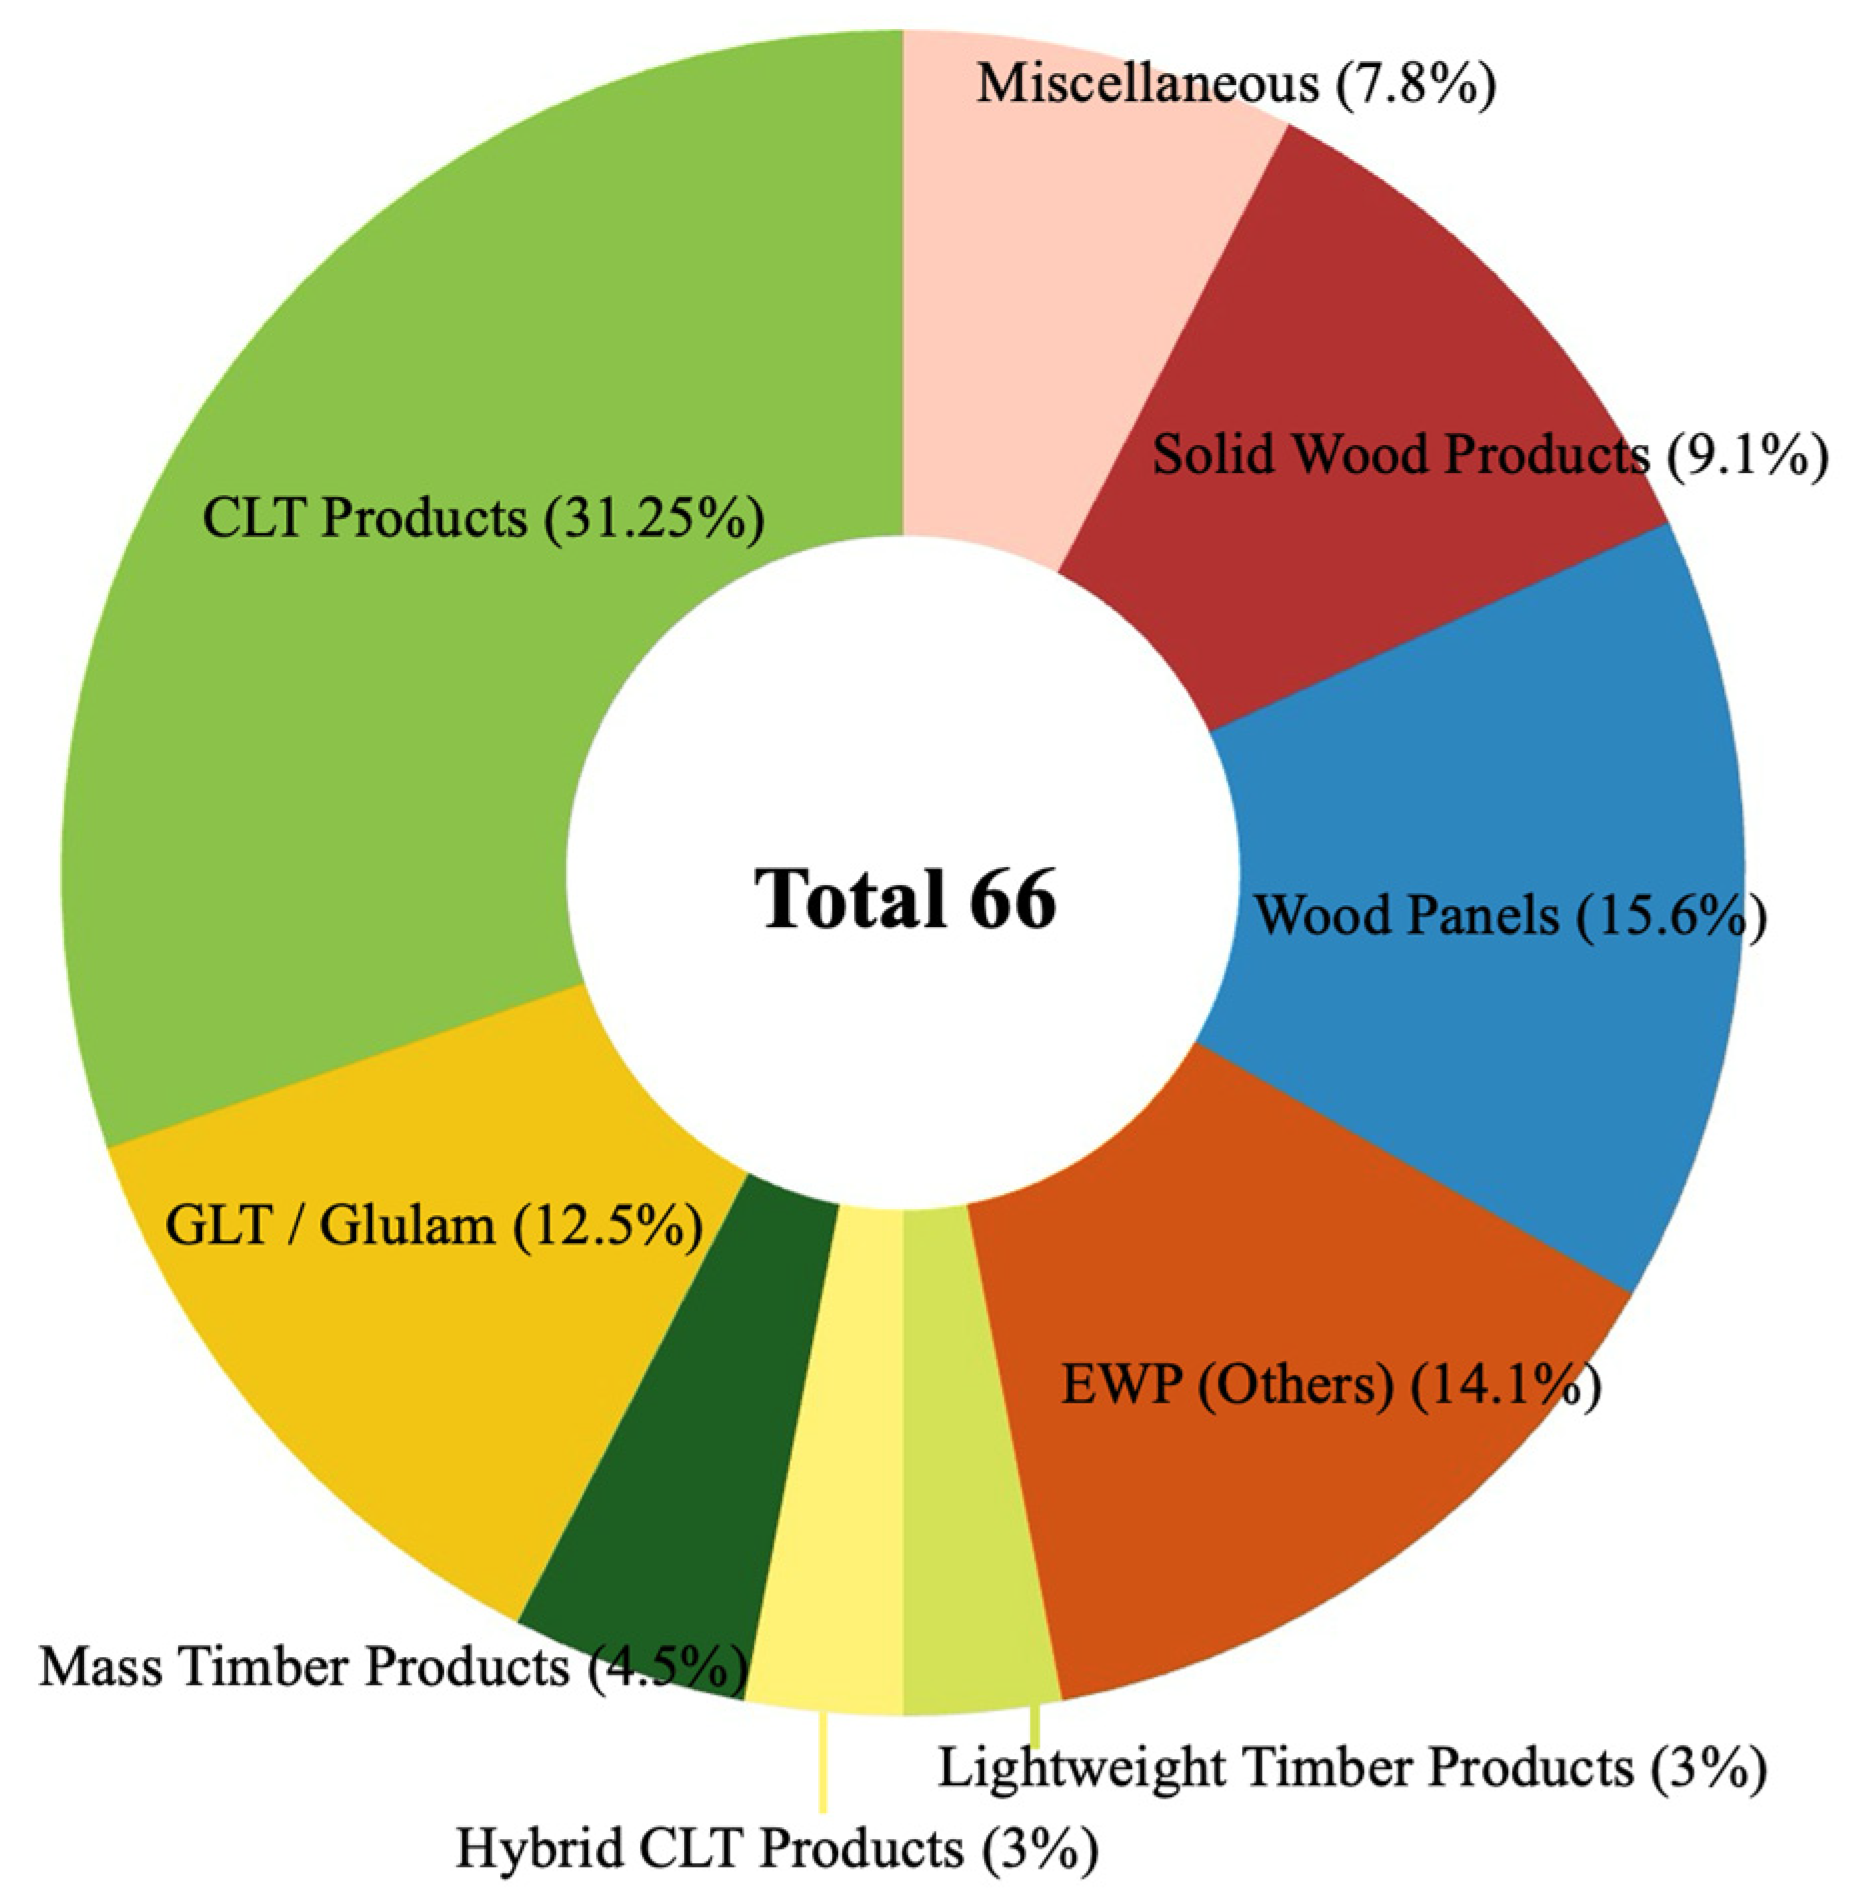
4.4. Engineered Wood Product (EWP) Categories
4.5. Carbon Emission Analysis from the Production Stage
4.5.1. Regional Analysis of Carbon Footprint
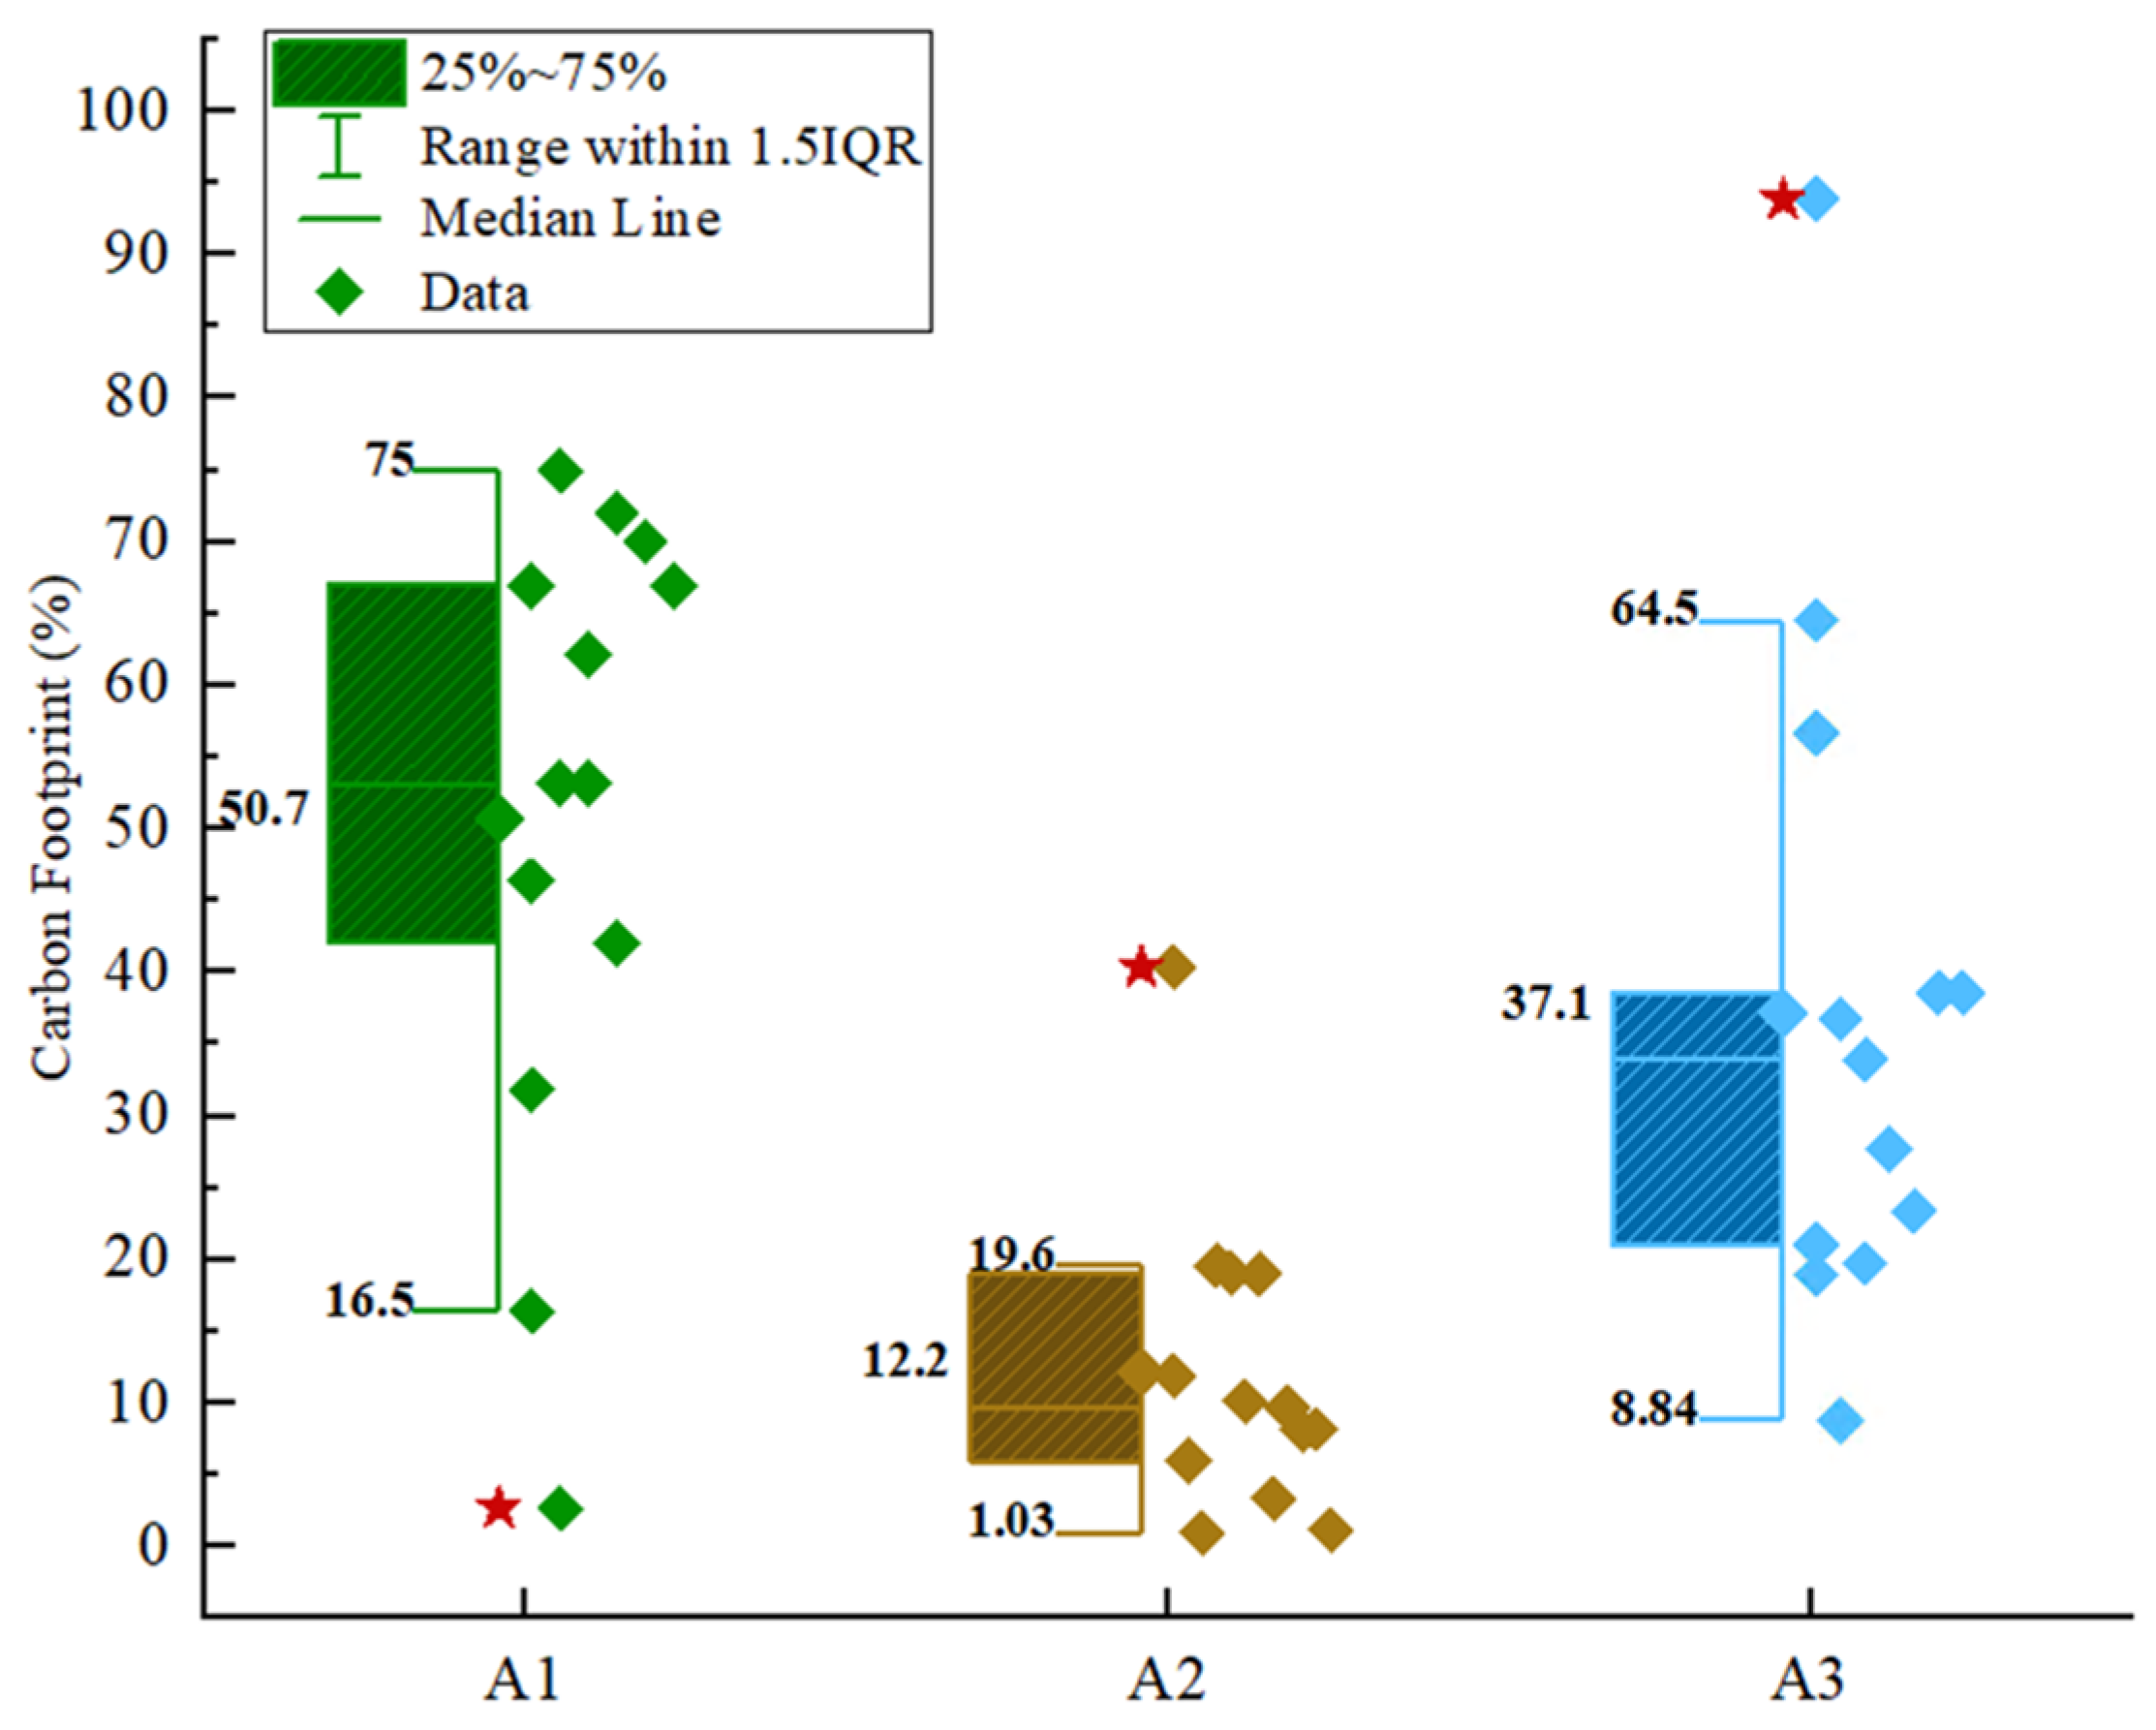
4.5.2. Contributions of Substages A1–A3 to Carbon Footprint
4.5.3. Temporal Trend Analysis
4.5.4. Biogenic Carbon and Dynamic Factor Analysis
5. Discussion and Implications
5.1. Impact of System Boundary and Functional Unit Selection
5.2. Analysis of Databases and Panel Types
5.3. Large Discrepancies in CF Results
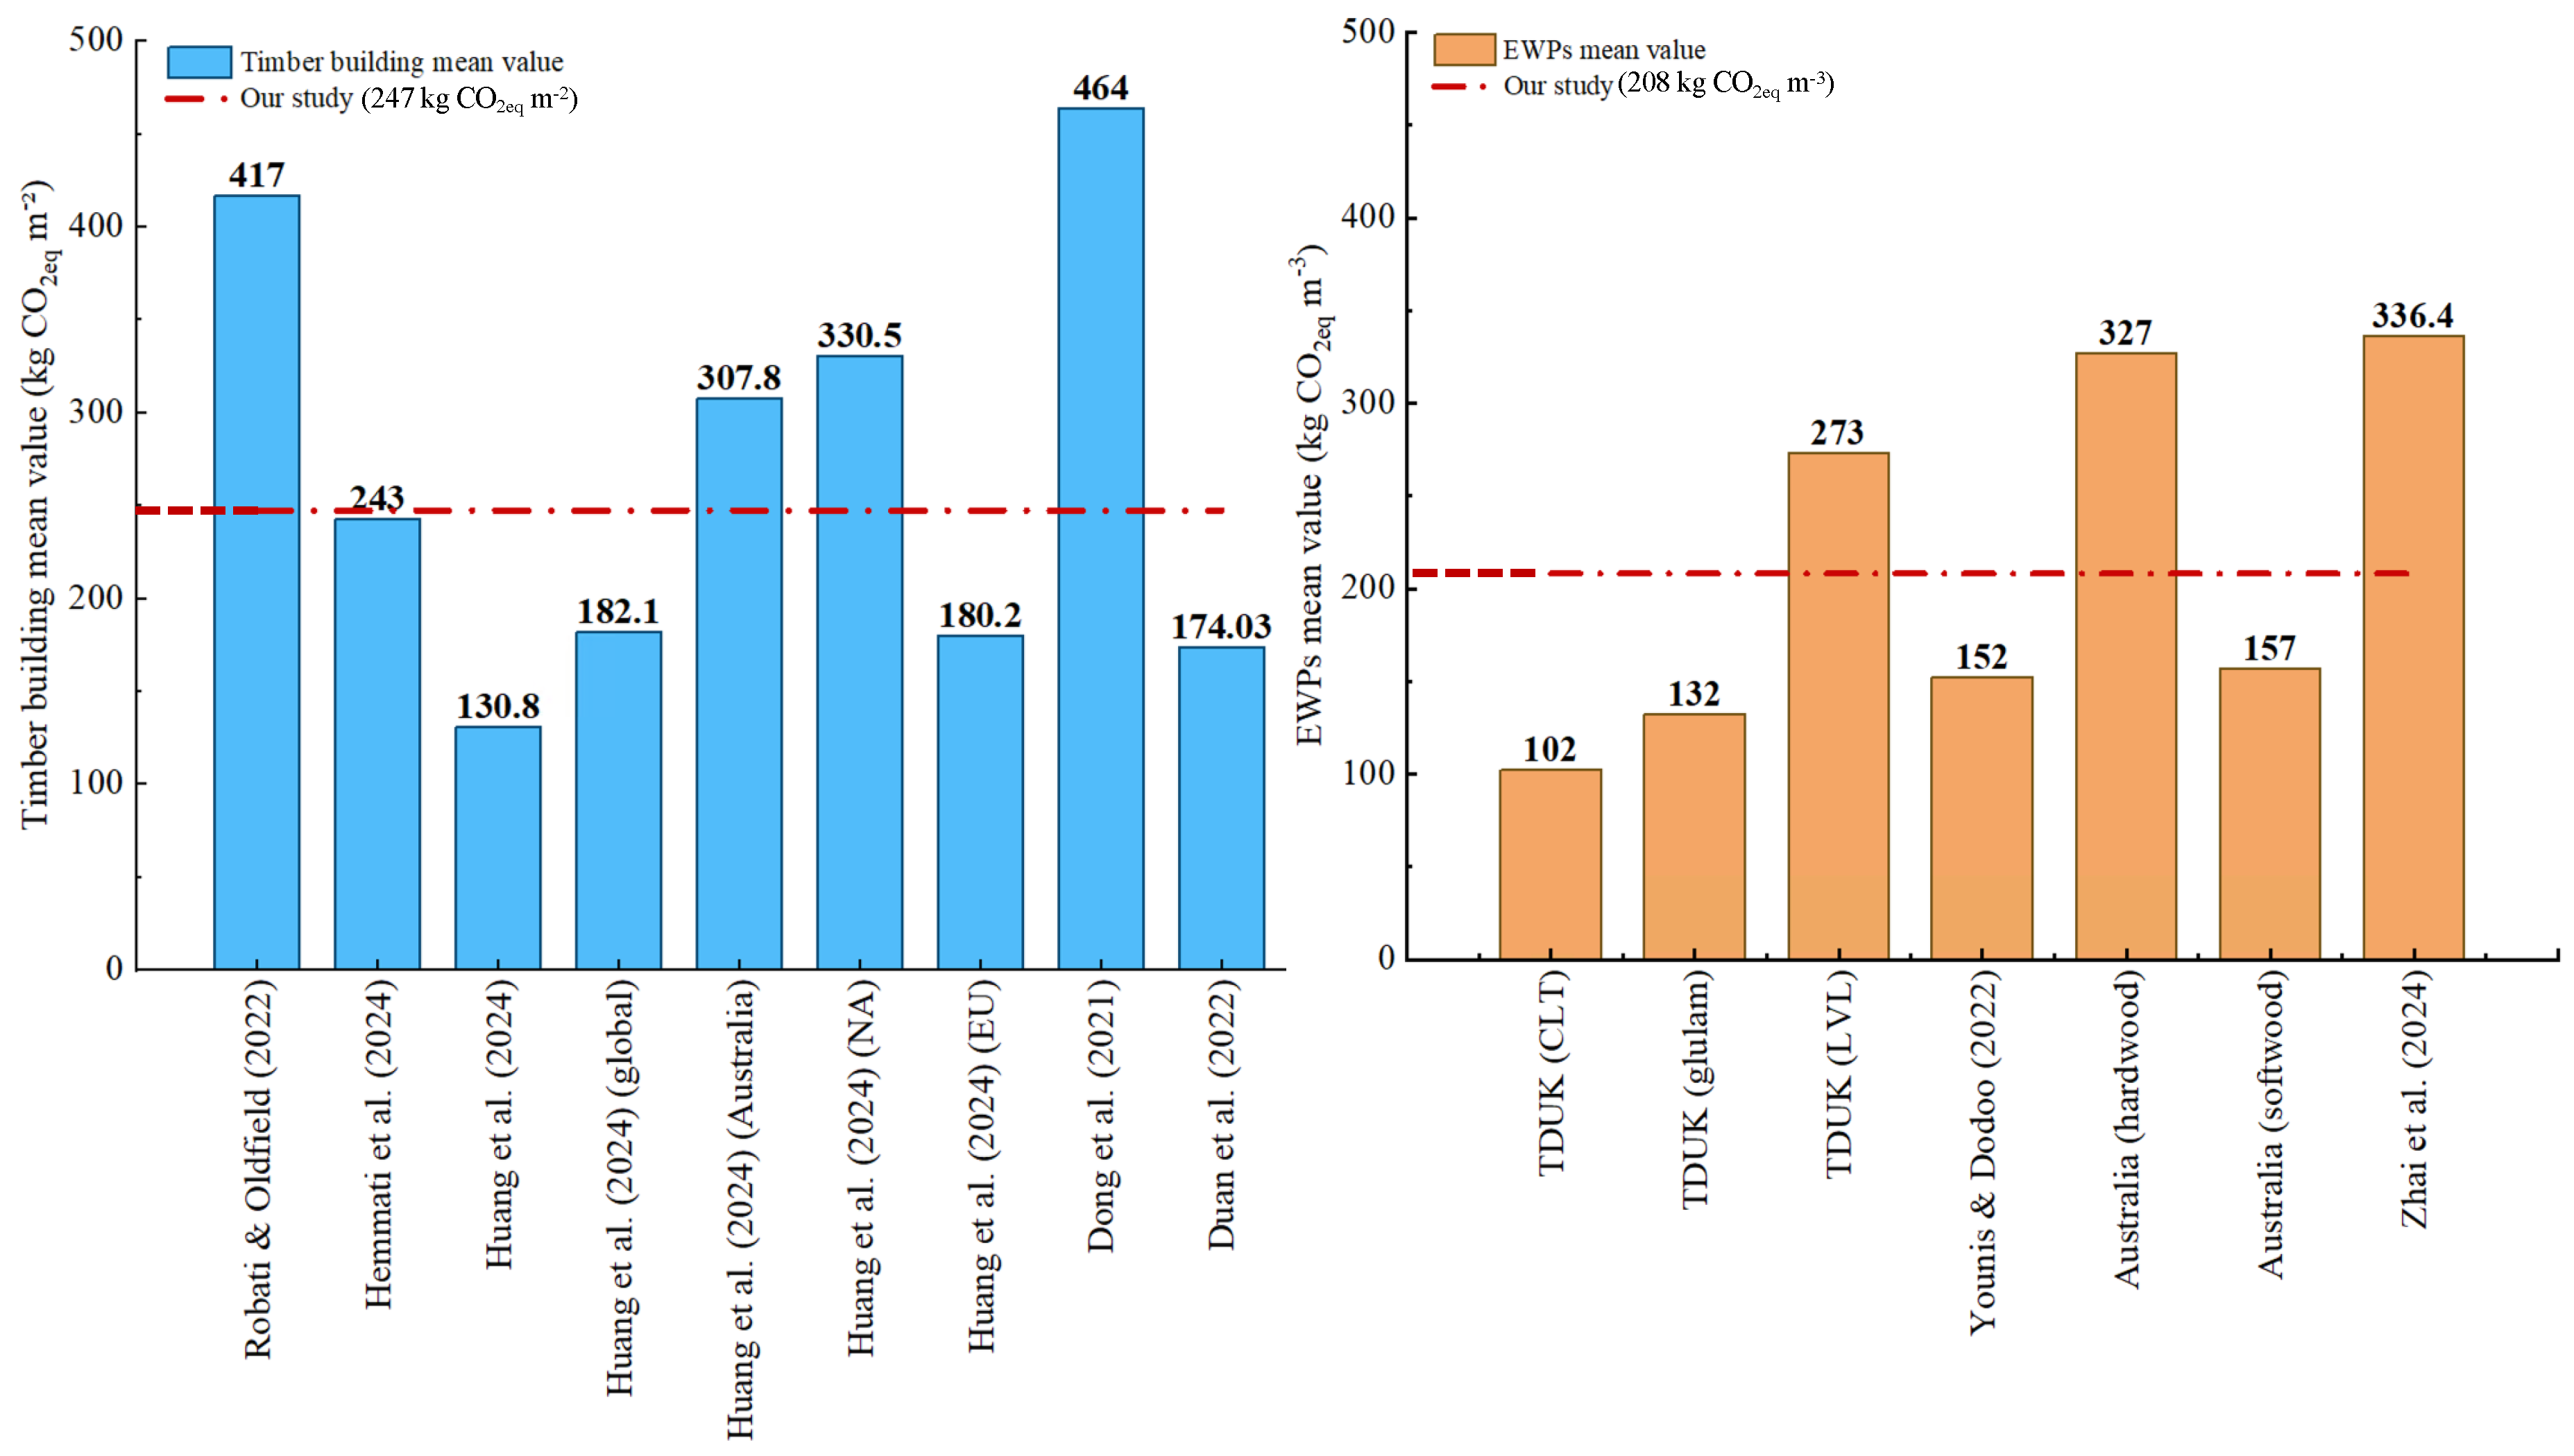
5.4. Comparison with Benchmark Studies and Sensitivity Analysis
5.5. Synthesis of Emission Reduction Metrics and Implications
5.6. Limitations and Future Research Directions
6. Conclusions
Supplementary Materials
Author Contributions
Funding
Institutional Review Board Statement
Informed Consent Statement
Data Availability Statement
Acknowledgments
Conflicts of Interest
Nomenclature
| Abbreviations | |
| CF | Carbon footprint |
| CLT | Cross-laminated timber |
| COP | Conference of parties |
| EF | Emission factor |
| EoL | End-of-life |
| EPD | Environmental product declaration |
| EWP | Engineered wood product |
| GHG | Greenhouse gas |
| Glulam | Glue-laminated timber |
| HWP | Harvested wood products |
| IPCC | The Intergovernmental Panel on Climate Change |
| LCA | Life cycle assessment |
| LVL | Laminated veneer lumber |
| MFA | Material flow analysis |
| OSB | Oriented strand board |
| PAS2050 | Publicly Available Specification 2050 |
| WCF | Wood cement fibreboard |
| Symbols | |
| AD | Activity data [kg or m−3] |
| BCS | Biogenic carbon storage of EWPs [kg CO2eq m−3] |
| BD | Bulk density of the timber [kg m−3] |
| CF | Carbon fraction of dry wood |
| CS | Carbon sequestered [kg CO2eq m−3] |
| DE | Delayed biogenic emissions [kg CO2eq m−3] |
| E | GHG emission [kg CO2eq] |
| EF | Emission factor [kg CO2eq kg−1 or kg CO2eq m−3] |
| FS | Molecular weight ratio of CO2 to carbon |
| M | Mass [kg] |
| MC | Moisture content |
| t | the service time of EWPs [a] |
| V | Volume of the timber product [m3] |
References
- Himes, A.; Busby, G. Wood Buildings as a Climate Solution. Dev. Built Environ. 2020, 4, 100030. [Google Scholar] [CrossRef]
- Rischmiller, K. Australian Government Signs Up to Increase the Use of Timber in Buildings by 2030. Available online: https://www.advance-timber-hub.org/media-releases/australian-government-signs-up-to-increase-the-use-of-timber-in-buildings-by-2030/ (accessed on 22 March 2024).
- Intergovernmental Panel on Climate Change. Climate Change 2023: Synthesis Report. Contribution of Working Groups I, II and III to the Sixth Assessment Report of the Intergovernmental Panel on Climate Change; Intergovernmental Panel on Climate Change: Geneva, Switzerland, 2023. [Google Scholar]
- Yadav, R.; Kumar, J.; Yadav, R.; Kumar, J. Engineered Wood Products as a Sustainable Construction Material: A Review. In Engineered Wood Products for Construction; IntechOpen: London, UK, 2021; ISBN 978-1-83962-772-9. [Google Scholar]
- Amarasinghe, I.T.; Qian, Y.; Gunawardena, T.; Mendis, P.; Belleville, B. Composite Panels from Wood Waste: A Detailed Review of Processes, Standards, and Applications. J. Compos. Sci. 2024, 8, 417. [Google Scholar] [CrossRef]
- Gong, M. Wood and Engineered Wood Products: Stress and Deformation. In Engineered Wood Products for Construction; IntechOpen: London, UK, 2021; ISBN 978-1-83962-772-9. [Google Scholar]
- Low, K.; Burns, K. Engineered Wood Products. Agric. Commod. 2013, 3, 130–137. [Google Scholar] [CrossRef]
- Ding, Y.; Pang, Z.; Lan, K.; Yao, Y.; Panzarasa, G.; Xu, L.; Lo Ricco, M.; Rammer, D.R.; Zhu, J.Y.; Hu, M.; et al. Emerging Engineered Wood for Building Applications. Chem. Rev. 2023, 123, 1843–1888. [Google Scholar] [CrossRef] [PubMed]
- Grebner, D.L.; Bettinger, P.; Siry, J.P.; Boston, K. Chapter 4—Forest Products. In Introduction to Forestry and Natural Resources, 2nd ed.; Grebner, D.L., Bettinger, P., Siry, J.P., Boston, K., Eds.; Academic Press: San Diego, CA, USA, 2022; pp. 101–129. ISBN 978-0-12-819002-9. [Google Scholar]
- Dzhurko, D.; Haacke, B.; Haberbosch, A.; Köhne, L.; König, N.; Lode, F.; Marx, A.; Mühlnickel, L.; Neunzig, N.; Niemann, A.; et al. Future Buildings as Carbon Sinks: Comparative Analysis of Timber-Based Building Typologies Regarding Their Carbon Emissions and Storage. Front. Built Environ. 2024, 10, 1330105. [Google Scholar] [CrossRef]
- Janiski, J.; Sehovic, Z.; Knobloch, N.S.C.; Klein, J.; Richardson, P.; Janiski, J. Mass Timber Solutions for Eight Story Mixed-Use Buildings: A Comparative Study of GHG Emissions; Buro Happold: London, UK, 2020. [Google Scholar]
- Bian, J.; Yi, D.; Yao, E.; Yu, H.; Li, Z. Integrated Assessment Method for Carbon Emission and Cost throughout the Life Cycle of Office Buildings: A Comparative Study of Steel Structure and Timber Structure. Structures 2025, 77, 109103. [Google Scholar] [CrossRef]
- Dotel, N. A Critical Review of Timber as a Structural Material. OCEM J. Manag. Technol. Soc. Sci. 2024, 3, 63–72. [Google Scholar] [CrossRef]
- Bazli, M.; Heitzmann, M.; Ashrafi, H. Long-Span Timber Flooring Systems: A Systematic Review from Structural Performance and Design Considerations to Constructability and Sustainability Aspects. J. Build. Eng. 2022, 48, 103981. [Google Scholar] [CrossRef]
- What Is Mass Timber? Available online: https://www.naturallywood.com/topics/mass-timber/ (accessed on 9 July 2024).
- What Is LVL? How Is It Made? And The Application of LVL. Available online: https://fomexgroup.vn/news-event/what-is-lvl-how-is-it-made-and-the-application-of-lvl.html (accessed on 9 July 2024).
- Tupenaite, L.; Kanapeckiene, L.; Naimaviciene, J.; Kaklauskas, A.; Gecys, T. Timber Construction as a Solution to Climate Change: A Systematic Literature Review. Buildings 2023, 13, 976. [Google Scholar] [CrossRef]
- Aliu, J.; Oke, A.E.; Odia, O.A.; Akanni, P.O.; Leo-Olagbaye, F.; Aigbavboa, C. Exploring the Barriers to the Adoption of Environmental Economic Practices in the Construction Industry. Manag. Environ. Qual. Int. J. 2024, 36, 1–20. [Google Scholar] [CrossRef]
- De Rosa, M.; Pizzol, M.; Schmidt, J. How Methodological Choices Affect LCA Climate Impact Results: The Case of Structural Timber. Int. J. Life Cycle Assess. 2018, 23, 147–158. [Google Scholar] [CrossRef]
- Eslami, H.; Yaghma, A.; Jayasinghe, L.B.; Waldmann, D. Comparative Life Cycle Assessment of Light Frame Timber and Reinforced Concrete Masonry Structural Systems for Single-Family Houses in Luxembourg. Heliyon 2024, 10, e26083. [Google Scholar] [CrossRef] [PubMed]
- Newell, J.P.; Vos, R.O. Accounting for Forest Carbon Pool Dynamics in Product Carbon Footprints: Challenges and Opportunities. Environ. Impact Assess. Rev. 2012, 37, 23–36. [Google Scholar] [CrossRef]
- Barkhausen, R.; Rostek, L.; Miao, Z.C.; Zeller, V. Combinations of Material Flow Analysis and Life Cycle Assessment and Their Applicability to Assess Circular Economy Requirements in EU Product Regulations. A Systematic Literature Review. J. Clean. Prod. 2023, 407, 137017. [Google Scholar] [CrossRef]
- Costa, D.; Serra, J.; Quinteiro, P.; Dias, A.C. Life Cycle Assessment of Wood-Based Panels: A Review. J. Clean. Prod. 2024, 444, 140955. [Google Scholar] [CrossRef]
- Younis, A.; Dodoo, A. Cross-Laminated Timber for Building Construction: A Life-Cycle-Assessment Overview. J. Build. Eng. 2022, 52, 104482. [Google Scholar] [CrossRef]
- Huang, Z.; Zhou, H.; Miao, Z.; Tang, H.; Lin, B.; Zhuang, W. Life-Cycle Carbon Emissions (LCCE) of Buildings: Implications, Calculations, and Reductions. Engineering 2024, 35, 115–139. [Google Scholar] [CrossRef]
- Hespenheide, E.; Pavlovsky, K.; McElroy, M. Accounting for Sustainability Performance. Financ. Exec. 2010, 26, 52–58. [Google Scholar]
- Ascui, F.; Lovell, H. As Frames Collide: Making Sense of Carbon Accounting. Account. Audit. Account. J. 2011, 24, 978–999. [Google Scholar] [CrossRef]
- Stechemesser, K.; Guenther, E. Carbon Accounting: A Systematic Literature Review. J. Clean. Prod. 2012, 36, 17–38. [Google Scholar] [CrossRef]
- ISO 14044; Environmental Management—Life Cycle Assessment—Requirements and Guidelines. International Organization for Standardization: Geneva, Switzerland, 2006.
- ISO 14040; Environmental Management—Life Cycle Assessment—Principles and Framework. International Organization for Standardization: Geneva, Switzerland, 1997.
- PAS 2050; Specification for the Assessment of the Life Cycle Greenhouse Gas Emissions of Goods and Services. British Standards Institution: London, UK, 2011.
- ISO 14067; Greenhouse Gases—Carbon Footprint of Products—Requirements and Guidelines for Quantification. International Organization for Standardization: Geneva, Switzerland, 2018.
- GHG Protocol Scope 3 Standard; Corporate Value Chain (Scope 3) Accounting and Reporting Standard. World Resources Institute and World Business Council for Sustainable Development: Washington, DC, USA, 2011.
- ISO 14064-1; Greenhouse Gases—Part 1: Specification with Guidance at the Organization Level for Quantification and Reporting of Greenhouse Gas Emissions and Removals. International Organization for Standardization: Geneva, Switzerland, 2018.
- GHG Protocol Corporate Standard; Greenhouse Gas Protocol: A Corporate Accounting and Reporting Standard. World Resources Institute and World Business Council for Sustainable Development: Washington, DC, USA, 2004.
- Recommendation 2013/179/EU; On the Use of Common Methods to Measure and Communicate the Life Cycle Environmental Performance of Products and Organisations. European Commission: Brussels, Belgium, 2013.
- Intergovernmental Panel on Climate Change (IPCC). 2019 Refinement to the 2006 IPCC Guidelines for National Greenhouse Gas Inventories; IPCC: Geneva, Switzerland, 2019. [Google Scholar]
- World Resources Institute (WRI). Land Sector and Removals Guidance.; World Resources Institute: Washington, DC, USA, 2024. [Google Scholar]
- Green, J.F. Private Standards in the Climate Regime: The Greenhouse Gas Protocol. Bus. Polit. 2010, 12, 1–37. [Google Scholar] [CrossRef]
- Ehrler, V.; van den Engel, A.; Davydenko, I.; Diekmann, D.; Kiel, J.; Lewis, A.; Seidel, S. Global Standardisation of the Calculation of CO2 Emissions Along Transport Chains—Gaps, Approaches, Perspectives of the Global Alignment Process. In Proceedings of the Commercial Transport, Kaiserslautern, Germany, 8–10 March 2016; Clausen, U., Friedrich, H., Thaller, C., Geiger, C., Eds.; Springer International Publishing: Cham, Switzerland, 2016; pp. 143–157. [Google Scholar]
- Šerkinić, V.; Renjo, M.M.; Ucović, V. CO2 Footprint for Distribution Oil Immersed Transformers According to ISO 14067:2018. J. Energy Energ. 2020, 69, 3–9. [Google Scholar] [CrossRef]
- Curran, M.A. Strengths and Limitations of Life Cycle Assessment. In Background and Future Prospects in Life Cycle Assessment; Klöpffer, W., Ed.; Springer: Dordrecht, The Netherlands, 2014; ISBN 978-94-017-8697-3. pp. 189–206. [Google Scholar]
- Moss, R.H. Reducing Doubt about Uncertainty: Guidance for IPCC’s Third Assessment. Clim. Change 2011, 108, 641. [Google Scholar] [CrossRef]
- Sinden, G. The Contribution of PAS 2050 to the Evolution of International Greenhouse Gas Emission Standards. Int. J. Life Cycle Assess. 2009, 14, 195–203. [Google Scholar] [CrossRef]
- Pelletier, N.; Ardente, F.; Brandão, M.; De Camillis, C.; Pennington, D. Rationales for and Limitations of Preferred Solutions for Multi-Functionality Problems in LCA: Is Increased Consistency Possible? Int. J. Life Cycle Assess. 2015, 20, 74–86. [Google Scholar] [CrossRef]
- Schaubroeck, T. Sustainability Assessment of Product Systems in Dire Straits Due to ISO 14040–14044 Standards: Five Key Issues and Solutions. J. Ind. Ecol. 2022, 26, 1600–1604. [Google Scholar] [CrossRef]
- Ranganathan, J. GHG Protocol a Corporate Accounting and Reporting Standard; GHG Protocol: Geneva, Switzerland, 2015. [Google Scholar]
- Oblitas-Romero, A.M.; Pérez-Diaz, A.N.; Zúñiga, C.L.O. Application of the Greenhouse Gas Protocol (GHG Protocol) and the ISO 14064-1: 2006 Standard for the Estimation of the Carbon Footprint at the National University of Jaen in 2021. DYNA 2023, 90, 90–97. [Google Scholar] [CrossRef]
- Barrow, M.; Buckley, B.; Caldicott, T.; Cumberlege, T.; Hsu, J.; Kaufman, S.; Ramm, K.; Rich, D.; Temple-Smith, W.; Cummis, C.; et al. GHG Protocol Technical Guidance for Calculating Scope 3 Emissions; GHG Protocol: Geneva, Switzerland, 2011. [Google Scholar]
- Vedat, K.; Neal, B.; Eldred, M.; Sonne-Schmidt, C.; Suboyin, A.; Thatcher, J.; Rehman, A. Navigating the Seas of Sustainability: A Study on Maritime Scope 3 Emissions Through Digital Innovation. In Proceedings of the International Petroleum Technology Conference (IPTC), Dhahran, Saudi Arabia, 12–14 February 2024. Paper Number: IPTC-23401-MS. [Google Scholar] [CrossRef]
- Pelletier, N.; Allacker, K.; Pant, R.; Manfredi, S. The European Commission Organisation Environmental Footprint Method: Comparison with Other Methods, and Rationales for Key Requirements. Int. J. Life Cycle Assess. 2014, 19, 387–404. [Google Scholar] [CrossRef]
- Garcia, R.; Freire, F. Carbon Footprint of Particleboard: A Comparison between ISO/TS 14067, GHG Protocol, PAS 2050 and Climate Declaration. J. Clean. Prod. 2014, 66, 199–209. [Google Scholar] [CrossRef]
- Peter, C.; Fiore, A.; Hagemann, U.; Nendel, C.; Xiloyannis, C. Improving the Accounting of Field Emissions in the Carbon Footprint of Agricultural Products: A Comparison of Default IPCC Methods with Readily Available Medium-Effort Modeling Approaches. Int. J. Life Cycle Assess. 2016, 21, 791–805. [Google Scholar] [CrossRef]
- McDonald, L.J.; Hernandez Galvan, J.L.; Emelue, C.; Pinto, A.S.S.; Mehta, N.; Ibn-Mohammed, T.; Fender, T.; Radcliffe, J.; Choudhary, A.; McManus, M.C. Towards a Unified Carbon Accounting Landscape. Philos. Trans. R. Soc. Math. Phys. Eng. Sci. 2024, 382, 20230260. [Google Scholar] [CrossRef]
- Levasseur, A.; Lesage, P.; Margni, M.; Samson, R. Biogenic Carbon and Temporary Storage Addressed with Dynamic Life Cycle Assessment. J. Ind. Ecol. 2013, 17, 117–128. [Google Scholar] [CrossRef]
- Dye, A.W.; Houtman, R.M.; Gao, P.; Anderegg, W.R.L.; Fettig, C.J.; Hicke, J.A.; Kim, J.B.; Still, C.J.; Young, K.; Riley, K.L. Carbon, Climate, and Natural Disturbance: A Review of Mechanisms, Challenges, and Tools for Understanding Forest Carbon Stability in an Uncertain Future. Carbon Balance Manag. 2024, 19, 35. [Google Scholar] [CrossRef] [PubMed]
- Lenzen, M.; Murray, J. Accounting for Carbon Flows: Comparing the Principles of the UNFCCC and the SEEA. Soc. Nat. Resour. 2011, 24, 1216–1227. [Google Scholar] [CrossRef]
- Jasinevičius, G.; Lindner, M.; Pingoud, K.; Tykkylainen, M. Review of Models for Carbon Accounting in Harvested Wood Products. Int. Wood Prod. J. 2015, 6, 198–212. [Google Scholar] [CrossRef]
- Intergovernmental Panel on Climate Change (IPCC). 2006 IPCC Guidelines for National Greenhouse Gas Inventories, Volume 4: Agriculture, Forestry and Other Land Use, Chapter 12; IPCC: Geneva, Switzerland, 2006. [Google Scholar]
- Jasinevičius, G.; Lindner, M.; Cienciala, E.; Tykkyläinen, M. Carbon Accounting in Harvested Wood Products: Assessment Using Material Flow Analysis Resulting in Larger Pools Compared to the IPCC Default Method. J. Ind. Ecol. 2018, 22, 121–131. [Google Scholar] [CrossRef]
- Jang, E.-K.; Youn, Y.-C. Effects of Wood Product Utilization on Climate Change Mitigation in South Korea. Sustainability 2021, 13, 6737. [Google Scholar] [CrossRef]
- Del Borghi, A. LCA and Communication: Environmental Product Declaration. Int. J. Life Cycle Assess. 2013, 18, 293–295. [Google Scholar] [CrossRef]
- Säynäjoki, A.; Heinonen, J.; Junnonen, J.-M.; Junnila, S. Input–output and process LCAs in the building sector: Are the results compatible with each other? Carbon Manag. 2017, 8, 155–166. [Google Scholar] [CrossRef]
- Liu, M.; Murano, A.; Goh, C.S.; Kayo, C. Evaluation of the Environmental Burden of Cross-Laminated Timber Manufacturing in Japan Using the Input–Output Analysis. Forests 2023, 14, 2263. [Google Scholar] [CrossRef]
- Crawford, R.H.; Bontinck, P.-A.; Stephan, A.; Wiedmann, T.; Yu, M. Hybrid Life Cycle Inventory Methods—A Review. J. Clean. Prod. 2018, 172, 1273–1288. [Google Scholar] [CrossRef]
- Lausselet, C.; Crawford, R.H.; Brattebø, H. Hybrid Life Cycle Assessment at the Neighbourhood Scale: The Case of Ydalir, Norway. Clean. Eng. Technol. 2022, 8, 100503. [Google Scholar] [CrossRef]
- Yang, Y.; Heijungs, R.; Brandão, M. Hybrid Life Cycle Assessment (LCA) Does Not Necessarily Yield More Accurate Results than Process-Based LCA. J. Clean. Prod. 2017, 150, 237–242. [Google Scholar] [CrossRef]
- Head, M.; Magnan, M.; Kurz, W.A.; Levasseur, A.; Beauregard, R.; Margni, M. Temporally-Differentiated Biogenic Carbon Accounting of Wood Building Product Life Cycles. SN Appl. Sci. 2021, 3, 62. [Google Scholar] [CrossRef]
- Peñaloza, D.; Erlandsson, M.; Falk, A. Exploring the Climate Impact Effects of Increased Use of Bio-Based Materials in Buildings. Constr. Build. Mater. 2016, 125, 219–226. [Google Scholar] [CrossRef]
- EN 15804:2012+A2:2019/AC:2021; Sustainability of Construction Works—Environmental Product Declarations—Core Rules for the Product Category of Construction Products. European Committee for Standardization (CEN): Bruxelles, Belgium, 2021.
- U.S. Environmental Protection Agency (USEPA). Documentation for Greenhouse Gas Emission and Energy Factors Used in the Waste Reduction Model (WARM); U.S. Environmental Protection Agency (USEPA): Washington, DC, USA, 2023. [Google Scholar]
- Zargar, S.; Roy, B.B.; Li, Q.; Gan, J.; Ke, J.; Liu, X.; Tu, Q. The Application of Industrial Ecology Methods to Understand the Environmental and Economic Implications of the Forest Product Industries. Curr. For. Rep. 2022, 8, 346–361. [Google Scholar] [CrossRef]
- Bergeron, F.C. Energy and Climate Impact Assessment of Waste Wood Recovery in Switzerland. Biomass Bioenergy 2016, 94, 245–257. [Google Scholar] [CrossRef]
- Wang, R.; Haller, P. Dynamic Material Flow Analysis of Wood in Germany from 1991 to 2020. Resour. Conserv. Recycl. 2024, 201, 107339. [Google Scholar] [CrossRef]
- Zhang, L.; Wang, M.; Chang, Z.; Lyu, Z.; Huang, Y. A Dataset of CO2 Emission Factors in UNFCCC Annex I Countries from 1990 to 2016. China Sci. Data 2020, 5. [Google Scholar] [CrossRef]
- Bertolini, M.; Duttilo, P.; Lisi, F. Accounting Carbon Emissions from Electricity Generation: A Review and Comparison of Emission Factor-Based Methods. Appl. Energy 2025, 392, 125992. [Google Scholar] [CrossRef]
- Zhang, Y.; Zheng, H.; Wu, P.; Zhang, Y.; Wang, Y.; Dou, Z.; Sun, P. Research on Carbon Emission Accounting for Industrial-Type Integrated Energy Projects Based on the Emission Factor Method. In Proceedings of the Ninth International Conference on Energy Materials and Electrical Engineering (ICEMEE 2023), Guilin, China, 25–27 August 2023; SPIE: Bellingham, WA, USA, 2024; Volume 12979, pp. 474–481. [Google Scholar]
- Desjardins, S.M.; Chen, J.; Ter-Mikaelian, M.T. A Review of Cradle-to-Gate Greenhouse Gas Emission Factors for Canada’s Harvested Wood Products. For. Prod. J. 2024, 74, 278–293. [Google Scholar] [CrossRef]
- Van Amstel, A.; Kroeze, C.; Janssen, L.J.H.M.; Olivier, J.G.J.; van der Wal, J.T. Greenhouse Gas Emission Accounting. Preliminary Study as Input to a Joint Int. IPCC Expert Meeting/CKO-CCB Workshop on Comparison of Top-Down Versus Bottom-Up Emission Estimates; Wageningen University & Research: Wageningen, The Netherlands, 1997. [Google Scholar]
- Jonas, M.; Nilsson, S.; Shvidenko, A.; Stolbovoi, V.; Gluck, M.; Obersteiner, M.; Oeskog, A. Full Carbon Accounting and the Kyoto Protocol: A Systems-Analytical View; IIASA: Laxenburg, Austria, 1999. [Google Scholar]
- Ge, L.; Mo, X.; Liu, J. Carbon Accounting Method Based on Power System Energy Carbon Footprint Characteristics and Multi-Source Data Fusion. Int. J. Energy 2023, 2, 71–75. [Google Scholar] [CrossRef]
- Karaman Öztaş, S. The Limitations of LCA Methodology Towards Sustainable Construction Materials. In Proceedings of the 3rd International Sustainable Buildings Symposium (ISBS 2017), Dubai, UAE, 15–17 March 2017; Fırat, S., Kinuthia, J., Abu-Tair, A., Eds.; Springer International Publishing: Cham, Switzerland, 2018; pp. 102–113. [Google Scholar]
- Marlowe, J.; Clarke, A.; Marlowe, J.; Clarke, A. Carbon Accounting: A Systematic Literature Review and Directions for Future Research. Green Financ. 2022, 4, 71–87. [Google Scholar] [CrossRef]
- Steininger, K.W.; Lininger, C.; Meyer, L.H.; Muñoz, P.; Schinko, T. Multiple Carbon Accounting to Support Just and Effective Climate Policies. Nat. Clim. Change 2016, 6, 35–41. [Google Scholar] [CrossRef]
- O’Brien, D.; Shalloo, L.; Patton, J.; Buckley, F.; Grainger, C.; Wallace, M. Evaluation of the Effect of Accounting Method, IPCC v. LCA, on Grass-Based and Confinement Dairy Systems’ Greenhouse Gas Emissions. Animal 2012, 6, 1512–1527. [Google Scholar] [CrossRef]
- Rosales, M.V.; Dhakal, S. A Comparative Analysis of Carbon Accounting Methodologies and Tools. In Proceedings of the 2024 International Conference on Sustainable Energy: Energy Transition and Net-Zero Climate Future (ICUE), Pattaya City, Thailand, 21–23 October 2024; pp. 1–7. [Google Scholar]
- Ionescu, L. Carbon Accounting in the Circular Economy. Ann. Spiru Haret Univ. Econ. Ser. 2023, 23. [Google Scholar] [CrossRef]
- Hazaea, S.A.; Al-Matari, E.M.; Alosaimi, M.H.; Farhan, N.H.S.; Abubakar, A.; Zhu, J. Past, Present, and Future of Carbon Accounting: Insights from Scholarly Research. Front. Energy Res. 2023, 10, 958362. [Google Scholar] [CrossRef]
- Siddaway, A.P.; Wood, A.M.; Hedges, L.V. How to Do a Systematic Review: A Best Practice Guide for Conducting and Reporting Narrative Reviews, Meta-Analyses, and Meta-Syntheses. Annu. Rev. Psychol. 2019, 70, 747–770. [Google Scholar] [CrossRef]
- Page, M.J.; McKenzie, J.E.; Bossuyt, P.M.; Boutron, I.; Hoffmann, T.C.; Mulrow, C.D.; Shamseer, L.; Tetzlaff, J.M.; Akl, E.A.; Brennan, S.E.; et al. The PRISMA 2020 Statement: An Updated Guideline for Reporting Systematic Reviews. BMJ 2021, 372, n71. [Google Scholar] [CrossRef]
- Athena Sustainable Materials Institute (ASMI). A Cradle-to-Gate Life Cycle Assessment of Cross-Laminated Timber (CLT) and Glued-Laminated Timber (Glulam) Manufactured by ELEMENT; Athena Sustainable Materials Institute: Ottawa, ON, Canada, 2022. [Google Scholar]
- Athena Sustainable Materials Institute (ASMI). A Cradle-to-Gate Life Cycle Assessment of Softwood Plywood Produced in British Columbia; Athena Sustainable Materials Institute: Ottawa, ON, Canada, 2022. [Google Scholar]
- Vilčeková, S.; Budajová, J.; Harčárová, K.; Mésároš, P.; Krídlová Burdová, E.; Zimermann, R. The Impact of Green Roofs’ Composition on Its Overall Life Cycle. J. Environ. Manag. 2024, 369, 122363. [Google Scholar] [CrossRef]
- Allan, K.; Phillips, A.R. Comparative Cradle-to-Grave Life Cycle Assessment of Low and Mid-Rise Mass Timber Buildings with Equivalent Structural Steel Alternatives. Sustainability 2021, 13, 3401. [Google Scholar] [CrossRef]
- Andersen, J.H.; Rasmussen, N.L.; Ryberg, M.W. Comparative Life Cycle Assessment of Cross Laminated Timber Building and Concrete Building with Special Focus on Biogenic Carbon. Energy Build. 2022, 254, 111604. [Google Scholar] [CrossRef]
- Chen, Z.; Gu, H.; Bergman, R.D.; Liang, S. Comparative Life-Cycle Assessment of a High-Rise Mass Timber Building with an Equivalent Reinforced Concrete Alternative Using the Athena Impact Estimator for Buildings. Sustainability 2020, 12, 4708. [Google Scholar] [CrossRef]
- Chen, C.X.; Pierobon, F.; Jones, S.; Maples, I.; Gong, Y.; Ganguly, I. Comparative Life Cycle Assessment of Mass Timber and Concrete Residential Buildings: A Case Study in China. Sustainability 2022, 14, 144. [Google Scholar] [CrossRef]
- Chen, P.-C.; Chen, C.-J.; Kuo, S.-T. Carbon Footprint Life Cycle Assessment of Modular Wooden Construction. WIT Trans. Ecol. Environ. 2023, 261, 13. [Google Scholar] [CrossRef]
- Dodoo, A. Lifecycle Impacts of Structural Frame Materials for Multi-Storey Building Systems. J. Sustain. Archit. Civ. Eng. 2019, 24, 17–28. [Google Scholar] [CrossRef]
- Dodoo, A.; Gustavsson, L.; Sathre, R. Lifecycle Carbon Implications of Conventional and Low-Energy Multi-Storey Timber Building Systems. Energy Build. 2014, 82, 194–210. [Google Scholar] [CrossRef]
- Dodoo, A.; Nguyen, T.; Dorn, M.; Olsson, A.; Bader, T.K. Exploring the Synergy between Structural Engineering Design Solutions and Life Cycle Carbon Footprint of Cross-Laminated Timber in Multi-Storey Buildings. Wood Mater. Sci. Eng. 2022, 17, 30–42. [Google Scholar] [CrossRef]
- Duan, Z. Impact of Climate Change on the Life Cycle Greenhouse Gas Emissions of Cross-Laminated Timber and Reinforced Concrete Buildings in China. J. Clean. Prod. 2023, 395, 136446. [Google Scholar] [CrossRef]
- Duan, Z.; Huang, Q.; Sun, Q.; Zhang, Q. Comparative Life Cycle Assessment of a Reinforced Concrete Residential Building with Equivalent Cross Laminated Timber Alternatives in China. J. Build. Eng. 2022, 62, 105357. [Google Scholar] [CrossRef]
- Felmer, G.; Morales-Vera, R.; Astroza, R.; González, I.; Puettmann, M.; Wishnie, M. A Lifecycle Assessment of a Low-Energy Mass-Timber Building and Mainstream Concrete Alternative in Central Chile. Sustainability 2022, 14, 1249. [Google Scholar] [CrossRef]
- Fu, F.; Luo, H.; Zhong, H.; Hill, A. Development of a Carbon Emission Calculations System for Optimizing Building Plan Based on the LCA Framework. Math. Probl. Eng. 2014, 2014, 653849. [Google Scholar] [CrossRef]
- Greer, F.; Horvath, A. Exploring the Significance of Transportation Emissions in Upfront Embodied Carbon in Buildings. Build. Environ. 2025, 269, 112457. [Google Scholar] [CrossRef]
- Gu, H.; Liang, S.; Lo Ricco, M.; Bergman, R. Life-Cycle Assessment of Environmental Impacts of Mass Timber Buildings in the Northeast Region of the United States; U.S. Department of Agriculture, Forest Service, Forest Products Laboratory: Madison, WI, USA, 2024; Report No. FPL-RP-719. [Google Scholar] [CrossRef]
- Hegeir, O.A.; Kvande, T.; Stamatopoulos, H.; Bohne, R.A. Comparative Life Cycle Analysis of Timber, Steel and Reinforced Concrete Portal Frames: A Theoretical Study on a Norwegian Industrial Building. Buildings 2022, 12, 573. [Google Scholar] [CrossRef]
- Invidiata, A.; Lavagna, M.; Ghisi, E. Selecting Design Strategies Using Multi-Criteria Decision Making to Improve the Sustainability of Buildings. Build. Environ. 2018, 139, 58–68. [Google Scholar] [CrossRef]
- Jayalath, A.; Navaratnam, S.; Ngo, T.; Mendis, P.; Hewson, N.; Aye, L. Life Cycle Performance of Cross Laminated Timber Mid-Rise Residential Buildings in Australia. Energy Build. 2020, 223, 110091. [Google Scholar] [CrossRef]
- Kumar, V.; Ricco, M.L.; Bergman, R.D.; Nepal, P.; Poudyal, N.C. Environmental Impact Assessment of Mass Timber, Structural Steel, and Reinforced Concrete Buildings Based on the 2021 International Building Code Provisions. Build. Environ. 2024, 251, 111195. [Google Scholar] [CrossRef]
- Lechón, Y.; de la Rúa, C.; Lechón, J.I. Environmental Footprint and Life Cycle Costing of a Family House Built on CLT Structure. Analysis of Hotspots and Improvement Measures. J. Build. Eng. 2021, 39, 102239. [Google Scholar] [CrossRef]
- Leskovar, V.Ž.; Žigart, M.; Premrov, M.; Lukman, R.K. Comparative Assessment of Shape Related Cross-Laminated Timber Building Typologies Focusing on Environmental Performance. J. Clean. Prod. 2019, 216, 482–494. [Google Scholar] [CrossRef]
- Liang, S.; Gu, H.; Bergman, R. Environmental Life-Cycle Assessment and Life-Cycle Cost Analysis of a High-Rise Mass Timber Building: A Case Study in Pacific Northwestern United States. Sustainability 2021, 13, 7831. [Google Scholar] [CrossRef]
- Lolli, N.; Fufa, S.M.; Kjendseth Wiik, M. An Assessment of Greenhouse Gas Emissions from CLT and Glulam in Two Residential Nearly Zero Energy Buildings. Wood Mater. Sci. Eng. 2019, 14, 342–354. [Google Scholar] [CrossRef]
- Mazur, Ł.; Olenchuk, A. Life Cycle Assessment and Building Information Modeling Integrated Approach: Carbon Footprint of Masonry and Timber-Frame Constructions in Single-Family Houses. Sustainability 2023, 15, 15486. [Google Scholar] [CrossRef]
- Moncaster, A.M.; Pomponi, F.; Symons, K.E.; Guthrie, P.M. Why Method Matters: Temporal, Spatial and Physical Variations in LCA and Their Impact on Choice of Structural System. Energy Build. 2018, 173, 389–398. [Google Scholar] [CrossRef]
- Motuzienė, V.; Rogoža, A.; Lapinskienė, V.; Vilutienė, T. Construction Solutions for Energy Efficient Single-Family House Based on Its Life Cycle Multi-Criteria Analysis: A Case Study. J. Clean. Prod. 2016, 112, 532–541. [Google Scholar] [CrossRef]
- Nakano, K.; Koike, W.; Yamagishi, K.; Hattori, N. Environmental Impacts of Cross-Laminated Timber Production in Japan. Clean Technol. Environ. Policy 2020, 22, 2193–2205. [Google Scholar] [CrossRef]
- Petrović, B.; Eriksson, O.; Zhang, X. Carbon Assessment of a Wooden Single-Family Building—A Novel Deep Green Design and Elaborating on Assessment Parameters. Build. Environ. 2023, 233, 110093. [Google Scholar] [CrossRef]
- Piccardo, C.; Gustavsson, L. Implications of Different Modelling Choices in Primary Energy and Carbon Emission Analysis of Buildings. Energy Build. 2021, 247, 111145. [Google Scholar] [CrossRef]
- Pierobon, F.; Huang, M.; Simonen, K.; Ganguly, I. Environmental Benefits of Using Hybrid CLT Structure in Midrise Non-Residential Construction: An LCA Based Comparative Case Study in the U.S. Pacific Northwest. J. Build. Eng. 2019, 26, 100862. [Google Scholar] [CrossRef]
- Sandanayake, M.; Lokuge, W.; Zhang, G.; Setunge, S.; Thushar, Q. Greenhouse Gas Emissions during Timber and Concrete Building Construction—A Scenario Based Comparative Case Study. Sustain. Cities Soc. 2018, 38, 91–97. [Google Scholar] [CrossRef]
- Takano, A.; Hafner, A.; Linkosalmi, L.; Ott, S.; Hughes, M.; Winter, S. Life Cycle Assessment of Wood Construction According to the Normative Standards. Eur. J. Wood Wood Prod. 2015, 73, 299–312. [Google Scholar] [CrossRef]
- Vidal, R.; Sánchez-Pantoja, N.; Martínez, G.; Vidal, R.; Sánchez-Pantoja, N.; Martínez, G. Life Cycle Assessment of a Residential Building with Cross-Laminated Timber Structure in Granada-Spain. Inf. Constr. 2019, 71, 60982. [Google Scholar] [CrossRef]
- Bergman, R.D.; Alanya-Rosenbaum, S. Cradle-to-Gate Life-Cycle Assessment of Laminated Veneer Lumber Production in the United States*. For. Prod. J. 2017, 67, 343–354. [Google Scholar] [CrossRef]
- Bergman, R.; Kaestner, D.; Taylor, A.M. Life Cycle Impacts of North American Wood Panel Manufacturing. Wood Fiber Sci. 2016, 48, 40–53. Available online: https://research.fs.usda.gov/treesearch/51009 (accessed on 26 January 2025).
- Bowers, T.; Puettmann, M.E.; Ganguly, I.; Eastin, I. Cradle-to-Gate Life-Cycle Impact Analysis of Glued-Laminated (Glulam) Timber: Environmental Impacts from Glulam Produced in the US Pacific Northwest and Southeast*. For. Prod. J. 2017, 67, 368–380. [Google Scholar] [CrossRef]
- Chen, C.X.; Pierobon, F.; Ganguly, I. Life Cycle Assessment (LCA) of Cross-Laminated Timber (CLT) Produced in Western Washington: The Role of Logistics and Wood Species Mix. Sustainability 2019, 11, 1278. [Google Scholar] [CrossRef]
- Gong, Y.; Liu, R.; Yao, L.; Ren, H.; Xu, J. Innovation Analysis of Carbon Emissions from the Production of Glued Laminated Timber in China Based on Real-Time Monitoring Data. J. Clean. Prod. 2024, 469, 143174. [Google Scholar] [CrossRef]
- Han, H.-S.; Oneil, E.; Bergman, R.D.; Eastin, I.L.; Johnson, L.R. Cradle-to-Gate Life Cycle Impacts of Redwood Forest Resource Harvesting in Northern California. J. Clean. Prod. 2015, 99, 217–229. [Google Scholar] [CrossRef]
- Heidari, M.D.; Bergman, R.; Salazar, J.; Hubbard, S.S.; Bowe, S.A. Life-Cycle Assessment of Prefinished Engineered Wood Flooring in the Eastern United States; U.S. Department of Agriculture, Forest Service, Forest Products Laboratory: Madison, WI, USA, 2023; p. FPL-RP-718. [Google Scholar]
- Hubbard, S.S.; Bergman, R.D.; Sahoo, K.; Bowe, S.A. A Life Cycle Assessment of Hardwood Lumber Production in the Northeast and North Central United States; Forest Service U.S. Department of Agriculture: Washington, DC, USA, 2020. [Google Scholar]
- Lan, K.; Kelley, S.S.; Nepal, P.; Yao, Y. Dynamic Life Cycle Carbon and Energy Analysis for Cross-Laminated Timber in the Southeastern United States. Environ. Res. Lett. 2020, 15, 124036. [Google Scholar] [CrossRef]
- Lao, W.; Han, Y.; You, J. Carbon Footprint as an Environmental Indicator for Wood Flooring Industry in China. Case Stud. Constr. Mater. 2024, 21, e03594. [Google Scholar] [CrossRef]
- Mahalle, L.; Lavoie, P. A Cradle-to-Gate Life Cycle Assessment of Canadian Hardwood Lumber and Hardwood Floor Covering. In Proceeding of the 5th International Science Conference Hardwood Process, Kreuzlingen, Switzerland, 12–17 April 2015. [Google Scholar]
- Milota, M.; Puettmann, M.E. Life-Cycle Assessment for the Cradle-to-Gate Production of Softwood Lumber in the Pacific Northwest and Southeast Regions*. For. Prod. J. 2017, 67, 331–342. [Google Scholar] [CrossRef]
- Puettmann, M.; Sinha, A.; Ganguly, I. Life Cycle Energy and Environmental Impacts of Cross Laminated Timber Made with Coastal Douglas-Fir. J. Green Build. 2019, 14, 17–33. [Google Scholar] [CrossRef]
- Sahoo, K.; Bergman, R.; Khatri, P. Cradle-to-Grave Life-Cycle Assessment of Cellulosic Fiberboard. Recent Prog. Mater. 2021, 3, 1–28. [Google Scholar] [CrossRef]
- Sahoo, K.; Bergman, R.; Runge, T. Life-Cycle Assessment of Redwood Lumber Products in the US. Int. J. Life Cycle Assess. 2021, 26, 1702–1720. [Google Scholar] [CrossRef]
- Wang, Y.; Lan, K. Life Cycle Assessment of Emerging Mass Timber Product: Cross-Laminated Bamboo. Clean. Environ. Syst. 2024, 15, 100243. [Google Scholar] [CrossRef]
- The Norwegian EPD Foundation. A Specific EPD for Cross Laminated Timber (CLT) Made of Spruce, u 12%; The Norwegian EPD Foundation: Oslo Norway, Norway, 2024. [Google Scholar]
- EPD Australasia. Environmental Product Declaration XLam CLT Panel; EPD Australasia: South Perth, WA, Australia, 2023. [Google Scholar]
- EPD Australasia. Environmental Product Declaration Softwood Timber; EPD Australasia: Nelson, New Zealand, 2022. [Google Scholar]
- Timberlink. Structural Softwood Timber; EPD Australasia: Nelson, New Zealand, 2022. [Google Scholar]
- EPD Australasia. Environmental Product Declaration Structural Softwood Timber; EPD Australasia: Bell Bay, Tasmania, Australia, 2023. [Google Scholar]
- EPD Australasia. Environmental Product Declaration Cross-Laminated Timber (CLT); EPD Australasia: Rotorua, New Zealand, 2022. [Google Scholar]
- Consortium for Research on Renewable Industrial Material (CORRIM). Cradle to Gate Life Cycle Assessment of North American Medium Density Fiberboard Production; WoodLife Environmental Consultants: Corvallis, OR, USA, 2019. [Google Scholar]
- IBU—Institut Bauen und Umwelt. Environmental Product Declaration Medium Density Fibreboard (MDF), Coated Sonae Arauco, S.A.; IBU—Institut Bauen und Umwelt: Berlin, Germany, 2024. [Google Scholar]
- IBU—Institut Bauen und Umwelt. Environmental Product Declaration Unilin Medium Density Fiberboard Unilin B.V. Division Panels; IBU—Institut Bauen und Umwelt: Berlin, Germany, 2023. [Google Scholar]
- IBU—Institut Bauen und Umwelt. Environmental Product Declaration Oriented Strand Board Sonae Arauco, S.A.; IBU—Institut Bauen und Umwelt: Berlin, Germany, 2022. [Google Scholar]
- Tsupari, E. Impact of System Boundaries on the Effectiveness of Climate Change Mitigation Actions: Dissertation; Aalto University Publication Series: Doctoral Dissertations; Aalto University: Espoo, Finland, 2018; ISBN 978-952-60-8357-5. [Google Scholar]
- Balasbaneh, A.T.; Ramli, M.Z. A Comparative Life Cycle Assessment (LCA) of Concrete and Steel-Prefabricated Prefinished Volumetric Construction Structures in Malaysia. Environ. Sci. Pollut. Res. 2020, 27, 43186–43201. [Google Scholar] [CrossRef]
- Chaudhary, A.; Akhtar, A. Template for Evaluating Cradle-to-Site Environmental Life Cycle Impacts of Buildings in India. ACS Environ. Au 2023, 3, 94–104. [Google Scholar] [CrossRef]
- Tukey, J.W. Exploratory Data Analysis; Addison-Wesley: Reading, MA, USA, 1977. [Google Scholar]
- Norouzi, M.; Haddad, A.N.; Jiménez, L.; Hoseinzadeh, S.; Boer, D. Carbon Footprint of Low-Energy Buildings in the United Kingdom: Effects of Mitigating Technological Pathways and Decarbonization Strategies. Sci. Total Environ. 2023, 882, 163490. [Google Scholar] [CrossRef]
- Oliveira Júnior, E.D.; Seixas, F. Energy Analysis of Eucalyptus Harvesting Operations in Two Mechanized Systems. Sci. For. 2006, 70, 49–57. [Google Scholar]
- ISO 21930; Sustainability in Buildings and Civil Engineering Works—Core Rules for Environmental Product Declarations of Construction Products and Services. International Organization for Standardization: Geneva, Switzerland, 2017.
- Markewitz, D. Fossil Fuel Carbon Emissions from Silviculture: Impacts on Net Carbon Sequestration in Forests. For. Ecol. Manag. 2006, 236, 153–161. [Google Scholar] [CrossRef]
- Doraisami, M.; Kish, R.; Paroshy, N.J.; Domke, G.M.; Thomas, S.C.; Martin, A.R. A Global Database of Woody Tissue Carbon Concentrations. Sci. Data 2022, 9, 284. [Google Scholar] [CrossRef]
- Cuéllar-Franca, R.M.; Azapagic, A. Environmental Impacts of the UK Residential Sector: Life Cycle Assessment of Houses. Build. Environ. 2012, 54, 86–99. [Google Scholar] [CrossRef]
- de Simone Souza, H.H.; de Abreu Evangelista, P.P.; Medeiros, D.L.; Albertí, J.; Fullana-i-Palmer, P.; Boncz, M.Á.; Kiperstok, A.; Gonçalves, J.P. Functional Unit Influence on Building Life Cycle Assessment. Int. J. Life Cycle Assess. 2021, 26, 435–454. [Google Scholar] [CrossRef]
- Pauer, E.; Wohner, B.; Tacker, M. The Influence of Database Selection on Environmental Impact Results. Life Cycle Assessment of Packaging Using GaBi, Ecoinvent 3.6, and the Environmental Footprint Database. Sustainability 2020, 12, 9948. [Google Scholar] [CrossRef]
- Otero, M.S.; Garnica, T.; Montilla, S.; Conde, M.; Tenorio, J.A. Analysis of Sectoral Environmental Product Declarations as a Data Source for Life Cycle Assessment. Buildings 2023, 13, 3032. [Google Scholar] [CrossRef]
- Palumbo, E.; Soust-Verdaguer, B.; Llatas, C.; Traverso, M. Implications of the Building System Boundary Definition to Conduct an LCA. A Case Study Comparison of Two Frameworks for Assessing Building Sustainability: DGNB and Level(s). E3S Web Conf. 2022, 349, 04015. [Google Scholar] [CrossRef]
- McGavin, R.L.; Dakin, T.; Shanks, J. Mass-Timber Construction in Australia: Is CLT the Only Answer? BioResources 2020, 15, 4642–4645. [Google Scholar] [CrossRef]
- Hansen, R.N.; Eliassen, J.L.; Schmidt, J.; Andersen, C.E.; Weidema, B.P.; Birgisdóttir, H.; Hoxha, E. Environmental Consequences of Shifting to Timber Construction: The Case of Denmark. Sustain. Prod. Consum. 2024, 46, 54–67. [Google Scholar] [CrossRef]
- Guo, J.; Li, R.; Zhang, R.; Qi, J.; Li, N.; Xu, C.; Chiu, A.S.F.; Wang, Y.; Tanikawa, H.; Xu, M. Shedding Light on the Shadows: Transparency Challenge in Background Life Cycle Inventory Data. J. Ind. Ecol. 2025, 1, 1–11. [Google Scholar] [CrossRef]
- Roswag-Klinge, E.; Neumann, E.; Klinge, A. Climate Impacts of Wood/ Timber as a Building Material – Investigated on Three Urban Quarters in Germany (CIW). IOP Conf. Ser. Earth Environ. Sci. 2022, 1078, 012029. [Google Scholar] [CrossRef]
- Dong, Y.; Ng, S.T.; Liu, P. A Comprehensive Analysis towards Benchmarking of Life Cycle Assessment of Buildings Based on Systematic Review. Build. Environ. 2021, 204, 108162. [Google Scholar] [CrossRef]
- Hemmati, M.; Messadi, T.; Gu, H. Life Cycle Assessment of the Construction Process in a Mass Timber Structure. Sustainability 2024, 16, 262. [Google Scholar] [CrossRef]
- Robati, M.; Oldfield, P. The Embodied Carbon of Mass Timber and Concrete Buildings in Australia: An Uncertainty Analysis. Build. Environ. 2022, 214, 108944. [Google Scholar] [CrossRef]
- TDUK. 2024 Embodied Carbon Data for Timber Products; Timber Development UK: London, UK, 2024. [Google Scholar]
- Zhai, Y.; Li, Y.; Tang, S.; Liu, Y.; Liu, Y. Lightweight Strategies for Wooden-Structure Buildings Based on Embodied Carbon Emission Calculations for Carbon Reduction. Buildings 2024, 14, 3460. [Google Scholar] [CrossRef]
- Tupenaite, L.; Kanapeckiene, L.; Naimaviciene, J. Development of Timber Construction in European Countries: Drivers, Barriers, and Education. In Modern Building Materials, Structures and Techniques; Barros, J.A.O., Kaklauskas, G., Zavadskas, E.K., Eds.; Springer Nature Switzerland: Cham, Switzerland, 2024; pp. 556–565. [Google Scholar]
- England, J.R.; May, B.; Raison, R.J.; Paul, K.I. Cradle-to-Gate Inventory of Wood Production from Australian Softwood Plantations and Native Hardwood Forests: Carbon Sequestration and Greenhouse Gas Emissions. For. Ecol. Manag. 2013, 302, 295–307. [Google Scholar] [CrossRef]
- Martin, L.J.; Blossey, B.; Ellis, E. Mapping Where Ecologists Work: Biases in the Global Distribution of Terrestrial Ecological Observations. Front. Ecol. Environ. 2012, 10, 195–201. [Google Scholar] [CrossRef]
- Pasgaard, M.; Dalsgaard, B.; Maruyama, P.K.; Sandel, B.; Strange, N. Geographical Imbalances and Divides in the Scientific Production of Climate Change Knowledge. Glob. Environ. Change 2015, 35, 279–288. [Google Scholar] [CrossRef]
- Yousefi-Nooraie, R.; Shakiba, B.; Mortaz-Hejri, S. Country Development and Manuscript Selection Bias: A Review of Published Studies. BMC Med. Res. Methodol. 2006, 6, 37. [Google Scholar] [CrossRef]
- Guerrero-Casado, J.; Dylewski, Ł.; Rosin, Z.M.; Skórka, P.; Wuczyński, A.; Tobolka, M. Spatial and Thematic Bias in the Scientific Literature on Farmland Birds across the Globe. Eur. Zool. J. 2023, 90, 775–789. [Google Scholar] [CrossRef]
- Skaldina, O.; Blande, J.D. Global Biases in Ecology and Conservation Research: Insight from Pollinator Studies. Ecol. Lett. 2025, 28, e70050. [Google Scholar] [CrossRef]
- Smith, R. Publishing Research from Developing Countries. Stat. Med. 2002, 21, 2869–2877. [Google Scholar] [CrossRef]
- Homma, E.; Lawrence, A. Assessing Carbon in Timber Buildings - The Institution of Structural Engineers. Struct. Eng. 2024, 102, 28–32. [Google Scholar] [CrossRef]
- Atnoorkar, S.; Ghatpande, O.A.; Haile, S.L.; Goetsch, H.E.; Harris, C.B. Carbon Intensity of Mass Timber Materials: Impacts of Sourcing and Transportation. Front. Built Environ. 2024, 9, 1321340. [Google Scholar] [CrossRef]
- Sasaki, N. Timber Production and Carbon Emission Reductions through Improved Forest Management and Substitution of Fossil Fuels with Wood Biomass. Resour. Conserv. Recycl. 2021, 173, 105737. [Google Scholar] [CrossRef]
- Ratnasingam, J.; Ramasamy, G.; Toong, W. An Assessment of the Carbon Footprint of Tropical Hardwood Sawn Timber Production. BioResources 2015, 10, 5174–5190. [Google Scholar] [CrossRef]
- Kaulen, A.; Engler, B.; Purfürst, T. Net Carbon Storage of Supplied Timber in Highly Mechanized Timber Harvest. Silva Fenn. 2024, 58, 24011. [Google Scholar] [CrossRef]
- Lin, W.; Wang, J.; Saud, P. Assessment of Carbon Emission and Balance from Hardwood Lumber Processing in Central Appalachia, USA. In Proceedings of the 55th International Convention of Society of Wood Science and Technology, Beijing, China, 27–31 August 2012. [Google Scholar]
- Martínez-Alonso, C.; Berdasco, L. Carbon Footprint of Sawn Timber Products of Castanea Sativa Mill. in the North of Spain. J. Clean. Prod. 2015, 102, 127–135. [Google Scholar] [CrossRef]
- Saud, P.; Wang, J.; Sharma, B.D.; Liu, W. Carbon Impacts of Hardwood Lumber Processing in the Northeastern United States. Can. J. For. Res. 2015, 45, 1699–1710. [Google Scholar] [CrossRef]
- Petrović, B.; Eriksson, O.; Zhang, X.; Wallhagen, M. Carbon Assessment of a Wooden Single-Family Building—Focusing on Re-Used Building Products. Buildings 2024, 14, 800. [Google Scholar] [CrossRef]
- Ventura, A. Conceptual Issue of the Dynamic GWP Indicator and Solution. Int. J. Life Cycle Assess. 2023, 28, 788–799. [Google Scholar] [CrossRef]
- Cordier, S.; Blanchet, P.; Robichaud, F.; Amor, B. Dynamic LCA of the Increased Use of Wood in Buildings and Its Consequences: Integration of CO2 Sequestration and Material Substitutions. Build. Environ. 2022, 226, 109695. [Google Scholar] [CrossRef]
- Shrestha, P.; Sun, C. Carbon Emission Flow and Transfer through International Trade of Forest Products. For. Sci. 2019, 65, 439–451. [Google Scholar] [CrossRef]
- Arodudu, O.; Therasme, O.; Volk, T.; Malmsheimer, R.; Crovella, P.; Germain, R.; Kloster, D.; Kumar, D. Towards a Carbon Accounting Framework for Assessing the Benefits of Biogenic Wood Carbon to Net Zero Carbon Targets. Forests 2023, 14, 1959. [Google Scholar] [CrossRef]


| IPCC | LCA | MFA | |
|---|---|---|---|
| Principle | Tiered approach (Tier 1 to Tier 3) using EFs to estimate GHG emissions and carbon stocks | Tracks carbon emissions and sequestration across the lifecycle stages | Tracks material flows and carbon stocks through production, use, and end-of-life phases |
| Scale of analysis | National to regional level | Product or project level | System-level (e.g., material flows within an economy sector) |
| EFs application | Tiers 1 and 2 rely on standardised EFs; Tier 3 adjusts EFs using region-specific data | Phase-specific EFs for each lifecycle stage (e.g., production, use, disposal) | Links EFs to material flows for tracking direct emissions and carbon storage over time |
| Strengths |
|
|
|
| Limitations |
|
|
|
| Key tools | FAOSTAT database, national inventory datasets, default, and region-specific EFs | Databases such as Ecoinvent and EPDs | Material flow datasets, stock-flow models, and decay dynamic models |
| References | [54,79,80] | [81,82] | [54,83,84] |
| Asia | Europe | North America | Oceania | |
|---|---|---|---|---|
| CFmed (kg CO2eq m−2) | 190.5 | 163.9 | 160.4 | 319.2 |
| CF25% (kg CO2eq m−2) | 138.3 | 110.6 | 145.5 | 289.4 |
| CF75% (kg CO2eq m−2) | 287.0 | 330.3 | 289.4 | 349.0 |
| Asia | Europe | North America | Oceania | |
|---|---|---|---|---|
| CFmed (kg CO2eq m−3) | 139.0 | 25.2 | 184.5 | 118.0 |
| CF25% (kg CO2eq m−3) | 124.5 | 15.1 | 162.8 | 97.8 |
| CF75% (kg CO2eq m−3) | 168.5 | 38.8 | 329.8 | 149.0 |
| Asia | Europe | North America | Oceania | |
|---|---|---|---|---|
| SDBuildings (kg CO2eq m−2) | 110.15 | 162.07 | 106.52 | 59.26 |
| SDEWPs (kg CO2eq m−3) | 32.59 | 17.52 | 123.85 | 37.33 |
| Intervention Type | Estimated Emission Reduction Potential | Affected Life Cycle Stage(s) | Reference |
|---|---|---|---|
| Air-drying versus kiln-drying | Reduces manufacturing emissions by approximately 75% | A3—Manufacturing | [121] |
| Transportation optimisation | Decreases transport-related emissions by up to 20% | A2—Transport | [184] |
| Selection of low-density species | Lowers emissions by 24–28.3% during extraction and transport stages | A1—Raw material extraction, A2—Transport | [186] |
| Sawmill operational efficiency | Achieves approximately 11% reduction in processing emissions | A3—Manufacturing | [189] |
| Renewable energy substitution | Replaces fossil fuels, reducing emissions by up to 76% | A3—Manufacturing | [190] |
| Use of reclaimed timber | Reduces embodied emissions by up to 92% through material reuse | A1–A3 (avoided) | [191] |
Disclaimer/Publisher’s Note: The statements, opinions and data contained in all publications are solely those of the individual author(s) and contributor(s) and not of MDPI and/or the editor(s). MDPI and/or the editor(s) disclaim responsibility for any injury to people or property resulting from any ideas, methods, instructions or products referred to in the content. |
© 2025 by the authors. Licensee MDPI, Basel, Switzerland. This article is an open access article distributed under the terms and conditions of the Creative Commons Attribution (CC BY) license (https://creativecommons.org/licenses/by/4.0/).
Share and Cite
Qian, Y.; Gunawardena, T.; Mendis, P.; Aye, L. Carbon Footprint Variability in Engineered Wood Products for Timber Buildings: A Systematic Review of Carbon Accounting Methodologies. Sustainability 2025, 17, 4804. https://doi.org/10.3390/su17114804
Qian Y, Gunawardena T, Mendis P, Aye L. Carbon Footprint Variability in Engineered Wood Products for Timber Buildings: A Systematic Review of Carbon Accounting Methodologies. Sustainability. 2025; 17(11):4804. https://doi.org/10.3390/su17114804
Chicago/Turabian StyleQian, Yi, Tharaka Gunawardena, Priyan Mendis, and Lu Aye. 2025. "Carbon Footprint Variability in Engineered Wood Products for Timber Buildings: A Systematic Review of Carbon Accounting Methodologies" Sustainability 17, no. 11: 4804. https://doi.org/10.3390/su17114804
APA StyleQian, Y., Gunawardena, T., Mendis, P., & Aye, L. (2025). Carbon Footprint Variability in Engineered Wood Products for Timber Buildings: A Systematic Review of Carbon Accounting Methodologies. Sustainability, 17(11), 4804. https://doi.org/10.3390/su17114804